Article

Possible Overestimation of Nitrogen Dioxide Outgassing during the Beirut 2020 Explosion

1
Department of Physics, College of Engineering and Physics, King Fahd University of Petroleum and Minerals, Dhahran 31261, Saudi Arabia
2
Centre of Research Excellence in Renewable Energy, King Fahd University of Petroleum and Minerals, Dhahran 31261, Saudi Arabia
3
Space and Planetary Science Center, Khalifa University, Abu Dhabi P.O. Box 127788, United Arab Emirates
4
Department of Physics, Khalifa University, Abu Dhabi P.O. Box 127788, United Arab Emirates
5
School of Life and Environmental Sciences, Schmid College of Science and Technology, Chapman University, Orange, CA 92866, USA
6
Institute of Earthquake Forecasting, China Earthquake Administration, Beijing 100036, China
*
Author to whom correspondence should be addressed.
Remote Sens. 2022, 14(24), 6377; https://doi.org/10.3390/rs14246377
Submission received: 30 October 2022 / Revised: 6 December 2022 / Accepted: 10 December 2022 / Published: 16 December 2022
(This article belongs to the Section Atmospheric Remote Sensing)

Abstract

:
On 4 August 2020, a strong explosion occurred near the Beirut seaport, Lebanon and killed more than 200 people and damaged numerous buildings in the vicinity. As Amonium Nitrate (AN) caused the explosion, many studies claimed the release of large amounts of NO2 in the atmosphere may have resulted in a health hazard in Beirut and the vicinity. In order to reasonably evaluate the significance of NO2 amounts released in the atmosphere, it is important to investigate the spatio-temporal distribution of NO2 during and after the blast and compare it to the average day-to-day background emissions from vehicle and ship traffic in Beirut. In the present study, we use Sentinel-5 TROPOMI data to study NO2 emissions in the atmosphere close to the affected area prior, during, and after the Beirut explosion (28 July–8 August 2020). Analysis shows an increase in NO2 concentrations over Beirut up to about 1.8 mol/m2 one day after the explosion that was gradually dissipated in about 4 days. Seven days before the blast (on 28 July 2020) NO2 concentration was, however, observed to be up to about 4.3 mol/m2 over Beirut, which is mostly attributed to vehicle emissions in Lebanon, ships passing by the Beirut seaport and possibly the militant activities in Syria during 20–26 July. It is found that the Beirut blast caused a temporarily and spatially limited increase in NO2. The blast mostly affected the coastal areas in Lebanon, while it did not have much effect on inland regions. TROPOMI data are also analyzed for the Greater Cairo Area (GCA), Suez Canal, Egypt, and in Nicosia, Cyprus to confirm the effect of human activities, vehicles, and ship traffic on NO2 emissions in relatively high and relatively low populated zones.

1. Introduction

Ammonium nitrate (AN) (NH4NO3) is a white crystalline solid chemical compound consisting of ions of ammonium and is commonly used as a high-nitrogen garden and farm fertilizer [1]. AN caused a string of accidents that usually occurred when people underestimated the compound’s explosive properties by wrongly storing it in large piles near a source of heat with a temperature above 190 °C, while contaminated with a fuel oil or diesel [2]. Under such conditions, AN decomposes, which may trigger an explosion similar to a conventional (non-nuclear) explosion [3,4].
Historically, more than thirty AN accidents have occurred since the beginning of the 19th century [5,6,7,8,9,10]. The most recent massive blast occurred on 4 August 2020, from the explosion of about 2.7 × 10⁶ kg of AN stored in warehouse number 12 near the seaport in Beirut, Lebanon [11] (Figure 1). The explosion killed more than 200 people, injured 7000 people, and caused a loss of about USD 15 billion of structural damage. The explosion was intense and felt even in neighboring countries, including Turkey, Syria, and Cyprus, more than 250 km away [12]. Studies that investigated the explosion blast using shock arrival time [13,14] or acoustic and seismic signals [12], concluded that the explosion is equivalent to about 6.5 × 10⁵ kg of TNT.
In addition to the large loss of lives, injuries, massive property destructions, and economical effects that such incidents may cause; AN explosions also affect air quality with large amounts of fine particulate matter, dust, and toxic gases loaded in the air [15]. The decomposition of ammonium nitrates can lead to the formation of gaseous species such as white ammonia nitrate mist (NH3), HNO3, nitrous oxide (N2O), and water vapor (H2O). The shock wave associated with the explosion can generate wind-spreading emissions loaded with chemicals and glass ripples that can be transported to a few kilometers away from the blast area. Such transport of gases and reactions with other gases can further spread, which was seen by the brown fumes covering a large portion of Beirut after the explosion. These contain harmful toxic chemicals such as Nitric oxide (NO) and Nitrogen dioxide (NO2) [16].
Nitrogen dioxide is a highly reactive gas belonging to the nitrogen oxides (NOx) group. Nitric acid (HNO3) and nitrous acid (HNO2) also belong to the nitrogen oxides group. According to the Agency for Toxic Substances and Disease Registry (ATSDR) [17], NO and NO2 are the most hazardous nitrogen oxides. Inhaling air with a high NO2 concentration can irritate the human respiratory system [18]. Nitrogen dioxide also forms from emissions of vehicles, burning fuel, power plants, and off-road equipment. NO2 interacts with oxygen, water, and other atmospheric components to form acid rain [19], which harms the ecosystems in large water bodies and forests [18]. High concentrations of NO2 in the atmosphere could also contribute to stimulating phytoplankton growth in coastal waters.
Many studies [15,16,20] have reported increased amounts of NO2 emission in the atmosphere due to the Beirut blast, which directly affected the environment and health of the people living in the surrounding blast areas.
For example, the NO2 Beirut blast toxicity is discussed in [15], where the emission of irritating white and brown fumes across large areas of Beirut was reported. Additionally, the environmental and health effects of NO2 during the Beirut blast is reported in [21], however, an in-depth investigation of the spatial and temporal coverage of NO2 gas to assess its real hazardous effect after the blast is still far from complete.
In this work, we use data from the TROPOspheric Monitoring Instrument (TROPOMI) on board of the Copernicus Sentinel-5 Precursor (S5P) spacecraft, where data are downloaded and processed using Google Earth Engine [22] from 28 July to 8 August, 2000. Recently, TROPOMI tropospheric NO2 data have been used to estimate variations and characteristics in NO2 concentration and to monitor local emission sources at global and regional scales [23,24,25]. Ground-based sensor networks can also measure the NO2 (and all NOx) species in general. These data are sensitive to the location and the distance from emission sources (e.g., busy streets with heavy traffic routes). As ground-based sensors are usually limited to specific locations, NO2 maps based on such sensors are generated through models that interpolate gaps between the sparse ground sensors with large uncertainties. As NO2 ground-based data are unavailable for the study area/period, only satellite data are used.
In this study, we focus on examining the spatial and temporal distribution of the NO2 emitted because of the Beirut explosion. The study also investigates the significance of the NO2 enhancement because of the explosion compared to the NO2 background in Beirut. We study whether the NO2 concentration recorded is a direct consequence of the blast or due to the ambient emissions from vehicles, ships, and air mass transport. Moreover, we verify the effect of vehicles and ships’ activities on the NO2 loading by measuring NO2 concentrations in the Greater Cairo Area (GCA) and Suez Canal in Egypt (known for their high number of vehicles and ships’ activities) and in Nicosia city, Cyprus (known for its low population and traffic density). Data are also used to examine how the NO2 generated by a large AN blast could be compared to the NO2 emission from vehicle and ship emissions in the eastern Mediterranean region.

2. Materials and Methods
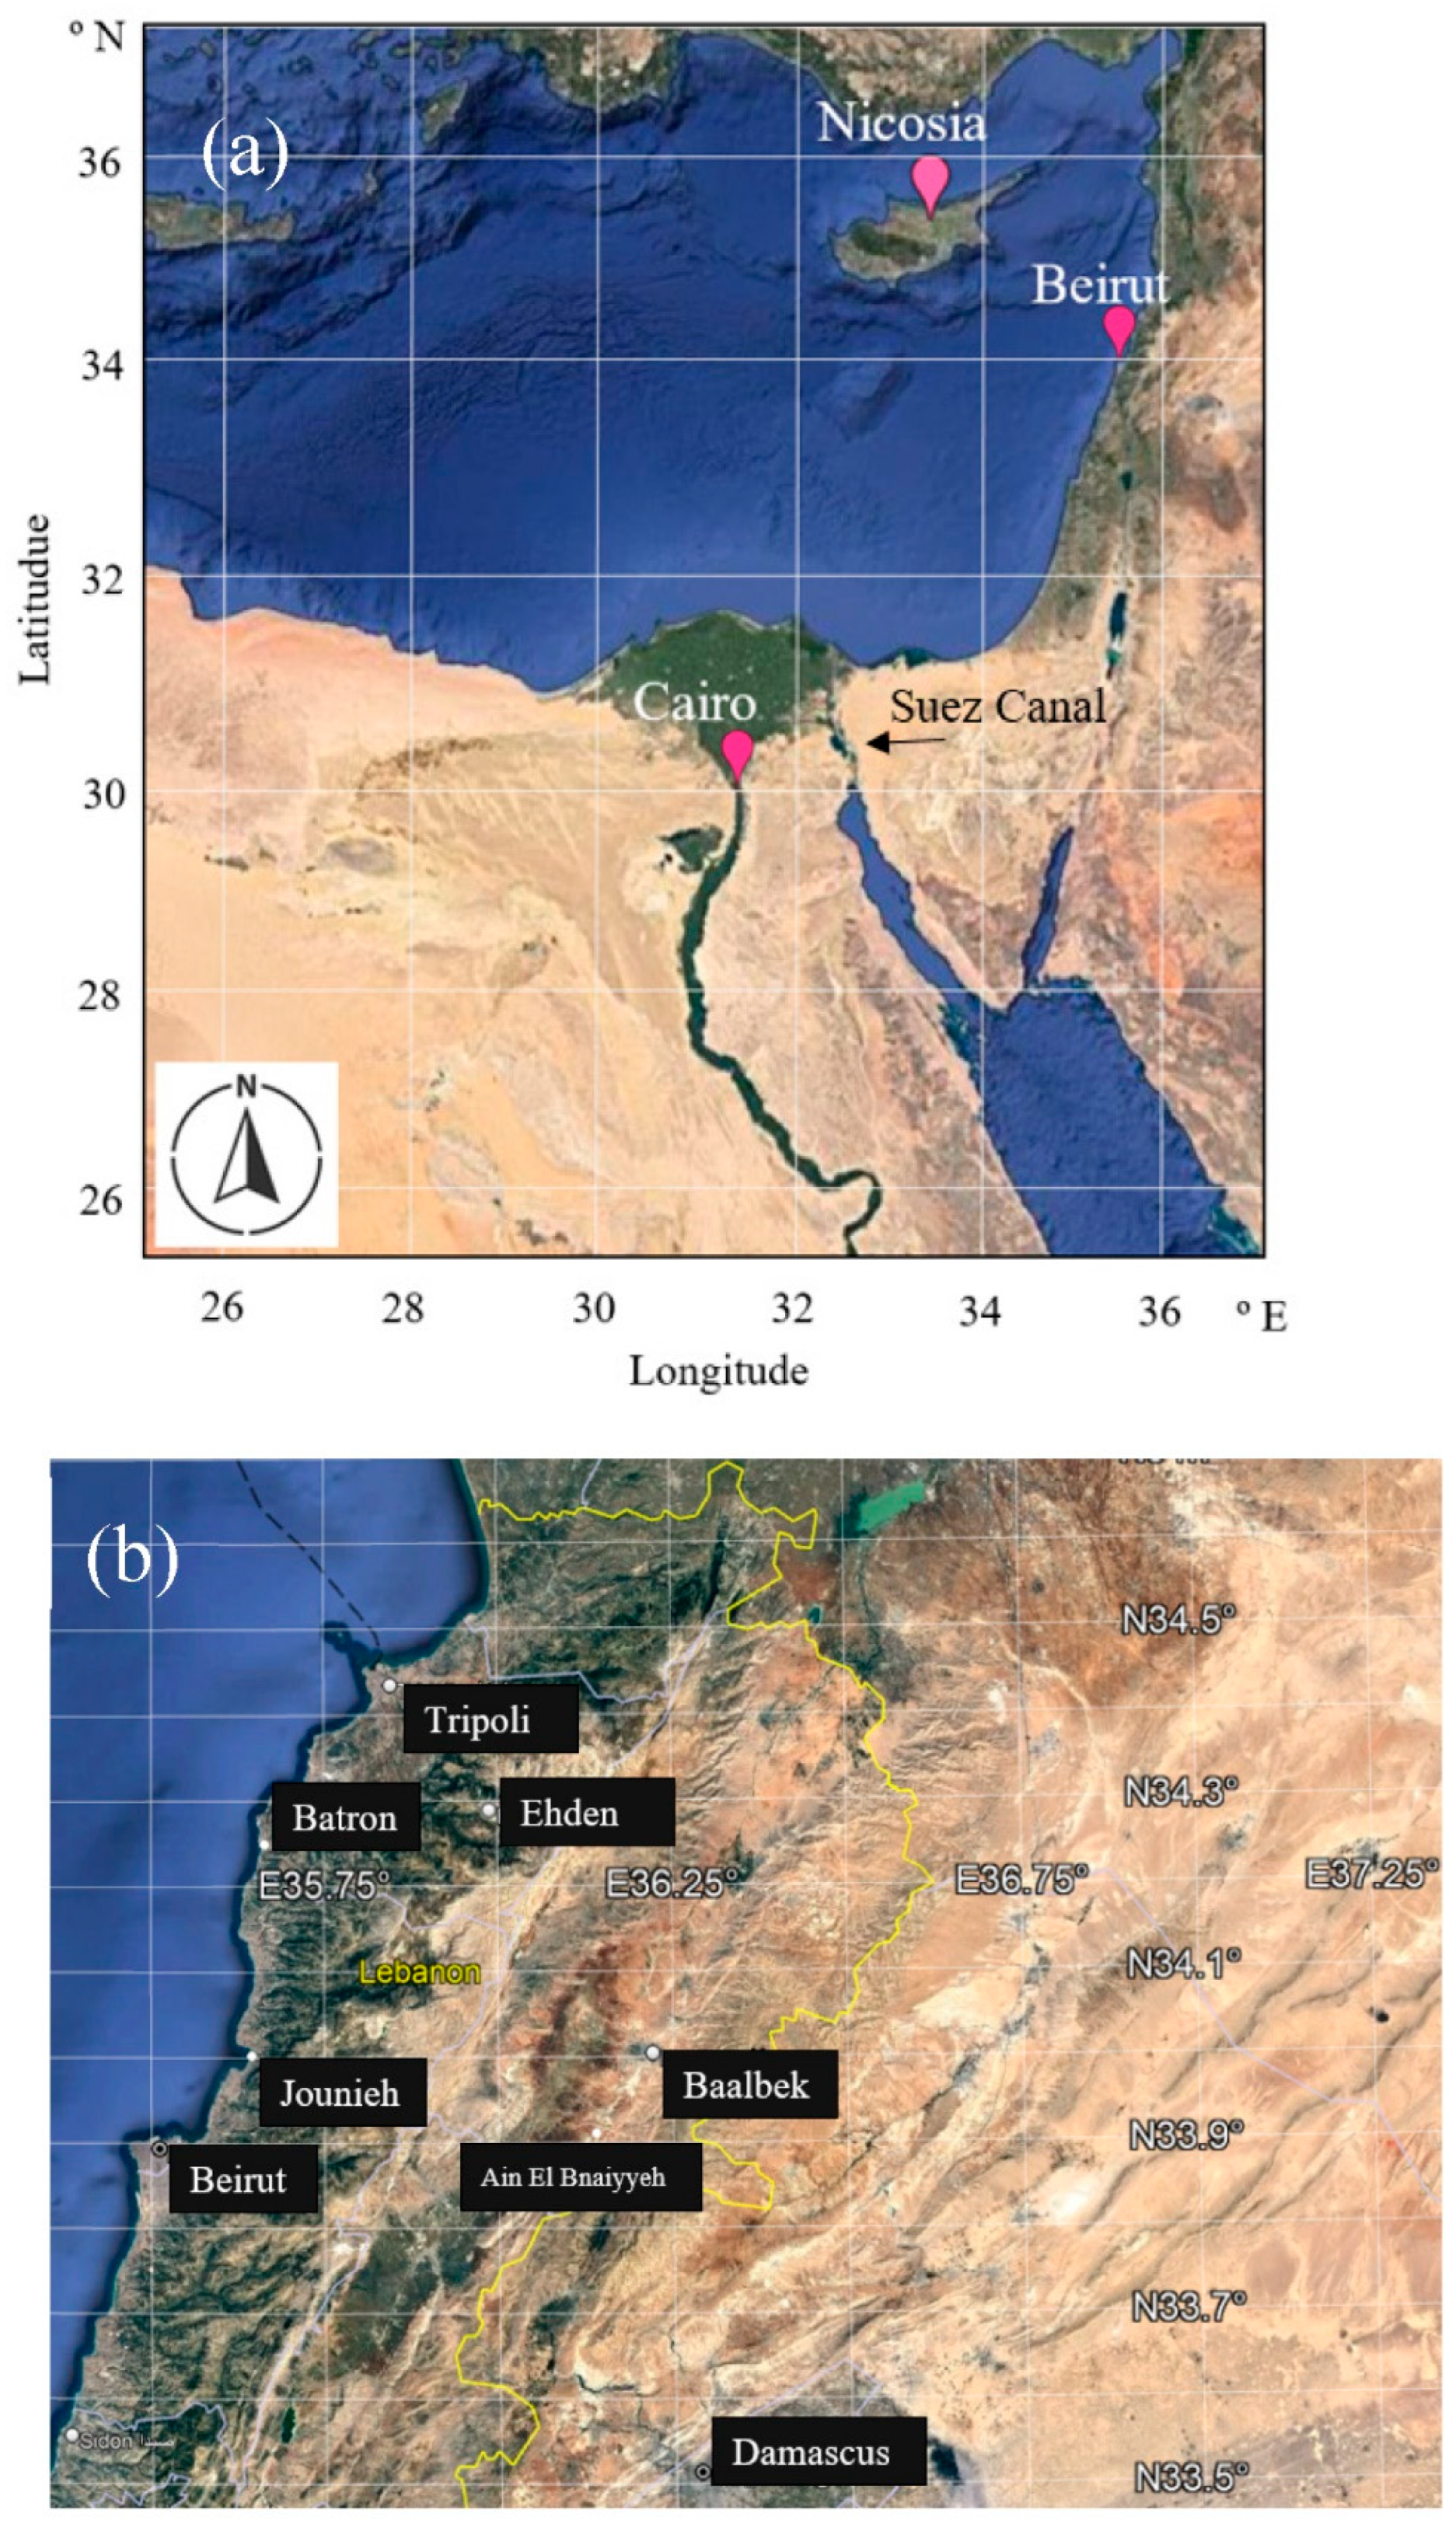
2.1. Study Area

Beirut (33.8°N, 35.5°E) (Figure 2a) is the capital city of Lebanon, with an area of about 19.8 km2 and a population of about 2.4 million people [26]. The city is located on a peninsula at the center of Lebanon’s Mediterranean coast. Beirut seaport is located on the northern Mediterranean coast. In addition to Beirut, 3 coastal cities (Jounieh, Batron, and Tripoli) and 3 inland cities (Ehden, Baalbek, and Ain El Bnaiyyeh are investigated in Lebanon (Figure 2b), Table 1.
Cairo (Al Qahirah) (30.04°N, 31.2°E) (Figure 2a) is the capital city of Egypt located in the Greater Cairo Area (GCA), which is the 6th largest metropolitan region in the world and the largest in the Middle East and Africa with a total area of about 1700 km2 and a population of about 21 million people.
In Cairo [27], summers are arid, humid, and hot, while winters are dry, cool, and mostly clear. From May to October the temperature in Cairo ranges from about 24 to 35 °C, while during November–April it drops to about 10–19 °C. Cairo does not observe much precipitation during the year with an average monthly rain fall of about 0.2 in from October to April and about 0.0 in from May to September. The winder part of the year extends from March to July with an average wind speed of about 16 km/h.
The Suez Canal (29.9°N, 32.5°E) (Figure 2a) which connects the Red Sea to the Mediterranean Sea is one of the essential and busiest waterways in the world, where about 12% of the world’s vessels pass through the Canal.
In Suez city [28], summers are arid, humid, hot, and clear, while winters are dry, cool, and mostly clear. From May to September the temperature in Suez ranges from about 23 to 33 °C, while during November–April it drops to about 10–18 °C. Suez does not observe much precipitation during the year with an average monthly rain fall of about 0.2 in from October to March and about 0.0 inch from April to September. The winder part of the year extends from March to July with an average wind speed of about 14 km/h.
Nicosia (35.2°N, 33.4°E) (Figure 2a) is the capital city of the Republic of Cyprus with an area of about 111 km2 and a population of about 200,000 people. Cyprus is the third largest and third most populated island in the Mediterranean region. Nicosia is located northwest of Beirut and north of Cairo.
In Nicosia [29], summers are arid, humid, hot, and clear, while winters are windy, cold, and mostly clear. From June to September the temperature in Suez ranges from about 22 to 32 °C, while during November–May it drops to about 6–15 °C. The wet season in Nicosia can last up to about 5 months from October to March with an average monthly rain fall of about 0.5 in from September to May and about 0.0 inch from June to August. The winder part of the year extends from November to April with an average wind speed of about 18 km/h.
Weather conditions in Beirut [30], Jounieh [31], Tripoli [32], Ehden, Baalbek [33], Cairo [34], Suez [35], and Nicosia [36] during the study period are displayed in Table 2. Weather information is not available for Batorn and Ain El Bnaiyyeh in Lebanon.
Based on the NO2 concentration in the atmosphere, the United States Environmental Protection Agency (USEPA) (USEPA 2011) classifies air quality into five categories: good ≤ 8.0, 8.0 < moderate ≤ 1.2, 1.2 < unhealthy for sensitive groups ≤ 1.6, 1.6 < unhealthy ≤ 2.0, very unhealthy > 2.0 (×10−4 mol/m2).

2.2. Methodology

Spacecraft Data

In this work, we use NO2 data from the Level 2 NO2 TROPOspheric Monitoring Instrument (TROPOMI), a single nadir viewing passive remote sensing instrument on board of S5P spacecraft [37] that covers a wavelength band from 100 to 700 nm. TROPOMI measures the solar radiation at the top of the Atmosphere reflected by the Earth in the visible, Near Infra-Red (NIR), and Short-Wave Infra-Red (SWIR) spectral bands [38]. TROPOMI spatial resolution is 5.5 × 3.5 km2 near nadir with a swath width of about 2600 km; this enables the instrument to measure air properties and trends of trace gases over large cities and mega metropolitan regions. Prior to launch the TROPOMI sensor was calibrated as described in [39]. During the first 6 months of the mission, the sensor was calibrated for angular dependency, geolocation, and irradiance radiometry. The sensor is currently applying a repetitive scenario calibration, measurements with radiance and irradiance data are calibrated to optimize nominal settings and high-spatial-sampling radiance data are measured for cloud, CO, NO2, and CH4 retrievals [40].
The relatively short lifetime (a few hours–1 day) of tropospheric NO2 ensures that any relatively high concentrations of NO2 measured in the boundary layer could be a strong indicator of the emission sources. This makes TROPOMI observation of NO2 column density a reliable source of NO2 concentrations.
However, it is essential to mention that TROPOMI measurements can still be affected by the complex processes of transformation and transport of NO2, which could create discrepancies between the space-borne measurements and the actual emissions. Some of the key factors that could affect the accuracy of the NO2 concentrations derived from TROPOMI are:
  • The tropospheric NO2 column measurements could be affected by long-range transport of NO2 and local meteorology.
  • The measurement of NO2 from TROPOMI is the impact of solar zenith angle (SZA) at a specific location and time of the observation [41], where the relevant SZA at a specific location can vary significantly with seasons.
Due to higher spatial resolution, the tropospheric vertical column density of NO2 concentration from TROPOMI is an effective proxy for surface NO2 in many air quality applications [42].

3. Results and Discussion

The NO2 concentration levels were examined in Beirut during the 4 August 2020 explosion. They were compared to the NO2 background in Beirut, possibly generated by vehicles, ships, or connected to neighboring countries. The NO2 concentration levels in Beirut have also been compared to Cairo, the Suez Canal, and Nicosia.

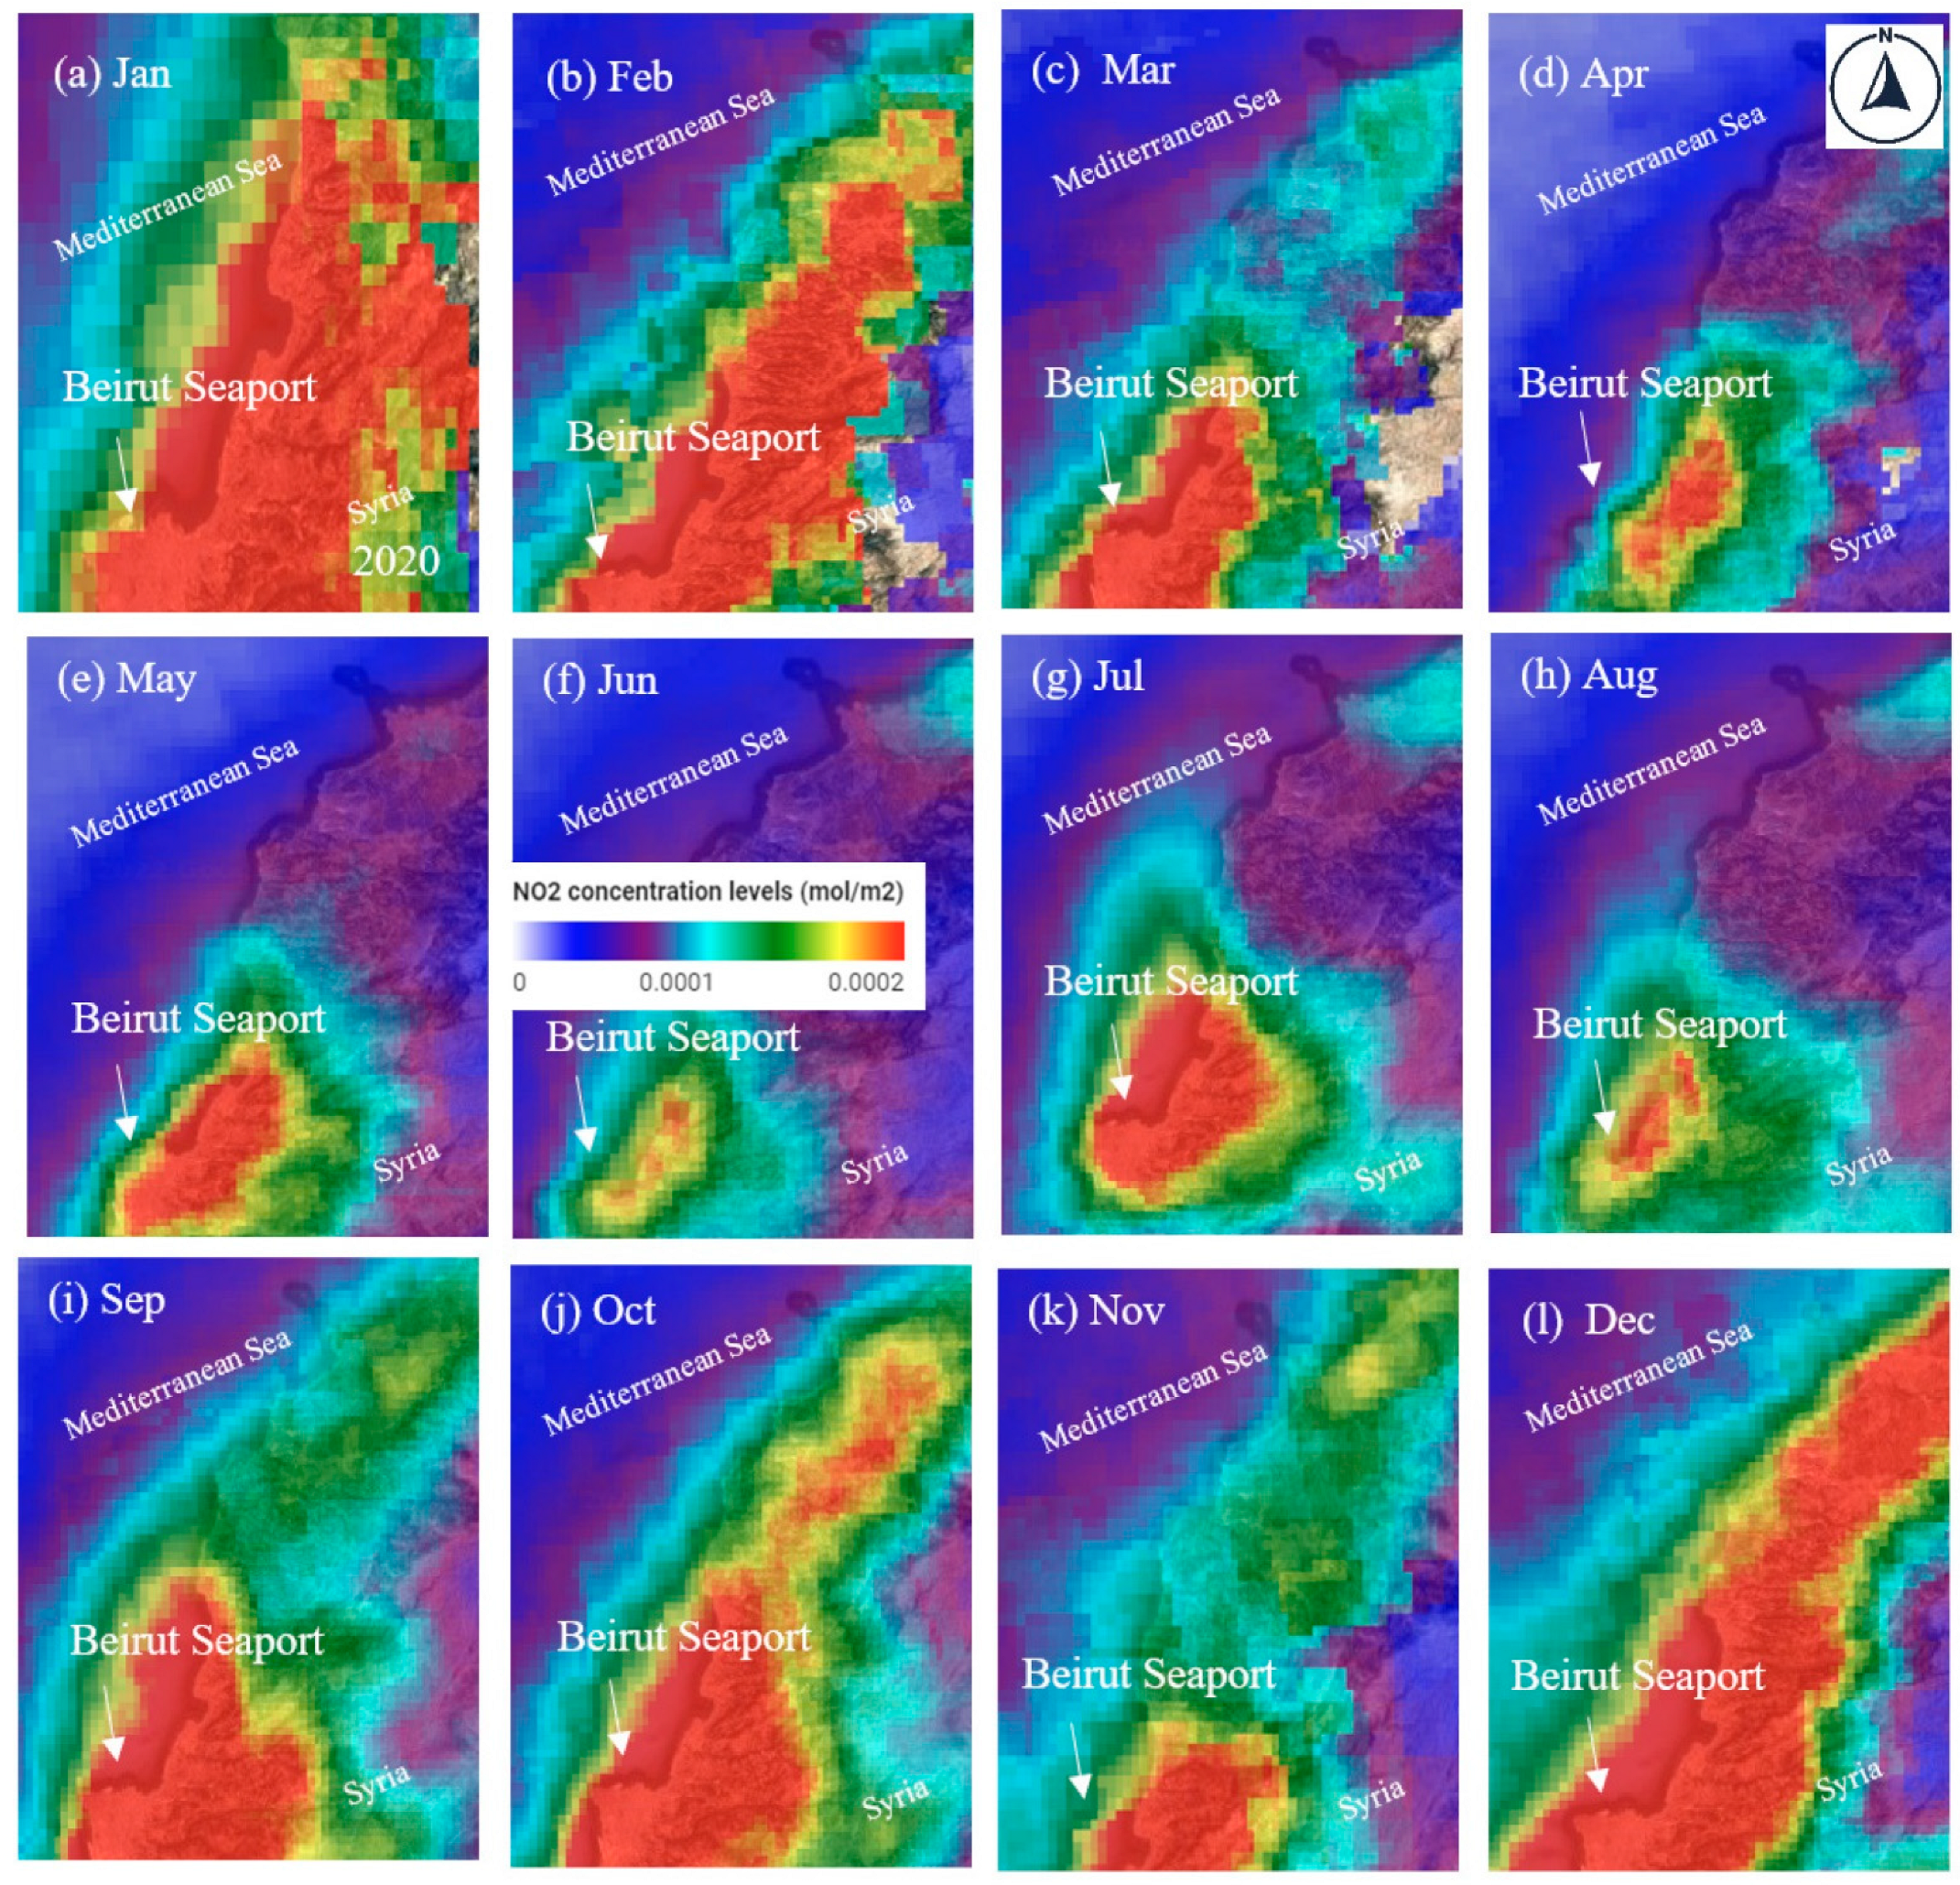
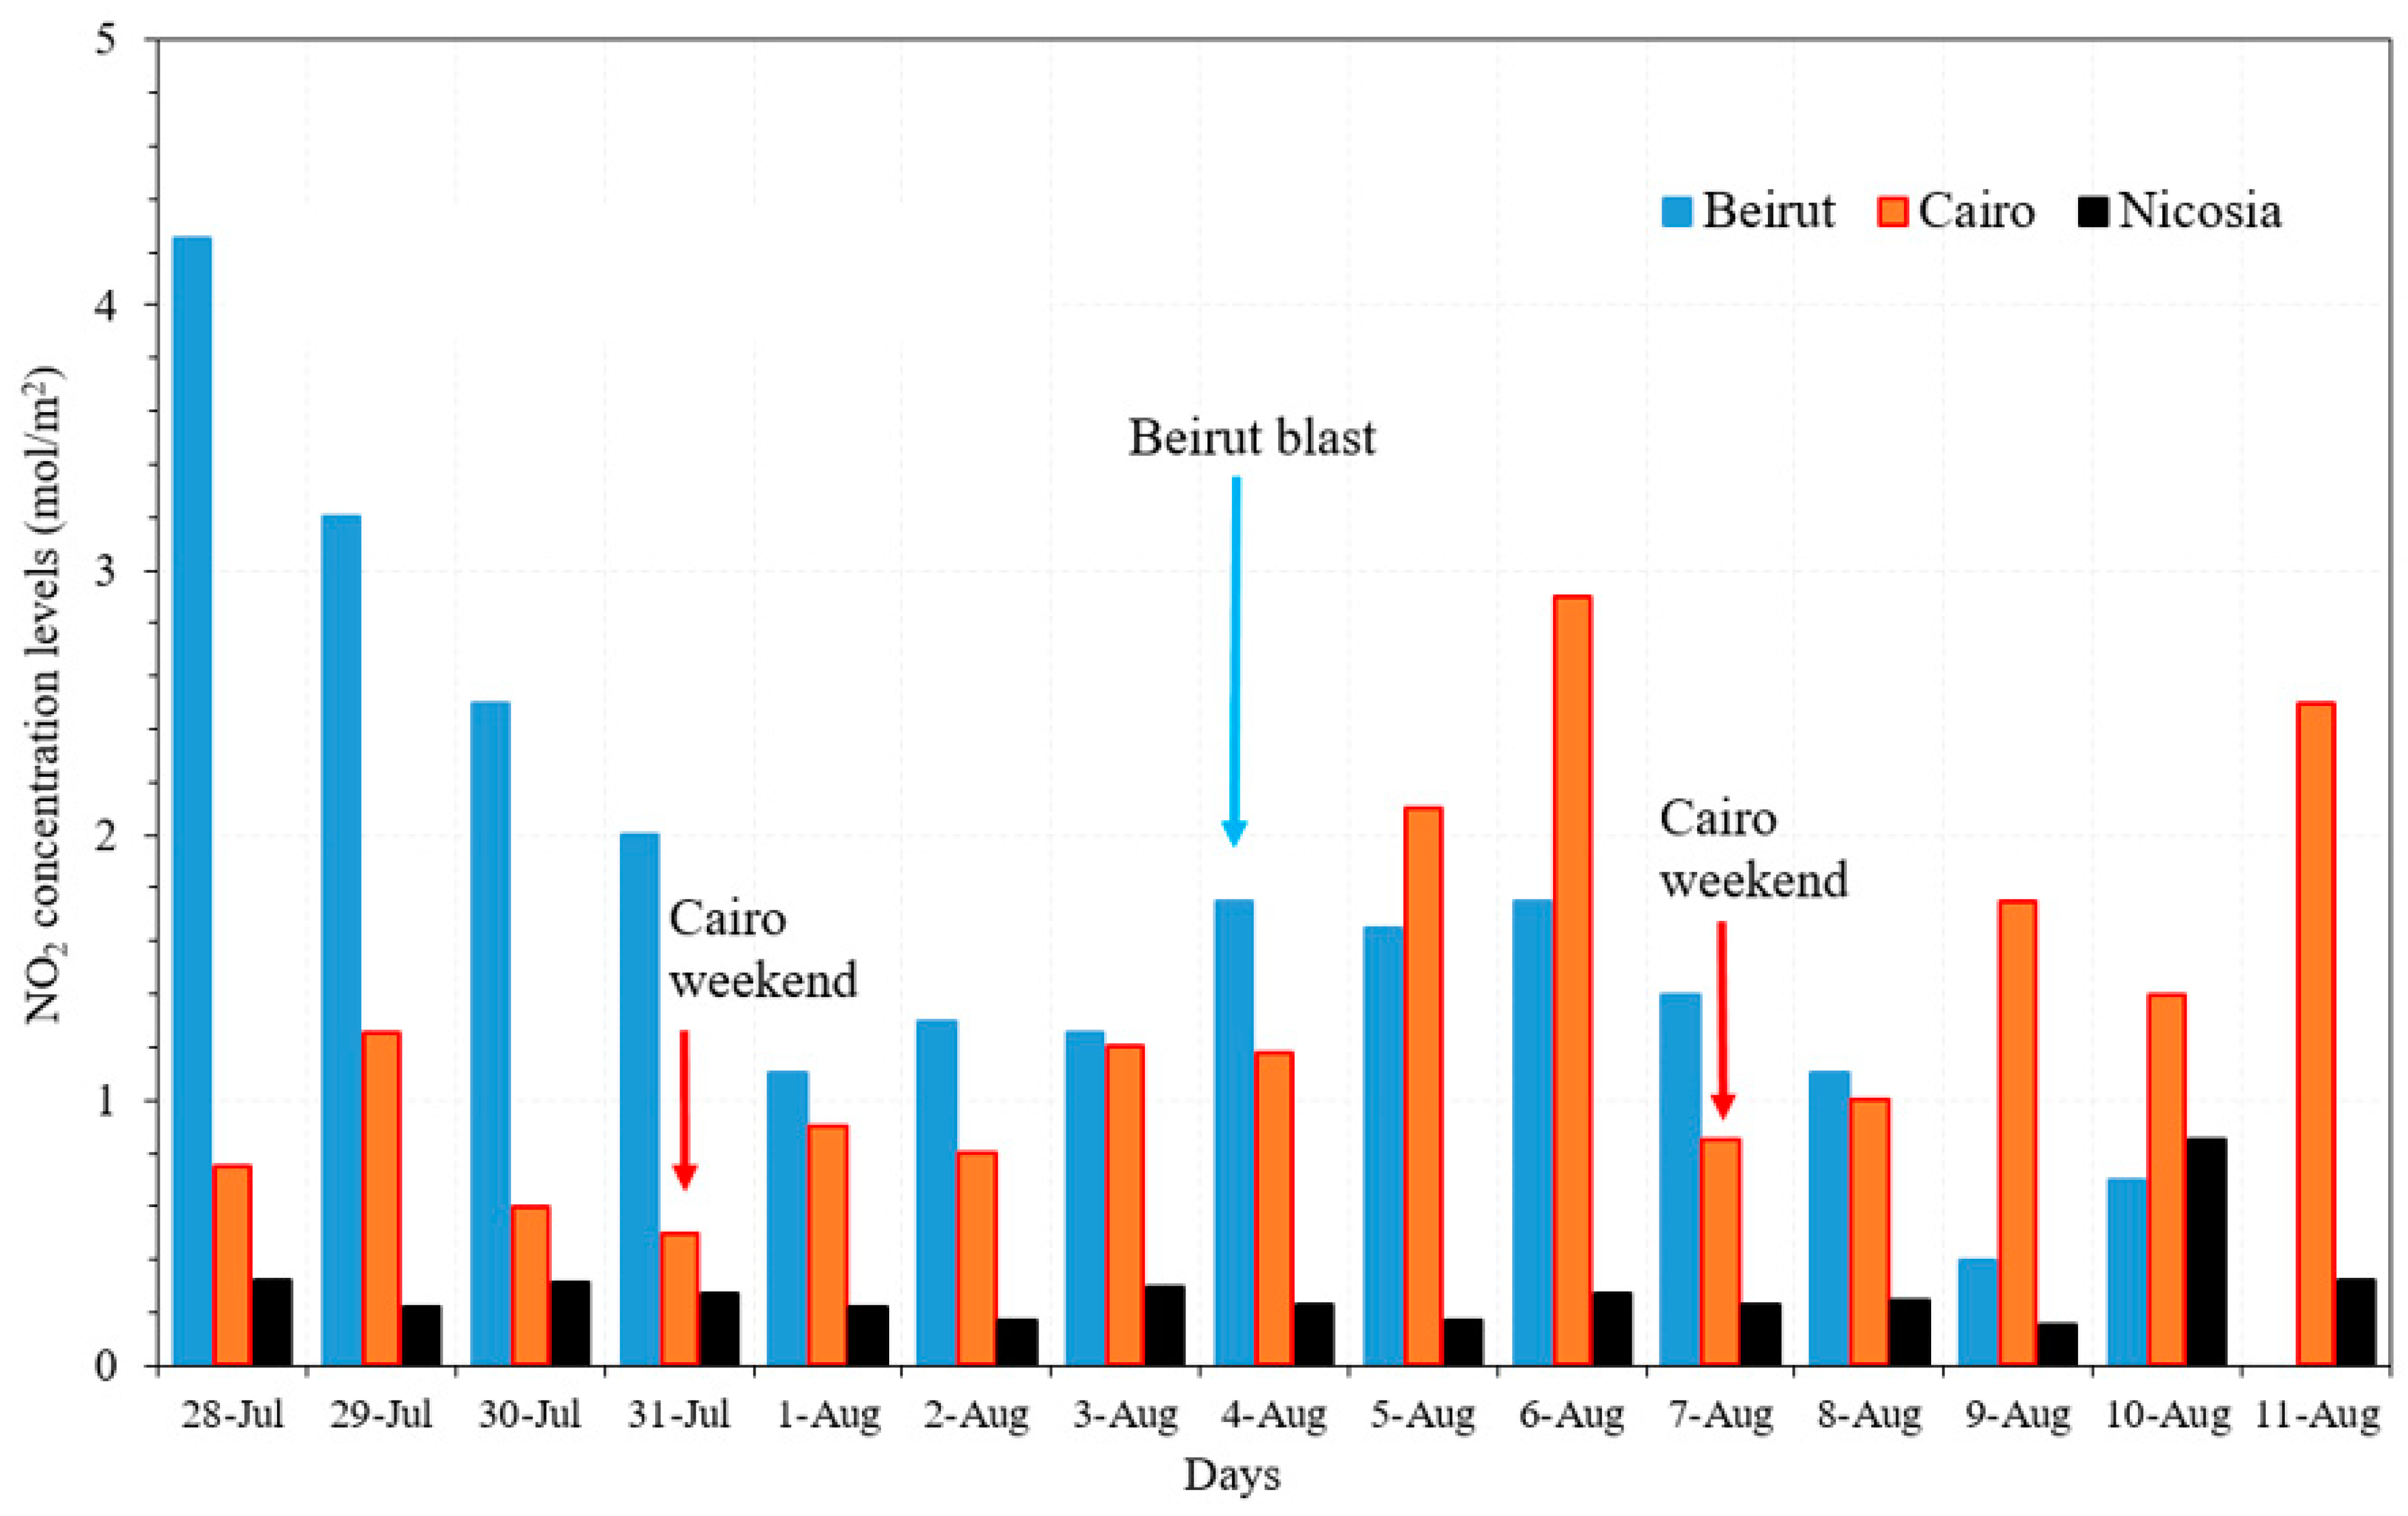
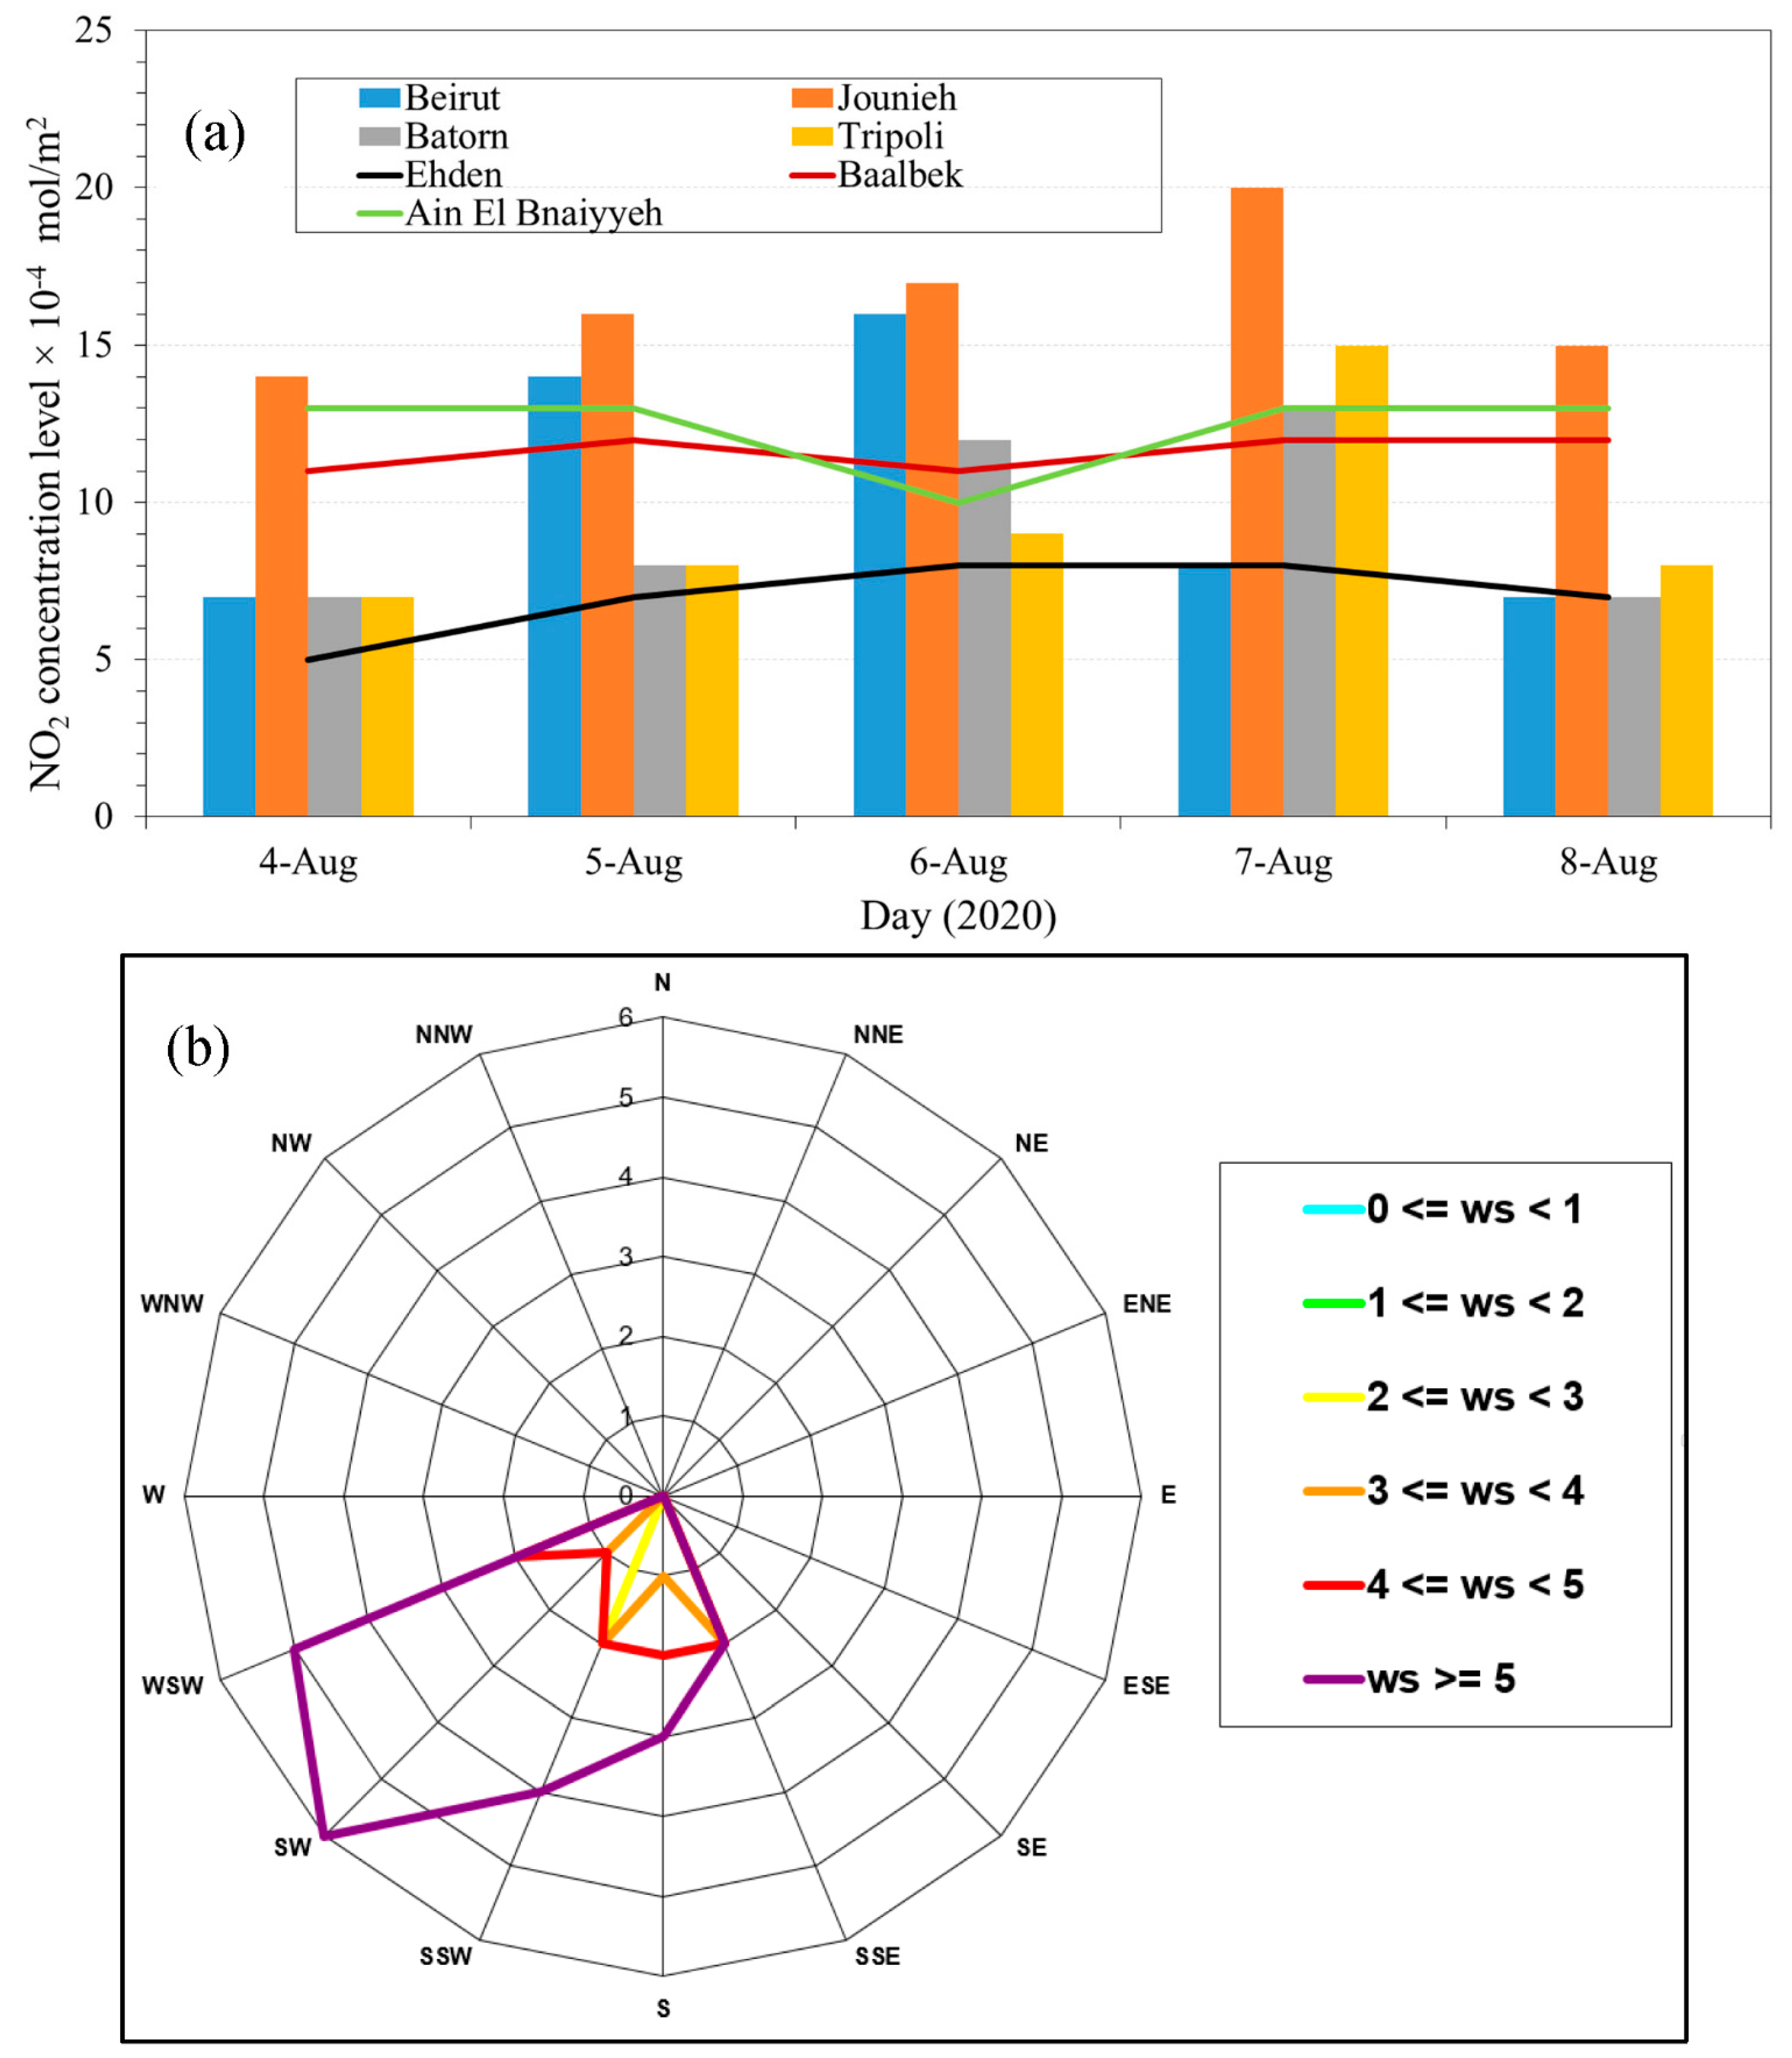
3.1. NO2 Concentration in Beirut

Figure 3a–l show the spatial distribution of NO2 concentrations over Beirut, Lebanon, from 28 July to 8 August 2020. This date range covered a few days before and a few days after the August 4th Beirut blast.
Interestingly a high NO2 emission over Beirut was observed from 28 July to 3 August 2020, before the Beirut blast (Figure 3a–g), with the highest emission on 28 July (Figure 3a). It is interesting to observe that the NO2 concentration on 28 July 2020 (Figure 3a) is higher than those recorded one day after the blast on August 5th (Figure 3i). It is also important to mention that Sentinel−5P data were acquired on August 4th around 13:05:40 (Beirut time), while the blast took place around 18:00:00 (Beirut time), thereby Figure 3h does not represent NO2 emission during the blast.
To examine if the increase in NO2 measured concentration observed in Figure 3 is not artificially caused by the data collection period, Sentinel−5P acquisition times over Beirut were examined. It can be observed (Table 3) that from 28 July to 8 August, Sentinel data were acquired almost around the same time of the day, and the satellite was above the study area for about 50 min except on 29 July, where the satellite acquired data for about 2 h and 30 min. The data indicate that the observed NO2 concentrations are not affected by the satellite acquisition times and are related to some emission sources within or around the study area.
The high NO2 background observed in Beirut could be attributed to many reasons including vehicle and ship emissions, and the war in Syria. This differentiation could help to understand the spatial and temporal significance of the NO2 emission during the explosion. Meanwhile, the armed conflict between the Syrian government and some militant groups from 20 to 26 July 2020 may have caused the enhancement of the NO2 concentration in Beirut during the end of July [43,44], where the distance between Beirut and the Syrian borders is about 60 km.
On the other hand, the relatively high NO2 emission observed in Figure 3g could be related to the air strikes over Syria on 3 August 2020 [44]. The hot spot observed in Figure 3k, is attributed to a large fire that took place in the Beirut seaport three days after the explosion [45].
To investigate if such a relatively high NO2 background is a general trend of the Beirut atmosphere or if it is just related to some short-term events, we examined the average monthly NO2 emission over Beirut from January to December 2020 (Figure 4a–l). High NO2 loadings can be observed in all months, with relatively low NO2 emissions in April, June, July, and August 2020. Data from the Beirut seaport (Figure 5) show that hundreds of ships passed by the Beirut seaport in 2020. For example, the most significant number of vessels that passed by the Beirut seaport in 2020 was in January, with about 194 ships passing (Figure 5), while TROPOMI data show high NO2 emissions during the same month. A similar observation was noticed during February–May, July, September–December 2020 (Figure 3b–e,g,i–l), where the high NO2 emission can be correlated to the relatively large numbers of ships in the Beirut seaport.
Meanwhile, during August 2020, only 136 ships passed by the Beirut seaport, with a relatively low NO2 emission observed during that month (Figure 3h). Interestingly, relatively low NO2 emission was observed in June 2020 (Figure 3f), while about 172 ships passed by the Beirut seaport that month. This discrepancy could be due to the declination of other NO2 emission sources over Beirut during June. Although vessel traffic in Beirut seaport is small compared to other ports in the world (and there was no significant change in the number of vessels that visited Beirut seaport during 2020), such traffic may significantly affect the air quality for a relatively small country like Lebanon.

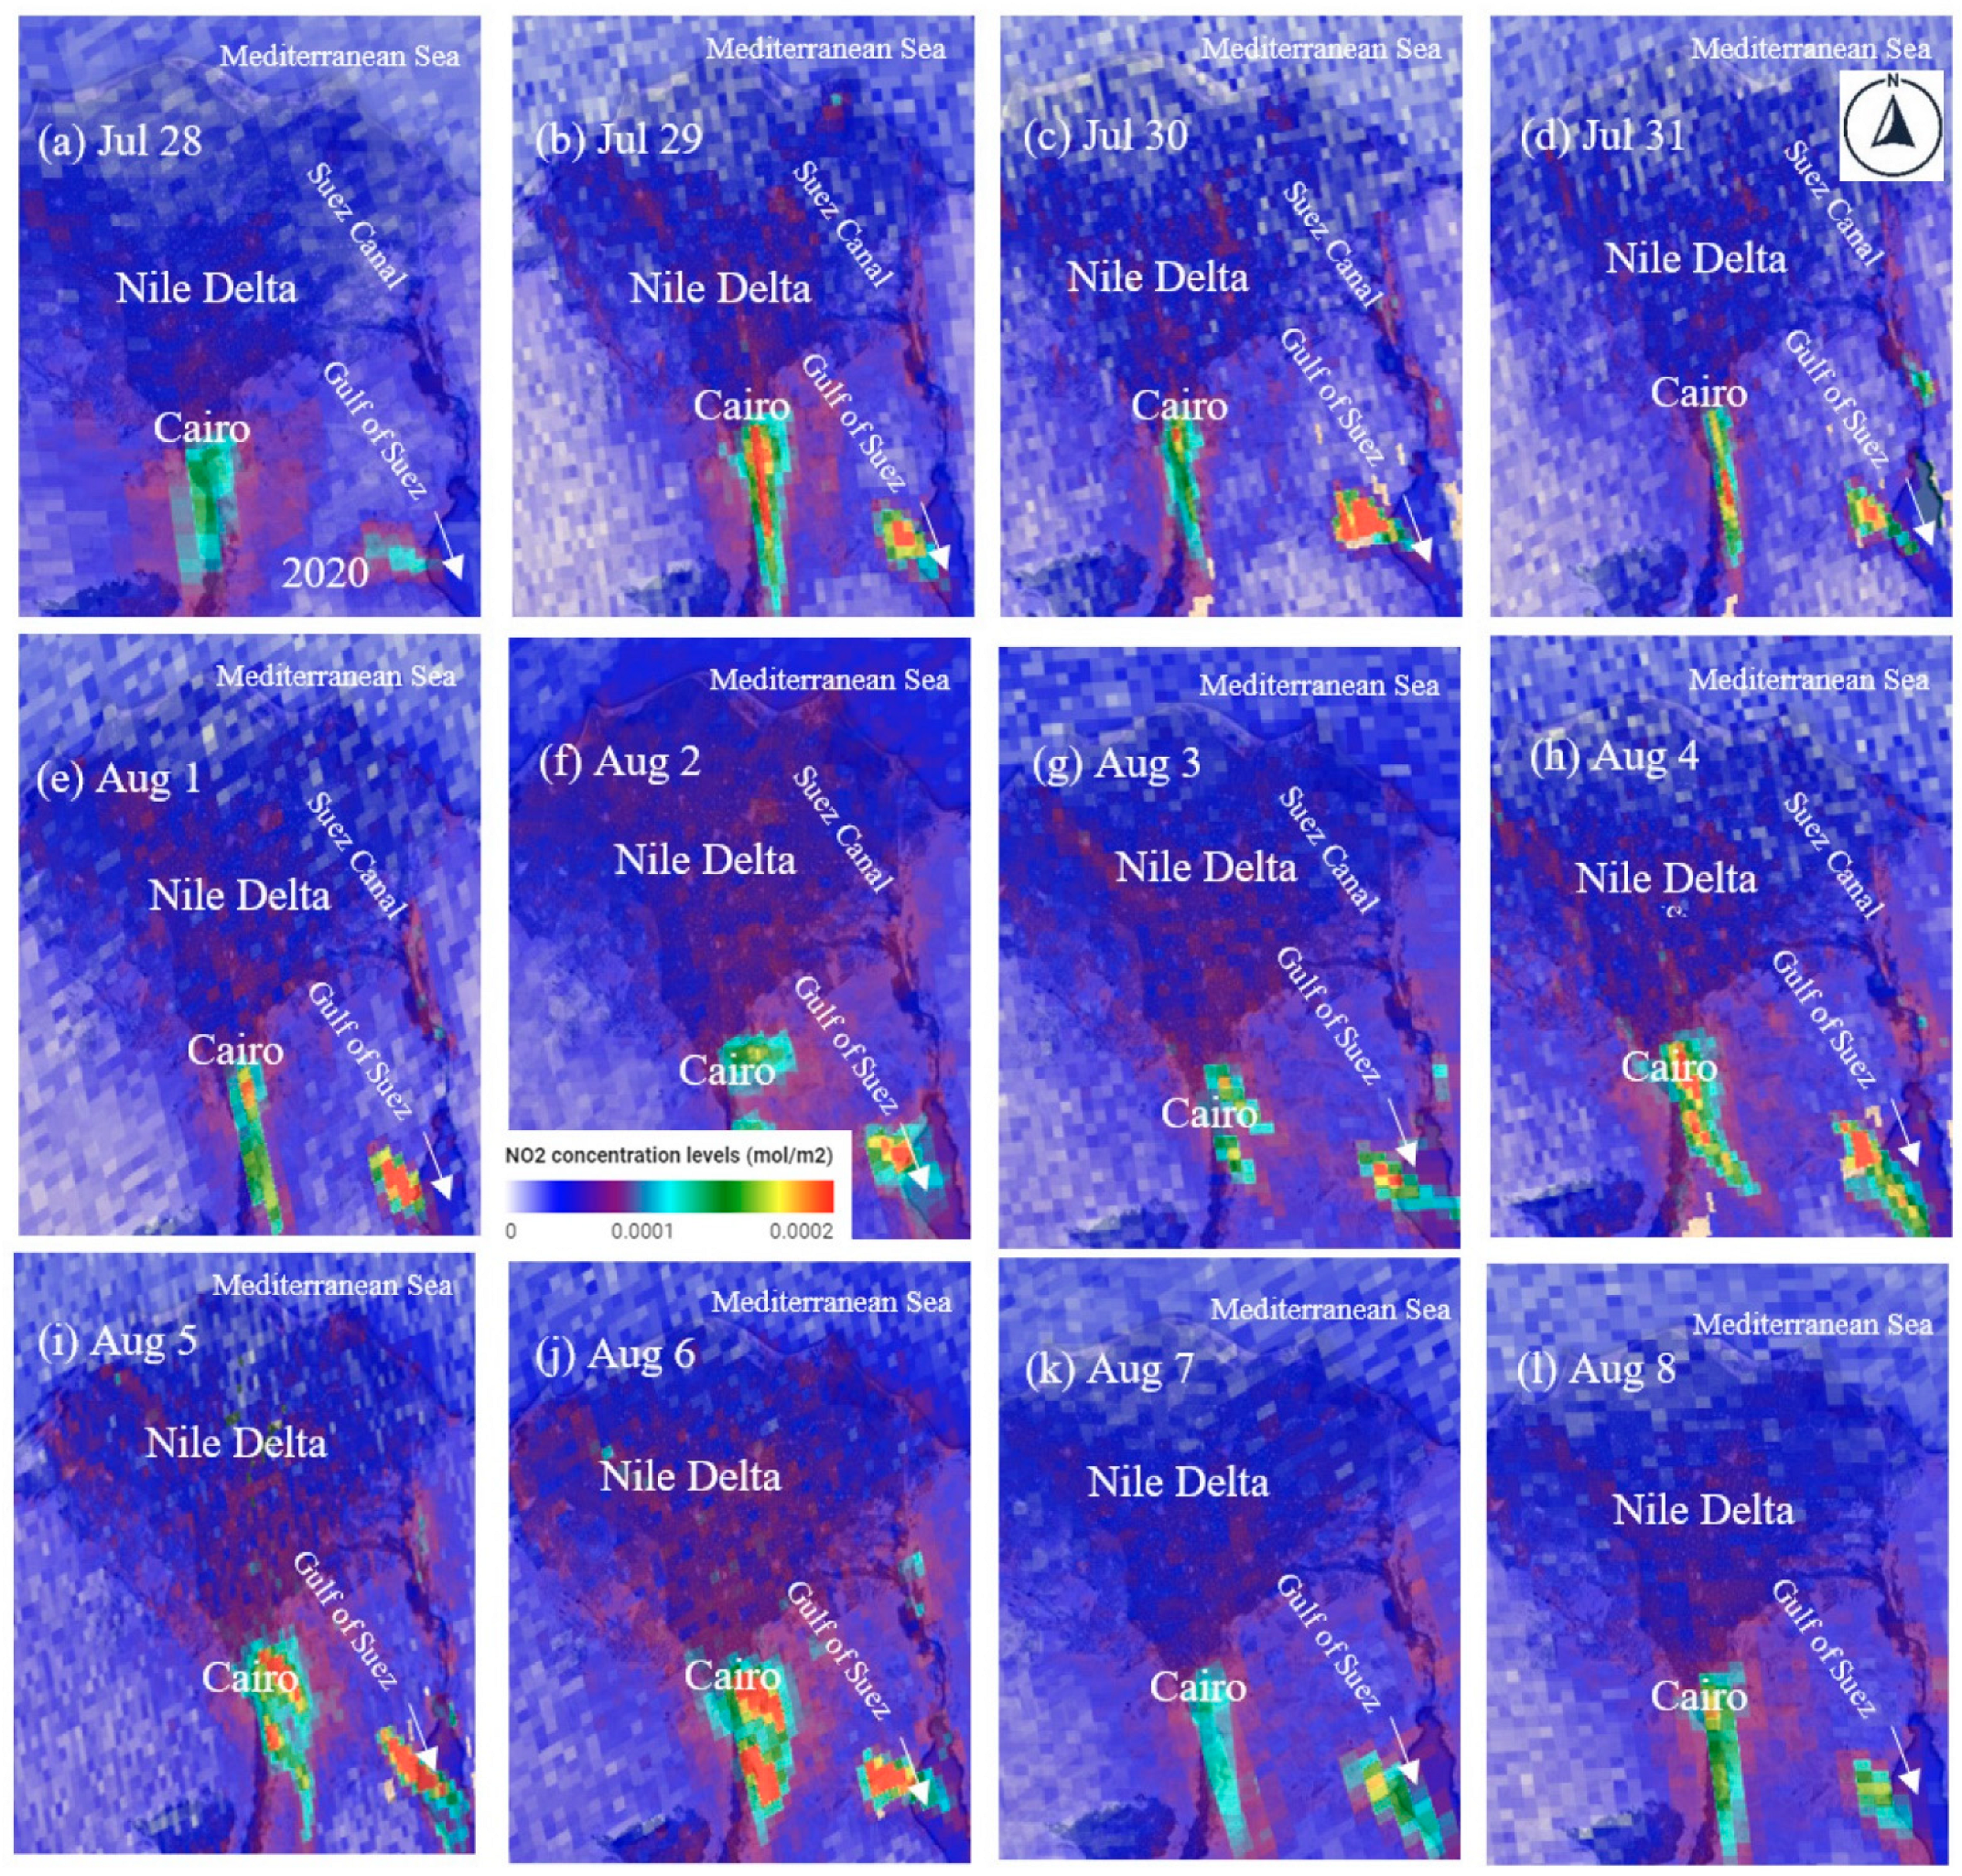
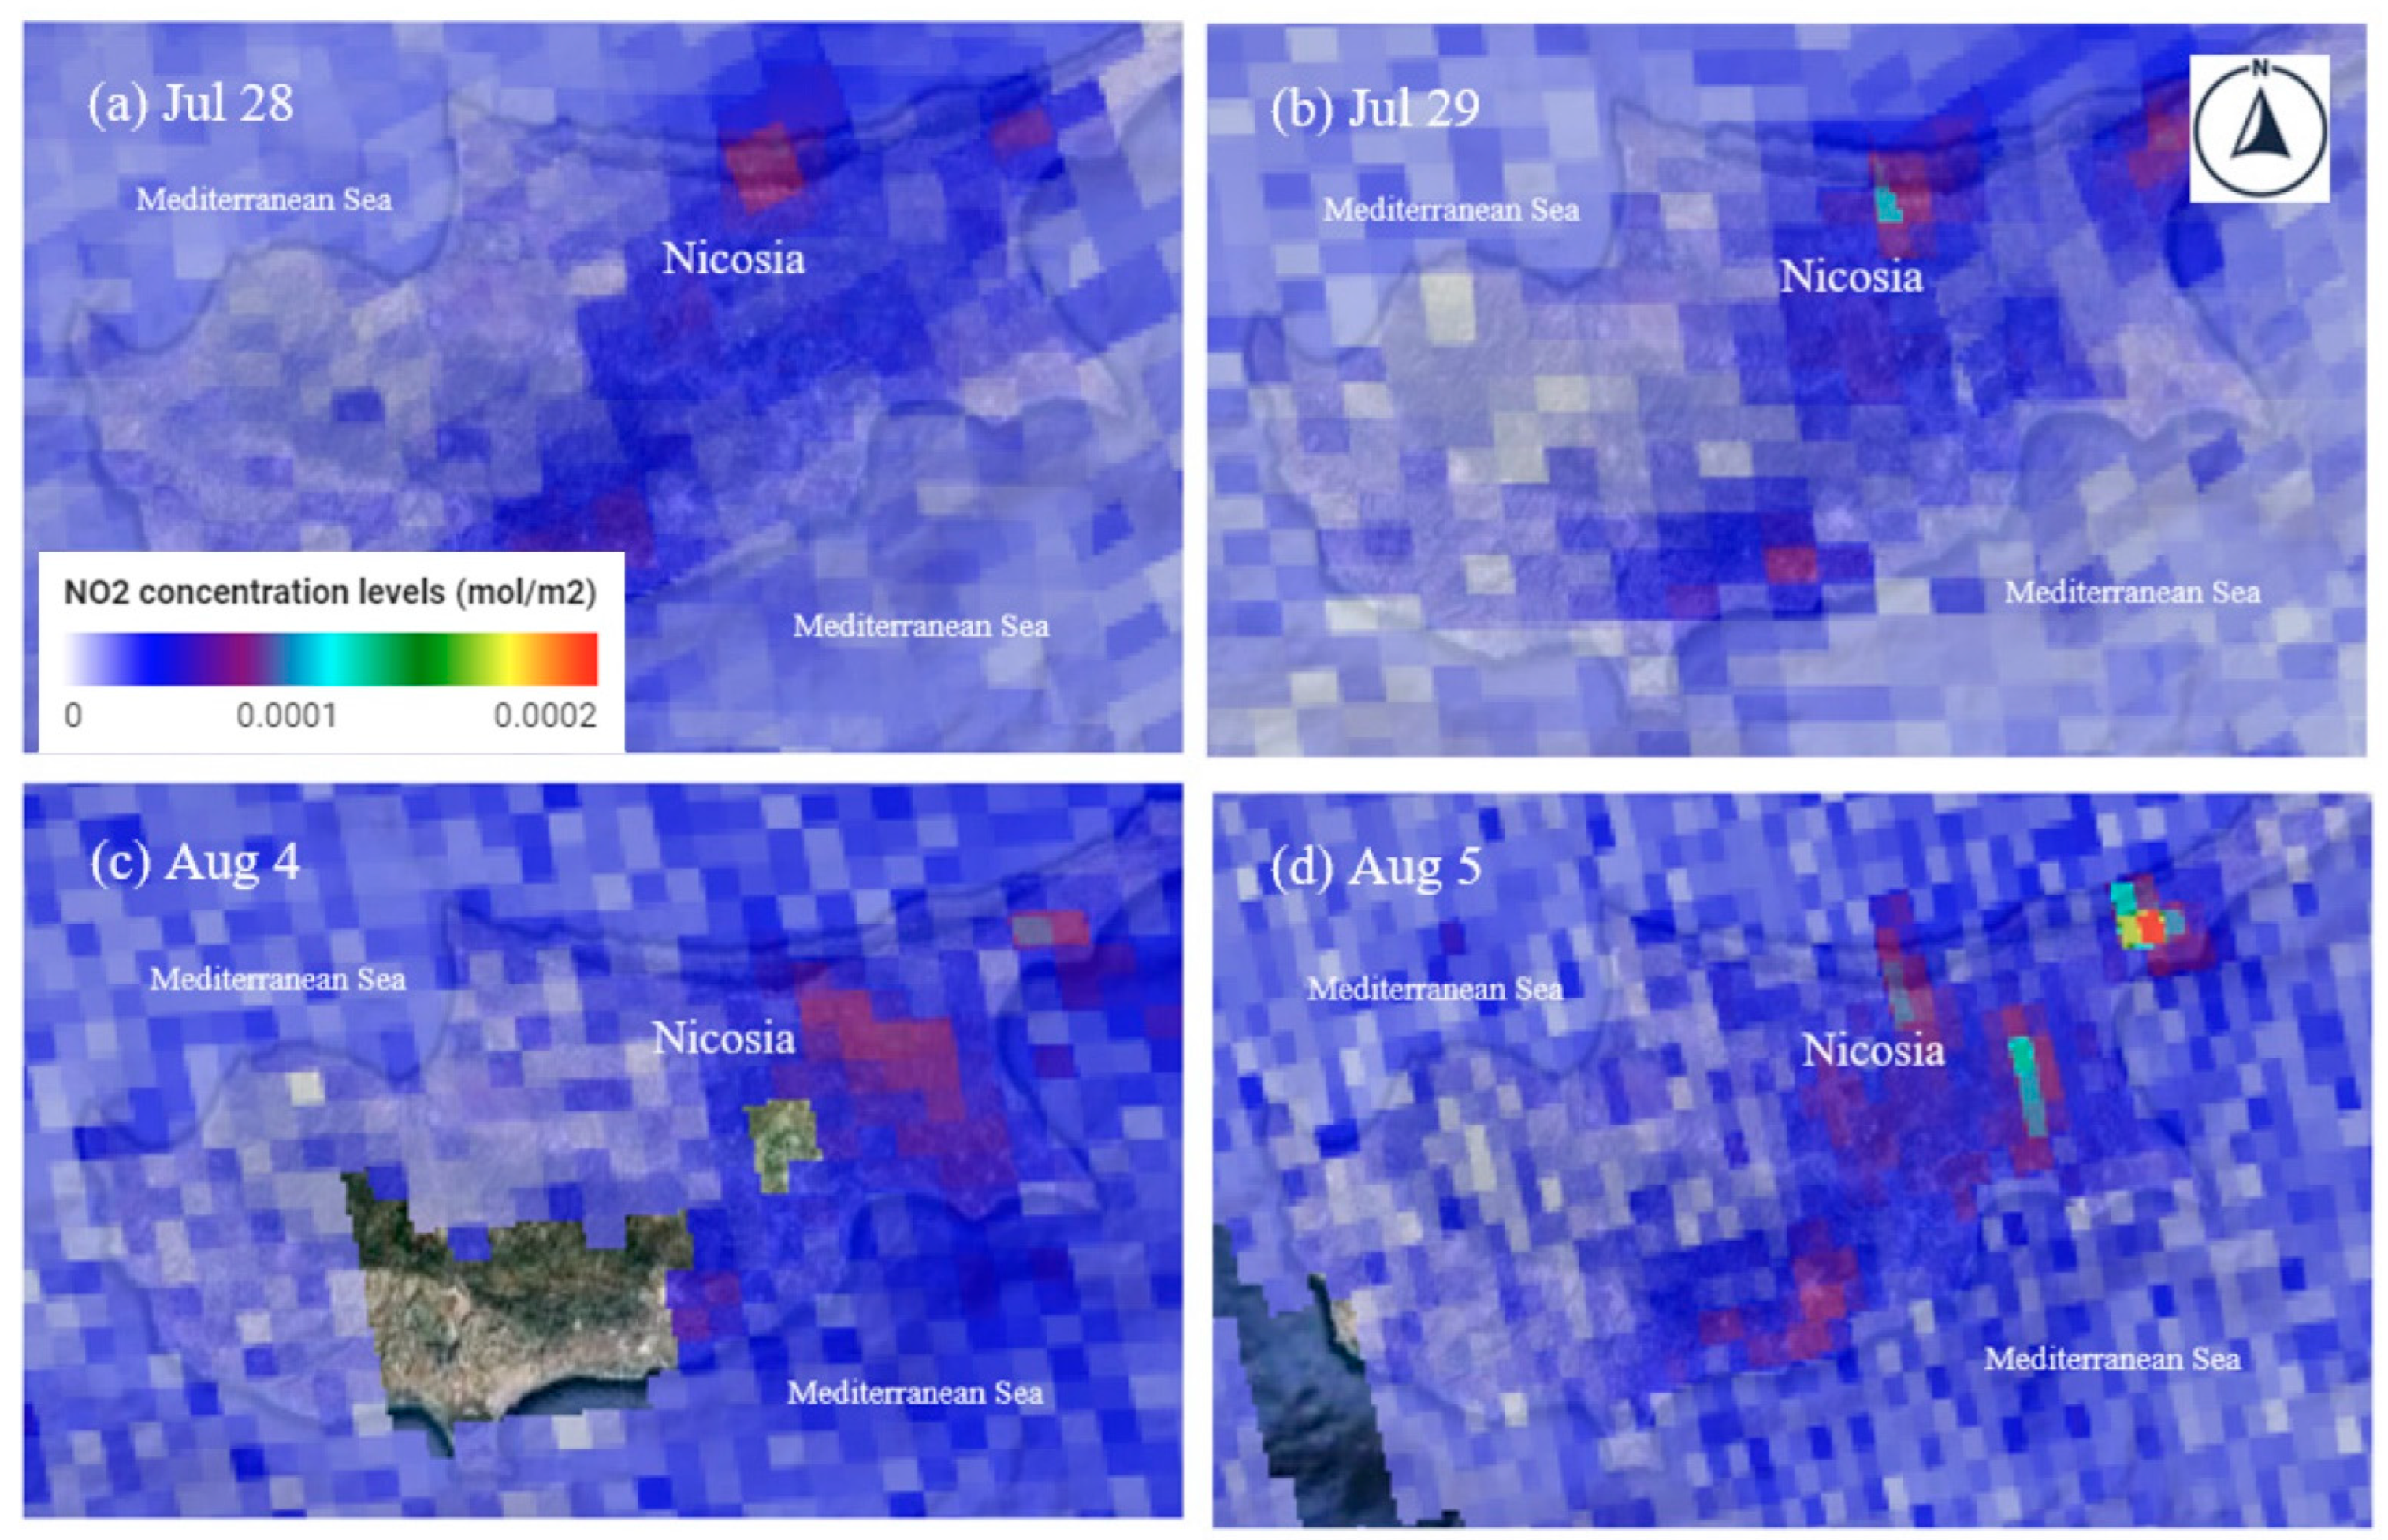
3.2. NO2 Concentration in Cairo, Suez Canal, and Nicosia

To better understand the effect of vehicles and ships on the NO2 loadings in the atmosphere, emissions from the GCA were examined from 28 July to 8 August 2020 (Figure 6a–l). Cairo city registered vehicle data were reported at about 2,483,030.000 units in 2017. In Egypt, diesel is still widely used in fueling heavy machines, buses, and trucks. The high number of aged and diesel-based vehicles in the GCA produces several toxic emissions such as carbon monoxide (CO), hydrocarbons, and nitrogen oxides [29,30].
Permanent high NO2 emissions can be observed over the GCA during the study period. This emission is mostly attributed to this region’s dense population and associated high traffic. Another hotspot of high NO2 emission is observed near in the east of Egypt at the Suez city (29.9°N, 32.5°E) on the Gulf of Suez at the Red Sea, where this area hosts the Suez Canal, one of the world’s busiest artificial waterways connecting the Red Sea to the Mediterranean Sea. Such dense vehicles and marine traffic near the Suez Canal are expected to increase NO2 emissions from ships, trucks, and other logistic services related to the canal. It is interesting to observe the relative reduction in NO2 emissions on 31 July (Figure 6d) and 7 August (Figure 6k), where both dates are Fridays, a weekend in Egypt. This confirms the high correlation between human activities related to road and marine traffic and NO2 emissions in Egypt. Based on the USEPA categorization for air quality NO2 concentrations, large hot spots of unhealthy and very unhealthy regions are observed around the Nile delta and the Gulf of Suez. Similar effects of NO2 vehicular emissions have been reported in [45], where NO2 hotspots are observed near sections of roads where vehicles are accelerating or queueing. Trends of NO2 decays away from urban areas similar to Figure 6 have also been reported in [46]. Locations of NO2 hotspots near GCA and the Suez canal can also be observed in the NASA Aura/OMI NO2 measurements [47] over Egypt from 1 December 2019 to 1 October 2022 and these locations match the data displayed in Figure 6.
Another example of vehicles’ possible effect on NO2 concentrations in the atmosphere is displayed in Figure 7, where NO2 concentrations are measured over Nicosia, Cyprus, on 28–29 July and 4–5 August 2020. It can be observed that the NO2 concentration over Nicosia is significantly lower than observed over Beirut and CGA during the same period. Similar relatively low NO2 concentrations were observed from 30 July to 3 August and 6 to 8 August 2020 (not shown in Figure 7). Such low NO2 emission could be related to the relatively low population in Nicosia (200,452 people) compared to Beirut (1,916,100 people) and Cairo (21,750,020 people) [26], thereby there are less of vehicle emissions.
Figure 8 shows a comparison between the cities of Beirut, Cairo, and Nicosia from 28 July to 11 August 2020, where the maximum daily NO2 concentration is recorded, where the NO2 emissions in Beirut were about 4.3 and about 2.3 times higher than those in Cairo and Nicosia. While NO2 emissions remained high in Beirut compared to Cairo and Nicosia during 29 July–31 July, emissions in Beirut started to decline on 1 August to about 1.2 mol/m2, close to the Cairo emissions (about 1.1 mol/m2) on the same day. The Beirut explosion enhanced NO2 concentrations over the city from 4 to 6 August, while the emissions started dissipating from 7 August to 10 August. No concentrations of NO2 from the TROPOMI satellite were observed over Beirut on 11 August 2020.
On 31 July and 7 August, the NO2 concentrations over Cairo declined to about 0.6 and about 0.8 mol/m2 associated with the weekend in Egypt. A high enhancement in NO2 concentration was observed over Cairo on 5 August (about 2.1 mol/m2) and 6 August (about 2.9 mol/m2). Compared to Cairo and Beirut, the NO2 concentrations remained low in Nicosia except on 10 August 2020, where an enhancement was observed up to about 0.8 mol/m2 associated with some large musical events that took place on 9 and 10 August 2020 in the city of Paphos (about 159 km from Nicosia). Such cultural events in Cairo and Nicosia were associated with an increase in the number of vehicles near the events area, which caused the NO2 emission enhancement.
The above results show that NO2 emissions from vehicles and ships could be comparable to or even more significant than those generated by large AN blasts similar to the Beirut explosion. It is important, however, to examine the temporal and spatial significance of NO2 emissions during the explosion.

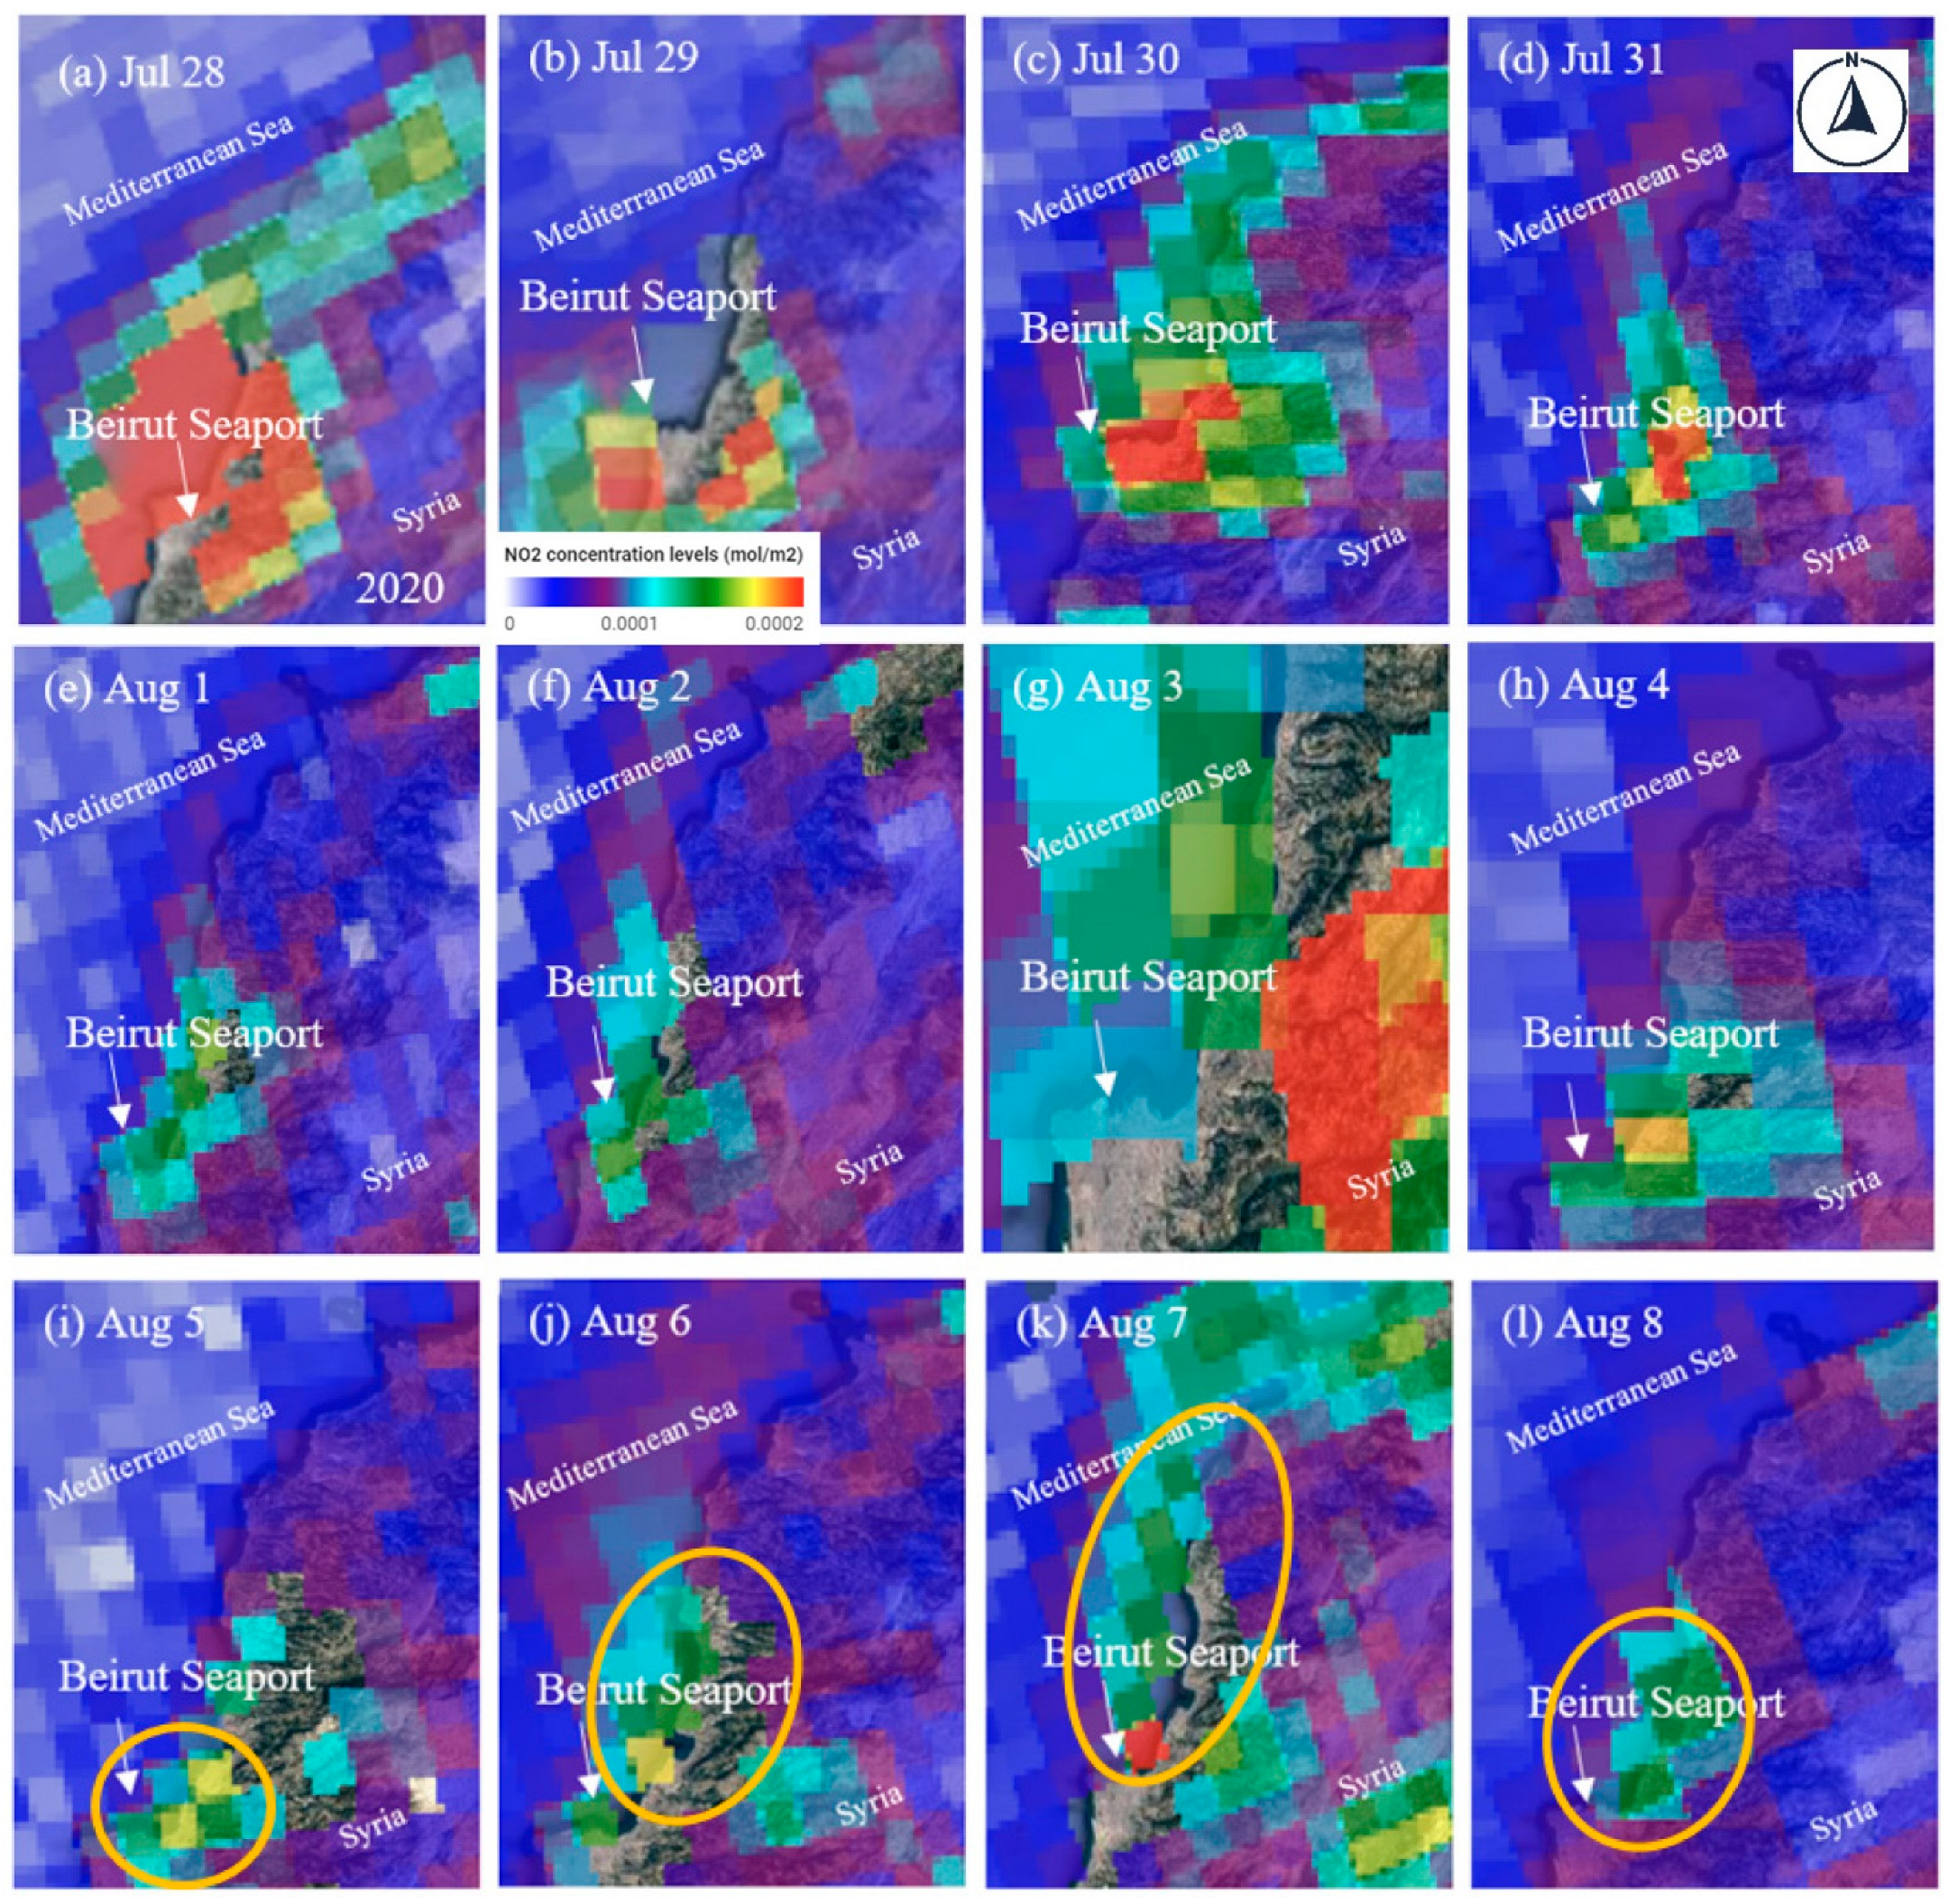
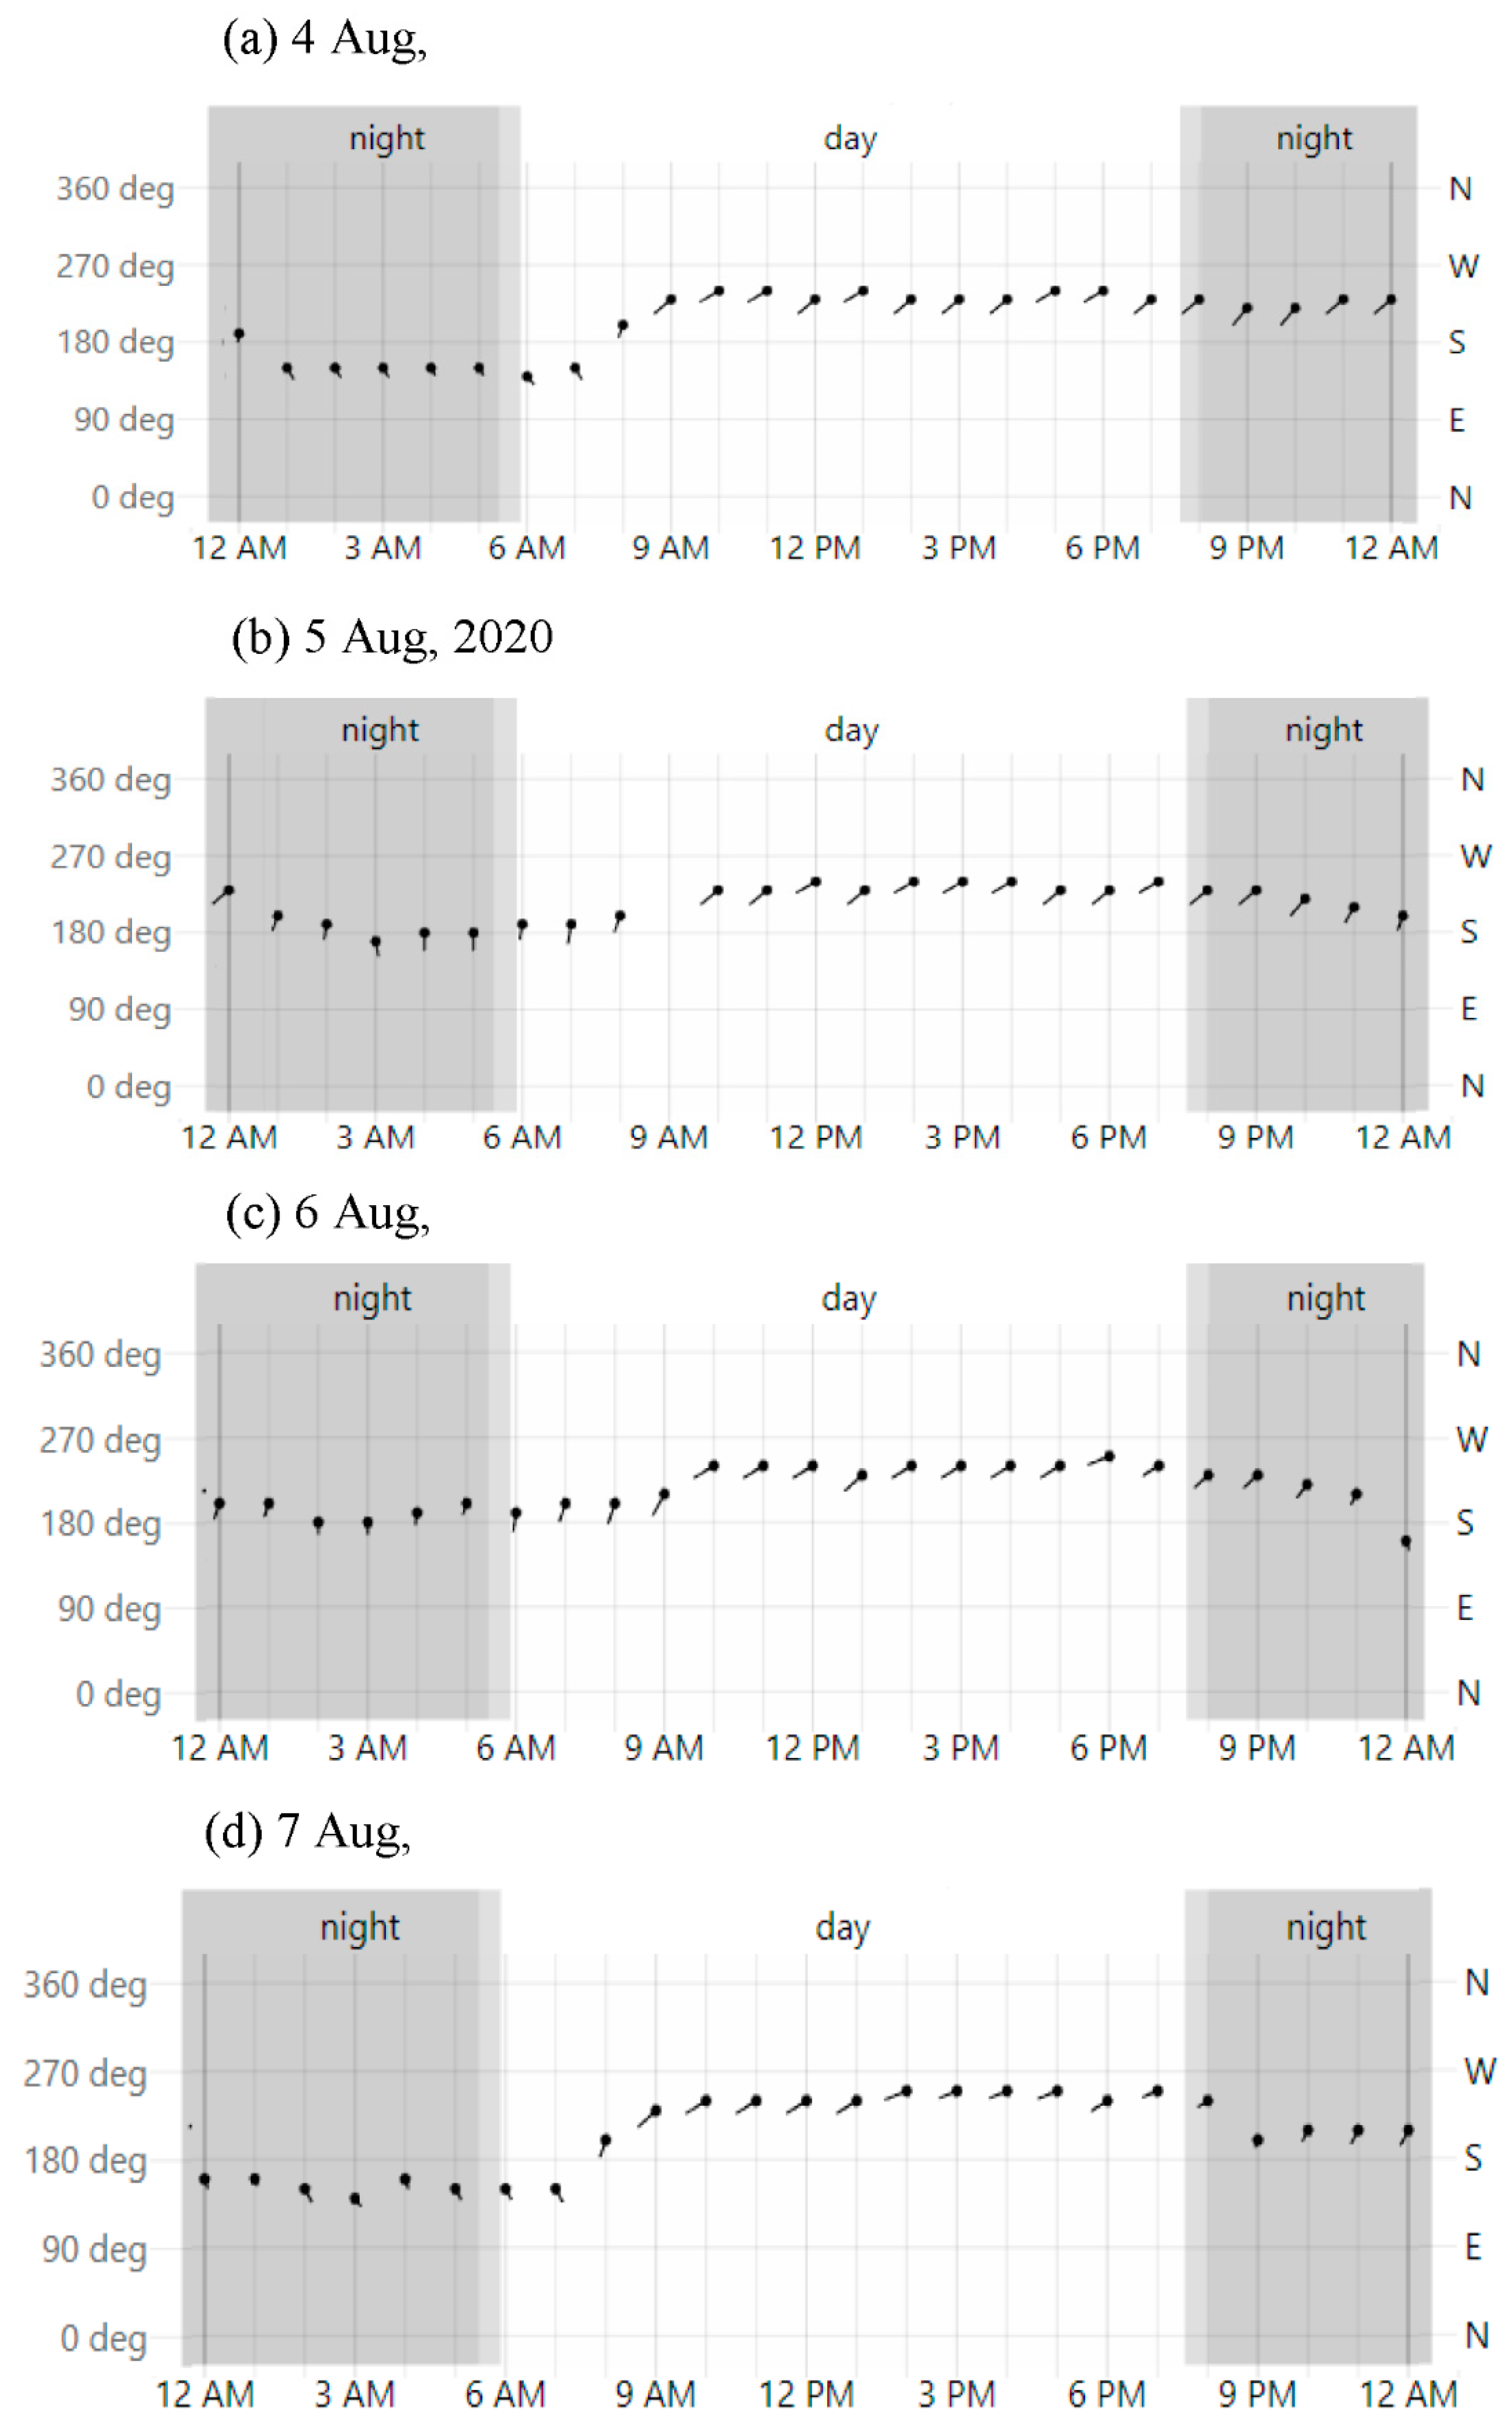
3.3. Effect of the Blast on NO2 Concentration over Beirut

It is well known that AN explosions produce NO2 gas, and for a massive blast like the Beirut explosion, large amounts of NO2 are expected to be generated and loaded into the atmosphere. This can be confirmed by the explosion photos (example: Figure 1a) that reveal a distinct reddish color to the plume of gases from the explosion. For a small country like Lebanon, without a steady pattern of its NO2 background, it is important to differentiate between the NO2 emitted during the explosion and the background. This is undertaken by tracking the NO2 plumes after the emission and by investigating the spatial and temporal distribution of the NO2 gas produced by the blast. This is crucial; otherwise, the NO2 loading in the atmosphere during the blast may be overestimated by mixing it with the background. NO2 background is usually distributed over a large area (for example: Figure 3a–d,g), while NO2 emitted from the blast is usually focused in a small areas, where the plumes can be tracked to other regions.
The circles/ovals in Figure 3i–l clearly show the NO2 plume originating from the Beirut seaport and propagating along the Lebanese coast in the NE direction. Figure 3k shows the NO2 emission associated with the fire that took place near the Beirut seaport on 7 August. Figure 3l shows that the plume almost dissipated around 8 August. It is interesting to observe that NO2 plumes barely moved into inland directions.
NO2 concentration levels have been examined in seven locations (Figure 2b, Table 1) with four coastal locations: (1) Beirut, (2) Jounieh, (3) Batron, and (4) Tripoli and three inland locations: (1) Ehden, (2) Baalbek, and (3) Ain El Bnaiyyeh. Figure 9b shows NO2 concentration levels from 4 to 8 August 2020 in the seven locations. It is clear that the NO2 concentration levels increased in the coastal sites after the blast, while the inland locations are mostly unaffected. Figure 9b and Figure 10 illustrate that from 4 to 8 August 2020 the wind from the SW direction could have helped in the propagation of NO2 from the explosion site towards the NE direction towards the coastal locations. The above results indicate that although NO2 was emitted during the Beirut blast it mostly affected some of the coastal locations within 20–25 km from Beirut and it did not affect the inland regions. The limited spatial dissipation of NO2 observed in Beirut agrees with [7], where the overpressure zone extended from 280m to few kilometers around Toulouse, France during the 2001 AN detonation. On the other hand, the spatial distribution of NO2 after the explosion was estimated in [26] to cover large areas of Beirut and Lebanon and all the way to western Syria starting from the first day of the explosion, however other sources that may have contributed to the NO2 loading in the atmosphere were not fully examined in that study.
Moreover, the NO2 effect on the coastal regions lasted for 3 days only after the blast then it dissipated on day 4 (August 8). It can also be observed that vehicles and ship traffic could significantly affect NO2 loading in the atmosphere, and NO2 emissions from such sources could be comparable to large AN explosions similar to the 2020 Beirut blast.

4. Conclusions

The present work provides an analysis of the impact of AN explosions and massive fires on air quality. It also shows that the routine monitoring of atmospheric characteristics with satellite images and meteorological data is an important public service and essential for understanding the role of chemical accidents in affecting the atmospheric quality.
A damaging AN blast occurred on 4 August 2020 in Beirut, Lebanon. Many research articles and news reports reported [16,17,21] the generation of the toxic NO2 gas in the blast which could have been a major risk to Beirut residents. While the massive Beirut explosion has damaged buildings, possibly increased particulate matter loadings in the atmosphere, this study found that its effect on loading NO2 in the atmosphere was limited to few days and few kilometers along the Lebanon coast. This spatio-temporal limitation of the NO2 propagation over Lebanese cities has been confirmed by TROPOMI data used in this work. The TROPOMI data (a few days before the blast over Beirut show an enhancement in NO2 concentrations more than about 2.5 times higher than the average values observed during the blast. This indicates that vehicles, ships, and war zones can significantly increase NO2 background concentrations in the atmosphere, and in many cases, it can even suppress emissions from large explosions like the Beirut blast.
The possible effect of vehicle and ship traffic is verified using the satellite-derived Level 2 NO2 concentration analysis from the TROPOMI instrument onboard the Sentinel-5P satellite over GCA, and Nicosia from 28 July to 8 August 2020. The effect of high population and heavy vehicle and/or ship traffic in enhancing NO2 background concentrations in the atmosphere is clearly observed in the data. This can also be confirmed by observing the relatively low NO2 concentration over Cairo during weekends (Fridays in Egypt). Another indication of the effect of vehicles is the low NO2 concentration observed over Nicosia because of its low population density compared to Beirut and Cairo.
The results of this work show that it is very difficult to conclude that the NO2 emissions observed after August 4 are because of the blast only and not just because of the vehicles on Beirut roads, ship traffic in the Beirut seaport, and the war in Syria as the NO2 plumes are tracked only along the Lebanese coast from 5 to7 August in four locations within about 20–25km from the blast area. The study also found that the Beirut blast has only a limited effect on NO2 loading in the inland regions of Lebanon.
Ground-based NO2 detection networks could help determine the significance of the NO2 loading during and after the blast; however, ground-based data are unavailable for Beirut city. More attention, however, needs to be paid to other emission sources in large and highly populated areas. Decision-makers need to understand how out-of-ordinary human activities (wars) could lead to significant changes in NO2 loadings in the atmosphere.

Author Contributions

Conceptualization, A.F. and N.E.-K.; methodology, A.F.; validation, A.F. and N.E.-K.; formal analysis, A.F. and data curation, A.F. and F.J.; writing—original draft preparation, A.F. and N.E.-K.; review and editing, R.P.S., F.J. and N.E.-K.; project administration, A.F. and N.E.-K.; funding acquisition, A.F. and N.E.-K. All authors have read and agreed to the published version of the manuscript.

Funding

The author (A.F.) would like to acknowledge the support provided by the Deanship of Scientific Research (DSR) at the King Fahd University of Petroleum and Minerals (KFUPM) for funding this work through project No. INRE2205. The Author (N.K) is partly supported by the Khalifa University Space and Planetary Science Center grant (8474000336-KU-SPSC). (N.E.K) would also like to acknowledge the support provided by the Aspire Award for Research Excellence (AARE), Award No. 000-329-00001.

Data Availability Statement

Data available in a publicly accessible repository that does not issue DOIs. Publicly available datasets were analyzed in this study. These data can be found here: https://disc.gsfc.nasa.gov/datasets/COPERNICUS/S5P/OFFL/L3_NO2 (accessed on: 4 May 2022).

Acknowledgments

Author A.F. is thankful for the support of the Centre of Research Excellence in Renewable Energy (CORERE), KFUPM. The authors would like to thank the anonymous reviewers for their comments/suggestions that have helped us improve the manuscript’s current version. Authors A.F. and N.E.K would like to thank Maher A. Dayeh, Southwest Research Institute (SwRI) for the useful discussion.

Conflicts of Interest

The author declares no conflict of interest.

References

  1. Ammonium Nitrate|Formula, Uses, & Facts|Britannica. Available online: https://www.britannica.com/science/ammonium-nitrate (accessed on 6 December 2022).
  2. NFPA. Available online: https://www.nfpa.org/ (accessed on 23 November 2022).
  3. The Deadly History of Ammonium Nitrate, the Explosive Linked to the Beirut Blast. Available online: https://www.nationalgeographic.com/science/article/deadly-history-ammonium-nitrate-explosive-linked-to-beirut-blast (accessed on 16 May 2022).
  4. Guglielmi, G. Why Beirut’s Ammonium Nitrate Blast Was so Devastating. Nature, 2020; online ahead of print. [Google Scholar] [CrossRef]
  5. Boeck, L.R.; Mahan, P.W. Loss Prevention Learnings from Beirut and Similar Ammonium Nitrate Explosions. Process Saf. Prog. 2022, 41, 276–282. [Google Scholar] [CrossRef]
  6. Prugh, R.W. Historical Record of Ammonium Nitrate Disasters. Process Saf. Prog. 2020, 39, e12210. [Google Scholar] [CrossRef]
  7. Dechy, N.; Bourdeaux, T.; Ayrault, N.; Kordek, M.-A.; Le Coze, J.-C. First Lessons of the Toulouse Ammonium Nitrate Disaster, 21st September 2001, AZF Plant, France. J. Hazard. Mater. 2004, 111, 131–138. [Google Scholar] [CrossRef] [PubMed]
  8. Laboureur, D.M.; Han, Z.; Harding, B.Z.; Pineda, A.; Pittman, W.C.; Rosas, C.; Jiang, J.; Mannan, M.S. Case Study and Lessons Learned from the Ammonium Nitrate Explosion at the West Fertilizer Facility. J. Hazard. Mater. 2016, 308, 164–172. [Google Scholar] [CrossRef]
  9. Willey, R.J. West Fertilizer Company Fire and Explosion: A Summary of the U.S. Chemical Safety and Hazard Investigation Board Report. J. Loss Prev. Process Ind. 2017, 49, 132–138. [Google Scholar] [CrossRef]
  10. Zhao, B. Facts and Lessons Related to the Explosion Accident in Tianjin Port, China. Nat. Hazards 2016, 84, 707–713. [Google Scholar] [CrossRef]
  11. Aouad, C.J.; Chemissany, W.; Mazzali, P.; Temsah, Y.; Jahami, A. Beirut Explosion: TNT Equivalence from the Fireball Evolution in the First 170 Milliseconds. Shock Waves 2021, 31, 813–827. [Google Scholar] [CrossRef]
  12. Valsamos, G.; Larcher, M.; Casadei, F. Beirut Explosion 2020: A Case Study for a Large-Scale Urban Blast Simulation. Saf. Sci. 2021, 137, 105190. [Google Scholar] [CrossRef]
  13. Stennett, C.; Gaulter, S.; Akhavan, J. An Estimate of the TNT-Equivalent Net Explosive Quantity (NEQ) of the Beirut Port Explosion Using Publicly-Available Tools and Data. Propellants Explos. Pyrotech. 2020, 45, 1675–1679. [Google Scholar] [CrossRef]
  14. Rigby, S.E.; Lodge, T.J.; Alotaibi, S.; Barr, A.D.; Clarke, S.D.; Langdon, G.S.; Tyas, A. Preliminary Yield Estimation of the 2020 Beirut Explosion Using Video Footage from Social Media. Shock Waves 2020, 30, 671–675. [Google Scholar] [CrossRef]
  15. Ali, T.; Abouleish, M.; Gawai, R.; Hamdan, N.; Elaksher, A. Ammonium Nitrate Explosion at the Main Port in Beirut (Lebanon) and Air Pollution: An Analysis of the Spatiotemporal Distribution of Nitrogen Dioxide. Euro-Mediterr. J. Environ. Integr. 2022, 7, 21–27. [Google Scholar] [CrossRef] [PubMed]
  16. Al-Hajj, S.; Dhaini, H.R.; Mondello, S.; Kaafarani, H.; Kobeissy, F.; DePalma, R.G. Beirut Ammonium Nitrate Blast: Analysis, Review, and Recommendations. Front. Public Health 2021, 9, 657996. [Google Scholar] [CrossRef] [PubMed]
  17. Nitrogen Oxides|Medical Management Guidelines|Toxic Substance Portal|ATSDR. Available online: https://wwwn.cdc.gov/TSP/MMG/MMGDetails.aspx?mmgid=394&toxid=69 (accessed on 20 November 2022).
  18. EPA. Basic Information about NO2. Available online: https://www.epa.gov/no2-pollution/basic-information-about-no2 (accessed on 23 November 2022).
  19. EPA. What Is Acid Rain? Available online: https://www.epa.gov/acidrain/what-acid-rain (accessed on 23 November 2022).
  20. ur Rehman, S.; Ahmed, R.; Ma, K.; Xu, S.; Aslam, M.A.; Bi, H.; Liu, J.; Wang, J. Ammonium Nitrate Is a Risk for Environment: A Case Study of Beirut (Lebanon) Chemical Explosion and the Effects on Environment. Ecotoxicol. Environ. Saf. 2021, 210, 111834. [Google Scholar] [CrossRef] [PubMed]
  21. Fares, M.Y.; Musharrafieh, U.; Bizri, A.R. The Impact of the Beirut Blast on the COVID-19 Situation in Lebanon. Z Gesundh Wiss 2021, 1–7. [Google Scholar] [CrossRef] [PubMed]
  22. Google Earth Engine. Available online: https://earthengine.google.com (accessed on 23 November 2022).
  23. Reductions in Nitrogen Oxides over Europe Driven by Environmental Policy and Economic Recession|Scientific Reports. Available online: https://www.nature.com/articles/srep00265 (accessed on 20 November 2022).
  24. de Foy, B.; Lu, Z.; Streets, D.G. Satellite NO2 Retrievals Suggest China Has Exceeded Its NOx Reduction Goals from the Twelfth Five-Year Plan. Sci. Rep. 2016, 6, 35912. [Google Scholar] [CrossRef] [Green Version]
  25. Hilboll, A.; Richter, A.; Burrows, J.P. Long-Term Changes of Tropospheric NO2 over Megacities Derived from Multiple Satellite Instruments. Atmos. Chem. Phys. 2013, 13, 4145–4169. [Google Scholar] [CrossRef] [Green Version]
  26. Cairo Climate, Weather By Month, Average Temperature (Egypt)-Weather Spark. Available online: https://weatherspark.com/y/96939/Average-Weather-in-Cairo-Egypt-Year-Round (accessed on 23 November 2022).
  27. Suez Climate, Weather By Month, Average Temperature (Egypt)-Weather Spark. Available online: https://weatherspark.com/y/97264/Average-Weather-in-Suez-Egypt-Year-Round (accessed on 23 November 2022).
  28. Nicosia Climate, Weather By Month, Average Temperature (Cyprus)-Weather Spark. Available online: https://weatherspark.com/y/97684/Average-Weather-in-Nicosia-Cyprus-Year-Round (accessed on 23 November 2022).
  29. Weather in August 2020 in Beirut, Lebanon. Available online: https://www.timeanddate.com/weather/lebanon/beirut/historic?month=8&year=2020 (accessed on 16 May 2022).
  30. Weather in August 2020 in Ehden, Lebanon. Available online: https://www.timeanddate.com/weather/@273725/historic?month=8&year=2020 (accessed on 29 November 2022).
  31. Weather in August 2020 in Tripoli, Lebanon. Available online: https://www.timeanddate.com/weather/lebanon/tripoli/historic?month=8&year=2020 (accessed on 29 November 2022).
  32. Weather in August 2020 in Baalbek, Lebanon. Available online: https://www.timeanddate.com/weather/@277130/historic?month=8&year=2020 (accessed on 29 November 2022).
  33. Weather in August 2020 in Cairo, Egypt. Available online: https://www.timeanddate.com/weather/egypt/cairo/historic?month=8&year=2020 (accessed on 23 November 2022).
  34. Weather in August 2020 in Suez, Egypt. Available online: https://www.timeanddate.com/weather/egypt/suez/historic?month=8&year=2020 (accessed on 23 November 2022).
  35. Weather in August 2020 in Nicosia, Cyprus. Available online: https://www.timeanddate.com/weather/cyprus/nicosia/historic?month=8&year=2020 (accessed on 23 November 2022).
  36. Veefkind, J.P.; Aben, I.; McMullan, K.; Förster, H.; de Vries, J.; Otter, G.; Claas, J.; Eskes, H.J.; de Haan, J.F.; Kleipool, Q.; et al. TROPOMI on the ESA Sentinel-5 Precursor: A GMES Mission for Global Observations of the Atmospheric Composition for Climate, Air Quality and Ozone Layer Applications. Remote Sens. Environ. 2012, 120, 70–83. [Google Scholar] [CrossRef]
  37. Ingmann, P.; Veihelmann, B.; Langen, J.; Lamarre, D.; Stark, H.; Courrèges-Lacoste, G.B. Requirements for the GMES Atmosphere Service and ESA’s Implementation Concept: Sentinels-4/-5 and -5p. Remote Sens. Environ. 2012, 120, 58–69. [Google Scholar] [CrossRef]
  38. Kleipool, Q.; Ludewig, A.; Babić, L.; Bartstra, R.; Braak, R.; Dierssen, W.; Dewitte, P.-J.; Kenter, P.; Landzaat, R.; Leloux, J.; et al. Pre-Launch Calibration Results of the TROPOMI Payload on-Board the Sentinel-5 Precursor Satellite. Atmos. Meas. Tech. 2018, 11, 6439–6479. [Google Scholar] [CrossRef]
  39. Ludewig, A.; Kleipool, Q.; Bartstra, R.; Landzaat, R.; Leloux, J.; Loots, E.; Meijering, P.; van der Plas, E.; Rozemeijer, N.; Vonk, F.; et al. In-Flight Calibration Results of the TROPOMI Payload on Board the Sentinel-5 Precursor Satellite. Atmos. Meas. Tech. 2020, 13, 3561–3580. [Google Scholar] [CrossRef]
  40. Kimbrough, S.; Chris Owen, R.; Snyder, M.; Richmond-Bryant, J. NO to NO2 Conversion Rate Analysis and Implications for Dispersion Model Chemistry Methods Using Las Vegas, Nevada near-Road Field Measurements. Atmos. Environ. 2017, 165, 23–34. [Google Scholar] [CrossRef] [PubMed]
  41. Lamsal, L.N.; Duncan, B.N.; Yoshida, Y.; Krotkov, N.A.; Pickering, K.E.; Streets, D.G.; Lu, Z.U.S. NO2 Trends (2005–2013): EPA Air Quality System (AQS) Data versus Improved Observations from the Ozone Monitoring Instrument (OMI). Atmos. Environ. 2015, 110, 130–143. [Google Scholar] [CrossRef]
  42. The Carter Center: Waging Peace. Fighting Disease. Building Hope. Available online: https://www.cartercenter.org/ (accessed on 23 November 2022).
  43. Wheida, A.; Nasser, A.; El Nazer, M.; Borbon, A.; Abo El Ata, G.A.; Abdel Wahab, M.; Alfaro, S.C. Tackling the Mortality from Long-Term Exposure to Outdoor Air Pollution in Megacities: Lessons from the Greater Cairo Case Study. Environ. Res. 2018, 160, 223–231. [Google Scholar] [CrossRef] [PubMed]
  44. Beckwith, M.; Bates, E.; Gillah, A.; Carslaw, N. NO2 Hotspots: Are We Measuring in the Right Places? Atmos. Environ. X 2019, 2, 100025. [Google Scholar] [CrossRef]
  45. Chaney, A.M.; Cryer, D.J.; Nicholl, E.J.; Seakins, P.W. NO and NO2 Interconversion Downwind of Two Different Line Sources in Suburban Environments. Atmos. Environ. 2011, 45, 5863–5871. [Google Scholar] [CrossRef]
  46. OMI NO2 Weekly Average Images for Cairo Egypt. Available online: https://so2.gsfc.nasa.gov/no2/pix/htmls/Cairo_data.html (accessed on 23 November 2022).
  47. 2022 World Population by Country. Available online: https://worldpopulationreview.com/ (accessed on 20 November 2022).
  48. Beirut 2020 Past Weather (Lebanon)-Weather Spark. Available online: https://weatherspark.com/h/y/99217/2020/Historical-Weather-during-2020-in-Beirut-Lebanon (accessed on 20 November 2022).
Figure 1. Beirut blast (a) photo shows the red and orange plumes generated by the explosion on 4 August 2020 (b) aerial view showing the damage on 5 August 2020.
Remotesensing 14 06377 g001
Figure 2. Map of the study area showing (a) Beirut, Lebanon; Cairo, Egypt; and Nicosia, Cyprus, (b) Beirut along with 3 coastal cities (Jounieh, Batron, and Tripoli) and 3 inland cities (Ehden, Baalbek, and Ain El Bnaiyyeh in Lebanon.
Remotesensing 14 06377 g002
Figure 3. NO2 concentrations over Beirut, Lebanon 28 July–11 August 2020. The 4 August 2020 Beirut blast occurred around 18:00 Beirut local time. NO2 plumes from 5 to 8 August are indicated by the yellow ovals.
Remotesensing 14 06377 g003
Figure 4. NO2 concentrations over Beirut, Lebanon from January to December 2020. The Beirut blast occurred on 4 August 2020.
Remotesensing 14 06377 g004
Figure 5. Number of vessels in Beirut Seaport from January to December 2020 (source: port of Beirut: Port of Beirut http://www.portdebeyrouth.com (accessed on: 17 November 2022).
Remotesensing 14 06377 g005
Figure 6. NO2 concentrations over Cairo and the Gulf of Suez Egypt 28 July–11 August 2020.
Remotesensing 14 06377 g006
Figure 7. NO2 concentrations over Nicosia, Cyprus 28 July–5 August 2020.
Remotesensing 14 06377 g007
Figure 8. Comparison of NO2 concentration over Beirut, Cairo, and Nicosia from 28 July to 11 August 2020.
Remotesensing 14 06377 g008
Figure 9. (a) NO2 concentration levels × 10−4 mol/m2 from 3 to8 August 2020 in the eight locations. Coastal locations (Beirut, Jounieh, Batron, and Tripoli) are represented by bars and inland locations (Ehden, Baalbek, and Ain El Bnaiyyeh) are represented by lines (b) Wind Rose of the wind speed and direction over Beirut from 4 to 8 August 2020.
Remotesensing 14 06377 g009
Figure 10. Wind direction on (a) 4 (b) 5 (c) 6, and (d) 7 August 2020. Measured wind direction is measured at about 10 m above sea level. Civil twilight and night are indicated by shaded overlays. [48].
Remotesensing 14 06377 g010
Table 1. Longitude and latitude of 3 coastal cities (Jounieh, Batron, and Tripoli) and 3 inland cities (Ehden, Baalbek, and Air El Bnaiyyeh in Lebanaon.
LocationCityLon,°ELat.
°N
CoastalJounieh35.6333.98
Batorn35.6634.24
Tripoli35.8334.43
InlandEhden35.9734.28
Baalbek36.2134.00
Ain El Bnaiyyeh36.2233.91
Table 2. Weather conditions in Beirut, Jounieh, Tripoli, Ehden, Baalbek, Cairo, Suez, and Nicosia during the study period are displayed in Table 2. Weather information is not available for Batorn and Ain El Bnaiyyeh in Lebanaon.
CountryCityT °CRH %WDWS km/hCloudsPrecipitation
LebanonBeirut2973SW18–24ScatteredNo
Jounieh2466SW18–24PassingNo
Batron2473SW18–24PassingNo
Tripoli2466SW18–24PassingNo
Ehden2466SW18–24PassingNo
Baalbek2466SW18–24PassingNo
Ain El Bnaiyyeh2465SW17–24PassingNo
EgyptCairo3456N9–17ClearNo
Suez3151N11ClearNo
CyprusNicosia3544N6–11PassingNo
Table 3. Sentinel−5P acquisition times over Beirut (28 July–8 August 2020).
DateSentinel−5P Acquisition Times
July
2020
UTC
Time
(HH:MM:SS)
Lebanon
Time
(HH:MM:SS)
Time with Respect to the Explosion
(HH:MM:SS)
Acquisition Duration
(HH:MM:SS)
2810:05:4013:05:40about 7 days before00:52:36
2910:35:2813:35:28about 6 days before02:31:42
3010:16:2113:16:21about 5 days before00:49:19
3110:50:4013:50:40about 4 days before00:53:25
August
2020
110:30:4013:30:40about 3 days before00:52:31
210:13:2513:13:25about 2 days before00:54:23
310:41:2513:41:2524:19:07 before02:33:29
410:22:1813:22:1804:37:42 before00:51:07
510:03:1213:03:1219:03:12 after00:50:13
610:38:1113:38:1143:38:11 after00:54:06
710:18:1113:18:1167:18:11 after00:53:13
810:47:2113:47:21about 4 days after00:50:50
Publisher’s Note: MDPI stays neutral with regard to jurisdictional claims in published maps and institutional affiliations.

