Article

Multispectral UAV-Based Monitoring of Leek Dry-Biomass and Nitrogen Uptake across Multiple Sites and Growing Seasons

1
KU Leuven Department of Biosystems, MeBioS Division, 3000 Leuven, Belgium
2
Flanders Research Institute for Agriculture, Fisheries and Food (ILVO), 9820 Merelbeke, Belgium
3
Flemish Institute for Technological Research (VITO), 2400 Mol, Belgium
4
Inagro, 8800 Roeselare, Belgium
5
Research Station for Vegetable Production Sint-Katelijne Waver (PSKW), 2860 Sint-Katelijne-Waver, Belgium
6
Research Station for Vegetable Production (PCG), 9770 Kruishoutem, Belgium
*
Author to whom correspondence should be addressed.
Remote Sens. 2022, 14(24), 6211; https://doi.org/10.3390/rs14246211
Submission received: 15 October 2022 / Revised: 25 November 2022 / Accepted: 6 December 2022 / Published: 8 December 2022
(This article belongs to the Special Issue Agricultural Applications Using Hyperspectral Data)

Abstract

:
Leek farmers tend to apply too much nitrogen fertilizer as its cost is relatively low compared to the gross value of leek. Recently, several studies have shown that proximal sensing technologies could accurately monitor the crop nitrogen content and biomass. However, their implementation is impeded by practical limitations and the limited area they can cover. UAV-based monitoring might alleviate these issues. Studies on UAV-based vegetable crop monitoring are still limited. Because of the economic importance and environmental impact of leeks in Flanders, this study aimed to investigate the ability of UAV-based multispectral imaging to accurately monitor leek nitrogen uptake and dry biomass across multiple fields and seasons. Different modelling approaches were tested using twelve spectral VIs and the interquartile range of each of these VIs within the experimental plots as predictors. In a leave-one-flight out cross-validation (LOF-CV), leek dry biomass (DBM) was most accurately predicted using a lasso regression model (RMSEct = 6.60 g plant−1, R2= 0.90). Leek N-uptake was predicted most accurately by a simple linear regression model based on the red wide dynamic range (RWDRVI) (RMSEct = 0.22 gN plant−1, R2 = 0.85). The results showed that randomized Kfold-CV is an undesirable approach. It resulted in more consistent and lower RMSE values during model training and selection, but worse performance on new data. This would be due to information leakage of flight-specific conditions in the validation data split. However, the model predictions were less accurate for data acquired in a different growing season (DBM: RMSEP = 8.50 g plant−1, R2 = 0.77; N-uptake: RMSEP = 0.27 gN plant−1, R2 = 0.68). Recalibration might solve this issue, but additional research is required to cope with this effect during image acquisition and processing. Further improvement of the model robustness could be obtained through the inclusion of phenological parameters such as crop height.

Graphical Abstract

1. Introduction

It is projected that the current global nitrogen use efficiency (NUE) should rise from 52% to 75% in Europe to meet global future food demands while reducing the input of nitrogen fertilizers [1]. In this context, a great effort should be made for fruit and vegetable cultivation as their NUE should increase from 14% to 40%. To achieve this, fertilizer inputs should be halved. There are multiple reasons for the low NUE of vegetables: (i) they often have a shallow rooting system, while (ii) having a high nitrogen demand, and (iii) mineral fertilizers are cheap compared to the high gross value of vegetables [2]. Therefore, farmers tend to apply too high fertilizer doses to their vegetable crops to avoid yield losses. This study focuses on leeks, which represented about 22.1% of the total gross value of field vegetables in Flanders, Belgium from 2010 until 2020 [3]. Additionally, Belgium was among the five top leek-producing countries between 2014 and 2019 [4]. Multiple strategies and tools exist to assist farmers in improving their nitrogen management, such as soil-based systems, simulation models, and crop monitoring [2,5,6]. Recently, there have been several studies on using different proximal sensing technologies to monitor vegetable crops and assist fertilization management [5,7]. Several researchers reported useful relations between measurements with a handheld chlorophyll meter and the leaf nitrogen content of tomatoes [8], sweet peppers [9] and cucumbers [10]. However, as the sampling surface is small, multiple repetitions in combination with a strict sampling protocol are required to acquire representative data [7]. This might impede its practical use for precision nitrogen management in farmers’ fields. Proximal canopy reflectance sensors (e.g., multi- and hyperspectral cameras) have a larger measurement surface and can be mounted on a vehicle for continuous measurement. These sensors allow for both the estimation of the crop nitrogen content [8,11] and biomass [12,13,14]. However, according to Tsouros et al. [15], unmanned-aerial vehicle (UAV) monitoring is even more efficient than ground systems as UAVs can cover larger areas and still acquire high-resolution images. Until today, the number of studies on UAV-based vegetable monitoring is still limited [16,17,18,19,20] compared to crop monitoring and phenotyping in arable crops [21,22].
Several researchers have found a good relationship between UAV-derived morphological parameters such as plant height [18,19] or canopy volume [17] and crop biomass. Wittstruck et al. [16] have used UAV imagery to count the number of pumpkins within a field. Moreover, the combination of both image-derived morphological parameters and spectral reflectance indices allowed to successfully monitor the biomass of tomatoes [20,23] as well as eggplant and cabbage [20]
However, while many of these studies investigated different crops, they only covered a small fraction of all the different vegetables. Therefore, this study’s objective was to expand the research on UAV-based vegetable monitoring by examining the potential of high-resolution multispectral UAV images as a tool for robust estimation of the variation in leek biomass and nitrogen uptake within a field throughout the growing season. To this end, leek development was monitored across multiple fields over two consecutive growing seasons.

2. Materials and Methods

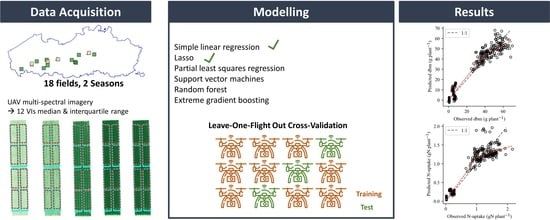
2.1. Data Acquisition

2.1.1. Site Description and Agricultural Management

In both 2019 and 2020, multiple fields across Flanders, Belgium, were planted with leeks (Allium porrum) (Figure 1). In 2019, the experiments were spread across four fields at agricultural research stations (ILVO, Inagro, PSKW, and PCG). The leeks were planted between 19 June and 28 June and harvested between 4 December 2019, and 10 February 2020. All fields were planted with the Pluston variety (Nunhems Netherlands BV, Nunhems, The Netherlands). In addition to the research centres, leek cultivation at ten fields from ten different farmers were also included in the experiments in 2020. The leeks were planted between 29 May and 31 July 2020 and harvested between 12 October 2020 and 24 April 2021, depending on the location. The farmers cultivated several varieties, sometimes even two within one field (Table 1). At the research stations, only the Pluston variety was planted. At the research stations, different fertilization strategies were applied, which were determined as variants of the strategies proposed by the updated KNS advisory system for Flemish soils [24,25]. In 2019, mineral fertilizers were applied at planting and 7 to 9 weeks after planting in the form of calcium ammonia nitrate (CAN). The total amount of applied fertilizers at the research stations varied from 0 kg N/ha to 247 kg N/ha in 2019. In 2020, the total amount of mineral fertilizers varied from 0 kg N/ha to 157 kg N/ha. The farmers applied their standard management homogeneously throughout the field. The applied fertilizers consisted of initial fertilization with organic fertilizer or manure and a side-dress with mineral fertilizers. Some farmers planted multiple varieties in their fields (Table 1). All fields were grown under rain-fed conditions. Only at the research station of PSKW irrigation was applied.

2.1.2. Plant Samples

In each field, one or multiple trial plots were laid out from which leeks were harvested at different sampling moments throughout the growing season. At each sampling moment, 12 leeks (or at least 2 kg) were sampled from each plot within a field. First, the harvested plants were cleaned to remove any soil. Next, the plants were cut into 2 cm pieces and mixed to ensure representative fractions of all plant parts in the 250 g sub-sample. Finally, the sub-sample was dried in an oven at 60 °C for at least 72 h. The dried mass was used to calculate the dry matter content (DM%) of the leeks. This was subsequently multiplied by the sampled plant’s average weight to determine the dry biomass (DBM) (g plant−1). The total nitrogen content was determined from the plant samples using the Dumas combustion method, expressed as gN kg−1 fresh weight [26]. The leek nitrogen uptake was then determined by multiplying this number by the average fresh weight of the harvest.
Table 1 summarizes the year, location, planted varieties, the number of experimental plots within the field, the total number of plant samples for both DBM and crop nitrogen uptake, and the number of UAV flights for these samples.

2.1.3. UAV Monitoring

At each plant sampling moment, a UAV flight was performed with a DJI M600 or a DJI M200 drone (DJI, SZ DJI Technology Co., Shenzhen, China), as indicated in Table 1. The plant samples were acquired right before the second fertilization dose was applied and during harvest. At the research centres two additional plant samples were acquired, between the second fertilizer application and the legal deadline to apply fertilizers in Flanders (i.e., 31 October). At the farmers field, only one sample was collected in this period. Both UAVs were equipped with a multispectral sensor (Micasense Rededge MX, Micasense, Seattle, WA, USA). In 2019, flights were carried out at an altitude of 20 m, which resulted in a ground sampling distance (GSD) of 11 ± 4 mm (standard deviation on the GSD resulting from variation in the actual flying height). In 2020, the altitude was increased to 40 m to be able to cover the farmer’s fields completely, resulting in a GSD of 27 ± 2 mm. The side and forward overlap were set to 80%. The flights were executed around solar noon, i.e., between 11 am and 3 pm. Five ground control points (GCP) were placed within each field to optimize the georeferencing of the ortho-mosaics. GCP locations were determined with an RTK-GNSS (S10 GNSS Receiver, Stonex, Italy; SL600, Satlab, Sweden) and using the Flemish Positioning Service (FLEPOS).

2.2. Image Processing and Feature Extraction

Image stitching and radiometric calibration were carried out by an automated processing pipeline developed by the Flemish Institute for Technological Research (VITO, Mol, Belgium) (https://mapeo.vito.be/en accessed on: 7 September 2021). These processes resulted in an ortho-mosaic with five spectral bands (blue: 475 nm, green: 560 nm, red: 668 nm, rededge: 717 nm, and near-infrared (NIR): 842 nm). The GSD was not consistent across all flights due to different flight altitude settings and small variations between the actual flight and the set altitude. Therefore, all ortho-mosaics were resampled to the largest GSD of all flights (31.2 mm), using the average resampling implemented in Rasterio (v1.1.3) [27]. From the five resulting spectral reflectance bands, twelve vegetation indices (VIs) were calculated: the normalized difference vegetation index (NDVI), normalized difference rededge index (NDRE), green NDVI (GNDVI), blue NDVI, red wide-dynamic range vegetation index (RWDRVI), blue WDRVI (BWDRVI), Meris terrestrial chlorophyll index (MTCI), modified chlorophyll absorption in reflectance index (MCARI), canopy chlorophyll content index (CCCI), chlorophyll index green (CI-green), chlorophyll index rededge (CI-rededge) and soil adjusted vegetation index (SAVI) (Table 2). These indices were first calculated at pixel level and subsequently aggregated by calculating the median and interquartile range (iqr) from all pixels within an experimental plot, as the extraction of plant pixels did not improve the model accuracy [28].

2.3. Statistical Analysis

2.3.1. Modelling Approaches

In this study, both the ability of linear and non-linear regression models was tested to predict the crop DBM (g plant−1) and nitrogen uptake (gN plant−1). In total, six different modelling approaches were studied because they possess various mathematical properties. The linear models consisted of simple linear regression (SLR), lasso regression (lasso) and partial least squares regression (PLSR). Support vector regression (SVR), random forest regression (RFR) and gradient boosting with a tree-based model as a base estimator (xGBR) were studied as non-linear models. The SLR models contained only one predictor variable. The other models were more complex as they included the median and iqr of all VIs. A lasso regression model automatically selects predictor variables [39] while a PLSR model reduces the dimensionality by projecting the predictors onto a lower-dimensional space where the latent variables are orthogonal [40]. An SVR model determines a hyperplane (i.e., support vectors) that captures the relationship between the predictor variables and target variable [41]. When the Euclidean distance of a data point to a support vector is below a threshold (ε), the data point is not considered in calculating the model performance index. Finally, random forest regression (RFR) and extreme gradient boosting regression (xGBR) are both ensemble regression methods that predict the target values based on a stack of multiple regression trees [42,43]. RFR uses numerous trees fitted on bootstrapped datasets and finally aggregates the predictions of all trees to predict the response value of a new observation. In an xGBR model, the first decision tree is fitted on the complete dataset, and the following trees are built on a dataset using the residual of the previous tree as the response. The SLR, Lasso, PLSR, SVR and RFR models were fitted using python’s Scikit-Learn (v.0.22.1) package [44], while the xGBR models were estimated with the XGBoost (v.1.2.0) package [42].

2.3.2. Model Training and Hyperparameter Optimization

The workflow to estimate, select and validate the models is illustrated in Figure 2. The models were trained using the data that was acquired during the field trials in 2019. Cross-validation (CV) was used to quantify the ability of the model to predict crop DBM and nitrogen uptake throughout the leek development. As the observations acquired at each sampling moment and location are not independent due to similar soil, weather conditions and MS-sensor calibration during each flight, random CV-splits might lead to over-fitting models, poor generalization, and thus poor model selection [45,46]. To obtain a reliable estimate of the prediction performance for a new flight, a leave-one-flight out cross-validation (LOF-CV) scheme was used. In each iteration, the data was split such that all data from one flight were set aside to validate the model, while the data from the other flights were used to train the model. The parameters of the SLR were estimated through ordinary least squares. The other methods require specification of one or multiple hyperparameters. These hyperparameters were optimized through the minimization of the root mean squared error cross-validation (RMSEcv) (Equation (2)) on the training data. So, the data of the remaining n−1 flights to train the model were iteratively split in a training set of n−2 flights and a validation set containing all data from the remaining flight. For the PLSR model, the number of latent variables was selected as the number with the lowest RMSEcv. For the lasso model, the regularization parameter was optimized. Before the estimation of the Lasso or PLSR model, the predictor variables were scaled to zero mean and unit standard deviation. For the SVR model, only the RBF kernel was considered. The kernel scaling factor (gamma), ε and L2-regularization parameters were optimized. For the RFR model, the number of regression trees, the minimal number of observations at each leaf, the maximal number of predictors used and the maximal depth of each tree were optimized. For the xGBR model, the following hyperparameters were tuned: the number of regression trees that were used, the maximal tree depth, the minimum reduction in the loss function value, learning rate, L2 regularization weight and the number of predictors used to build the trees. The hyperparameters for the SVR, RFR and xGBR models were optimized through Bayesian optimization using the scikit-optimize package (v0.8.1).
Next, the models with the selected hyperparameters were trained on the n−1 flights of the training set. To evaluate the model performance the RMSE on the training data was calculated for each model, and the model was applied to the test data to predict the response values. After all iterations, the average RMSE for the training data (Equation (1)) was calculated as well as the cross-testing RMSE (RMSEct, Equation (2)).

2.3.3. Model Selection and Validation

The goal of this research was to find the modelling approach that provides the most accurate prediction of DBM or crop nitrogen uptake during the growing season. Therefore, the best performing model was selected based on the smallest R M S E c t (Equation (2)). Furthermore, model performance was also quantified in terms of the bias (Equation (5)) and R2 of the linear regression model between the observed and predicted values. The R M S E c t was calculated as the average error across all LOF-CV iterations as the number of observations per flight varied from 8 to 24.
R M S E ¯ t r a i n = 1 n k = 1 n 1 n 1 i = 1 ; i k n j = 1 m i ( y i j y ^ i j ) 2 m i
R M S E ¯ c v = 1 n 1 k = 1 n 1 1 n 2 i = 1 ; i k n 1 j = 1 m i ( y i j y ^ i j ) 2 m i
R M S E c t = 1 i = 1 n m i i = 1 n j = 1 m i ( y i j y ^ i j ) 2
r R M S E = R M S E σ o b s
B i a s = 1 i = 1 n m i i = 1 n j = 1 m i ( y i j y ^ i j )
with n the number of flights, mi the number of observations in flight i, and y ^ i j the jth observation and prediction of flight i, respectively, and σobs the standard deviation of the observations.
After the best performing model architecture was selected, this model was trained on the data from all flights executed in the first season (2019) and tested on the data of the flights executed in the second season (2020).

3. Results

3.1. UAV Flights and Plant Samples

It was planned to acquire the plant samples within as short as possible after a UAV flight. However, due to practical issues, this was not always possible. As longer delays were expected to negatively influence the relationship between image features and the destructive measurements, the flights for which the reference measurements were not made within 7 days were left out of the regression dataset. In total, 12 UAV flights (four from the 2019 experiment and eight from the 2020 experiment) could not be matched to any plant sample. The data for the remaining flights are summarized in Table 1. Figure 3 shows the evolution of the NDVI throughout the 2019 growing season at the field of PSKW. A clear increase in the NDVI values can be observed in the beginning of the season, while it saturates towards the end of the growing season.
In Figure 4, the DBM and nitrogen uptake measured with the reference methods are plotted as a function of the days after planting (DAP). It clearly shows that there was a fast increase in DBM and nitrogen uptake after planting until DAP 100, after which they remained quite constant. The final yield and nitrogen uptake in 2020 were lower compared to 2019. The acquired data in 2019 were mainly measured in the very early growth stage (DAP < 50) or after the leek reached a DBM level similar to the final yield. Thus, little information was acquired during the exponential growth phase. In 2020 plant samples and UAV multispectral images were also obtained during the exponential growth phase. The average measured DBM was 33.60 g plant−1 and 29.25 g plant−1 for the 2019 and 2020 experiments, respectively. The minimal and maximal measured DBM values were 0.71 and 70.15 in 2019, and 1.34 and 97.98 g plant−1 in 2020. The observed leek nitrogen uptake in 2019 ranged from 0.02 to 2.16 with a mean value of 0.94 gN plant−1 and in 2020, nitrogen uptake ranged from 0.04 to 1.62, with a mean value of 0.78 gN plant−1.

3.2. Regression Analysis and Model Selection

3.2.1. SLR Models

For both N-uptake and DBM, 24 SLR models were built (Figure 5). The DBM was most accurately predicted by the RWDRVI model with an RMSEct of 9.08 g plant−1 (Figure 5a). The median NDVI and BNDVI had only a slightly increased RMSEct, 9.37 and 9.96 g plant−1, respectively. The N-uptake was also most accurately predicted by the RWDRVI model with an RMSEct of 0.22 gN plant−1. The SLR models using the median NDVI, BNDVI, GNDVI and BWDRVI had a similar accuracy (Figure 5b). The RMSEct only varied from 0.23 to 0.25 gN plant−1. The N-uptake and DBM were both least accurately estimated using the iqr of the NDRE; the RMSEct was equal to 0.67 gN plant−1 and 25.26 g/plant, respectively. However, the relationship between the observed and predicted values in LOF-CV was significant (p < 0.001). Only the iqr of the MTCI index resulted in a non-significant linear model for both DBM (p = 0.05) and N-uptake (p = 0.08) estimation. More complex models were trained and compared to the best performing SLR model to evaluate whether the information contributed by multiple VIs could provide more accurate predictions.

3.2.2. Model Selection for DBM Prediction

All model types were used to quantify their ability to estimate the leek DBM (Table 3). The best performing SLR model was the least accurate of all models during training with an R M S E ¯ t r a i n of 8.11 g plant−1. The other models had smaller training errors that varied from 1.97 g plant−1 for the xGBR model to 5.26 g plant−1 for the PLSR model. However, the average RMSEcv of the internal cross-validation loop (Figure 2) for the SLR model was only 6.34 g plant−1, which was similar to the R M S E ¯ c v of the RFR and xGBR models, which had the lowest values of the multivariate models.
The Lasso had a small RMSEct value (6.60 g plant−1) and large R2 (0.9). Additionally, its RMSE values during training, cross-validation and cross-testing were relatively consistent. Although the RMSEct of the Lasso model was slightly larger than for the RFR model, the Lasso model was preferred, as the model is considerably less complex than the RFR model. Besides, the RMSEct value of the RFR model was almost two times larger than the R M S E ¯ t r a i n , which indicates the model was prone to overfitting. The results showed that the SVR and xGBR models had the same issue: a small R M S E ¯ t r a i n but considerably larger RMSEct values.

3.2.3. Model Selection for N-Uptake Prediction

Table 4 summarizes the model performance of all model types to estimate the leek N-uptake. The predictions of the SVR model were most accurate during model training, with an R M S E ¯ t r a i n equal to 0.08 gN plant−1. The SLR model performed the least accurately during model training, with an average training error of 0.21 gN plant−1. However, the SLR model was the second most accurate model in cross-validation and cross-testing with an RMSEcv and RMSEct of 0.20 and 0.22 gN plant−1, respectively. Additionally, the SLR model had consistent RMSE values during training, internal cross-validation, and cross-testing. The bias of the SLR model was also almost zero. Although the SVR model was the best performing model during training, the RMSEcv (0.30 gN plant−1) was much larger than the R M S E ¯ t r a i n (0.08 gN plant−1). The SVR model had also the largest bias compared to the other models.
Figure 6 illustrates the predictions during cross-testing for both leek DBM and N-uptake using the Lasso and SLR models, respectively. The lowess curves, which indicate the average prediction error, are rather small in the beginning of the growing season. However, at larger DBM and N-uptake values, both models tend to underestimate the observations. Despite a good overall relationship between predicted and observed DBM values, the relationship for the low DBM (rpearson = 0.44) and N-uptake (rpearson = 0.66) values was less clear.

3.3. Model Validation

For the prediction of the leek DBM and N-uptake, the Lasso model and SLR model were trained again on all the observations from 2019. The dominant parameters in the Lasso model were the median values of RWDRVI and MCARI, with both positive coefficients. The hyperparameter optimization resulted in a value of the regularization parameter of 0.06.
Next, these models were used to predict the DBM and N-uptake for the dataset of 2020. In the following sections, the model prediction accuracy for the Pluston variety will be analysed as well as the ability of the model to be transferred to other varieties.

3.3.1. Pluston Variety

For the predictions of the Pluston DBM a considerable increase in the RMSEP (8.50 g plant−1) was observed (+28.8%) compared to the RMSEct (Table 5). Additionally, the R2 decreased (0.77) and absolute bias (1.59 g plant−1) increased compared to cross-testing. DBM was less accurately predicted at the farmers’ fields compared to the research centres as the bias and RMSEP increased to 3.11 g plant−1 and 9.79 g plant−1, respectively. The prediction error was relatively small for low DBM values but increased for larger DBM values. As the maximal observed DBM in 2020 was smaller than in 2019, no clear underestimation of the DBM yield was observed (Figure 7a). Similar trends were observed for the validation of the SLR model to predict the Pluston N-uptake. The RMSEP increased 22.7% relative to the RMSEct to a value of 0.27 gN plant−1, while also the R2 (0.68) decreased and the absolute bias increased slightly to 0.03 gN plant−1. N-uptake in the beginning of the growing season was clearly underestimated at the research centres, while this was not the case for the farmer fields. The model predictions were less accurate for large N-uptake values (Figure 7b).

3.3.2. Model Transfer to Other Varieties

Different leek varieties differ in the leaf greenness, shaft length, and the intended season to be planted. Therefore, they could vary in both spectral and physiological properties. In this study, the generalization ability of the models trained on only the Pluston variety was evaluated using a limited number of observations acquired in 2020 at farmers’ field. The DBM of the Chiefton variety was most accurately predicted with an RMSEP of 6.19 g plant−1 (Table 6). The Harston DBM was the least accurately predicted with an RMSEP of 21.68 g plant−1. Low DBM values were largely overestimated while a very large DBM yield was observed, 97.98 g plant−1, which was clearly underestimated. The RWDRVI was able to predict the N-uptake of the Harston and Krypton varieties with similar accuracy compared to Pluston, the RMSEP was 0.26 gN plant−1 for both varieties, while the bias was, respectively −0.01 and 0.04 gN plant−1 (Table 6). The RMSEP of the Chiefton variety was 0.27 gN plant−1, which could be largely attributed to the large bias of 0.24 gN plant−1. The N-uptake of the Vitaton variety was least accurately predicted with an RMSEP of 0.44 gN plant−1 and a bias of 0.29 gN plant−1.

4. Discussion

4.1. Model Selection and Validation

The aim of this study was to find a robust modelling approach to estimate leek DBM and N-uptake throughout the growing season at multiple locations from multispectral data acquired with a UAV. The results showed that for both DBM and N-uptake the most robust predictions were achieved with a simple model with a limited number of predictors (Table 3 and Table 4). The LOF-CV clearly showed that more complex models like SVR, RFR and xGBR were prone to overfitting despite the hyperparameter tuning in leave-one-flight-out cross-validation to avoid this. This result was contrary to several other studies where RFR was reported to outperform linear regression models [18,20,47]. However, these studies used either Kfold-CV or validation plots within the same field as the calibration plots to quantify model performance. Using randomized Kfold-CV on the dataset used in this study, the RMSE values during training, cross-validation, and cross-testing were smaller and more consistent compared to the LOF-CV results (Table A1 and Table A2). The problem of overfitting would thus be less clear. Additionally, based on the Kfold-CV results the ability of multispectral UAV imagery to predict leek DBM and N-uptake for the 2020 experiments would be overestimated if RMSEct (Table A1 and Table A2) is compared to RMSEP (Table 5).
Based on these results it can be hypothesized that more complex models were able to capture some flight-specific effects which resulted in less accurate predictions in cross-testing [46]. To alleviate this problem, additional research is required into these effects, which probably originate from image acquisition or radiometric calibration. Field specific model adjustments might solve this issue but would impede application in precision farm management.
Kim et al. [19] achieved accurate biomass predictions after applying a bias and slope correction on the predicted values when their model was transferred to the next growing season. In our study, an increase in both bias and RMSEP was observed which could not be corrected by either a bias or slope correction. However, Kim et al. [19] used only phenological parameters such as crop height and vegetation fraction. Several other studies indicated that the combination of spectral VIs and plant morphological parameters such as canopy cover and plant height resulted in more accurate estimates of the crop biomass [20,28,48,49,50,51]. Crop height could not be reliably estimated for the UAV flights of 2020 and was therefore omitted in this study. The digital surface model (DSM) was georeferenced using 5 GCPs and a digital terrain model (DTM) was determined based on soil pixels selected from the DSM. It is hypothesized that the presence of only five GCPs in the fields was not sufficient for the covered area and therefore led to inaccurate image products. However, the need for placing a large number of GCPs in each field would be a serious drawback for practical implementation. This problem might be overcome by equipping UAVs with an RTK GNSS, as Štroner et al. [52] reported that this allows to obtain georeferencing errors smaller than one GSD without using GCPs.

4.2. Model Application

This study showed the potential of multispectral UAV imagery for leek growth monitoring as both leek DBM and N-uptake were predicted relatively accurate for the Pluston variety. However, there are still some challenges that should be tackled to improve the model robustness in the context of precision agriculture. Nitrogen fertilization of leeks is most often applied at planting and about eight weeks after planting. The results showed that the predictions in this early growth stage did not correlate well with the observed values compared to the overall fit. This might result in sub-optimal management decisions. In both the Lasso model for DBM prediction and the SLR model for N-uptake prediction, the median RWDRVI was an important VI. Although wide dynamic range VIs were developed to cope with the saturation effect of the NDVI, high DBM and N-uptake levels were still underestimated during cross-testing [33]. This was less pronounced during model validation. However, the maximal observed values of the 2020 experiments were smaller compared to the 2019 experiments. The consequences for in-season management decisions will be limited, but accurate predictions of yield and N-uptake are essential to evaluate management decisions. Nonetheless, some farmers also apply fertilizers after eight weeks in the growing season to fertilize in a more fractioned way.
In farmers’ fields, it is common to plant multiple varieties next to each other, so it would be helpful if only one model is needed to estimate DBM or N-uptake of different varieties. However, the validation predictions for the other leek varieties showed mixed results, some varieties had accurate predictions for either DBM or N-uptake while other predictions were considerably less accurate. However, due to the limited number of observations and variable plant densities, these results on the transferability to other varieties should be handled with care.

5. Conclusions

To achieve sustainable leek production, N-input should be reduced, however, relatively low fertilizer prices combined with high N-demand, a shallow rooting system and a long growing period make this a difficult task. UAV imagery has been identified as a tool with high potential to assist farmers in improving their N-management and allow site-specific fertilization as it overcomes some practical limitations of handheld, proximal imaging sensors. As few of these studies have focused on vegetable cultivation and none were found on leeks, this study aimed to expand the research on UAV-based vegetable monitoring by identifying the most robust modelling approaches to monitor leek DBM and N-uptake using leave-one-flight-out cross-validation (LOF-CV). Simple linear models based on a limited number of spectral VIs achieved the best results. More complex models like SVR, RFR and xGBR were prone to overfitting as large differences between R M S E ¯ t r a i n , R M S E ¯ c v and RMSEct were observed. A Lasso model, using RWDRVI and MCARI resulting in an RMSEct of 6.60 g plant−1, a bias of 0.57 g plant−1 and an R2 of 0.90 was determined as the best model to predict leek DBM. An SLR using the RWDRVI resulted in an RMSEct of 0.22 gN plant−1, a biasct of 0.00 gN plant and an R2 of 0.85. The models still have some limitations as the model predictions were less accurate when used to predict DBM and N-uptake during the next growing season, as the RMSEP and bias increased while the R2 decreased. This study also showed that Kfold-CV could lead to over-optimistic results and the consequent selection of models with poor generalizability due to the inclusion of flight-specific effects such as the weather conditions, soil type, and sensor calibration in the validation data. Additional research into these effects is recommend to build models that are capable of predicting DBM and N-uptake accurately throughout different growing seasons and fields from multispectral UAV data. As long as this has not been resolved, field- and season-specific calibration will be required to improve model accuracy, which impedes the applicability of the technology.

Author Contributions

Conceptualization, J.H., W.S., P.L. and S.C.; methodology, J.H., P.L., T.D.C., J.V.B. and W.S.; software, J.H. and D.R.; formal analysis, J.H.; writing—original draft preparation, J.H.; writing—review and editing, J.H., W.S., S.C., P.L., T.D.C., J.V.B., E.A., D.R., O.B. and J.B.; visualization, J.H.; supervision, W.S., S.C., P.L., E.A., T.D.C., O.B., J.B. and J.V.B.; project administration, E.A. and T.D.C.; All authors have read and agreed to the published version of the manuscript.

Funding

This research has received funding from Flanders Innovation & Entrepreneurship (WikiLeeks project—VLAIO HBC.2017.0819).

Data Availability Statement

Data will be made available upon request.

Acknowledgments

The authors want to express their gratitude towards the certified pilots of ILVO: Thomas Vanderstocken and Aaron van Gehuchten; pilots from Inagro: Kris Demaeght and Pieter Vanhee; pilots from Airtfacts and Dronepix; and all staff from the research centres involved in acquiring the plant samples.

Conflicts of Interest

The authors declare no conflict of interest.

Appendix A

Table A1. Model training performance using randomized Kfold-CV for the prediction of the leek DBM using the data from the 2019 experiments.
SLRLassoPLSRSVRRFRxGBR
R M S E ¯ t r a i n (g plant−1)8.154.495.073.581.71.96
R M S E ¯ c v (g plant−1)8.174.885.324.364.184.35
RMSEct (g plant−1)8.194.475.384.314.204.52
rRMSEct (%)38.7423.0525.4720.019.8921.38
Biasct (g plant−1)0.010.000.10−0.05−0.20−0.63
R20.850.950.940.960.960.96
Table A2. Model training performance using randomized Kfold-CV for the prediction of the leek N-uptake using the data from the 2019 experiments.
SLRLassoPLSRSVRRFRxGBR
R M S E ¯ t r a i n (g plant−1)0.210.150.140.080.060.14
R M S E ¯ c v (g plant−1)0.210.160.160.160.140.15
RMSEct (g plant−1)0.210.160.160.170.140.16
rRMSEct (%)36.4428.3627.1929.2324.3527.83
Biasct (g plant−1)0.000.000.000.010.000.01
R20.870.920.930.910.940.93

References

  1. Zhang, X.; Davidson, E.A.; Mauzerall, D.L.; Searchinger, T.D.; Dumas, P.; Shen, Y. Managing Nitrogen for Sustainable Development. Nature 2015, 528, 51–59. [Google Scholar] [CrossRef] [Green Version]
  2. Thompson, R.B.; Tremblay, N.; Fink, M.; Gallardo, M.; Padilla, F.M. Tools and Strategies for Sustainable Nitrogen Fertilisation of Vegetable Crops; Springer: Cham, Switzerland, 2017; pp. 11–63. [Google Scholar]
  3. Groenten Openlucht|Landbouw & Visserij. Available online: https://landbouwcijfers.vlaanderen.be/landbouw/groenten-openlucht (accessed on 31 August 2022).
  4. FAO Crops and Livestock Products. Available online: https://www.fao.org/faostat/en/#data/QCL (accessed on 31 August 2022).
  5. Thompson, R.B.; Voogt, W.; Incrocci, L.; Fink, M.; de Neve, S. Strategies for Optimal Fertiliser Management of Vegetable Crops in Europe. Acta Hortic. 2018, 1192, 129–140. [Google Scholar] [CrossRef]
  6. Tei, F.; de Neve, S.; de Haan, J.; Kristensen, H.L. Nitrogen Management of Vegetable Crops. Agric. Water Manag. 2020, 240, 106316. [Google Scholar]
  7. Padilla, F.M.; Gallardo, M.; Peña-Fleitas, M.T.; de Souza, R.; Thompson, R.B. Proximal Optical Sensors for Nitrogen Management of Vegetable Crops: A Review. Sensors 2018, 18, 2083. [Google Scholar] [CrossRef] [PubMed] [Green Version]
  8. Ulissi, V.; Antonucci, F.; Benincasa, P.; Farneselli, M.; Tosti, G.; Guiducci, M.; Tei, F.; Costa, C.; Pallottino, F.; Pari, L.; et al. Nitrogen Concentration Estimation in Tomato Leaves by VIS-NIR Non-Destructive Spectroscopy. Sensors 2011, 11, 6411–6424. [Google Scholar] [CrossRef] [Green Version]
  9. de Souza, R.; Peña-Fleitas, M.T.; Thompson, R.B.; Gallardo, M.; Grasso, R.; Padilla, F.M. The Use of Chlorophyll Meters to Assess Crop N Status and Derivation of Sufficiency Values for Sweet Pepper. Sensors 2019, 19, 2949. [Google Scholar] [CrossRef] [PubMed] [Green Version]
  10. de Souza, R.; Grasso, R.; Teresa Peña-Fleitas, M.; Gallardo, M.; Thompson, R.B.; Padilla, F.M. Effect of Cultivar on Chlorophyll Meter and Canopy Reflectance Measurements in Cucumber. Sensors 2020, 20, 509. [Google Scholar] [CrossRef] [Green Version]
  11. Corti, M.; Marino Gallina, P.; Cavalli, D.; Cabassi, G. Hyperspectral Imaging of Spinach Canopy under Combined Water and Nitrogen Stress to Estimate Biomass, Water, and Nitrogen Content. Biosyst. Eng. 2017, 158, 38–50. [Google Scholar] [CrossRef]
  12. Marino, S.; Alvino, A. Hyperspectral Vegetation Indices for Predicting Onion (Allium cepa L.) Yield Spatial Variability. Comput. Electron. Agric. 2015, 116, 109–117. [Google Scholar] [CrossRef]
  13. Suarez, L.A.; Robson, A.; McPhee, J.; O’Halloran, J.; van Sprang, C. Accuracy of Carrot Yield Forecasting Using Proximal Hyperspectral and Satellite Multispectral Data. Precis. Agric. 2020, 21, 1304–1326. [Google Scholar] [CrossRef]
  14. Marino, S.; Basso, B.; Leone, A.P.; Alvino, A. Agronomic Traits and Vegetation Indices of Two Onion Hybrids. Sci. Hortic. 2013, 155, 56–64. [Google Scholar] [CrossRef]
  15. Tsouros, D.C.; Bibi, S.; Sarigiannidis, P.G. A Review on UAV-Based Applications for Precision Agriculture. Information 2019, 10, 349. [Google Scholar] [CrossRef] [Green Version]
  16. Wittstruck, L.; Kühling, I.; Trautz, D.; Kohlbrecher, M.; Jarmer, T. UAV-Based RGB Imagery for Hokkaido Pumpkin (Cucurbita Max.) Detection and Yield Estimation. Sensors 2021, 21, 118. [Google Scholar] [CrossRef] [PubMed]
  17. Ballesteros, R.; Ortega, J.F.; Hernandez, D.; Moreno, M.A. Onion Biomass Monitoring Using UAV-Based RGB Imaging. Precis. Agric. 2018, 19, 840–857. [Google Scholar] [CrossRef]
  18. Moeckel, T.; Dayananda, S.; Nidamanuri, R.R.; Nautiyal, S.; Hanumaiah, N.; Buerkert, A.; Wachendorf, M. Estimation of Vegetable Crop Parameter by Multi-Temporal UAV-Borne Images. Remote Sens. 2018, 10, 805. [Google Scholar] [CrossRef] [Green Version]
  19. Kim, D.-W.; Yun, H.; Jeong, S.-J.; Kwon, Y.-S.; Kim, S.-G.; Lee, W.; Kim, H.-J. Modeling and Testing of Growth Status for Chinese Cabbage and White Radish with UAV-Based RGB Imagery. Remote Sens. 2018, 10, 563. [Google Scholar] [CrossRef] [Green Version]
  20. Astor, T.; Dayananda, S.; Nautiyal, S.; Wachendorf, M. Vegetable Crop Biomass Estimation Using Hyperspectral and RGB 3D UAV Data. Agronomy 2020, 10, 1600. [Google Scholar] [CrossRef]
  21. Xie, C.; Yang, C. A Review on Plant High-Throughput Phenotyping Traits Using UAV-Based Sensors. Comput. Electron. Agric. 2020, 178, 105731. [Google Scholar] [CrossRef]
  22. Panday, U.S.; Pratihast, A.K.; Aryal, J.; Kayastha, R.B. A Review on Drone-Based Data Solutions for Cereal Crops. Drones 2020, 4, 41. [Google Scholar] [CrossRef]
  23. Johansen, K.; Morton, M.J.L.; Malbeteau, Y.; Aragon, B.; Al-Mashharawi, S.; Ziliani, M.G.; Angel, Y.; Fiene, G.; Negrão, S.; Mousa, M.A.A.; et al. Predicting Biomass and Yield in a Tomato Phenotyping Experiment Using UAV Imagery and Random Forest. Front. Artif. Intell. 2020, 3, 28. [Google Scholar] [CrossRef]
  24. de Nies, J.; Verhaeghe, M. Het Documenteren en Milieukundig Bijstellen van Het KNS en Andere Bemestingsadviessystemen in de Tuinbouw met het Oog op Een Ruimere Toepassing in de Tuinbouw Zoals Voorzien in het Actieprogramma 2011–2014. Available online: http://www.vlm.be/nl//SiteCollectionDocuments/Mestbank/Studies/Bemestingsadviessystementuinbouw/20141114eindrapportVlaamsKNS.pdf (accessed on 23 January 2020).
  25. Lorenz, H.P.; Schlaghecken, J.; Engel, G.; Maync, A.; Ziegler, J.; Strohmeyer, K. Ordnungsgemaesse Stickstoff-Versorgung im Freiland-Gemuesebau nach dem, Kulturbegleitenden-Nmin-Sollwerte-(KNS)-System; Ministerium fuer Landwirtschaft, Weinbau und Forsten Rheinland-Pfalz: Mainz, Germany, 1989; 85p. (In German) [Google Scholar]
  26. Mihaljev, Ž.A.; Jakšić, S.M.; Prica, N.B.; Ćupić, Ž.N.; Živkov-Baloš, M.M. Comparison of the Kjeldahl Method, Dumas Method and NIR Method for Total Nitrogen Determination in Meat and Meat Products. J. Agroaliment. Process. Technol. 2015, 21, 365–370. [Google Scholar]
  27. Gillies, S.; Ward, B.; Petersen, A.S. Others Rasterio: Geospatial Raster I/O for Python Programmers. 2013. Available online: https://github.com/rasterio/rasterio (accessed on 7 October 2022).
  28. Haumont, J.; Lootens, P.; Cool, S.; van Beek, J.; Raymaekers, D.; Ampe, E.M.; de Cuypere, T.; Bes, O.; Bodyn, J.; Saeys, W. 60. Leek Growth Monitoring Using Multispectral UAV Imagery; Wageningen Academic Publishers: Wageningen, The Netherlands, 2021; pp. 501–507. [Google Scholar] [CrossRef]
  29. Rouse, J.W., Jr.; Haas, R.H.; Schell, J.A.; Deering, D.W. Monitoring Vegetation Systems in the Great Plains with Erts; NASA Special Publication: Washington, DC, USA, 1974; Volume 351, p. 309. [Google Scholar]
  30. Gitelson, A.; Merzlyak, M.N. Quantitative Estimation of Chlorophyll-a Using Reflectance Spectra: Experiments with Autumn Chestnut and Maple Leaves. J. Photochem. Photobiol. B 1994, 22, 247–252. [Google Scholar] [CrossRef]
  31. Gitelson, A.; Kaufman, Y.; Merzlyak, M. Use of a Green Channel in Remote Sensing of Global Vegetation from EOS-MODIS. Remote Sens. Environ. 1996, 58, 289–298. [Google Scholar] [CrossRef]
  32. Yang, C.; Everitt, J.H.; Bradford, J.M.; Murden, D. Airborne Hyperspectral Imagery and Yield Monitor Data for Mapping Cotton Yield Variability. Precis. Agric. 2004, 5, 445–461. [Google Scholar] [CrossRef]
  33. Gitelson, A.A. Wide Dynamic Range Vegetation Index for Remote Quantification of Biophysical Characteristics of Vegetation. J. Plant Physiol. 2004, 161, 165–173. [Google Scholar] [CrossRef] [PubMed] [Green Version]
  34. Dash, J.; Curran, P.J. The MERIS Terrestrial Chlorophyll Index. Int. J. Remote Sens. 2010, 25, 5403–5413. [Google Scholar] [CrossRef]
  35. Daughtry, C.S.T.; Walthall, C.L.; Kim, M.S.; de Colstoun, E.B.; McMurtrey, J.E. Estimating Corn Leaf Chlorophyll Concentration from Leaf and Canopy Reflectance. Remote Sens. Environ. 2000, 74, 229–239. [Google Scholar] [CrossRef]
  36. Barnes, E.M.; Clarke, T.R.; Richards, S.E.; Colaizzi, P.D.; Haberland, J.; Kostrzewski, M.; Waller, P.; Choi, C.; Riley, E.; Thompson, T.; et al. Coincident Detection of Crop Water Stress, Nitrogen Status and Canopy Density Using Ground Based Multispectral Data. In Proceedings of the Fifth International Conference on Precision Agriculture, Bloomington, MN, USA, 16–19 July 2000; Volume 1619, p. 6. [Google Scholar]
  37. Gitelson, A.; Gritz, Y.; Merzlyak, M. Relationships between Leaf Chlorophyll Content and Spectral Reflectance and Algorithms for Non-Destructive Chlorophyll Assessment in Higher Plant Leaves. J. Plant Physiol. 2003, 160, 271–282. [Google Scholar] [CrossRef]
  38. Huete, A.R. A Soil-Adjusted Vegetation Index (SAVI). Remote Sens. Environ. 1988, 25, 295–309. [Google Scholar] [CrossRef]
  39. Tibshirani, R. Regression Shrinkage and Selection via the Lasso. J. R. Stat. Soc. Ser. B (Methodol.) 1996, 58, 267–288. [Google Scholar] [CrossRef]
  40. Geladi, P.; Kowalski, B.R. Partial Least-Squares Regression: A Tutorial. Anal. Chim. Acta 1986, 185, 1–17. [Google Scholar] [CrossRef]
  41. Smola, A.J.; Schölkopf, B. A Tutorial on Support Vector Regression. Stat. Comput. 2004, 14, 199–222. [Google Scholar] [CrossRef] [Green Version]
  42. Chen, T.; Guestrin, C. {XGBoost}: A Scalable Tree Boosting System. In Proceedings of the 22nd ACM SIGKDD International Conference on Knowledge Discovery and Data Mining, San Francisco, CA, USA, 13–17 August 2016; Association of Computer Machinery: New York, NY, USA, 2016; pp. 785–794. [Google Scholar]
  43. Breiman, L. Random Forests. Mach. Learn. 2001, 45, 5–32. [Google Scholar] [CrossRef] [Green Version]
  44. Pedregosa, F.; Varoquaux, G.; Gramfort, A.; Michel, V.; Thirion, B.; Grisel, O.; Blondel, M.; Prettenhofer, P.; Weiss, R.; Dubourg, V.; et al. Scikit-Learn: Machine Learning in {P}ython. J. Mach. Learn. Res. 2011, 12, 2825–2830. [Google Scholar]
  45. Saeys, W.; Nguyen Do Trong, N.; Van Beers, R.; Nicolaï, B.M. Multivariate Calibration of Spectroscopic Sensors for Postharvest Quality Evaluation: A Review. Postharvest Biol. Technol. 2019, 158, 110981. [Google Scholar] [CrossRef]
  46. Kemps, B.J.; Saeys, W.; Mertens, K.; Darius, P.; de Baerdemaeker, J.G.; de Ketelaere, B. The Importance of Choosing the Right Validation Strategy in Inverse Modelling. J. Near Infrared Spectrosc. 2010, 18, 231–237. [Google Scholar] [CrossRef]
  47. Luo, S.; Jiang, X.; He, Y.; Li, J.; Jiao, W.; Zhang, S.; Xu, F.; Han, Z.; Sun, J.; Yang, J.; et al. Multi-Dimensional Variables and Feature Parameter Selection for Aboveground Biomass Estimation of Potato Based on UAV Multispectral Imagery. Front. Plant Sci. 2022, 13, 2673. [Google Scholar] [CrossRef]
  48. Bendig, J.; Yu, K.; Aasen, H.; Bolten, A.; Bennertz, S.; Broscheit, J.; Gnyp, M.L.; Bareth, G. Combining UAV-Based Plant Height from Crop Surface Models, Visible, and near Infrared Vegetation Indices for Biomass Monitoring in Barley. Int. J. Appl. Earth Obs. Geoinf. 2015, 39, 79–87. [Google Scholar] [CrossRef]
  49. Pranga, J.; Borra-Serrano, I.; Aper, J.; de Swaef, T.; Ghesquiere, A.; Quataert, P.; Roldán-Ruiz, I.; Janssens, I.A.; Ruysschaert, G.; Lootens, P. Improving Accuracy of Herbage Yield Predictions in Perennial Ryegrass with UAV-Based Structural and Spectral Data Fusion and Machine Learning. Remote Sens. 2021, 13, 3459. [Google Scholar] [CrossRef]
  50. Viljanen, N.; Honkavaara, E.; Näsi, R.; Hakala, T.; Niemeläinen, O.; Kaivosoja, J. A Novel Machine Learning Method for Estimating Biomass of Grass Swards Using a Photogrammetric Canopy Height Model, Images and Vegetation Indices Captured by a Drone. Agriculture 2018, 8, 70. [Google Scholar] [CrossRef] [Green Version]
  51. Näsi, R.; Viljanen, N.; Kaivosoja, J.; Alhonoja, K.; Hakala, T.; Markelin, L.; Honkavaara, E. Estimating Biomass and Nitrogen Amount of Barley and Grass Using UAV and Aircraft Based Spectral and Photogrammetric 3D Features. Remote Sens. 2018, 10, 1082. [Google Scholar] [CrossRef] [Green Version]
  52. Štroner, M.; Urban, R.; Seidl, J.; Reindl, T.; Brouček, J. Photogrammetry Using UAV-Mounted GNSS RTK: Georeferencing Strategies without GCPs. Remote Sens. 2021, 13, 1336. [Google Scholar] [CrossRef]
Figure 1. The location of the leek fields at the research centres (yellow) and farmers (green) during the 2019 (triangles) and 2020 (squares) experiments.
Remotesensing 14 06211 g001
Figure 2. Workflow for model training, hyperparameter optimization and model selection.
Remotesensing 14 06211 g002
Figure 3. Evolution of the NDVI values acquired at the field of PSKW during the 2019 growing season. The cyan rectangles indicate the complete experimental plot while the red rectangle indicates the area used to extract the multispectral data.
Remotesensing 14 06211 g003
Figure 4. The evolution of (a) the DBM (g plant−1) and (b) the N-uptake (gN plant−1) across all experimental plots in 2019 (blue) and 2020 (orange) in function of the days after planting. The solid line is a lowess smoother.
Remotesensing 14 06211 g004
Figure 5. R M S E c t values for all the SLR models for (a) DBM (g plant−1) and (b) N-uptake (gN plant−1) ordered from the smallest to largest.
Remotesensing 14 06211 g005
Figure 6. Scatter plots of predicted versus observed values for (a) leek DBM using the Lasso model and (b) leek N-uptake using the SLR model based on the median RWDRVI. The red dotted line shows the lowess smoother for the predictions.
Remotesensing 14 06211 g006
Figure 7. The predicted dbm (a) and N-uptake (b) in function of their observed values at the research centres (orange dots) and farmer fields (blue crosses) from the experiments in 2020.
Remotesensing 14 06211 g007
Table 1. Description of the fields that were monitored during the experiments, the varieties that were planted, fertilizers used, the number of observations and flights for both the plant nitrogen uptake (N-uptake) and dry biomass (DBM) and the days after planting (DAP) on which the flights were executed.
SeasonTypeLocationArea (ha)VarietyFertilizerPlant Density (ha−1)nplotsnflightsnobsDAP
2019Research CentreILVO 10.89PlustonCAN153 8461234041, 99, 125
Inagro 20.53PlustonCAN153 84624512041, 101, 132, 176, 216
PCG 20.14PlustonCAN153 846124483, 41, 100, 129
PSKW 10.09PlustonCAN178 57185406, 41, 100, 126, 168
2020Research CentreILVO 10.48PlustonCAN153 8461646444, 83, 136, 251
Inagro 20.32PlustonCAN153 8461646449, 91, 135, 210
PCG 20.18PlustonCAN153 846431242, 84, 129
PSKW 10.28PlustonCAN178 571164 (1) *64 (16) *36, 77, 105, 149 *
FarmerF1 23.51VitatonPS + Urean 185 18533943, 124, 257
F2 12.97ChieftonCM + CAN185 18522443, 134
PlustonCM + CAN185 18512238, 129
F3 21.45PlustonCS + CAN161 94333936, 118, 183
F4 23.09KryptonN.A. §161 94322454, 243
F5 12.14HarstonPS + CAN170 94023 (1) *6 (2) *44, 100, 266 *
F6 21.88VitatonCS + CAN151 515212204
F7 21.21PlustonPS + CAN175 43913340, 122, 176
PoultonPS + CAN175 43923656, 138, 187
F8 20.79HarstonCM + APP208 33322447, 263
F9 11.95PlustonNovatec227 27323 (1) *6 (2) *37, 106, 150 *
F10 10.66PoultonRM + CAN170 94022 (0) *4 (0) *43, 134
Total 20195617248
Total 20207644 (32) *263 (203) *
Total13261511 (451) *
1,2 These UAV flights were executed by certified pilots with a DJI M6001 or a DJI M2002. * The number of flights and observations that were matched with N-uptake observations deviates from the number of flights for DBM observations and is indicated between brackets. The flight moments that correspond to those flights is also indicated with *. The different mineral fertilizers used were calcium ammonia nitrate (CAN), Urean, Novatec, and ammonia polyphosphate (APP), while the used organic fertilizers were pig slurry (PS), cattle slurry (CS) or cattle manure (CM). § The farmer did not provide information on the type of fertilizer used.
Table 2. Calculated vegetation indices and formulae based on the Micasense Rededge MX bands.
VIFormulaReferences
NDVI(nir − red)/(nir + red)[29]
NDRE(nir − rededge)/(nir + rededge)[30]
GNDVI(nir − green)/(nir + green)[31]
BNDVI(nir − blue)/(nir + blue)[32]
RWDRVI(0.1 × nir − red)/(0.1× nir + red)[33]
BWDRVI(0.1 × nir − blue)/(0.1× nir + blue)[33]
MTCI(nir − rededge)/(rededge − red)[34]
MCARI(rededge − red) − 0.2(rededge − green)(rededge/red)[35]
CCCI[(nir + red)(nir − rededge)]/[(nir − red)(nir + rededge)] [36]
CI-greennir/green − 1[37]
CI-rededgenir/rededge − 1[37]
SAVI[(1 + 0.5) × (nir − rededge)]/(nir + red + 0.5)[38]
Table 3. Summary of the model performances based on R M S E ¯ t r a i n across all LOF-CV iterations, the RMSEcv, Biasct, and R2 for DBM (g plant−1). The SLR model performance is based on the median RWDRVI model.
SLRLassoPLSRSVRRFRxGBR
R M S E ¯ t r a i n (g plant−1)8.115.005.263.593.301.97
R M S E ¯ c v (g plant−1)6.347.227.5811.156.376.31
RMSEct (g plant−1)9.086.607.9010.926.356.72
rRMSEct (%)42.9731.2137.3651.6730.0331.80
Biasct (g plant−1)−0.020.590.70−0.07−0.43−0.89
R20.810.900.870.730.910.90
Table 4. Summary of the model performance based on R M S E ¯ t r a i n across all LOF-CV iterations, the RMSEcv, Biasct, and R2 for N-uptake (gN plant−1). The SLR model performance is based on the median RWDRVI model.
SLRLassoPLSRSVRRFRxGBR
R M S E ¯ t r a i n (g plant−1)0.210.200.160.080.110.15
R M S E ¯ c v (g plant−1)0.200.250.230.320.190.18
RMSEct (g plant−1)0.220.290.260.300.210.23
rRMSEct (%)39.0851.3544.8952.4936.7840.11
Biasct (g plant−1)0.000.050.010.140.03−0.05
R20.850.750.820.780.870.87
Table 5. Summary of the Lasso model to predict Pluston DBM and SLR model to predict Pluston N-uptake on the test data acquired during the 2020 experiments.
Field TypeAllResearch CentreFarmer
VarietyPlustonPlustonPluston
DBM
nobs22420420
RMSEP8.508.379.79
rRMSEP49.9849.9650.62
Bias1.281.103.11
R20.770.770.78
N-uptake
nobs17215616
RMSEP0.270.280.24
rRMSEP69.7772.7649.51
Bias0.030.020.09
R20.680.670.82
Table 6. Summary of the prediction accuracy for leek DBM and N-uptake for leek varieties that were not included in the training dataset.
VarietyChieftonHarstonKryptonPoultonVitaton
DBM
nobs41041011
RMSEP6.1921.689.2013.3211.59
Bias1.033.893.949.830.23
R21.000.590.860.710.70
N-uptake
nobs464611
RMSEP0.270.260.260.300.44
Bias0.24−0.010.040.230.29
R20.960.730.770.960.65
Publisher’s Note: MDPI stays neutral with regard to jurisdictional claims in published maps and institutional affiliations.

