Article

Theory and Experiment Analysis on the Influence of Floods on a GNSS Pseudo-Range Multipath and CNR Signal Based on Two Cases Study in China

1
Communication Engineering School, Hangzhou Dianzi University, Hangzhou 310005, China
2
School of Geodesy and Geomatics, Wuhan University, Wuhan 430072, China
3
School of Electronic Information Engineering, Beihang University, Beijing 100191, China
*
Author to whom correspondence should be addressed.
Remote Sens. 2022, 14(22), 5874; https://doi.org/10.3390/rs14225874
Submission received: 8 October 2022 / Revised: 13 November 2022 / Accepted: 17 November 2022 / Published: 19 November 2022
(This article belongs to the Topic GNSS Measurement Technique in Aerial Navigation)

Abstract

:
The surrounding environment of a GNSS observation station is changed during a flood, and this results in a more serious multipath than in a normal environment. Considering that the multipath error is largely related to the pseudo-range multipath and CNR (Carrier-to-noise ratio) of the GNSS signal, the influence of floods on a pseudo-range multipath and CNR is analyzed in theory and through experiment. To ensure the accuracy of the analysis results, the ground track repeat period of GPS, GLONASS, and BDS satellites is investigated from the perspective of theory and skyplots. Two real cases study collected in Zhengzhou and Xinxiang, China, in 2021, are used to demonstrate the influence of floods on a pseudo-range multipath and CNR in detail. Experimental results show that the pseudo-range multipath of a GPS satellite performs more seriously during a flood. The maximum RMS increase rate is approximately 17.85%, and the average of all other satellites with a whole arc is approximately 6.55%. In addition, the CNR of three GNSS systems performs a decrease during a flood. For GPS and GLONASS satellites, the decrease performs more seriously at a high elevation angle than that at a low elevation angle. The maximum decrease is approximately 5 dB-Hz for the GPS satellite and approximately 7 dB-Hz for the GLONASS satellite. In terms of the BDS system, the CNR of all three orbital type satellites decreases during a flood. The average decrease is approximately 2 dB-Hz for BDS MEO and GEO satellites, and about 1 dB-Hz for the BDS IGSO satellite.

1. Introduction

Regarding global warming, extreme weather has been occurring more frequently in recent years, especially floods and urban water logging caused by heavy rainfall. Floods or urban water-logging disasters can result in many serious disturbances to communities and the environment [1,2]. Thus, many researchers have been dedicating their efforts to detect and forecast floods. However, the flood having an effect on the GNSS (Global Navigation Satellite System) signal and the mechanism of influence have not been researched in depth.
The surrounding environment of the observation station is changed during a flood, and this change leads to a fluctuation of multipath effects in theory. Cai et al. investigated the influence of different observation environments on the multipath effect [3]. The results show that the pseudo-range multipath (MP) with water around the observation station is increased for the BDS (BeiDou System) and GPS (Global Positioning System) satellites compared with the open sky. However, the water environment of this experiment only exists on one side of the observation station. Thus, it can be predicted that the multipath error will become more severe when a flood occurs, since the observation station will be surrounded by water. In addition, Michael indicated that the reflection coefficient of fresh water is nearly three times larger than that of dry soil [4]. However, how much the change of environment affects the MP has not been investigated in depth, and neither has the under-flood environment.
A multipath error is largely related to a CNR of GNSS signal. Axelrad et al. developed an experiment using the CNR to detect a GPS multipath error first [5]. The relationship between the multipath error, double-difference residual of carrier phase observation, and CNR is analyzed [6]. Experimental results indicated that the CNR decreases as the multipath increases. Moreover, Su et al. demonstrated that the multipath residuals of the carrier phase maintains a strong relationship with the CNR, and the multipath residual is inversely proportional to CNR [7]. Tian et al. analyzed the multipath error of the BDS marine measurement, and the results indicated that the CNR received in marine environments performs less effectively than that of on-land environments for most BDS satellites because of the multipath effect [8]. In addition, some of the previous literature has directly or indirectly verified the correlation between the multipath and CNR, such as [9]. However, the reason why the CNR will be affected by the change of environment has not been analyzed in theory.
In order to ensure the accuracy of a performance comparison analysis between the same satellites, the orbital repeat period of a satellite with respect to the static observation station at the same elevation and azimuth should be investigated. Genrich et al. analyzed the ground track repeat period of the GPS satellite. The results show that the period is nearly a sidereal day [10]. Thus, to research the variety of characteristics of the GPS satellite, a data set collected on two consecutive adjacent days can be used. Although Su et al. pointed out that the satellite maneuver can lead to a fluctuation of the repeat period, the influence is on the order of minutes or hours, and it hardly affects the analysis with units in days [11]. Wang et al. demonstrated that the GLONASS satellite runs around the earth seventeen times about every eight solar days [12]. However, how to estimate the satellite repeat period of GLONASS has not been introduced in theory. In terms of the Galileo IOV (In-Orbit Verification) and FOC (Full Operational Capability) satellites, both of them have a repeat period of about 10 days [13]. In addition, Wang et al. indicated that Galileo E18 and E14 satellites were launched into incorrect orbits [14,15]; thus, these two satellites repeat their ground tracks about every 20 days instead of every 10 days [16]. The ground track repeat period of the BDS system was researched by Su et al. in depth. The results show that the ground track repeat period of the BDS IGSO (Inclined GeoSynchronous Orbit) and GEO (GEosynchronous Orbit) satellites is one day. As for the BDS MEO (MEdium Orbit) satellites, the ground track repeat period is seven days [17]. In addition, all the previous literature only presented the results of the repeat period, but did not present the results in skyplot.
Based on the above, the reason why the MP and CNR are affected by floods is analyzed in theory. In addition, the reason why the satellite repeat period can be calculated for GLONASS satellite is demonstrated in theory and in skyplot. Data sets collected during two floods are used in the experiment. Combing the ground track repeat period of satellite, the influence of floods on the GPS satellite MP signal is analyzed. In addition, the CNR of GPS, GLONASS, and BDS is investigated in depth, and some meaningful conclusions are drawn.

2. Theory and Methods

In order to analyze the influence of floods on GNSS MP and CNR signals, the theory of the relationship between floods and multipaths, and the relationship between multipaths and the CNR signal is given first. In addition, the pseudo-range multipath combination model of the GPS satellite is presented.

2.1. Relationship between Floods and Multipaths

The multipath effect is induced by a reflection signal, refraction signal, and scatter signal. In addition, the amplitude of a multipath is affected by the shape, size, and reflection coefficient of the multipath-inducing surface. The primary factor that affects the amplitude of the reflection or diffraction signal is the reflection coefficient of the multipath-inducing surface. Detailed treatment of reflection coefficients will not be provided here, but it must be noted that reflection coefficients are a function of the angle of incidence of the signal and typically approach unity for near parallel incidence (e.g., very small elevation angles in the case of ground reflection).
The reflectivity and refractivity of different objects vary greatly. Table 1 summarizes the reflection coefficients and attenuation factors for common surfaces at normal incidences on a GPS L1 frequency [4]. It can be seen that the reflection coefficient of dry soil is only 0.268, which is much lower than that of fresh water. The reflection coefficient of water is 0.800, which is nearly three times that of dry soil. Therefore, for a static GPS observation station, the multipath error without surrounding by water is much lower than that with water. Thus, on the basis of the above analysis, it can be concluded that the multipath error of a static station will increase when a flood occurs.

2.2. Relationship between the GNSS CNR Signal and Multipath

In theory, the GNSS receiver can not only receive the direct signal, but also can receive the indirect signal. Without a loss of generality, the signal received by the GNSS receiver can be expressed as follows [18]:
S ( t ) = i = 0 n a i ( t ) cos ( w 0 t + γ i ) + ε ( t )
where S ( t ) denotes the signal received by the GNSS receiver; n is the total number of the received signals; w 0 denotes the nominal frequency of the direct signal; γ i is the relative phase of the i-th component; ε ( t ) represents noise; a i ( t ) means the amplitude of the signal, which includes both direct and indirect signals. Thus, Equation (1) can be further expressed as follows [19]:
S ( t ) = i = 0 k a i d ( t ) cos w 0 t + i = 0 m a i r ( t ) cos ( w 0 t + γ i )
where k and m mean the number of direct and indirect signals, respectively; a i d ( t ) and a i r ( t ) denote the amplitude of direct and indirect signals. Considering that the strength of the GNSS signal is often denoted by CNR observation, the above Equation (2) can be simplified as follows:
C N R = A d 2 + A r 2 + 2 A d A r cos φ
where A d is the amplitude of direct signal; A r means the amplitude of indirect signal; φ is the phase difference between the direct and indirect signals.
From Equation (3), it can be seen that the CNR is not only related to the direct signal, but also performs largely in tandem with the indirect signal. When the phase of the indirect signal is the same as that of the direct signal, the strength of the received signal will be enhanced. On the contrary, if the phase between the indirect signal and direct signal is inconsistent, the signal will be attenuated. This phenomenon is called the multipath effect, and the indirect signal is often denoted as a multipath signal. Thus, based on the above analysis, it can be concluded that the CNR is strongly related with the multipath. In addition, it should be pointed out that the CNR can be directly obtained from the RNIEX observation files.

2.3. Pseudorange Multipath Combination Model

To eliminate the influence of the geometry and ionosphere delay, the pseudo-range multipath (MP) combination model based on the pseudo-range and dual-frequency carrier phase observation is used. The concrete MP combination can be expressed as follows:
M P j = P j f j 2 + f i 2 f j 2 f i 2 λ j φ j + 2 f i 2 f j 2 f i 2 λ i φ i B i j
where the subscripts i and j (ij) indicate different frequencies; MPj is the pseudo-range multipath combination in unit with meter; λi and λj are wavelengths; fi and fj are frequencies; φi and φj are carrier phase observations; Pi and Pj are pseudo-range observations; Bij is composed of the ambiguity term and hardware delay bias. Thus, it can be considered to be constant if no cycle slip occurs on the carrier phase observation. The pseudo-range multipath combination can cancel out atmospheric (ionospheric and tropospheric) delays as well as all geometric errors, but the ambiguities and differential hardware bias still remains in Bij. Thus, to remove the constant, a moving average filter method is used, which is expressed as follows:
M P j = M P j M P j ¯
where MPj is the pseudo-range multipath combination in units of meters, which is calculated by Equation (4). M P j ¯ is the averageof MPj; M P j are the pseudo-range multipath residuals.
After removing the constant term Bij by subtracting the average value of the multipath combination series for each continuous ambiguity block, the residual series are dominated by the pseudo-range multipath and tracking noise of the pseudo-range observation. More information is detailed in [17,20].

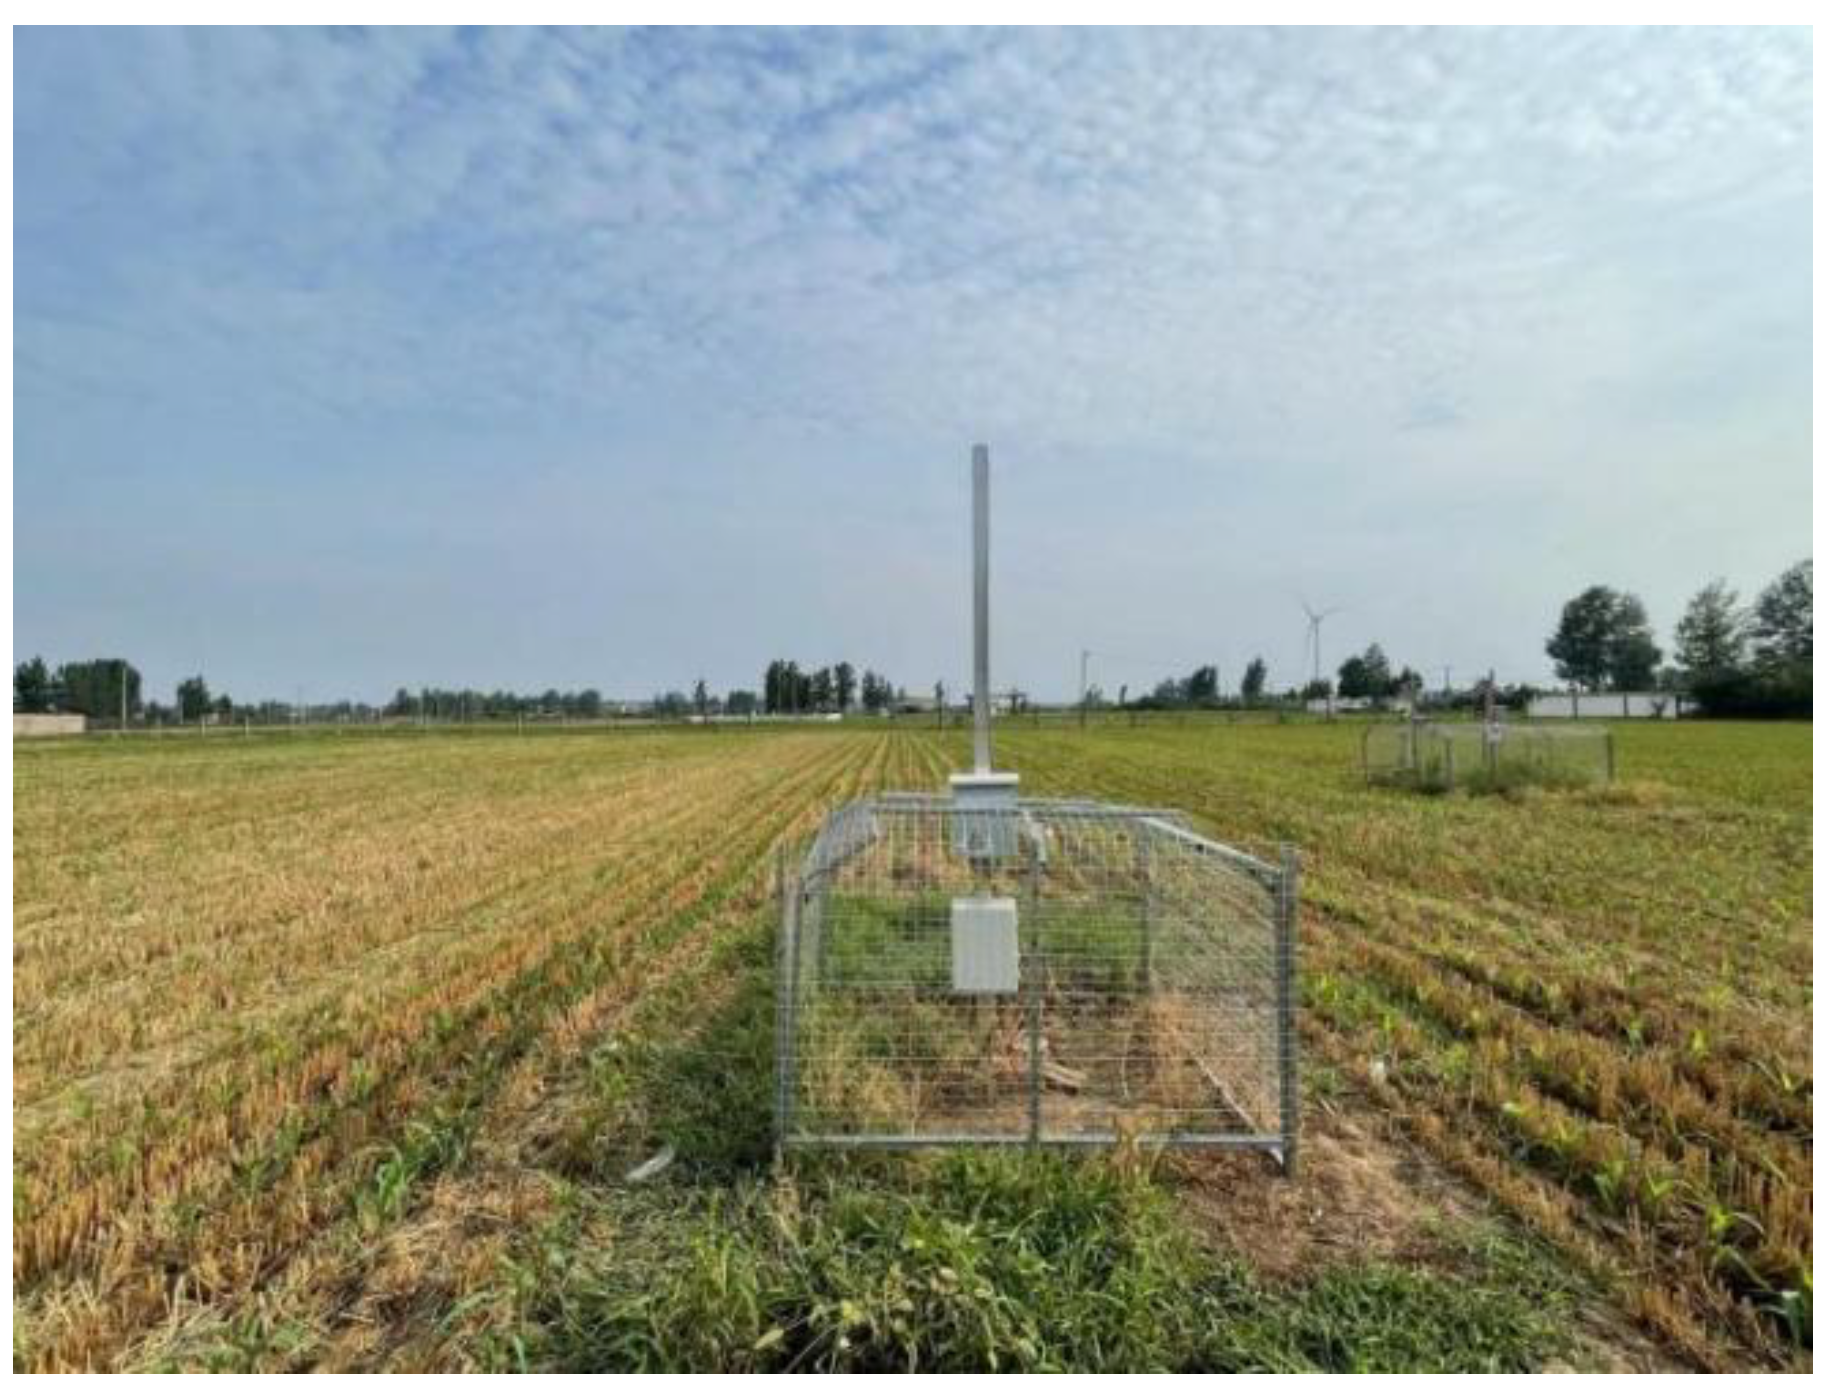
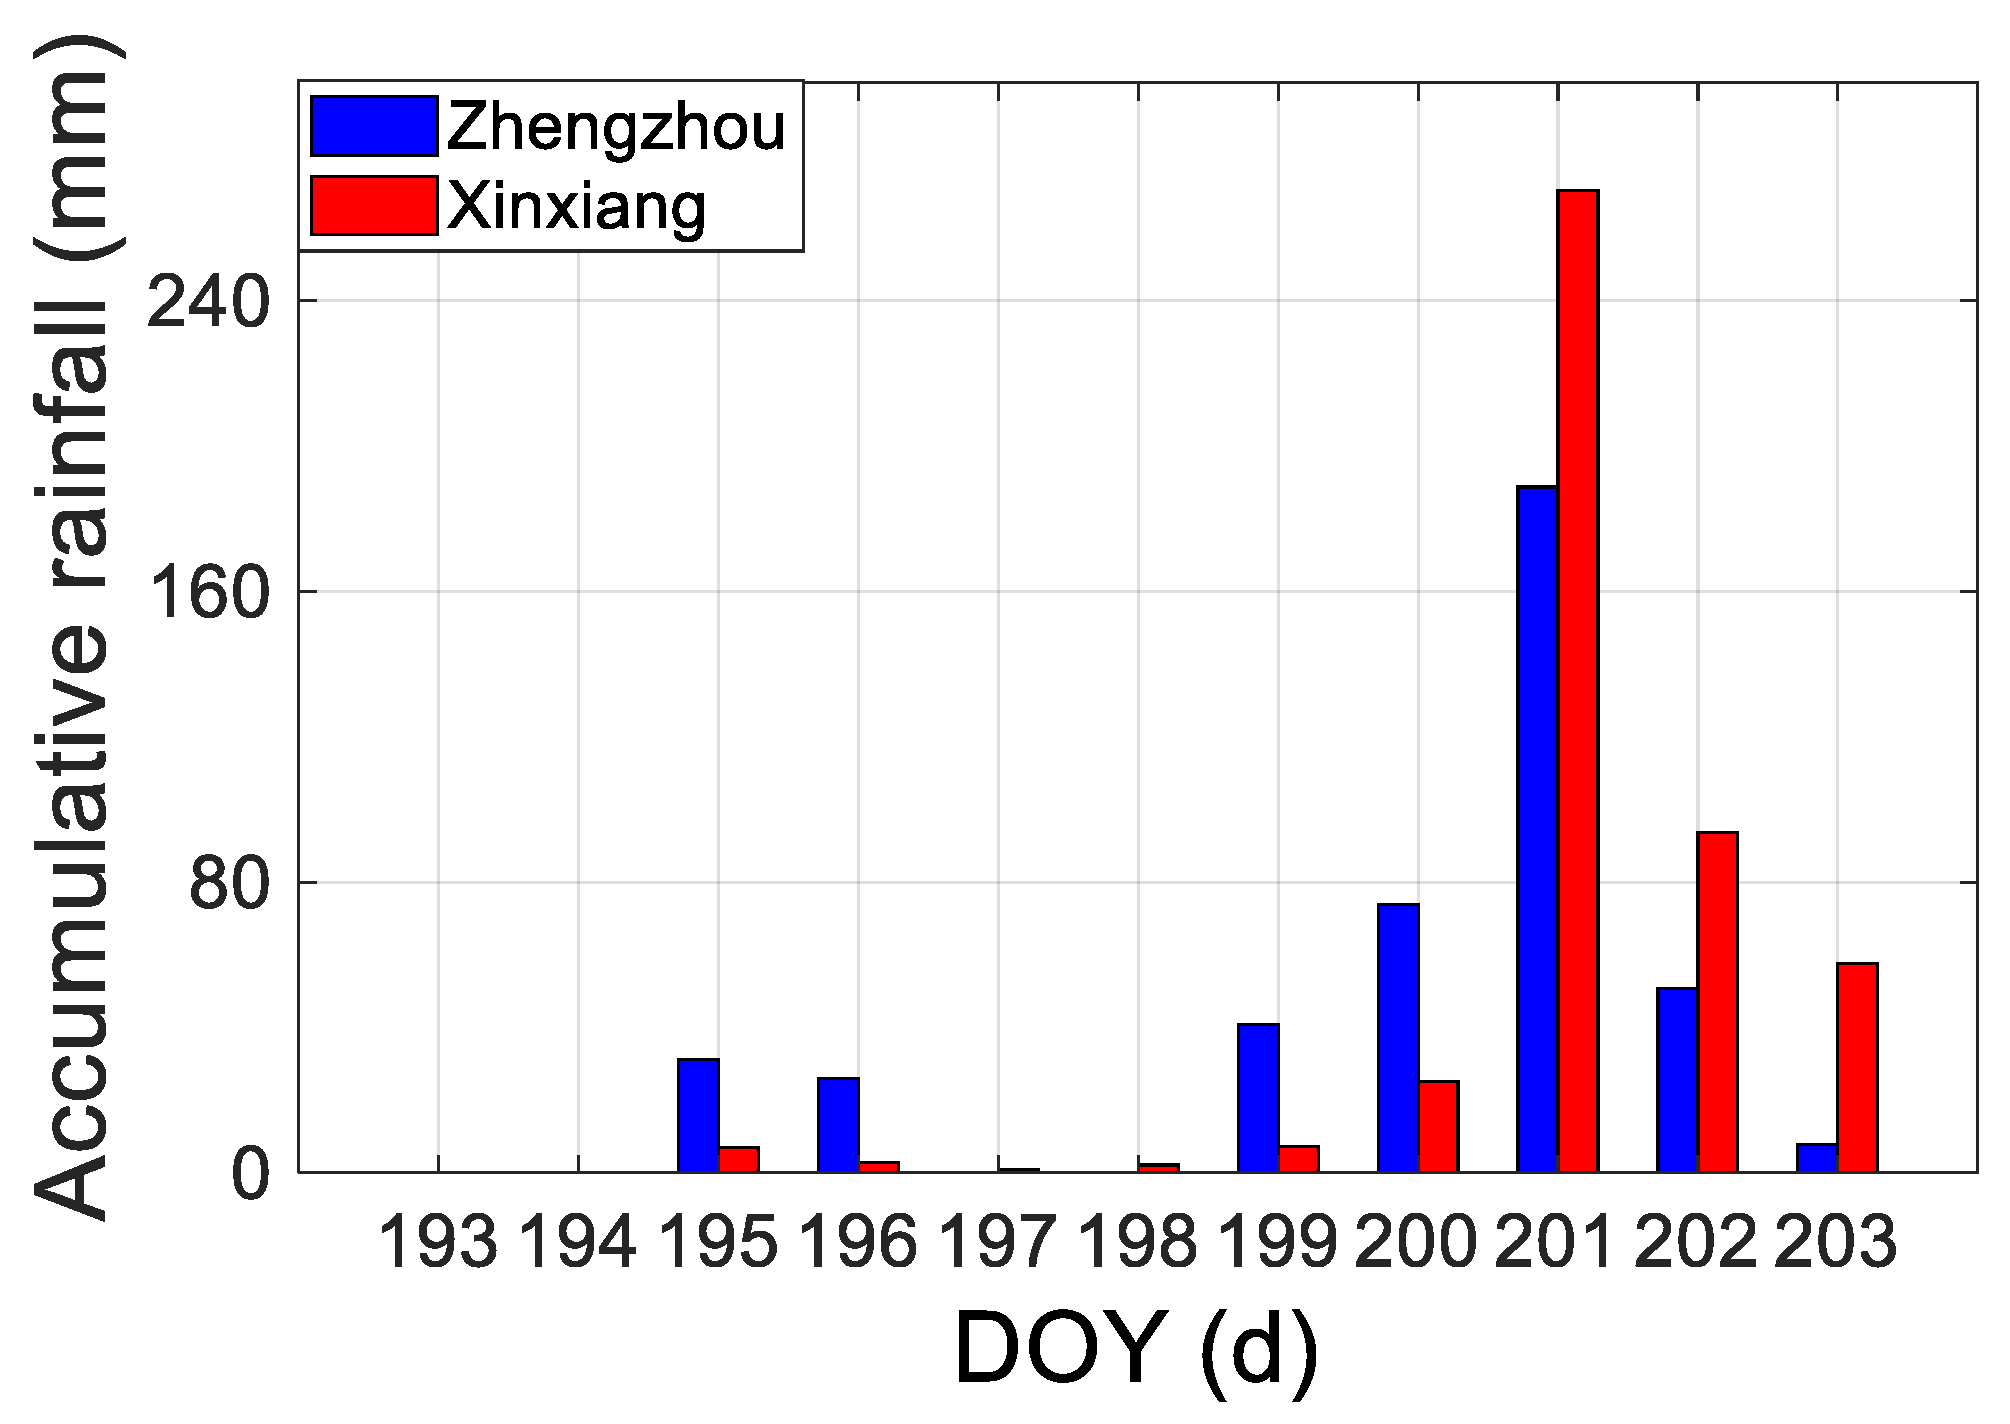
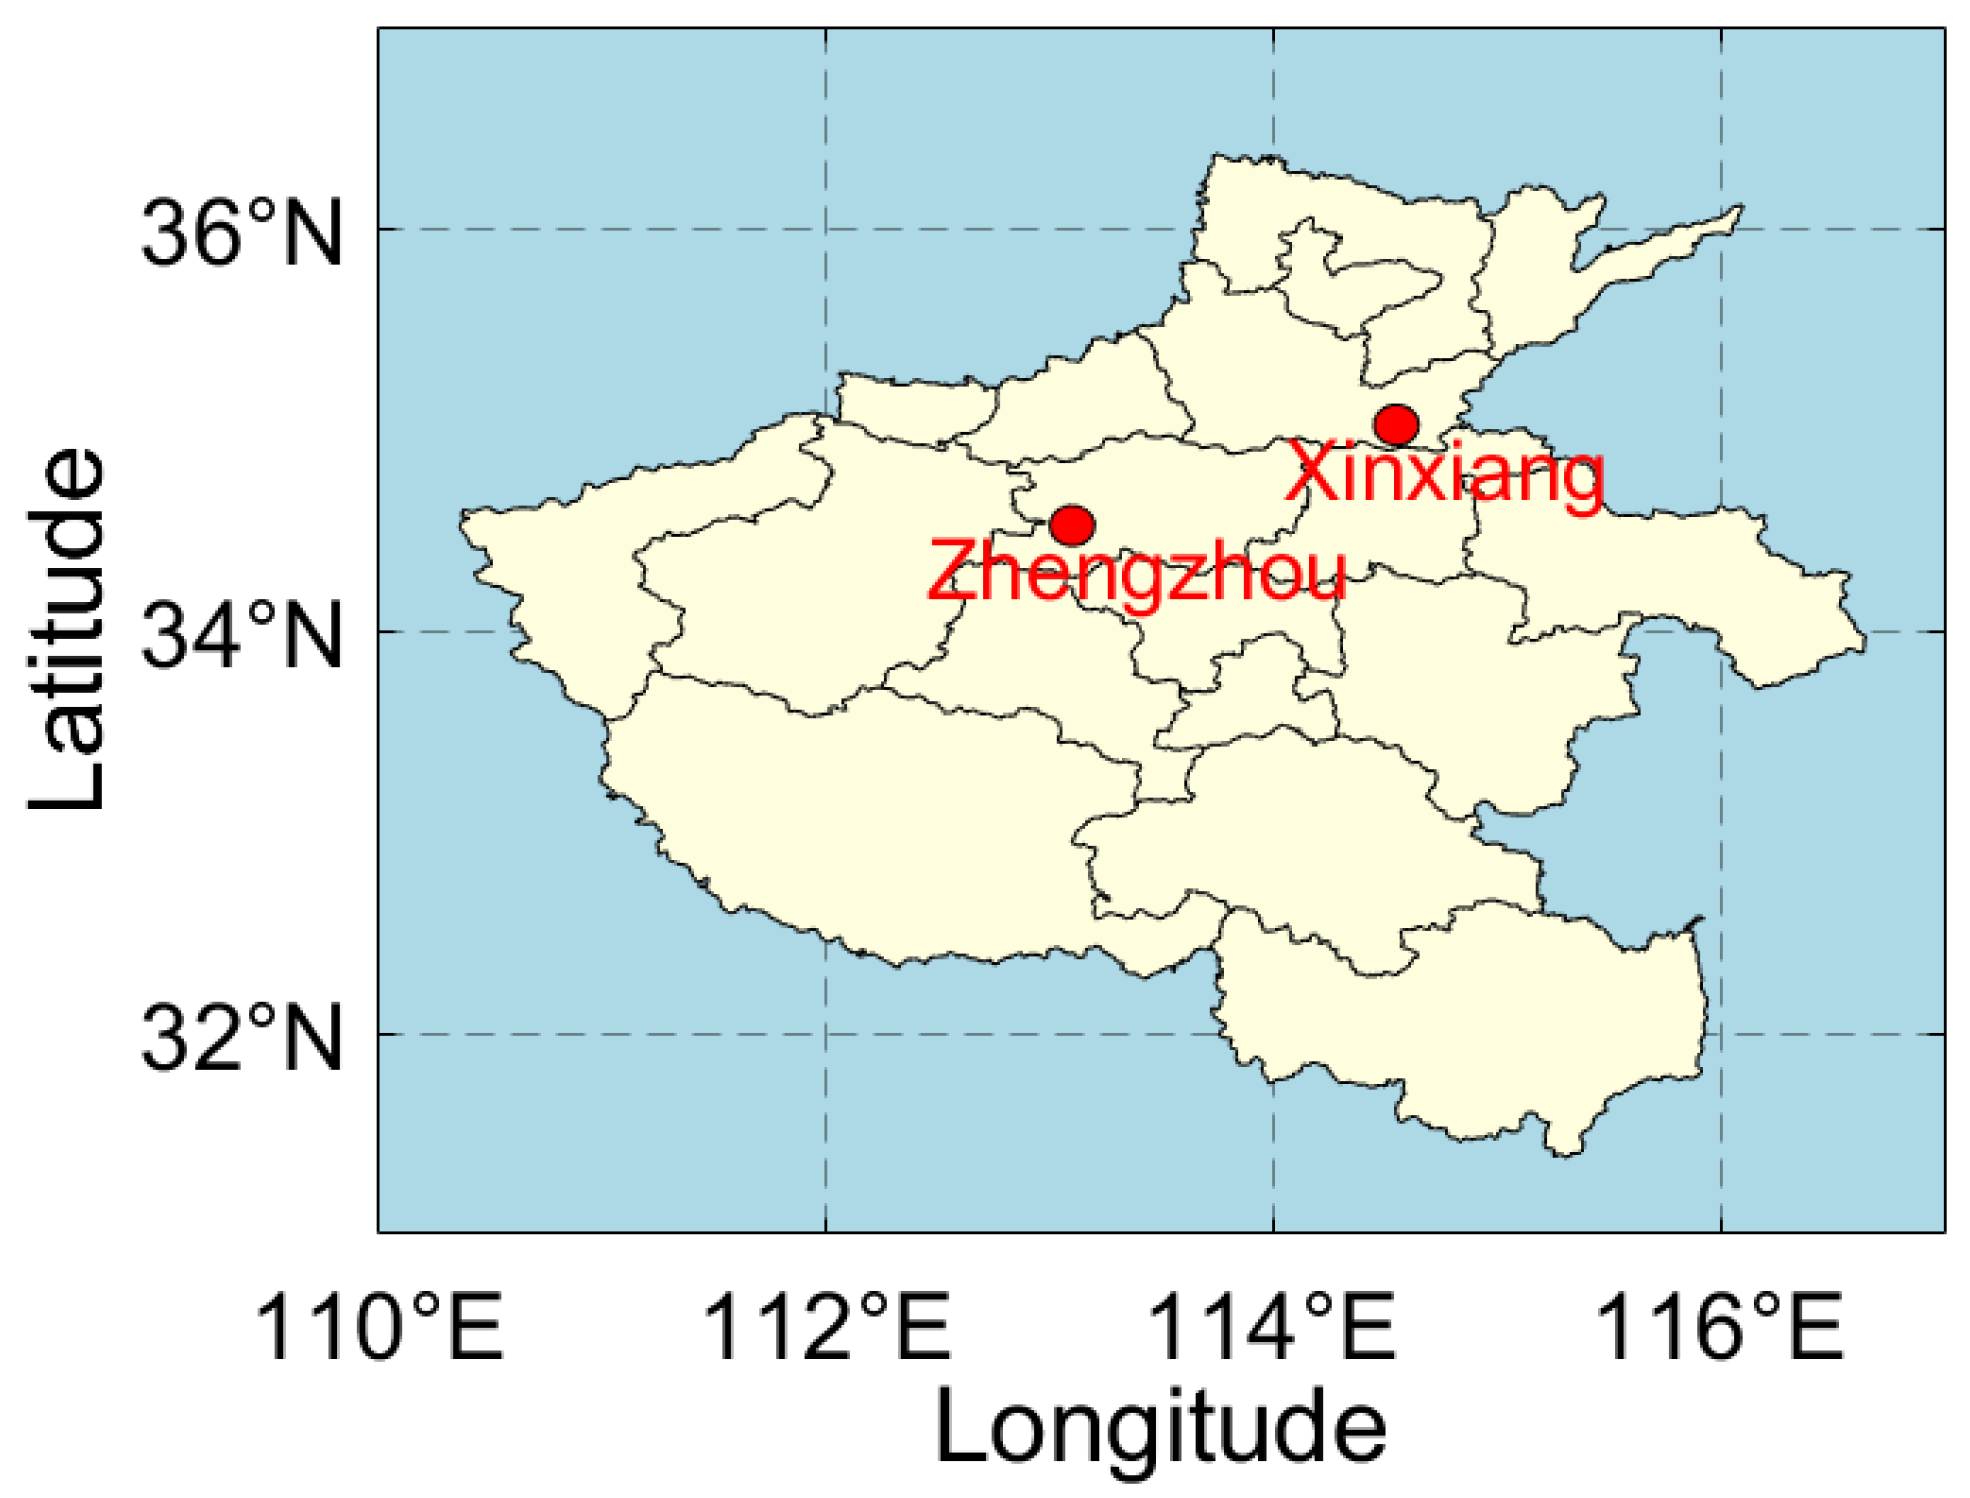
3. Site and Data Set Description

Two flood cases are used in this experiment. The first flood occurred on DOY (Day Of Year):201, 2021, in Zhengzhou City, Henan province, China. The observation station was named ZHNZ and is located in Zhengzhou (34.52°N, 113.10°E). This station was established and is managed by the Infrastructure of National Earthquake Data Center, China. The antenna is set on an observation pier, and the height of the pier is approximately 3 m. Both the GPS and GLONASS dual-frequency signal can be received, and the sampling rate of data set is 30 s. The receiver is a TRIMBLE NETR8 geodetic dual-frequency receiver with a TRM59900.00 antenna. It should be pointed out that there is no surrounding picture at present because of the confidentiality of the observation environment. However, the data set from the Infrastructure of National Earthquake Data Center, China, can be applied.
The second flood occurred on DOY:203, 2021 in Xinxiang city, Henan province, China. The observation station was established and is managed by the Changxin team from Wuhan university. The receiver is located at 35.02°N, 114.55°E around a field of corn, and the height of the antenna is approximately 2 m. Both the GPS and BDS single-frequency signal can be received, and the sampling rate of the data sets is 1 s. Considering that the double frequencies carrier phase and pseudo-range observation should be used to calculate the MP, this flood can only analyze the influence of floods on the CNR, but cannot analyze the MP. The station is equipped with a low-cost u-blox geodetic single-frequency receiver with a ANN-MB antenna. The surrounding environment of the station is presented as Figure 1.
Both of these two floods are induced by a continuous accumulation of rainfall. The rainfall information is presented in Figure 2. In addition, the latitude and longitude for these two floods is presented in Figure 3. Considering that the data set collected on eight and seven days before the flood should be used to analyze the GLONASS and BDS MEO satellite, the rainfall information of these eight days is given in Figure 2. The blue bar denotes the rainfall in Zhengzhou, and the red bar denotes the rainfall in Xinxiang. It should be pointed out that although the rainfall on DOY:203 is weaker than that of on DOY:201 in Xianxiang, the flood occurred on DOY:203 because of the continuous rainfall and overflow of the river in previous days. Relevant information can be found by searching the website: https://q-weather.info/weather (accessed on 20 July 2021).

4. Ground Track Repeat Period of GPS, GLONASS, and BDS Satellites

In order to accurately analyze the influence of floods on the GNSS signal, the quantity used to compare and analyze the non-flood period should be determined first. Considering that the multipath is related to the surrounding environment of the observation station, the elevation and azimuth of the non-flood observation should be the same as that of the flood observation. This requires the same ground track repeat period as the satellite.

4.1. Theory of Ground Track Repeat Period Model

Before calculating the ground track repeat period, the satellite operation period is introduced first. The satellite operation period is the period of the satellite that rounds the orbit of itself one time. If the earth is stationary, the satellite operation period is totally same as the ground track repeat period for the static observation station. However, it is well known that the earth exists by rotation and revolution instead of remaining stationary. Thus, the satellite operation period (denoted as Tsop) is different from the satellite ground track repeat period.
Considering that only an approximation ground track repeat period with units in day needs to be determined in this experiment instead of an accurate period with units in seconds, the simplest fraction method is adopted [21]. The simplest fraction method can be expressed as follows:
N T s o p = D T s d
where N and D mean that after D solar days, the satellite operations N rounds are in their own orbit. Tsd denotes the sidereal day, which is 86,164 s. Tsop is the satellite operation period with units in seconds. Tsop can be calculated by two methods; one is based on the Kepler’s third law, which is expressed as follows [22]:
T s o p = 2 π ( R + H ) 3 / G M
where GM = 3.986005 × 10¹⁴ m3/s2 is the earth’s gravitational constant; R and H denote the mean radius of the earth and the height of the satellite from the ground, respectively. Based on Equation (7), Tsop can be calculated by the broadcast ephemeris. More information can be found in [23,24]. Another method is based on the information of the satellite’s orbit, which is given by the GNSS operation official government sector. The relevant information is summarized in Table 2.
It should be noted that the Tsop calculated by the broadcast ephemeris and Kepler’s third law is more accurate than that by the given orbital repetition information. However, for the GLONASS satellite, the broadcast ephemeris only includes the satellite coordinates instead of the root parameter of the satellite’s orbit. Thus, only the given orbital repetition information can be used to calculate Tsop. Since only an approximation period with units in days is needed in this experiment, the GLONASS satellite period calculated by official information can be used in subsequent analyses.
After estimating parameter Tsop, the N and D can be determined by the search and test process. For example, the Tsop of the GLONASS satellite can be calculated by Table 2, which is 40,560 s. Thus, Equation (6) can be converted to:
N D = T s d T s o p = 86 , 164 40 , 560 = 2.21435
where Tsd is the sidereal day.
Then, by using the search and test method, it can be found that only the simplest fraction (17/8) = 2.215 can approximately satisfy the equation. This indicates that the GLONASS satellite runs around the earth seventeen times about every eight solar days. Thus, in order to analyze the influence of flood on GLONASS satellite, data set collected on eight day ago before flood should be used. The repetition period of BDS MEO satellite can also be calculated by the above process.

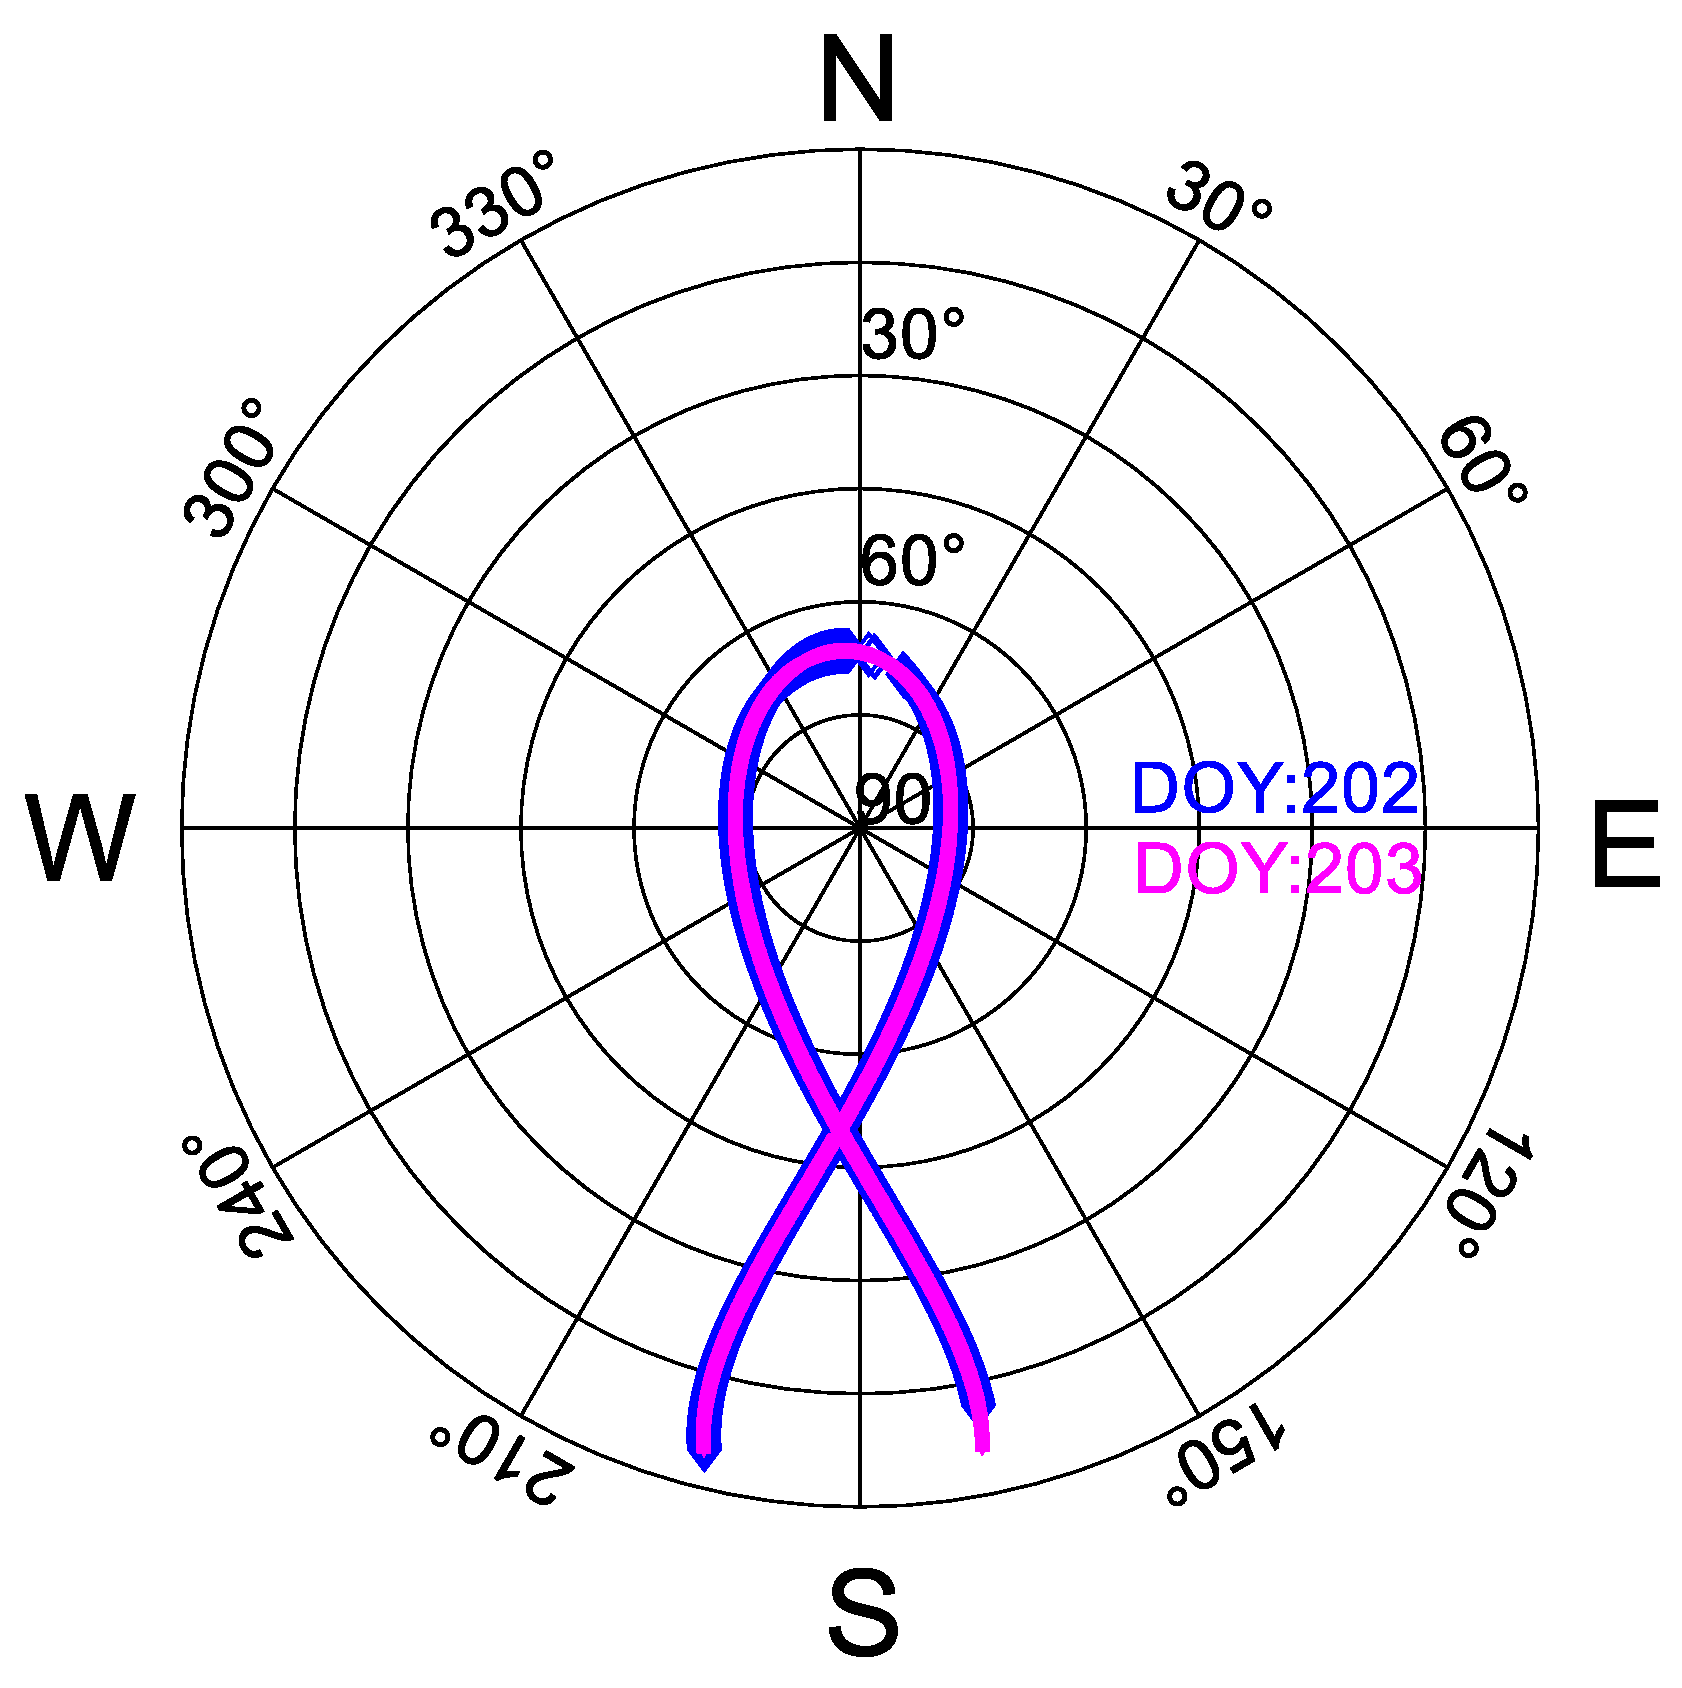
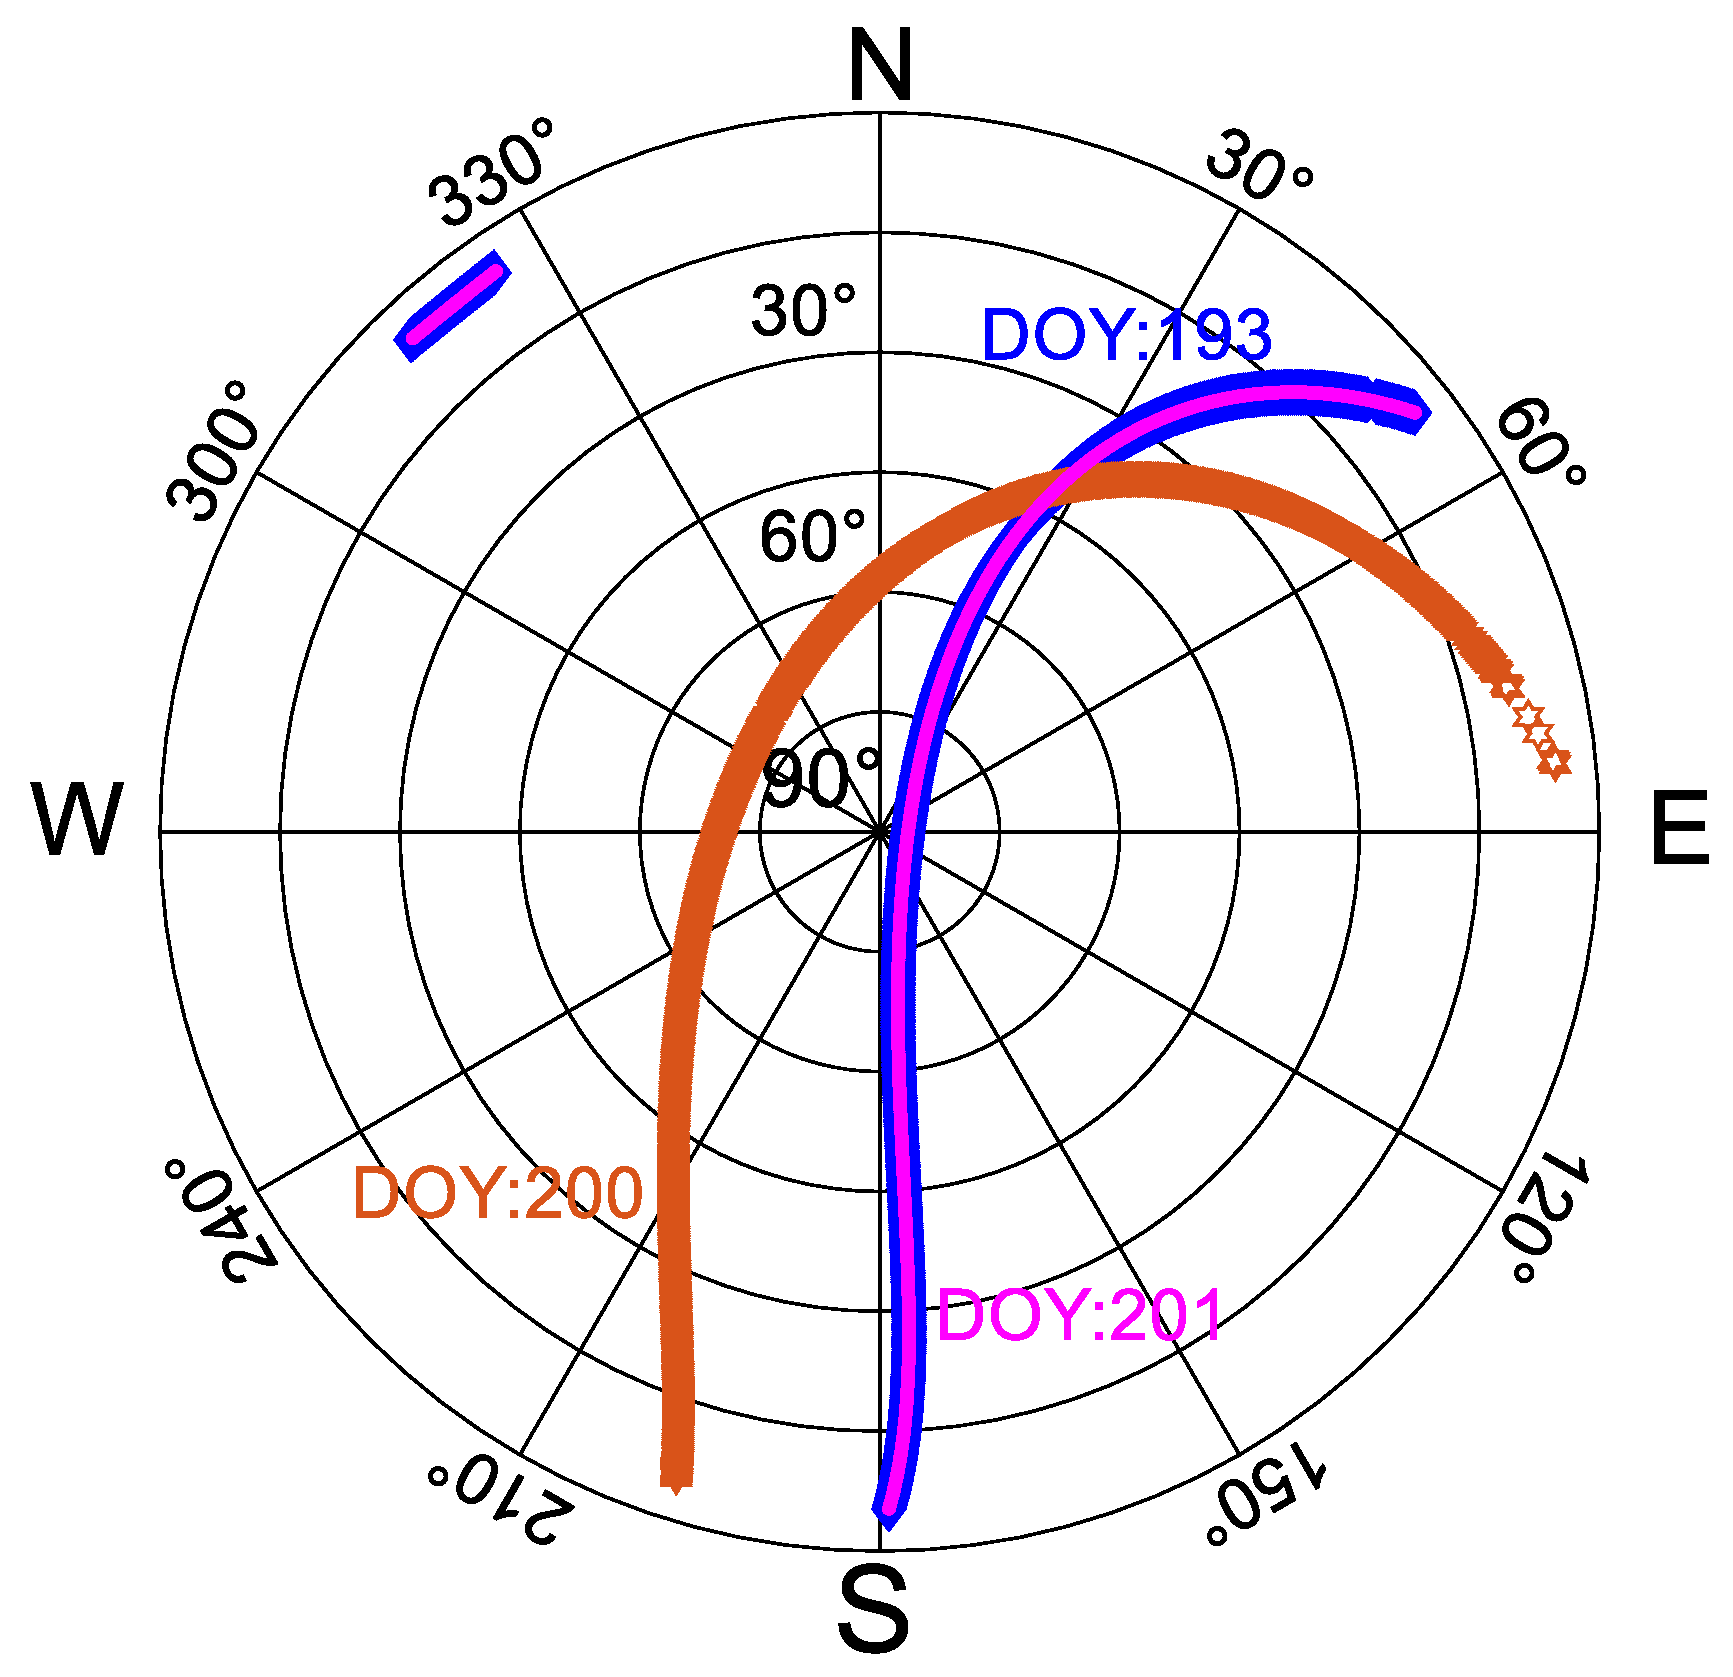
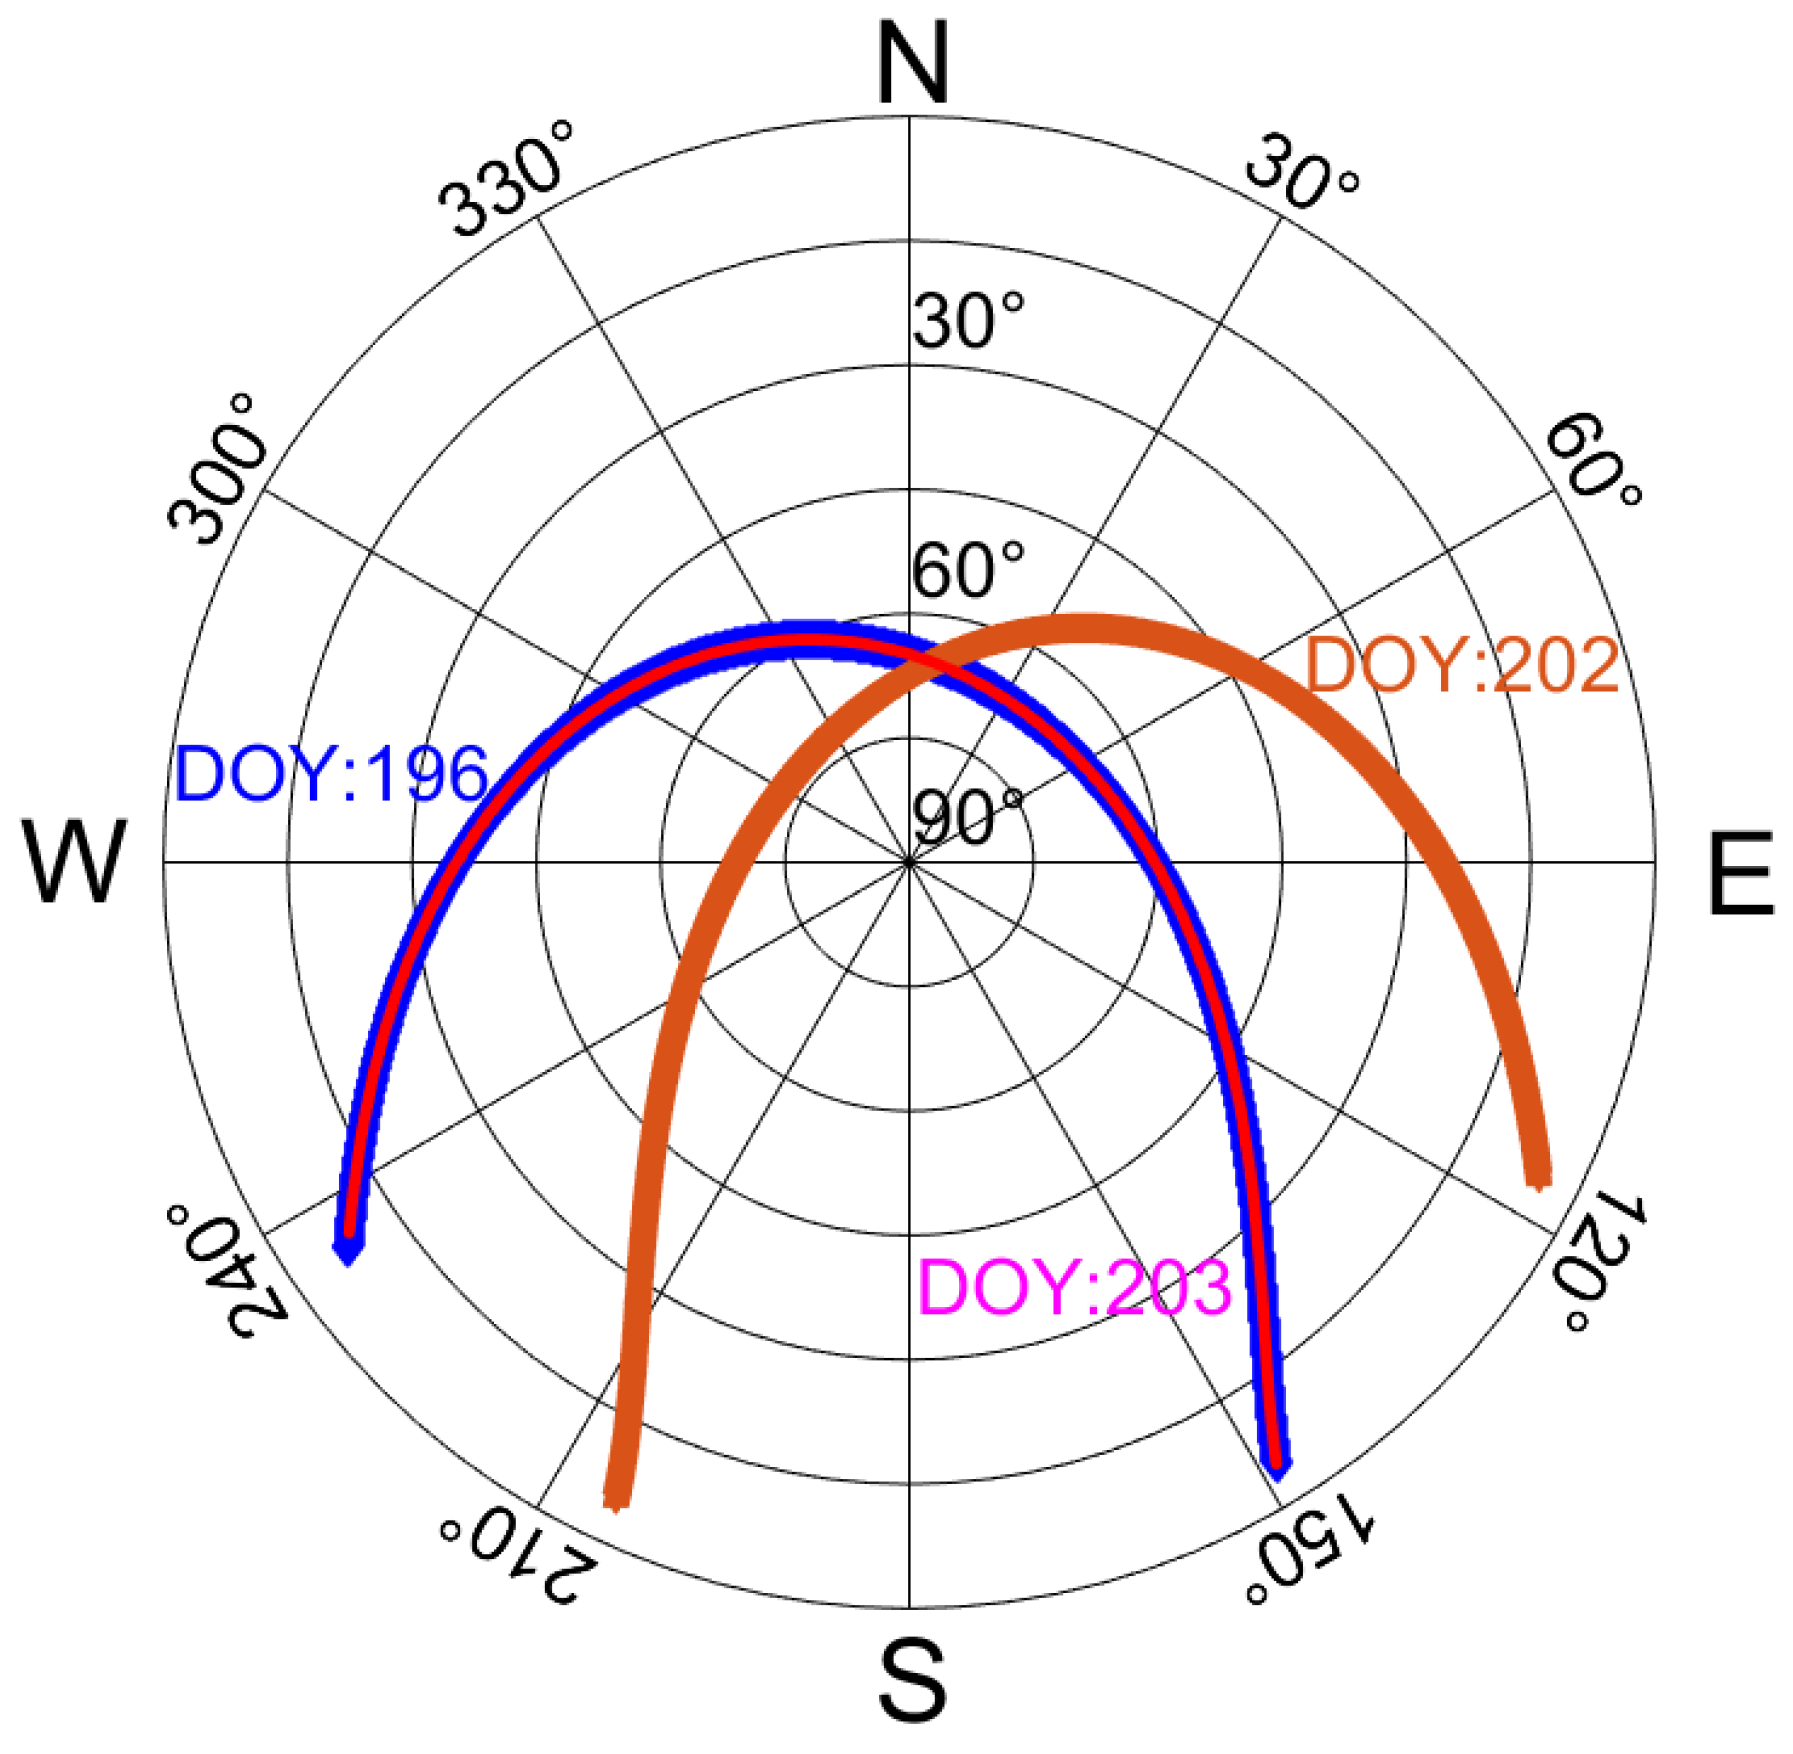
4.2. Results Analysis of Ground Track Repetition Period

Considering that the BDS GEO satellite is a geosynchronous earth orbit satellite, the ground track of the GEO satellite remains almost stationary; therefore, only GPS, GLONASS, BDS IGSO, and MEO satellites are analyzed in this section. In addition, since the ground track repetition period of GPS and BDS IGSO is a sidereal day, both of them are analyzed together for simplicity. In order to be consistent with the subsequent analysis of the influence of floods, the data set collected during the flood(s) is used in this section.
The ground track repeat period of the GPS G32 satellite is presented in Figure 4. The blue and pink lines denote the DOY:200 and DOY:201, 2021, respectively. The vertical denotes the elevation angle, and the circle represents the azimuth angle. The width of the pink line is half as wide as the blue line to make it clear that these two lines are almost exactly overlapped. This convention applies to all of the skyplots. From Figure 4, it can be seen that the elevation and azimuth of the G32 satellite remain identical to each other for two adjacent days. This result indicates that the ground track repetition period of the GPS satellite is a sidereal day, which is consistent with the theoretical results. Similar to the GPS G32 satellite, the ground track repeat period of the BDS IGSO satellite is also a sidereal day. Figure 5 demonstrates the ground track repeat period of the BDS IGSO B16 satellite. It can be found that the elevation and azimuth of the B16 satellite perform identically to each other for two adjacent days. Thus, in order to analyze the influence of floods on GPS and BDS IGSO satellites, two adjacent days before and after the flood should be used.
Different from GPS and BDS IGSO satellites, the ground track repeat period of the GLONASS satellite is eight sidereal days. The satellite ground track repeat period of the R14 satellite from the perspective of the skyplot is demonstrated in Figure 6. The brown and blue lines denote the R14 satellite on DOY:200 and DOY:201, 2021, respectively. It can be seen that the elevation and azimuth of the R14 satellite on DOY:200 is totally different from DOY:201. Thus, the multipath of these two days will be different for the R14 satellite. This is completely different from the GPS satellite. For the GPS satellite, the elevation and azimuth will be repeated in two consecutive days if there is no orbital maneuvering [11]. The pink line denotes the elevation and azimuth of the R14 satellite on DOY:193. Thus, to investigate the influence of floods on the GLONASS satellite, the data set collected eight days prior to the flood should be used.
To illustrate the repeat period of the BDS MEO satellite, the skyplot of the B20 satellite on DOY:196, DOY:202, and DOY:203, 2021 is presented in Figure 7. The brown and pink lines denote the trajectory of the B20 satellite on DOY:202 and DOY:203, respectively. The elevation and azimuth of the B20 satellite on DOY:202 is totally different from DOY:203, even though they are adjacent for two days. However, the blue line means the trajectory of the B20 satellite on DOY:196, which is exactly same as DOY:203. Thus, based on the above analysis, to investigate the influence of floods on the BDS MEO satellite, the data set collected seven days prior to the flood should be used.

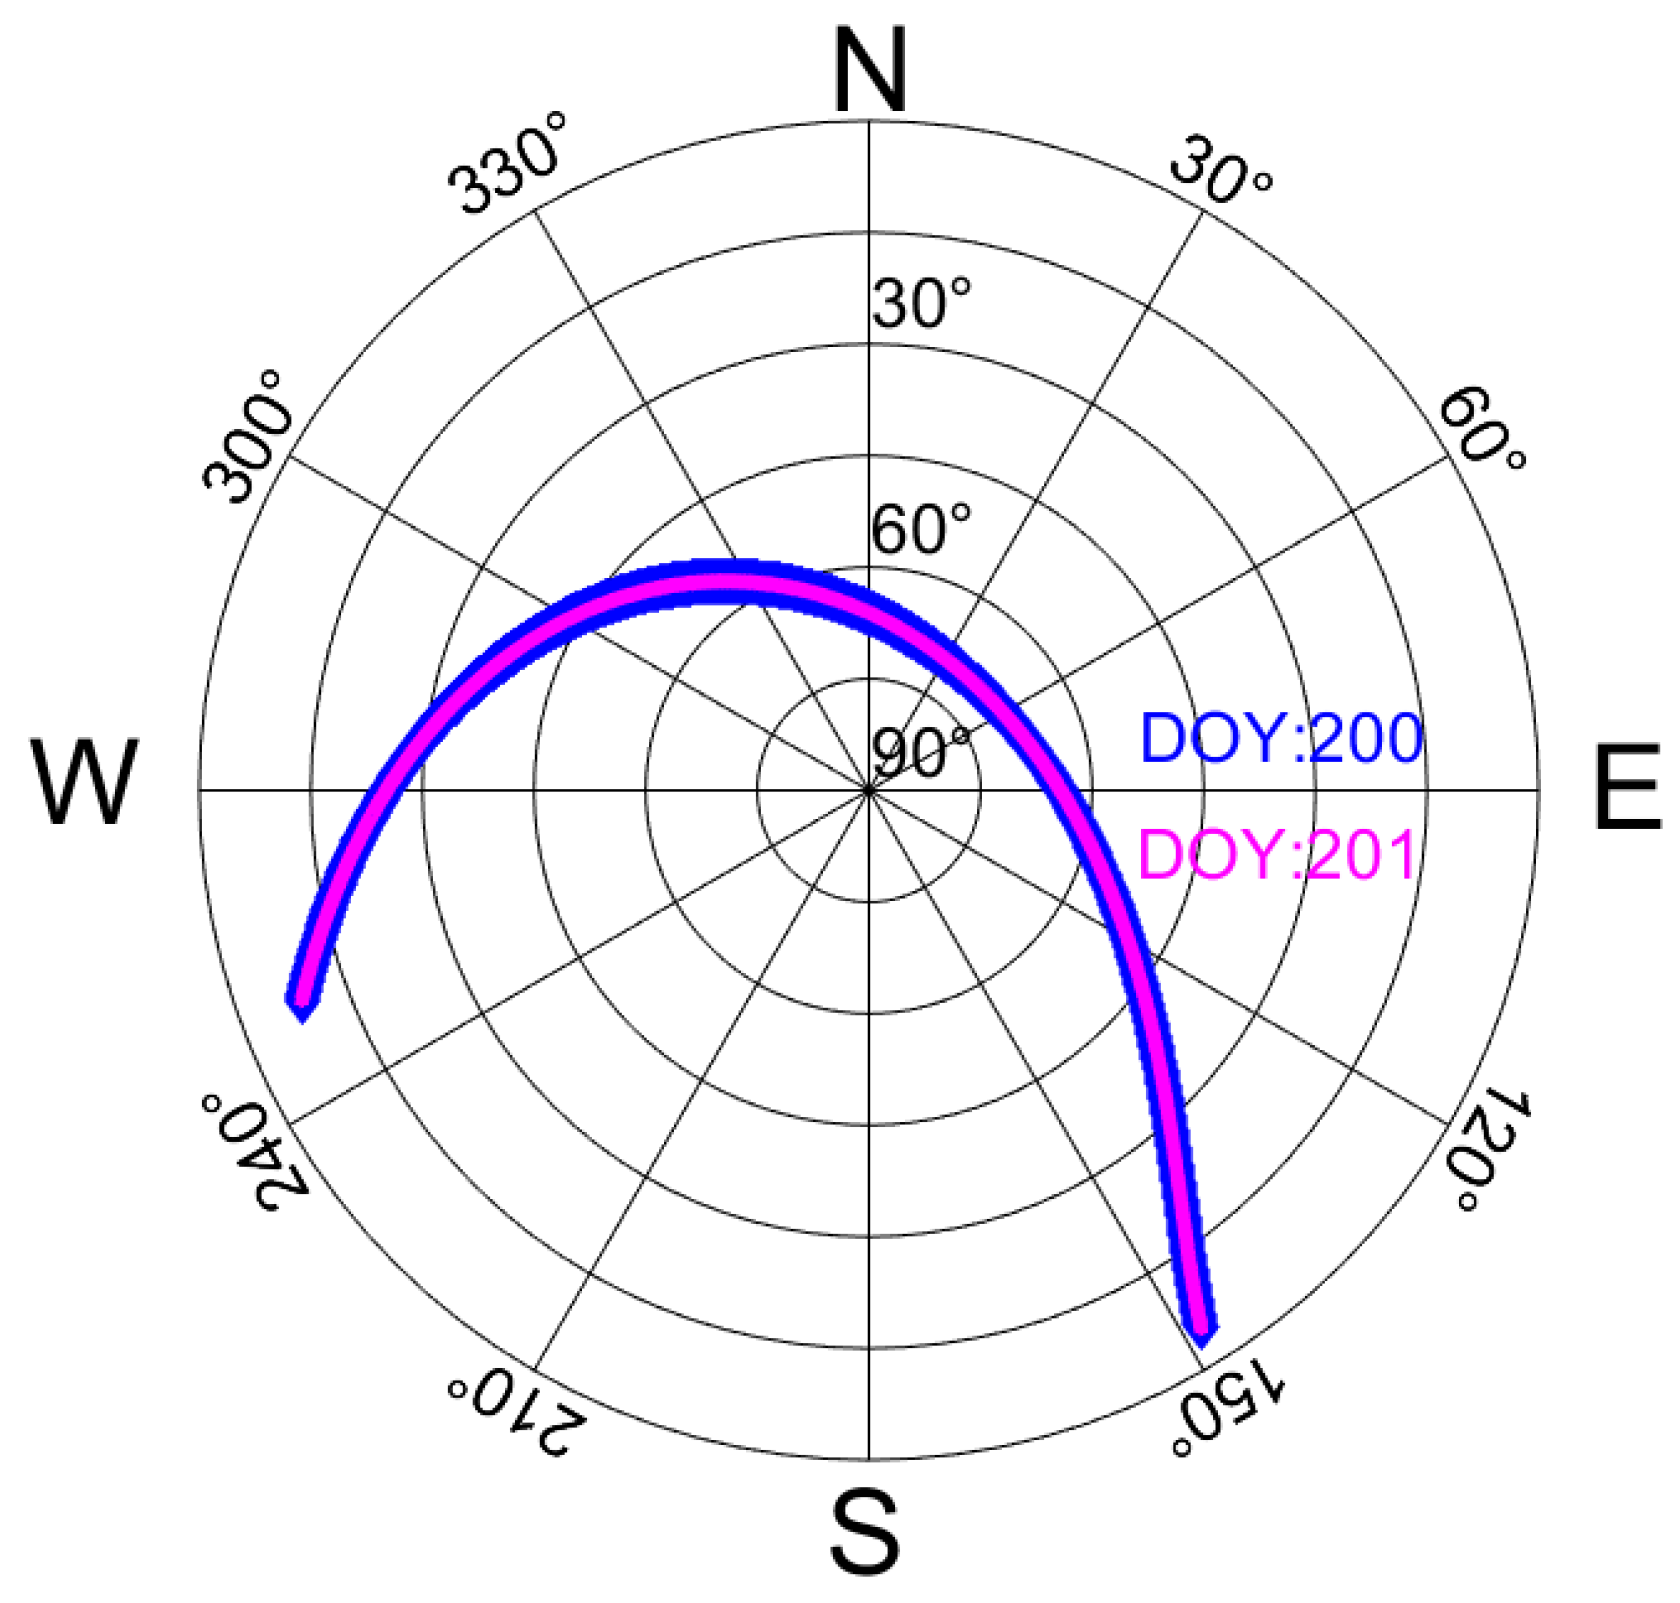
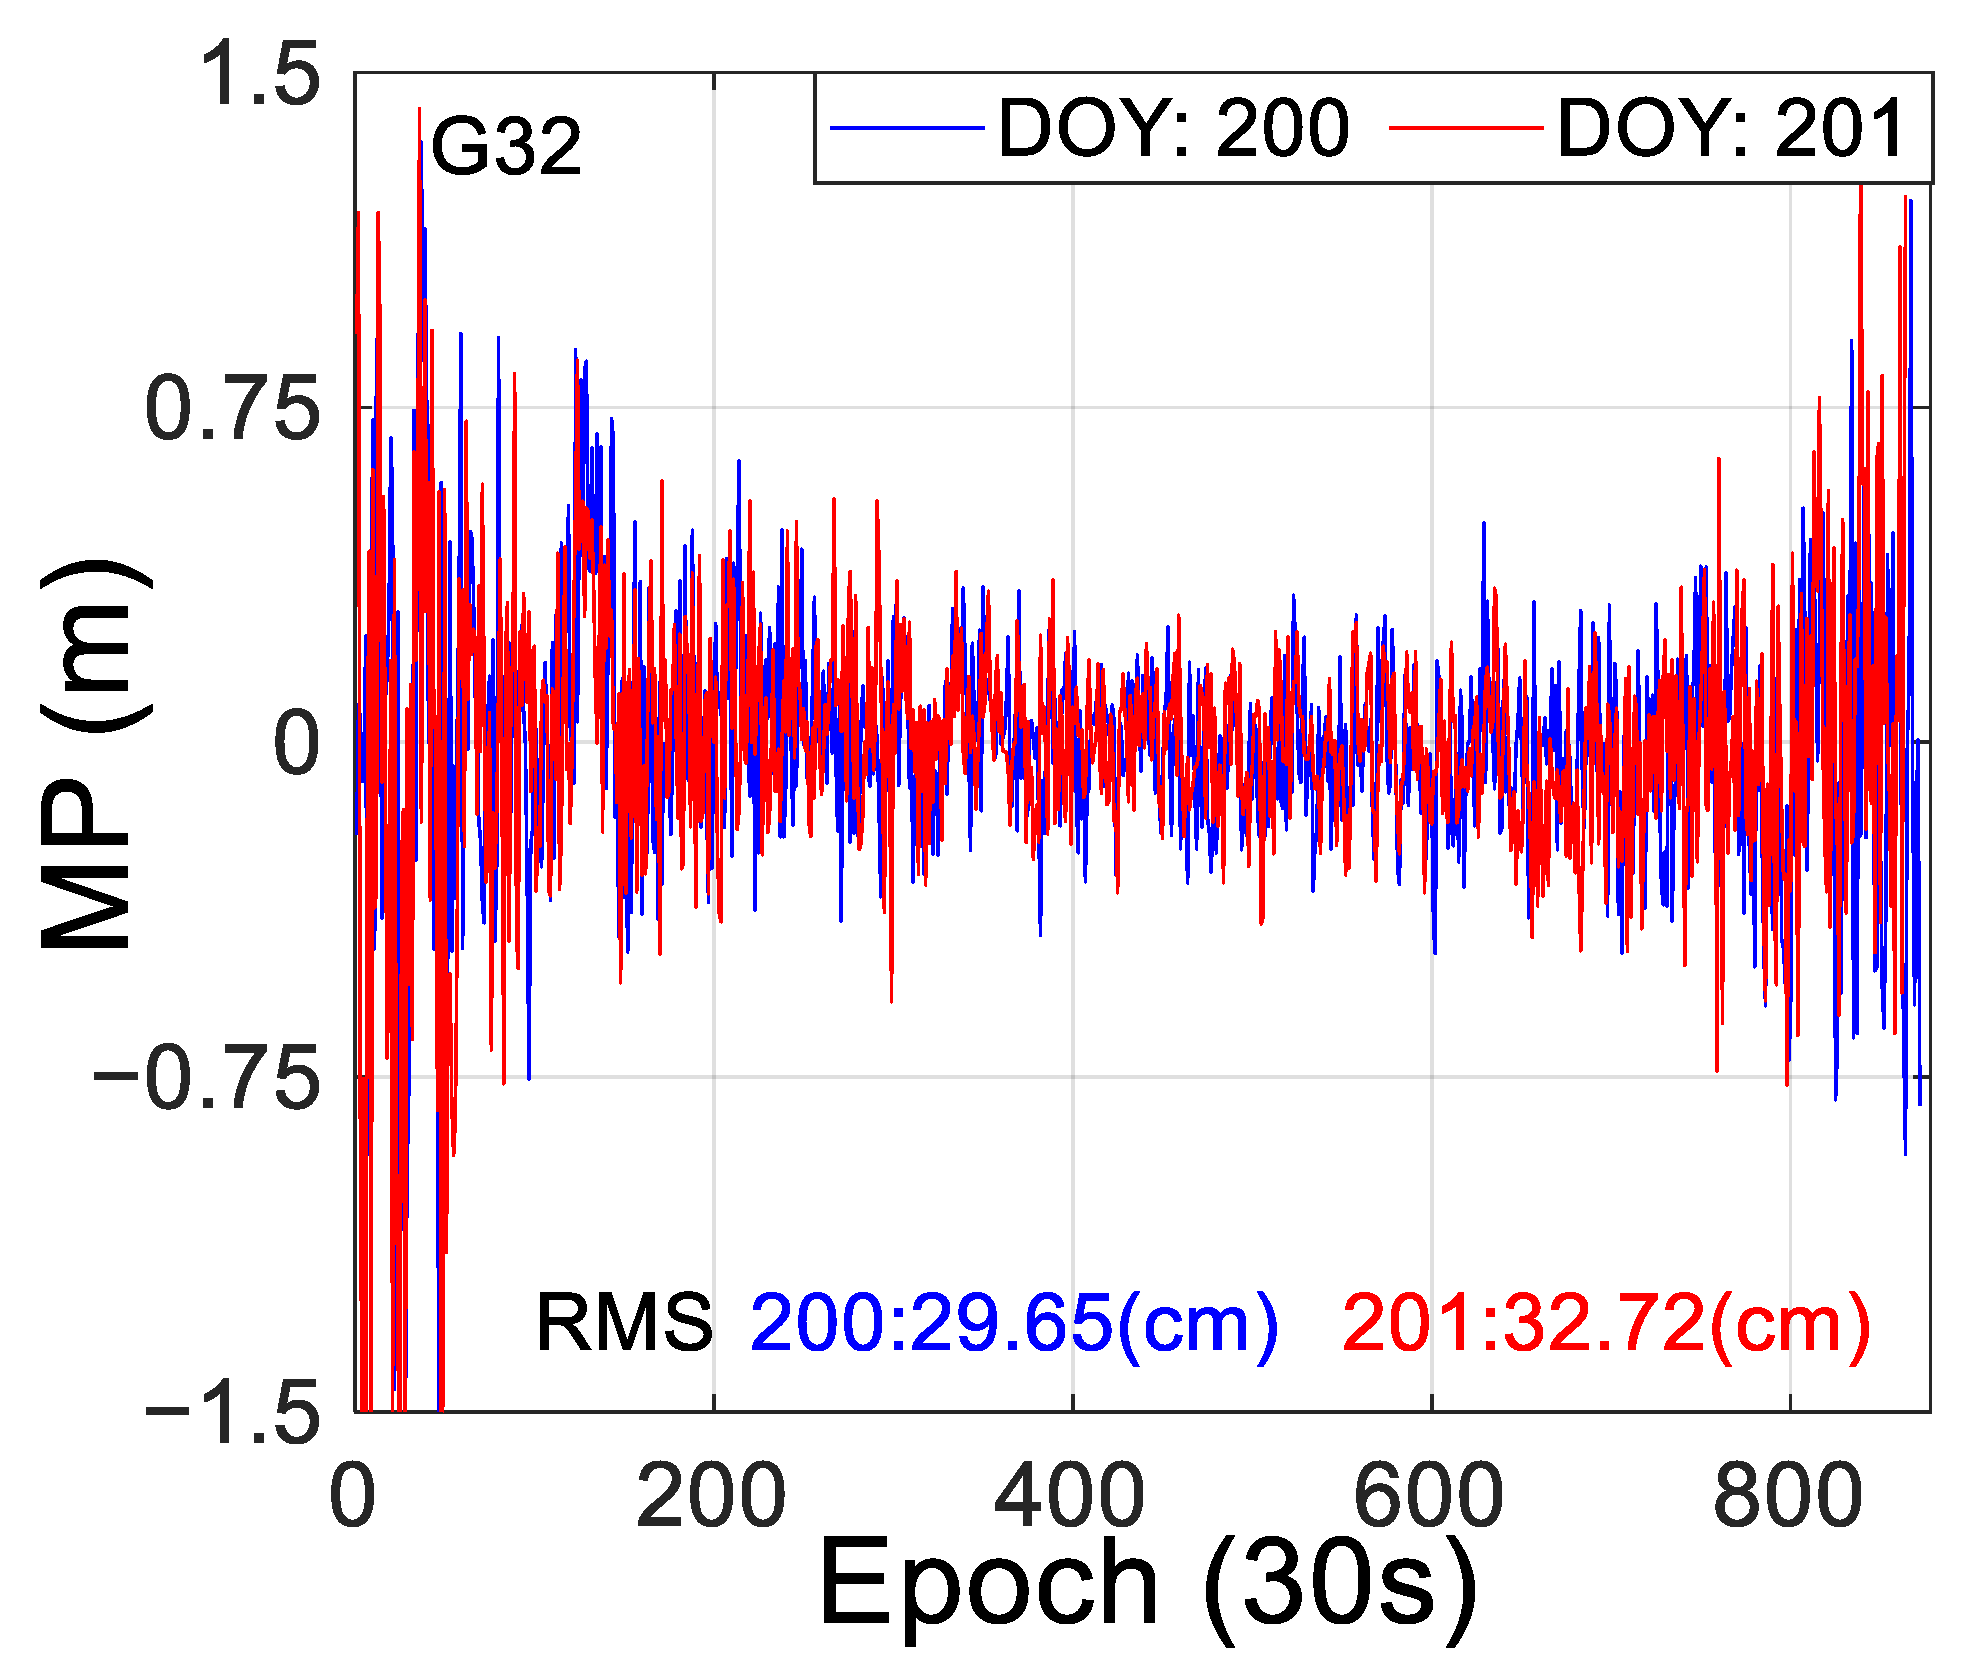
5. Influence of Floods on GPS MP Signals

Considering that the ground track repeat period of the GPS satellite is a sidereal day, data sets collected on the day before the flood can be used to compare the characteristics of the GPS MP signal. Figure 8 demonstrates the MP of G32 satellite L1 frequency before and after the flood. The red line denotes the MP of the G32 satellite on DOY:201, 2021, which the flood occurred in this day. The blue line denotes the MP of the G32 satellite on DOY:200, 2021, which used to compare the influence of floods on the MP. The RMS of MP residuals of these two days is presented on the bottom of Figure 8.
From Figure 8, it can be seen that the trend of the MP before and after the flood remains consistent as a whole. For example, both of these two days show a crest at epoch 160. This phenomenon also demonstrates the repeatability of GPS satellites for two adjacent days. Due to fluctuation, the MP of these two days is difficult to effectively distinguish in Figure 8. Therefore, the RMS of MP residual is presented to show that the MP during the flood is increased compared with the MP without the flood. Concretely, the RMS of MP increases from 29.65 cm to 32.72 cm. The RMS increase rate of the MP is approximately 10.35%, which indicates that the flood can largely affect the MP of GPS satellites.
In addition, to further analyze the influence of floods on the MP of GPS satellites, the RMS increase rate of all other satellites with an entire arc both on DOY:200 and DOY:201 is presented in Figure 9. It can be seen that the MP of these satellites increased to a certain degree compared with the non-flood scenarios. Considering the maximum increase rate of the G29 satellite, the RMS of the MP on DOY:201 increases approximately 17.85% compared with DOY:200. It should be noted that the RMS increase rate of some satellites is relatively small, such as with the G05 satellite, which is only 0.23%. The reason for this phenomenon should be related to the surrounding environment of the satellite ground track. Moreover, for all satellites in Figure 9, the average RMS increase rate is approximately 6.55%. Thus, based on the above analysis, it can be concluded that the MP of the GPS satellite can be affected by floods. The experimental results remain consistent with the theory analysis.

6. Influence of Floods on GPS, GLONASS, and BDS CNR

The two floods that occurred in Zhengzhou (DOY:201, 2021) and Xinxiang (DOY:203, 2021), China, are used to analyze the influence of flood on GPS, GLONASS, and BDS CNR. The GPS and GLONASS satellites were observed at Zhengzhou station, and the GPS and BDS satellite were observed at Xinxiang station. The sample rate of the Zhengzhou and Xinxiang data sets is 30 s and 1 s, respectively.

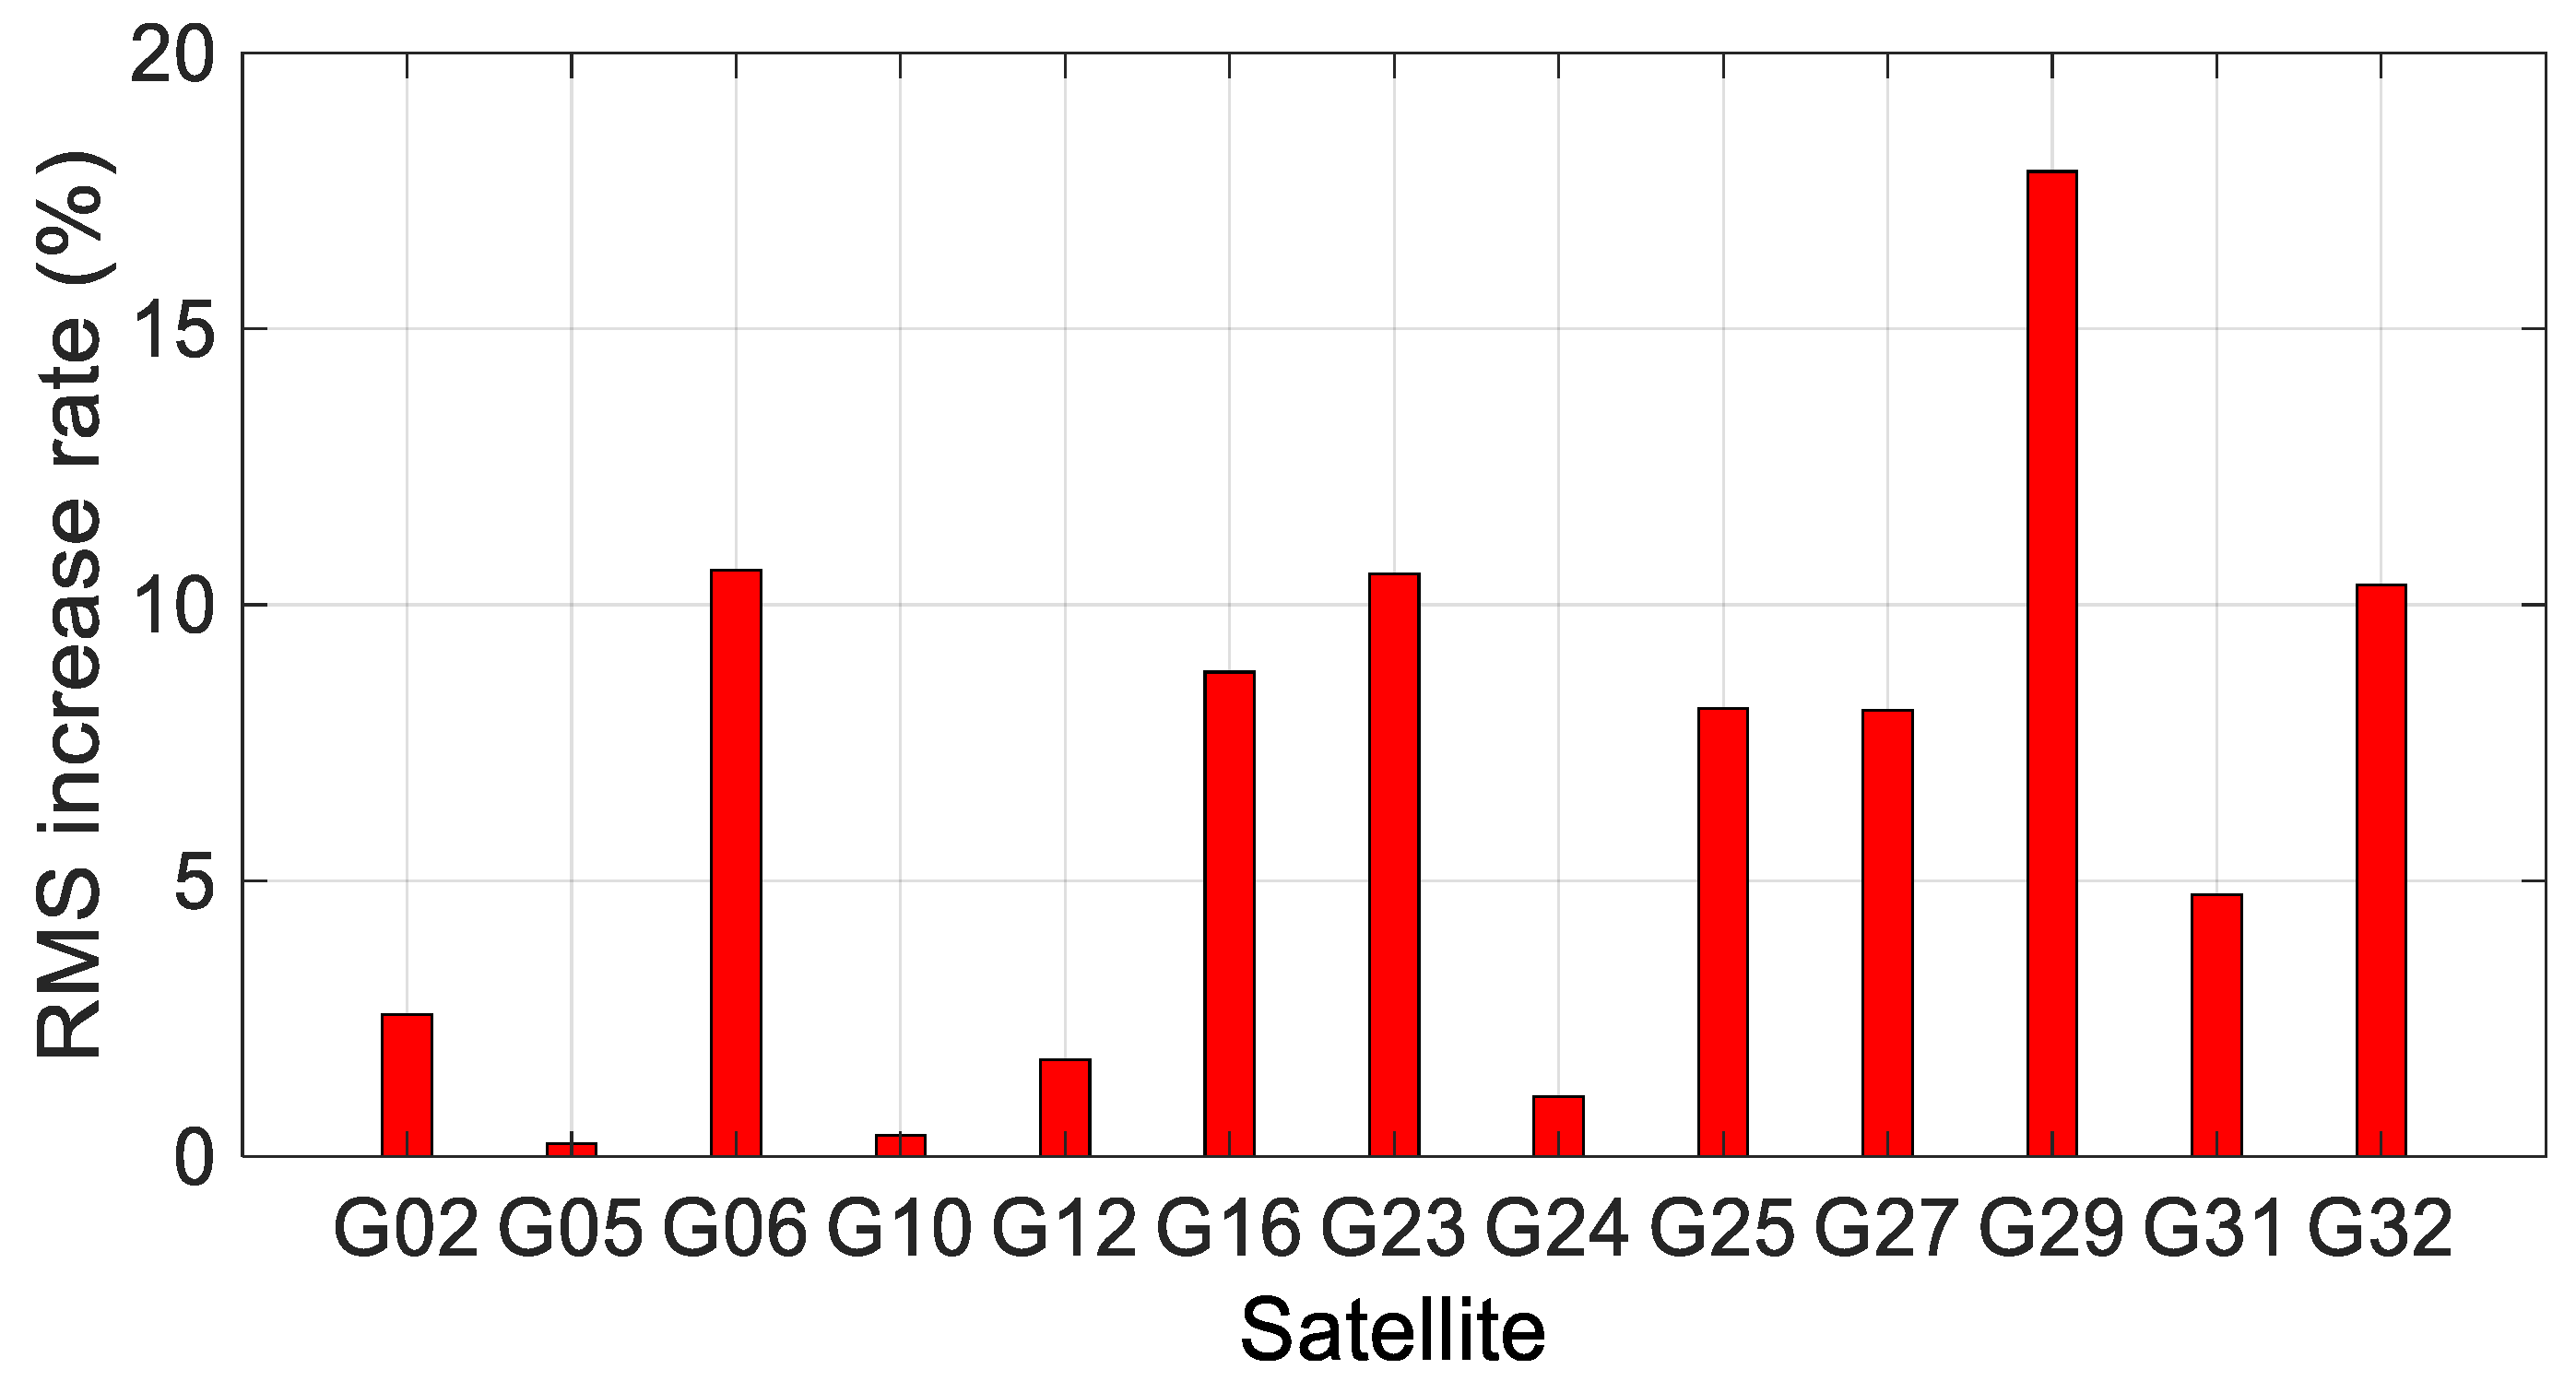
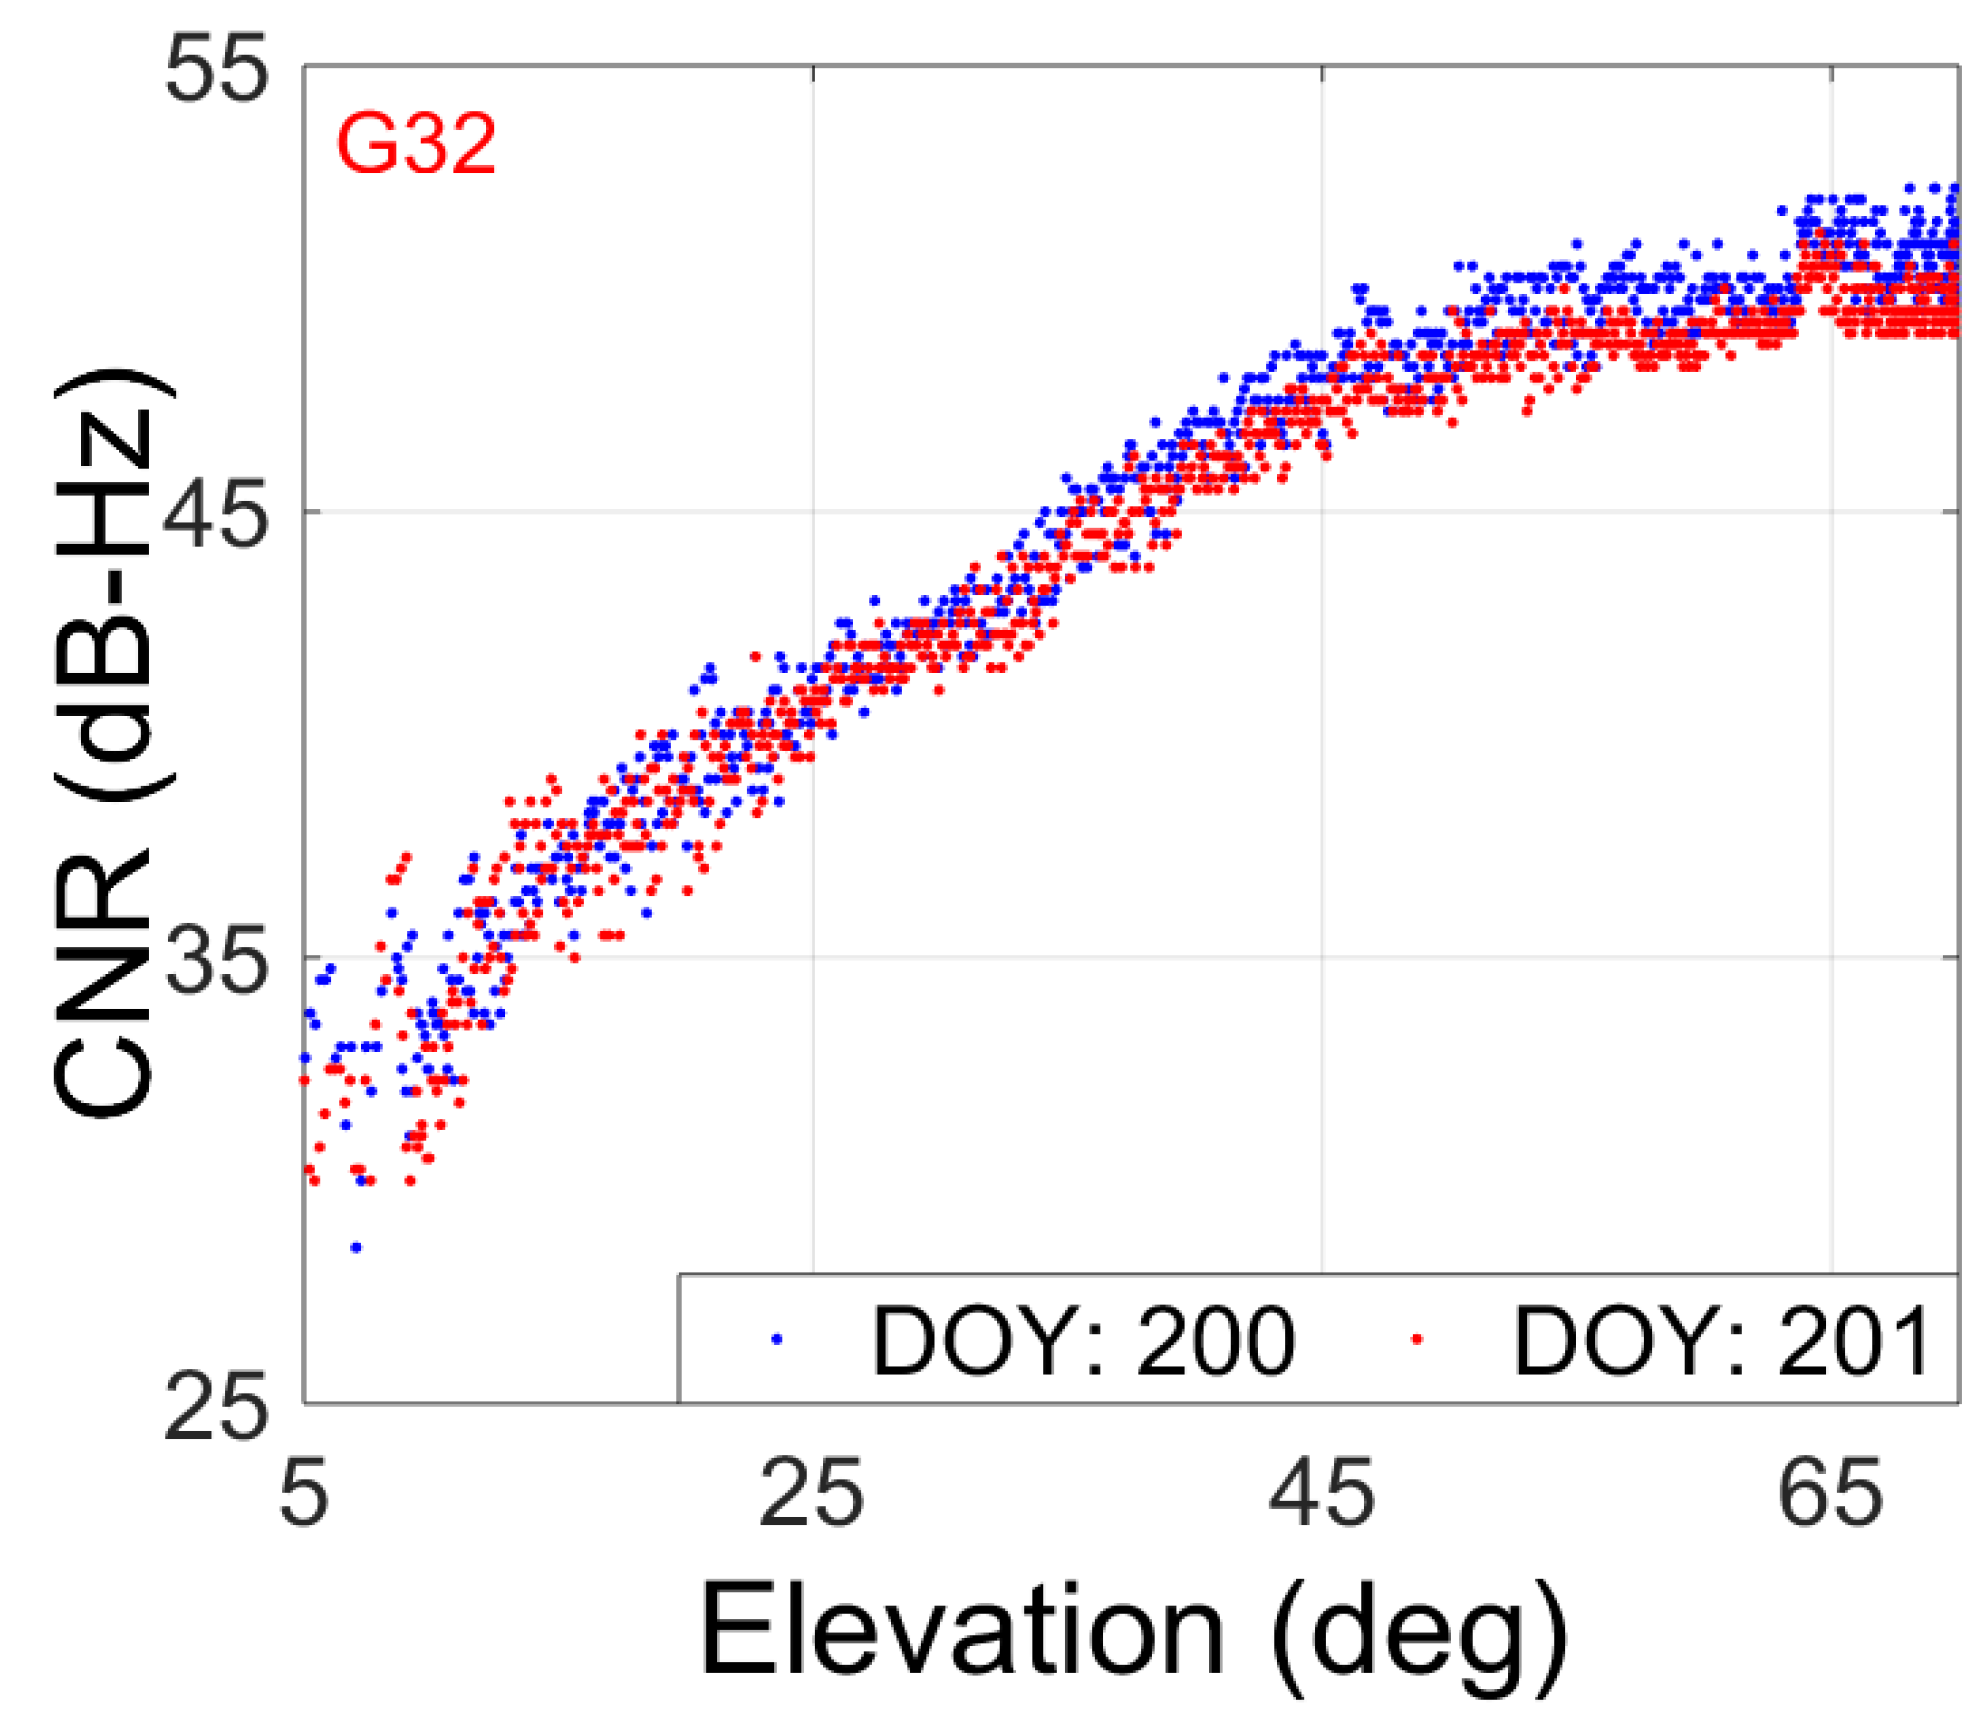
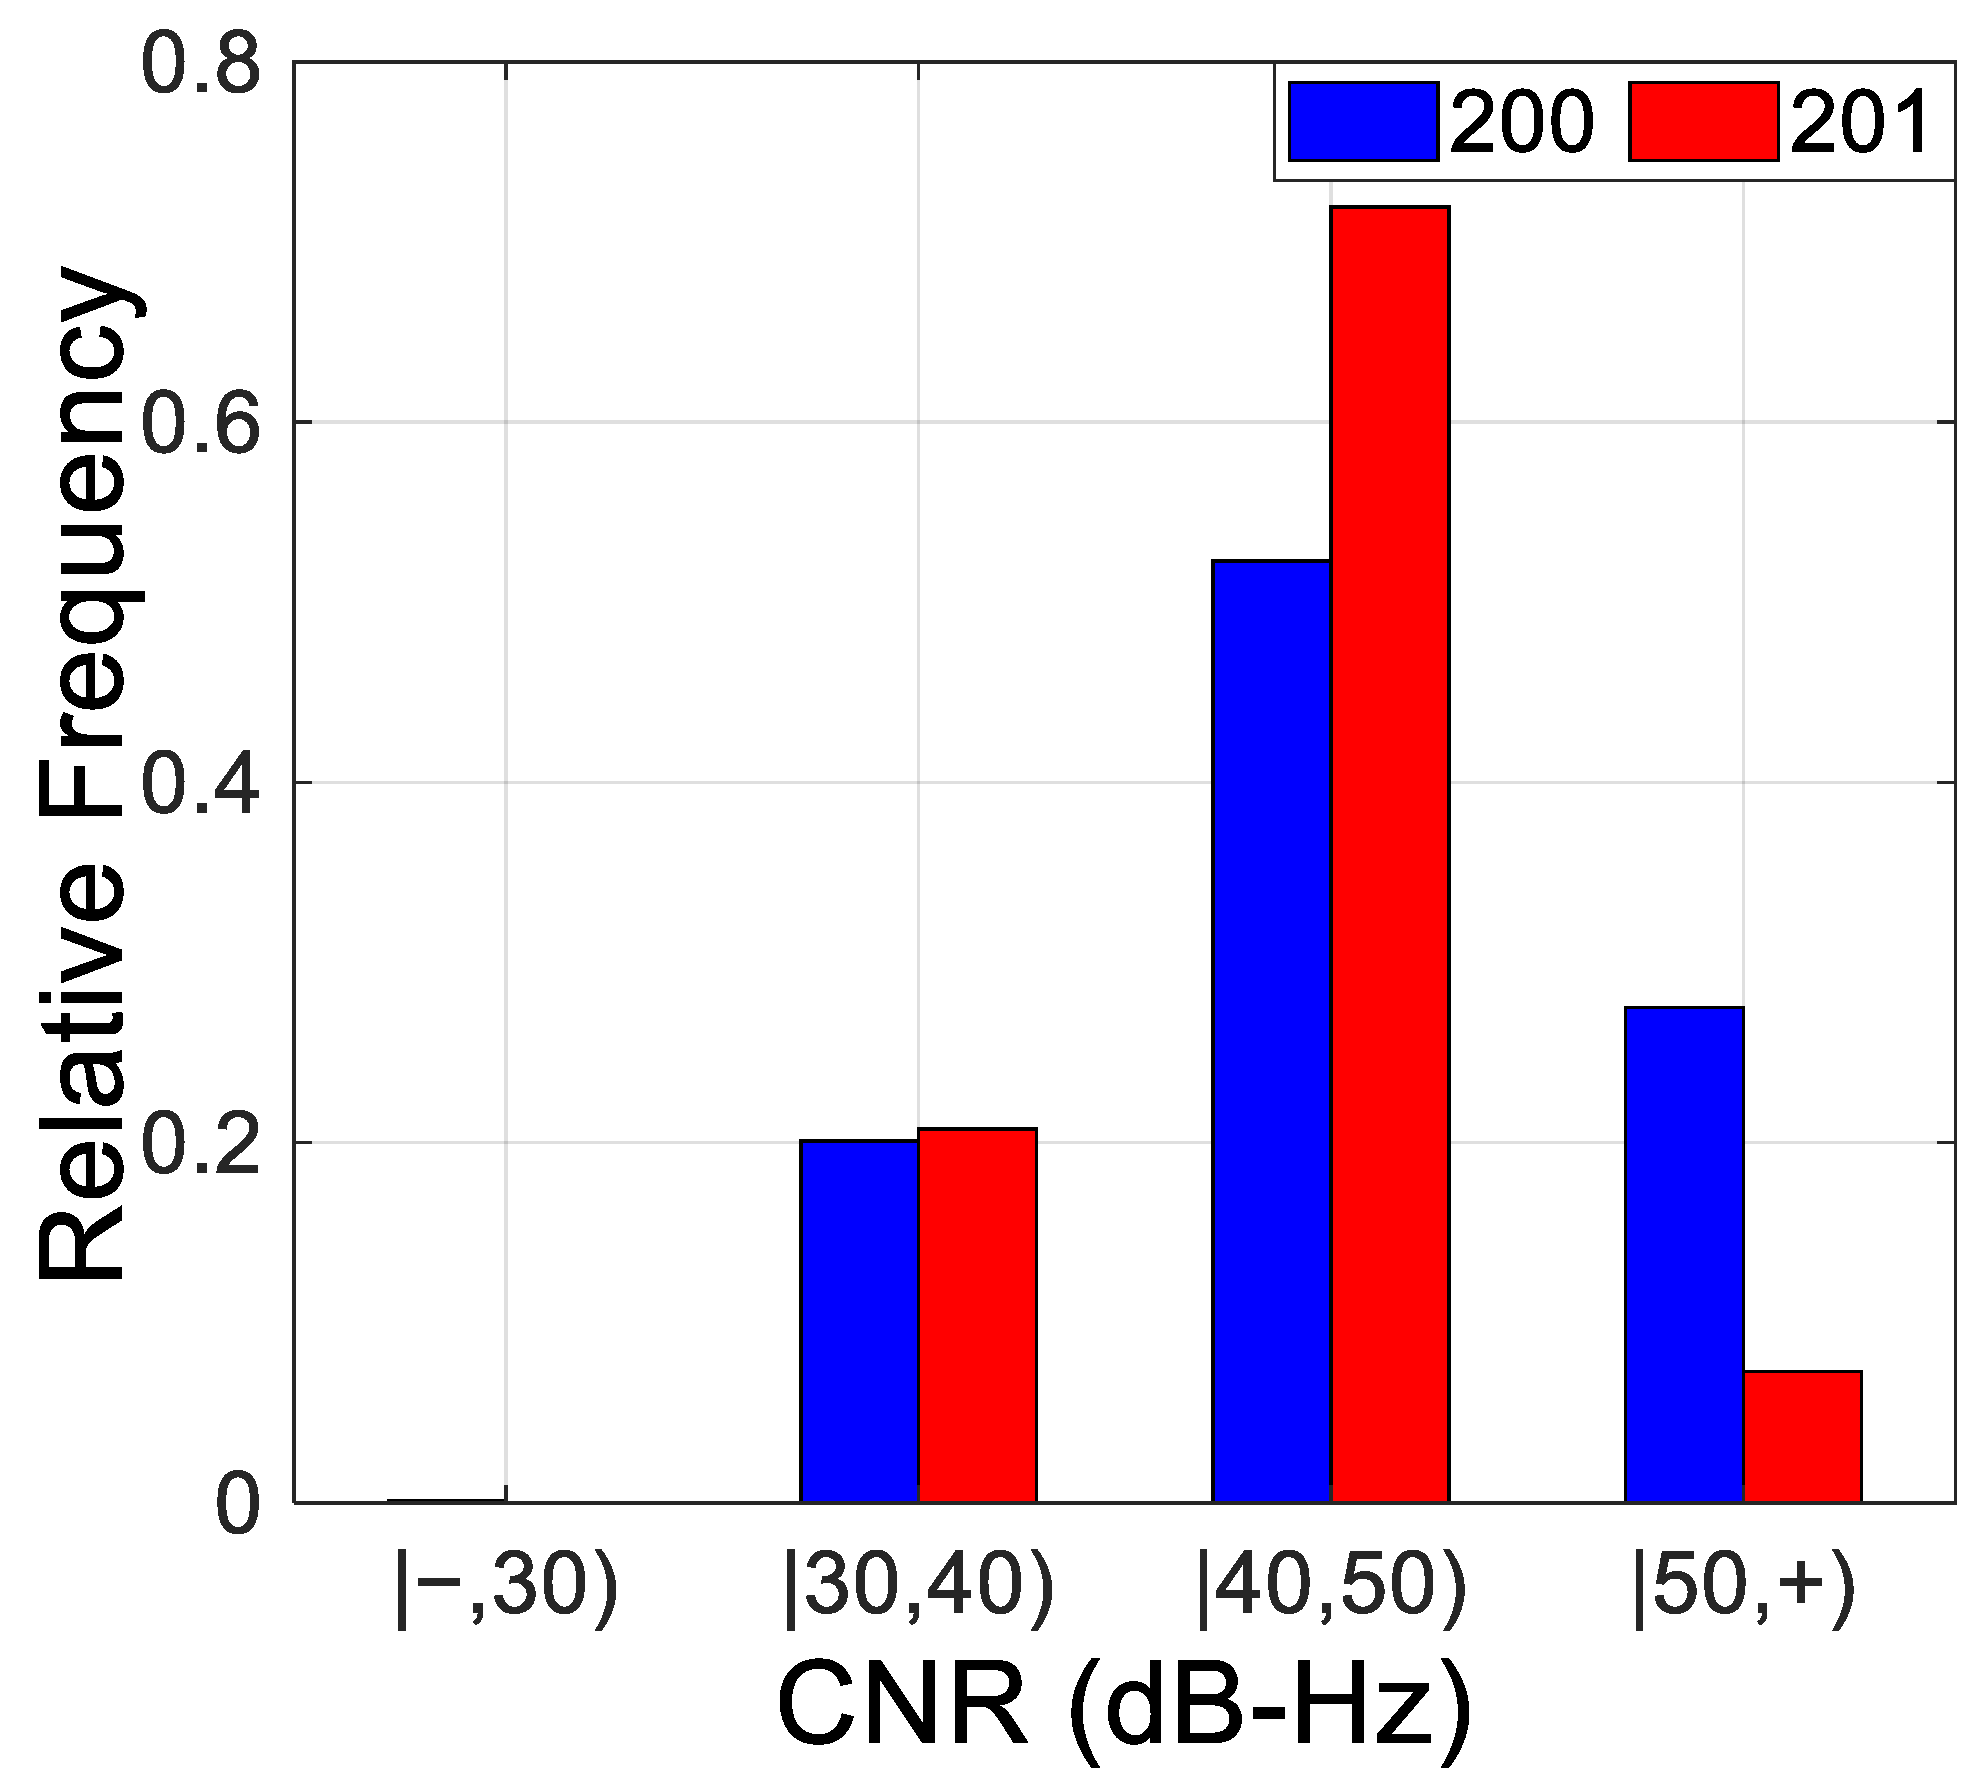
6.1. Influence of Floods on GPS with 30 s Data Set

Similarly, since the ground track repeat period of the GPS satellite is a sidereal day, the data set collected on the previous day before the flood can be used to compare the characteristics of the CNR. Figure 10 presented the CNR of the G32 satellite on DOY:200 (blue dots) and DOY:201 (red dots), 2021. DOY:200 is used to denote the characteristics of the CNR for a normal day, since there was no flood on DOY:200. In order to make the comparison result more intuitive, the satellite’s elevation is used as the horizontal axis. From Figure 10, it can be seen that the CNR decreases on DOY:201, which is represented by red dots. The decrease trend performs more seriously with an increasing elevation angle, especially when the elevation is larger than 50 deg. The maximum decrease in the CNR is approximately 5 dB-Hz at an elevation between 5° and 90°. Compared with DOY:200, the percentage of decrease in CNR ranges from 9.09% (compared with 55 dB-Hz) to 16.67% (compared with 30 dB-Hz). However, this is the maximum decrease, but not the average. In terms of the average, the percentage would be much lower, which is only 1.36%. This phenomenon is mainly because the CNR mainly decreases when the elevation greater than 50°, but the reduction is not significant at a low elevation. The reason is that the multipath effect is serious at low elevations both on the days with floods and days without floods. However, at the larger elevation, the multipath effect performs more seriously during a flood compared with a day without a flood. Thus, the difference of the CNR at larger elevations during a flood will more obvious it would be at lower elevations.
To further illustrate the difference in CNR between DOY:200 and DOY:201, the histogram of the CNR and relative frequency are presented in Figure 11. The CNR is divided into four categories. It can be found that the distribution of the CNR on DOY:200 and DOY:201 is different from each other. The CNR larger than 50 dB-Hz on DOY:200 is more than that of on DOY:201. The maximum difference is approximately 0.20. The total number of G32 satellite epochs is 878. Thus, the difference between them is about 176 epochs, which is approximately 20.05% of the total epochs. This is a remarkable phenomenon. Considering that the relationship between the CNR and elevation creates a positive correlation, this result is consistent with Figure 10. In addition, it should be noted that it is not only the G32 satellite that is affected during a flood, but also other satellites are influenced during a flood. More information can be found in [25].

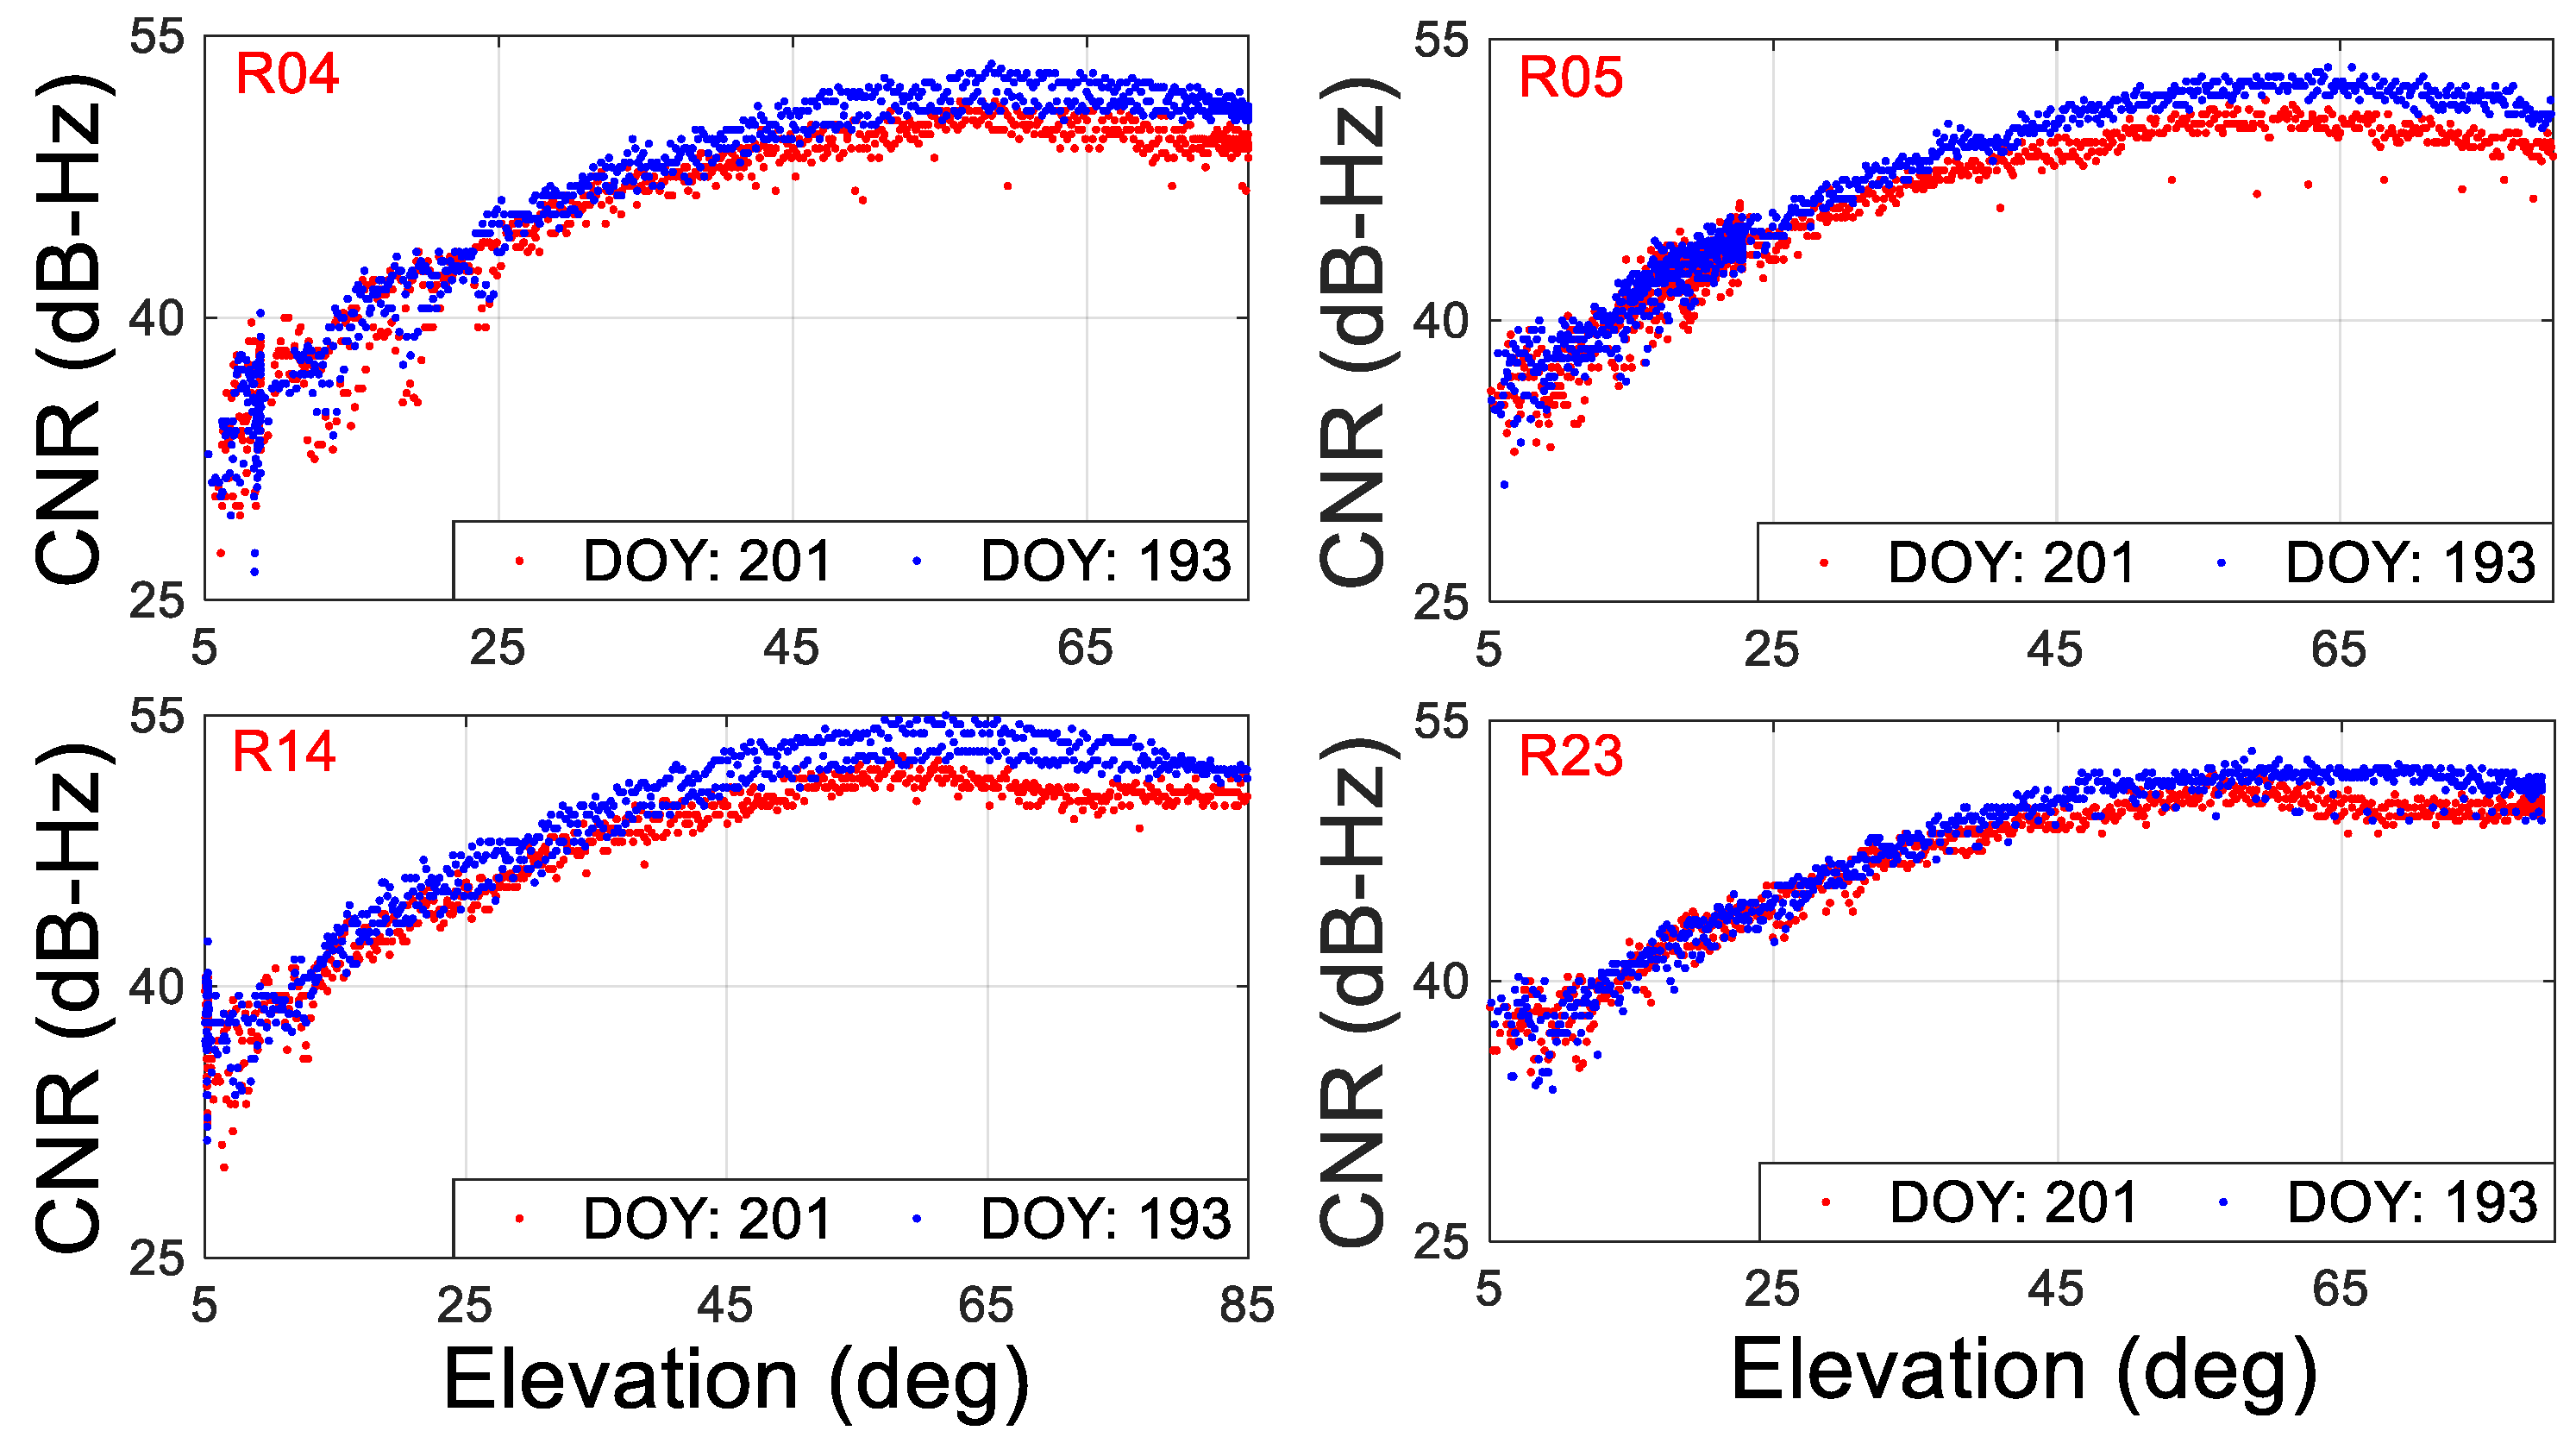
6.2. Influence of Floods on GLONASS with 30 s Data Set

Comparison results of the CNR on GLONASS satellites (R04, R05, R14, and R23) L1 frequency between normal weather conditions without a flood (DOY:193) and with a flood (DOY:201) is presented in Figure 12. The blue dots denote the CNR collected on DOY:193 without a flood, and the red dots denote the CNR collected on DOY:201 with a flood. It can be seen that the CNR on DOY:193 is larger than that of on DOY:201, especially when the elevation was greater than 45 deg. The maximum decrease can reach 7 dB-Hz for the R14 satellite, and the average of decrease is approximately 3 dB-Hz. This phenomenon is consistent with the GPS satellite, in which the CNR during the flood day is shown to be lower than without the flood day, especially when the elevation is high. It should be noted that this phenomenon not only appeared on these four satellites and the L1 frequency, but could also be found on other satellites and the L2 frequency.
In addition, compared to these four satellites, it can be found that the starting elevation of CNR reduction performs differently in the two cases in question. For example, the CNR of the R05 satellite shows a downward trend at an elevation of 25 deg. However, the deceasing trend starts at an elevation of nearly 50 deg for the R23 satellite. Moreover, for the R05 and R14 satellites, the CNR on DOY:201 also decreases slightly when the satellite was at a low elevation. By contrast, R04 and R23 did not show this phenomenon. The above phenomena may be caused by the ground track of the satellite, but the specific reasons need to be further researched in the future.

6.3. Influence of Floods on GPS with 1 s Data Set

To further analyze the influence of floods on the GPS satellite, the flood that appeared in Xinxiang on DOY:203, 2021, is also used, and the sample rate of data set is 1 s. As introduced before, the ground track repeat period of the GPS satellite is a sidereal day. Thus, the data set collected on the day before the flood can be used to compare the characteristics of the CNR. However, DOY:200 (no flood) is used to compare with the DOY:203 (with flood) in this experiment instead of DOY:202. The reason for choosing DOY:200 for comparison is that there was localized flooding on DOY:201 and DOY:202, which could have affected the accuracy of the comparison results.
Figure 13 presents the comparison results of DOY:200 and DOY:203. The blue dots denote the CNR collected on DOY:200 (no flood), and the red dots denote the CNR collected on DOY:203 (with flood). The green line is the satellite’s elevation, which can demonstrate the relationship between the time series of the CNR and the elevation. From Figure 13, it can be seen that the CNR decreases on DOY:203 compared with DOY:200 at an elevation larger than 60 deg. When the elevation angle is close to 90 deg, the amplitude of the CNR dropped to approximately 5 dB-Hz. Moreover, the amplitude of the CNR on DOY:203 also decreases to between 1.5 × 10⁴ and 2.0 × 10⁴ epochs to a certain degree. Thus, on the basis of the above analysis, it can be concluded that the influence of floods on the CNR of the GPS satellite with a 1 s data set can be observed, especially when the elevation is high. These results are consistent with the data set where the sample rate is 30 s.
In addition, it can be found that the CNR is seen as slightly larger than DOY:200 in some epochs, such as between 18,000 and 20,000 epochs. The amplitude of the CNR on DOY:203 fluctuates more seriously than that of on DOY:200. These phenomena could have occurred for two reasons; one reason is that the surrounding environment of the receiver is covered with corn, which may introduce more of a multipath effect. The other reason is that the receiver used in this experiment is a low-cost receiver, and the performance of signal tracking may perform more fluctuations under a multipath environment than in a normal environment.

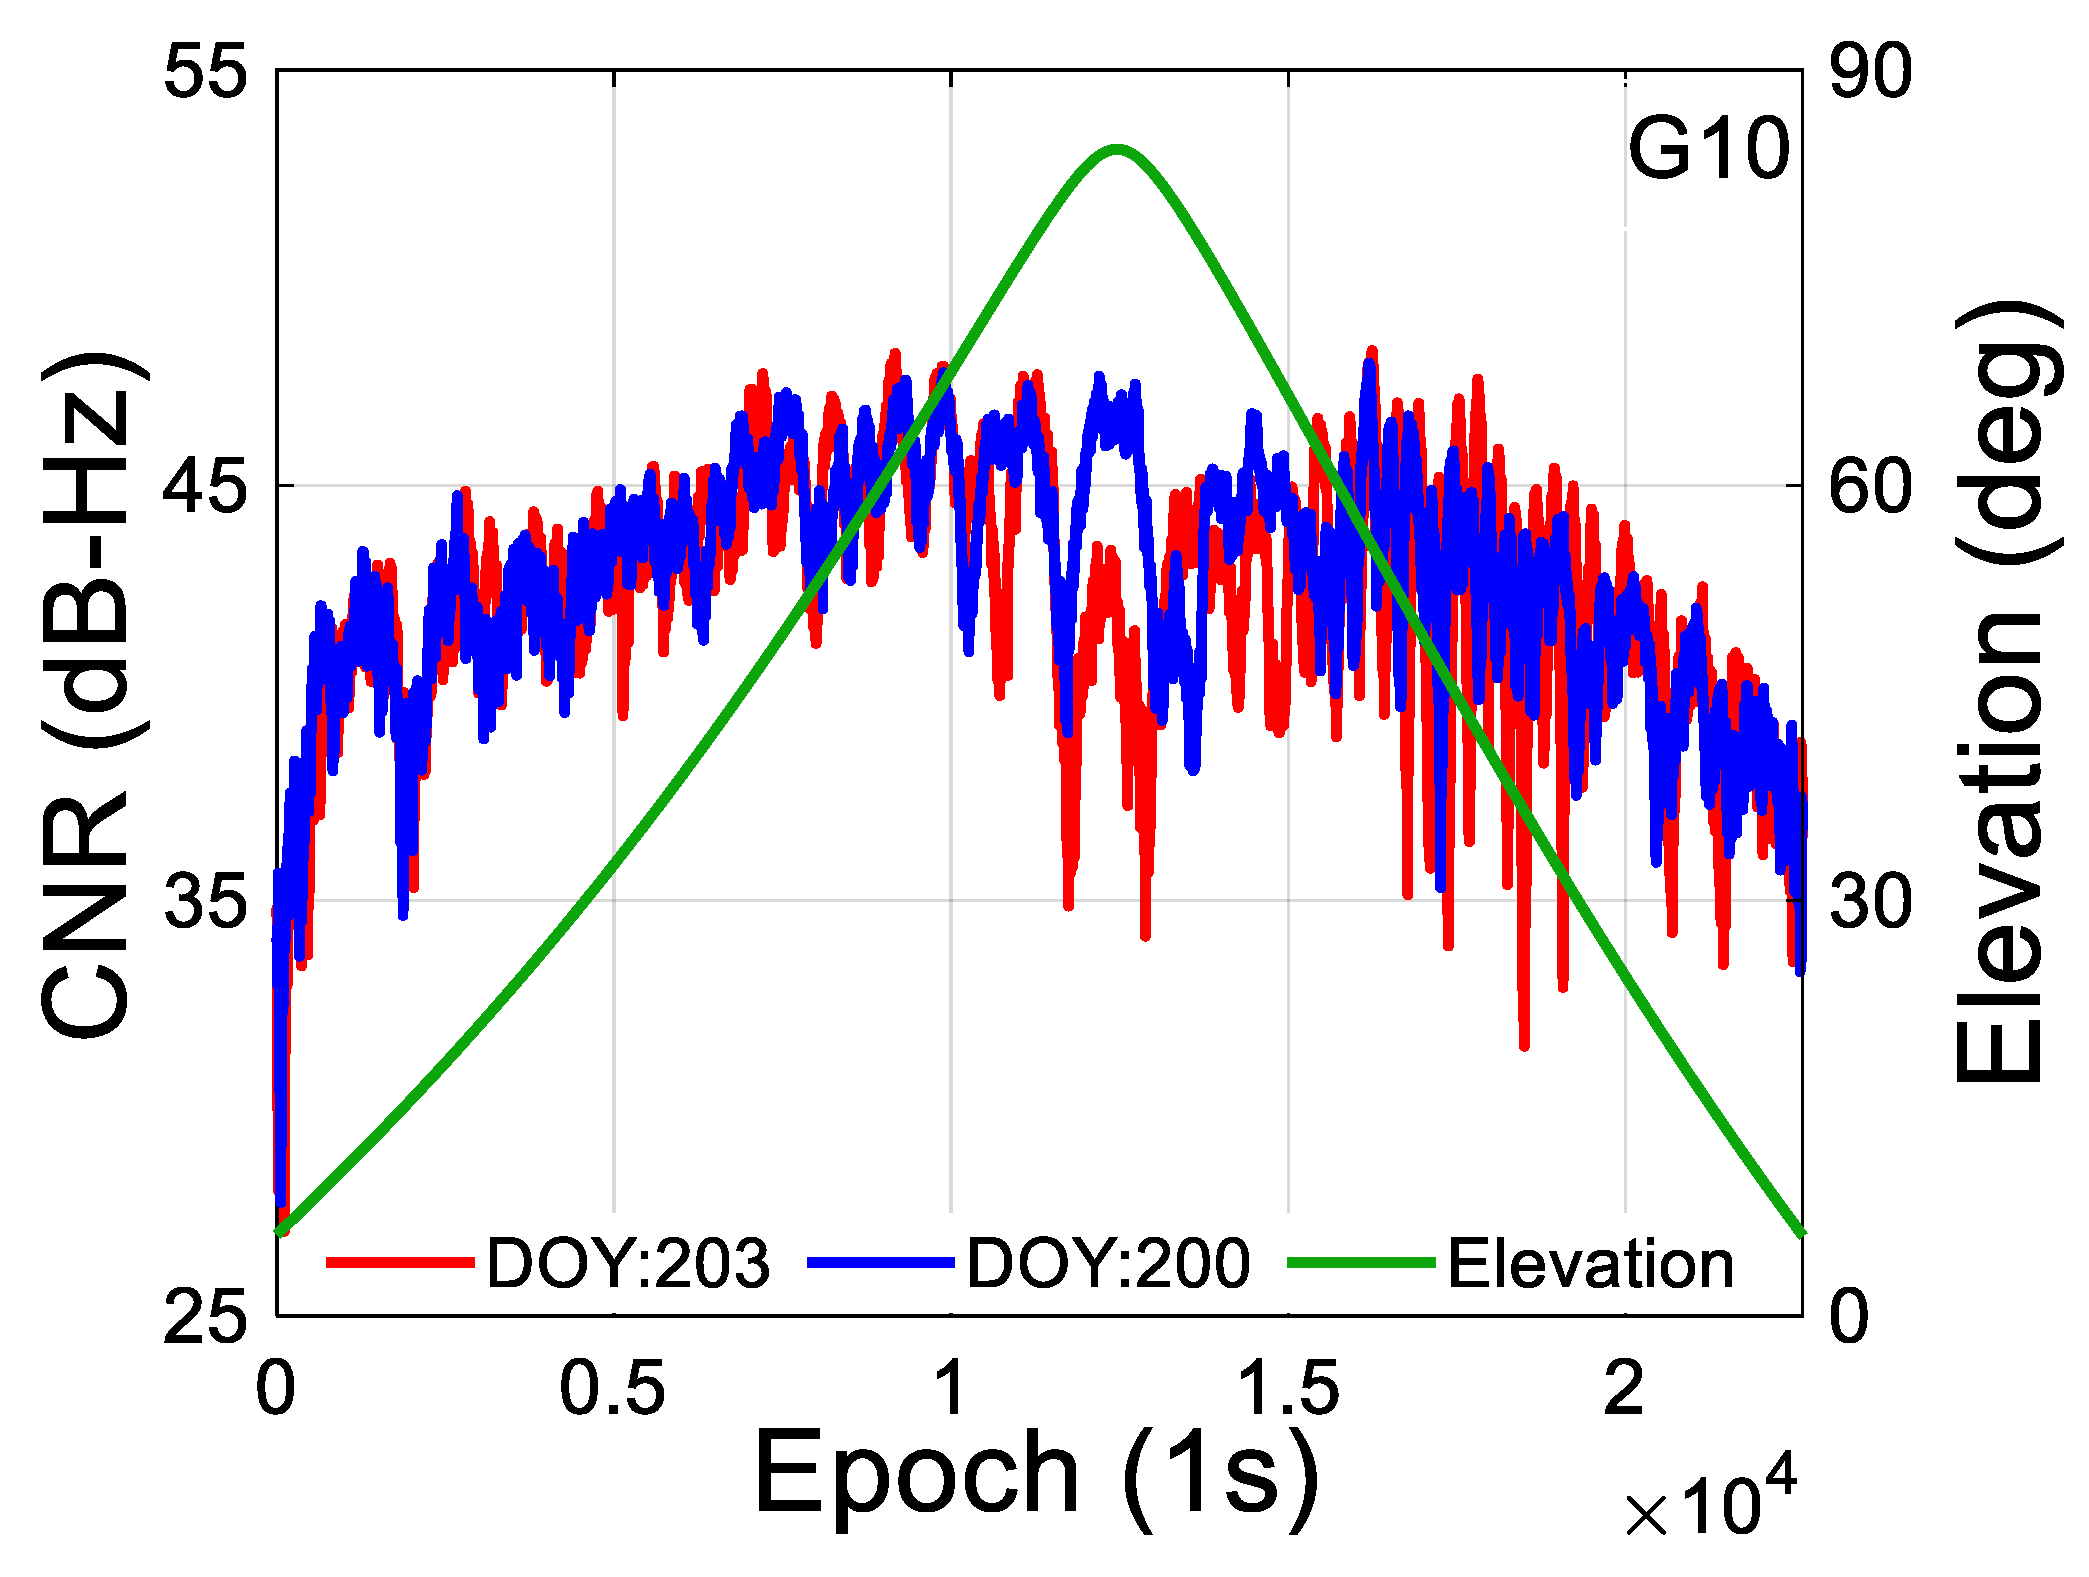
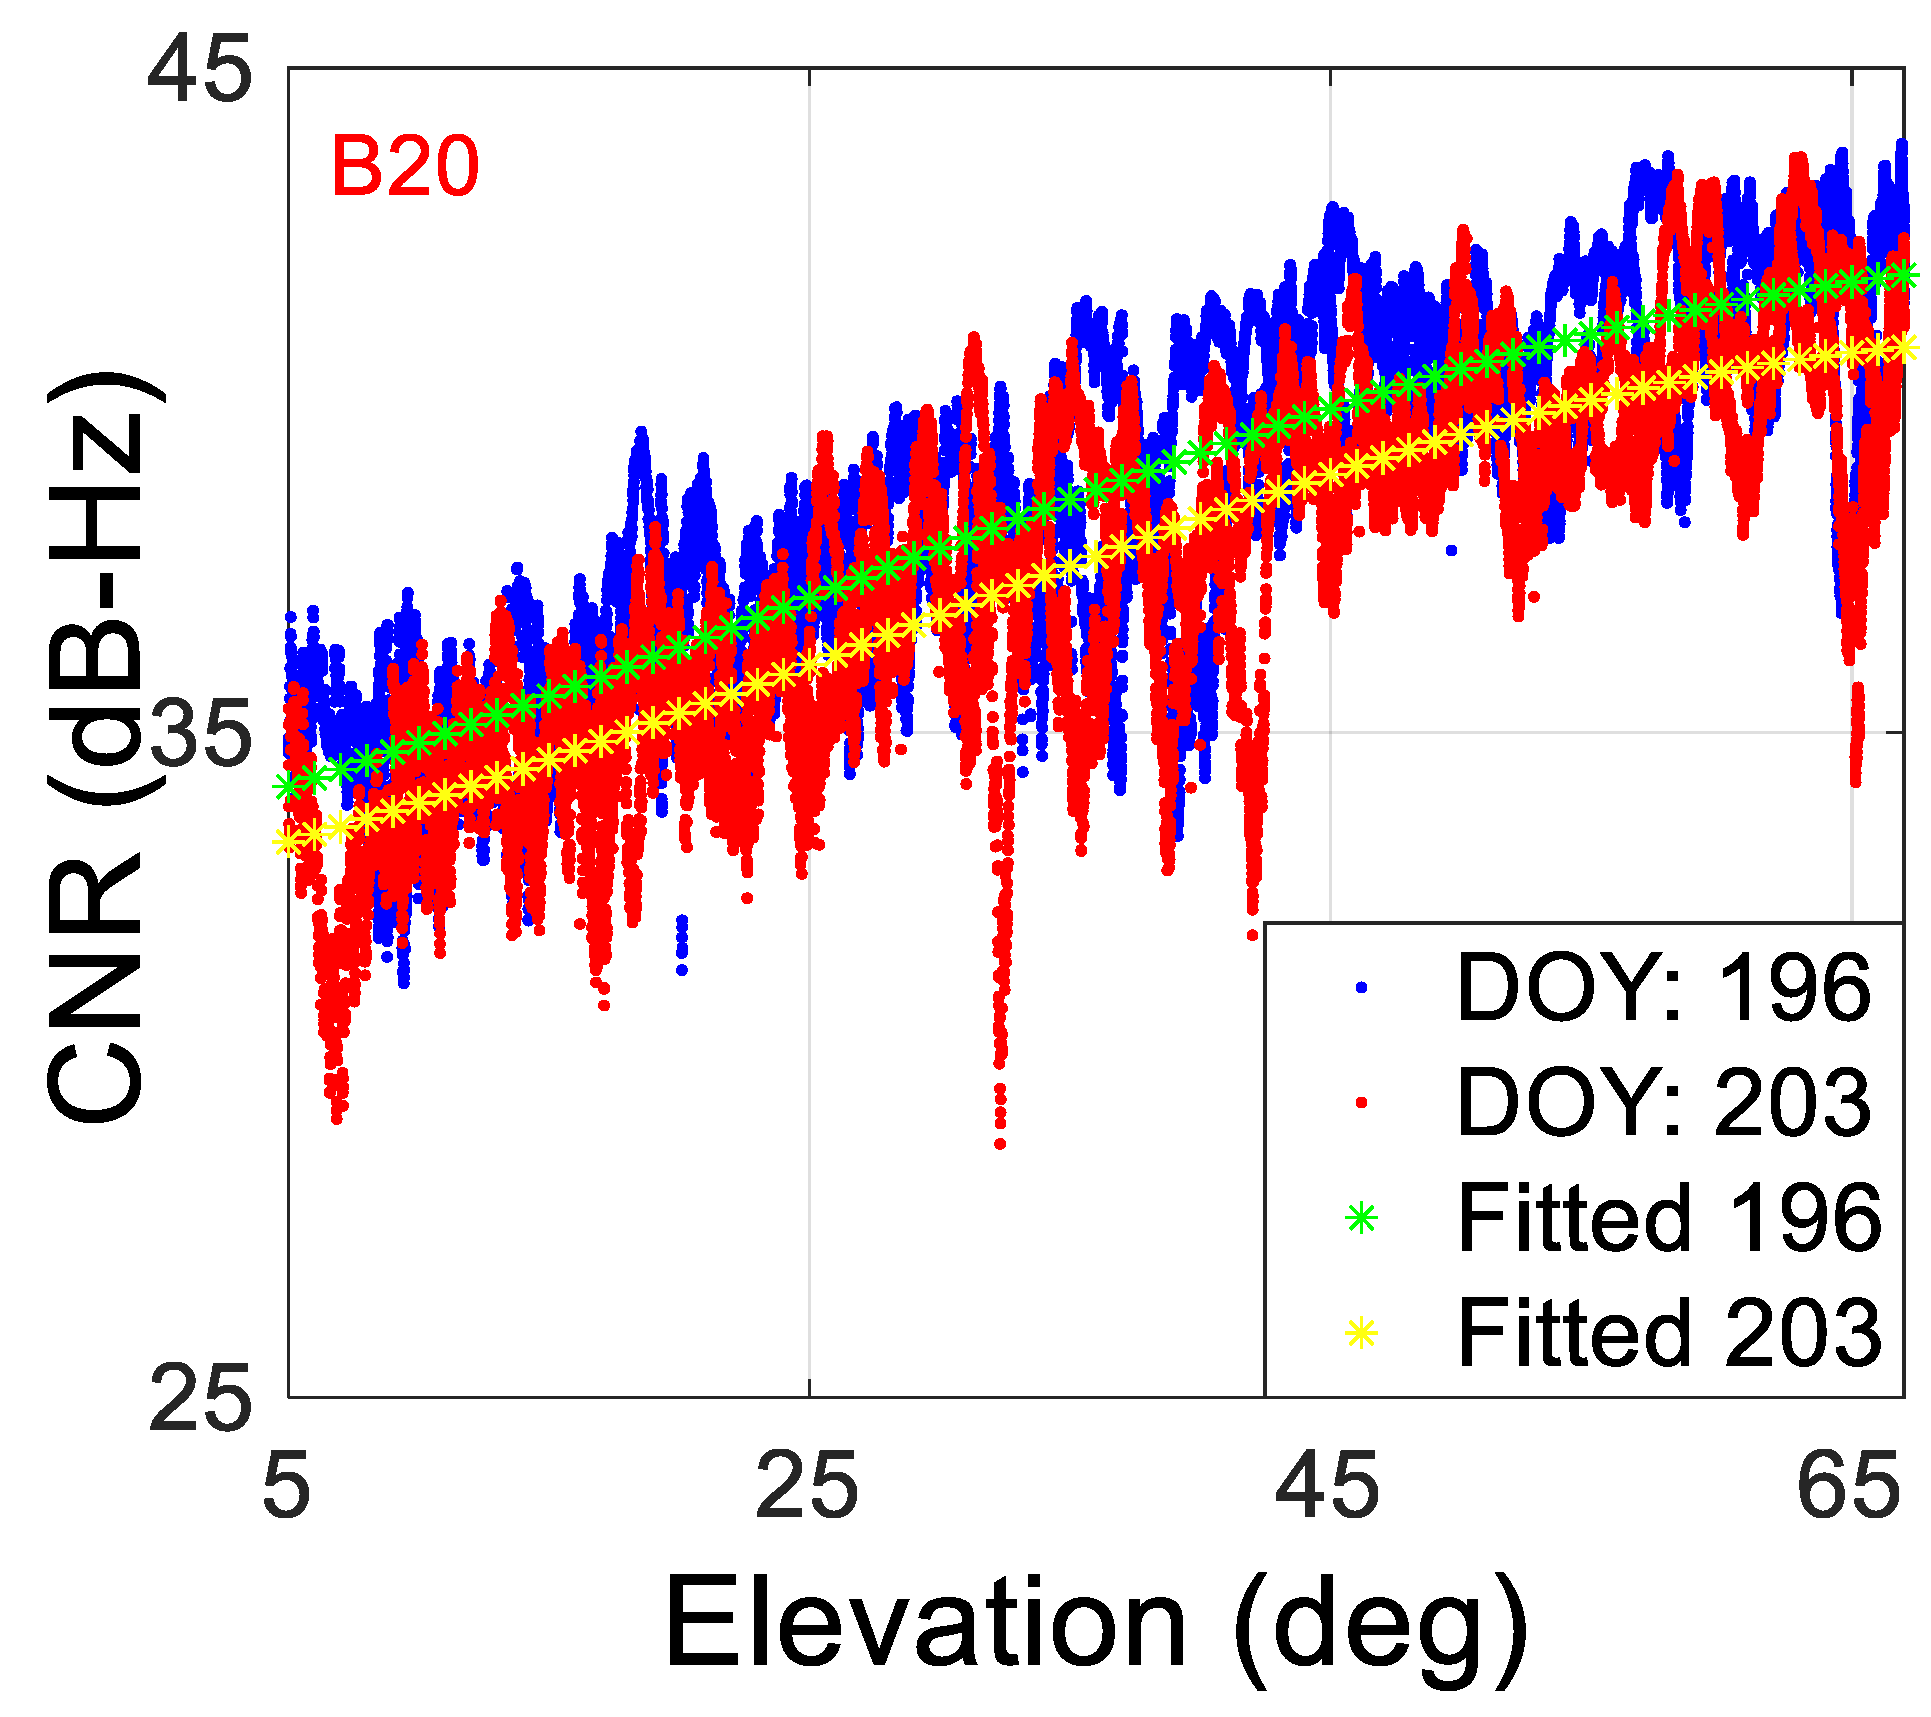
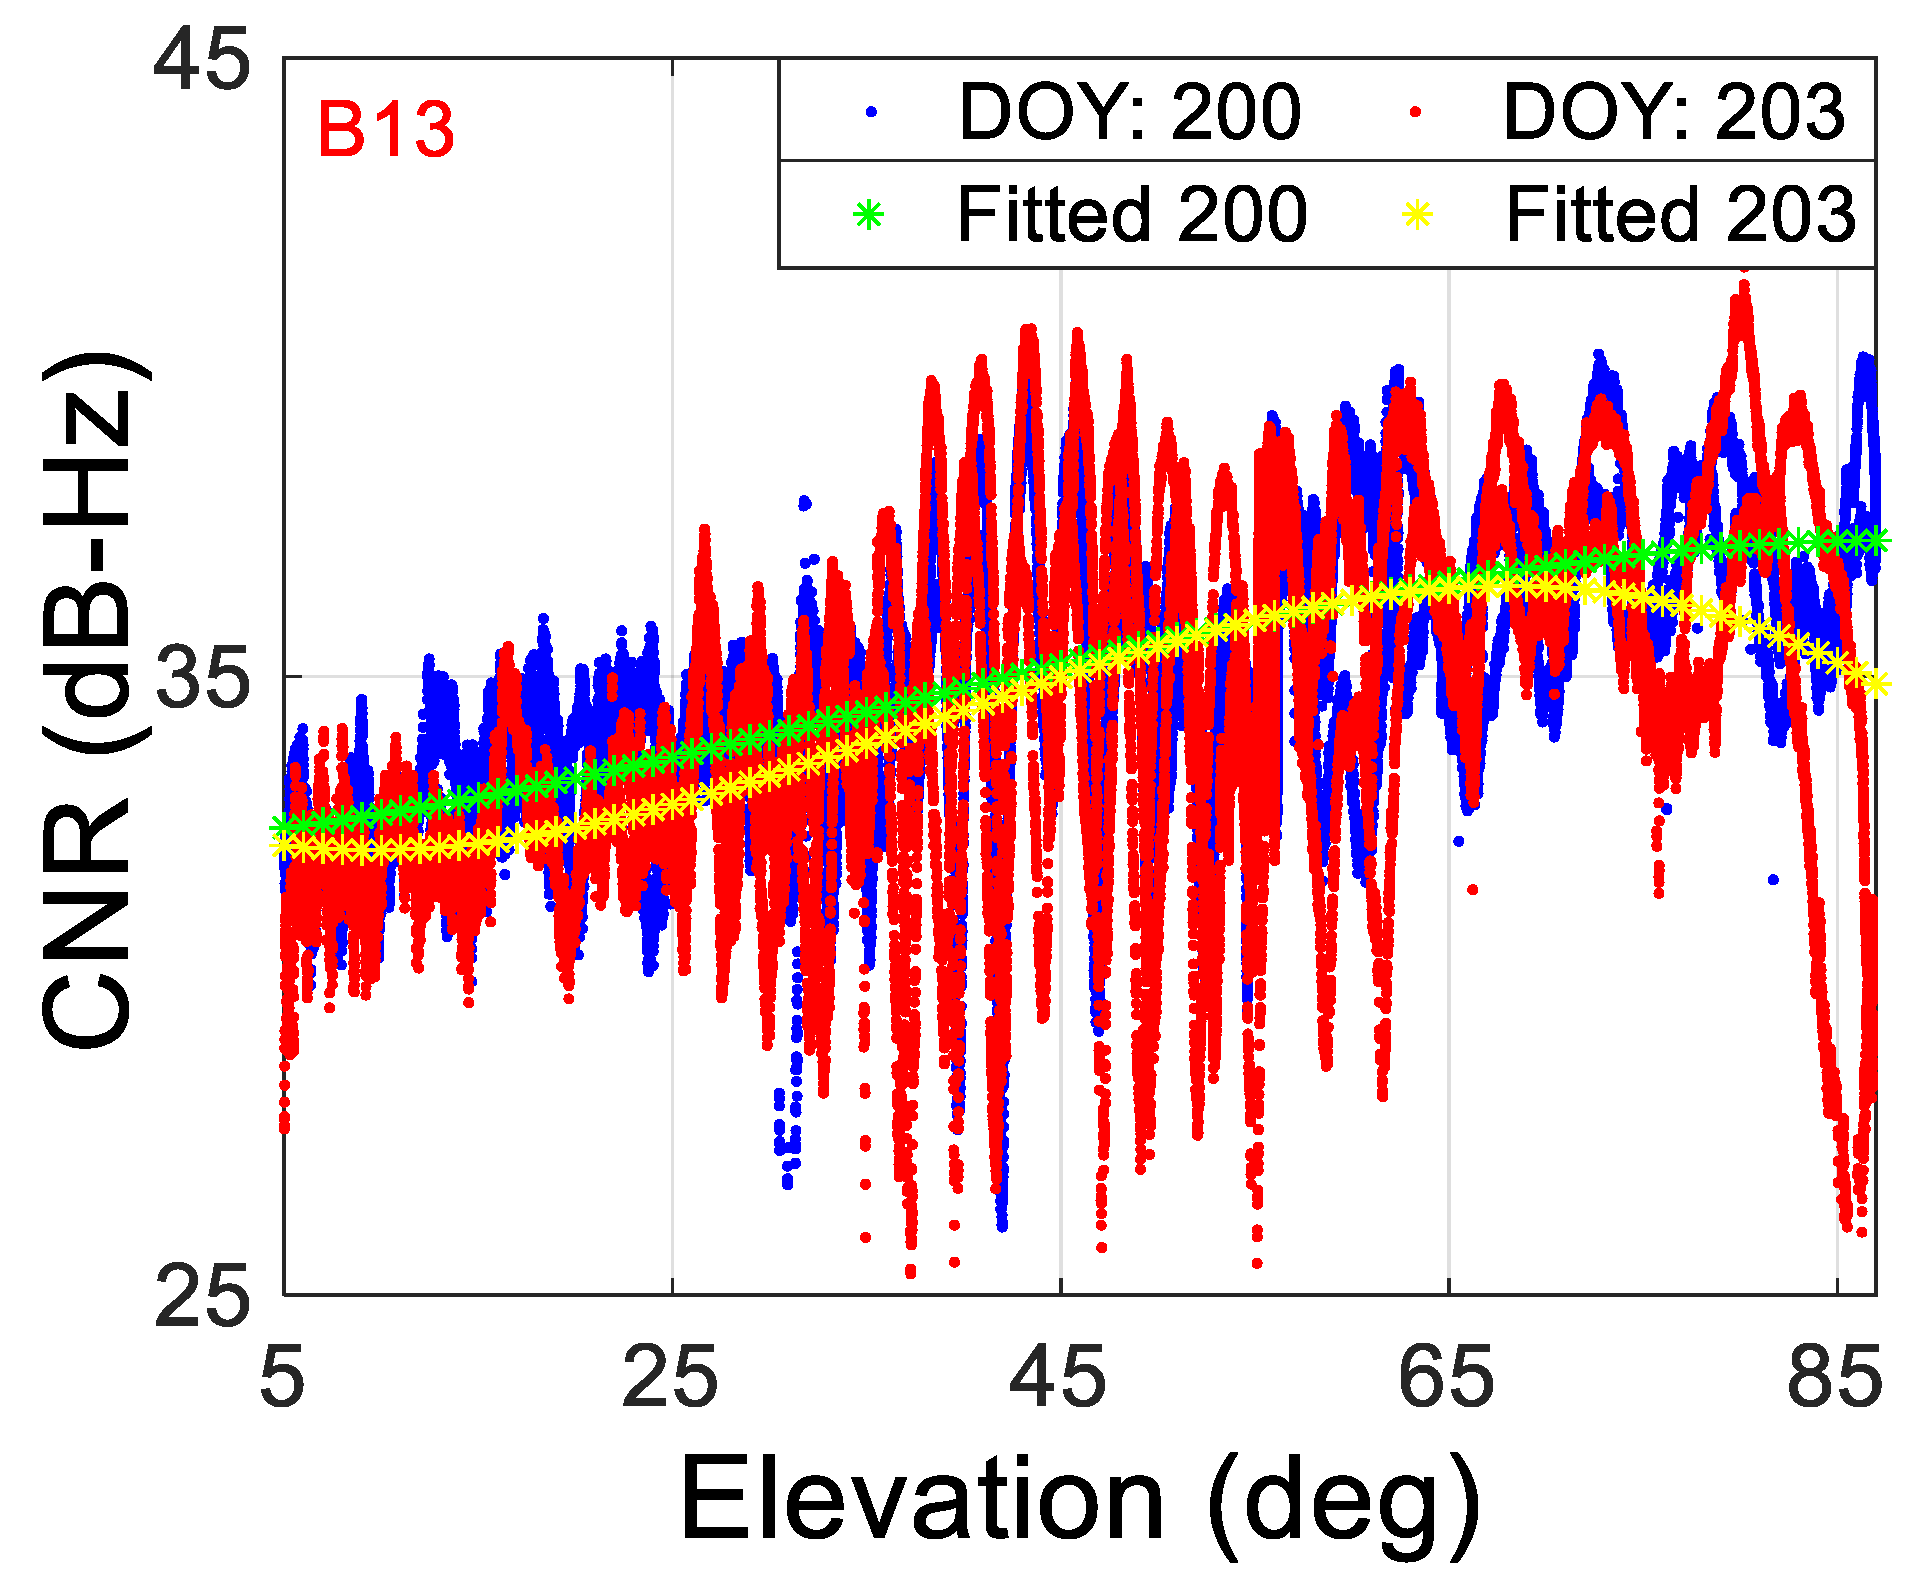
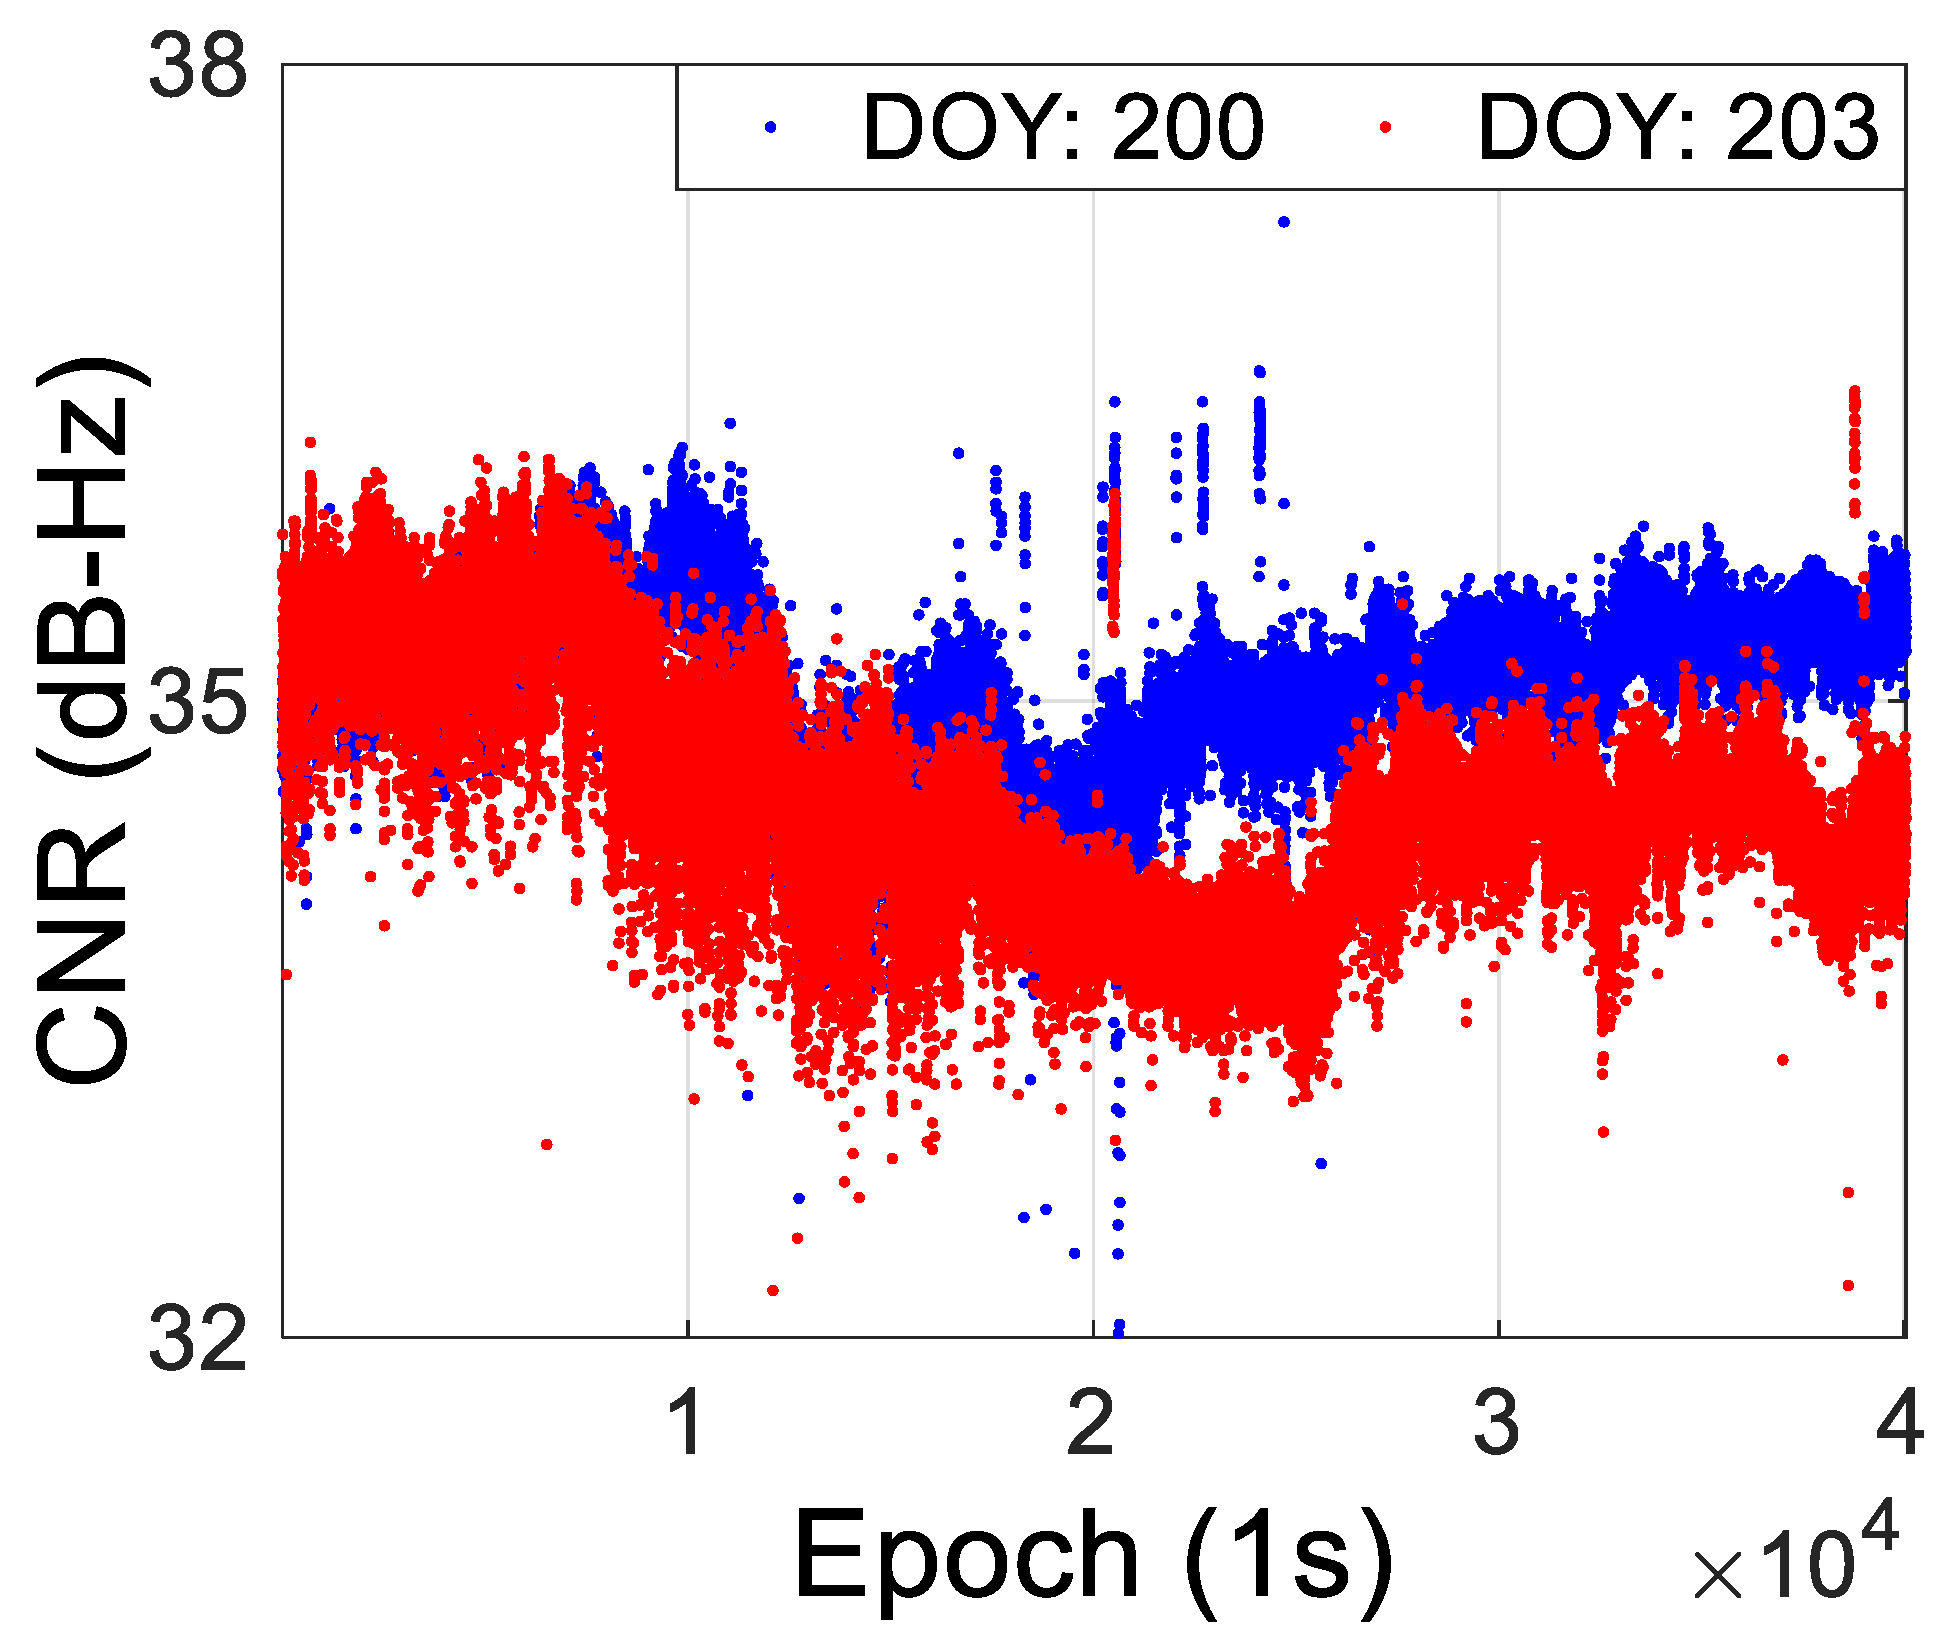
6.4. Influence of Floods on BDS with 1 s Data Set

As is well known, the BDS system consists of three orbital-type satellites, such as MEO, IGSO, and GEO satellites. Considering that the orbital repeat period of these three types is different, thus, they are analyzed separately in this section.

6.4.1. BDS MEO Satellite

In order to analyze the influence of floods on the BDS MEO satellite, the data set collected seven days prior to the flood should be used. The comparison results are presented in Figure 14. The blue and red dots denote the original CNR observations on DOY:196 (no flood) and DOY:203 (flood), respectively. It can be seen that the CNR on DOY:203 performs lower than that of on DOY:196, from a low elevation to a high elevation as a whole. This result is consistent with previous experiments, which indicates that the flood can reduce the CNR of the BDS MEO satellite. In addition, to further investigate the extent of the impact, the original CNR is fitted by a third-order polynomial fitting method. The green line means the fitted result of DOY:196, and the yellow line denotes the fitted result of DOY:203. From the fitted result, it is evident that the CNR on DOY:203 performs lower than that of on DOY:196. Although the average decrease is only approximately 0.99 dB-Hz, the influence of floods on the CNR is noteworthy in and of itself. In addition, it should be noted that the above phenomenon not only appeared on the B20 satellite, but also appeared on other BDS MEO satellites.

6.4.2. BDS IGSO and GEO Satellite

For BDS IGSO and GEO satellites, their ground track repeat periods are sidereal days. Thus, to analyze the influence of floods on the CNR of BDS IGSO and GEO satellites, the data set collected one day prior to the flood should be used. However, there was localized flooding on DOY:201 and DOY:202, which could have affected the accuracy of the comparison results. Thus, the data set collected on DOY:200 is used in this experiment.
Figure 15 demonstrates the comparison results of the CNR of the BDS IGSO B13 satellite on DOY:200 and DOY:203, 2021. The green and yellow lines denote the fitted results of the original CNR on DOY:200 and DOY:203. It can be seen that the difference of CNR between DOY:200 and DOY:203 is mainly concentrated on low and high elevations. For example, the CNR slightly decreases when the elevation is lower than 20 deg and larger than 65 deg. In addition, it can be found that the fluctuation of the B13 IGSO satellite performs more severely than the B20 MEO satellite. This phenomenon may be related to the characteristics of the satellite’s track. The orbit height of the BDS IGSO satellite is much higher than that of the MEO satellite, which is approximately 3.6 × 10⁴ km away from the surface of the earth. The relationship between signal attenuation and propagation distance is positively correlated. Thus, the BDS IGSO satellite performs more severe fluctuations than the BDS MEO satellite.
The comparison result of the BDS GEO B01 satellite B1 frequency is presented in Figure 16. It should be noted that since B01 is a geostationary satellite, the elevation angle of the satellite remains almost constant. Thus, the time series of the CNR is used for comparative analysis. Theoretically, the B01 satellite can be observed all day. However, there is no observation data in many epochs because of the observation environment and low-cost receiver, especially during the flood on DOY:203. Thus, in order to ensure the reliability of the analysis’ result, only the same epochs on DOY:200 and DOY:203 are selected for comparison. From Figure 16, it can be seen that the CNR on DOY:203 is lower than that of on DOY:200 in nearly two thirds of the epochs. The amplitude of decrease is approximately 1 dB-Hz. In some of the epochs, the CNR on DOY:200 is lower than that of on DOY:203. For example, the CNR on DOY:200 is lower than DOY:203 by around 2.0 × 10⁴ and 3.8 × 10⁴. This phenomenon is caused by environmental changes and is seen as more of a random fluctuation. Overall, the influence of floods on the BDS GEO satellite can be observed, and the CNR is decreased because of the influence of floods as a whole.
In addition, when comparing Figure 15 and Figure 16 with Figure 14, it can be found that the CNR of the B13 and B01 satellites is lower than that of the B20 satellite as a whole. The reason for this phenomenon is that the B13 and B01 belong to IGSO and GEO satellites, respectively, which are approximately 3.6 × 10⁴ km away from the earth’s surface. However, for the BDS MEO satellite, the height of the orbital is only 2.2 × 10⁴ km. Thus, the signal attenuation of the MEO satellite is smaller than that of the IGSO and GEO satellites under the same signal power. In addition, the CNR of the B01 satellite fluctuates in a range from 32 dB-Hz to 38 dB-Hz, but is concentrated on 35 dB-Hz. This is because the B01 satellite is stationary, and the strength of the signal is relatively stable compared with IGSO and MEO satellites. Moreover, from the relationship between the CNR and the elevation of the B13 and B20 satellites, it can be found that the CNR has a positive correlation with the elevation angle.

7. Conclusions

The CNR is an index of the strength of the GNSS signal, which is related to the direct and indirect signals. The multipath effect caused by floods will result in an attenuation of received signals by the GNSS receiver. Thus, the MP and CNR will be affected during a flood.
The relationship between the CNR and GNSS signal is introduced, and the reason why the flood will lead to the decline of the CNR is analyzed theoretically. The MP combination model is presented. In addition, the ground track repetition period of the GPS, GLONASS, and BDS satellites for a static observation stations with the same elevation and azimuth were investigated. The skyplot was used to verify the validity of the repeat period. Real data set results showed that the ground track repetition period of the GLONASS satellite is eight days, and the BDS MEO satellite is seven days. Thus, to analyze the influence of floods on GLONASS and BDS MEO satellites, the data set collected on eight and seven days prior to the flood(s) should be used.
Two real flood cases studies occurred in Zhengzhou and Xinxiang cities, China, 2021, and were used to analyze the influence of floods on the GNSS signal. The pseudo-range multipath of the GPS satellite during floods was analyzed, and results showed that the RMS of the MP during floods performed more seriously than on the days without a flood. The maximum RMS increase rate is approximately 17.85%, and the average of all other satellite is approximately 6. 55%. In addition, experimental results demonstrated that floods can decrease the CNR of GPS and GLONASS satellites, especially when the elevation is high. The reason for this phenomenon is that the multipath effect is serious at low elevations, and the multipath effect caused by floods can hardly influence the CNR. By contrast, when the elevation is high, the multipath without floods is much smaller than that of with floods. Thus, the multipath effect caused by floods has more influence. In terms of the BDS system satellite, although the influence of floods on three orbital-type satellites is slightly different from one another, the CNR of all them declined during the flood as a whole.
In conclusion, based on the analysis of GPS, GLONASS, and BDS system satellites, it can be concluded that floods can lead to an increase of pseudo-range multipaths and induce a decrease of the CNR on the GNSS signal to a certain degree. Considering that the accuracy of positioning is related to the quality of the signal, whether the accuracy of GNSS positioning will be affected during flood, whether the elevation angle weight strategy can still be used during a flood, and whether the CNR can be used to detect the entire flood process should be answered in future research.

Author Contributions

Conceptualization and writing, M.S. (Mingkun Su); data curation, X.C. and F.Z.; methodology, J.S.; software, L.Q.; validation, X.T. and M.S. (Minhong Sun); All authors have read and agreed to the published version of the manuscript.

Funding

This research was funded by Zhejiang Provincial Natural Science Foundation of China grant number No. LQ22D040001 and GK218815299009.

Data Availability Statement

The data set used in this study was collected from the Infrastructure of National Earthquake Data Center, China and Changxin teams. Readers in China can apply for the data set from the agency Crustal Movement Observation Network of China on their own, and the website is: http://data.earthquake.cn (accessed on 20 July 2021). In addition, the data set can also be made available by contacting the corresponding author.

Acknowledgments

We appreciate the authors Zheng Fu and Chang Xin for providing the data set. We also appreciate the reviewers and editors’ valuable comments to improve the paper’s quality. In addition, compared with the people which affected by the flood, the impact of GNSS is negligible. Thus, we really hope that there will be no more floods in the word, even though we cannot publish article in this aspect, thank the creator.

Conflicts of Interest

The authors declare no conflict of interest.

References

  1. Wan, W.; Liu, B.; Zeng, Z.; Chen, X.; Wu, G.; Xu, L.; Chen, X.; Hong, Y. Using CYGNSS Data to Monitor China’s Flood Inundation during Typhoon and Extreme Precipitation Events in 2017. Remote Sens. 2019, 11, 854. [Google Scholar] [CrossRef] [Green Version]
  2. Mahmoud, R.; Hossein, N.; Mostafa, H. Evaluation of CYGNSS Observations for Flood Detection and Mapping during Sistan and Baluchestan Torrential Rain in 2020. Water 2020, 12, 2047. [Google Scholar] [CrossRef]
  3. Cai, C.; Gao, Y.; Pan, L.; Dai, W. An analysis on combined GPS/COMPASS data quality and its effect on single point positioning accuracy under different observing conditions. Adv. Space Res. 2014, 54, 818–829. [Google Scholar] [CrossRef]
  4. Michael, S. Multipath. In Springer Handbook of Global Navigation Satellite Systems; Teunissen, P., Montenbruck, O., Eds.; Springer: New York, NY, USA, 2017; pp. 444–466. [Google Scholar]
  5. Axelrad, P.; Comp, C.; Macdoran, P. SNR based multipath error correction for GPS differential phase. IEEE Trans. Aerosp. Electron. Syst. 1996, 32, 650–660. [Google Scholar] [CrossRef]
  6. Zhang, Z.; Li, B.; Gao, Y.; Shen, Y. Real-time carrier phase multipath detection based on dual-frequency C/N0 data. GPS Solut. 2019, 23, 7. [Google Scholar] [CrossRef]
  7. Su, M.; Yang, Y.; Qiao, L.; Ma, H.; Feng, W.; Qiu, Z.; Zheng, J. Multipath extraction and mitigation for static relative postitioning based on adaptive layer wavelet packets, bootstrapped searches, and CNR constraints. GPS Solut. 2021, 25, 123. [Google Scholar] [CrossRef]
  8. Tian, X.; Chai, H.; Xiang, M.; Yin, X.; Wang, M. The analysis and evaluation of the multipath error of the BDS marine measurement. Adv. Space Res. 2022, 71, 496–809. [Google Scholar] [CrossRef]
  9. Strode, R.; Groves, P. GNSS multipath detection using three-frequency signal-to-noise measurements. GPS Solut. 2016, 20, 399–412. [Google Scholar] [CrossRef] [Green Version]
  10. Genrich, J.; Bock, Y. Rapid resolution of crustal motion at short ranges with the Global Positioning System. J. Geophys. Res. 1992, 97, 3261–3269. [Google Scholar] [CrossRef]
  11. Su, M.; Zheng, J.; Yang, Y.; Wu, Q. A new multipath mitigation method based on adaptive thresholding wavelet denoising and double reference shift strategy. GPS Solut. 2018, 22, 40. [Google Scholar] [CrossRef]
  12. Wang, M.; Wang, J.; Dong, D.; Li, H.; Han, L.; Chen, W. Comparison of Three Methods for Estimating GPS Multipath Repeat Time. Remote Sens. 2018, 10, 6. [Google Scholar] [CrossRef] [Green Version]
  13. Zandbergen, R.; Dinwiddy, S.; Hahn, J.; Breeuwer, E.; Blonski, D. Galileo orbit selection. In Proceedings of the 17th International Technical Meeting of the Satellite Division of The Institute of Navigation (ION GNSS 2004), Long Beach, CA, USA, 26–29 September 2004; pp. 616–623. [Google Scholar]
  14. Galileo Satellite Recovered and Transmitting Navigation Signals. Available online: http://www.esa.int/Our_Activities/Navigation/Galileo_satellite_recovered_and_transmitting_navigation_signals (accessed on 20 May 2018).
  15. Sixth Galileo Satellite Reaches Corrected Orbit. Available online: http://www.esa.int/Our_Activities/Navigation/Galileo/Galileo_Launches/Sixth_Galileo_satellite_reaches_corrected_orbit (accessed on 20 May 2018).
  16. Wang, K.; Khodabandeh, A.; Teunissen, P. Five-frequency Galileo long-baseline ambiguity resolution with multipath mitigation. GPS Solut. 2018, 22, 75. [Google Scholar] [CrossRef] [Green Version]
  17. Su, M.; Yang, Y.; Jiang, J. BeiDou system satellite-induced pseudorange multipath bias mitigation based on different orbital characteristic for static applications. IET Radar Sonar Navig. 2019, 14, 242–251. [Google Scholar] [CrossRef]
  18. Rost, C.; Wanninger, L. Carrier phase multipath mitigation based on GNSS signal quality measurements. J. Appl. Geod. 2009, 3, 81–87. [Google Scholar] [CrossRef]
  19. Su, M.; Yang, Y.; Qiao, L.; Teng, X.; Song, H. Enhanced multipath mitigation method based on multi-resolution CNR model and adaptive statistical test strategy for real-time kinematic PPP. Adv. Space Res. 2020, 67, 868–882. [Google Scholar] [CrossRef]
  20. Zhang, X.; Wu, M.; Liu, W.; Li, X.; Yu, S.; Lu, C.; Wickert, J. Initial assessment of the COMPASS/BeiDou-3: New-generation navigation signals. J. Geod. 2017, 91, 1225–1240. [Google Scholar] [CrossRef]
  21. Yang, J. Spacecraft Orbit Dynamics and Control; China Astronautic Publishing House: Beijing, China, 1995; pp. 196–197. [Google Scholar]
  22. Su, M.; Feng, J.; Qiao, L.; Qiu, Z.; Zhang, H.; Zheng, J.; Yang, Y. An improved time-domain multipath mitigation method based on the constraint of satellite elevation for low-cost single frequency receiver. Adv. Space Res. 2022, 69, 3597–3608. [Google Scholar] [CrossRef]
  23. Choi, K.; Bilich, A.; Larson, K.; Axelrad, P. Modified sidereal filtering: Implications for high-rate GPS positioning. Geophys. Res. Lett. 2004, 31, L22608. [Google Scholar] [CrossRef] [Green Version]
  24. Yang, Y.; Jiang, J.; Su, M. Comparison of Satellite Repeat Shift Time for GPS, BDS, and Galileo Navigation Systems by Three Methods. Algorithms 2020, 12, 233. [Google Scholar] [CrossRef] [Green Version]
  25. Su, M.; Zheng, F.; Shang, J.; Qiao, L.; Qiu, Z.; Zhang, H.; Zheng, J. Influence of flooding on GPS carrier-to-noise ratio and water content variation analysis: A case study in Zhengzhou, China. GPS Solut. 2022, 27, 21. [Google Scholar] [CrossRef]
Figure 1. Surrounding environment of the observation station, located in Xinxiang City, Henan Province, China.
Remotesensing 14 05874 g001
Figure 2. Accumulative rainfall from DOY:193, 2021 to DOY:203, 2021 in Zhengzhou and Xinxiang, China. The blue and red bars denote Zhengzhou and Xinxiang, respectively.
Remotesensing 14 05874 g002
Figure 3. Latitude and longitude of the two floods. The map denotes Henan Province, China.
Remotesensing 14 05874 g003
Figure 4. Skyplot of the GPS G32 satellite on DOY:200 (denoted by blue line) and DOY:201 (denoted by pink line), 2021. The vertical means the elevation angle, and the circle represents the azimuth angle.
Remotesensing 14 05874 g004
Figure 5. Skyplot of the BDS IGSO B16 satellite on DOY:202 (denoted by blue line) and DOY:203 (denoted by pink line), 2021. The vertical means the elevation angle, and the circle represents the azimuth angle.
Remotesensing 14 05874 g005
Figure 6. Skyplot of the GLONASS R14 satellite on DOY:193 (denoted by blue line), DOY:200 (denoted by brown line), and DOY:201 (denoted by pink line), 2021. The vertical means the elevation angle, and the circle represents the azimuth angle.
Remotesensing 14 05874 g006
Figure 7. Skyplot of the BDS MEO B20 satellite on DOY:196 (denoted by blue line), DOY:202 (denoted by brown line), and DOY:203 (denoted by pink line), 2021. The vertical means the elevation angle, and the circle represents the azimuth angle.
Remotesensing 14 05874 g007
Figure 8. MP of GPS G32 satellite L1 frequency. The blue and red lines denote the MP on DOY:200 (no flood) and DOY:201 (with flood), 2021, respectively.
Remotesensing 14 05874 g008
Figure 9. RMS increase rate of all other GPS satellites’ L1 frequency MP compared with DOY:200.
Remotesensing 14 05874 g009
Figure 10. CNR of GPS G32 satellite L1 frequency comparison results with elevation as the horizontal axis. The blue and red dots denote the CNR collected on DOY:200 (no flood) and DOY:201 (with flood), 2021, respectively.
Remotesensing 14 05874 g010
Figure 11. Histogram of the CNR and relative frequency. The blue and red bars denote the CNR collected on DOY:200 and DOY:201, 2021. |−,30) means CNR lower than 30 dB-Hz. |50,+) means CNR larger than 50 dB-Hz. Symbol | and) denote inclusion and non-inclusion, respectively.
Remotesensing 14 05874 g011
Figure 12. CNR of GLONASS satellite L1 frequency comparison between under the flood and the normal weather. The blue dots denote the CNR collected on DOY:193 (no flood), and the red dots denote the CNR collected on DOY:201 (with flood).
Remotesensing 14 05874 g012
Figure 13. CNR of GPS G32 satellite L1 frequency comparison results with elevation as the horizontal axis. The blue dots denote the CNR collected on DOY:200 (no flood), and the red dots denote the CNR collected on DOY:203 (with flood). The green line is the elevation angle.
Remotesensing 14 05874 g013
Figure 14. CNR of BDS MEO B20 satellite B1 frequency comparison results with elevation as the horizontal axis. The blue and red dots denote the CNR collected on DOY:196 (no flood) and DOY:203 (with flood), 2021, respectively. The green and yellow lines are the fitted results of CNR on DOY:196 and DOY:203.
Remotesensing 14 05874 g014
Figure 15. CNR of BDS IGSO B13 satellite B1 frequency comparison results with elevation as the horizontal axis. The blue and red dots denote the CNR collected on DOY:200 (no flood) and DOY:203 (with flood), 2021, respectively. The green and yellow lines are the fitted results of CNR on DOY:200 and DOY:203.
Remotesensing 14 05874 g015
Figure 16. CNR of BDS GEO B01 satellite B1 frequency. The blue and red dots denote the CNR collected on DOY:200 (no flood) and DOY:203 (with flood), 2021, respectively.
Remotesensing 14 05874 g016
Table 1. Reflection coefficients and attenuation factors for common surfaces at normal incidences (elevation angle of 90°) on a GPS L1 frequency.
Surface TypeReflection CoefficientAttenuation Factor (dB)
Dry soil0.268−11.4
Wet soil0.691−3.21
Grassy field0.334−9.53
Fresh water0.800−1.95
Glass0.421−7.51
Brick0.345−9.24
Concrete0.404−7.87
Table 2. General characteristic of GNSS orbits modes (i: inclination, T: orbital period).
ConstellationiT
GPS55°11 h 58 m
GLONASS65°11 h 16 m
Galileo56°14 h 05 m
BDS MEO55°12 h 53 m
BDS IGSO55°23 h 56 m
BDS GEO23 h 56 m
Publisher’s Note: MDPI stays neutral with regard to jurisdictional claims in published maps and institutional affiliations.

