Article

Research of Deformation and Soil Moisture in Loess Landslide Simultaneous Retrieved with Ground-Based GNSS

1
College of Geological Engineering and Geomatics, Chang’an University, Xi’an 710054, China
2
State Key Laboratory of Geo-Information Engineering, Xi’an 710054, China
3
Key Laboratory of Ecological Geology and Disaster Prevention, Ministry of Natural Resources, Xi’an 710054, China
4
Big Data Center for Geosciences and Satellites (BDCGS), Chang’an University, Xi’an 710054, China
*
Author to whom correspondence should be addressed.
Remote Sens. 2022, 14(22), 5687; https://doi.org/10.3390/rs14225687
Submission received: 29 September 2022 / Revised: 29 October 2022 / Accepted: 7 November 2022 / Published: 11 November 2022
(This article belongs to the Special Issue New Advances in GNSS-R Signal Processing)

Abstract

:
The Loess Plateau is one of the three most severely affected geological disaster areas in China. Water sensitivity is the most significant feature of the loess. Under the action of continuous heavy rainfall, rainwater infiltrates the loess, resulting in a rapid increase in soil saturation and changes in soil moisture. This affects the shear strength of the soil and induces shallow loess landslides. Therefore, it is significant to our country’s disaster prevention and mitigation efforts to effectively monitor the deformation and inducement of such landslides. At present, the global navigation satellite system (GNSS) is widely used in the field of landslide disaster monitoring as a technical means to directly obtain real-time three-dimensional vector deformation of the surface. At the same time, GNSS can also provide a steady stream of L-band microwave signals to obtain surface environmental information, such as soil moisture around the station. In past landslide disaster monitoring research, GNSS was only used to provide three-dimensional deformation information, and its ability to provide environmental information around the station was almost completely ignored. This study proposes a ground-based GNSS remote sensing comprehensive monitoring system integrating “three-dimensional deformation and soil moisture content” combined with a rainfall-type shallow loess landslide event in Linxia City. The ability of ground-based GNSS to comprehensively monitor shallow loess landslide disasters was analysed. Experiments show that GNSS can provide high-precision deformation time series characteristics and monitor the changes in soil moisture content around the station at the same time; the two have a certain response relationship, which can comprehensively evaluate the stability of shallow loess landslides. As heavy rainfall is a key factor affecting the change in soil water content, this study adds the atmospheric water vapour content calculated by ground-based GNSS refraction remote sensing in the discussion chapter and analyses the relationship between precipitable water vapour and rainfall in this area to give full play to ground-based GNSS remote sensing. In the role of landslide disaster monitoring, we hope to build a more comprehensive ground-based GNSS remote sensing monitoring system to better serve the monitoring of landslide disasters.

Graphical Abstract

1. Introduction

Landslides are a geological disaster phenomenon in which the weak structural surface (belt) of a rock mass or soil mass on a slope is affected by natural or human factors, and overall or scattered sliding occurs under the action of gravity [1,2,3]. China is a vast territory with many types of high-frequency geological disasters. Approximately one-third of the country’s geological disasters occur in the Loess Plateau every year [4,5,6,7], among which rainfall-type shallow loess landslides caused by extreme weather account for more than 75%. Therefore, it is of practical significance to effectively monitor and warn about such landslide disasters. Since the 1990s, global navigation satellite system (GNSS) technology has achieved fruitful research results for the monitoring of landslide geological hazards. Calcaterra et al. [8] evaluated the surface displacements of two landslides in the South Apennines region of Italy using global positioning system (GPS) and inclinometers. The experimental results showed that the surface displacements monitored by GPS over three years were in good agreement with the surface displacements measured by inclinometers. Wang et al. [9] combined a large-scale physical model test of a certain type of landslide and proved that GPS real-time kinematic (RTK) technology can be used for dynamic real-time deformation monitoring of landslide disasters with deformations greater than 15 mm under certain conditions. Further study of the possible accuracy and reliability of GPS Precise Point Positioning (PPP) technology for landslide and other geological disaster monitoring is required. Bai et al. [10] proposed the concept of “cloud + terminal,” independently developed real-time BDS/GNSS monitoring technology and equipment, using the cloud platform to conduct millimetre-level real-time monitoring and early warning on the landslide surface; the results have been successfully applied to the Heifangtai landslide in Gansu. With the continuous deepening of landslide research, many scholars have conducted in-depth analyses of the causes of landslides. Lumb [11] found that the stability of typical rainfall-type landslides in Hong Kong is affected by the duration of rainfall, the intensity of rainstorms, and the accumulated rainfall within a certain time range before the rainstorm. Lehmann et al. [12] concluded that in rainfall-induced shallow landslides, an increase in soil water content and pore water pressure reduces the effective stress in the soil, resulting in a loss of soil shear strength. Zhang et al. [13] analysed in detail the main controlling factors of loess landslides in the Baota District of Yan’an City, finding that rainfall and engineering activities are important factors affecting the stability of the slope. Qiu et al. [14] used the method of machine learning, to study and draw the susceptibility map of debris flow related to Gyirong Zangbo river, which combined meteorological factors (such as temperature and precipitation), topography and geological conditions, to demonstrate the influence of rainfall on debris flow. Many scientific studies have found that the impact of rainfall on landslides is mainly reflected in the increase in the water content of the slope caused by rainwater infiltration, the decline of soil matrix suction, and the increase in pore water pressure, reducing the mechanical strength of the landslide soil and affects the stability of the landslide [15,16,17,18,19]. It was determined that the action of water in the soil was one of the main causes of landslides. Therefore, it is of practical significance to analyse the deformation characteristics of loess landslides and study how to make full use of displacement monitoring, rainfall, and soil moisture data for the disaster prevention and mitigation of loess landslides.
With the continuous development and application of GPS GNSS technology, an increasing number of scholars have used the noise in GNSS signals to conduct scientific research. Larson et al. [20] first proposed an algorithm for estimating soil moisture based on the signal-to-noise ratio (SNR) data of a geodetic GNSS receiver. By separating the direct and reflected signals, the amplitude fluctuation of the reflected signal was found to be in good agreement with the change in soil moisture. In the same year, Larson and Small [21] further experimented using receiver data in Boulder, Colorado, finding that in the variation of shallow soil moisture, the phase showed greater consistency than by the amplitude, with a correlation coefficient of 0.91. Chew et al. [22] studied the sensitivity of phase offset and amplitude to changes in soil moisture and found that the phase is the best parameter to reflect changes in soil moisture under bare soil conditions. Chew and Larson [23] considered the interference of low-surface vegetation on the soil moisture retrieval process and proposed a method to determine whether the SNR data were affected by vegetation and correct for this effect. Vey et al. [24] conducted a long-term soil moisture inversion experiment using seven years of GPS observation data and successfully obtained seasonal fluctuations and annual periodic changes in soil moisture. Yang et al. [25] verified the feasibility of retrieving soil moisture by comparing the B1 and B2 satellite signals of the BDS with the interference pattern and SNR. Shi et al. [26] used a genetic algorithm back propagation neural network model to combine ground GRSS-IR soil moisture data with other surface environmental parameters around the site. A high spatial and temporal resolution soil moisture product of 500 m/d was obtained by inversion. Aiming at the adverse effect of undulating terrain on the application of GNSS-IR technology [27], Ran et al. [28] proposed an arc-editing method when interpreting soil moisture, and only the DSNR data whose interference mode is a typical cosine waveform is retained. The experimental results show that this method can improve the inversion accuracy of soil moisture in undulating terrains. Nie et al. [29] constructed a multipath error calculation model with dual-frequency carrier phase and dual-frequency pseudorange to solve the delayed phase for soil moisture inversion. The results showed that the soil moisture inversion method based on multi-satellite dual-frequency combined multipath error can replace the traditional inversion method and effectively improve the temporal resolution of GNSS-IR soil moisture estimation. A series of soil moisture inversion experiments was carried out successively to verify the effectiveness of GNSS-IR in interpreting soil moisture. However, in previous experiments, most scholars used the experimental data of the Plate Boundary Observatory H2O network for experimental verification. In landslide disaster monitoring research, GNSS is only used to provide three-dimensional deformation information, and its ability to provide environmental information around the station is almost completely ignored. Research on soil moisture inversion based on landslide mass stations to provide soil moisture parameters for landslide deformation has not yet been conducted.
In this study, a ground-based GNSS remote sensing system integrating “soil moisture content and three-dimensional deformation” is proposed for comprehensive monitoring of loess landslides to give full play to the role of GNSS in landslide disaster monitoring. Based on the loess landslide event in Linxia City, Gansu Province, this study analysed the ability of GNSS to monitor deformation and interpret environments, such as soil moisture around the station, and explored the response relationship between the deformation of the shallow loess landslide and soil moisture content. In the discussion section, ground-based GNSS remote sensing technology was used to calculate the atmospheric water vapour content in the landslide area, and the correlation between precipitable water vapour (PWV) and rainfall in the area was analysed to fully understand the role of ground-based GNSS remote sensing in landslide disaster monitoring.

2. Basic Method

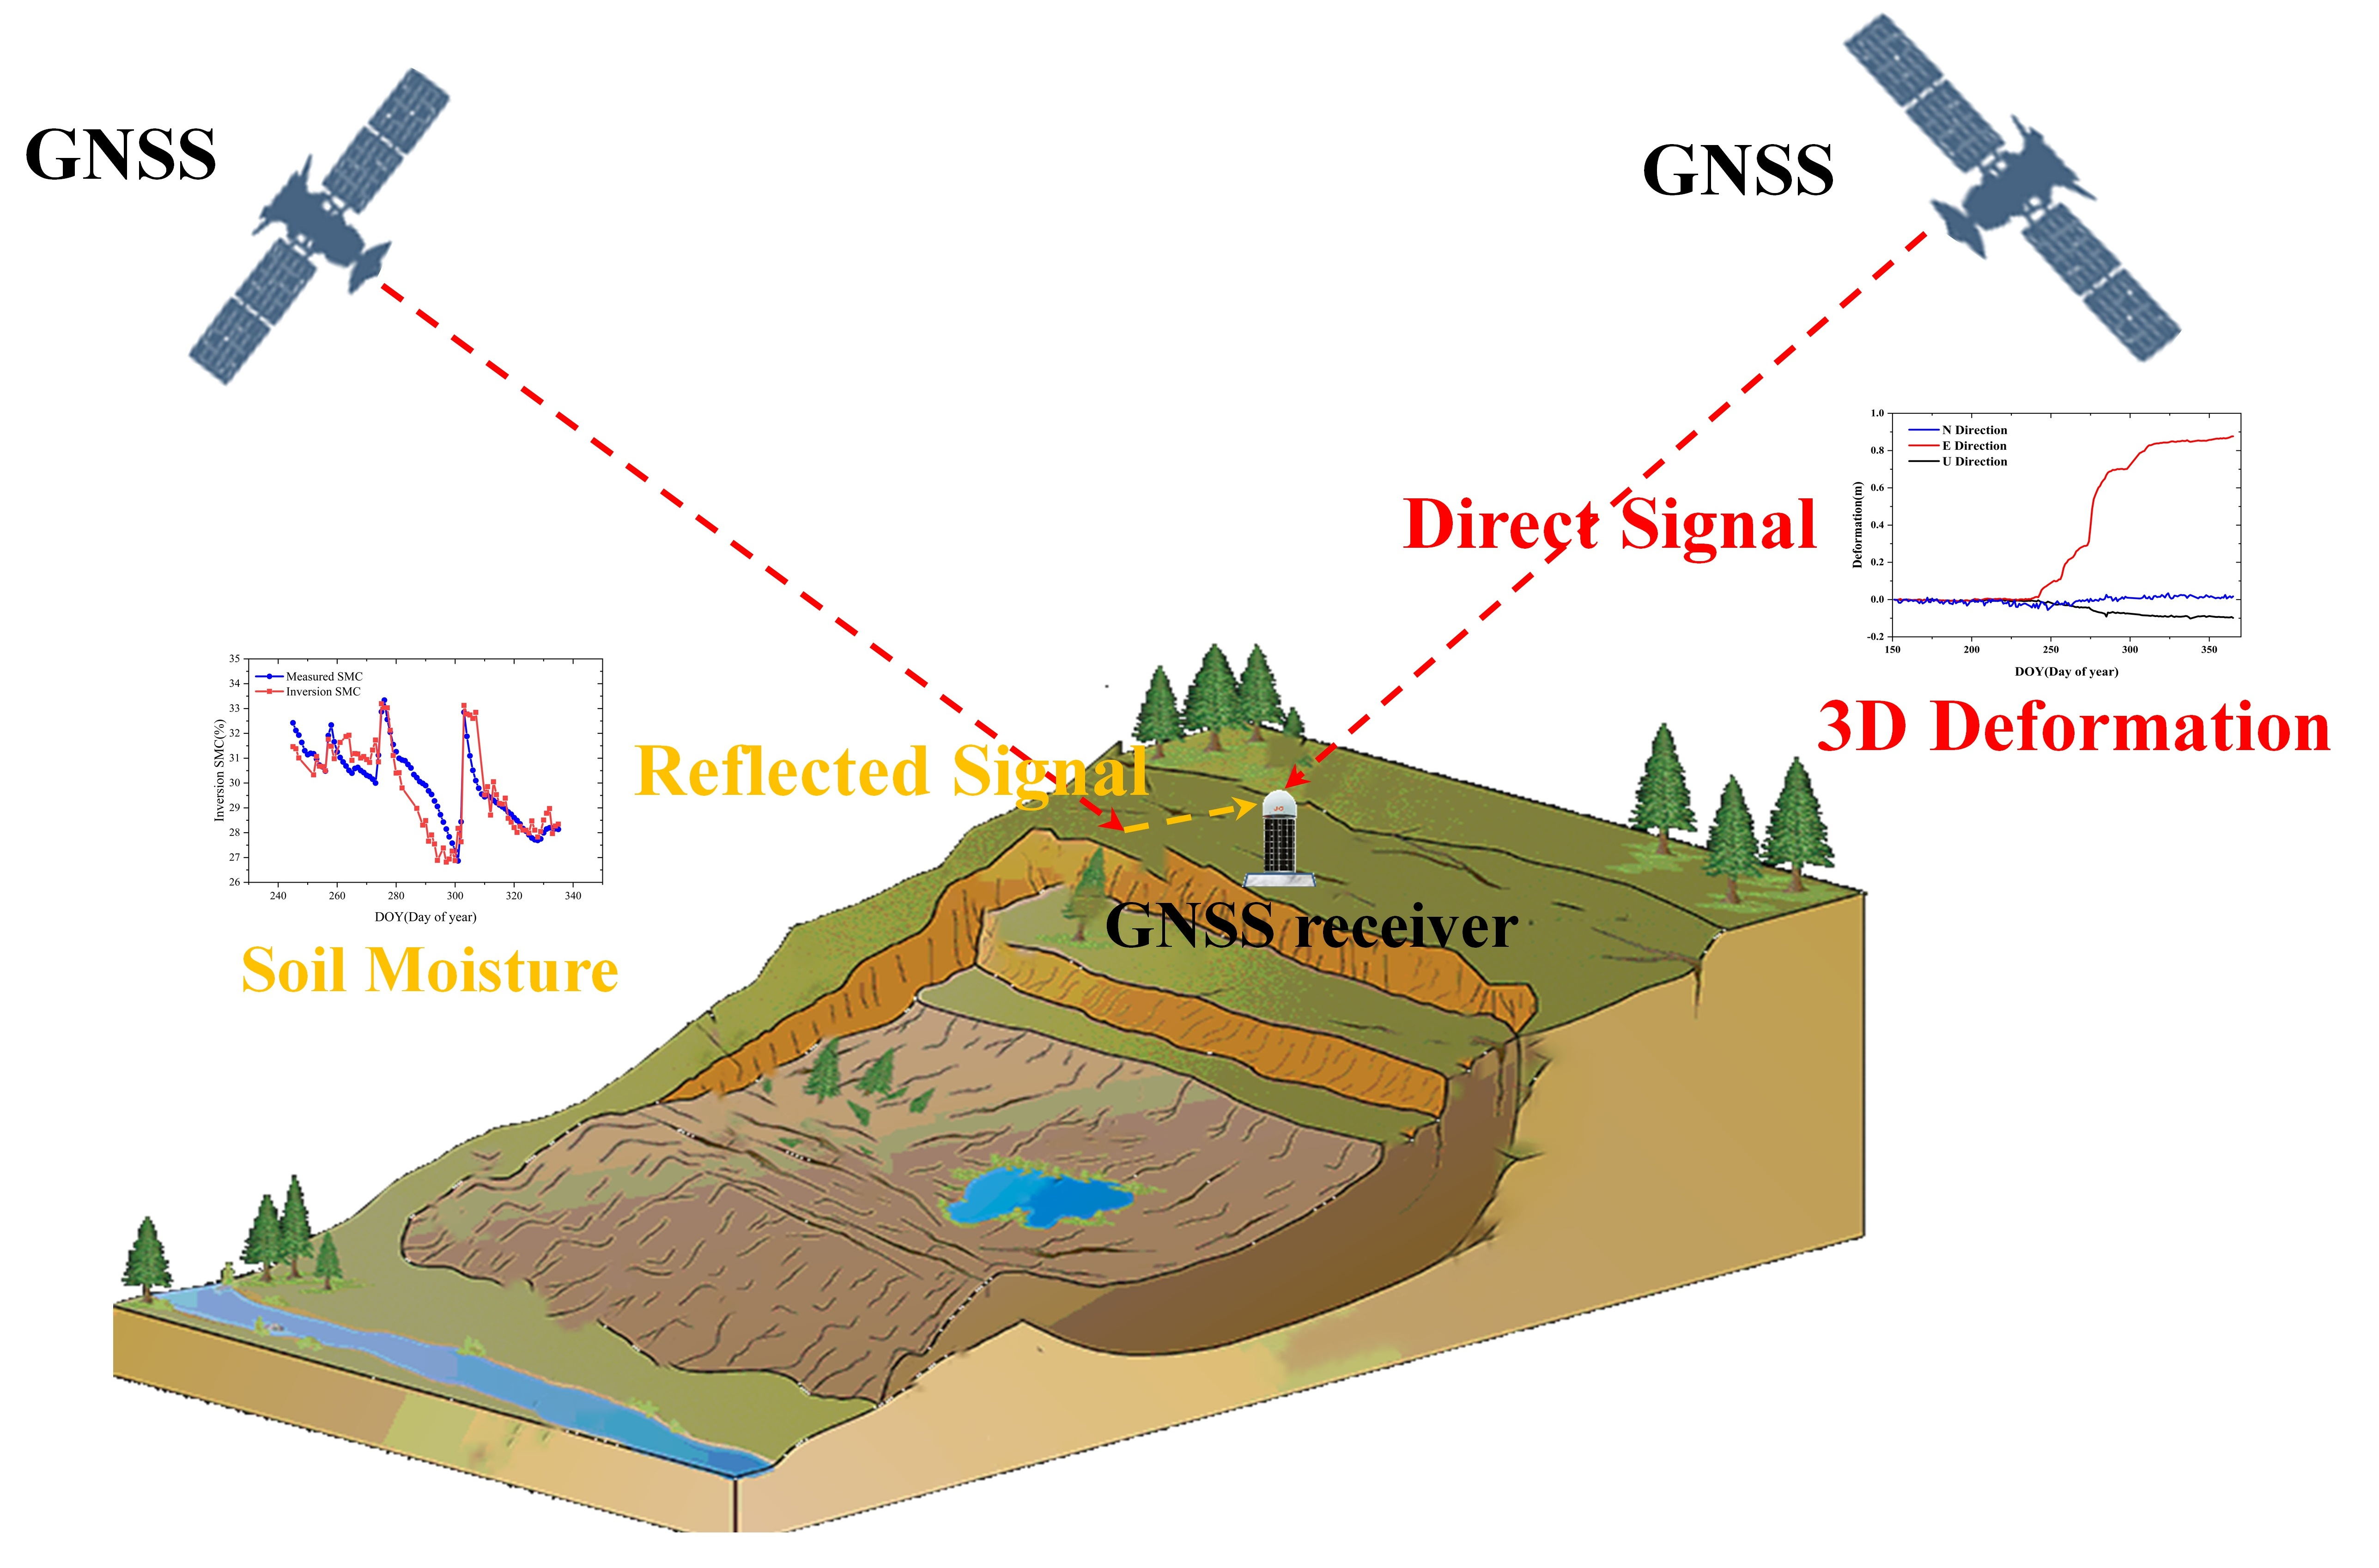
2.1. General Research Rdeas

Although GNSS provides spatial information for positioning, the global coverage and free, continuous L-band microwave signals it provides are also regarded as a kind of atmospheric and reflective surface detection signal, becoming a low-cost, non-cooperative remote-sensing microwave signal source [30,31,32], which can reflect the changes in environmental parameters. Based on the universal GNSS receiver, this study proposes a ground-based GNSS remote sensing comprehensive monitoring system that integrates “soil moisture content and three-dimensional deformation” (Figure 1). First, the direct and reflected signals received by the station were processed by GNSS carrier phase difference and GNSS remote sensing technology, respectively. The three-dimensional deformation of the monitoring points in the survey area and the soil moisture content around the station were obtained, and the feasibility of GNSS to interpret the three-dimensional surface deformation and soil moisture content simultaneously. Then, we analysed the rainfall, surface deformation obtained by GNSS, soil moisture content, and derived indicators (such as deformation rate, soil moisture content transformation rate). Time-delay cross-correlation analysis of the deformation rate, rainfall, and soil moisture content was carried out to further determine the response relationship between deformation rate, rainfall, and soil moisture content, which provides support for the study of the physical mechanism of rainfall-induced shallow loess landslide deformation and makes the ground-based GNSS remote sensing comprehensive monitoring system better serve landslide disaster monitoring.

2.2. Basic Principles of GNSS Interpretation of Landslide 3D Deformation

At present, the commonly used landslide disaster monitoring methods include the macro-geological, geodetic, remote sensing, close-range photogrammetry, and GNSS methods [33,34,35,36,37]. Traditional geological disaster monitoring technology is rich in monitoring content, intuitive, and simple, but is greatly affected by terrain and observation conditions; it has a high labour intensity and long operation cycle, making it difficult to monitor sudden geological disasters as a whole quickly. Emerging modern space monitoring technology, such as remote sensing, can quickly and accurately monitor landslide hazards, but it is also affected by weather conditions. GNSS technology for landslide monitoring has become a powerful means of monitoring and early warning of landslides and other geological disasters owing to its many advantages, such as being independent of weather, high degree of automation, real-time, high accuracy, and direct access to real-time three-dimensional surface vector deformation of landslide disasters [8,38,39].
The GNSS technology was used for landslide monitoring. Given the complex station environment (many obstructions, few satellites, and poor geometric conditions), high-frequency sampling density (1 Hz sampling rate), and GNSS signal interruption, it is necessary to use special GNSS data processing methods for dynamic deformation monitoring to achieve the purpose of timely warning of landslide deformation. Usually, RTK and GNSS single epoch positioning technology are used to achieve fast GNSS positioning [40]. RTK technology is a real-time dynamic differential location technology based on carrier phase observation [41,42,43]. The principle of carrier phase differential positioning is to deploy a GNSS device as a reference station on a known stable point and the other as a mobile station on the target to be measured. The two stations simultaneously observe common viewing satellites and use the carrier phase as the observation amount. For the carrier phase, the measurement accuracy reached 0.5~2.0 mm.
In landslide deformation monitoring using RTK technology, owing to the particularity of the landslide, the selection of monitoring stations and reference stations should be based on field survey and long-term Interferometric Synthetic Aperture Radar (InSAR) data analysis. GNSS equipment should be deployed as monitoring stations in the parts with poor geological conditions and instability of the landslide to be tested. The reference stations should be selected in the areas near the landslide that are not easy to deform. The landslide monitoring system is mainly composed of three parts: field monitoring equipment, data transmission, and real-time calculations, as shown in Figure 2. The reference and monitoring stations in the RTK carrier phase-difference technology are very close. As the position of the reference station is accurately known in advance, the geometric distance between the satellite and reference station can be obtained by adding the precise position of the visible satellite calculated according to the satellite ephemeris. If the pseudo-range obtained by considering the carrier phase as the measurement signal is compared with this geometric distance, the measurement error of the satellite by the reference station can be obtained. As the observation times of the reference station and monitoring station are at the same time and in the same area, the ionospheric error, tropospheric error, and satellite clock error of the reference station and monitoring station are the same. The pseudo-range derived using the carrier phase as the measurement signal was compared with this geometric distance to obtain the measurement error of the reference station for this satellite. In the same area, the observation time of the reference station and the monitoring station are synchronised, so the ionospheric error, tropospheric error, and satellite clock difference between the reference station and the monitoring station are the same. Therefore, the pseudo-range of the monitoring station is calculated and combined with the differential information from the reference station, that is, the measurement error, and we can obtain the geometric distance of the monitoring station. To obtain a better differential positioning effect, the distance between the reference station and monitoring station (i.e., the baseline length) is usually required to be within the range of 20 km [9].
The core problem of GNSS single epoch positioning technology is whether to solve the fixed solution of the whole cycle ambiguity of carrier phase, which determines the positioning accuracy. In this study, the real-time dynamic solution module TrackRT in GAMIT/GLOBK was used to obtain GNSS station 3D deformation information in real-time, and the module used a combination of Melbourne-Wubbena widelane (MW-WL), extra lane (EX)-WL, and LC (ionospheric delay corrected phase) floating point estimates to determine the integer ambiguity. This approach can solve the 3D coordinates and form variables of the monitoring point after observing only one epoch, which has the advantages of fast convergence, no need to detect circumferential jumps, and high positioning accuracy [44].

2.3. Basic Principles of GNSS Interpretation of Soil Moisture Content

At this stage, the commonly used soil moisture detection methods include the drying weighing method, time domain/frequency domain reflectometry, and remote sensing methods. The drying method to measure soil moisture is widely used in real life because of its high accuracy, but it requires considerable manpower and material resources, causes damage to the soil layer, and is difficult to monitor in real-time. The detection range of the time- and frequency-domain reflectometry methods is only one point. However, soil moisture in the landslide body exhibited large spatial and temporal changes. To realise large-scale monitoring of an entire landslide, a large number of detectors must be arranged, and the detection cost is relatively high. For remote sensing satellites, large-scale measurement models are not suitable for soil moisture monitoring of landslides in small areas, and these data are easily interfered with by various complex factors and lack verification support from the ground data.
The GNSS-IR combines the advantages of active radar and passive radiometers. Compared with traditional satellite remote sensing methods, GNSS-IR technology does not need to actively transmit remote sensing signals; has abundant free navigation satellite signal sources; is less affected by severe weather, such as fog, rain, and snow; can penetrate clouds; and is particularly sensitive to soil moisture, which is conducive to long-term stable and all-weather observations. The most prominent advantage of GNSS-IR technology is that it uses a geodetic survey receiver. While the GNSS receiver installed on the landslide body receives a direct signal, the reflected signal from the ground surface is also received, and the reflected signal carries information about the characteristics of the ground. Therefore, the surface environmental parameters can be obtained by analysing the interference signal in the SNR, which significantly reduces the monitoring cost and realises the effect of “one machine with multiple uses.” Figure 3 shows a schematic diagram of soil moisture monitoring using GNSS.
In Figure 3, h is the height from the receiver antenna phase centre to the reflector, θ is the satellite elevation angle, and 2hsinθ is the path delay between the direct reflection signals. As shown in Figure 3, the electromagnetic wave signal reaching the receiver antenna is a composite signal, which is formed by the interference of the direct signal and the multipath signal reflected by the surface of the station. The SNR is usually regarded as such an interference signal. Therefore, under a simplified model in which only one specular reflection occurs on the plane, the SNR can be expressed as [45].
SNR 2     A c 2 = A d 2 + A m   2 + 2 A d A m cos ψ
where A d and A m denote the amplitudes of the direct and reflected signals, respectively. ψ is the phase difference between the direct and reflected signals, which can be expressed as
ψ = 2 π λ 2 h sin θ
The direct signal determines the overall change trend of the synthetic signal, which is equivalent to the overall trend item of the signal, whereas the reflected signal shows local periodic oscillations. To obtain the multipath variation information caused by surface reflection in the SNR, the direct and reflected signals of the SNR are separated, and a partial SNR r , including the interference signal is obtained.
SNR r = 2 A d A m cos ψ = A cos ( 2 π λ 2 h sin θ + ψ 0 )
For t = sin θ and f   = 2 h λ , the above equation can be simplified to:
SNR r = A cos ( 2 π f t + ψ 0 )
The frequency f of the reflected signal was obtained by spectral analysis of the SNR r curve, and the phase shift observation ψ 0 was obtained using the nonlinear least squares solution. This is the key to monitoring soil moisture changes using GNSS. Then, the phase offset was converted to soil moisture using a method proposed in the literature [46] to calculate soil moisture using the scale moisture index.

3. Linxia Loess Landslide Case Analysis

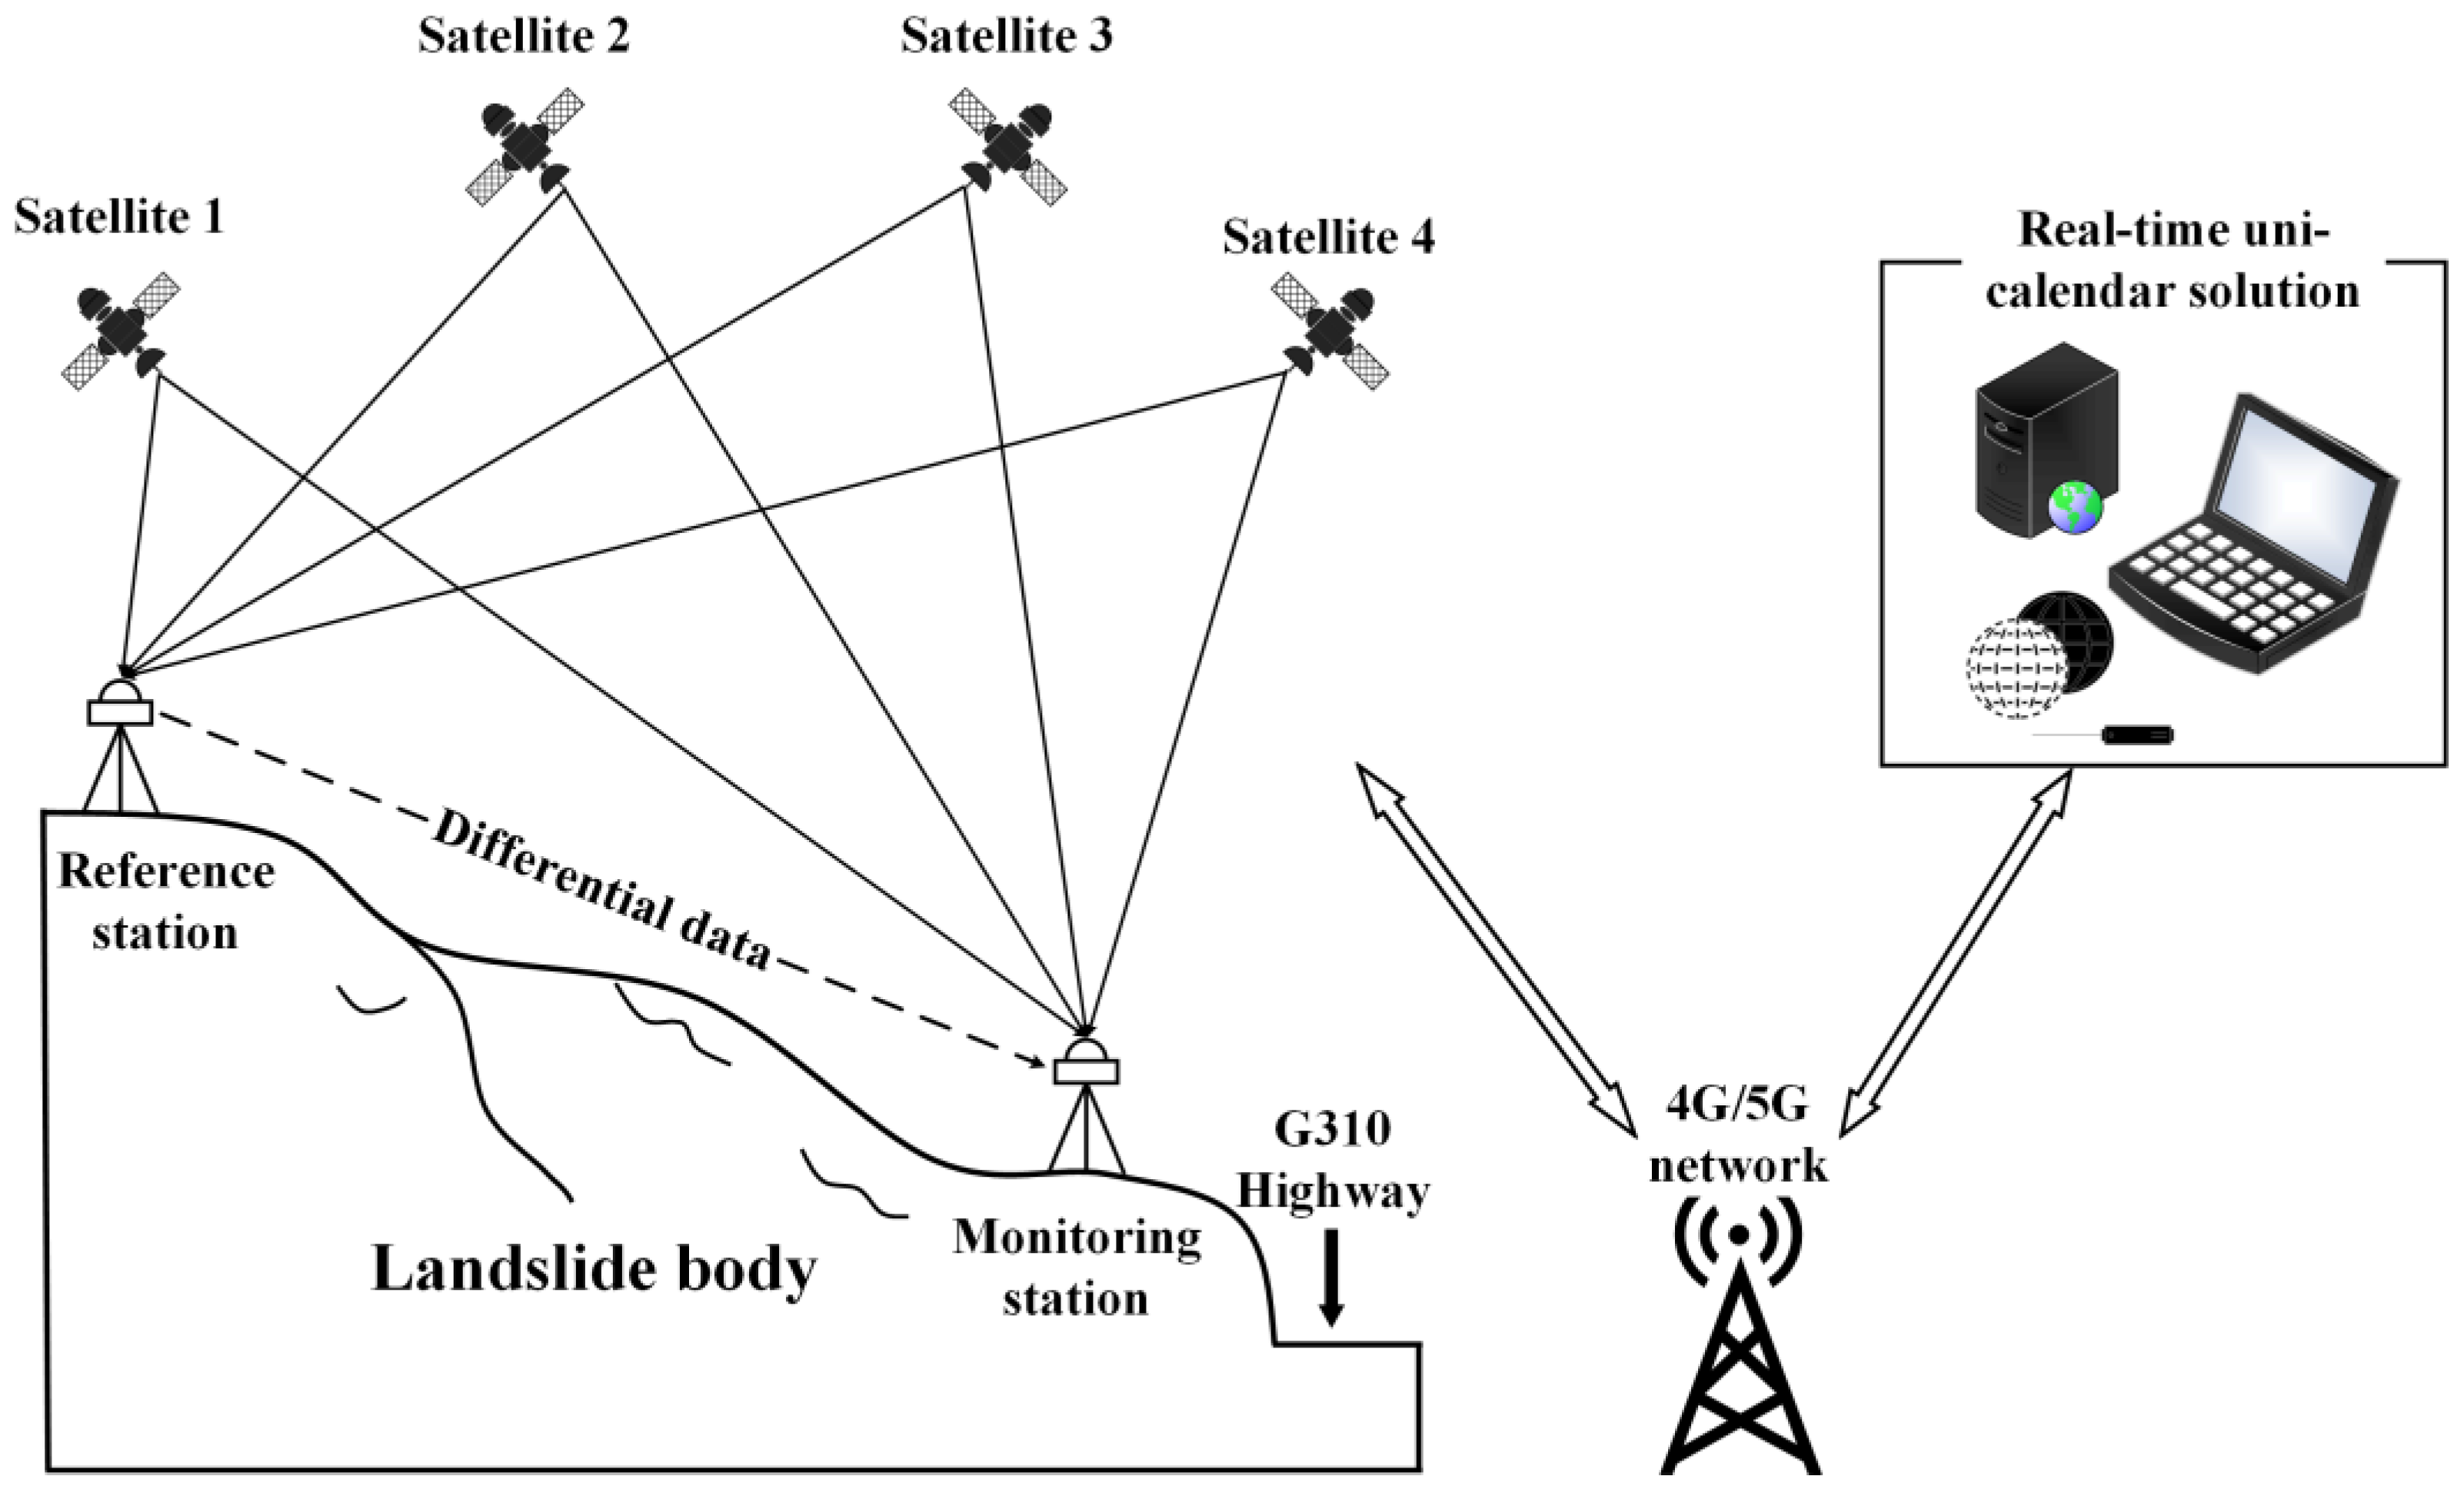
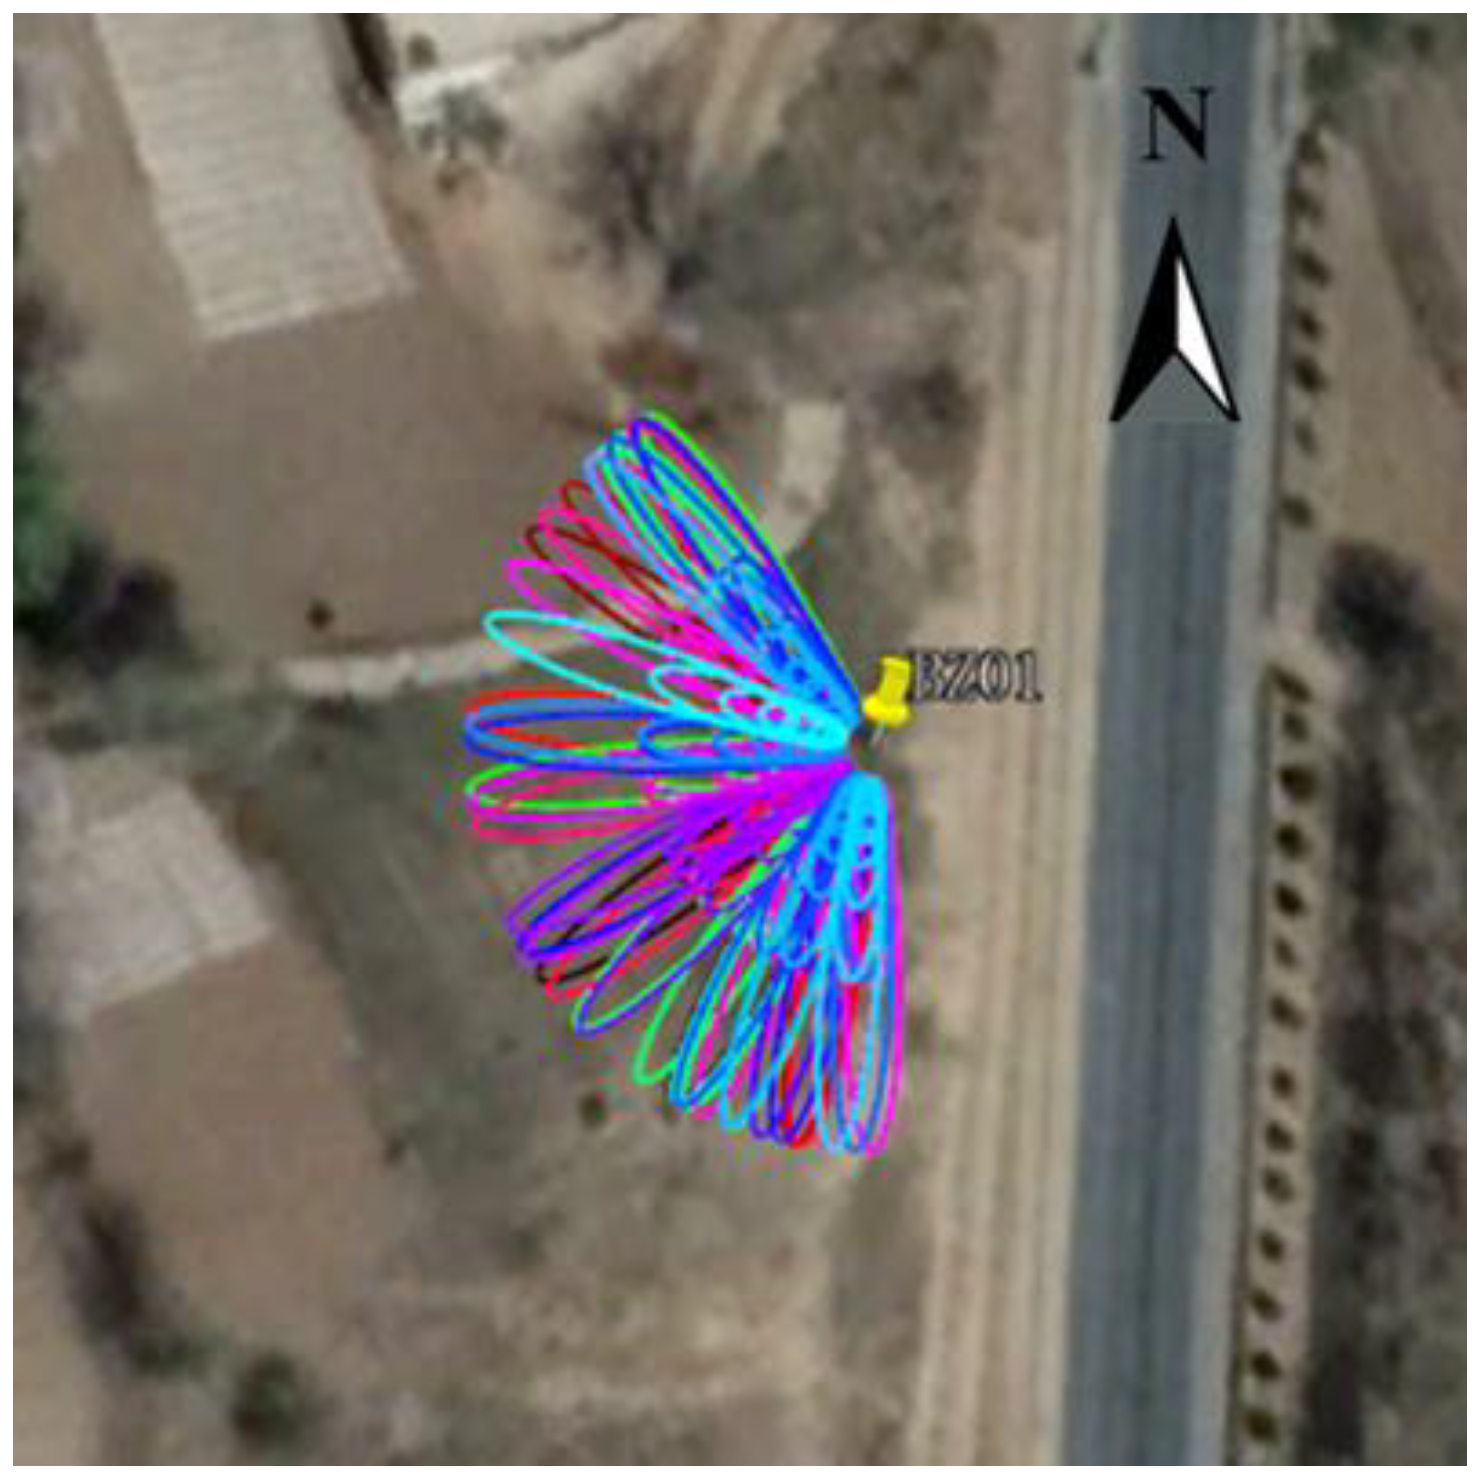
3.1. Experimental Area and Data Source

Linxia is located at the junction of the Qinghai-Tibet Plateau and the Loess Plateau. The terrain was high in the southwest and low in the northeast. The valleys are vertical and horizontal, and erosion and cutting are violent, showing a unique loess landform feature. The main components of loess are hydrophilic clay minerals, mainly composed of montmorillonite and ilmenite, which have certain expansion and contraction properties. These minerals swell when exposed to water and shrink when dry. Under the action of continuous expansion and contraction fatigue, the integrity of the rock and soil structure is destroyed, the volume of medium and small pores increases, and joints and fissures develop until they penetrate the rock and soil structure, thereby forming a broken landslide structure. Figure 4 shows the location and surroundings of this experimental site, which is located southwest of the Linxia Hui Autonomous Prefecture (35°35′44″N, 102°57′2″E), and is an active landslide beside the National Highway G310. The region has a temperate, semi-arid, and semi-humid climate, with heavy rain in summer and cloudy rain in autumn. As the landslide body is located in the shady slope section, the evaporation is small, the water content of the soil is large, and it is easy to form seasonal freezing and thawing alternation, resulting in the section of the mountain body as a slippery section and the slope as a whole sliding towards the highway.
Crack meters, GNSS receivers, and sensors were placed around the landslide. The GNSS receiver can receive observations from GPS in real-time. The sensor collected in situ soil moisture data at a depth of 10 cm and a sampling rate of 1 h; synchronised rainfall data were also observed and recorded. The equipment installed on the landslide captured the development trend of the landslide over time, which provided an important data basis for research on the early warning and occurrence mechanism of the landslide.
Landslides are always accompanied by the development of cracks. Figure 5 shows the relationship between the two-day rainfall and crack width at the experimental site during the flood season in 2019. This stage can be divided into six stages based on the trends of the two curves. The first stage is when neither rainfall nor cracks occur. The rainfall during the two days from 23 August to 25 August increased by approximately 30 mm, and at the same time, the cracks began to develop gradually, and the crack increment was approximately 40 mm. In the third stage, although there was no local rainfall, the cracks continued to grow rapidly to approximately 410 mm, which was in line with the lag between crack development and rainfall. During the four days from 29 August to 2 September, the total local rainfall increment was 24 mm, while the cracks continued to develop, with an increment of 78 mm. The reasons for the sharp increase in cracks include the amount of rainfall in this phase and the lag in the previous phase. In the fifth stage, there was no local rainfall, and the cracks no longer grew, indicating that the hysteresis of the cracks was fully exerted and entered a stable stage. During the two days from September 10th to 12th, the local rainfall increased sharply, with an increment of 104 mm, and the daily average rainfall was heavy rain of 52 mm. Simultaneously, the cracks increased significantly again, with an increment of 612 mm. This shows that the rapid development of cracks from the stable stage was caused by rainstorms. Under heavy rainfall conditions, rainwater can directly reach the weak interlayer of the landslide.
The above analysis shows that the surface cracks of this slope are influenced by rainfall factors and have typical rainfall-type shallow loess landslide characteristics, making it an ideal site for studying the pervasive GNSS interpretation of loess landslide deformation and soil moisture. In this experiment, GNSS data for 2020 were collected to analyse the ability of the pervasive GNSS to decode loess landslide deformation and soil moisture.

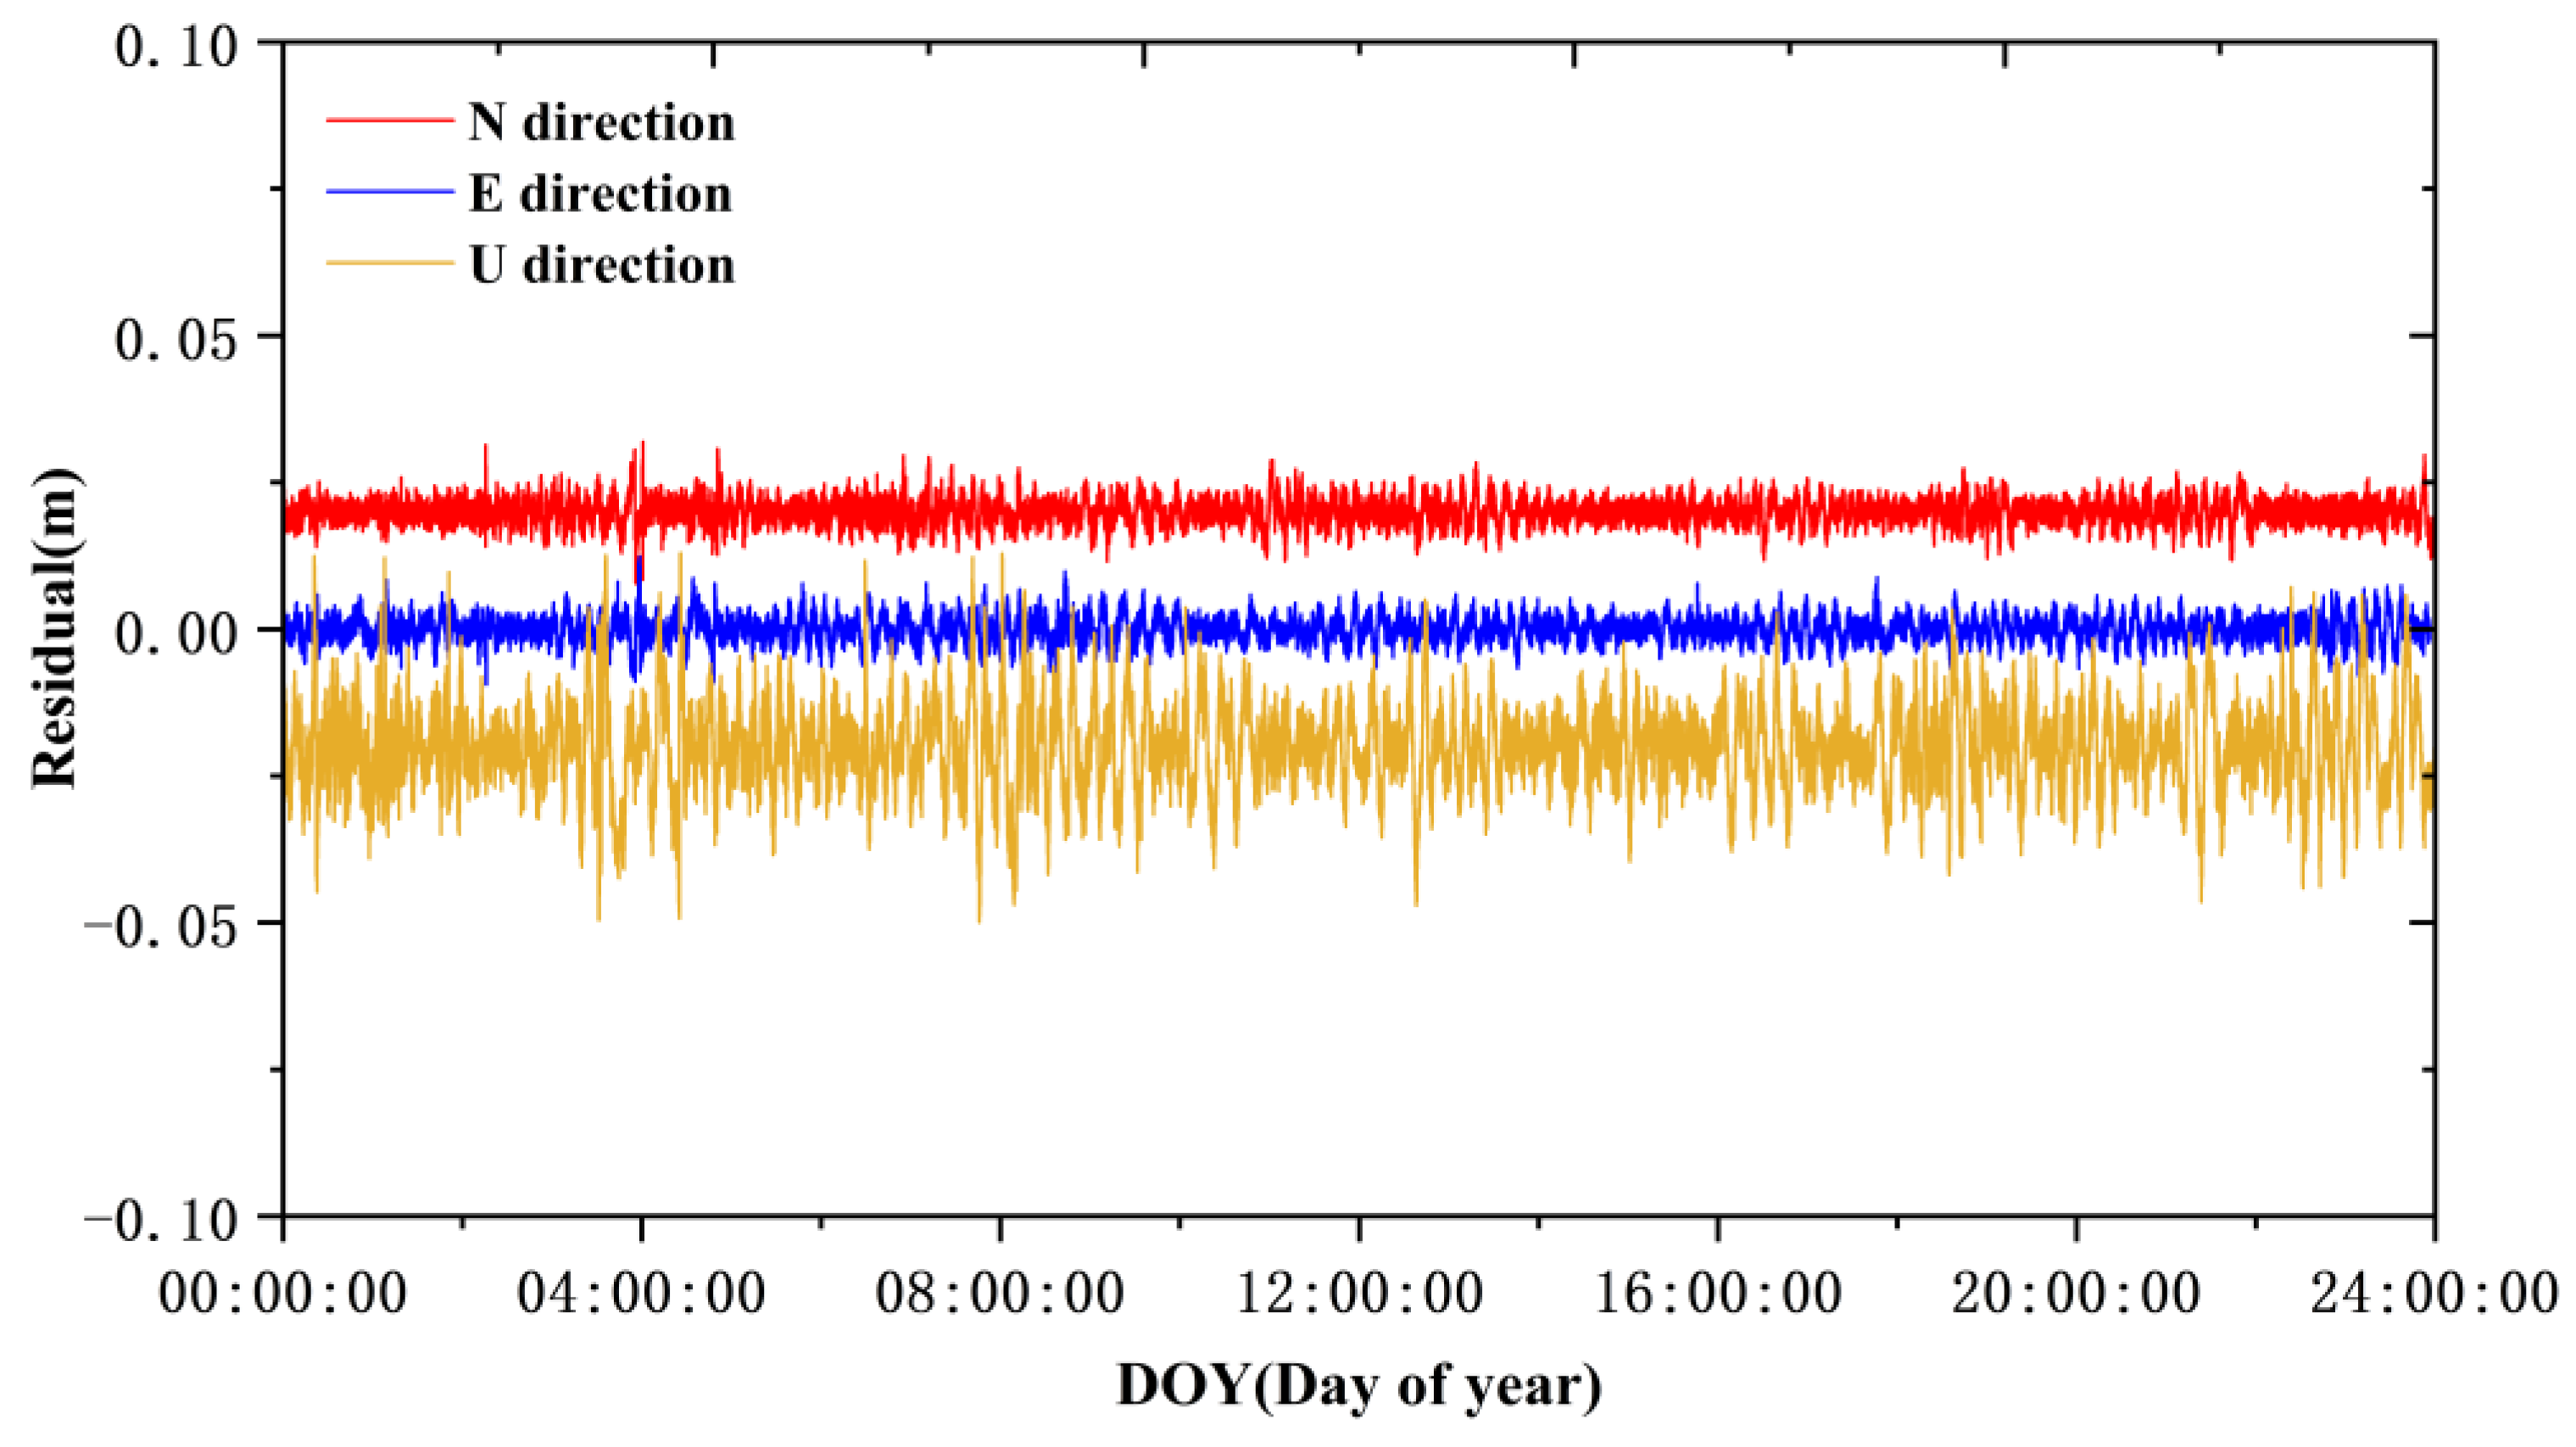
3.2. GNSS Interpretation of Loess Landslide Deformation

To achieve near-real-time and real-time 3D deformation monitoring of landslide surfaces using GNSS with high accuracy, the experiments were based on the high-precision baseline processing software GAMIT/GLOBK and TrackRT modules, and two solution modes of near-real-time baseline solution and real-time single ephemeris solution were implemented. Figure 6 shows the deformation time series in three directions for the entire year of BZ01 station in 2020, as solved by the GAMIT module, where there is no significant deformation in the N, E, and U directions during the period from day 1 to day 245 in 2020. Deformation occurred mainly from day 245 to day 313, with the most pronounced deformation in the easterly direction. Since then, the station has again shown no significant deformation and has stabilised in all three directions.
To analyse the landslide deformation more carefully, accurately, and in real-time, a data processing algorithm based on complementary ensemble empirical mode decomposition (CEEMD) was used to correct the monitoring results of days 245–335 solved by TrackRT; the results are shown in Figure 7. The analysis shows that the N direction of site BZ01 has only changed by approximately 2 cm, the E direction by approximately 78 cm, and the U direction by approximately 12 cm during this period. Deformation in the E direction was slow and steady at the start but increased rapidly starting from day 273, stabilised between days 287 and 302, and then stabilised again with a smaller deformation between days 302 and 313, before levelling off again during the final period.
To evaluate the monitoring accuracy of the GAMIT/TrackRT short baseline mode, the data from day 66 to 90 of landslide stabilisation were selected for the GAMIT accuracy analysis, and the monitoring data from the 254th day, with a total of 86,400 calendar elements selected for the TrackRT accuracy analysis. The GAMIT near-real-time baseline solution results are shown in Figure 8, and the TrackRT single-calendar element localisation results after CEEMD filtering are shown in Figure 9. The RMS statistics of the GAMIT and TrackRT monitoring results are listed in Table 1. As can be seen from Figure 8, site BZ01 is in a stable state on days 66–90, and the accuracy of GAMIT near the real-time baseline solution is within 2 mm in the horizontal direction and within 5 mm in the elevation direction. When evaluating the real-time monitoring accuracy of TrackRT, the GAMIT baseline solution with higher accuracy is taken as the true value, and the single ephemeris solution obtained from TrackRT is compared with the NEU coordinates obtained from GAMIT to obtain the real-time positioning residuals of the monitoring point, that is, positioning accuracy. The analysis shows that the accuracy of the TrackRT real-time monitoring results is within 3 mm in the horizontal direction and 8 mm in the elevation direction after CEEMD sidereal day filtering. One of the essential reasons that the elevation accuracy of GNSS positioning is lower than the plane accuracy is that the fundamental symmetry of satellite distribution can be ensured by selecting the observation period and satellites when GNSS determines the plane position, thus eliminating or weakening the influence of the deviation in distance measurement and the atmospheric delay error and ephemeris error in the process of satellite signal propagation on the plane position. However, for height measurement, all the observed satellites are above the ground level, and the distribution of satellites is always asymmetric and basically on the same orbit. Many systematic errors are difficult to eliminate, which leads to poor quality of vertical component precision factor. Therefore, compared with the U direction in Figure 9, the N and E directions in Figure 8 show larger fluctuations [47]. According to the above experimental results, GNSS can capture the 3D deformation information of landslide surface at the millimetre level in a timely and fast manner.

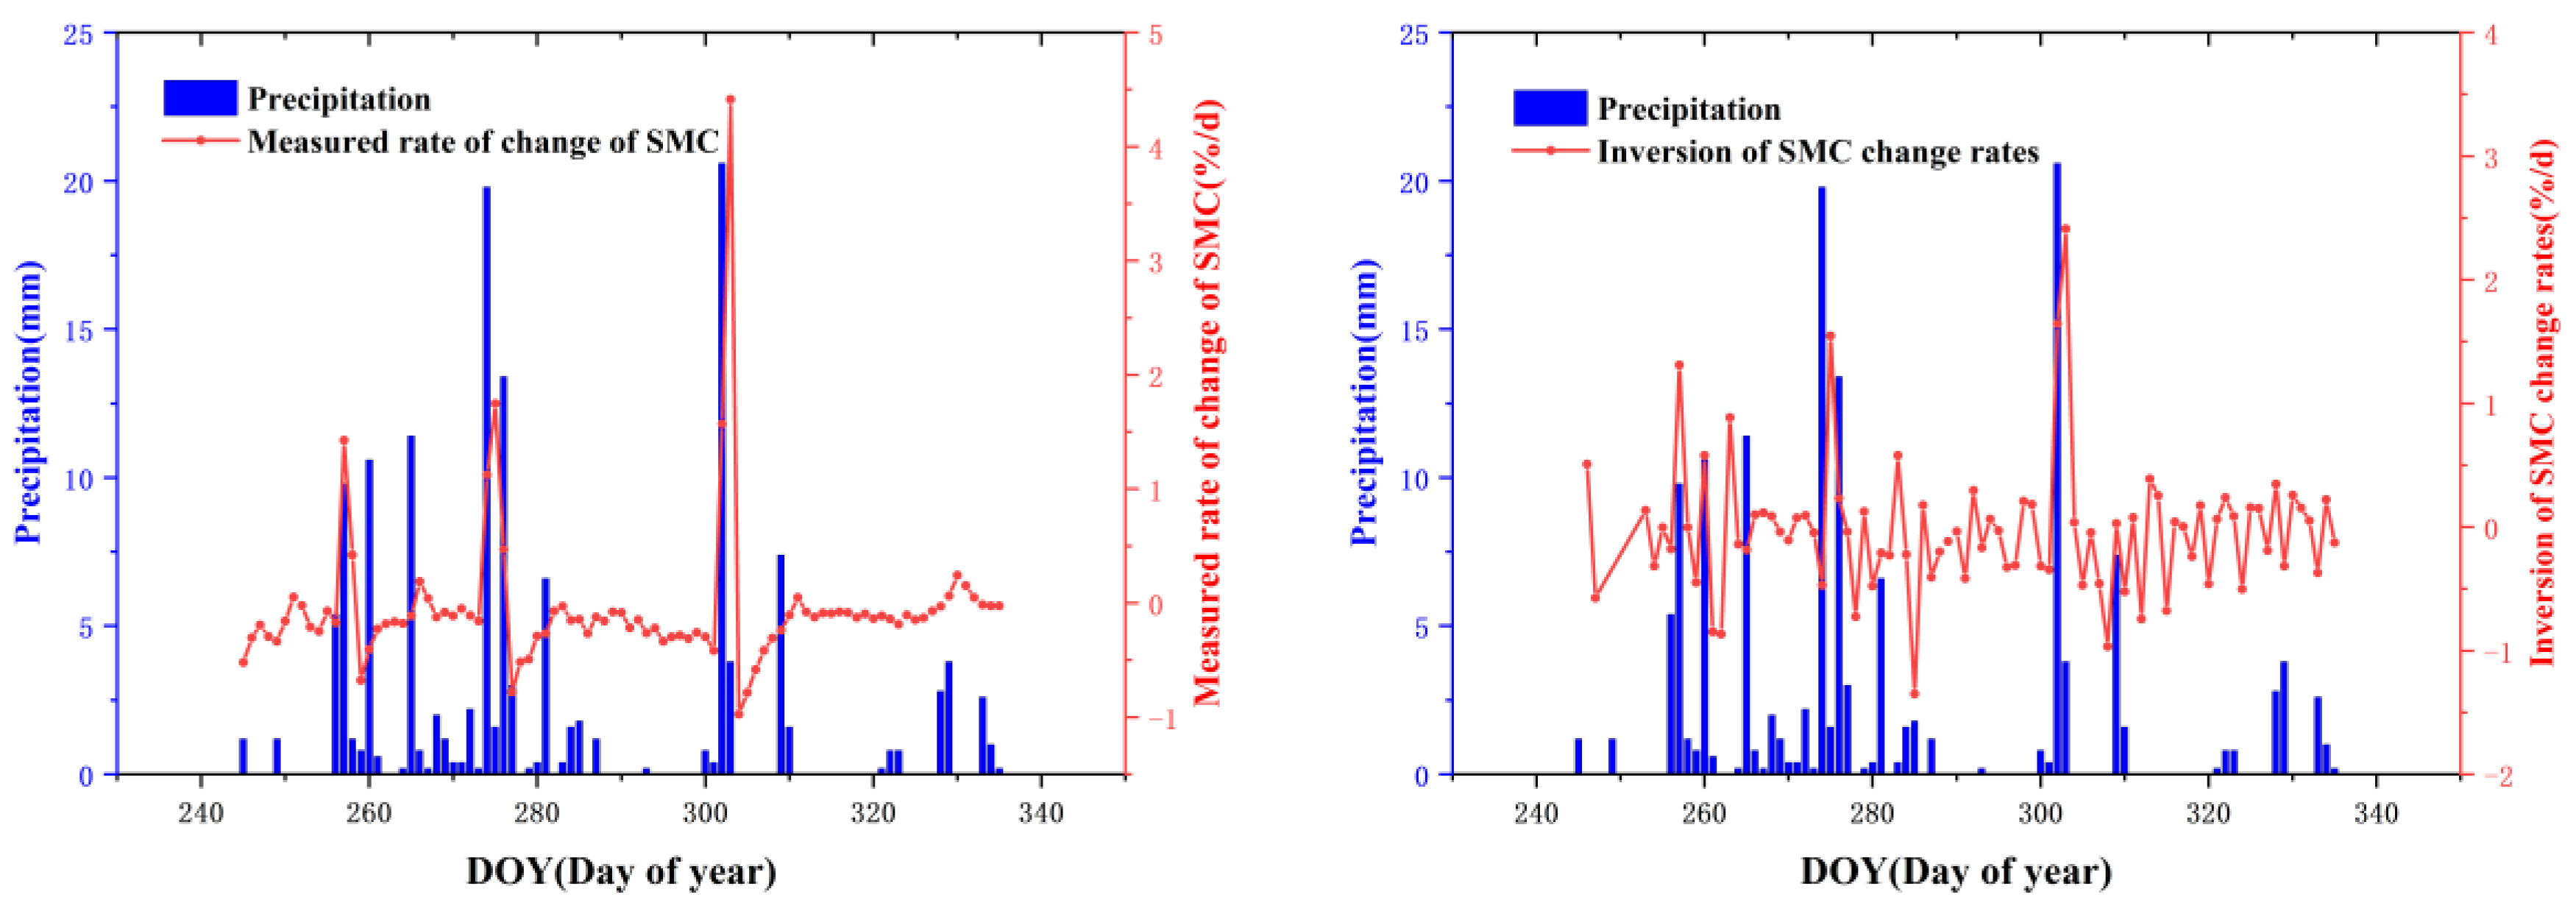
3.3. GNSS Interpretation of Soil Moisture on Loess Landslides

In the process of interpreting soil moisture content monitoring, the first thing that should be determined is the first Fresnel reflection area, that is, the effective area for GNSS to interpret the surface soil moisture of the loess landslide in this experiment. Figure 10 shows the first Fresnel reflections of the satellites at different low-altitude angles in the azimuth range of 180° to 360° for station BZ01, which is the inversion area selected for this experiment. Different colours represent different satellites. It is clear from the above sections that landslide deformation occurs mainly in the E direction and the 245th to 335th days of 2020. Therefore, this section will analyse the accuracy of the soil moisture content of each satellite interpretation during this period, providing important data to support the GNSS monitoring of the response of loess landslide deformation to the interpreted soil moisture content in the next section.
Figure 11 shows the comparison results and correlation analysis between the soil water content decoded by the four satellites and the measured soil water content. From the figure, it can be seen that the resulting curves of each satellite are in good agreement with the measured soil water content change curves, all showing an increasing and decreasing trend with the measured soil water content, in line with the soil water content change, and the correlation coefficients are all significant, reaching 0.78, 0.85, 0.77, and 0.88, respectively. However, at one time or another, the interpretation results showed slight deviations and did not reflect subtle changes in soil water content. For example, satellites G2 and G8 showed anomalous peaks on days 283 and 260 of decreasing soil water content, respectively. During the period of continuous decrease in soil water content from 303 to 328 days, the resulting curves of G2, G8, G9, and G14 fluctuated. Therefore, GNSS-IR technology based on a single satellite is distorted when monitoring subtle changes in soil moisture content. To further explore the reliability of the interpretation of soil water content by GNSS-IR technology, in this paper, the correlation coefficient between the interpretation results of each satellite and the measured soil moisture content is used to determine the weight, and the correlation coefficient is 0.7 as the threshold. If the correlation of the interpretation results of a satellite is less than 0.7 on a certain day or the data is missing, the satellite’s weight is 0, that is, it does not participate in the fusion of that day. Use the following formula to achieve fusion:
S M C F = P 1 S M C 1 + P 1 S M C 1 + + P n S M C n P 1 + P 2 + + P n
where P i represents the weight corresponding to the soil moisture result S M C i interpreted by each satellite, and the final estimated value of soil moisture in the landslide area is obtained.
Figure 12 shows the fused multi-satellite estimates of the soil moisture content around the station, rainfall, and soil moisture collected by the sensors. Red and black represent soil water content estimated by GNSS and in situ soil water content, respectively, and blue bars represent rainfall. The results show that two distinct precipitation events over 15 mm occurred within the studied annual accumulation-day range, which occurred on the 274th day and the 302nd day, respectively. These two precipitation events were accompanied by a marked increase in the soil moisture profile, with soil moisture content peaking on days 276 and 303 at 33.34% and 32.85% soil moisture content, respectively, as rainfall continued to occur in the latter part. During the two time periods of 276–301 and 303–328 days, there was a clear decreasing trend in rainfall, and a slow decrease in soil moisture content occurred until the onset of a new precipitation event. Then, there was another upward fluctuation. The red curve direction of soil water content from the GNSS-IR fusion multi-satellite interpretation can be seen, which does not reflect the actual change in soil water content in some periods. For example, it appeared up and down on days 312–335. Analysing the possible reasons, it may be due to the more complicated reflection area of the landslide, and the extraction of the phase offset is affected. However, in general, the soil water content curves from the GNSS-IR fusion multi-satellite interpretation in this experiment followed the actual measured soil water content curves in the overall trend. The coincidence of the fused results from multiple satellites showed greater consistency than that of single satellites, and the correlation analysis of the fused results with the measured soil water content (Figure 12b) showed a correlation coefficient of 0.89, which is an improvement over that of single satellites.
To further verify that the soil moisture content change decoded by GNSS has a good response to the rainfall process, the measured and fused soil moisture content change rate and rainfall were analysed separately in this study (Figure 13). The results showed that the measured soil moisture content change rate reached higher values on days 257, 275, and 303, with 1.428%/d, 1.748%/d, and 4.415%/d, respectively, and significant rainfall occurred at the corresponding time and a day earlier, in line with the actual situation. Similarly, the rate of change of soil water content from GNSS-IR technology combined with multi-satellite interpretation also reached higher values at the same time. Although there are slight differences between the numerical values and the measured soil water content and more fluctuations in the rate of change than the measured rate of change, the rate of change of soil water content after rainfall shows an increase and a good response relationship with rainfall. This indicates that the soil moisture content interpreted by GNSS-IR can well reflect the transformation trend of soil after rainfall, which is consistent with the actual situation and has high accuracy.

3.4. Interpretation of Loess Landslide Soil Moisture Response Analysis to Deformation

The loess was composed of powdered soil and clay. Large pores, vertical joints, and pores developed, and the resistance to rainwater scouring was weak. The infiltration process and influence depth of rainwater in the rainfall process will directly lead to a change in the soil moisture content of the slope body, thus affecting the strength of the slope soil body, which directly leads to a change in the stability of the loess slope. Therefore, the hydrological environment around the loess landslide is closely related to the landslide deformation. According to the experimental results in the above sections, it can be seen that the baseline solution results of GAMIT have higher accuracy than the solution accuracy of TrackRT module, and the deformation is mainly in the E direction. Therefore, the E-direction deformation results calculated by GAMIT are selected in this section for subsequent correlation analysis. Figure 14 shows the relationship between rainfall and deformation in the E direction. The E direction shifted significantly in the three stages of days 256–273, 273–287, and 301–313, moving 184, 381, and 123 mm, respectively. There was a significant increase in rainfall at the onset of all three deformations, with the single-day rainfall increasing from 5.4 mm, 2.4 mm, and 0.4 mm to 15.2 mm, 20 mm, and 20.6 mm on days 257, 274, and 302, respectively, with respective sequential increases of 9.8 mm, 17.6 mm, and 20.2 mm. No significant rainfall occurred during days 287–301 and 313–335, and accordingly, no significant deformation was observed in the E direction. In addition to the influence of rainfall conditions on landslide deformation on the same day (or at the same time), the influence of accumulated rainfall in the previous period must also be considered. The cumulative rainfall in the text refers to the sum of the rainfall in a certain period before the day. Figure 14b–d shows that the two-day, three-day, and four-day cumulative rainfall also increased to different degrees at the corresponding times when landslide deformation occurred. From the graphs of the relationship between the three- and four-day cumulative rainfall and deformation, it can be found that in the second deformation period, the three-day and four-day cumulative rainfall reached the maximum value during the experimental period, corresponding to 34.8 mm and 37.8 mm of rainfall, so that the second deformation is the largest among the three deformations. It can be concluded that a sudden increase in rainfall is an important factor that induces the occurrence of the three deformations.
To analyse the correlation between landslide deformation and rainfall, the relationship curves between the deformation rate and the factors of single-day rainfall and cumulative rainfall were established for further analysis. In Figure 15, the red and blue bars indicate the deformation rate and rainfall, respectively. The deformation rate reached its peak on days 258, 276, and 304 during the three periods of landslide deformation, which were 0.037, 0.075, and 0.031 m/d, respectively. During this period, the daily rainfall and the cumulative rainfall of two, three, and four days also reached a peak in the period corresponding to the peak deformation rate. In particular, the transformation trend of the cumulative rainfall of three and four days is highly consistent with the changing trend of the deformation rate in the whole period, indicating a strong correlation between the cumulative rainfall and the landslide deformation rate. The results of the lagged correlation analysis between the two results are shown in Figure 16, where the response lag time of deformation rate to single-day, two-day, and three-day cumulative rainfall is 1 day, while the response lag time of deformation rate to four-day cumulative rainfall is 0 days, and With the increase in cumulative rainfall days in the experimental area, the extreme value of the correlation between deformation rate and cumulative rainfall also increases continuously, and the extreme value of the correlation between deformation rate and four-day cumulative rainfall reached 0.8, a significantly high correlation.
Similar to rainfall, soil moisture content is also an important factor influencing landslide deformation. As the soil moisture content increased, the self-weight and sliding force of the landslides increased, while the friction force decreased, which led to accelerated landslide deformation. The cumulative deformation and soil water content for the corresponding periods at monitoring site BZ01 were analysed, and the results are shown in Figure 17. Both the measured soil water content and GNSS-interpreted soil water content showed a significant increase in soil water content at the three deformation occurrences, and the measured soil water content increased from 30.48%, 30%, and 26.87% to 31.92%, 31.12%, and 28.43% on days 257, 274, and 302, respectively, with increases of 4%, 4%, and 6%, respectively. Although the soil moisture content results from the GNSS interpretation showed a decrease on day 274 instead of inversion errors, the soil moisture content was enhanced on the following 275 days, with increases of 4%, 5%, and 6% on days 257, 275, and 302, respectively. The results indicate that the change in soil moisture affects the shear strength of the soil and is one of the most important predisposing factors for the deformation of loess landslides.
To further analyse the influence of soil moisture on landslide deformation, the deformation rate and soil moisture data were analysed, and the results are shown in Figure 18, showing that the deformation rate and soil moisture have the same change trend during the monitoring period, and it can be judged that there is some correlation between them. The results of the lagged correlation analysis between the two results are shown in Figure 19, indicating that the measured soil moisture content results and GNSS-decoded soil moisture content reached a peak when the lagged period was 0 days. The extreme value of the correlation between the measured soil moisture content and GNSS-decoded soil moisture content was 0.7, and the extreme value of the correlation between the measured soil moisture content and GNSS-decoded soil moisture content was 0.65, both of which were highly correlated.
The relationship between soil water content and landslide deformation was significant. To investigate whether the rate of change in soil water content affects landslide deformation, the rate of change of soil water content is analysed with deformation and deformation rate. Figure 20 shows the relationship between the rate of change of soil water content and deformation. The measured and interpreted soil moisture content rates reached their respective peaks on days 257, 275, and 303 during the three deformation periods. Figure 21 shows the relationship between the rate of change of soil water content and the rate of deformation based on the previous analysis, demonstrating the rate of change in soil water content peaked on days 258, 276, and 304 after the rate of change of soil water content also reached its respective peaks in the three periods. The two trends are consistent, indicating that the sudden increase in the soil moisture rate is also one of the factors affecting the deformation of loess landslides, and both have a good response relationship.

4. Discussion

Loess landslides are complex geological hazards, and their deformation processes are usually accompanied by various factors, such as rainfall, soil water content, geotechnical body, and freeze–thaw. In this study, we propose a ground-based GNSS remote sensing integrated monitoring system integrating “soil water content and 3D deformation,” and conduct experiments based on a landslide event in Linxia City, demonstrating that GNSS, as a powerful tool for landslide disaster monitoring and early warning, can provide high-precision 3D deformation time series and facilitate rapid capture of sudden landslides. GNSS can also provide changes in soil moisture content associated with rainfall intensity as a signal source for remote sensing monitoring using the error term multipath effect, which is considered to interfere with navigation positioning accuracy, and changes in soil moisture content can affect changes in internal soil stress. By correlating the deformation and deformation rate sequences with rainfall, soil water content, and soil water content change rate at monitoring site BZ01 in the monitoring area, the results show that the landslide deformation rate is significantly correlated with cumulative rainfall: the response lag time to single-day, two-day, and three-day cumulative rainfall is 1 day, and the response lag time to four-day cumulative rainfall is 0 days, and the extreme value of correlation also reaches the rate of deformation is highly correlated with soil moisture content, and the lag time of response to shallow loess moisture is approximately 0 days. The rate of change of soil moisture content is also an important indicator for analysing landslide deformation and deformation rate, and when it reaches its peak, the increase in surface deformation and the rate of change also reach their peaks accordingly. Therefore, soil water content and change rate are the key indicators of landslide deformation, and accumulated rainfall is the key factor affecting soil water content change. In the subsequent study, GNSS receivers deployed in different parts of the landslide will be used to interpret the shallow soil moisture content around the measuring station, and the influence of soil moisture content changes in different parts of the landslide on deformation will be compared. Finally, the influence of various factors on landslide deformation will be more comprehensively analysed by combining with pore water pressure and other parameters.
To further analyse the potential of ground-based GNSS remote sensing in the comprehensive monitoring of loess landslides, we calculated the atmospheric water vapour content in the landslide area. From Figure 22, we can see that there is always an accumulation process of PWV before the rainfall event, and PWV drops rapidly after the rainfall. Landslides caused by rainfall events usually have a certain lag, and the monitoring of rainfall events is important for landslide disaster warnings. PWV and rainfall events have a strong correlation. Therefore, PWV information estimated using GNSS in real-time can provide a reference for landslide disaster warnings. It should be noted that because of the short length of the time series of the experimental data and the single experimental site, the decoded soil water content area has almost no vegetation growing as bare soil, and the terrain is relatively flat compared with other landslides. The conclusions drawn need to be further verified. We will continue to conduct in-depth research on this topic, so that the universal GNSS can better serve landslide disaster monitoring, provide more data analysis for landslide disaster occurrence, and establish more comprehensive reference indicators for landslide disaster warning.

5. Outlook

The carrier wave used by GNSS satellites is located in the L-band of microwaves, which is less affected by bad weather, such as fog, rain, and snow, and can penetrate the cloud layer, which is particularly sensitive to soil moisture content. Therefore, it is conducive to long-term, stable, and all-weather observations. Along with the continuous improvement of the GNSS decoding soil moisture algorithm, the continuous improvement of global CORS stations, and the continuous increase in the total number of future GNSS satellites will provide rich data for the study of GNSS decoding landslide area environments and monitoring surface deformation, further promoting the research and application of this technology in landslide soil moisture monitoring, and can also enable GNSS to play a better role in landslide disaster monitoring and early warning.
With the rapid development of landslide monitoring technology, the means of monitoring various triggering factors of landslides have been improved, and the real-time monitoring data and sampling rate have been enhanced. Figure 23 illustrates the ultimate goal of obtaining 3D deformation, atmospheric water vapour content, and soil water content information of the landslide survey area using GNSS carrier phase difference, GNSS refraction remote sensing, and GNSS reflection remote sensing, and integrating 5G, artificial intelligence, the Internet of Things, cloud computing, and real-time GNSS data acquisition technology, respectively, to complete a comprehensive monitoring system integrating “soil water content, 3D deformation, and atmospheric water vapour content”. Real-time GNSS data acquisition technology can efficiently encode the data streams of GNSS monitoring stations along the pipeline in RTCM format and transmit them to the data centre in real-time following the Internet transmission protocol, which provides important support for the subsequent decoding of soil water content, atmospheric water vapour content, and precise positioning data processing. This comprehensive monitoring system can theoretically realise continuous monitoring all day and night and achieve early activation of the plan when disaster damage occurs under extreme weather or unfavourable factors, which can greatly reduce the cost of disaster monitoring and disaster warning and is conducive to strengthening the meteorological risk warning of geological disasters in the disaster area and enabling GNSS to better monitor loess landslide disasters.

Author Contributions

Conceptualization, X.Z., S.Z. and Q.Z.; methodology, X.Z., S.Z., Q.L. and Z.M.; software, X.Z.; validation, X.Z., T.W., J.T. and X.L.; writing—original draft preparation, X.Z. and S.Z.; writing—review and editing, Q.Z. and J.T.; supervision, Q.Z. All authors have read and agreed to the published version of the manuscript.

Funding

This research was funded by the Programs of the National Natural Science Foundation of China (42127802); the National Natural Science Foundation of China Projects (Grant No.42074041; 41731066); the National Natural Science Foundation of China Projects (Grant No.42074041); The National Key Research and Development Program of China (Grant No.2020YFC1512000; 2019YFC1509802); State Key Laboratory of Geo-Information Engineering (Grant No. SKLGIE2019-Z-2-1), Shaanxi Natural Science Research Program (Grant No.2020JM-227), This research was also supported in part by the Fundamental Research Funds for the Central Universities, Chang’an University, (Grant No.300 102260301, 300 102262401), in part by the Shaanxi Province Science and Technology Innovation Team (Grant No. 2021 TD-51), and in part by the European Space Agency through the ESA-MOST DRAGON-5 Project (Grant No. 59339).

Institutional Review Board Statement

Not applicable.

Informed Consent Statement

Not applicable.

Data Availability Statement

Not applicable.

Acknowledgments

The authors would like to thank Kristine Larson, Carolyn Roesler, Berkay Bahadur, and many others who have provided open access to MATLAB code. All anonymous reviewers and editors are thanked for their constructive review of this manuscript.

Conflicts of Interest

The authors declare no conflict of interest.

References

  1. Highland, L. Landslide Types and Processes; U.S. Geological Survey: Reston, VA, USA, 2004. [Google Scholar]
  2. Zhang, Q.; Hang, G.; Yang, C. Precision space observation technique for geological hazard monitoring and early warning. Acta Geodaet. Cartogr. Sin. 2017, 46, 1300. [Google Scholar]
  3. Bogaard, T.A.; Greco, R. Landslide hydrology: From hydrology to pore pressure: Wiley Interdisciplinary Reviews. Water 2016, 3, 439–459. [Google Scholar]
  4. Zhang, F.; Chen, W.; Liu, G.; Liang, S.; Kang, C.; He, F. Relationships between landslide types and topographic attributes in a loess catchment, China. J. Mount. Sci. 2012, 9, 742–751. [Google Scholar] [CrossRef]
  5. Bai, X.; Sang, L.; Bai, G.; Kang, H.; Liu, Z. Research Progress in Loess Landslides Forecast and Prediction Based on Assimilating Multi-Source Information. IOP Conf. Ser. Earth Environ. Sci. 2019, 310, 052045. [Google Scholar] [CrossRef]
  6. Wang, J.J.; Liang, Y.; Zhang, H.P.; Wu, Y.; Lin, X. A loess landslide induced by excavation and rainfall. Landslides 2014, 11, 141–152. [Google Scholar] [CrossRef]
  7. Zhuang, J.; Peng, J.; Wang, G.; Javed, I.; Wang, Y.; Li, W. Distribution and characteristics of landslide in Loess Plateau: A case study in Shaanxi province. Eng. Geol. 2018, 236, 89–96. [Google Scholar] [CrossRef]
  8. Calcaterra, S.; Cesi, C.; Di Maio, C.; Gambino, P.; Merli, K.; Vallario, M.; Vassallo, R. Surface displacements of two landslides evaluated by GPS and inclinometer systems: A case study in Southern Apennines, Italy. Nat. Hazards 2012, 61, 257–266. [Google Scholar] [CrossRef]
  9. Wang, L. A study on key technology of high precision gps monitoring for geological hazard. Acta Geodaet. Cartogr. Sin. 2015, 44, 826. [Google Scholar]
  10. Bai, Z.; Zhang, Q.; Huang, G.; Jing, C.; Wang, J. Real-time BeiDou landslide monitoring technology of “light terminal plus industry cloud”. Acta Geodaet. Cartogr. Sin. 2019, 48, 1424. [Google Scholar]
  11. Lumb, P. Slope failures in Hong Kong. Q. J. Eng. Geol. 1975, 8, 31–65. [Google Scholar] [CrossRef]
  12. Lehmann, P.; Gambazzi, F.; Suski, B.; Baron, L.; Askarinejad, A.; Springman, S.M.; Holliger, K.; Or, D. Evolution of soil wetting patterns preceding a hydrologically induced landslide inferred from electrical resistivity survey and point measurements of volumetric water content and pore water pressure. Water Resour. Res. 2013, 49, 7992–8004. [Google Scholar] [CrossRef]
  13. Zhang, M.; Jie, L. Controlling factors of loess landslides in western China. Environ. Earth Sci. 2010, 59, 1671–1680. [Google Scholar] [CrossRef]
  14. Qiu, C.; Su, L.; Zou, Q.; Geng, X. A hybrid machine-learning model to map glacier-related debris flow susceptibility along Gyirong Zangbo watershed under the changing climate. Sci. Total Environ. 2022, 818, 151752. [Google Scholar] [CrossRef]
  15. Brand, E.W. Some thoughts on rain-induced slope failures. In Proceedings of the 10th International Conference on Soil Mechanics and Foundation Engineering, Stocholm, Sweden, 15–19 June 1981; A.A. Balkema: Roterdam, The Netherlands, 1981; Volume 3, pp. 373–376. [Google Scholar]
  16. Anderson, S.A.; Sitar, N. Analysis of rainfall-induced debris flows. J. Geotech. Eng. 1995, 121, 544–552. [Google Scholar] [CrossRef]
  17. Gens, A. Soil–environment interactions in geotechnical engineering. Géotechnique 2010, 60, 3–74. [Google Scholar] [CrossRef]
  18. Xu, L.; Dai, F.C.; Tu, X.B.; Javed, I.; Woodard, M.J.; Jin, Y.L.; Tham, L.G. Occurrence of landsliding on slopes where flowsliding had previously occurred: An investigation in a loess platform, North-west China. Catena 2013, 104, 195–209. [Google Scholar] [CrossRef]
  19. Sorbino, G.; Nicotera, M.V. Unsaturated soil mechanics in rainfall-induced flow landslides. Eng. Geol. 2013, 165, 105–132. [Google Scholar] [CrossRef]
  20. Larson, K.M.; Small, E.E.; Gutmann, E.; Bilich, A.; Axelrad, P.; Braun, J. Using GPS multipath to measure soil moisture fluctuations: Initial results. GPS Solut. 2008, 12, 173–177. [Google Scholar] [CrossRef]
  21. Larson, K.M.; Small, E.E.; Gutmann, E.D.; Bilich, A.L.; Braun, J.J.; Zavorotny, V.U. Use of GPS receivers as a soil moisture network for water cycle studies. Geophys. Res. Lett. 2008, 35, L24405. [Google Scholar] [CrossRef] [Green Version]
  22. Chew, C.C.; Small, E.E.; Larson, K.M.; Zavorotny, V.U. Effects of near-surface soil moisture on GPS SNR data: Development of a retrieval algorithm for soil moisture. IEEE Trans. Geosci. Remote Sens. 2013, 52, 537–543. [Google Scholar] [CrossRef]
  23. Chew, C.C.; Small, E.E.; Larson, K.M. An Algorithm for Soil Moisture Estimation Using GPS-Interferometric Reflectometry for Bare and Vegetated Soil. GPS Solut. 2016, 20, 525–537. [Google Scholar] [CrossRef]
  24. Vey, S.; Güntner, A.; Wickert, J.; Blumek, T.; Ramatschi, M. Long-term soil moisture dynamics derived from GNSS interferometric reflectometry: A case study for Sutherland, South Africa. GPS Solut. 2016, 20, 641–654. [Google Scholar] [CrossRef]
  25. Yang, T.; Wan, W.; Chen, X.; Chu, T.; Hong, Y. Using BDS SNR observations to measure near-surface soil moisture fluctuations: Results from low vegetated surface. IEEE Geosci. Remote Sens. Lett. 2017, 14, 1308–1312. [Google Scholar] [CrossRef]
  26. Shi, Y.; Ren, C.; Yan, Z.; Lai, J. High Spatial-Temporal Resolution Estimation of Ground-Based Global Navigation Satellite System Interferometric Reflectometry (GNSS-IR) Soil Moisture Using the Genetic Algorithm Back Propagation (GA-BP) Neural Network. ISPRS Int. J. Geo-Inform. 2021, 10, 623. [Google Scholar] [CrossRef]
  27. Larson, K.M.; Nievinski, F.G. GPS snow sensing: Results from the EarthScope Plate Boundary Observatory. GPS Solut. 2013, 17, 41–52. [Google Scholar] [CrossRef]
  28. Ran, Q.; Zhang, B.; Yao, Y.; Yan, X.; Li, J. Editing arcs to improve the capacity of GNSS-IR for soil moisture retrieval in undulating terrains. GPS Solut. 2022, 26, 1–11. [Google Scholar] [CrossRef]
  29. Nie, S.; Wang, Y.; Tu, J.; Li, P.; Xu, J.; Li, N.; Wang, M.; Huang, D.; Song, J. Retrieval of Soil Moisture Content Based on Multisatellite Dual-Frequency Combination Multipath Errors. Remote Sens. 2022, 14, 3193. [Google Scholar] [CrossRef]
  30. Chen, R.; Wang, L.; Li, D.; Chen, L.; Wenju, F. A survey on the fusion of the navigation and the remote sensing techniques. Acta Geodaet. Cartogr. Sin. 2019, 48, 1507. [Google Scholar]
  31. Yu, K.; Han, S.; Bu, J.; An, Y.; Zhoud, Z.; Wang, C.; Tabibi, S.; Wayn Cheong, J. Spaceborne GNSS Reflectometry. Remote Sens. 2022, 14, 1605. [Google Scholar] [CrossRef]
  32. Jin, S.; Feng, G.P.; Gleason, S. Remote sensing using GNSS signals: Current status and future directions. Adv. Space Res. 2011, 47, 1645–1653. [Google Scholar] [CrossRef]
  33. Jiang, W.; Jiao, Q.; Luo, Y.; Li, Y.; Li, Q.; Li, B. Risk investigation of landslide hazard and disaster emergency based on multi-platforms remote sensing techniques. In Proceedings of the IGARSS 2020–2020 IEEE International Geoscience and Remote Sensing Symposium, Virtual Symposium, 26 September–2 October 2020; pp. 5211–5214. [Google Scholar]
  34. Lissak, C.; Bartsch, A.; De Michele, M.; Gomez, C.; Maquaire, O.; Raucoules, D.; Roulland, T. Remote sensing for assessing landslides and associated hazards. Surv. Geophys. 2020, 41, 1391–1435. [Google Scholar] [CrossRef]
  35. Chae, B.G.; Park, H.J.; Catani, F.; Simoni, A.; Berti, M. Landslide prediction, monitoring and early warning: A concise review of state-of-the-art. Geosci. J. 2017, 21, 1033–1070. [Google Scholar] [CrossRef]
  36. Qiang, X.; Xing, Z.; Weile, L.; Xiujun, D.; Karen, D.; Yanan, J.; Huiyan, L.; Chen, G. Technical progress of space-air-ground collaborative monitoring of landslide. Acta Geodaet. Cartogr. Sin. 2022, 51, 1416–1436. [Google Scholar]
  37. Xu, X.; Shang, M.; Deng, Y.H. Analysis about the classification of Landslide Monitoring Method. Appl. Mech. Mater. 2014, 638, 360–364. [Google Scholar] [CrossRef]
  38. Gili, J.A.; Corominas, J.; Rius, J. Using Global Positioning System techniques in landslide monitoring. Eng. Geol. 2000, 55, 167–192. [Google Scholar] [CrossRef]
  39. Carlà, T.; Tofani, V.; Lombardi, L.; Raspini, F.; Bianchini, S.; Bertolo, D.; Thuegaz, P.; Casagli, N. Combination of GNSS, satellite InSAR, and GBInSAR remote sensing monitoring to improve the understanding of a large landslide in high alpine environment. Geomorphology 2019, 335, 62–75. [Google Scholar] [CrossRef]
  40. Yongqi, C.; Lutes, J. Development of the Methodology for Single Epoch GPS Deformation Monitoring. Geomat. Inform. Sci. Wuhan Univ. 1998, 23, 324–328,363. [Google Scholar]
  41. Soto, J.; Galve, J.P.; Palenzuela, J.A.; Azañón, J.M.; Tamay, J.; Irigaray, C. A multi-method approach for the characterization of landslides in an intramontane basin in the Andes (Loja, Ecuador). Landslides 2017, 14, 1929–1947. [Google Scholar] [CrossRef]
  42. Uhlemann, S.; Chambers, J.; Wilkinson, P.; Maurer, H.; Merritt, A.; Meldrum, P.; Kuras, O.; Gunn, D.; Smith, S.; Dijkstra, R. Four-dimensional imaging of moisture dynamics during landslide reactivation. J. Geophys. Res. Earth Surf. 2017, 122, 398–418. [Google Scholar] [CrossRef] [Green Version]
  43. Bourdeau, C.; Lenti, L.; Martino, S.; Oguz, O.; Yalcinkaya, E.; Bigarrè, P.; Coccia, S. Comprehensive analysis of the local seismic response in the complex Büyükçekmece landslide area (Turkey) by engineering-geological and numerical modelling. Eng. Geol. 2017, 218, 90–106. [Google Scholar] [CrossRef] [Green Version]
  44. Teunissen, P.J.G.; Giorgi, G.; Buist, P.J. Testing of a new single-frequency GNSS carrier phase attitude determination method: Land, ship and aircraft experiments. GPS Solut. 2010, 15, 15–28. [Google Scholar] [CrossRef] [Green Version]
  45. Bilich, A.; Larson, K.M. Mapping the GPS multipath environment using the signal-to-noise ratio (SNR). Radio Sci. 2007, 42, 1–16. [Google Scholar] [CrossRef]
  46. Zhang, S.; Roussel, N.; Boniface, K.; Ha, M.C.; Frappart, F.; Darrozes, J.; Baup, F.; Calvet, J.-C. Use of reflected GNSS SNR data to retrieve either soil moisture or vegetation height from a wheat crop. Hydrol. Earth Syst. Sci. 2017, 21, 4767–4784. [Google Scholar] [CrossRef]
  47. Kaplan, E.; Hegarty, C.J. Understanding GPS/GNSS: Principles and Applications; Artech House: New York, NY, USA, 2017. [Google Scholar]
Figure 1. Application of Global Navigation Satellite System (GNSS) in landslide monitoring.
Remotesensing 14 05687 g001
Figure 2. GNSS—real-time kinematic (RTK) landslide deformation monitoring technology.
Remotesensing 14 05687 g002
Figure 3. Schematic diagram of soil moisture monitoring by GNSS.
Remotesensing 14 05687 g003
Figure 4. The location and surroundings of the experimental site.
Remotesensing 14 05687 g004
Figure 5. Relationship between rainfall and crack width.
Remotesensing 14 05687 g005
Figure 6. GAMIT baseline solving cumulative deformation time series.
Remotesensing 14 05687 g006
Figure 7. TrackRT single-epoch solves the cumulative deformation time series.
Remotesensing 14 05687 g007
Figure 8. GAMIT baseline solving cumulative deformation.
Remotesensing 14 05687 g008
Figure 9. TrackRT Single-epoch localization residual results.
Remotesensing 14 05687 g009
Figure 10. Part of the satellite Fresnel reflection area in 180°–360° azimuth at BZ01 station.
Remotesensing 14 05687 g010
Figure 11. (a) Comparison results of soil moisture by satellite interpretation and measured soil moisture. (b) Correlation analysis between measured soil moisture and inverse soil moisture.
Remotesensing 14 05687 g011
Figure 12. (a) Comparison of the results after integration with the measured soil moisture. (b) Correlation analysis of the integration results with the measured soil moisture.
Remotesensing 14 05687 g012
Figure 13. Relationship between rainfall and rate of change of (left) inverted soil moisture; (right) measured soil moisture.
Remotesensing 14 05687 g013
Figure 14. Relationship between deformation and (a) single-day rainfall; (b) two-day cumulative rainfall; (c) three-day cumulative rainfall; and (d) four-day cumulative rainfall.
Remotesensing 14 05687 g014
Figure 15. Relationship between deformation rate and (a) single-day rainfall; (b) two-day cumulative rainfall; (c) three-day cumulative rainfall; and (d) four-day cumulative rainfall.
Remotesensing 14 05687 g015
Figure 16. (a) Single-day rainfall; (b) two-day cumulative rainfall; (c) three-day cumulative rainfall; and (d) four-day cumulative rainfall and deformation rate time lag intercorrelation series.
Remotesensing 14 05687 g016
Figure 17. Relationship between soil moisture and deformation.
Remotesensing 14 05687 g017
Figure 18. Relationship between deformation rate and (a) measured soil moisture; (b) inverse soil moisture.
Remotesensing 14 05687 g018
Figure 19. (a) Measured soil moisture; (b) inverse soil moisture and deformation rate time lag intercorrelation series.
Remotesensing 14 05687 g019
Figure 20. Relationship between deformation and the rate of change of (a) measured soil moisture; (b) inverse soil moisture.
Remotesensing 14 05687 g020
Figure 21. Relationship between rate of deformation and rate of change of (a) measured soil moisture; (b) inverse soil moisture.
Remotesensing 14 05687 g021
Figure 22. Relationship between PWV and rainfall estimated by GNSS receivers.
Remotesensing 14 05687 g022
Figure 23. Design idea of GNSS integrated landslide monitoring system.
Remotesensing 14 05687 g023
Table 1. Two kinds of monitoring results NEU direction RMS precision statistics (Unit: mm).
NEU
GAMIT1.61.74.8
TrackRT2.22.17.5
Publisher’s Note: MDPI stays neutral with regard to jurisdictional claims in published maps and institutional affiliations.

