Article

Spatio-Temporal Multi-Scale Analysis of Landscape Ecological Risk in Minjiang River Basin Based on Adaptive Cycle

1
College of Forestry, Fujian Agriculture and Forestry University, Fuzhou 350002, China
2
University Key Lab for Geomatics Technology and Optimize Resource Utilization in Fujian Province, Fujian Agriculture and Forestry University, Fuzhou 350002, China
*
Author to whom correspondence should be addressed.
Remote Sens. 2022, 14(21), 5540; https://doi.org/10.3390/rs14215540
Submission received: 31 August 2022 / Revised: 30 October 2022 / Accepted: 31 October 2022 / Published: 3 November 2022

Abstract

:
Landscape ecological security is an environmental requirement for social and economic development. Understanding the dynamic mechanisms of landscape change and the associated ecological risks in regional socioecological systems is necessary for promoting regional sustainable development. Using the Minjiang River Basin as the research area, the Google Earth Engine platform, random forest (RF) model, and FLUS model were employed for land use classification and future multi-scenario prediction. Multisource remote sensing data were used to establish a three-dimensional evaluation index system for an adaptive cycle. Additionally, the “potential-connection-resilience” framework was adopted to explore the spatial and temporal variations in landscape ecological risk in the basin from 2001 to 2035 under different administrative scales and development scenarios. The results showed that from 2001 to 2020, the building and forest areas increased significantly, whereas grassland and plowland areas decreased significantly. Moreover, the spatial fragmentation of the watershed improved significantly with the transformation of large amounts of grassland into forests. The construction area continued to expand in 2035 under different scenarios. Under the economic development scenario, the grassland and plowland areas decreased considerably, but the forest area increased slowly. Under the ecological protection scenario, the expansion of land use was restrained, and the reduction rate of grassland and cultivated land was moderated. From 2001 to 2020, the overall ecological risk was at a medium-low level and showed a decreasing trend, and the fragmentation degree of the forest had a significant impact on ecological risk. By 2035, landscape ecological risks increased under different development scenarios, and construction land expansion had become the dominant factor affecting the risk level. By evaluating the distribution and development trend of ecologically high-risk areas in the Minjiang River Basin, the results of this study provide basic support for the rational planning of land resources in the basin and decision making for future sustainable development efforts.

Graphical Abstract

1. Introduction

Ecological risks refer to the adverse ecological impacts that may occur in the ecological environment due to one or more external factors [1]. Since 1978, China has entered a stage of rapid urbanization. During the 40 years of reform and opening up, the urbanization rate of Fujian Province has increased by more than 50%, and the level of urbanization and population infrastructure has undergone considerable changes [2]. Under the influence of rapid urbanization and climate change, ecosystems are inevitably subjected to various disturbances and impacts, resulting in their rapid degradation, which affects sustainable social development [3]. Ecological risk assessments can effectively capture the relationship between risk receptors and sources, which supports relevant decision making to promote sustainable development.
The resilience theory was first proposed by Holling in 1972 [4]. It is a concept used to describe the persistence of ecosystems and their ability to cope with change and disturbances [5]. The adaptive cycle model combines the elasticity theory with the risk assessment index system. The three-dimensional (3D) framework of “potential-connectivity-resilience” can describe the complex evolutionary process of nature, society, and their integration [6]. In the adaptive cycle, “adaptation” refers to the adaptability, persistence, and recoverability of landscape risk receptors to risk sources [5], and “cycle” indicates that the process of landscape adaptation to risk effects occurs in stages [7], through development (r), protection (K), release (Ω), and reorganization (α) cycles. The system’s connectivity and stability in the early stage of urban expansion continue to increase [8], and capital accumulates to a certain extent [9], but the system’s elasticity and resilience gradually diminish until it faces a process of collapse and reorganization [10,11]. Presently, the adaptive cycle model is used to explore the process of sustainable ecological development under global environmental change [12]. A small number of scholars have also evaluated the landscape ecological risks of cities and watersheds using the adaptive cycle model. For example, Li et al. used a potential 3D framework to analyze the spatial heterogeneity of ecological risks in urban clusters and explored its driving factors [13]. Luo et al. integrated adaptation cycles into risk assessment frameworks to study the dynamic process and cycle stages of landscape ecological risk [14]. Liu et al. introduced an adaptive cycle framework, combined with an ordered weighted average algorithm, to map ecological risks under different scenario preferences in Shenzhen’s social-ecological system [15]. However, a watershed is a complex social-ecological system that is disturbed by anthropogenic activities, nature, and the outside world [14,16]. Establishing a 3D evaluation index system can effectively reflect the degree to which the landscape is affected by risk, as well as the response of landscape risk receptors to risk sources [17]. Consequently, a decision-making basis for regional sustainable development planning may be created.
Most existing studies focus on the evaluation of landscape ecological risks in a “past-present” scenario. Due to data limitations, the impact of different urban policies on landscape risks in the future has not been considered [18]. The impact of land use change on the structure and composition of the ecosystem is an intuitive reflection of the impact of human activities on the ecosystem [19], and the rational use of land resources is an inevitable requirement for the sustainable development of the ecosystem. Imbalanced or excessive land use planning will reduce the potential efficiency of the land, thereby reducing the value of ecosystem services. This will lead to the gradual destruction of landscape ecology and habitat problems, such as reduced landscape connectivity, a reduction in biodiversity, and soil erosion. Scenario simulations and predicting regional land use distribution patterns and ecological risks under different policy plans can all effectively be used to explore the level of ecological risk prevention and control under different policy orientations in the future.
In terms of the scale of analysis, the ecological risk assessment units in the existing research include natural units, administrative units, and grid units. Grid units are conducive to the refined assessment of ecological risks, but small-scale regular grids will divide a large number of connected landscape patches, thereby causing overestimations of the ecological risk of the landscape [20]. Using the natural unit as the analysis unit ensures the integrity of the landscape and is helpful for the analysis of the spatial distribution characteristics of the overall landscape. The administrative unit is used as the analysis unit to evaluate the ecological risk level of urban agglomerations under different development conditions, combined with the ecological risk assessment results under future scenario simulations. This is helpful in formulating risk management and control measures tailored to local conditions.
Based on the remote sensing cloud platform of the Google Earth Engine (GEE), combined with the random forest model (RF) and FLUS model, this study set up three scenarios in the Minjiang River Basin: natural development, economic development, and ecological protection. Subsequently, 35 years of land use classification and multi-scenario predictions were carried out. Different plans have been established to meet the development needs of different basins. Based on this, an adaptive cycle 3D evaluation index system was established using multisource remote sensing data. The spatial and temporal dynamics of landscape ecological risk from 2001 to 2035 were assessed under different administrative scales and development scenarios. The purpose of this study was to (1) classify land cover in the Minjiang River Basin from 2001 to 2020 and study the land cover transformation relationship; (2) forecast 2035 land cover and explore the differences in land cover change under different scenarios; and (3) assess the landscape ecological risk, based on the adaptive cycle theory, and explore its spatial and temporal variations.

2. Materials and Methods

2.1. Study Area

The Minjiang River Basin is located between 116°23′–119°35′E longitude and 25°23′–28°16′N latitude. It originates in the Wuyi and Xianxia Mountain Ranges at the border of Fujian, Jiangxi, and Zhejiang Provinces. The main river starts at the confluence of its three major tributaries, the Jianxi, Futunxi, and Shaxi Rivers, and has a total length of 6107 km. The basin covers a total area of 60,992 km2, of which nearly 60,000 km2 is located in Fujian Province and accounts for half of the total area of the province. The river flows from west to east, through 32 counties and 6 cities, until it reaches the mouth in Fuzhou, where it enters the sea. The basin is located in the red earth region of southern China, which is dominated by hills. The overall altitude is low in the northwest and high in the southeast. The study area has a subtropical monsoon climate, with an annual average precipitation of more than 1700 mm, and abundant water resources. However, owing to the uneven distribution of rainfall, events of flooding and soil erosion occur frequently. To meet the objectives of this study, a comprehensive representation of regions was required; thus, 35 counties and districts in Fujian Province were selected as the research area, as shown in Figure 1.

2.2. Data Sources and Preprocessing
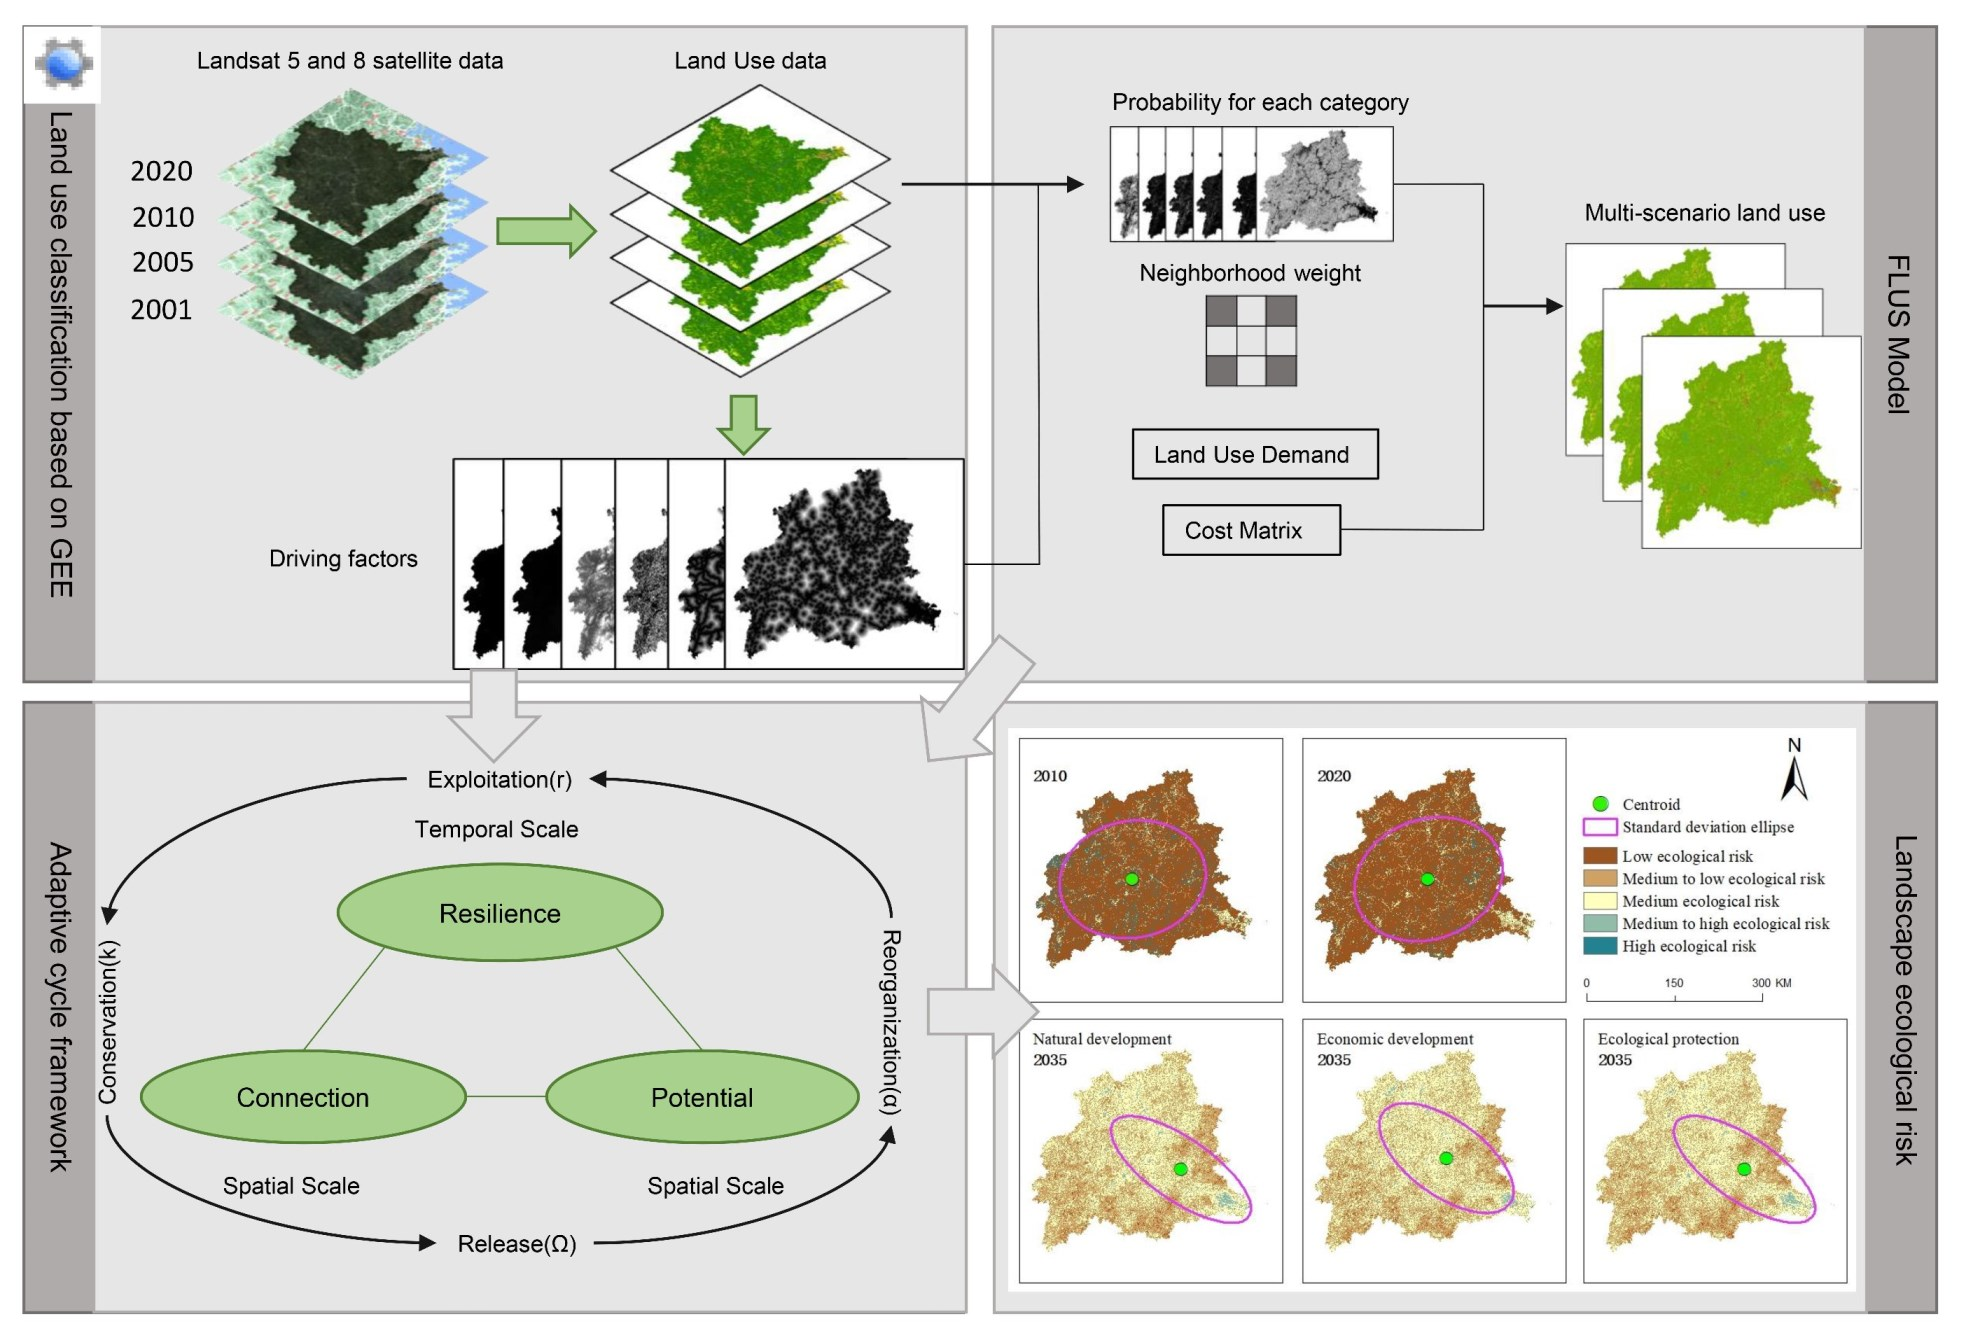
A landscape ecological risk assessment model based on multisource remote sensing data was built in this study, and future land use was simulated. The specific data sources are presented in Table 1. An annual, synthetic “NPP-VIIRs-like” nighttime light dataset, with a 500 m spatial resolution, was developed by the Yu Bailang teaching team of the East China Normal University. Cross-sensor correction of nighttime light data was achieved through the improved autoencoder [21]. The gross domestic product (GDP) data were obtained from the Institute of Geographic Sciences and Natural Resources Research of the Chinese Academy of Sciences. It was estimated through weight and grid calculations of land use type, night light brightness, and residential density. Each grid represents the gross GDP output within the grid range (1 km2) [22]. Land use, normalized vegetation index (NDVI), and mean land surface temperature data were obtained from Landsat 5 and 8 image data [3]. The spatial distribution data of the annual population density was obtained from WorldPop, at a resolution of 1000 m. The annual rainfall data were calculated using the CHIRPS grid rainfall dataset, at a resolution of 0.05°. The daily mean temperature was calculated using the ERA5-LAND dataset, at a resolution of 11,132 m. The digital elevation model (DEM) data released by NASA in 2020 were selected for elevation data. These data were based on SRTM DEM data, combined with GDEM and GMDEM data for elevation control and void filling, at a resolution of 30 m. The net primary productivity (NPP) of the vegetation was obtained using MOD17A3HGF V6 at a resolution of 500 m. These data were calculated using the GEE platform. A link to the data details page can be found in Table S1. The full names of the dataset and the other abbreviations in this article can be found in Table S2.

2.3. Methods

2.3.1. Land Use Classification Based on Random Forest

Classification System Construction

Using the first-level classification standard outlined by the “Land Use Classification GB/T 21010-2007,” and the actual land cover, the land cover classification system of the study area was determined as follows: forest, plowland, water, building, grassland, and unused land.
To determine the land cover classification system and understand the land use status of the study area, the supervised classification of land use was carried out on the GEE platform. The GEE platform is one of the most advanced geographic data analysis and visualization platforms powered by Google Cloud Computing. It contains petabytes of geographic science and remote sensing image data. In addition, it also has the advantages of high computational efficiency, strong running stability, and long data storage times. On the basis of determining the land cover classification system and understanding the land use status of the study area, the GEE platform was used for the visual interpretation of training samples and verification samples with the help of true and false color composite images with reference to Google Earth Pro historical images. The sample selection followed the principles of uniformity, comprehensiveness, and representativeness. Representative pixels were selected as sample point data, considering the distribution area and complexity of representation. Finally, 1935, 2103, 1948, and 2261 sample points were selected for land use classification in 2001, 2005, 2010, and 2020, respectively. Sample points were randomly selected; 80% were used as training samples and 20% as verification samples.

Classification Methods

Random forest (RF) is a commonly used supervised classification algorithm that can process features with a large amount of data without feature screening. The algorithm builds a decision tree forest through ensemble learning and selects the sample and training datasets. An RF algorithm was applied to the GEE platform to obtain land-cover classification results [23]. The main technical route is shown in Figure 2.
The combination of multiple feature variables can effectively improve classification accuracy. Multispectral bands, spectral indices, texture features, and topographic features were selected as the classification features. The data sources were Landsat images and NASADEM data; these subsequently underwent screening, cloud removal, and annual synthesis processing. The multispectral bands included the RGB, NIR, and SWIR1/2 bands. Texture features were obtained by processing the near-infrared band of Landsat images using a gray co-occurrence matrix. Topographic features, including elevation, slope, and aspect, were obtained via surface analysis of the DEM data. The spectral index features included the NDVI, enhanced vegetation index (EVI), surface water index (LSWI), and improved normalized differential water index (MNDWI) [24]. The formula for each index is as follows:
NDVI = (NIR − R)/(NIR + R)
EVI = 2.5 (NIR − R)/(NIR + 6R − 7.5B + 1)
LSWI = (NIR − SWIR)/(NIR + SWIR)
MNDWI = (G − MIR)/(G + MIR)
where NIR, MIR, and SWIR represent the reflectance of the near-infrared, middle infrared, and short-wave infrared bands, respectively; and R, G, and B represent the reflectance of the red, green, and blue bands, respectively. The results of the classification accuracy were evaluated according to class user accuracy, mapping accuracy, overall accuracy, and the Kappa coefficient.

2.3.2. Multi-Scenario Land Use Simulation and Prediction

The FLUS model was used to simulate future land use scenarios under the influence of human activities and nature. This model was derived from cellular automata (CA) and subsequently improved [25]. In the simulation of the FLUS model, the artificial neural network algorithm (ANN) would be used to calculate the suitability of the probability of ground class conversion. The ANN algorithm is a machine learning algorithm, which simulates the structure and function of biological neural networks for analysis and calculation. In this study, this algorithm is used to analyze the driving factors and the initial land use distribution map, so as to calculate the probability of the occurrence of local classes on each grid. Thereafter, according to the diagram of the calculated probability grid and different development scenarios, the CA model based on the adaptive inertia mechanism is used for the simulation. The GeoSOS-FLUS used in this study is a land use change simulation software based on the FLUS model [26]. The results for this model were verified by calculating the overall accuracy (OA) and quality factor (FOM) values. Different development schemes were then used to study the dynamic changes in landscape ecological risk [27].

Probability of Suitability

According to the regional characteristics of the study area, six driving factors of land use change were selected; these were elevation, slope, population, GDP, distance from construction land, and road network density [28]. The ANN probability algorithm was used to calculate the probability of land use suitability.

Multi-Scenario Prediction

In response to the requirements of the overall planning for the national major project, the Fujian Province Development and Reform Commission, Provincial Department of Natural Resources, Department of Ecological Environment, and Bureau of Forestry have drafted “The Important Ecosystem Protection and Restoration of Fujian Province Major Project Implementation Plan (2021–2035).” The plan explicitly states that comprehensive engineering of the ecological environment is to be carried out in the Minjiang River Basin. This area will also be subjected to the construction of water protection and restoration measures and improvement of the ecological function of the basin [29]. It was important to judge the spatial development pattern of land use in the future in a more scientific and reasonable way to provide support for decision makers. Therefore, the quantitative structure and distribution characteristics of land use in the basin were considered. Three scenarios were predicted for 2035: natural development, economic development, and ecological protection [30].
The natural development scenario was simulated based on the rate of land use change from 2005 to 2020, regardless of the constraints of policies or the environment. The economic development scenario was based on the probability of land conversion under the natural development scenario. In this scenario, the probability of the conversion of plowland, forest, grassland, water, and unused land to building land increased by 50%, but building land was not converted to other land use types. Under the ecological protection scenario, the probability of forest and grassland being converted to built-up land was reduced by 50%, the probability of water and plowland being converted to built-up land was reduced by 30% [31], and that of plowland being converted to forest and grassland increased by 30%. A CA model was then used to simulate a variety of future scenarios.

Domain Factor Parameter Settings

The domain impact factor represents the ability of certain land use types to expand to other land types. The range of the factor was set to 0–1, where the closer the value is to 1, the stronger the expansion ability of that land use type [32]. Based on previous studies, and by combining the characteristics of the study area, forest, water, plowland, building land, unused land, and grassland were assigned the values of 0.5, 0.3, 0.7, 1, 0.2, and 0.4, respectively.

Cost Matrix Parameter Settings

The cost matrix indicates whether the classes in each region can be converted to each other, with 1 indicating that they can be converted and 0 indicating that they cannot. Different transformation cost matrices were set for different scenarios. Notably, with the development of urbanization, building land cannot be converted to other land types; therefore, the corresponding values were set to 0 [33]. The other settings are listed in Table 2.

2.3.3. Construction of a 3D Assessment Framework for Adaptive Cyclic Landscape Risk

The 3D framework of adaptive circulation includes three criteria: potential, connectivity, and resilience (Figure 3). The potential feature represents the attributes of the landscape unit and its response to ecological risk sources. The connectivity feature describes the relationship between each landscape unit. The degree of interconnectedness between resilience traits assesses the ability of landscape receptors to recover from the impacts of risk [34]. Landscape risk sources include exposure and disturbances. Exposure indicates that the landscape will be affected as long as it is exposed to the risk sources, and mainly relates to the biophysical properties of the landscape. Disturbance indicates that the landscape will be affected only when it is disturbed by the risk sources, and mainly refers to anthropogenic impacts and climate change [13]. Understanding the different pathways influencing risk sources on risk receptors is crucial to better evaluate dynamic changes in landscape ecological risk.

Establishment of the Index System

The potential risks included six indicators: slope, land cover index, vegetation coverage, surface temperature, annual average temperature, and rainfall erosivity. The slope indicates the possibility of geological disasters caused by topographic features. In the “Overall Plan for Returning Farmland to Forest and Grassland,” the proposed scope of returning farmland to forest and grassland is strictly limited to sloping farmland and severely desertified farmland above 25°. Therefore, 25° is set as the risk threshold. When the slope is ≥25° the assignment is 1, when the slope is ≤2° the assignment is 0, and the slope is normalized when it is within the range of 2°–25°. The land cover index represents the potential ecological risks of different landscape patches, with reference to the landscape fragility index calculation. The risk values of unused land, forest, building land, plowland, grassland, and water were set to 1, 0, 0.9, 0.5, 0.2, and 0.1, respectively. The vegetation coverage index reflects the health of the natural ecosystem by describing the spatial distribution of vegetation coverage. Based on the NDVI, the pixel dichotomy method was used to extract the vegetation coverage. The surface temperature represents the regional temperature difference caused by urban development [35], which was calculated using Landsat image data. The annual mean temperature is affected by rapid urbanization, and the intensification of the greenhouse effect causes the mean temperature to gradually increase. This was calculated using the ERA5 dataset and normalized using raster data. Rainfall erosivity is an effective indicator for assessing soil erosion risk, which was calculated based on average monthly rainfall data, using the Wischmeier formula [36].
The connectivity risks include the Shannon diversity index, aggregation index, construction land distance, and population data. The Shannon diversity index reflects the diversity of landscape types, while the landscape aggregation index represents the aggregation and connectivity of landscape patches. Both were calculated using the moving window method in FRAGSTATS software, and the moving radius was set to 2400 m [37]. The distance index of construction land represents the disturbance of urban expansion to the surrounding land. The closer the area is to urban land, the higher the intensity of disturbance caused by human activities. This index was calculated using the Euclidean distance tool in ArcGIS software, and then normalized [38]. The road network density index was also used to reflect the impact of human activities on landscape ecology and then normalized.
Resilience risks include trends in NPP and nighttime light intensity, which can measure the impact of land use/cover change on vegetation and reflect the physical state of the ecosystem. A trend analysis, based on NPP data from 2001 to 2020, revealed that exponential growth showed a decrease in system risk, whereas the opposite indicated an increase in risk. When the NPP index increased, it was inversely normalized in the range of 0–0.5, but when the NPP index decreased, it was positively normalized in the range of 0.5–1. A nighttime light intensity trend analysis was conducted to determine this, as it can reflect the incremental change in urban expansion. If the nighttime light intensity showed an increasing trend, it was normalized forward between 0.5 and 1, but if the nighttime light intensity showed a decreasing trend, its absolute value was normalized backward between 0 and 0.5.
Based on the 12 indicators above, an adaptive circular ecological risk assessment index system was established. The weighting of each indicator was determined through an analytic hierarchy process (Table 3).

Construction of the Ecological Risk Index

The indicator weightings and three characteristic values were calculated. The risk values for the landscape potential, connectivity, resilience, and adaptive ecological risk index were calculated using weighted summation. The formula is as follows:
R i =   i = 1 n W p × R p
AERI =   W p × R p + W c × R c + W r × R r
where Ri are the three characteristic risk values, AERI is the adaptive ecological risk index, Ii is the normalized index, and Wi is the corresponding weight of each index and risk value.

3. Results

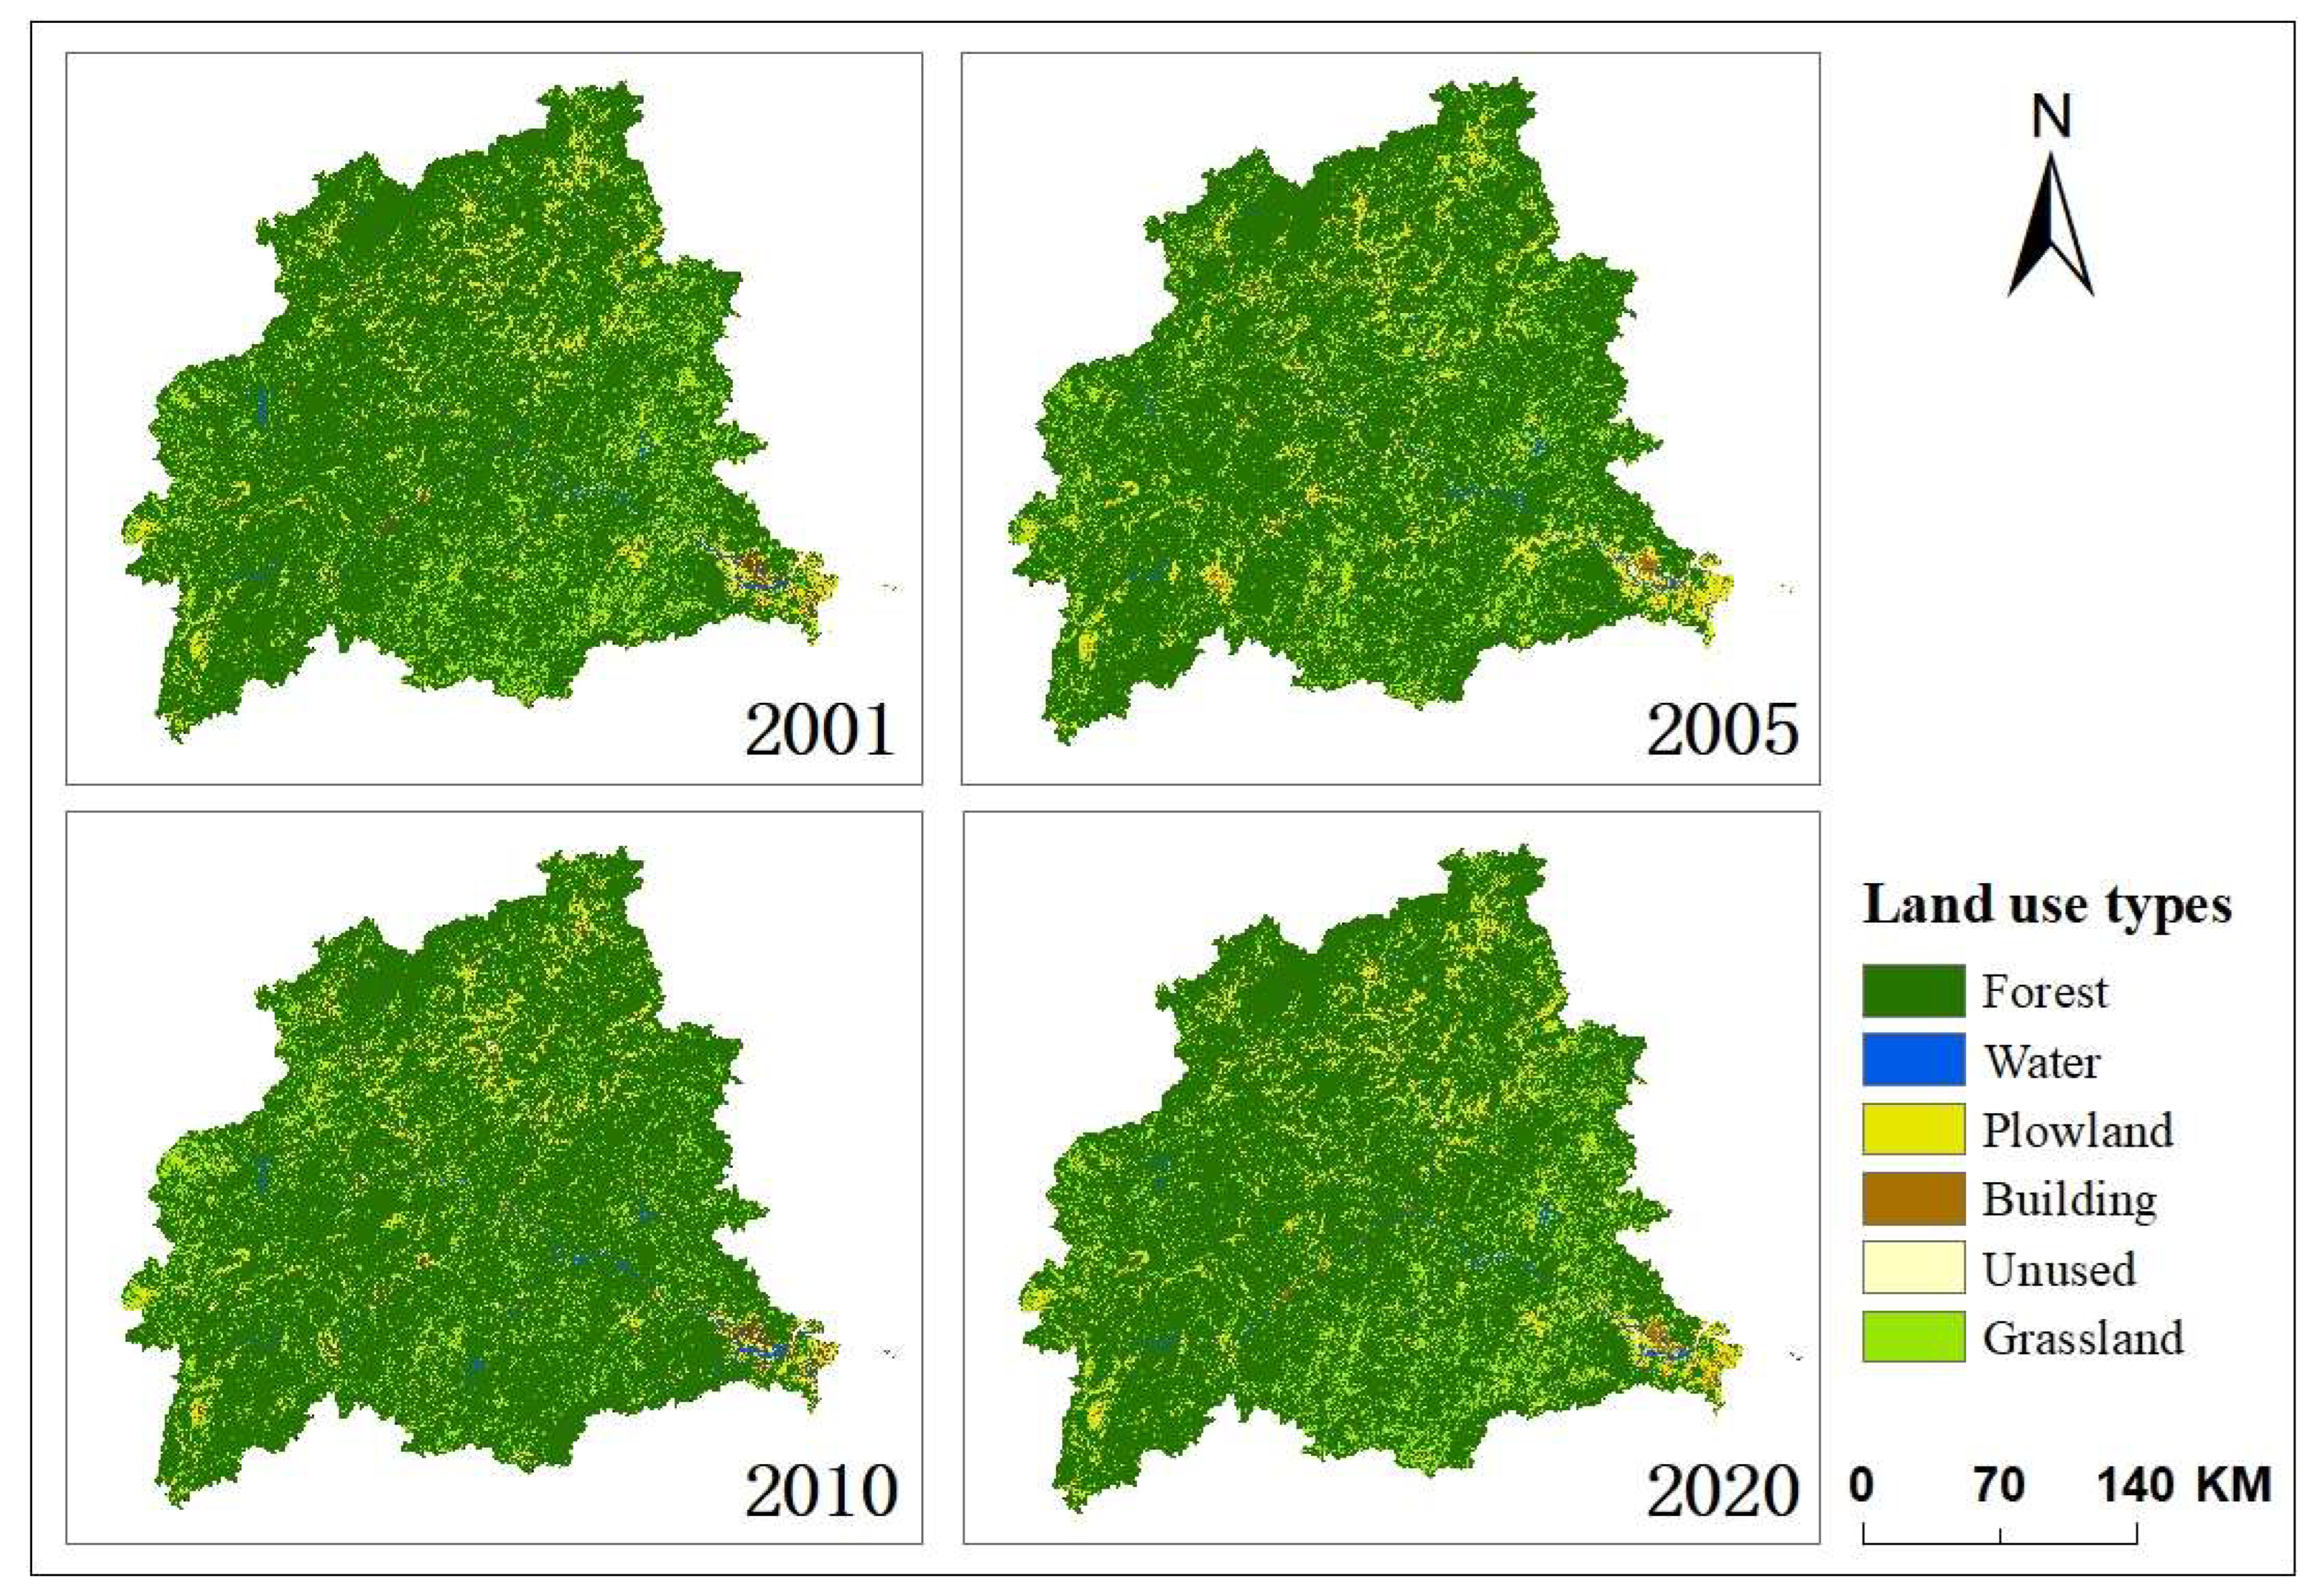
3.1. Spatial-Temporal Variations in Land Cover and Multi-Scenario Prediction

3.1.1. Temporal and Spatial Variations in Land Cover

Land use classification in the Minjiang River Basin was conducted based on the RF algorithm. The accuracies of this classification within the 4 years were all above 92%, and the Kappa coefficients were above 0.9. The user and mapping accuracies of the land use classification of forest land, water bodies, building land, and other features that are not easily changed, exceeded 80%. These results showed that this research method is reliable. The land cover classification maps of the basin in 2001, 2005, 2010, and 2020 are shown in Figure 4.
From the combination of information from Figure 4 and Figure 5, it is evident that the land cover in the Minjiang River Basin was dominated by forest, accounting for more than 81% of the total area, followed by grassland, which accounted for 9.1%. The smallest area of land type was unused land, which accounted for only 0.34%. From 2001 to 2020, the overall forest area in the basin presented a slow increase, reaching approximately 3.28 million km2 within 20 years. The area of water fluctuated; however, the area of buildings and unused land continuously increased, whereas the area of grassland and plowland continued to decrease.
To observe the different land use types and their relevant changes, a land use/land cover change transfer matrix for 2001–2020 was created using a spatial analysis method and displayed in a Chord diagram (Figure 6). A chord diagram is a graphical way of representing relationships between multiple objects. The nodes in the figure are distributed on a circle, and the points are connected by strings to represent the transformation relationship. The length of each arc, the thickness of the string, and the color of both give a vivid indication of the flow and amount of different types of data. The figure shows that in the 20 years, land use transfers among grassland, forest, and plowland were the most abundant. The areas transformed from plowland and grassland to forest were 1.66 million km2 and 8.8 million km2, respectively. From 2001 to 2010, the change in forest area was the largest, with an increase of nearly 1.19 million km2, mainly due to the conversion of plowland and low-cover forest. From 2010 to 2020, the change in the area of building land was the highest, increasing by nearly 1.08 million km2, and was mainly converted from plowland and forest.

3.1.2. Land Cover Multi-Scenario Prediction

The 2020 land use was simulated based on the land use classification data in 2005 and the results of the suitability probability analysis. Subsequently, the actual 2020 land use classifications and the geoSOs-FLUS software were used to calculate the accuracy and FOM coefficient of the simulation results. The OA value and FOM coefficient were 0.85 and 0.234, respectively. This indicated that the model simulation had a high reliability [39].
Using quantitative statistics of the simulation results, the land use and areas in 2035 under different scenarios are shown in Table 4. In the natural development scenario, policy factors were not considered, and the grid number calculation and land cover simulation were only carried out according to the transformation probability from 2005 to 2020. Compared with 2020, the forest area increased the most, reaching 798 km2 (an increase of ~1.6%). The built-up area increased by more than 500 km2, and the grassland area decreased considerably. The grassland was transformed into forest, and the area of building land continued to increase to meet the needs of social and economic development. In the economic development scenario, the area of building land increased considerably, and the area of forests still showed an increasing trend. A large portion of grassland and plowland was converted into forest and building land. In the ecological protection scenario, the growth rate of the forest area was higher, the decrease in grassland area was smaller, and the building land area increased less [40].

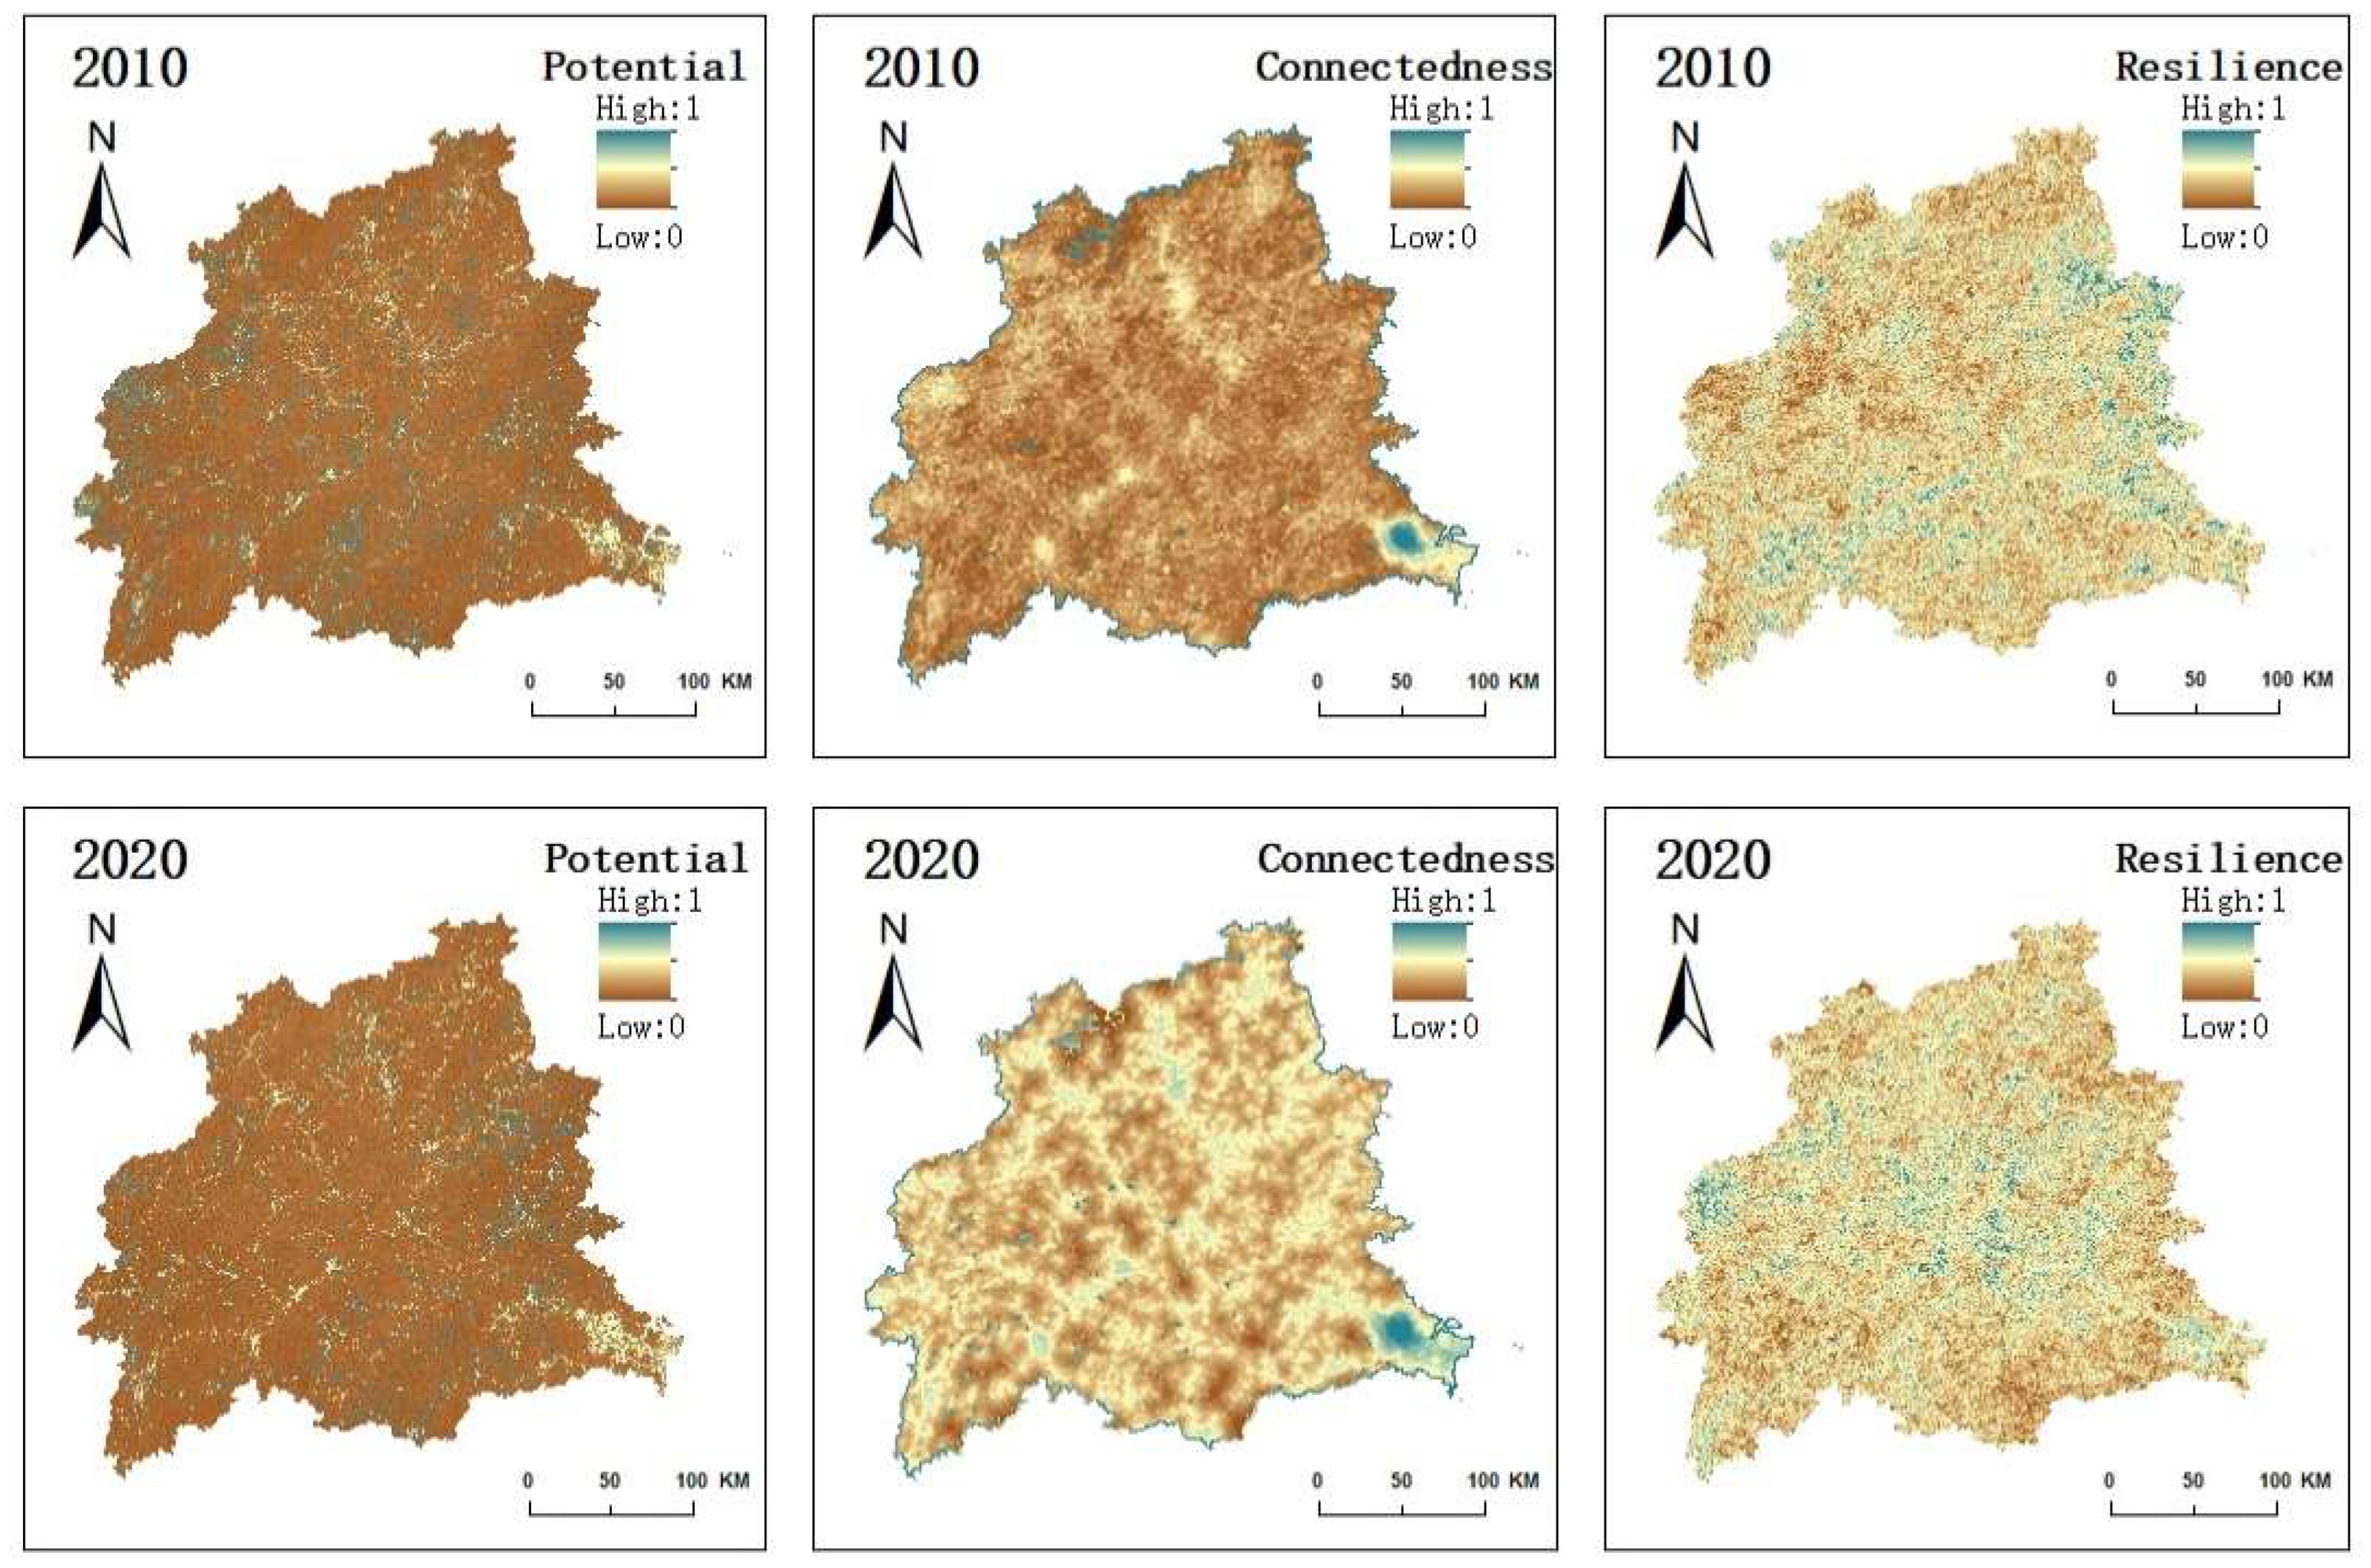
3.2. Temporal and Spatial Variations in Landscape Ecological Risk

3.2.1. Spatial and Temporal Distribution of Adaptive Ecological Risk Eigenvalues

The spatiotemporal dynamics of the characteristic risk values of “potential-connectivity-resilience” in the Minjiang River Basin were obtained by the weighted sum of the indexes included in the three eigenvalues (Figure 7). The three characteristics of the risk values presented completely different distribution characteristics. “Potential” reflects the properties of the study area regarding the degree of response to the risk source. Because the “risk receptor” of land use type was larger, the two-year potential risk values were high for grassland, construction land, and unused land, whereas the values for the potential of forest land, plowland, and water bodies in the distribution of value at risk were low. Furthermore, “connectivity” is related to landscape structure. The closer the area of interest was to a construction site and the more frequently the human activities occurred, the more serious the landscape fragmentation and the higher the risk of landscape connectivity. “Resilience” indicators are affected by vegetation production and socio-economic development. The resilience high-risk values for 2010 were mainly distributed in the mountainous areas, and the southwest and southeast counties within the basin, whereas large cities such as Fuzhou, Nanping, and Wuyishan presented low resilience values. Resilience in high-risk areas began to shift to the central region in 2020. In the last decade, the urban growth rate has exceeded the recovery level of the ecosystem, and urban resilience risk has increased. From 2010 to 2020, the risk values of potential characteristics did not change significantly, high-risk areas decreased, and most areas remained at a low risk level. The large expansion of building land in the past decade has led to a rapid increase in connectivity risk and a high overall risk level. The distribution of resilience showed that the resilience risk level in 2010 was mainly affected by vegetation growth, and the expansion of construction land and urban development became the main influencing factors leading to a higher risk in 2020.

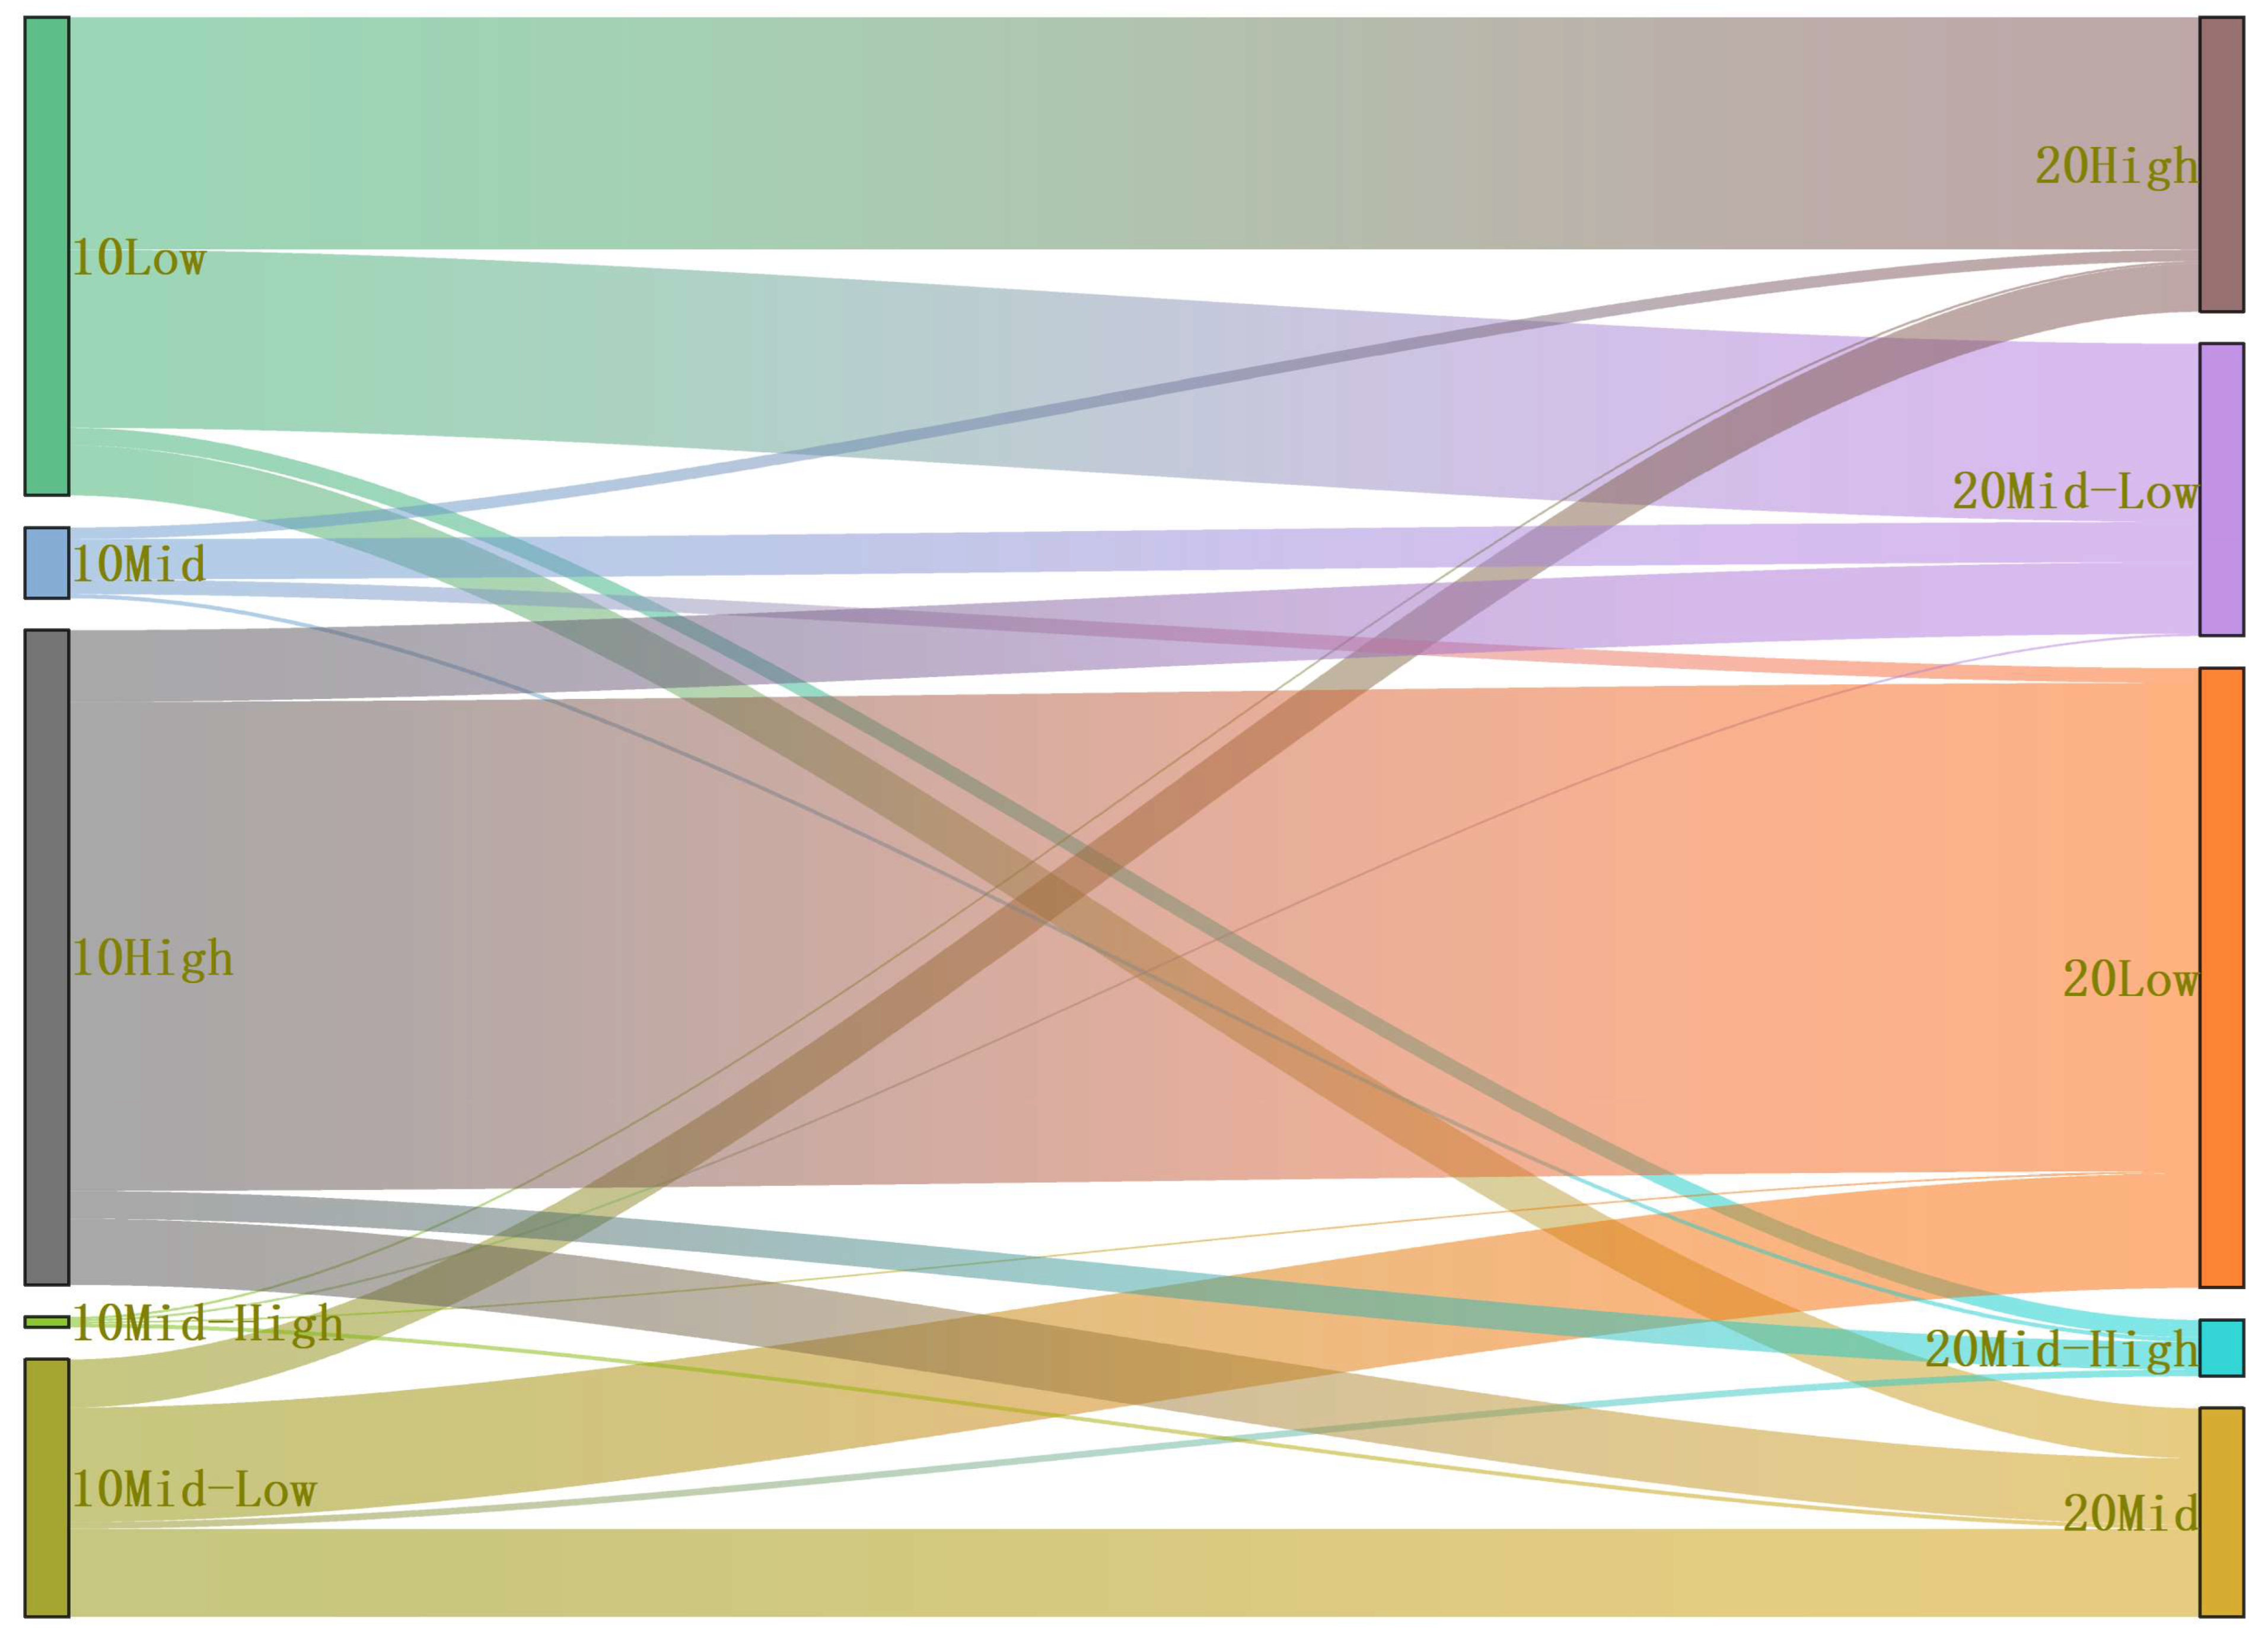
3.2.2. Spatial Variation Trends of the Ecological Risk Index

The current and future risk characteristics were weighted and superimposed to obtain the spatial distribution of the adaptive ecological risk in 2010 and 2020. The 2035 ecological risk values under three different development scenarios were then predicted. The grid images were normalized and divided into five categories using the equidistance fracture method; these categories were high ecological risk [0.81, 1]; relatively high ecological risk [0.61, 0.8]; medium ecological risk [0.41, 0.6]; relatively low ecological risk [0.21, 0.4]; and low ecological risk [0, 0.2]. A grid with a high ecological risk value was selected, and standard deviation ellipse and centroid analyses were conducted to study the trends.
As shown in Figure 8, the overall landscape ecological risk within the study area was at medium and low levels. The high-risk areas in 2010 and 2020 were generally scattered in the hilly grasslands in the west and southeast of the big cities. The urban agglomeration presented a medium level of ecological risk overall, and the risk levels of forest and plowland were relatively low. From 2010 to 2020, high-risk and low-risk areas underwent a large transformation (Figure 9). The low-risk areas of 1092 km2 and 1425 km2 increased to low- and high-risk areas, respectively. Most of these areas were located around construction land. The disorderly expansion of building land in space critically threatens the ecological security of the ecosystems around the city [41]. Approximately 2992 km2 of high-risk land was transformed into low-risk land, predominantly in the hills and mountains in the northwest and south. With the implementation of ecological and environmental governance policies and the effective control of soil and water loss, the improvement of forest coverage in mountainous areas reduced landscape ecological risks. The analysis of the distribution of ecological risk in 2035 showed that three scenarios of high-risk areas were still concentrated in the southeast coastal city area and inland in the construction area. The medium values were in the northwest and central areas. In 2010, there were many scattered high-risk plots in the northeastern and southern regions of the study area, benefiting from the ecological protection measures, and there were almost no high-risk areas.
The standard deviation ellipse and centroid analysis of the spatial distribution of high-risk areas in the 3 years showed that the standard deviation ellipse presented a northeast-to-southwest trend in 2010 and 2020. Compared with 2010, the centroid of the high-risk areas shifted by 22.6 km to the northeast in 2020, and the area of the standard deviation ellipse increased by 450 km2. Prior to this, natural factors (such as forest cover change) were the main factors affecting the ecological level of the landscape. The counties of Changting, Liancheng, Qingliu, Ninghua, and Datian in the southwest of the basin were set as the key counties for soil and water loss control in Fujian Province. The effective control of soil and water loss over the past 10 years has reduced the area of low-coverage forest in the southwest, improved the forest coverage rate, and reduced the ecological risk. Between 2020 and 2035, the area of building land in the basin showed a continuous increasing trend. In 2035, the transformation of the trend in the standard deviation ellipse was from northwest to southeast, which was the same direction as the increase in building land. The expansion of building land in 2035 was the main reason for the increase in landscape ecological risks in the basin. The center of mass in the economic development scenario shifted by approximately 32 km to the northwest, and the standard deviation ellipse area increased by more than 2400 km2. This indicates that the rapid growth of built-up areas in the northwest affected the movement of the ellipse’s center of mass and the distribution of high-risk areas in the case of a higher rate of urban expansion.
The watershed risk characteristic values and adaptive ecological risks were statistically divided at the district and county scales, and the average risk values for each district and county were determined (Figure 10). During the entire period, the ecological risk level within the basin generally decreased. In Fuzhou City, all districts and counties had high ecological risk values, and there were at least two high indices. This was caused by the rapid expansion of construction land within the city and the surrounding forest land, grassland, and plowland, which were severely disturbed. This resulted in low landscape connectivity and stability, and high ecological risk. Qingliu, Liancheng, Mingxi, Jiangle, and other regions had the lowest risk values of each characteristic layer. Most areas, such as Zhenghe, Yongan, Songxi, and Pingnan had higher “resilience” and “potential” risk values and a lower “connectivity” risk value. This indicated that the increasing awareness of ecological protection in the basin in recent years, and more reasonable land use planning of ecological–production–living spaces, contributed to alleviating landscape fragmentation, thereby enhancing landscape connectivity.

4. Discussion

4.1. Adaptive Cycle 3D Model Framework Applicability

The development of social-ecological systems is a complex process affected by multiple risk factors. Compared with the traditional landscape ecological risk index method, static landscape ecological risks are indirectly expressed by constructing a landscape disturbance index and vulnerability index. Risk assessment is carried out by constructing the three-dimensional framework of the adaptive cycle. It can reflect the dynamic change trend of regional landscape ecological risk from the time scale, reflect the relative size of potential ecological risk from the spatial scale [42], and promote a better understanding of the interaction between landscape and risk impact.
In most previous studies, the adaptive cycle was only a concept representing the cycle process of ecosystem development. How to use quantitative factors to accurately describe the abstract three-dimensional characteristics and thus spatially characterize each indicator is a problem that needs careful consideration [43]. After comprehensive reading of relevant literature, the three-dimensional spatial indicators are selected. Specifically, the “potential” indicator can be considered as the resources accumulated by the region, which is mainly expressed as the spatial rasterization of social and economic data. The index of “connectivity degree” reflects the connectivity degree of the regional landscape and the distribution density of ground classes, which can be obtained by analyzing the spatial structure of ground class units. The “resilience” index is an important index reflecting the dynamic change of regional landscape ecology [44]. By analyzing the changing trend of related factors on the time scale, it can reflect the anti-interference ability of the landscape after encountering risks. In addition, based on referring to the previous risk 3D assessment index system, this study improved the index system according to the ecological environment characteristics of the Minjiang River Basin. For example, compared with the discrete distribution of green space and abundant land class changes in the urban study area, the vegetation coverage of the study area is more than 80%, and NDVI supersaturation will occur under the condition of high vegetation cover. Therefore, the NPP trend indicator was used instead of the NDVI indicator to reflect the development status of vegetation [45]; also, considering the phenomenon of soil and water loss in the study area due to abundant precipitation and the general lack of herb cover, the element of annual precipitation was added to the potential index.
The results showed that from 2001 to 2020, the vast area of the study area was at a medium to low risk level, the overall ecosystem risk was reduced, and the area of high-risk areas was reduced to a certain extent, which was consistent with the research results obtained by Zhang [38] et al., who used the traditional landscape pattern index calculation method. However, in terms of the spatial distribution characteristics of ecological risks, Zhang [38] et al. believed that the overall pattern was “high in the north and low in the south”, and the areas with the lowest risk were concentrated in Jin’an District and its surrounding cities with high urbanization levels, which was different from the results of this paper. One possible reason is that the evaluation system of the present study argues that the rapid development of the urban ecosystem landscape fragmentation has a great influence on regional ecological risk and needs to rely on the external material flow to maintain its ability to resist risk interference, and does not have stability, so the ecological risk from construction land is relatively high. In the future simulation, fragmentation caused by urban development will become the main factor affecting ecological risks. However, the traditional landscape risk index method believes that urban areas have strong anti-interference and dominance, low vulnerability, and better stability than natural ecosystems [46]. In addition, there is a risk of soil erosion in the study area under the influence of heavy rainfall, so the annual rainfall factor will also cause a great change in the distribution of ecological risks, but traditional research methods do not consider this factor. Therefore, compared with traditional methods, the theoretical framework adopted in this study is more comprehensive for landscape ecological risk assessment.

4.2. Regional Risk Management Recommendations

According to the results of the landscape ecological risk assessment and multi-scenario risk simulation in 2010 and 2020 of this study, targeted measures can be put forward for socially sustainable development planning. The study found that the landscape ecological risk in the Minjiang River Basin tended to decrease from 2001 to 2020, and the woodland landscape connectivity risk decreased significantly in the past 10 years. However, the disordered expansion of the developing construction area in the future will lead to the fragmentation and fragility of the surrounding ecological space, and the connectivity risk of production and living space will become more prominent.
In general, the effective implementation of ecological engineering in the study area in recent years had a great impact on the reduction in risk. Since the 21st century, 22 key counties of soil and water loss control have been gradually established in Fujian Province, and the ecological engineering construction of soil and water loss control has been continuously carried out. Since 2017, the ecological protection and restoration project of mountains, forests, fields, lakes, and grass in the Minjiang River Basin has been listed in the second batch of national pilot projects. Based on the resource advantages of mountains, water, and farmland, 29 pilot counties have gradually explored a green development road adapted to local conditions. One side is subtracting soil erosion, and the other side is adding green cover [47]. The area of natural units such as forestland continues to expand, the problem of soil and water loss is effectively solved, the landscape connectivity is improved, and the landscape ecological risk is generally reduced [48].
The results showed that the medium-high-risk areas were mainly the urban built-up areas and the surrounding areas and the forest land with fragmented landscape distribution. Urban built-up areas mainly belong to areas with high potential connectivity risk and low resilience risk. For example, Fuzhou City has a relatively high degree of landscape fragmentation, but its restoration risk is low, and it has a strong ability to resist external interference. Suggestions for the city proper include paying attention to surrounding farmland and forest to protect the ecological space, such as setting up red lines to establish ecological protection and permanent basic farmland protection areas to limit the unlimited expansion of construction land; enhancing land use efficiency internally, putting the construction of ecological land use at the center of planning; undertaking planning of urban green space construction; and paying attention to building stronger ecological corridor connectivity [49]. In relation to the high degree of landscape fragmentation of forest land, which is evident in areas with high connectedness degrees of risk, soil and water loss is the main factor causing the regional risk. In this case, it is necessary to adjust measures to local conditions and continue to conduct ecological protection work, such as afforestation, rational allocation of forest undergrowth to planting schemes, and gradually enhance the capability of soil to retain fertilizer. Medium and low-risk areas are mainly small and medium-sized counties and cities and large areas of complete forest land. Small and medium-sized counties belong to the class of relatively high risk areas; their level of city development and resource reserves are poorer, and they have a weak ability to resist risk interference. While developing cities economically, they must at the same time pay attention to the intensive utilization of land and the spatial distribution pattern of construction land use and ecological land use, and reduce the fragmentation caused by the development of space [50]. However, the management planning of high-cover forest land should avoid human interference as much as possible and continue to carry out high-quality ecological protection to avoid it being destroyed.

4.3. Limitations and Future Works

This study proposes a model based on a 3D dynamic method of assessing ecological risk, which combines a simulation of future land use with an adaptive cycle through different perspectives to consider different factors of development. The method can be used to evaluate different-sized areas of human activity and natural conditions and measure different ecosystem influences on landscape ecological risk, for example, in rural areas, urban areas, tourist attractions [51], fisheries [52], and wetland [53] ecosystems. It can also be used to evaluate the sustainability of ecosystem health and development and provide an important scientific reference for assessing regional green and sustainable development dynamics and formulating risk mitigation strategies adapted to local conditions.
Although the corresponding results were obtained, this study also has some limitations. First, due to the limitations of data collection methods, this study did not set a red line of ecological protection, permanent basic farmland protection area, or other restricted reconstruction areas in the future land use simulation. This will lead to the transformation of some non-transformable farmland and ecological spaces in the future simulation results, which will affect the simulation accuracy. Second, in the future risk simulation performed in this study, only land use change was considered in the multi-variate variables, while other factors were left unchanged. This will impact the different analyses of ecological risks under different future scenarios. In future research efforts, adding future simulation studies of climate, such as the vegetation index and other index parameters, should be considered to improve the experimental design and enhance the reliability of the results. In addition, although the time and space scales describe the distribution and dynamic change trends of ecological risk, using the adaptive cycle model by building a 3D framework to select indicators of social and regional ecological risk also has some limitations. These limitations include an unclear analysis of human activities and natural conditions for each indicator, and the impact on the ecological risk ratio. Therefore, further research in this area should be carried out.

5. Conclusions

Based on the GEE platform, GeoSOS software, and adaptive cycle model, land classification and future simulation results were used to analyze the spatial and temporal patterns of landscape ecological risks and discuss the influencing factors in the Minjiang River Basin over the past 35 years.
The results show that the land use type of Minjiang River Basin is mainly forest, which occupies more than 80% of the area. With the rapid development of urbanization and the implementation of control policies for soil and water loss in the basin from 2001 to 2020, the areas of forest and building land increased greatly, whereas the area of arable land and grassland decreased. The area of forest and building land is expected to continue to increase. In terms of the changes in landscape ecological risks, the mean values of “potential risks” and “elastic risks” of the watershed showed a downward trend from 2010 to 2035, and the ability to resist the impact of risks was enhanced. However, due to the increasing degree of landscape fragmentation caused by urban expansion, the characteristic risk values of “connectivity” showed an upward trend. The high-risk area was transferred from forests to urban areas. Moreover, the adverse impact of the natural landscape pattern on regional landscape risk gradually decreased, while the impact of human activities gradually increased.
To summarize, the landscape ecological risk in the Minjiang River Basin during the study period was generally at a medium-low risk level and showed a declining trend. With the implementation of environmental protection policies, the ecological environment quality improved; nevertheless, concerning future development, attention should be paid to the adverse impact of urbanization on the ecological environment. In this study, the FLUS model was used to simulate future land use under different scenarios, while avoiding the limitation of existing studies that only focus on past periods of time. The model was also used to reflect the development status and characteristics of landscape risks in this region from two aspects: the spatial distribution of static risks and the trend in the spatiotemporal variation of dynamic risks. It provides a scientific basis for the comprehensive assessment of landscape ecological risk and the sustainable planning of land use.

Supplementary Materials

The following supporting information can be downloaded at: https://www.mdpi.com/article/10.3390/rs14215540/s1, Table S1: The URL of the datas. Table S2: Abbreviations.

Author Contributions

Conceptualization, T.B.; methodology, T.B.; software, T.B.; validation, T.B. and R.W.; formal analysis, T.B., L.S. and X.L.; investigation, T.B.; resources, T.B.; data curation, T.B. and S.Z.; writing—original draft preparation, T.B.; writing—review and editing, T.B.; visualization, T.B.; supervision, J.L., K.Y. and F.W.; project administration, F.W.; funding acquisition, F.W. All authors have read and agreed to the published version of the manuscript.

Funding

This research was funded by the National Youth Science Foundation Project, grant number: 41901387, Fujian Provincial Natural Science Foundation, grant number: 2022J05031, and Forestry Peak Discipline Construction Project of Fujian Agriculture and Forestry University, grant number: 72202200205.

Data Availability Statement

The data presented in this study are available upon request from the corresponding author.

Acknowledgments

We sincerely thank the Data Center of Resources and Environmental Sciences, the Chinese Academy of Sciences, the National Earth System Science Data Center, the Yu Bailang teaching team of East China Normal University, and Google Earth Engine for supplying the administrative division data and remote sensing datasets.

Conflicts of Interest

The authors declare no conflict of interest.

References

  1. Piet, G.J.; Knights, A.M.; Jongbloed, R.H.; Tamis, J.E.; de Vries, P.; Robinson, L.A. Ecological risk assessments to guide decision-making: Methodology matters. Environ. Sci. Policy 2017, 68, 1–9. [Google Scholar] [CrossRef] [Green Version]
  2. Liang, L.; Zhang, F.; Wu, F.; Chen, Y.X.; Qin, K.Y. Coupling coordination degree spatial analysis and driving factor between socio-economic and eco-environment in northern China. Ecol. Indic. 2022, 135, 108555. [Google Scholar]
  3. Li, W.J.; Wang, Y.; Xie, S.Y.; Cheng, X. Coupling coordination analysis and spatiotemporal heterogeneity between urbanization and ecosystem health in Chongqing municipality, China. Sci. Total Environ. 2021, 791, 148311. [Google Scholar] [CrossRef] [PubMed]
  4. Holling, C.S. Understanding the Complexity of Economic, Ecological, and Social Systems. Ecosystems 2001, 4, 390–405. [Google Scholar] [CrossRef]
  5. Vázquez-González, C.; Ávila-Foucat, V.S.; Ortiz-Lozano, L.; Moreno-Casasola, P.; Granados-Barba, A. Analytical framework for assessing the social-ecological system trajectory considering the resilience-vulnerability dynamic interaction in the context of disasters. Int. J. Disaster Risk Reduct. 2021, 59, 102232. [Google Scholar] [CrossRef]
  6. Zhao, X.Y.; Dong, S.K.; Yang, M.Y.; Dong, Q.M. Analysis of a pastoral social-ecological system in Qinghai-Tibet Plateau based on Panarchy. J. Nat. Res. 2021, 36, 2125–2138. [Google Scholar]
  7. Peter, U.; Peter, S.; Jan, P. Non-equilibrium thermodynamics and development cycles of temperate natural forest ecosystems. Folia Oecol. 2018, 45, 61–71. [Google Scholar]
  8. Sundstrom, S.M.; Allen, C.R. The adaptive cycle: More than a metaphor. Ecol. Complex. 2019, 39, 100767. [Google Scholar] [CrossRef]
  9. Zhang, Q.; Xue, H.L.; Lan, X.; Dai, L.W.; Wang, B.J.; Cui, F.Q.; Tang, H.P. Livelihood vulnerability of pastoral households in the semiarid grasslands of northern China: Measurement and determinants. Ecol. Indic. 2022, 140, 109020. [Google Scholar]
  10. Li, J.Y.; Sun, C.; Zheng, X. Assessment of spatio temporal evolution of regionally ecological risks based on adaptive cycle theory; a case study of Y angtze River Delta urban agglomeration. Acta Ecol. Sinica. 2021, 41, 2609–2621. [Google Scholar]
  11. Zhang, Y.J.; Zeng, J.; Chen, W.X.; Huang, C. Assessment on Ecological Risk of Danjiangkou Reservoir Area Based on Adaptive Cycle. Res. Soil Water Conserv. 2022, 29, 349–360. [Google Scholar]
  12. Jimenez, M.; Perez-Belmont, P.; Schewenius, M.; Lerner, A.M.; Mazari-Hiriart, M. Assessing the historical adaptive cycles of an urban social-ecological system and its potential future resilience: The case of Xochimilco, Mexico City. Reg. Environ. Change 2020, 20, 7. [Google Scholar]
  13. Li, X.P.; Li, S.S.; Zhang, Y.F.; O’Connor, P.J.; Zhang, L.W.; Yan, J.P. Landscape Ecological Risk Assessment under Multiple Indicators. Land 2021, 10, 739. [Google Scholar] [CrossRef]
  14. Luo, F.H.; Liu, Y.X.; Peng, J.; Wu, J.S. Assessing urban landscape ecological risk through an adaptive cycle framework. Landsc. Urban Plan. 2018, 180, 125–134. [Google Scholar] [CrossRef]
  15. Liu, Y.X.; Wang, Y.L.; Peng, J.; Zhang, T.; Wei, H. Urban landscape ecological risk assessment based on the 3D framework of adaptive cycle. Acta Geogr. Sin. 2015, 70, 1052–1067. [Google Scholar]
  16. Brondizio, E.S.; Vogt, N.D.; Mansur, A.V.; Anthony, E.J.; Costa, S.; Hetrick, S. A conceptual framework for analyzing deltas as coupled social-ecological systems: An example from the Amazon River Delta. Sustain. Sci. 2016, 11, 591–609. [Google Scholar] [CrossRef]
  17. Ingalls, M.L.; Stedman, R.C. The power problematic: Exploring the uncertain terrains of political ecology and the resilience framework. Ecol. Soc. 2016, 21, 6. [Google Scholar] [CrossRef] [Green Version]
  18. Li, J.Y. Research on Ecological Risk Assessment of Beijing from the Perspective of Adaptive Cycle and Spatial Optimization Strategies; Beijing Forestry University: Beijing, China, 2021. [Google Scholar]
  19. Li, W.; Wang, L.; Yang, X.; Liang, T.; Zhang, Q.; Liao, X.; White, J.R.; Rinklebe, J. Interactive influences of meteorological and socioeconomic factors on ecosystem service values in a river basin with different geomorphic features. Sci. Total Environ. 2022, 829, 154595. [Google Scholar] [CrossRef]
  20. Ji, J.; Tang, Z.; Zhang, W.; Liu, W.; Jin, B.; Xi, X.; Wang, F.; Zhang, R.; Guo, B.; Xu, Z.; et al. Spatiotemporal and Multiscale Analysis of the Coupling Coordination Degree between Economic Development Equality and Eco-Environmental Quality in China from 2001 to 2020. Remote Sens. 2022, 14, 737. [Google Scholar]
  21. Chen, Z.Q.; Yu, B.L.; Yang, C.S.; Zhou, Y.Y.; Yao, S.J.; Qian, X.J.; Wang, C.X.; Wu, B.; Wu, J.P. An extended time series (2000–2018) of global NPP-VIIRS-like nighttime light data from a cross-sensor calibration. Earth Syst. Sci. Data 2021, 13, 889–906. [Google Scholar] [CrossRef]
  22. Xu, X.L. China GDP Spatial Distribution Kilometer Grid Data Set; Resource and Environmental Science Data Registration and Publishing System: Beijing, China, 2017. [Google Scholar]
  23. Ji, Q.L.; Liang, W.; Fu, B.J.; Lv, Y.H. Land use/cover change in the Yellow River Basin based on Google Earth Engine and complex network. Acta Ecol. Sin. 2022, 42, 2122–2135. [Google Scholar]
  24. Koley, S.; Chockalingam, J. Sentinel 1 and Sentinel 2 for cropland mapping with special emphasis on the usability of textural and vegetation indices. Adv. Space Res. 2022, 69, 1768–1785. [Google Scholar] [CrossRef]
  25. Lin, T.; Feng, Z.H.; Wu, D.F.; Yang, M.Z. Spatial-temporal Changes and Multi-scenario Prediction of Ecological Land in Karst Area Based on FLUS Model—A Case Study in Ningyuan County, Hunan Province. Bull. Soil Water Conserv. 2022, 42, 219–227. [Google Scholar]
  26. Hou, J.K.; Chen, J.J.; Zhang, K.Q.; Zhou, G.Q.; You, H.T.; Han, X.W. Temporal and Spatial Variation Characteristics of Carbon Storage in the Source Region of the Yellow River Based on InVEST and GeoSoS-FLUS Models and Its Response to Different Future Scenarios. Environ. Sci. 2022, 214, 1–14. [Google Scholar]
  27. Jin, M.T.; Xu, L.P.; Xu, Q. FLUS-Markov model-based multiscenario evaluation and prediction of the landscape ecological risk in Kezhou, South Xinjiang. Arid Zone Res. 2021, 38, 1793–1804. [Google Scholar]
  28. Hu, Y.Y.; He, Y.; Li, Y.L. Urban Spatial Development Based on Multisource Data Analysis: A Case Study of Xianyang City’s Integration into Xi’an International Metropolis. Sustainability 2022, 14, 4090. [Google Scholar] [CrossRef]
  29. Liu, X.Y.; Wei, M.; Li, Z.G.; Zeng, J. Multi-scenario simulation of urban growth boundaries with an ESP-FLUS model: A case study of the Min Delta region, China. Ecol. Indic. 2022, 135, 108538. [Google Scholar] [CrossRef]
  30. Huo, J.E.; Shi, Z.Q.; Zhu, W.B.; Xue, H.; Chen, X. A Multi-Scenario Simulation and Optimization of Land Use with a Markov-FLUS Coupling Model: A Case Study in Xiong’an New Area, China. Sustainability 2022, 14, 2425. [Google Scholar] [CrossRef]
  31. Chen, L.T.; Cai, H.S.; Zhang, T.; Zhang, X.L. Land use multi-scenario simulation analysis of Rao River Basin based on Markov-FLUS model. Acta Ecol. Sin. 2022, 42, 3947–3958. [Google Scholar]
  32. Gao, Z.B.; Wang, X.R.; Sui, X.Y.; Wang, X. Multi-scenario prediction of habitat quality in Nanjing based on FLUS and InVEST models. J. Agric. Resour. Environ. 2021, 1–17, 6923. [Google Scholar]
  33. La, L.M.; Gou, M.M.; Li, L.; Wang, N. Spatiotemporal Dynamics and Scenarios Analysis on Trade- offs between Ecosystem Service in Three Gorges Reservoir Area: A Case Study of Zigui County. J. Ecol. Rural. Environ. 2021, 37, 1368–1377. [Google Scholar]
  34. Zhang, L.; Huang, Q.X.; He, C.Y.; Yue, H.B.; Zhao, Q.B. Assessing the dynamics of sustainability for social-ecological systems based on the adaptive cycle framework: A case study in the Beijing-Tianjin-Hebei urban agglomeration. Sust. Cities Soc. 2021, 70, 102899. [Google Scholar] [CrossRef]
  35. Azabdaftari, A.; Sunar, F. District-based urban expansion monitoring using multitemporal satellite data: Application in two mega cities. Environ. Monit. Assess. 2022, 194, 335. [Google Scholar] [CrossRef] [PubMed]
  36. Wischmeier, W.H.; Smith, D.D. Predicting Rainfall Erosion Losses—A Guide to Conservation Planning; U.S. Department of Agriculture: Fort Collins, CO, USA, 1978. [Google Scholar]
  37. Xiao, R.; Cao, W.; Liu, Y.; Lu, B.B. The impacts of landscape patterns spatio-temporal changes on land surface temperature from a multi-scale perspective: A case study of the Yangtze River Delta. Sci. Total Environ. 2022, 821, 153381. [Google Scholar] [CrossRef] [PubMed]
  38. Zhang, S.H.; Zhong, Q.L.; Cheng, D.L.; Xu, C.B.; Chang, Y.N.; Lin, Y.Y.; Li, B.Y. Coupling Coordination Analysis and Prediction of Landscape Ecological Risks and Ecosystem Services in the Min River Basin. Land 2022, 11, 222. [Google Scholar] [CrossRef]
  39. Hou, Y.F.; Chen, Y.N.; Ding, J.L.; Li, Z.; Li, Y.P.; Sun, F. Ecological Impacts of Land Use Change in the Arid Tarim River Basin of China. Remote Sens. 2022, 14, 1894. [Google Scholar] [CrossRef]
  40. Yao, G.H.; Li, H.D.; Wang, N.; Zhao, L.J.; Du, H.B.; Zhang, L.J.; Yan, S.G. Spatiotemporal Variations and Driving Factors of Ecological Land during Urbanization-A Case Study in the Yangtze River’s Lower Reaches. Sustainability 2022, 14, 4256. [Google Scholar] [CrossRef]
  41. Zhang, B.F.; Zhang, J.; Miao, C.H. Urbanization Level in Chinese Counties: Imbalance Pattern and Driving Force. Remote Sens. 2022, 14, 2268. [Google Scholar] [CrossRef]
  42. Jing, P.Q.; Zhang, D.H.; Ai, Z.M.; Guo, B. Natural landscape ecological risk assessment based on the three-dimensional framework of pattern-process ecological adaptability cycle: A case in Loess Plateau. Acta Ecol. Sin. 2021, 41, 7026–7036. [Google Scholar]
  43. Nacher, M.E.; Ferreira, C.; Jones, M.; Kalantari, Z. Application of the Adaptive Cycle and Panarchy in La Marjaleria Social-Ecological System: Reflections for Operability. Land 2021, 10, 980. [Google Scholar] [CrossRef]
  44. Burkhard, B.; Fath, B.D.; Muller, F. Adapting the adaptive cycle: Hypotheses on the development of ecosystem properties and services. Ecol. Mod. 2011, 222, 2878–2890. [Google Scholar] [CrossRef]
  45. Tang, Z.X.; Zhou, Z.X.; Wang, D.; Luo, F.B.; Bai, J.Z.; Fu, Y. Impact of vegetation restoration on ecosystem services in the Loess plateau, a case study in the Jinghe Watershed, China. Ecol. Indic. 2022, 142, 109183. [Google Scholar] [CrossRef]
  46. Feng, Y.X.; He, S.W.; Li, G.D. Interaction between urbanization and the eco-environment in the Pan-Third Pole region. Sci. Total Environ. 2021, 789, 148011. [Google Scholar] [CrossRef] [PubMed]
  47. Lai, S.H.; Sha, J.M.; Eladawy, A.; Li, X.M.; Wang, J.L.; Kurbanov, E.; Lin, Z.J.; Wu, L.B.; Han, R.; Su, Y.C. Evaluation of ecological security and ecological maintenance based on pressure-state-response (PSR) model, case study: Fuzhou city, China. Hum. Ecol. Risk Assess. 2022, 28, 734–761. [Google Scholar] [CrossRef]
  48. Li, M.; Zheng, P.; Pan, W.B. Spatial-Temporal Variation and Tradeoffs/Synergies Analysis on Multiple Ecosystem Services: A Case Study in Fujian. Sustainability 2022, 14, 3086. [Google Scholar] [CrossRef]
  49. Guan, H.Y.; Bai, Y.P.; Zhang, C.Y. Research on Ecosystem Security and Restoration Pattern of Urban Agglomeration in the Yellow River Basin. Sustainability 2022, 14, 11599. [Google Scholar] [CrossRef]
  50. Ouyang, X.; Tang, L.S.; Wei, X.; Li, Y.H. Spatial interaction between urbanization and ecosystem services in Chinese urban agglomerations. Land Use Policies 2021, 109, 105587. [Google Scholar] [CrossRef]
  51. Wang, F.; Zhao, X.G.; Qiu, Y.X.; Luo, J. Adaptability of traditional villages as tourist destinations in Yellow River Basin, China. Indoor Built Environ. 2022, 14, 1420326X221126056. [Google Scholar] [CrossRef]
  52. Westmont, V.C. Assessing the adaptive resilience of twentieth-century post-industrial fishing landscapes in Siglufjorour, Iceland. Landsc. Res. 2021, 46, 693–712. [Google Scholar] [CrossRef]
  53. Liu, H.X.; Gao, C.Y.; Wang, G.P. Considering the Adaptive Cycle and Resilience of the Ecosystem to Define Reference Conditions for Wetland Restoration. Earth Future 2022, 10, e2021EF002419. [Google Scholar] [CrossRef]
Figure 1. Geographical location of the study area.
Remotesensing 14 05540 g001
Figure 2. Flow chart of land use classification.
Remotesensing 14 05540 g002
Figure 3. Technical route.
Remotesensing 14 05540 g003
Figure 4. Basin land cover classification.
Remotesensing 14 05540 g004
Figure 5. Changes in the area proportion of catchments from 2001 to 2020.
Remotesensing 14 05540 g005
Figure 6. Chord diagram of land use type conversion from 2001 to 2020.
Remotesensing 14 05540 g006
Figure 7. Spatial and temporal distribution of the risk values of “potential-connectivity-resilience” features.
Remotesensing 14 05540 g007
Figure 8. Adaptive ecological risk and elliptic spatial distribution of standard deviation.
Remotesensing 14 05540 g008
Figure 9. Sankey map of area transfer of ecological risk at different levels from 2010 to 2020.
Remotesensing 14 05540 g009
Figure 10. Spatial distribution of adaptive ecological risk values in counties and districts of Minjiang River Basin.
Remotesensing 14 05540 g010
Table 1. Data sources.
NameTemporal/Spatial ResolutionPeriodCode
Landsat530 m/120 m/16 days2001, 2005, 2010LANDSAT/LT05/C01/T1_SR
Landsat830 m/16 days2015, 2020LANDSAT/LC08/C01/T1_SR
WorldPop100 m/annual2005, 2020WorldPop/GP/100m/pop
CHIRPS0.05°/5 days2010, 2020UCSB-CHG/CHIRPS/PENTAD
ERA5-LAND11,132 m/hourly2010, 2020ECMWF/ERA5_LAND/HOURLY
NASADEM30 m/annual (2020)2020NASA/NASADEM_HGT/001
MOD17A3HGF V6500 m/annual2001, 2010, 2020MODIS/006/MOD17A3HGF
Table 2. Land use transfer cost matrix under different scenarios.
Scenario ModesLand Use TypeForestWaterPlowlandBuildingUnusedGrassland
Natural developmentForest111111
Water111111
Plowland111111
Building000100
Unused111111
Grassland111111
Economic developmentForest101101
Water111101
Plowland001111
Building000100
Unused101111
Grassland111111
Ecological protectionForest100101
Water111111
Plowland111111
Building000100
Unused111111
Grassland100001
Table 3. Landscape ecological risk assessment index system.
Criteria Layer (Weight)Effects of Risk
Sources
Indicators (Weights)Normalization
Potential (0.479) ExposureSlope (0.182) +
Land cover index (0.198) +
Vegetation coverage (0.27)
DisturbanceSurface temperature (0.078) +
Annual mean temperature (0.116) +
Rainfall erosivity (0.156) +
connectivity (0.319) ExposureShannon diversity index (0.158)
Aggregation index (0.308)
DisturbanceDistance to construction land (0.225)
Density of road network (0.309) +
Resilience (0.202) ExposureNet primary productivity trends (0.625)
DisturbanceNighttime light intensity trends (0.375) +
Table 4. Scenario simulated land use areas in 2020 and 2035 (km2).
Scenario ModesForestWaterPlowlandBuildingUnusedGrassland
2020 49,888.61 622.31 2922.98 2059.98 254.11 3539.55
Natural development50,687.09 649.22 2334.31 2574.93 241.51 2800.49
Economic development50,386.48 613.45 2140.43 3198.13 217.91 2731.14
Ecological protection51,091.16 689.99 2250.12 2143.07 239.45 2873.76
Publisher’s Note: MDPI stays neutral with regard to jurisdictional claims in published maps and institutional affiliations.

