Article

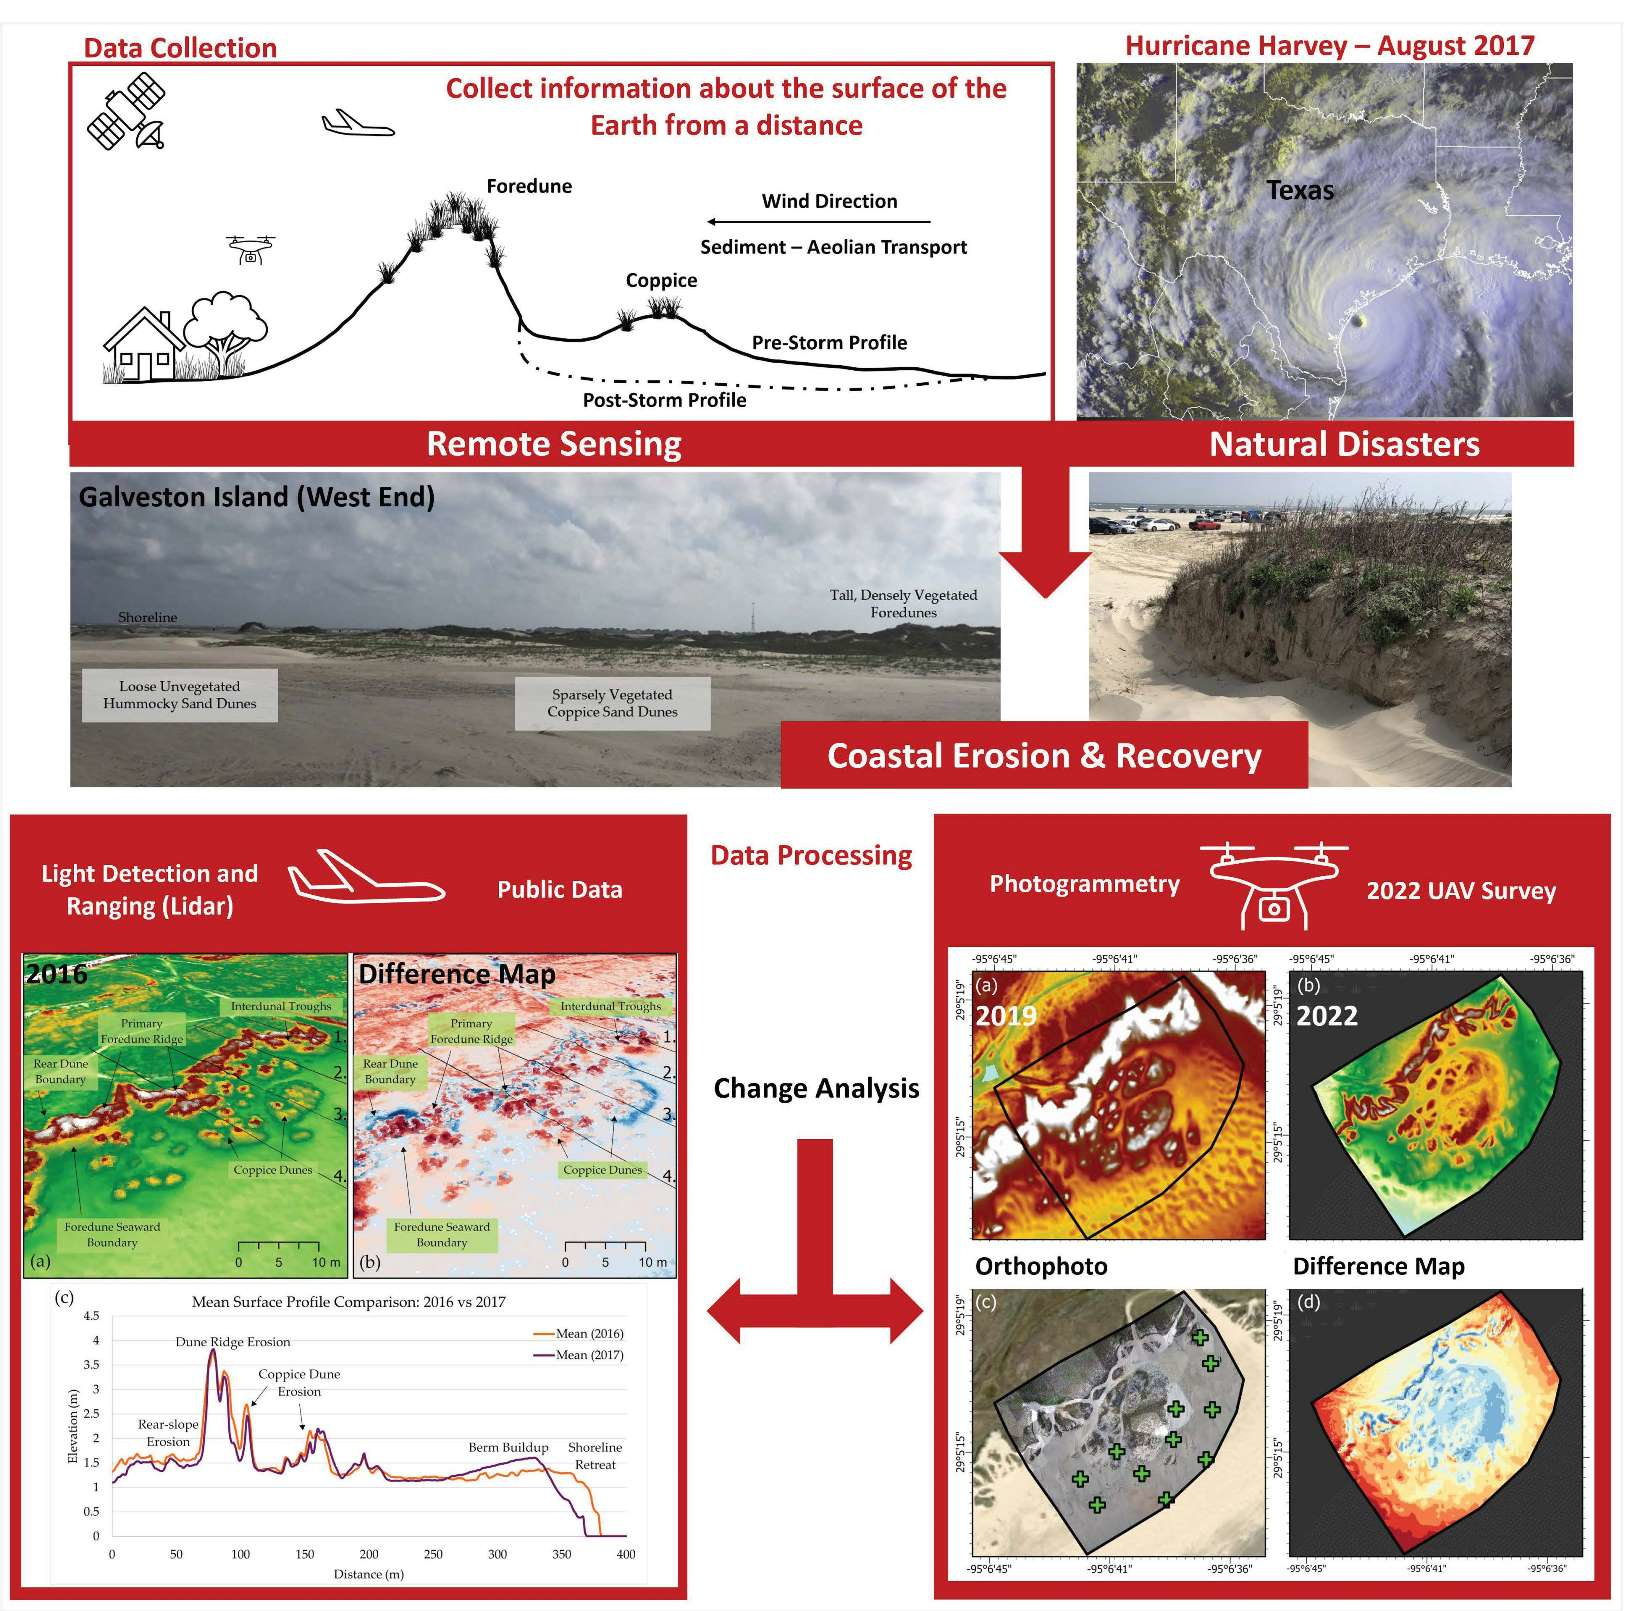
Impact of Hurricane Harvey on the Upper Texas Coast: Using Airborne Lidar Data Sets with UAV-Derived Topographic Data to Monitor Change and Track Recovery

Department of Earth and Atmospheric Sciences, University of Houston, Houston, TX 77204, USA
*
Author to whom correspondence should be addressed.
Remote Sens. 2022, 14(21), 5357; https://doi.org/10.3390/rs14215357
Submission received: 30 August 2022 / Revised: 18 October 2022 / Accepted: 20 October 2022 / Published: 26 October 2022
(This article belongs to the Special Issue Inauguration of Earth Observation for Emergency Management Section)

Abstract

:
The frequency of hurricanes and tropical storms is increasing; for example, there were a record-breaking 31 named storms during the 2020 Atlantic hurricane season. Texas has historically been susceptible to hurricanes and tropical storms; however, Hurricane Harvey in 2017 was the highest category storm event to cross Texas since 2000. Our regional change analysis used 2016 and 2018 lidar-derived elevation models with 1 m spatial resolution to determine above-sea level changes due to Hurricane Harvey. The upper Texas coast experienced shoreline erosion, with local depositional events occurring on the southeastern sides of jetties and groins. Incidents of dune washout and overwash fans were present along the barrier islands of the upper Texas coast, as well as erosion to foredune complexes and a decrease in dune heights. As of March 2018, recovery is visible through berm buildup and backbeach aggradation. Our multiyear analysis (above sea level) of four sites within Galveston and Follett’s Islands determined the immediate impact of Harvey (2016–2017) and followed recovery until March 2019. The multiyear analysis determined that all four sites experienced varying levels of recovery by 2018. UAV surveys conducted in 2022 showed potential in acquiring topographic data for comparison with 2019 beach-dune conditions.

Graphical Abstract

1. Introduction

Coastal dune systems are ever-changing and crucial components for the survival of coastline ecosystems. Coastal foredunes are the first line of defense against storm-related winds, high-energy waves, and storm surges. A beach can flatten and dissipate high-energy waves further offshore. Still, tall, densely vegetated, and stable foredunes are necessary to protect infrastructure and coastal ecosystems from the inundation of seawater [1].
Understanding the conditions required for coastal dunes to grow is essential to protecting this invaluable resource. Common characteristics of coastal dunes are steep windward slopes building up to a crest with gentle leeward slopes. Foredune crests are relatively flat and thickly vegetated with low, unvegetated interdunal troughs between dunes peaks [2]. Typical morphological features used to determine change to a beach-dune system include shoreline movement, vegetation line movement, heights and widths of coppice dunes and foredunes [3,4,5,6,7,8]. These features can be used as proxies to determine how an area has changed and the current processes guiding the morphological changes of an area.
Ideal circumstances for shoreline advance include relatively low-slope shores with an abundant supply of sediment and a large range between the high and low water levels to deposit sediment along the foreshore [2]. Onshore winds carry sand further inland toward the backbeach; provided adequate vegetation cover, the sand will accumulate among the obstructions. The berm crest is built up by low wave energy in the summer; sediment is deposited, distinguishing the steeper forebeach from the gentle sloping backbeach [9]. Further inland, coppice dunes are lightly vegetated dunes located seaward of the foredune complex and are the first stage toward forming a stable foredune ridge [2]. Coppice dunes are less stable and highly dynamic; however, if given enough time to grow in height and laterally, they can eventually form a foredune ridge [2].
In 1999, there were an average of 10 tropical storms over the Atlantic Ocean, Caribbean Sea, and the Gulf of Mexico every year. Among the 10 storms, six developed into hurricanes, and about two formed major hurricanes; roughly five hurricanes landed between Maine and Texas yearly [10]. Texas began a hurricane-rich period in 2003, with an average of eight hurricanes every 11 years [11]. Storm event frequency has increased, as 10 hurricanes and 14 tropical storms or depressions have crossed Texas in the last two decades (2001–2022) [12]. Hurricane Harvey (Category 4) was the highest-category hurricane to strike Texas since 2003 (Figure 1).
Several hours before landfall near Rockport, Texas, on 26 August of 2017, Harvey exhibited sustained winds of 115 kt, with the highest observed sustained winds observed near Rockport, Texas, at 126 kt [13]. Three hours after the initial landfall, Harvey made a second landfall on the mainland near the northeast coast of Copano Bay. Within twelve hours following landfall, Harvey degraded to a tropical storm as it traveled northwest before looping around and slowly moving southeast toward Matagorda Bay, dropping torrential rains across the Houston areas [13].
The typical diameter of a hurricane can be around 482 km wide; therefore, storm-related damage is not confined to the location of landfall [10]. Storm surge levels related to Harvey varied depending on the distance from landfall. Central Texas coastal areas experienced surges ranging from 0.6 to 2.13 m, with the highest levels of seawater inundation along the back bays between Port Aransas and Matagorda. The lower coastal Texas received storm surges between 0.3 to 0.91 m above ground level, and in the upper Texas regions, seawaters reached 0.6 to 1.21 m above ground level [13].
Texas coastal geomorphology studies between the 1970s and 1990s evaluated changes to shoreline movement and beach volume using aerial imagery and GPS surveys [14,15]. Shoreline movement determined using aerial imagery contained potential errors in the shoreline position, introduced by the digitizing of the wet/dry beach boundary, which varies depending on location, time, and date [5]. Disadvantages in GPS surveys included the time required to complete the surveys and potential errors introduced in the interpolation between GPS survey transects. The introduction of light detection and ranging (lidar) surveys in the 1990s decreased survey times and provided a continuous dataset. Presently, advances in technology have allowed public access to large-scale datasets online; however, these surveys are conducted sparingly, often after major storms, and usually at 1 m spatial resolution. Recent advances in drone (UAV) technology have allowed researchers to conduct single or multi-year beach-dune studies at a centimeter-level spatial resolution [16,17,18,19,20,21,22,23,24,25]. In 2020, a review of 48 studies conducted using UAV surveying on sandy beaches was compared for accuracy and quality assessment [17].
This study aims to evaluate the effect of Hurricane Harvey on the upper Texas coastal areas, complete an in-depth study of the subsections of Galveston and Follett’s Islands surrounding San Luis Pass, and better understand the geomorphological evolution of an area after a major storm event. The objectives of this work included: (1) performing a regional scale change analysis using publicly available lidar-derived digital elevation models (DEMs); (2) identifying the impact of Hurricane Harvey on beach-dune systems surrounding San Luis Pass; (3) examining the temporal variability in beach morphology using beach profiles through subsequent years; and (4) collecting data for 2022 using an unmanned aerial vehicle (UAV) to generate high spatial resolution orthophoto and digital elevation models, which were combined to create high-resolution three-dimensional models.
This study is the first application in a proposed five-year study on select beach-dune systems along the Texas Gulf coast. The Galveston and Follett’s UAV elevation data acquired in 2022 will serve as the baseline for future changes, as UAV surveys will be conducted every six months. A study of this kind aims to contribute to the understanding of beach-dune processes that guide recovery after major storm events.

2. Materials and Methods

This study used a two-part strategy. First, a regional analysis was conducted of Hurricane Harvey’s impact on coastal areas between the Matagorda Peninsula and the Bolivar Peninsula. Differences in elevation between pre- and post-Harvey were determined using publicly available elevation data (light detection and ranging [lidar]-derived point clouds and DEMs) downloaded from NOAA Data Access Viewer (Table 1). The second part of this study involved identifying areas of significant change and conducting topographic surveys using unmanned aerial vehicles (UAVs) to collect imagery to compare to previous topographic data.

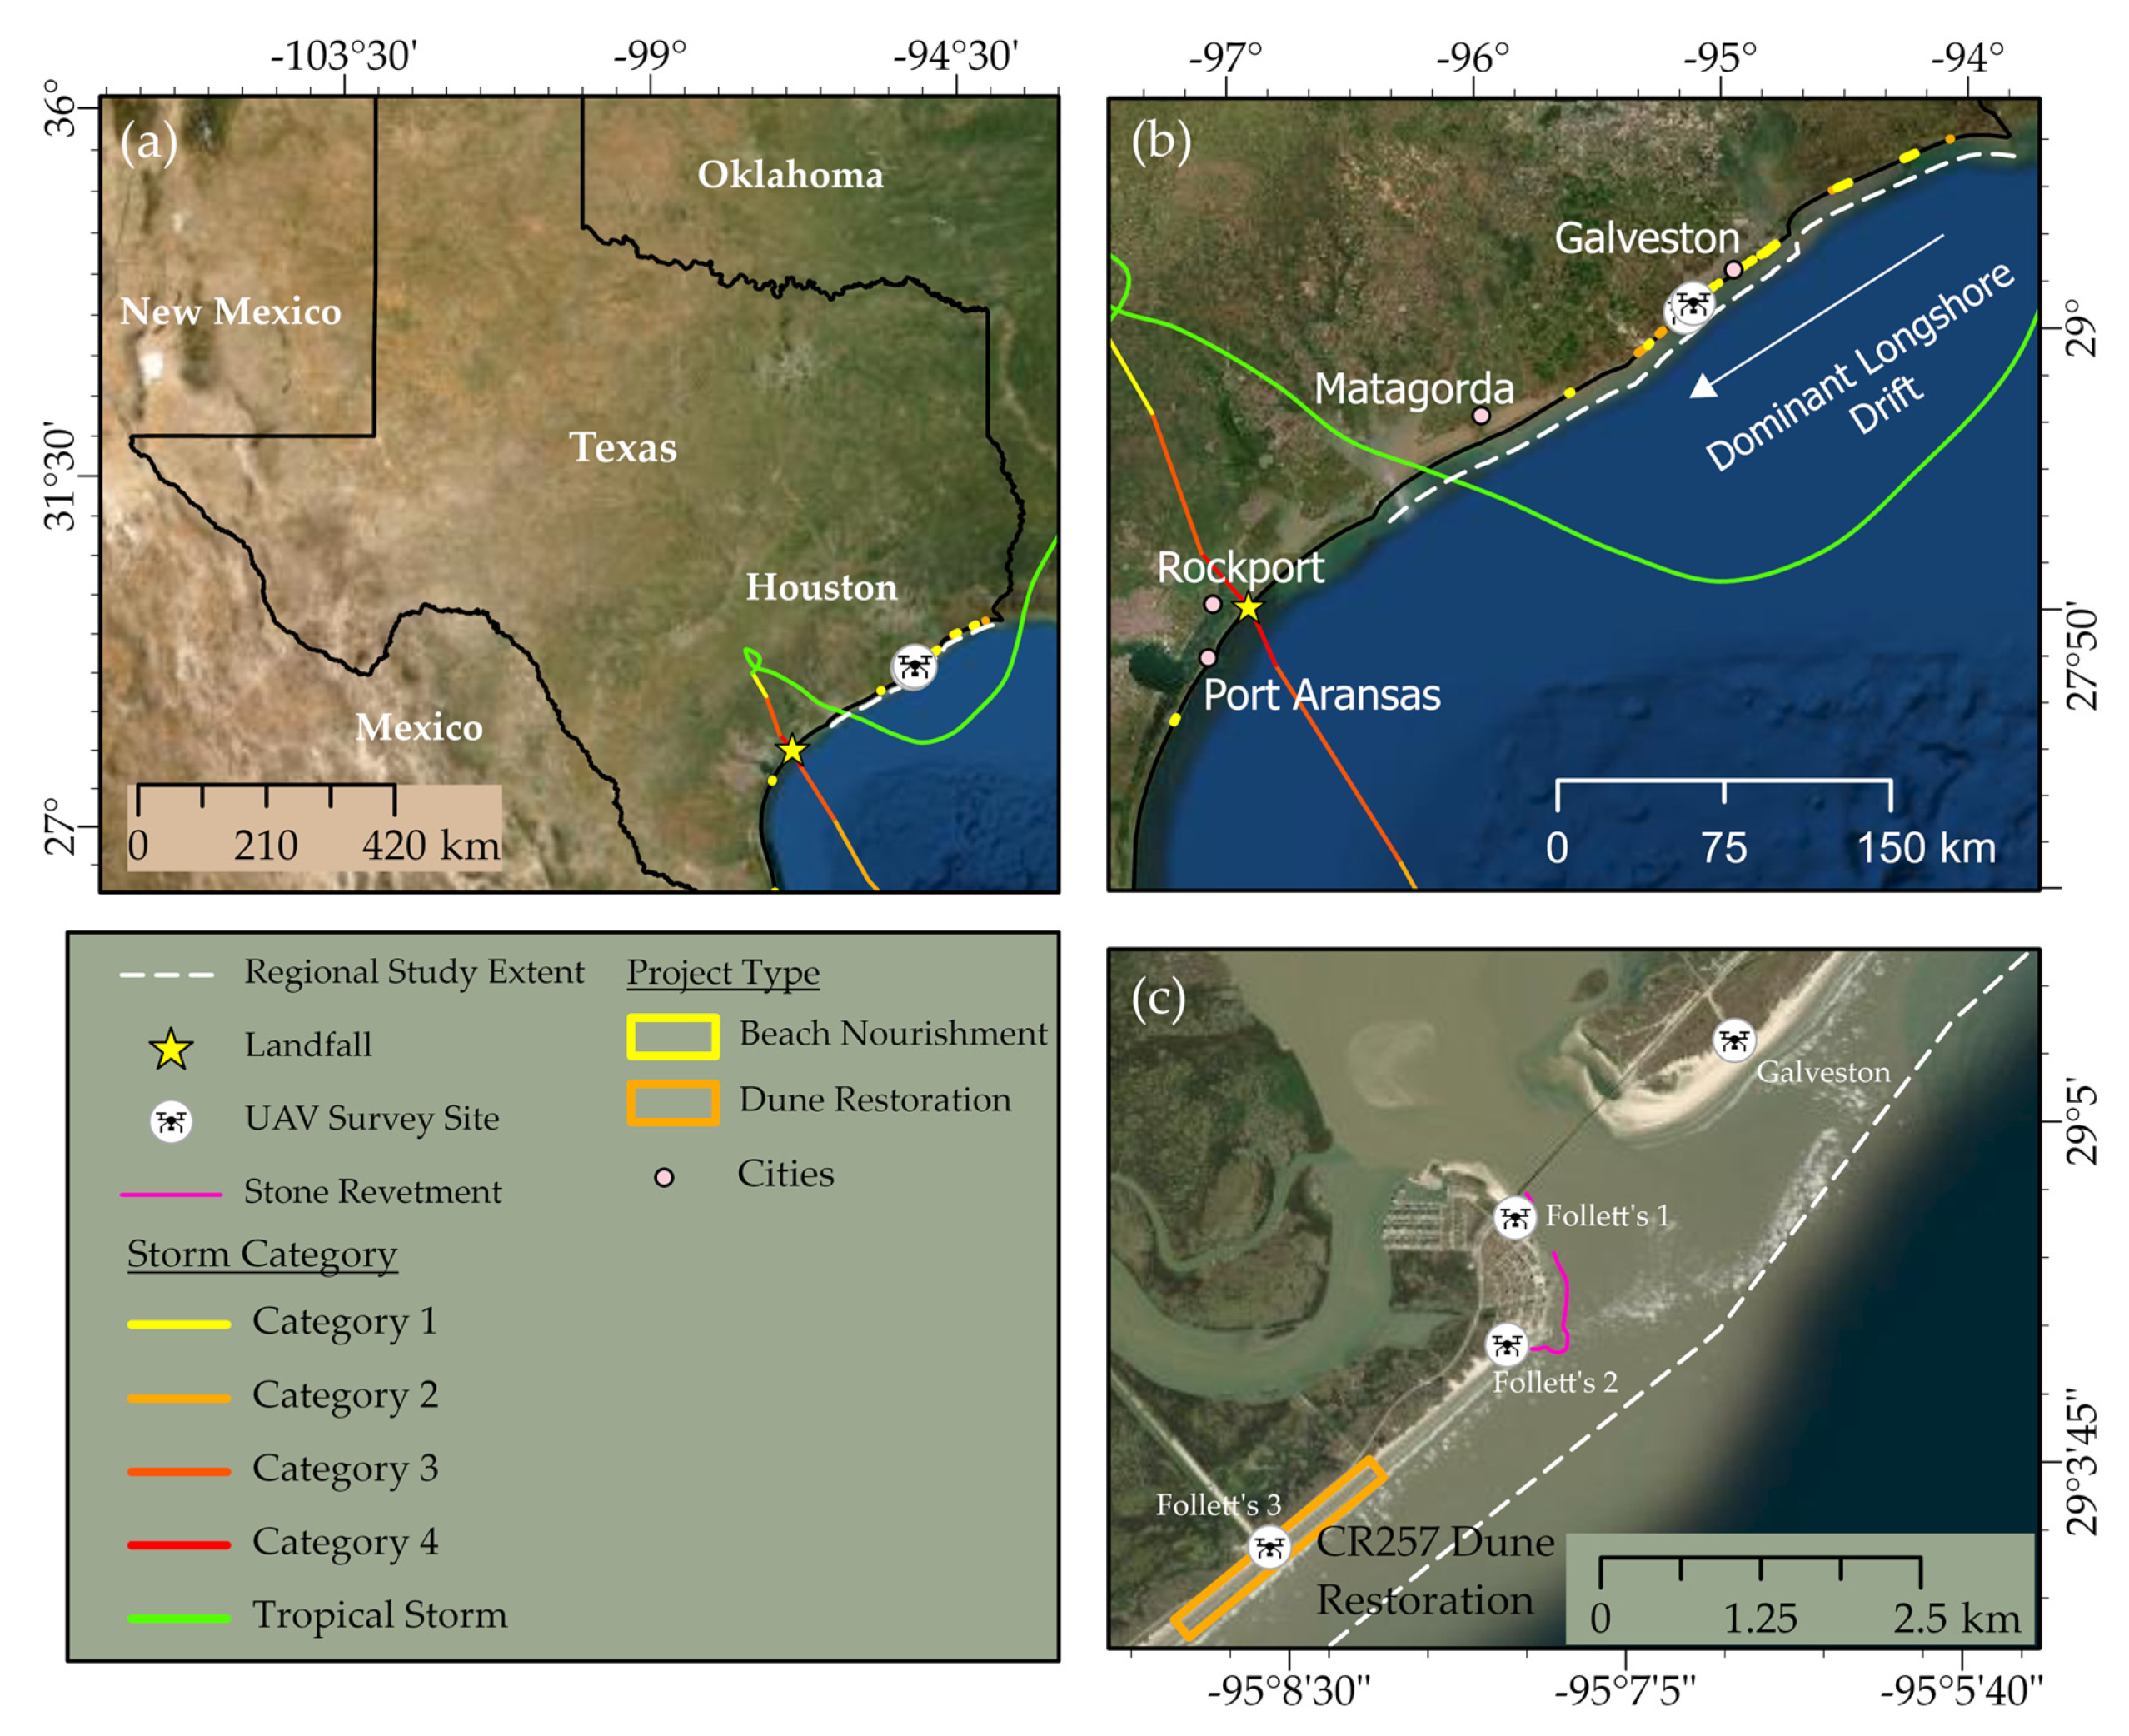
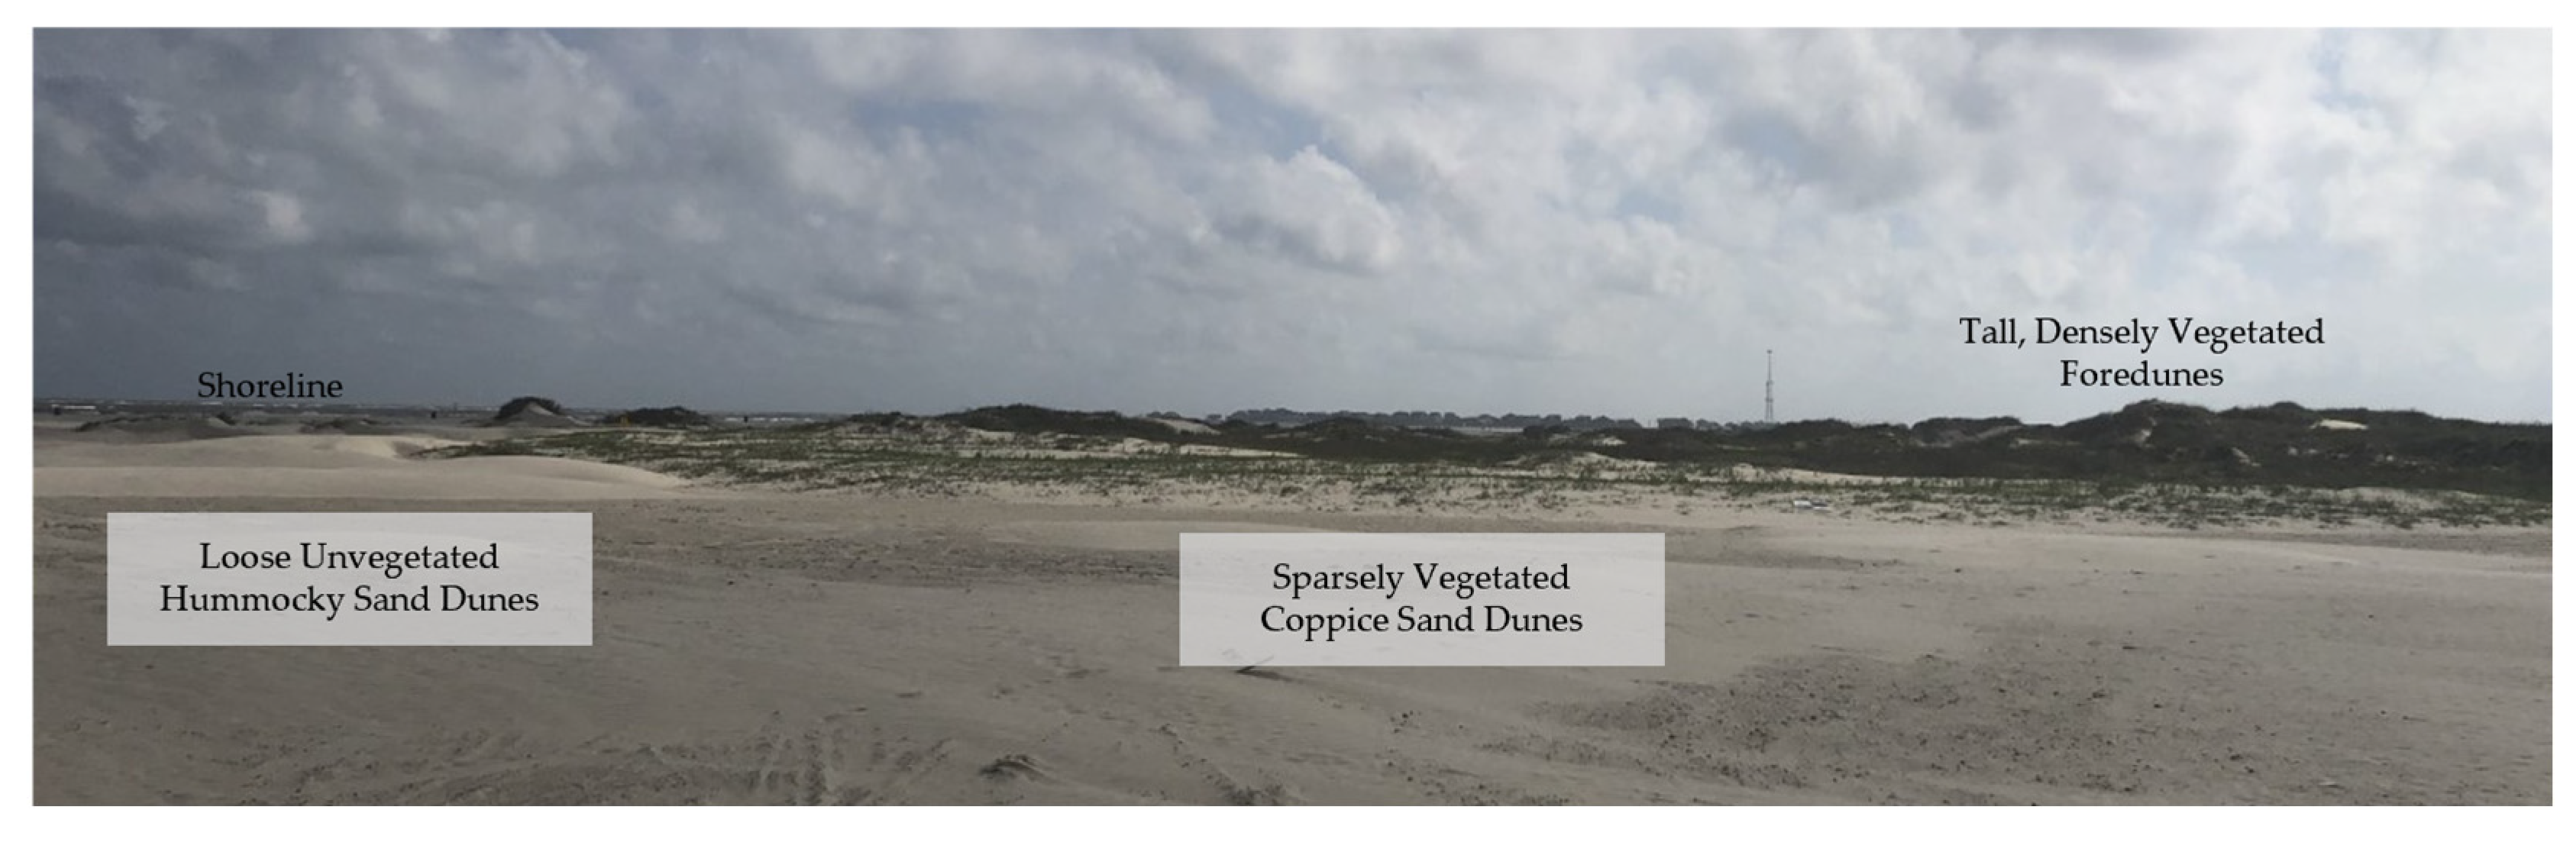
2.1. Study Area Background

The Texas coast consists of a system of Holocene barrier islands and peninsulas, separating marine embayments from the Gulf of Mexico [26]. This study first examined Harvey’s impact on the upper Texas coast, from the southwestern end of the Matagorda Peninsula to Bolivar Peninsula. Between barrier islands are tidal inlets, where the exchange of water and sediment occurs between the Gulf of Mexico and marine embayments.
The study then focused on sections of Follett’s Island and Galveston Island surrounding San Luis Pass, a kilometer-wide tidal inlet with the daily transfer of water and sediment between the Gulf of Mexico and the West Bay. San Luis Pass is within a micro-tidal region with low wave energy and predominantly southwestern winds. The sand-rich barrier islands are broad, with fine sand and relatively low backbeach elevations [9]. Sediments within the proximal area of the West Bay are dominantly fine sand; however, post-Harvey sediments were found to be finer compared to pre-storm samples [27]. Historical Texas shoreline positions and average annual shoreline movement rates show long-term erosional trends between the 1930s and 2019 for both Galveston and Follett’s Islands, where Galveston Island (west beach) retreated by ~0.93 m/yr and the Brazos-Colorado Headland (including Follett’s Island) retreated by ~2.16 m/yr. Conversely, the two areas contain differing short-term change trends between 2000 and 2019, where Galveston Island (west beach) advanced by ~0.45 m/yr and the Brazos-Colorado headland, including Follett’s Island, eroded by ~1.66 m/yr [5,28].
San Luis Pass is unique in that; (1) it’s been affected by multiple major storms since 2000, most notably Hurricane Ike (2008) and Harvey (2017), (2) the relatively high-velocity water exchange produces a deep and migrating channel carving sediment from the seafloor, (3) the ends of Follett’s and Galveston Island display opposing long-term movement trends as well as sand dune types, (4) San Luis Pass is one of the few naturally stable tidal inlets in Texas due to erosional long term terms and high-velocity waters which remove sediment along the seafloor resulting in a deep and migrating channel, and lastly (5) multiple years of elevation data are available for the area online.
Follett’s Site 1 (Figure 1c and Figure 2) is located southeast of the San Luis Pass Toll Bridge, where foredunes intersect with a residential property. Site 1 is on the southeastern side of the toll bridge, where the daily flow of water provides sediment aiding shoreline advance but also carves sediment away, contributing to shoreline retreat. This site is affected by property development and is a direct comparison to the unaltered and protected beach northwest of the toll bridge.
The “Treasure Island MUD Shoreline Protection” [29] project altered Follett’s Site 2 (Figure 1c and Figure 3) between November 2017 and August 2019 via the construction of a stone revetment (a stone or slab wall built to protect a shoreline from scarp, strong wave action, or storm surges) connecting the pre-existing revetment near the southeastern extent of Gulf Beach Drive to the CR257 bridge abutment (Figure 2c). The western end of the UAV survey for Site 2 contained piles of wood chips or mulch (Figure 3b). Similar features are present at Follett’s Site 3, where there was a confirmed dune restoration project (Figure 1c and Figure 4a).
The “CR 257 Dune Restoration” project zone seen in Figure 1c contains Follett’s Site 3 (Figure 4). The project began in October 2011 and restored approximately 5 miles of dune systems protecting wetland complexes and preserving the island’s main road, County Road 257 [30].
The western end of Galveston Island has advanced since the mid-1990s [5,9]. The area possesses a different morphology than Follett’s sites described in this study. Shorelines typically extend further outward toward the Gulf of Mexico with a broader backbeach extent, more expansive, lightly vegetated coppice dune clusters, and taller and laterally longer foredunes compared to the Follett’s Island sites (Figure 5). Within the foredune systems, loose unvegetated channels of sand (interdunal troughs), commonly altered by tourists driving through with all-terrain vehicles, run between foredune ridges.

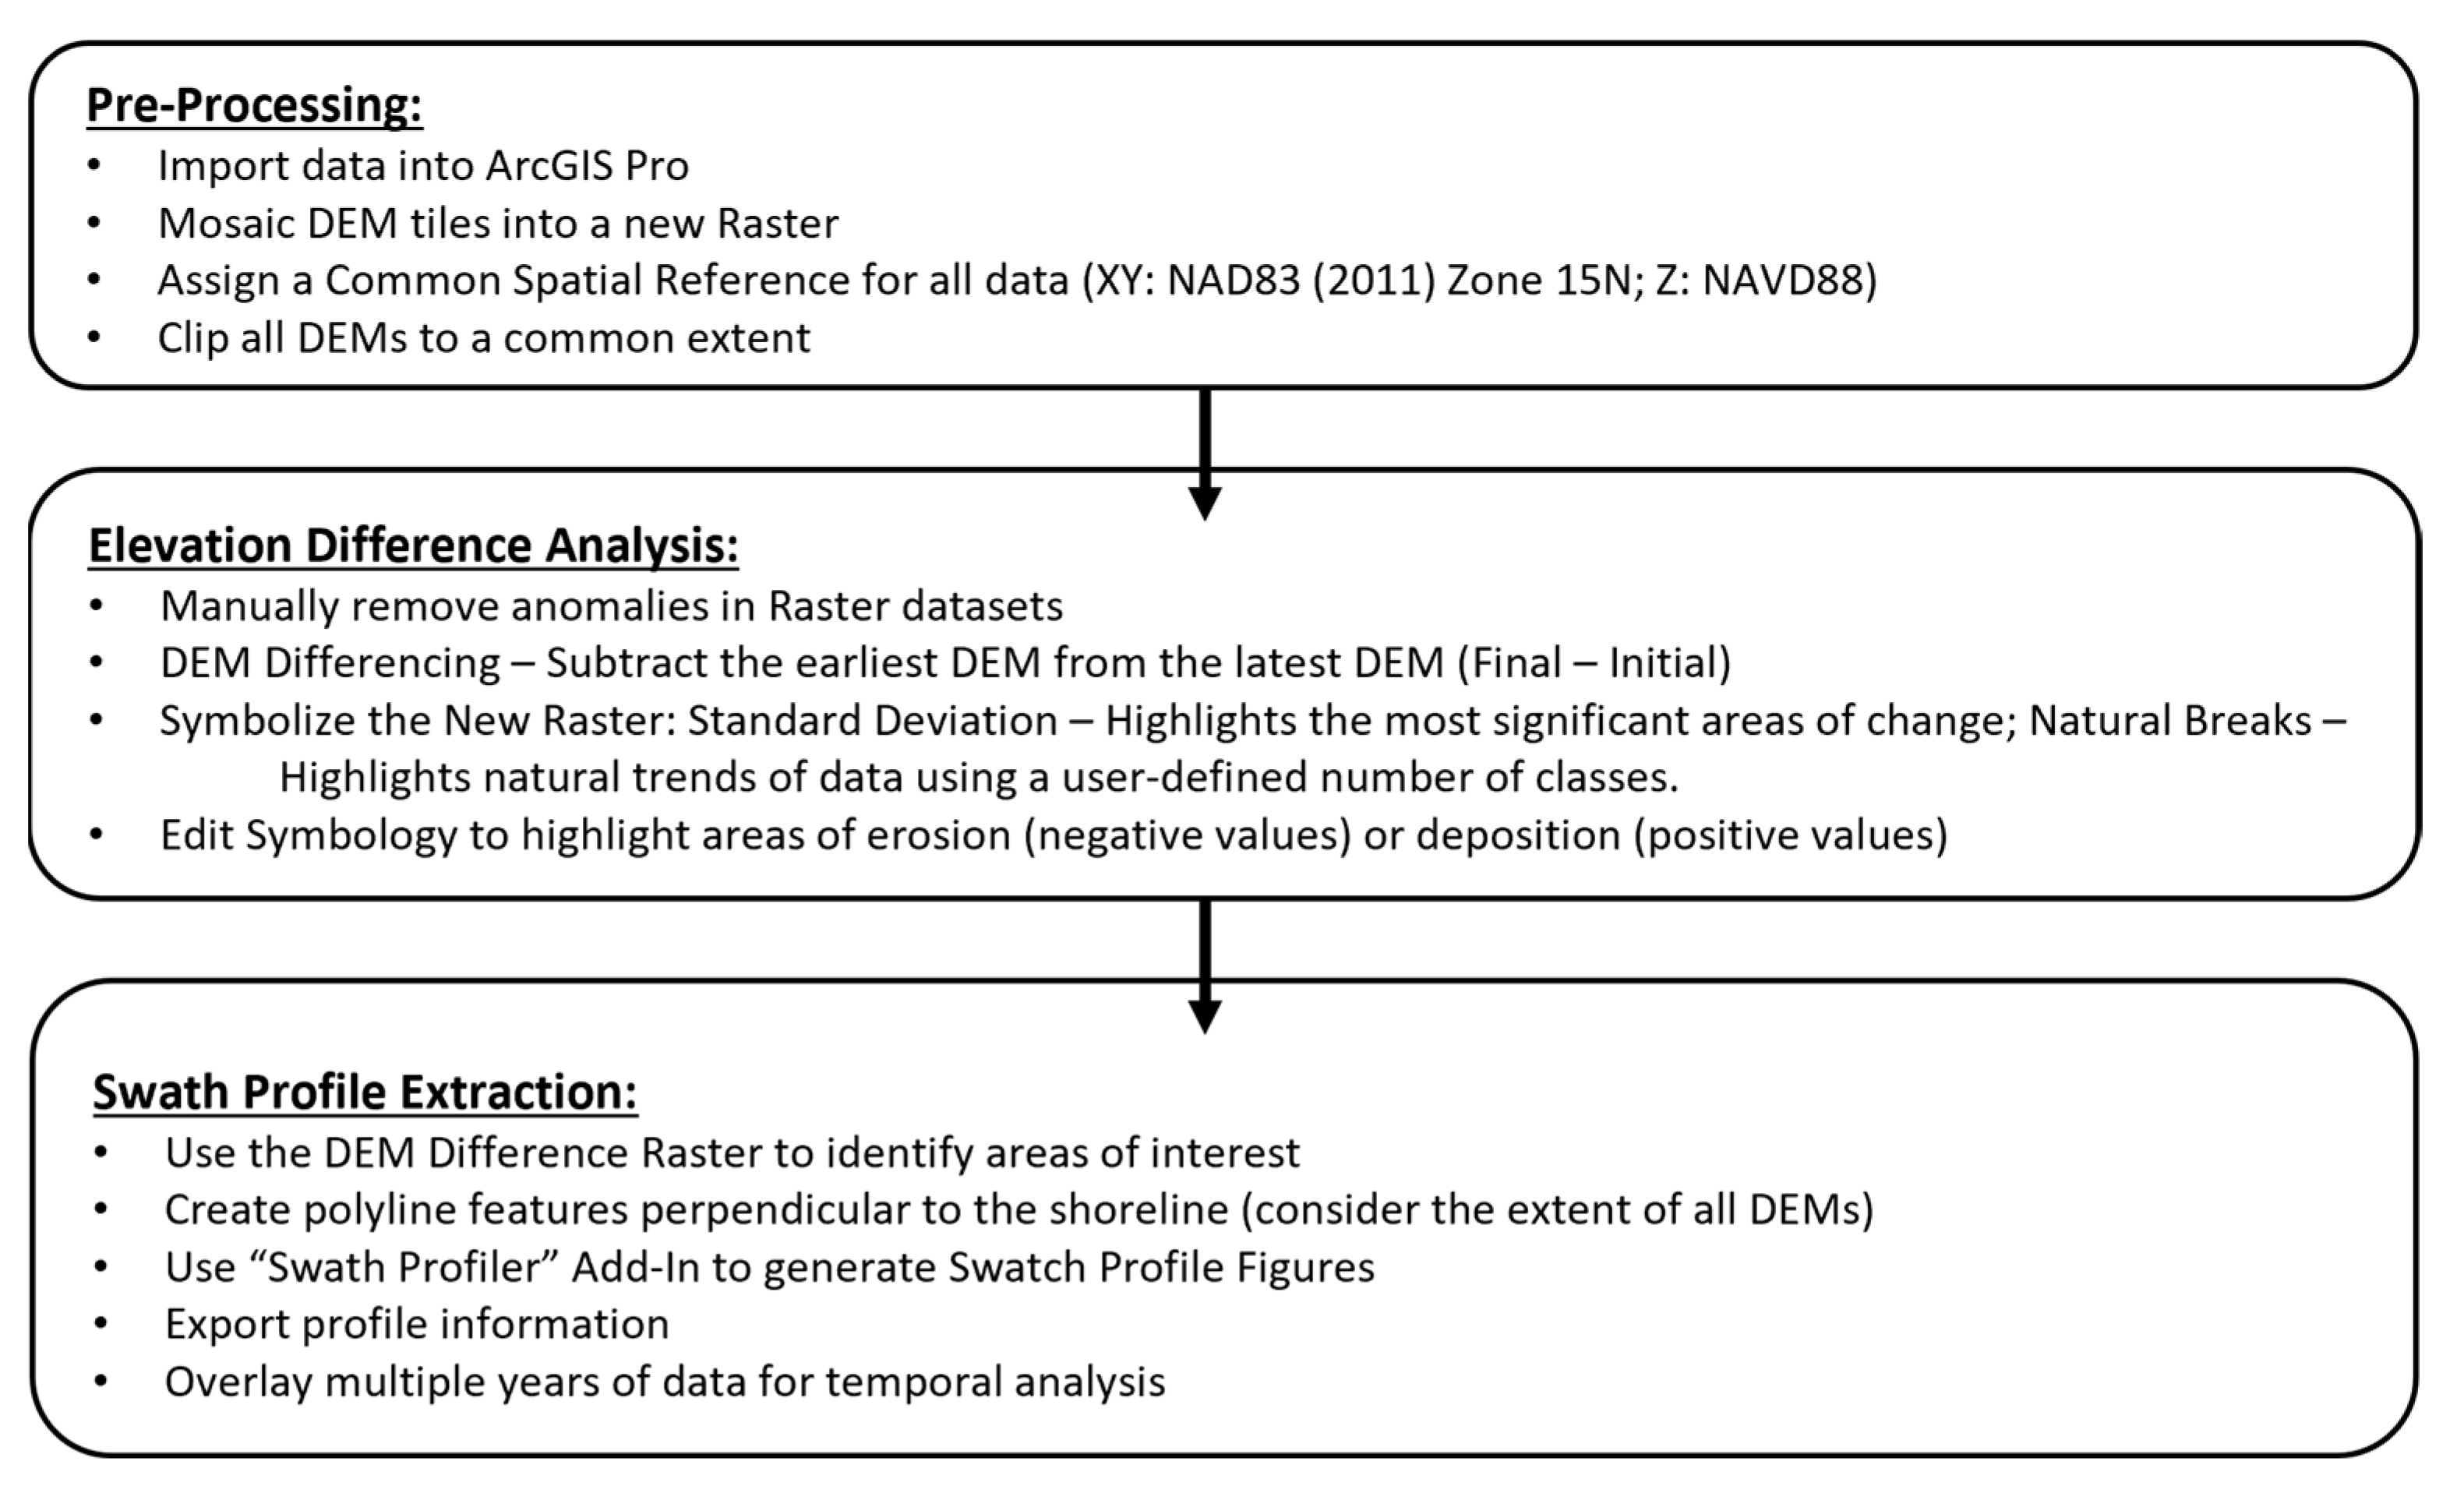
2.2. Topographic Elevation Data Processing

The open-sourced download manager application “uGet” [31] was used to batch download elevation data sets from NOAA’s Data Access Viewer since a large amount of data was required for an upper Texas coast regional change analysis. The LAStools [32] application was used to decompress LAZ files into LAS files, and only the ground return point clouds were imported into ArcGIS Pro [33]. The “LAS Dataset to Raster” tool was used to generate a lidar-derived DEM, and the local-scale products were projected to a common spatial reference: North American Datum (NAD) 1983 (2011) Universal Transverse Mercator Zone 15N. Lastly, a DEM difference map was generated by subtracting the older raster from the newer raster using the “Raster Calculator” tool. Figure 6 contains a general workflow for data processing in this study.
The 2018 “Lidar DEM: Coastal Texas” acquired by the Texas Water Development Board (Table 1) is the closest publicly available post-Harvey elevation data. Within months of Harvey’s landfall, between January and March 2018, the 2018 dataset was acquired. Therefore, data acquired sooner would be necessary to achieve an instantaneous change analysis of the area due to Harvey. The regional study identified San Luis Pass as an area of interest for a more detailed post-storm analysis. A lidar-derived DEM for 2017 was received from BEG [5,28] for sub-sections of Follett’s and Galveston Island (about 3–4 km inland from the toll bridge abutments). The 2017 dataset was a digital surface model generated using the Geoid 12b model. Therefore, the 2016 dataset was re-downloaded using the Geoid12b model for the immediate post-Harvey assessment. The 2017 DEM from BEG was initially partially cleaned, with portions of residential houses, businesses, and large shrub areas removed. No significant alterations to these features were seen in aerial imagery; therefore, “Terrain Filter” in ArcGIS Pro was used to edit the raster manually. The 2016 dataset was imported into ArcGIS Pro and mosaiced into a single raster file. Since the 2016 dataset included all returns, additional features needed to be manually edited, including cell/radio towers, powerlines, residential houses, and businesses. Lastly, the “Void” tool was used to fill holes within the DEM maps.
Bare ground elevation data sets (2016, 2018, and 2018/2019) (Table 1) were downloaded for the local bare ground change analysis from NOAA Data Access Viewer using the current geoid model, Geoid 18, and pre-processed following the steps listed in Figure 6.
Beach profiles provide information about the characteristics of a beach-dune system, such as the foredune height and width. Profiles also provide insight into sediment distribution around berms, dune slopes, and coppice dunes. The SwathProfiler ArcMap 10.1+ Add-in [34,35] was used to extract sequential spatial profiles from 2016, 2018, and 2018/2019 data sets. This tool took a single user-defined beach transect and generated 50 additional transects within a specified distance from the original, where 25 transects were generated on each side. A mean beach profile was generated from the 50 beach profiles. The temporal variability of beach-dune systems was analyzed to better understand the morphological evolution of sites surrounding San Luis Pass.
Due to the long time and high costs associated with collecting lidar data for coastal areas, the primary sources for free topographic data sets are state and federal agencies. However, online data sources (NOAA Data Access Viewer, Texas Natural Resources Information System) are sparse, and surveys are generally collected after a natural disaster has altered an area. Current data are suitable for determining large-scale changes to coastal areas; however, the current quantity and meter-scale resolution of publicly available topographic data only provide snapshots in time and do not contribute to the true dynamics that shape coastal beach-dune systems. Photogrammetry and unmanned aerial vehicles have proven to be reliable and low-cost solutions for collecting coastal topographic information such as elevation, land cover types, and vegetation [16,17,18,19,20,21,22,23,24,25].
In this study, Trimble R9 receivers with Zephyr 3 Geodetic antennas were set as static base stations within each survey. Six to twelve ground control points (GCPs) were placed throughout the survey sites. A Laser Atlanta Advantage Rangefinder (Figure 2a) was used to measure distances between base stations and each GCP with an accuracy of up to 15 cm. Aerial photos were acquired using a DJI Matrice 600 Pro (M600) drone equipped with a Zenmuse XT2 camera capable of taking visual and thermal imagery simultaneously. Autonomous flight plans were pre-programmed using the DJI Pilot App. Images were collected every 2.5 s, and flight lines were designed with an 80% front and side image overlap. Flight altitudes of 45 or 60 m were chosen to achieve optimal ground sampling distance for each survey configuration while considering the 20-to-40-min battery life. Survey information, such as flight time, estimated coverage, and the number of photos taken, is shown in Table 2.
GPS observation files were downloaded from the R9 receivers and post-processed using the Online Positioning User Service, with ~1 cm horizontal and ~3 to ~6 cm vertical accuracies. ArcGIS Drone2Map [36], a UAV photogrammetry application, was used to generate orthophotos, digital terrain models, and high-resolution three-dimensional models used in this study to determine topographic changes. Each site’s visual photos were imported into Drone2Map and processed separately, and approximately 8 to 14 GCPs were linked to 10 to 15 images within each survey site. A water body mask was created, excluding wave texture along the wet/dry beach boundary line. The final products were clipped to the wet/dry beach line, and inadequately imaged areas along the edges were excluded.

3. Results

3.1. Regional Scale: Upper Texas Coast: Post-Harvey Change Analysis

About 65 to 70 km northeast of Harvey’s landfall, scarped shorelines, breached dunes, and a visible overwash (Figure 7b) were observed on the southwestern end of the Matagorda Peninsula (southwest of the Matagorda Ship Channel). Foredune complexes, approximately 425 m inland, experienced vertical erosion of around ~1 m with some instances of ~2 m (Figure 7b). Between 2016 and 2018, the remainder of the peninsula experienced shoreline advance, berm build-up along the post-storm shoreline, aggregation of the backbeach, and accretion of sediment along the windward foredune slope. The larger section of Matagorda Peninsula to the northeast of the ship channel exhibited mainly berm build-up and deposition along the beach with around 0.5–1 m of vertical erosion along the primary foredune ridges.
About 106 km northeast of Harvey’s landfall, a 3 to 4 km stretch southwest of the Matagorda Channel displayed significant scarping of the shoreline, with a ~2 to 3 m decrease in elevation along the shoreline (Figure 7c). Shore accretion occurred on the channel’s opposing side. About 160 km northeast of Harvey’s landfall, two large overwash fans (left—about 420 m across along the shoreline; right—about 400 m across along the shoreline) occurred between Sargent and Freeport; both flattened the beach-dune areas by about 0.5 to 1 m and connected the Gulf of Mexico to Cedar Lakes and surrounding water bodies (Figure 7d).
Between 2016 and 2018, the groins along Seawall Boulevard in Galveston trapped around 0.5 to 1m of sediment, with a maximum of ~1.5 m increase within the first pair of groins (Figure 7f). Figure 7f,g shows subsections of the Bolivar Peninsula and Galveston Island (approximately 260 km northeast of landfall) with sediment deposition along the windward foredune boundary and backbeach, relic foredune erosion, and some instances of berm buildup.

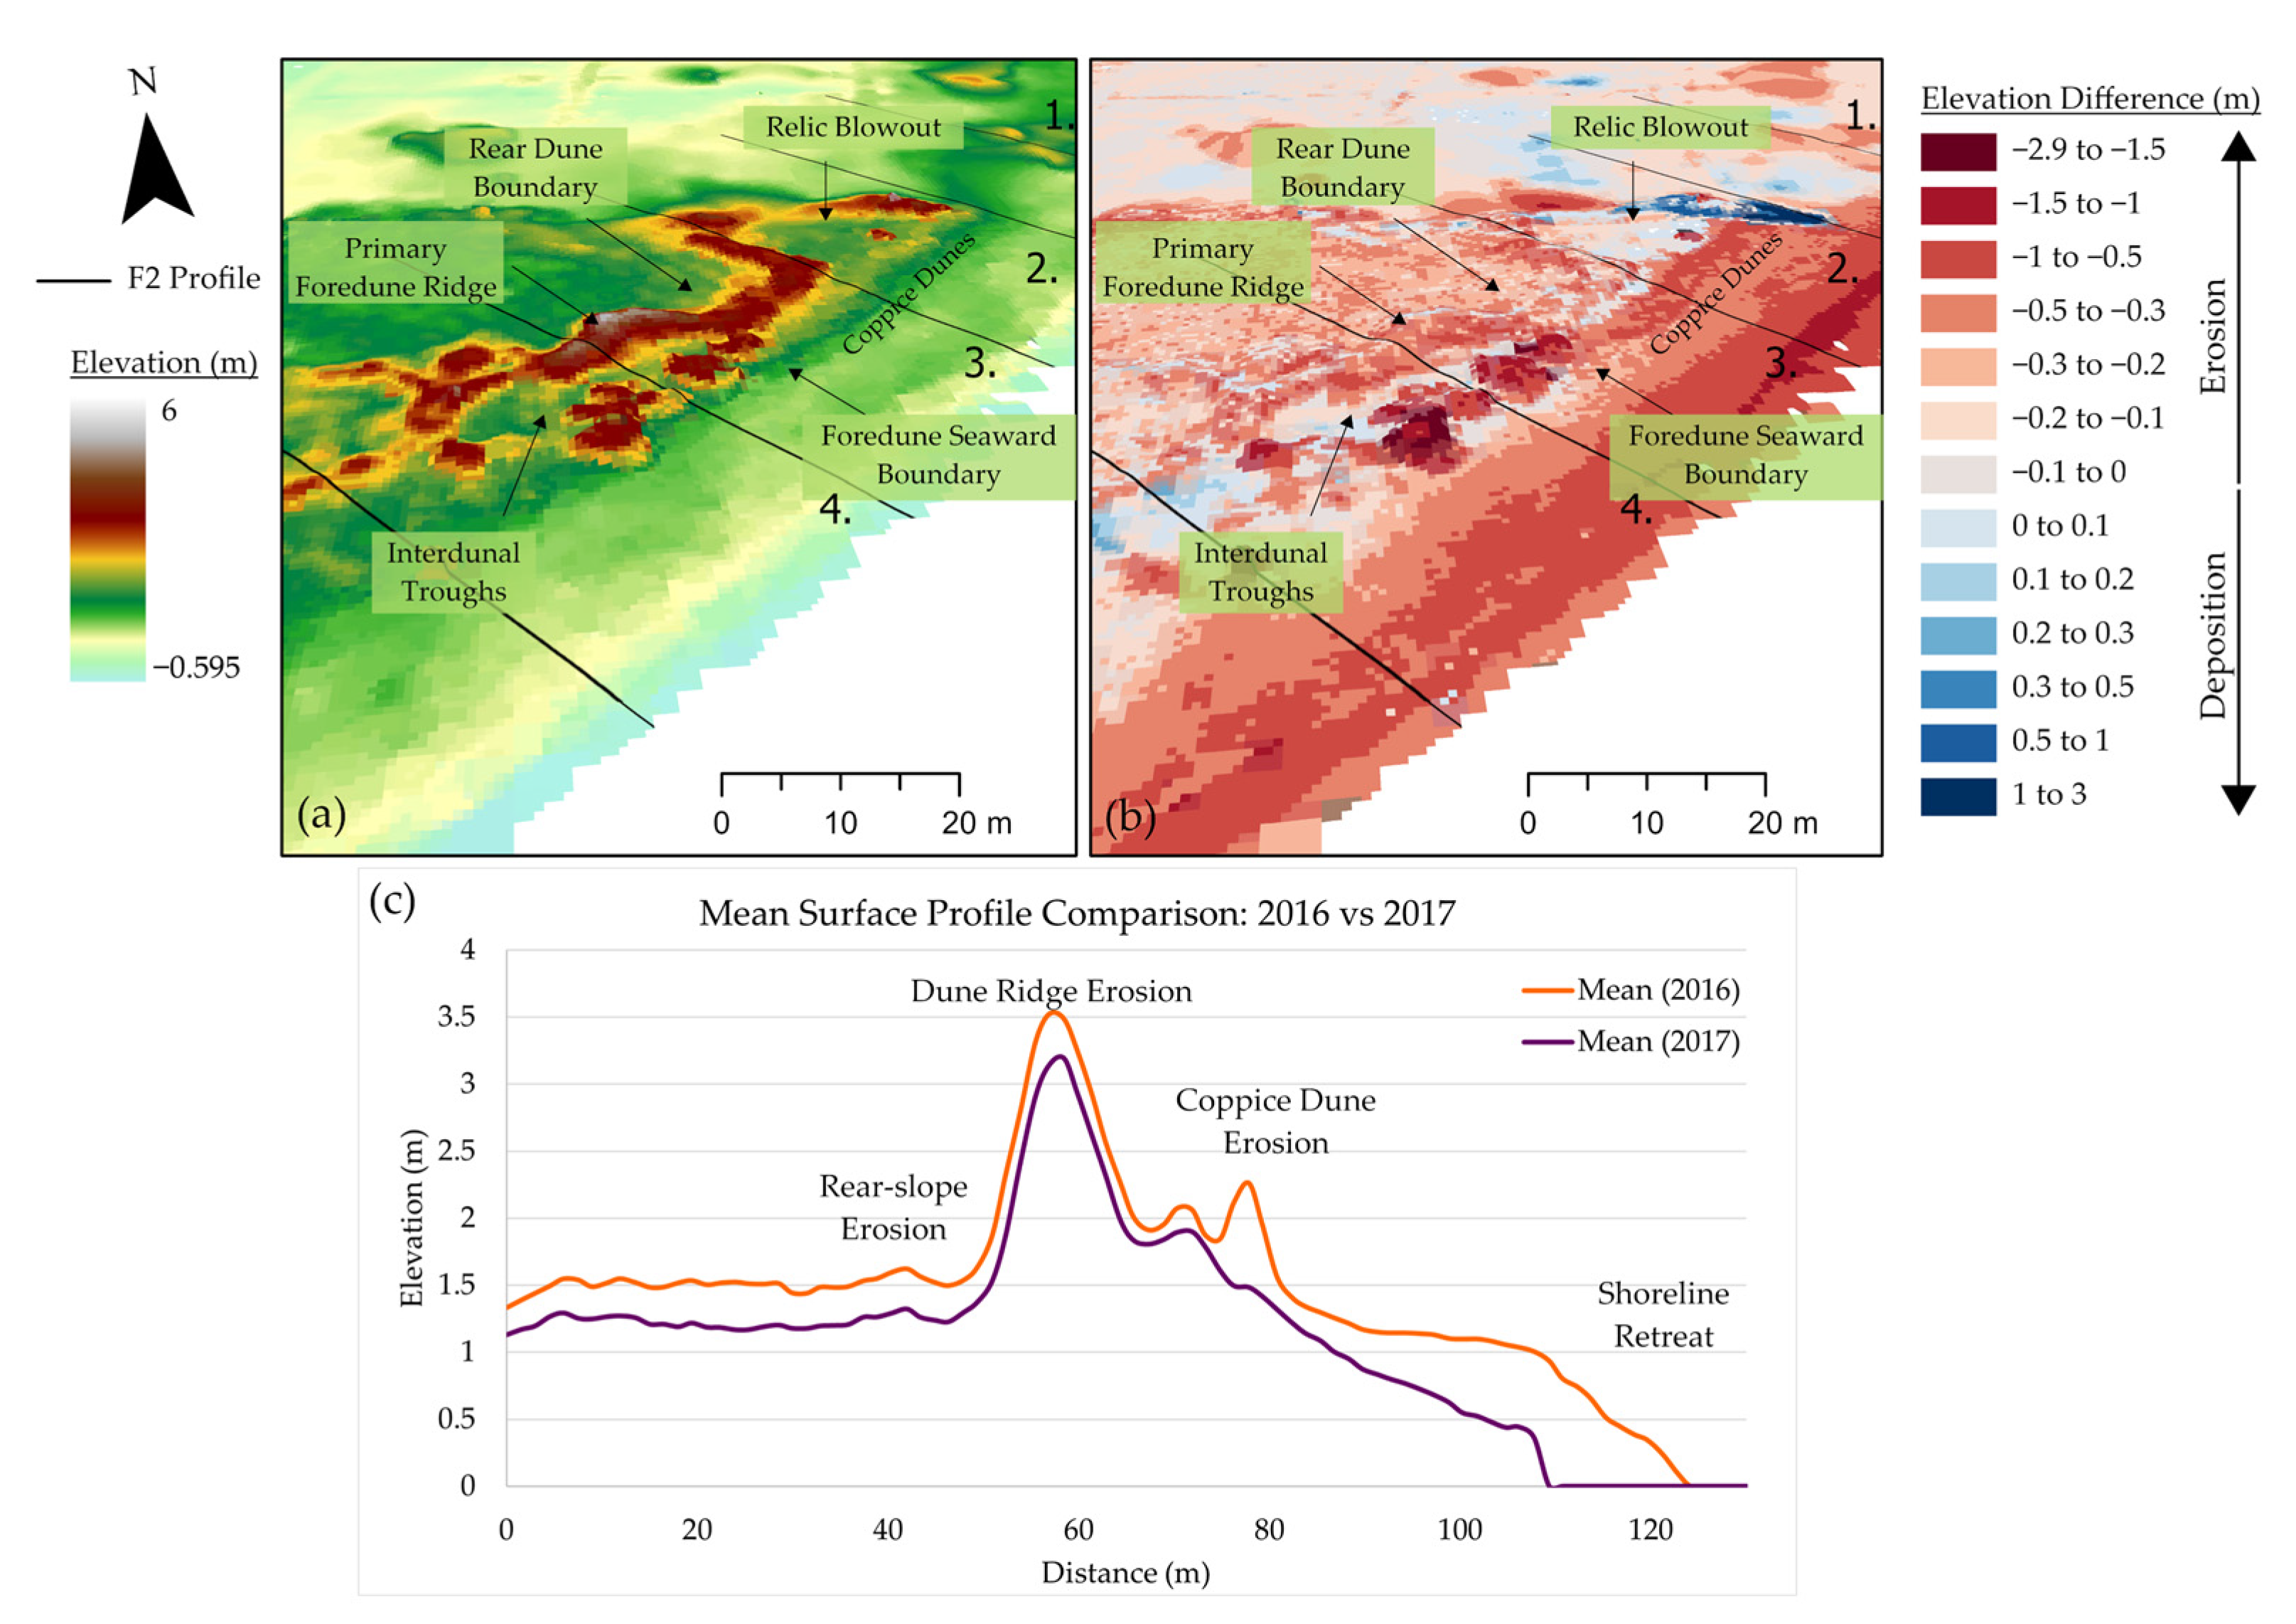
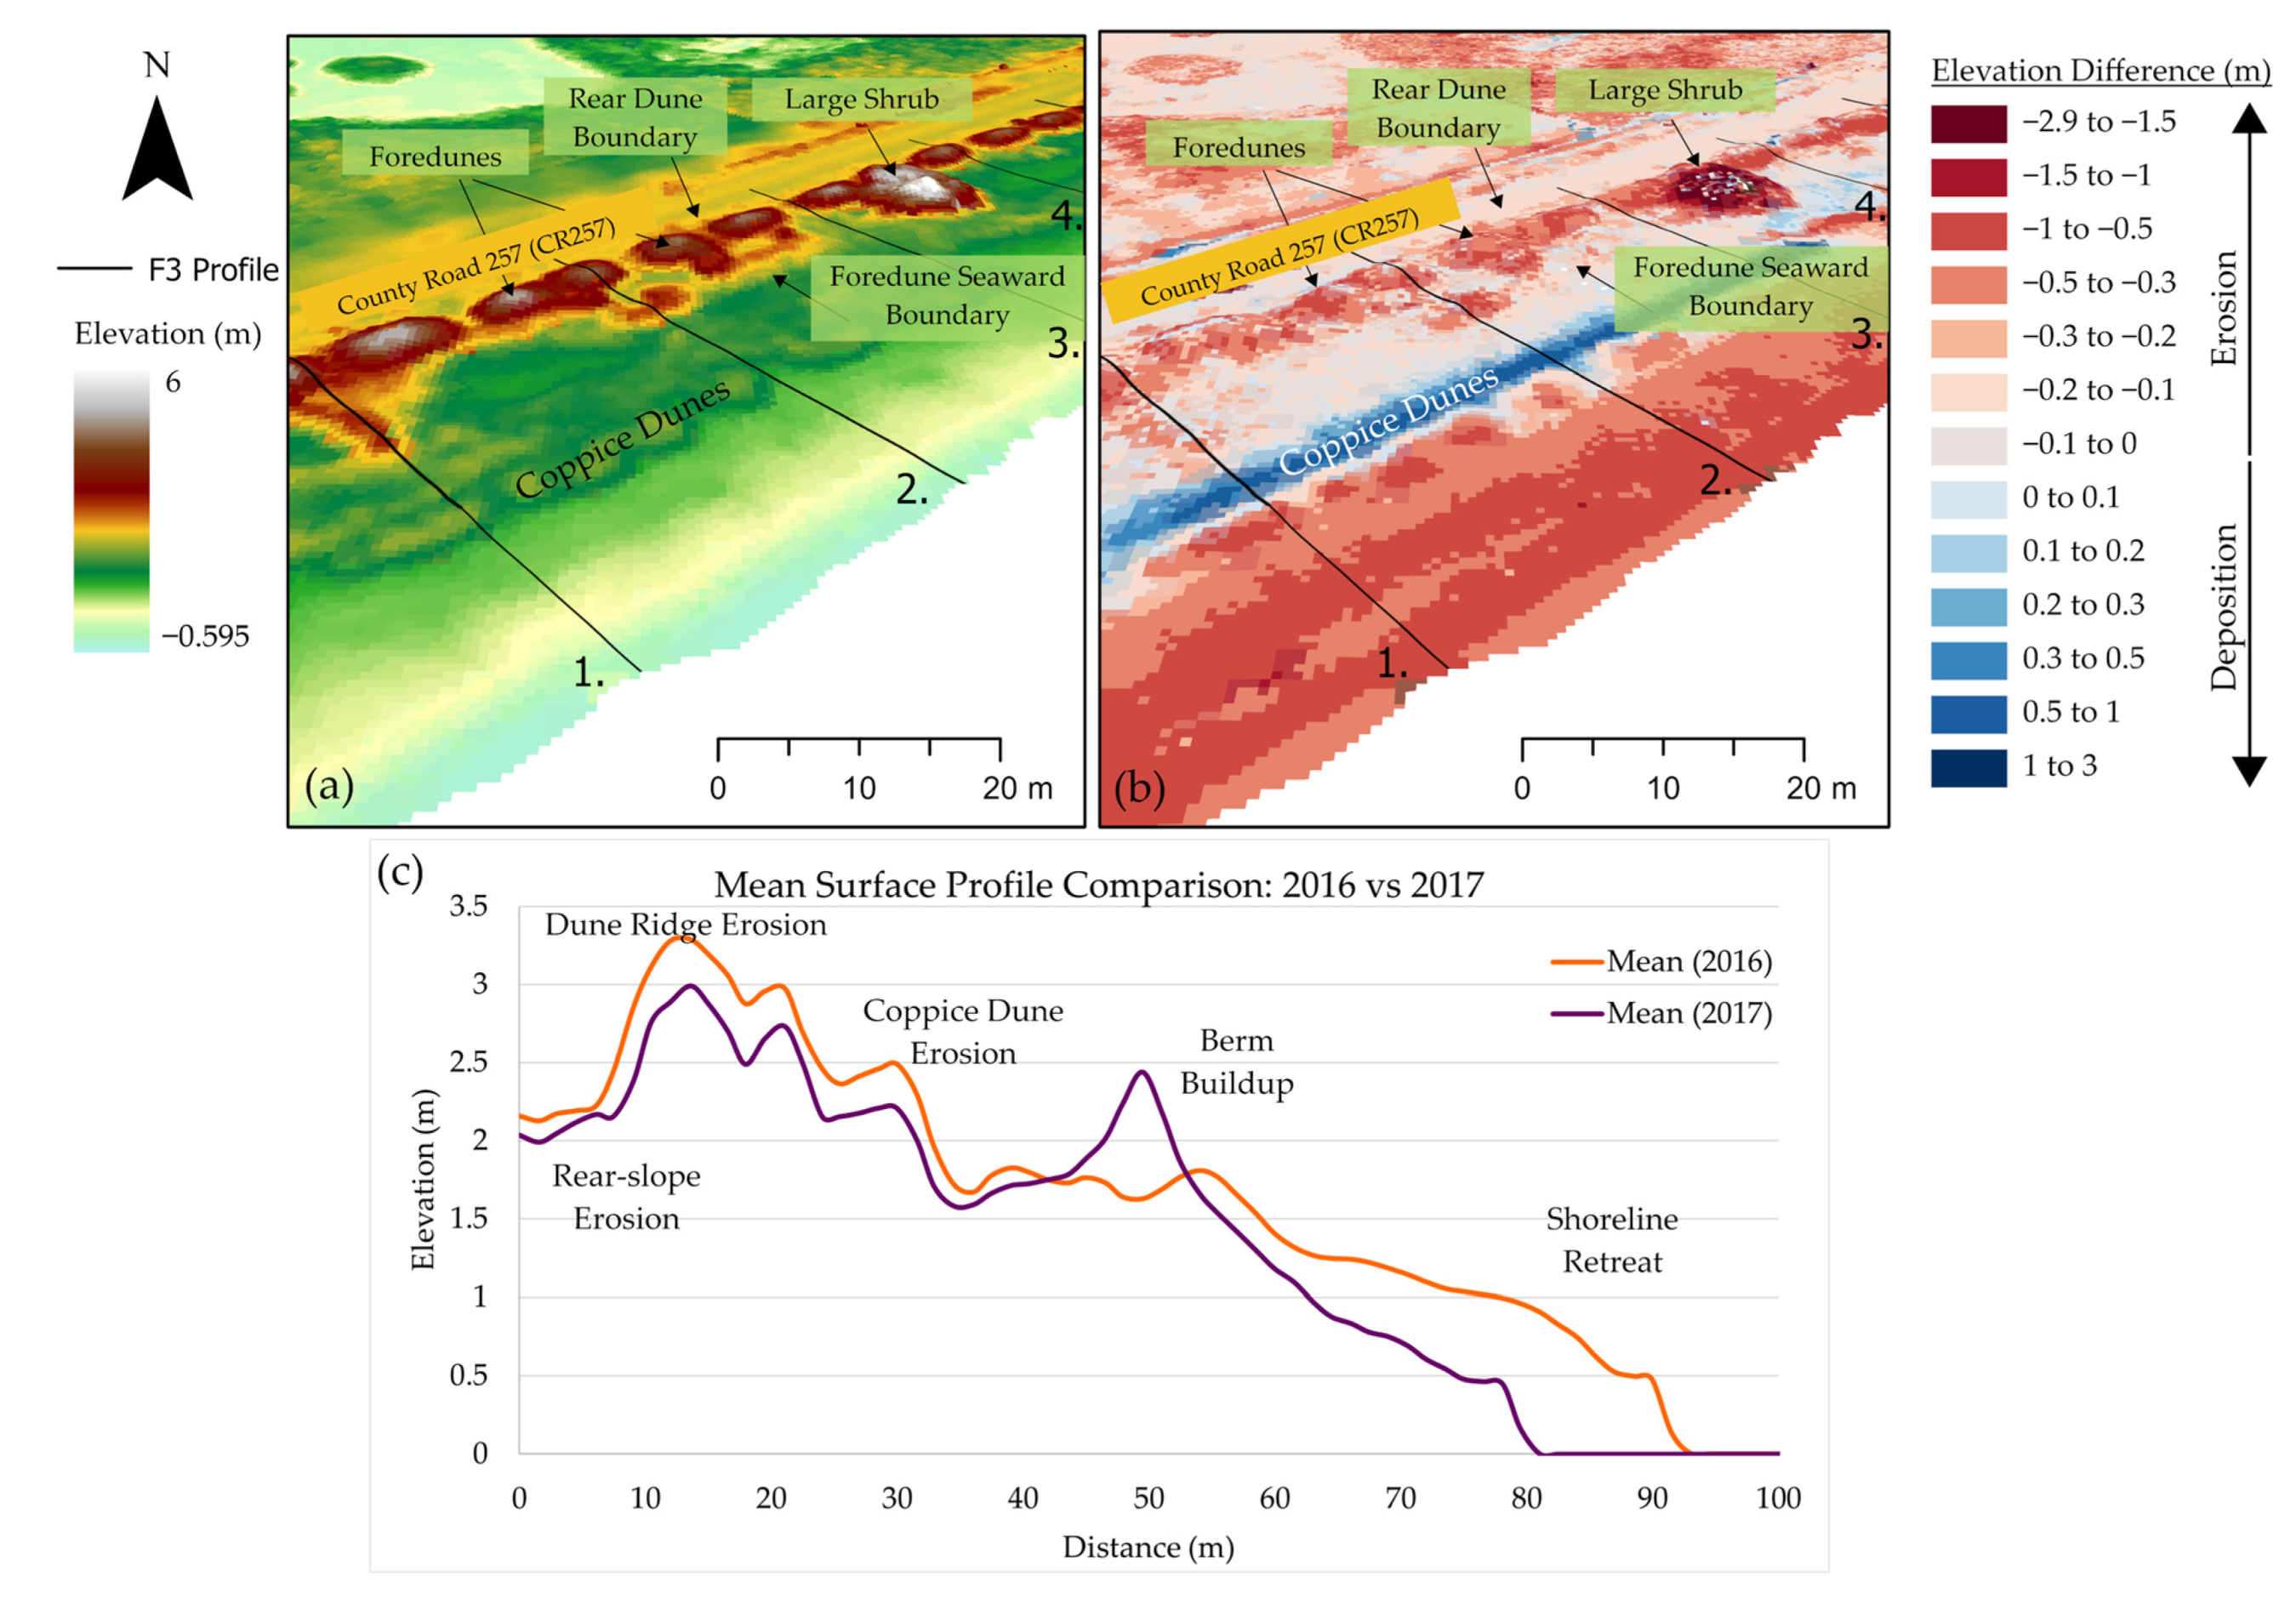
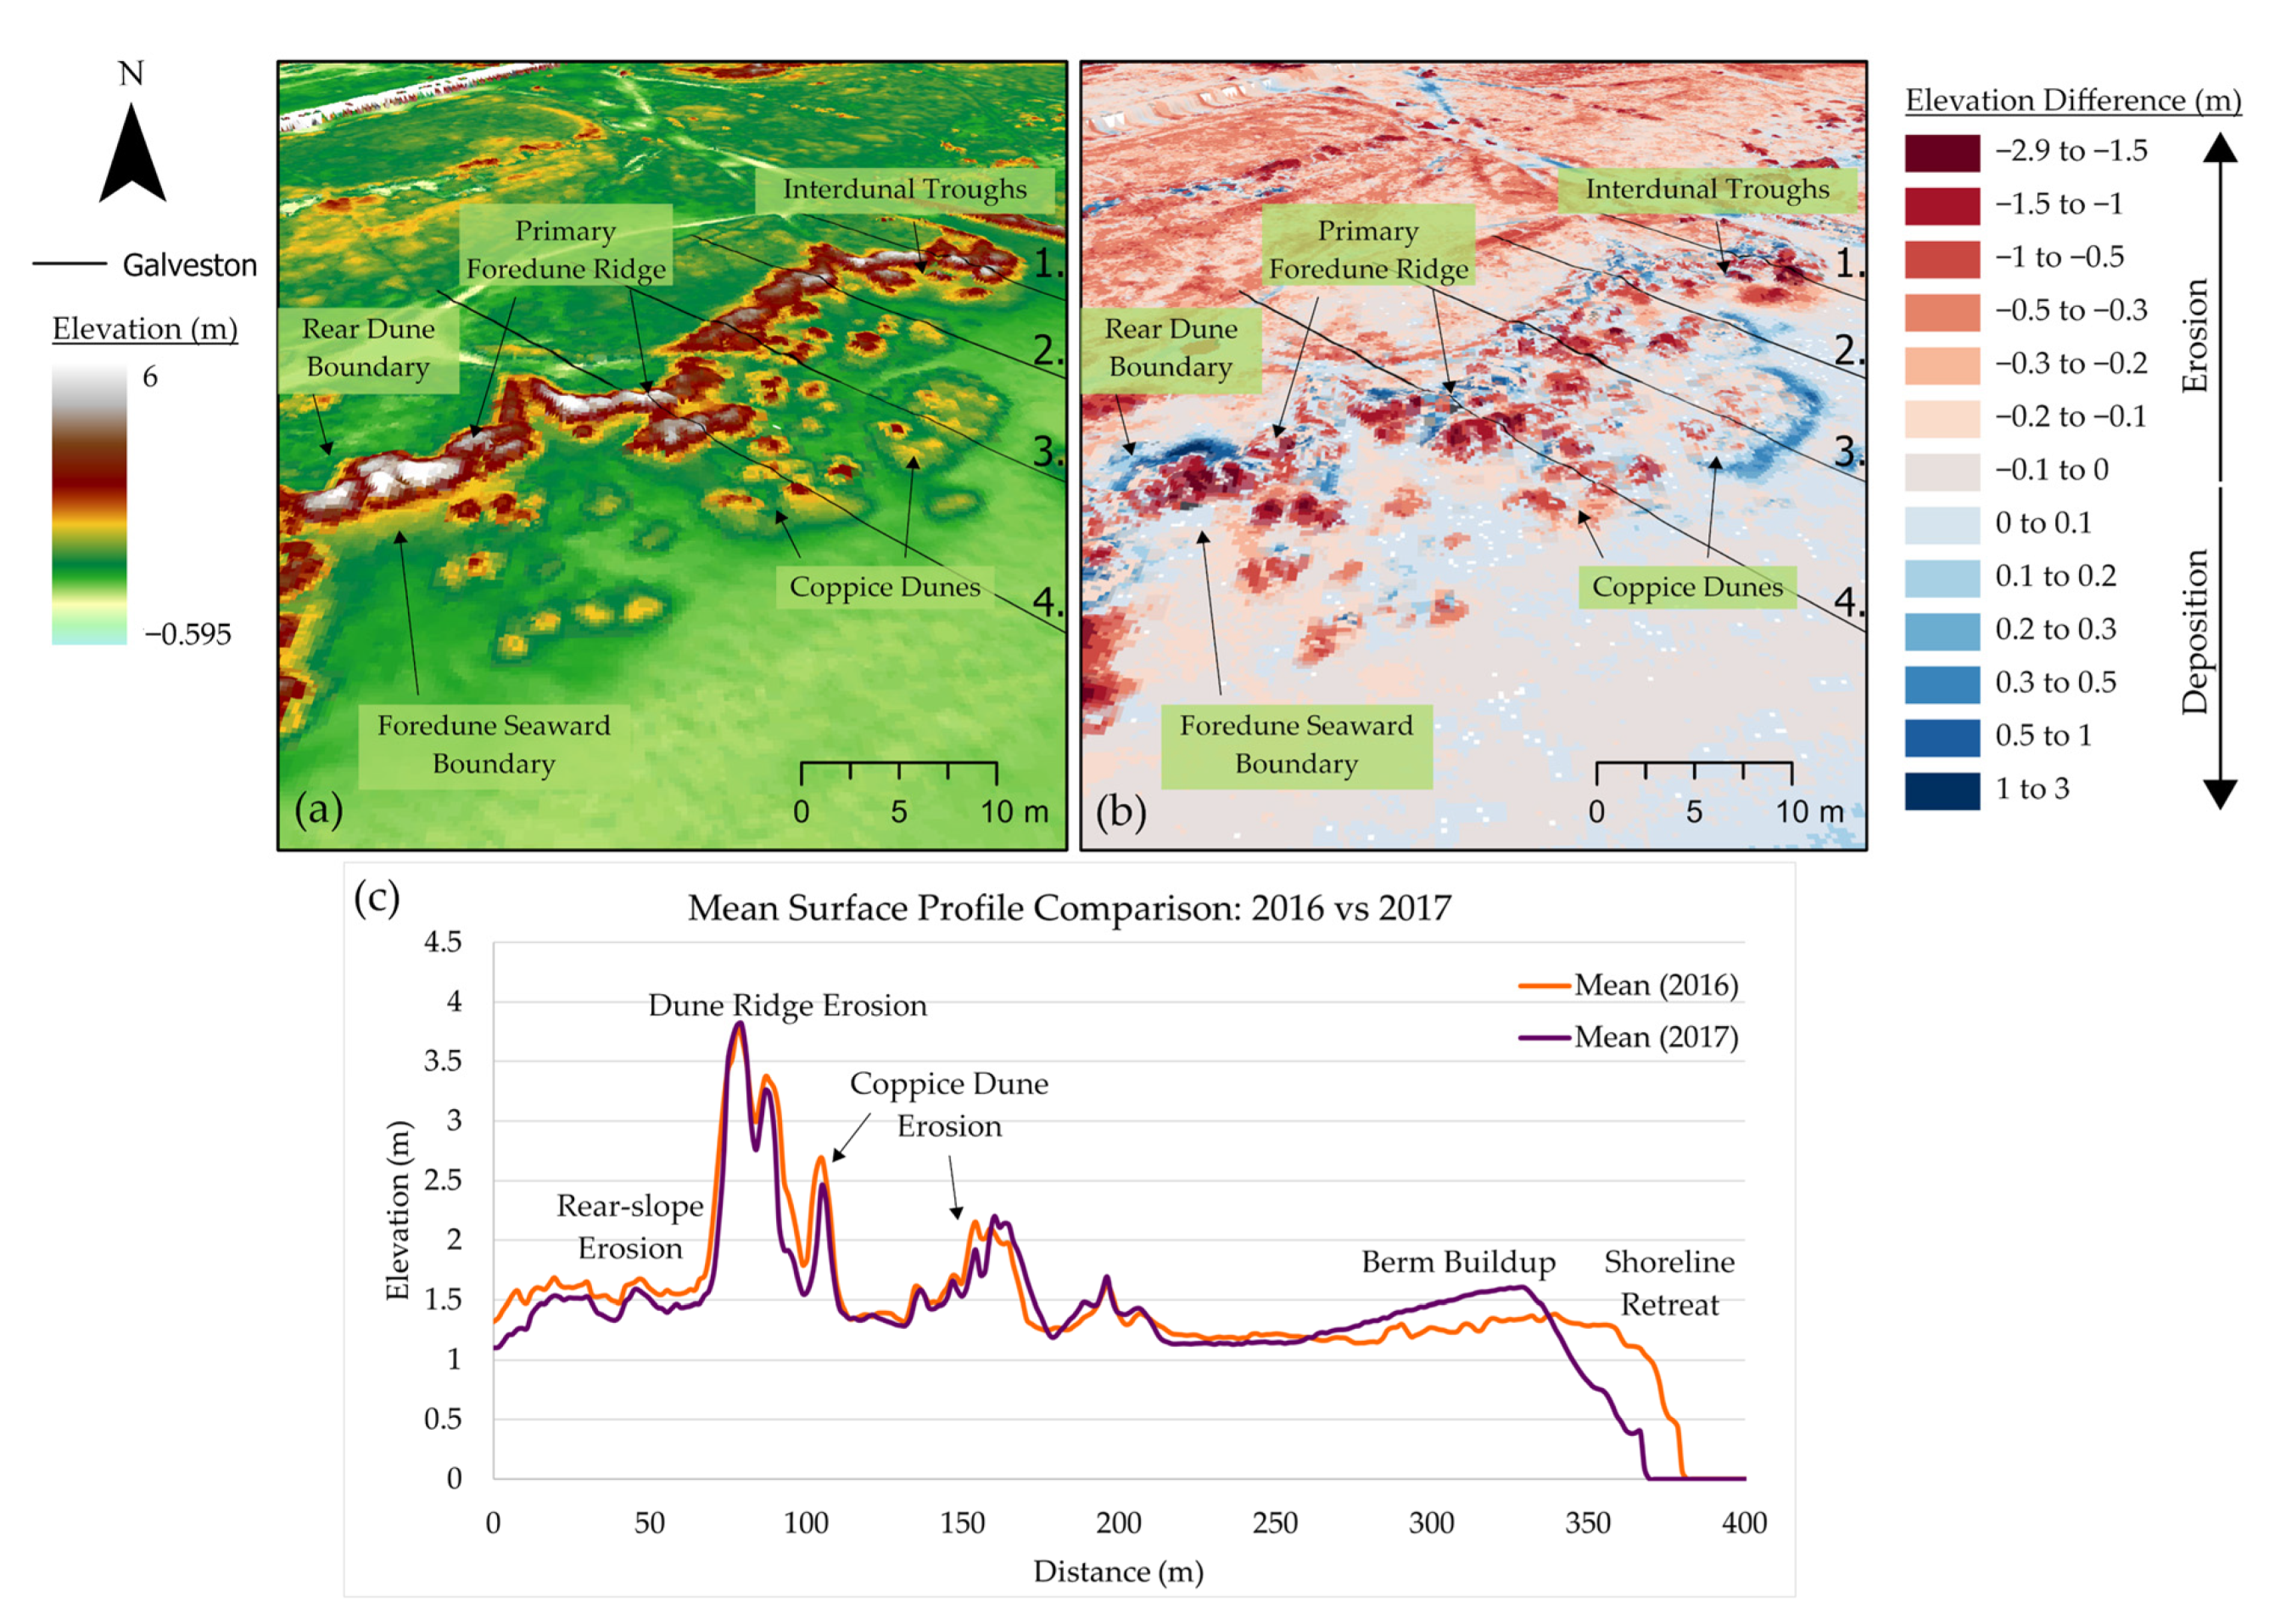
3.2. Local Scale: Instantaneous Post-Harvey Surface Change Analysis (2016–2017)

The instantaneous changes to Galveston and Follett’s Islands due to Harvey can be seen in Figure 8. Follett’s Island experienced shoreline retreat, with scarped shorelines and back beaches. All of Follett’s sites were eroded back to the pre-Harvey coppice dunes boundaries, while coppice dunes decreased in height. Washouts can be seen between evenly spaced dunes along the linear section of Follett’s Island. Washover fans are also visible, with erosion along the throat and sediment deposition behind the foredune features. Overwash fans were not observed along Galveston Island; however, the shoreline and berms were scarped, and berm buildup was seen along the post-Harvey shoreline. Sediment accumulation occurred between interdunal troughs and along the coppice dune boundaries, widening previous dune extents (Figure 8).
Erosion to Follett’s Site 1 foredune rear-slope and ridge height varied with values up to 0.5 m seen in Figure 9b. The pre-storm shoreline, berm, and backbeach in Figure 9a have scraped away between data sets, visualized by a concave profile in Figure 9c. Vegetated hummocky coppice dunes were eroded vertically, and up to 0.7 m of sediment was deposited along the post-storm berm.
Scarped shorelines and backbeach areas were observed along Follett’s Site 2 (Figure 10b) and in the subtle post-storm concave beach profile in Figure 10c.
Pre-Harvey foredunes within Site 2 were ~3 m tall, with a few instances of ~4 m tall (Figure 10a). In some cases, the coppice dunes decreased in elevation from 0.5–1.5 m, while taller primary foredune ridges further inland were eroded by up to 0.5 m. A ~1.5 m elevation increase is observed within a relic blowout linear shore-perpendicular dune at the east end of the survey.
Follett’s Site 3 experienced a scarped shoreline and berm zone, resulting in shoreline retreat with backbeach erosion up to the coppice dune boundary. Berm buildup along the post-storm shoreline of up to 0.8 m coincided with coppice dune boundaries (Figure 11b,c). Pre-Harvey foredunes of 3.5–4 m tall pre-Harvey (Figure 11a) were eroded up to 0.49 m after Harvey. As an example of changes to Site 3, Figure 11c shows erosion along the dune ridges, front and rear foredune toes, and along the berm and shoreline (Figure 11c).
The western end of Galveston Island experienced scarped shorelines, but the flat beach and coppice dunes were unaffected by storm waves (Figure 8 and Figure 12c). Berm buildup near the post-storm shoreline is shown in Figure 8, with an increase in up to 0.5 m in elevation. Various levels of vertical erosion can be seen along coppice dune heights, with sediment depositional values of up to 0.4 m around coppice dune boundaries. Some instances of seaward advance were present among coppice dunes due to rear-slope erosion and sediment accumulation on the seaward boundary, as seen in Figure 12c. There were various degrees of erosion along foredune ridges with sediment deposition between ridges in the interdunal troughs. The Galveston Site shown in Figure 12 displayed more segmented foredune complexes than laterally longer and linearly connected foredune ridges seen in Figure 8. As seen in Figure 12, rear-slope erosion occurred along the foredunes; however, other laterally longer and taller foredunes exhibited rear-slope accretion after Harvey (Figure 8).

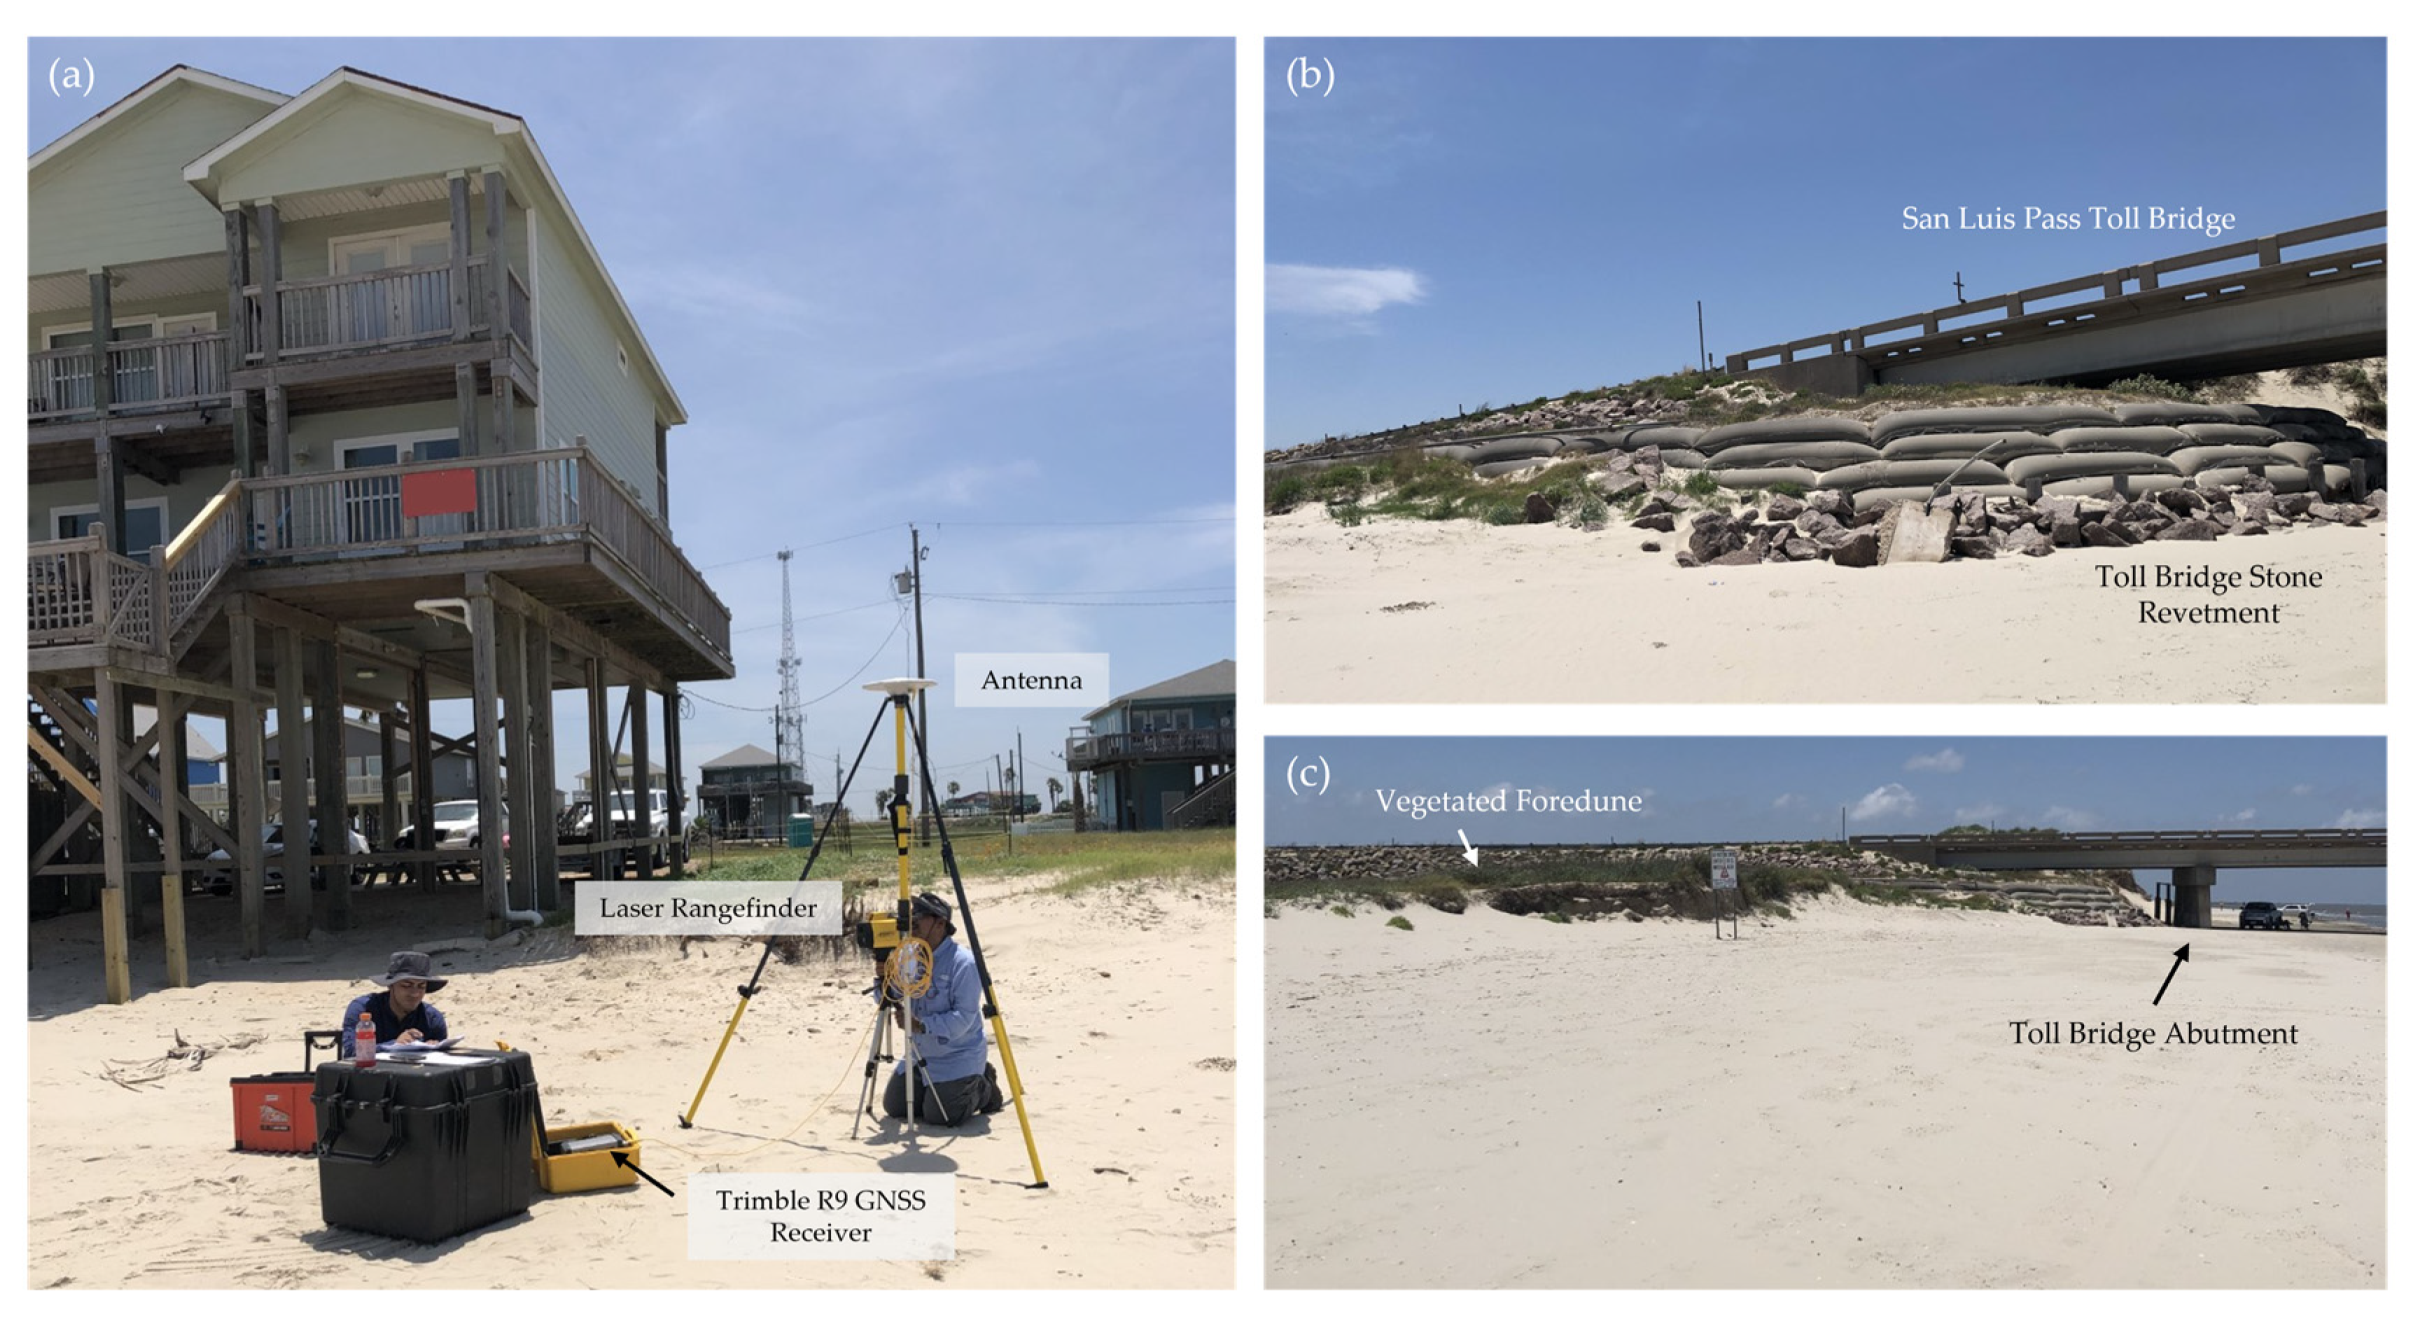
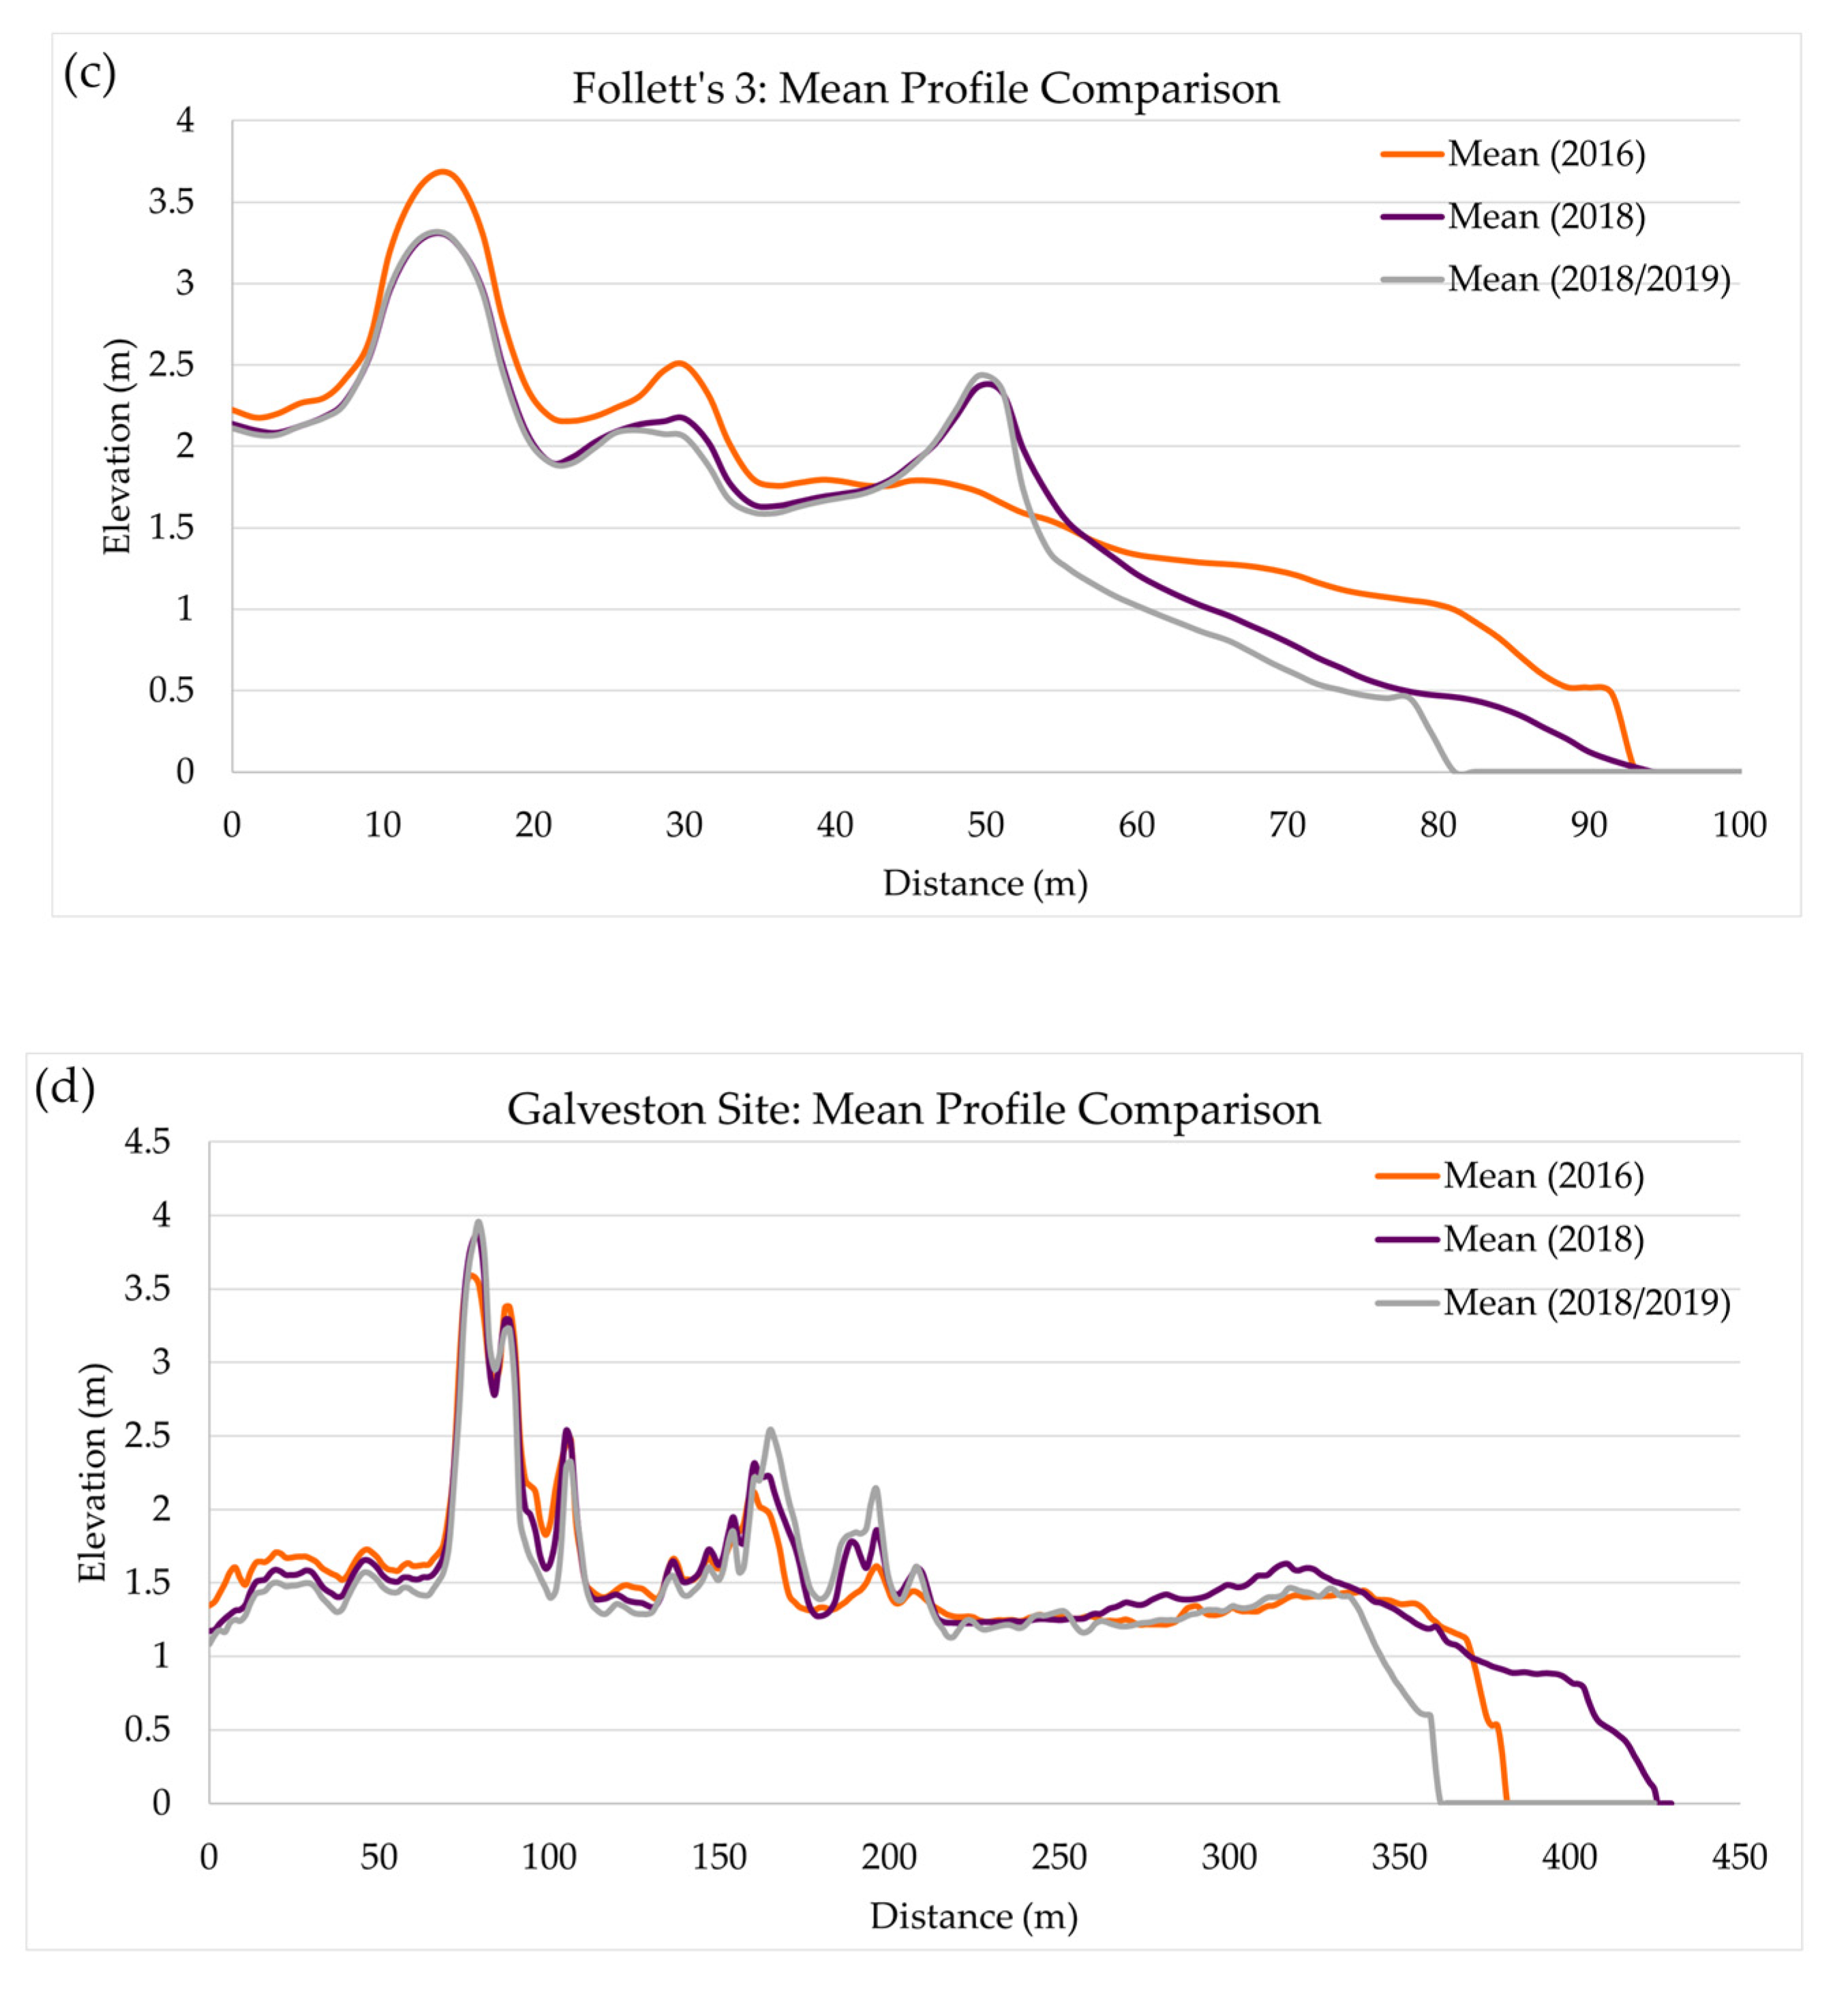
3.3. Multiyear Approach to Tracking Recovery in San Luis Pass
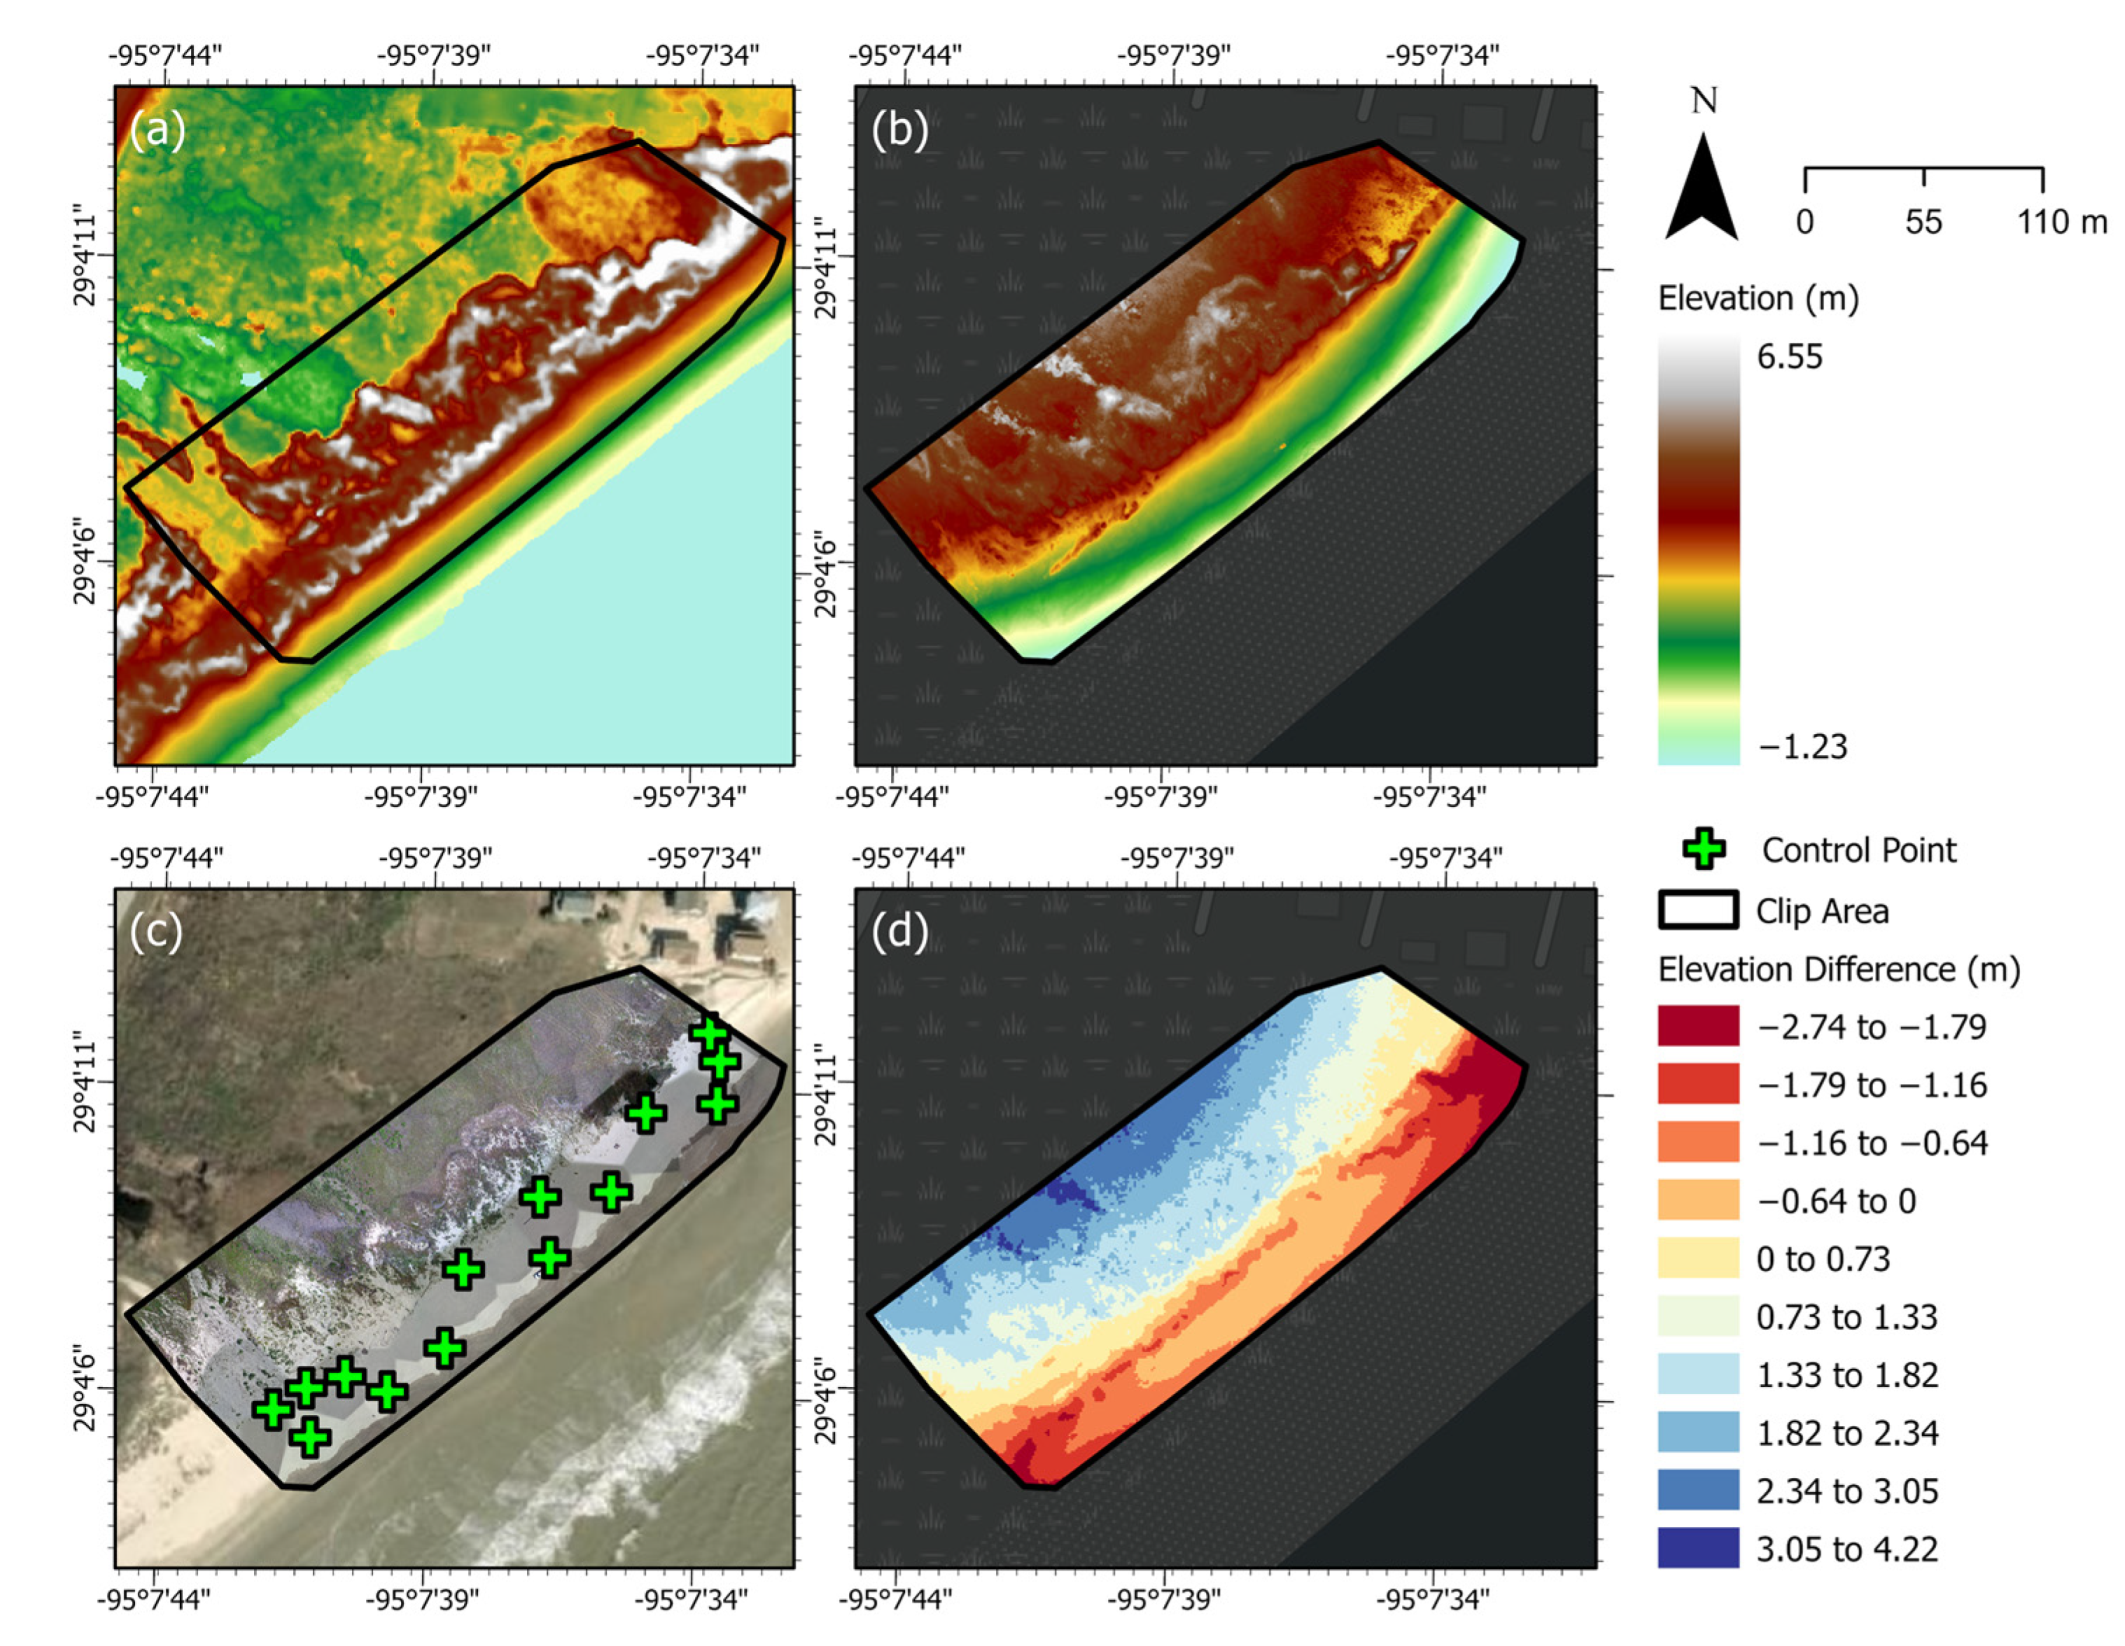
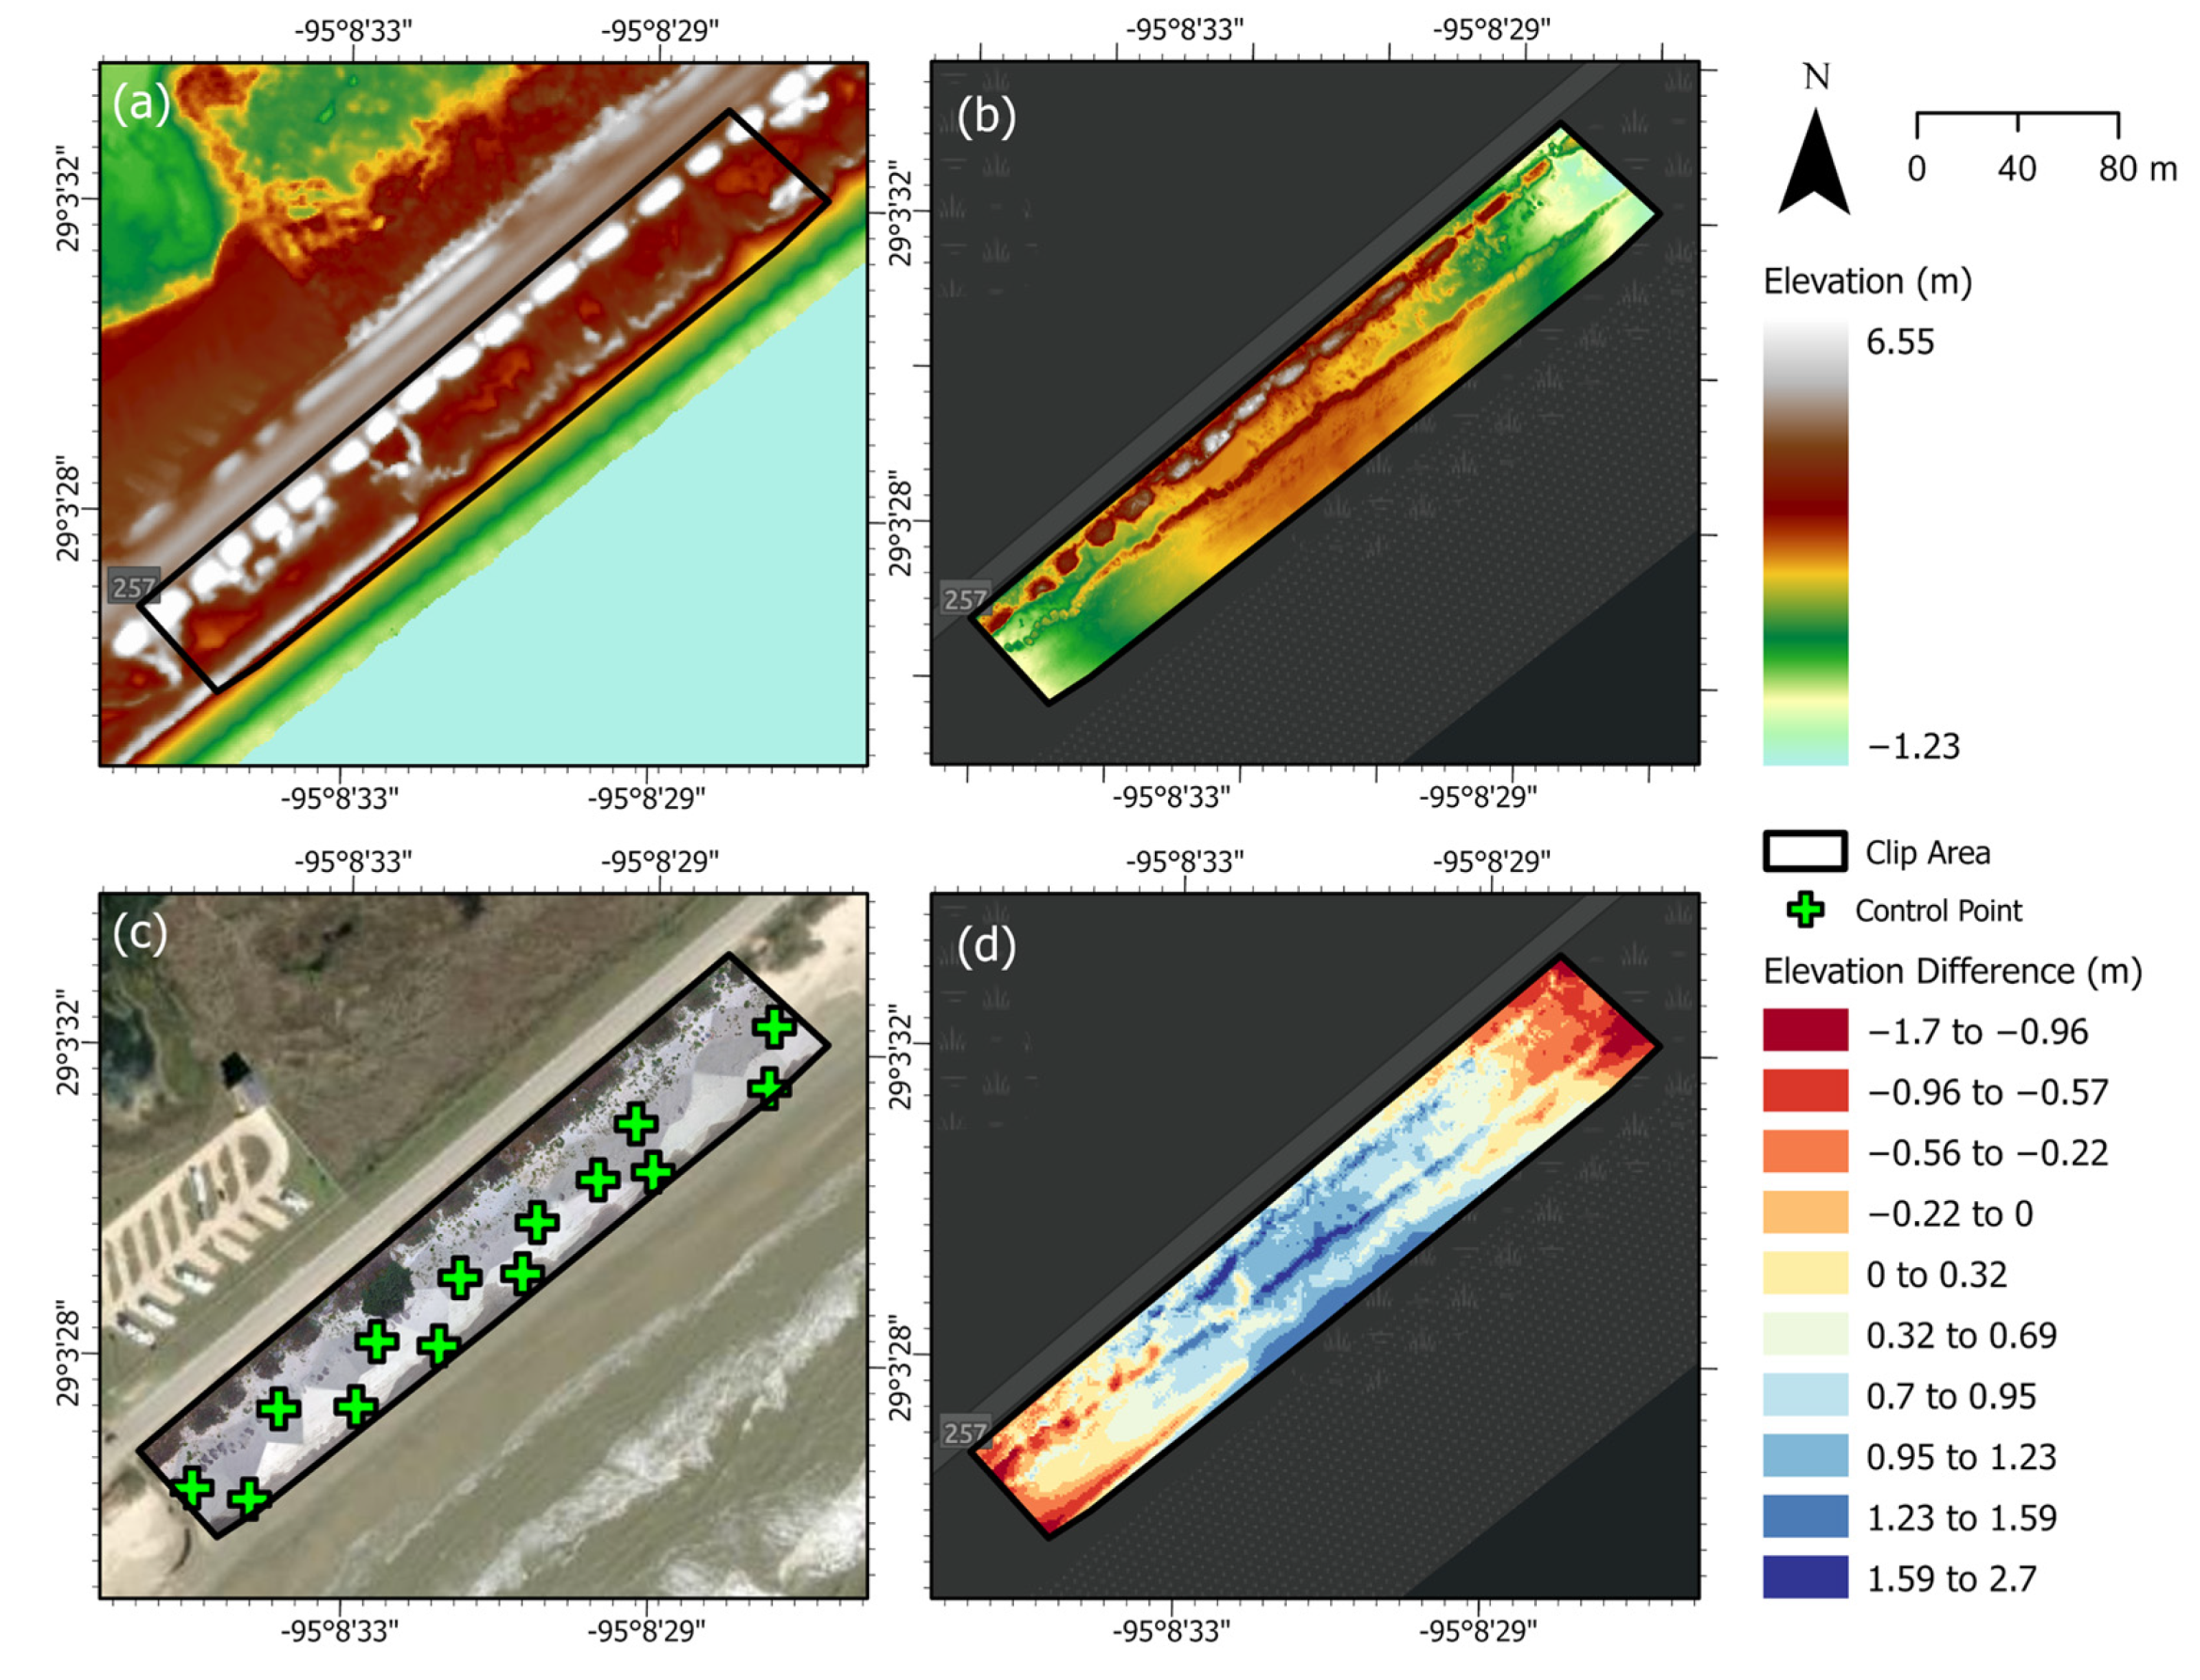
The post-Harvey change study was conducted using DEMs generated from the Geoid18 model. The 2018/2019 topographic dataset, collected between October 2018 and March 2019, was used to analyze the dynamics of the area after March 2018.
Shoreline and backbeach erosion were observed along Follet’s Site 1 in Figure 13a, with berm buildup of up to 0.6 m occurring between October 2016 and March 2018. Values of up to 0.3 m of erosion occurred among the foredune ridge within Site 1. Shoreline advance occurred along the stone revetment backing residential areas south of Follett’s Site 1 (Figure 13a). Shoreline retreat due to scarped shorelines and coppice dunes were observed along Follett’s Site 2. Additionally, ~0.4 m of sediment deposition along the foredunes was observed around Follett’s Site 2 in Figure 13a. The berm buildup displayed values of up to ~0.6 m along the coppice dune boundary in Follett’s Site 3 (Figure 13a). The throats of washover fans between Follett’s Site 2 and 3 were not as prominent in March of 2018 (Figure 13a) as in October 2017 (Figure 8), but deposition was still observed landward of the foredune boundary (Figure 13a). Shoreline retreat was observed along the southwestern toe of Galveston Island, with areas of shoreline advance on both sides of the erosional feature seen in Figure 13a. Berm buildup of up to ~0.4 m was observed by March 2018. Deposition around seaward coppice dune boundaries was up to ~0.4 m, while laterally longer foredunes experienced up to 1 m of rear-slope accretion.
Between March 2018 and March 2019, Follett’s Site 1 experienced backbeach aggradation and shoreline advance. The stone revetment south of Site 1 experienced significant erosion, shown in Figure 13b. Increases in elevation among the shoreline and backbeach of Follett’s Site 2 are represented as a large light blue zone in Figure 13b. Increases of up to 0.5 m were observed among the foredune complexes of Site 2 (Figure 13b).
By March 2019, Follett’s Site 3 exhibited varying levels of shoreline retreat, with erosion to the seaward coppice dune boundary. Vertical aggradation of up to 0.1 m was observed along the ridges of coppice and foredunes in Figure 13b. Galveston’s shoreline retreated between March 2018 and March 2019, and localized areas of berm buildup are seen in Figure 13b. There were low levels of overall net erosion along back beach areas (Figure 13b). Coppice dunes experienced vertical aggradation and varying levels of deposition along the seaward base of coppice dunes. Laterally longer foredunes to the west of the Galveston site, seen in Figure 13b, decreased in elevation along the seaward base and ridges as sediment was pushed landward toward the rear foredune boundary.
Follett’s mean profiles extracted from DEMs are presented as an example of morphology over time (2016 to 2019) within select sites within this study (Figure 14). Follett’s sites in Figure 14a,c have smoother mean profiles compared to the jagged Galveston site mean profile (Figure 14d). Follett’s Site 1 in Figure 14a shows vertical erosion along the foredune and coppice dune ridges, along with rear-slope erosion along the foredune landward boundary. Between October 2016 and March 2018, the shoreline was scarped, as shown in a concave profile in Figure 14a; however, berm buildup along the post-storm shoreline was higher than pre-storm conditions (Figure 14a). Backbeach aggradation continued elongating the backbeach extend through March 2019, but elevations remained below pre-storm conditions (Figure 14a).
Between October 2016 and March 2019, Follett’s Site 2 experienced vertical erosion along the foredune ridge, rear and seaward foredune boundaries. Scarped shorelines and backbeach are shown in Figure 14b, while coppice dunes around 2 m increased in height between 2018 and 2019.
Erosion along foredune ridges and coppice dune ridges occurred along Follett’s 3 between October 2016 and March 2018 (Figure 14c). The shoreline was scraped away by storm waves, and berm buildup occurred along the post-storm shoreline. Between March 2018 and March 2019, the foredune and new seaward most coppice dune features appear relatively stable based on Figure 14c. The backbeach and shoreline within Follett’s Site 3 continue to erode into March 2019 (Figure 14c).
Lastly, Figure 14d shows localized shoreline advances between October 2016 and March 2018. The Galveston mean profile shows vertical aggradation along foredune ridges, coppice dune ridges, and along the backbeach by March 2018 (Figure 14d). As of March 2019, the shoreline retreated further than the 2016 position, and backbeach elevations resemble pre-storm 2016 levels (Figure 14d). By March 2019, foredune ridges and some coppice dune heights were higher than pre-storm 2016 heights, while erosion continued to occur along the rear foredune boundary between 2016 and 2019 (Figure 14d).

3.4. UAV Surveys

As of May 2022, the ~3 m tall foredune ridges within Follett’s Site 1 (Figure 15a,d) were shortened by 1–2 m. Additionally, the dune segment decreased from ~150 m across to ~60 m before intersecting with the property, and the foredune width decreased from ~20 m to ~10–15 m (Figure 15a,b). The foredune eroded from the seaward side and shifted backward, pushing sediment behind the ridge (Figure 15d).
May 2022 UAV surveys of Follett’s Site 2 no longer show the shore-parallel linear primary foredune ridge seen in Figure 16a and further erosion of the foredune boundary inland by up to 0.63 m. UAV DEMs also show increases in elevation, or sediment accumulation, occurring behind the post-storm foredune boundary filling interdunal troughs higher than 2019 levels (Figure 16b,d).
As of March 2019, the main foredune features along Site 3 were ~10 m wide (Figure 17a), while 2022 foredunes are about 8 m wide. Additionally, there were instances of increasing foredune heights seen in blue (Figure 17d). The May 2022 UAV elevation data (Figure 17b) included the wet/dry shoreline boundary along the southeastern polygon boundary. In comparison to the 2019 shoreline seen in Figure 17a, shoreline retreat was observed between March 2019 and 2022, where the shoreline was cut back to the seaward most coppice dunes. The initial berm build-up along the coppice dune boundary that appeared after Harvey has been eroded by 2022 (Figure 17d). Additionally, the seaward most coppice dunes seen in Figure 17a have been eroded or moved further inland, as there was a new coppice dune ridge formed in the 2022 imagery (Figure 17b) not previously seen in the 2019 imagery; seen as accretion (blue) in Figure 17d.
The primary foredunes at the Galveston Site run parallel to the shore and have longer segments than Follett’s sites, around 3 to 5 m tall in 2019, with shore-perpendicular widths of 20 to 30 m (Figure 18a). The 2022 UAV surveys (Figure 18b) show the foredune shore- perpendicular widths to be around 5 to 10 m, as sediment was eroded along the rear foredune slope. The dunes within this survey appear to have migrated slightly toward the shore at levels of around 2 m of sediment accumulated along the seaward foredune slope while the landward boundary eroded (Figure 18d). Various levels of deposition occurred around the lightly vegetated coppice dunes seen in Figure 18d, where sediment was trapped around the base of the dune boundaries widening the coverage area and increasing the heights.

4. Discussion

4.1. General Effects of Harvey on the Coast

The regional analysis completed in this study evaluated changes along the upper Texas coast due to Hurricane Harvey, the extent shown in the dotted line in Figure 1b. By comparing DEMs from October 2016 and March 2018, Harvey’s impact relative to landfall was examined, and areas of significant change were detected. Our regional study (2016 to 2018) found erosion to the shorelines, backbeach, dune heights, and along the relic dunes of Matagorda Peninsula. As of March 2018, there was evidence of recovery along Matagorda in long stretches of deposition along the seaward foredune slope and boundaries. Washout and overwash fans were present along Matagorda Peninsula, between Sargent and Freeport, and Follett’s Island. Between 2016 and 2018, artificial shoreline stabilization structures such as jetties, groins, and stone revetments showed to mitigate erosion and assist in the accumulation of sediment in the direction of longshore drift.
Subsections of Galveston and Follett’s Island surrounding San Luis Pass were chosen for an immediate change study. The immediate change to San Luis Pass between October 2016 and October 2017 displayed significant scarping of shorelines, backbeach, and coppice dunes along sections of Follett’s Island, likely due to narrow beaches and a lower sediment budget compared to the western end of Galveston Island. The elevation of foredune ridges along Follett’s Island is generally around 3–4 m, whereas Harvey’s storm inundation level was up to 1.21 m above ground level for upper Texas coastal regions. Despite the distance from Harvey’s landfall, Follett’s Island was still susceptible to shoreline and dune scarping, overwash, and dune washout. Additionally, the immediate change study (2016–2017) showed the immediate return of sand to forebeach and berms to reestablish pre-storm equilibrium conditions. This influx of sediment immediately after the storm, combined with calm winter wave action, eroded the forebeach and carried sediment further inland for deposition along the back beach by March 2018. Follett’s Site 2 lacked evidence of beach recovery by October 2017, likely due to a large overwash fan that shifted sediment away from the beach-dune system into residential areas.
A similar study that evaluated the recovery of a 14km stretch of the Padre Island National Seashore (PAIS) after Harvey determined that areas frequently altered by public vehicles exhibited greater levels of erosion and slower recovery times compared to sections where driving was prohibited [37]. Therefore, the frequency of vehicles on Follett’s beach could be a contributing factor in the limited recovery of the island. As the backbeach is scarped after a major storm, the beach width narrows and as high tide occurs, drivers are forced to drive along foredune complexes and remove any variation along the beach, in which deposition would occur. This would be of particular concern near Follett’s Site 2, whereas Follett’s Site 3 has large piles of wooden chips visible, and drivers are likely to avoid driving over these features.
The Galveston Island Site was affected the least by Harvey. This location is popular with tourists, although swimming is not allowed due to dangerously high currents and steep drop-offs, and vehicles frequently become stuck in the loose hummocky sand. Therefore, the southwestern end of the island likely experiences fewer public vehicles compared to Follett’s Island. Additionally, the Galveston Site has broader backbeach extents and wide coppice dune fields, which provide additional time to attenuate storm waves reducing erosion. Galveston Island also has a larger supply of sediment compared to Follett’s Island, likely contributing to foredune stability and the seaward advance of coppice dunes immediately after Harvey.

4.2. Multiyear Impact and Recovery

The multiyear analysis (2016–2019) completed in this study determined varying levels of recovery for all four sites by 2018. As of March 2019, 3 of the four sites experienced increases in backbeach elevations since March 2018, apart from Follett’s 3, which continued to erode likely due to the seaward most dune-like feature blocking the transport of sediment toward the back foredunes. Increases in vegetation density post-Harvey likely aided in the stabilization of foredunes by trapping windblown sediment. All Follett’s sites experience very little vertical aggradation between March 2018 and March 2019. The western end of Galveston Island possessed differing recovery trends within segmented foredunes and laterally long connected ridges. By March 2019, the Galveston site, segmented foredune complex, showed foredune and some coppice dune heights higher than pre-Harvey conditions; with shoreline retreat greater than pre-storm conditions, possibly due to the advance of coppice dunes, and hummocky loose sand dunes, toward the shore where windblown sand could collect. West of the Galveston site exhibit differing erosional and depositional trends, emphasizing the factors that drive beach recovery, such as the location along the coastline (relative to longshore drift), the curvature of the shoreline, the orientation to dominant wind and wave action, backbeach width, vegetation density, and sediment supply.

4.3. Future Monitoring

The immediate change (2016–2017) of San Luis Pass due to Harvey provided additional information regarding sediment distribution during the initial stages of recovery, otherwise missed in the 2016–2018 change analysis. The collection of 2022 elevation data using a UAV in San Luis Pass to examine present-day conditions proved successful within sites around 100 to 300 m across. However, historical hurricane records show that San Luis Pass was affected by at least one storm event between 2018 and 2020. Therefore, the current morphology (2022) could reflect changes due to inundation levels of around 1–2 m above ground level from Hurricane Nicholas in late 2021. With the increasing frequency of tropical storms and hurricanes, there is a need for more frequent elevation data sets. High spatial- and temporal-resolution data could assist in understanding the dynamics that shape coastal beach and dune systems following major storm events, as well as develop algorithms to predict storm damage or detect overwash fans or scarped dunes and shorelines.

5. Conclusions

This study evaluated changes to beach-dune systems surrounding San Luis Pass with data sets within months of each other; 2017 (August–October), 2018 (January–March), and 2018/2019 (October 2018–March 2019). Evidence of Harvey’s impact included shoreline retreat, decreases in foredune elevations, decrease in coppice dune heights, and development of multiple overwash fans of considerable size. The multiyear analysis determined that all sites experienced recovery by 2018; however, sites exhibit differing recovery patterns despite their proximity.
This study recommends quarterly UAV surveys of select beach-dune locations. In years with a below-normal number of storm events, this data would provide insight into sediment transport processes during recovery periods. Conversely, hurricane-rich periods would provide a storm’s immediate erosional impact. Additionally, frequent monitoring of current erosional mitigation strategies could determine the efficiency of each method, contributing to perfecting coastal beach conservation strategies.

Author Contributions

S.S.R. (conceptualization, methodology, formal analysis, writing—original draft, visualization, writing—review & editing); S.D.K. (supervision, conceptualization, methodology, writing—review & editing); A.S. (conceptualization, methodology, writing—review & editing). All authors have read and agreed to the published version of the manuscript.

Funding

This project was funded by Grants to Enhance and Advance Research (GEAR), award from the University of Houston.

Acknowledgments

We would like to thank Julia Wellner for reading the draft and providing useful suggestions for improving the quality of this manuscript. We would like to thank Muhammad Qasim for assisting with collecting data in the field. We would like to thank Jeffrey Paine and Tiffany Caudle at the Coastal Studies Center at the University of Texas at Austin for providing the 2017 post-Harvey DEMs used for the immediate change analysis surrounding San Luis Pass. Additionally, we are grateful to Hildingers for allowing us on their property to conduct our UAV surveys.

Conflicts of Interest

The authors declare no conflict of interest.

References

  1. Komar, P.D. Beach Processes and Sedimentation, 2nd ed.; Prentice Hall: Hoboken, NJ, USA, 1998. [Google Scholar]
  2. Pethick, J. An Introduction to Coastal Geomorphology; Edward Arnold Ltd.: London, UK, 1984. [Google Scholar]
  3. Gibeaut, J.C.; Caudle, T.L. Defining and Mapping Foredunes, the Line of Vegetation, and Shorelines along the Texas Gulf Coast; Harte Research Institute for Gulf of Mexico Studies at TAMU-CC: Corpus Christ, TX, USA, 2009. [Google Scholar]
  4. Paine, J.G.; Caudle, T.L.; Andrews, J.R. Shoreline and Sand Storage Dynamics from Annual Airborne LIDAR Surveys, Texas Gulf Coast. J. Coast Res. 2017, 33, 487–506. [Google Scholar] [CrossRef]
  5. Paine, J.G.; Caudle, T.; Andrews, J.R. Final Report Shoreline Movement and Beach and Dune Volumetrics along the Texas Gulf Coast, 1930s to 2019: Final Report Prepared for the Texas General Land Office: The University of Texas at Austin, Bureau of Economic Geology. 2021. Available online: https://docslib.org/doc/12330322/shoreline-movement-and-beach-and-dune-volumetrics-along-the-texas-gulf-coast-1930s-to-2019-jeffrey-g (accessed on 29 August 2022).
  6. Dong, P.; Xia, J.; Zhong, R.; Zhao, Z.; Tan, S. A New Method for Automated Measurement of Sand Dune Migration Based on Multi-Temporal Lidar-Derived Digital Elevation Models. Remote Sens. 2021, 13, 3084. [Google Scholar] [CrossRef]
  7. le Mauff, B.; Juigner, M.; Ba, A.; Robin, M.; Launeau, P.; Fattal, P. Coastal Monitoring Solutions of the Geomorphological Response of Beach-Dune Systems Using Multi-Temporal LiDAR Datasets (Vendée Coast, France). Geomorphology 2018, 304, 121–140. [Google Scholar] [CrossRef]
  8. Baughman, C.A.; Jones, B.M.; Bodony, K.L.; Mann, D.H.; Larsen, C.F.; Himelstoss, E.; Smith, J. Remotely Sensing the Morphometrics and Dynamics of a Cold Region Dune Field Using Historical Aerial Photography and Airborne LiDAR Data. Remote Sens. 2018, 10, 792. [Google Scholar] [CrossRef] [Green Version]
  9. Morton, A.R. Gulf Shoreline Movement between Sabine Pass and the Brazos River, Texas: 1974 to 1996. Geol. Circ. 1997, 97, 1–46. [Google Scholar] [CrossRef]
  10. NOAA. Hurricane Basics; NOAA: Washington, DC, USA, 1999.
  11. Roth, D. Texas Hurricane History; National Weather Service: Camp Springs, MD, USA, 2010.
  12. NOAA’s Historical Hurricane Tracks. Available online: https://bit.ly/3dnTLW0 (accessed on 9 August 2022).
  13. Blake, E.S.; Zelinsky, D.A. Hurricane Harvey (AL092017); National Hurricane Center: Miami, FL, USA, 2017.
  14. Morton, R.A.; Paine, J.G. Beach and Vegetation-Line Changes at Galveston Island, Texas: Erosion, Deposition, and Recovery from Hurricane Alicia; University of Texas at Austin, Bureau of Economic Geology: Austin, TX, USA, 1985. [Google Scholar]
  15. Morton, R.A.; Leach, M.P.; Paine, J.G.; Cardoza, M.A. Monitoring Beach Changes Using GPS Surveying Techniques. J. Coast. Res. 1993, 9, 702–720. [Google Scholar]
  16. Lin, Y.C.; Cheng, Y.T.; Zhou, T.; Ravi, R.; Hasheminasab, S.M.; Flatt, J.E.; Troy, C.; Habib, A. Evaluation of UAV LiDAR for Mapping Coastal Environments. Remote Sens. 2019, 11, 2893. [Google Scholar] [CrossRef] [Green Version]
  17. Casella, E.; Drechsel, J.; Winter, C.; Benninghoff, M.; Rovere, A. Accuracy of Sand Beach Topography Surveying by Drones and Photogrammetry. Geo-Mar. Lett. 2020, 40, 255–268. [Google Scholar] [CrossRef] [Green Version]
  18. Choi, S.K.; Kim, G.H.; Choi, J.W.; Lee, S.K.; Choi, D.Y.; Jung, S.H.; Chun, S.J. UAV-Based Land Cover Mapping Technique for Monitoring Coastal Sand Dunes. J. Korean Soc. Surv. Geod. Photogramm. Cartogr. 2017, 35, 11–22. [Google Scholar] [CrossRef]
  19. Fabbri, S.; Grottoli, E.; Armaroli, C.; Ciavola, P. Using High-spatial Resolution Uav-derived Data to Evaluate Vegetation and Geomorphological Changes on a Dune Field Involved in a Restoration Endeavour. Remote Sens. 2021, 13, 1987. [Google Scholar] [CrossRef]
  20. Laporte-Fauret, Q.; Marieu, V.; Castelle, B.; Michalet, R.; Bujan, S.; Rosebery, D. Low-Cost UAV for High-Resolution and Large-Scale Coastal Dune Change Monitoring Using Photogrammetry. J. Mar. Sci. Eng. 2019, 7, 63. [Google Scholar] [CrossRef]
  21. Taddia, Y.; Corbau, C.; Zambello, E.; Pellegrinelli, A. UAVs for Structure-from-Motion Coastal Monitoring: A Case Study to Assess the Evolution of Embryo Dunes over a Two-Year Time Frame in the Po River Delta, Italy. Sensors 2019, 19, 1717. [Google Scholar] [CrossRef] [PubMed] [Green Version]
  22. Suo, C.; McGovern, E.; Gilmer, A. UAV Data for Coastal Dune Mapping. In Proceedings of the 10th International Conference on Environmental Engineering, ICEE 2017, Vilnius, Lithuania, 27–28 April 2017; Vilnius Gediminas Technical University Publishing House “Technika”: Vilnius, Lithuania, 2017. [Google Scholar]
  23. Costas, S.; de Sousa, L.B.; Kombiadou, K.; Ferreira, Ó.; Plomaritis, T.A. Exploring Foredune Growth Capacity in a Coarse Sandy Beach. Geomorphology 2020, 371, 107435. [Google Scholar] [CrossRef]
  24. Pagán, J.I.; Bañón, L.; López, I.; Bañón, C.; Aragonés, L. Monitoring the Dune-Beach System of Guardamar Del Segura (Spain) Using UAV, SfM and GIS Techniques. Sci. Total Environ. 2019, 687, 1034–1045. [Google Scholar] [CrossRef] [PubMed]
  25. Mancini, F.; Dubbini, M.; Gattelli, M.; Stecchi, F.; Fabbri, S.; Gabbianelli, G. Using Unmanned Aerial Vehicles (UAV) for High-Resolution Reconstruction of Topography: The Structure from Motion Approach on Coastal Environments. Remote Sens. 2013, 5, 6880–6898. [Google Scholar] [CrossRef] [Green Version]
  26. Lankford, R.R.; Rogers, J.J. The Galveston Bay Complex: A Summary of Characteristics; Datapages, Inc.: Tulsa, OK, USA, 1969. [Google Scholar]
  27. Ramon-Duenas, C.; Wellner, J.S.; Munoz, Y.P. Sediment Transport and Deposition in Flood-Tidal Deltas: Insight from the Texas Coast. Sediment. Geol. 2021, 416, 105826. [Google Scholar] [CrossRef]
  28. Paine, J.G.; Caudle, T. Final Report Shoreline Movement along the Texas Gulf Coast, 1930s to 2019: Final Report Prepared for the Texas General Land Office: The University of Texas at Austin, Bureau of Economic Geology. 2020. Available online: https://docslib.org/doc/13604187/shoreline-movement-along-the-texas-gulf-coast-1930s-to-2019-jeffrey-g (accessed on 29 August 2022).
  29. Treasure Island MUD Shoreline Protection. Available online: https://www.glo.texas.gov/coastal-grants/projects/1626-treasure-island-mud-shoreline-protection.html (accessed on 1 August 2022).
  30. CR 257 Dune Restoration. Available online: https://www.glo.texas.gov/coastal-grants/projects/1529-ciap-2009-cr257-dune-restoration.html (accessed on 1 August 2022).
  31. UGet—Download Manager. Available online: https://sourceforge.net/projects/urlget/ (accessed on 10 July 2022).
  32. LAStools—LASzip. Available online: https://lastools.github.io/ (accessed on 10 July 2022).
  33. ArcGIS Pro 2022; Version 3.0.1; Esri Inc.: Redlands, CA, USA.
  34. SwathProfiler (ArcGIS 10.1+). Available online: https://github.com/geolovic/SwathProfiler_ArcGIS (accessed on 10 July 2022).
  35. Pérez-Peña, J.v.; Al-Awabdeh, M.; Azañón, J.M.; Galve, J.P.; Booth-Rea, G.; Notti, D. SwathProfiler and NProfiler: Two New ArcGIS Add-Ins for the Automatic Extraction of Swath and Normalized River Profiles. Comput. Geosci. 2017, 104, 135–150. [Google Scholar] [CrossRef]
  36. Drone2Map 2022; Version 2022.1.0; Esri Inc.: Redlands, CA, USA.
  37. Wernette, P.; Houser, C.; Lehner, J.; Evans, A.; Weymer, B. Investigating the Impact of Hurricane Harvey and Driving on Beach-Dune Morphology. Geomorphology 2020, 358, 107119. [Google Scholar] [CrossRef]
Figure 1. Study area. (a) Hurricane Harvey’s path and landfall in Texas; (b) Harvey path and landfall in relation to unmanned aerial vehicle (UAV) survey sites around San Luis Pass; (c) San Luis Pass with selected sites for UAV surveys showing Follett’s Site 3 within CR257 dune restoration boundaries (J. Paine, personal communication, 17 April 2021) and the stone revetment relevant to the “Treasure Island MUD Shoreline Protection” project.
Remotesensing 14 05357 g001
Figure 2. Survey set-up for Follett’s Site 1 in May of 2022. (a) GPS base station setup with a rangefinder used to collect distances between the base station and the ground control points; (b) San Luis Toll bridge with sandbags and partial stone revetment; (c) Vegetated dune field within the survey site in relation to the toll bridge.
Remotesensing 14 05357 g002
Figure 3. Follett’s Site 2 in May of 2022. (a) The UAV survey site with a flat backbeach followed by vegetated dune fields with no wood or mulch; (b) piles of wood chips at the westward end of the UAV survey; (c) example of a more eroded mulch pile compared to (b).
Remotesensing 14 05357 g003
Figure 4. Follett’s Site 3 in May of 2022. (a) Ground control point 7 between wood chip piles in the foreground with a vegetated dune field in the background. The county road CR257 is visually blocked but sits immediately behind the vegetated foredunes; (b) Ground control point 8 near the water line.
Remotesensing 14 05357 g004
Figure 5. Galveston Site in May of 2022.
Remotesensing 14 05357 g005
Figure 6. Workflow diagram summarizing the key steps taken to process data for the change analysis.
Remotesensing 14 05357 g006
Figure 7. Digital elevation model difference map representing changes between 2016 and 2018. Erosion is represented by yellow, orange, and red. Sediment accretion is represented by green, turquoise, and purple. (a) For the full extent of regional data, refer to Figure 1b for the regional study extent in reference to the state of Texas; (b) Western end of Matagorda Peninsula; (c) Changes around Jetty Park and Matagorda Beach; (d) Overwash fans between Sargent and Freeport; (e) West end of Galveston Island; (f) East end of Galveston Island with seawall, jetty, and groins; (g) Bolivar Peninsula.
Remotesensing 14 05357 g007
Figure 8. Elevation difference map for the full extent of the 2016 and 2017 San Luis Pass. Post-Harvey 2017 data were collected between 31 August and 29 October.
Remotesensing 14 05357 g008
Figure 9. Change analysis for Follett’s Site 1. (a) A 3D model of 2016 USACE’s edited topobathy lidar-derived DEM with 4 shore perpendicular transects used to compare pre- and post- storm beach profiles within Follett’s Site 1; (b) DEM difference map created using USACE’s 2016 and BEG’s 2017 surface elevation data draped over the 2016 elevation model to show changes to the site after Harvey; (c) The 2016 and 2017 mean profiles for transect 2 overlayed for comparison.
Remotesensing 14 05357 g009
Figure 10. 3D models of Follett’s Site 2. (a) A 3D model of 2016 USACE’s edited topobathy lidar-derived DEM with 4 labeled shore perpendicular transects used to compare pre- and post- storm beach profiles within Follett’s Site 2; (b) DEM Difference Map was created using USACE’s 2016 and BEG’s 2017 surface elevation data draped over the 2016 elevation model to show changes to the site after Harvey; (c) The 2016 and 2017 mean profiles for transect 4 overlayed for comparison.
Remotesensing 14 05357 g010
Figure 11. 3D models of Follett’s Site 3. (a) A 3D model of 2016 USACE’s edited topobathy lidar-derived DEM with 4 shore perpendicular transects used to compare pre- and post- storm beach profiles within Follett’s Site 3; (b) DEM Difference Map was created using USACE’s 2016 and BEG’s 2017 surface elevation data draped over the 2016 elevation model to show changes to the site after Harvey; (c) The 2016 and 2017 mean profiles for transect 2 overlayed for comparison.
Remotesensing 14 05357 g011
Figure 12. 3D models of Galveston Site. (a) A 3D model of 2016 USACE’s edited topobathy lidar-derived DEM with 4 shore perpendicular transects used to compare pre- and post- storm beach profiles within the Galveston Site; (b) DEM Difference Map was created using USACE’s 2016 and BEG’s 2017 surface elevation data draped over the 2016 elevation model to show changes to the site after Harvey. (c) The 2016 and 2017 mean profiles for transect 3 overlayed for comparison.
Remotesensing 14 05357 g012
Figure 13. Comparison of elevation difference maps. (a) A difference map generated by comparing 2016 and 2018 bare ground data sets; (b) A difference map was generated by comparing 2018 and 2018/2019 data (Table 1).
Remotesensing 14 05357 g013
Figure 14. Multiyear profile analyses to examine temporal variation from 2016 to 2019. (a) Follett’s Site 1 Profile 2; (b) Follett’s 2 Profile 4; (c) Follett’s Site 3 Profile 2; (d) Galveston Site Profile 3.
Remotesensing 14 05357 g014aRemotesensing 14 05357 g014b
Figure 15. Follett’s Site 1 comparison of 2022 UAV data and 2018/2019 data. Spatial Reference: NAD 1983 UTM Zone 15n. (a) 2018/2019 NOAA’s Post Hurricane Harvey elevation model with survey clipping boundary; (b) May 2022 digital elevation model; (c) May 2022 orthophoto with a World Imagery Maxar base map; (d) Elevation difference map with erosion represented as yellow through red, and deposition represented by blue.
Remotesensing 14 05357 g015
Figure 16. Follett’s Site 2 comparison of 2022 UAV data and 2018/2019 data. Spatial Reference: NAD 1983 UTM Zone 15n. (a) 2018/2019 NOAA’s Post Hurricane Harvey elevation model with survey clipping boundary; (b) May 2022 digital elevation model; (c) May 2022 orthophoto with a World Imagery Maxar base map; (d) Elevation difference map with erosion represented as orange through red, and deposition represented by yellow to blue.
Remotesensing 14 05357 g016
Figure 17. Follett’s Site 3 comparison of 2022 UAV data and 2018/2019 data. Spatial Reference: NAD 1983 UTM Zone 15n. (a) 2018/2019 NOAA’s Post Hurricane Harvey elevation model with survey clipping boundary; (b) May 2022 digital elevation model; (c) May 2022 orthophoto with a World Imagery Maxar base map; (d) The elevation difference map with erosion represented as orange through red, and deposition represented by yellow to blue.
Remotesensing 14 05357 g017
Figure 18. Galveston Site comparison of 2022 UAV data and 2018/2019 data. Spatial Reference: NAD 1983 UTM Zone 15n. (a) 2018/2019 NOAA’s Post Hurricane Harvey elevation model with survey clipping boundary; (b) May 2022 digital elevation model; (c) May 2022 orthophoto with a World Imagery Maxar base map; (d) The elevation difference map with erosion represented as light green through red, and deposition represented by shades of blue.
Remotesensing 14 05357 g018
Table 1. Elevation data sets used in the post-storm change analysis and monitoring of beach-dune profiles in succeeding years.
DateYearData SetAgencyRes. (m)H. Acc.
(cm)
V. Acc.
(cm)
23 July–10 October2016Topobathy Lidar: Gulf Coast (AL, FL, MS, TX)USACE/NCMP0.3510010
31 August–29 October2017Post-Hurricane Harvey Topographic Lidar
DEMs of the Texas Gulf of Mexico
Shoreline: UTM Zone 15, Sabine Pass to Colorado River
BEG11–51–10
13 January–13 March2018Lidar DEM: Coastal TexasTWDB11004.8
27 October–6 March2018/2019Topobathy Lidar Post Hurricane Harvey:
Galveston to Corpus Christi, TX
NOAA NGS0.401007.1
Res.—Spatial Resolution; H. Acc.—Horizontal Accuracy; V. Acc.—Vertical Accuracy; AL—Alabama; FL—Florida; MS—Mississippi; TX—Texas; USACE—United States Army Corps of Engineers; NCMP—National Coastal Mapping Program; BEG—Bureau of Economic Geology; TWDB—Texas Water Development Board; NOAA—National Oceanic and Atmospheric Administration; NGS—National Geodetic Survey.
Table 2. UAV survey details for 5 pre-programmed missions completed on Galveston and Follett’s Islands on 18 May of 2022.
SiteEst. Flight Time (min)Est. Area
(m2)
Num. of PhotosGround Sampling Distance (cm/pixel)Flight
Altitude (m)
Alongshore
Length (m)
Follett’s 12171382411.0445~100
Follett’s 22118,0603291.3960~300
Follett’s 31690081561.3960~300
Galveston4130,3014581.3960~320
Publisher’s Note: MDPI stays neutral with regard to jurisdictional claims in published maps and institutional affiliations.

