Article

Analysis of the Influence of Deforestation on the Microphysical Parameters of Clouds in the Amazon

by
Helder José Farias da Silva
1,2,*,
Weber Andrade Gonçalves
3,
Bergson Guedes Bezerra
3,
Cláudio Moisés Santos e Silva
3,
Cristiano Prestrelo de Oliveira
3 and
Pedro Rodrigues Mutti
3
1
Post-Doctoral-Climate Sciences Post-Graduate Program, Department of Climate and Atmospheric Sciences, Federal University of Rio Grande do Norte, Natal 59078-970, Brazil
2
Substitute Teacher-Technology Center, Federal University of Alagoas, Maceió 57072-900, Brazil
3
Adjunct Teacher-Department of Atmospheric and Climate Sciences, Federal University of Rio Grande do Norte, Natal 59078-970, Brazil
*
Author to whom correspondence should be addressed.
Remote Sens. 2022, 14(21), 5353; https://doi.org/10.3390/rs14215353
Submission received: 2 August 2022 / Revised: 14 October 2022 / Accepted: 14 October 2022 / Published: 26 October 2022
(This article belongs to the Section Forest Remote Sensing)

Abstract

:
Studies have shown that deforestation can cause changes in energy, moisture, and precipitation flows, with implications for local and regional climate. These studies generally focus on understanding how the hydrological cycle is impacted by deforestation, but few studies have investigated these impacts on cloud microphysics in tropical forest regions. The objective of this study was to quantitatively evaluate the impacts of deforestation on the microphysical parameters of clouds, based on data extracted from active and passive orbital sensors from the TRMM satellite. The study area comprised the state of Rondônia, Brazil. The analyses of the microphysical parameters extracted from the Microwave Imager (TMI) and Precipitation Radar (PR) sensors of the 2A-CLIM and 2A25 products were performed considering a period of 14 years. The parameters analyzed were Rain Water Path (RWP), Ice Water Path (IWP), Surface Precipitation (SP), Freezing Level Height (FH), and Rainfall Type (RT). Land cover type data were extracted from the Project to Monitor Deforestation in the Legal Amazon (PMDA). Our results showed that local deforestation significantly altered the microphysical parameters of the study region. In general, the values of the microphysical parameters of the clouds in the transition areas (locations where forest pixels are neighbors to deforested pixels) were about 5–25% higher compared to forested and deforested areas associated with a higher frequency of episodes of convective rainfall possibly driven by mesoscale circulations. Correspondingly, forested areas had higher rainfall rates compared to deforested areas. Meanwhile, deforested areas had higher amounts for IWP, of around 1–16%, and FH, of around 2–8%, in relation to forested areas. Conversely, the RWP showed a decrease of around 2–20%. These results suggest that the microphysical structure of clouds has different characteristics when related to forested and deforested areas in the Amazon. This is useful for evaluation of simulations of cloud microphysical parameters in numerical models of weather and climate.

1. Introduction

The Amazon Rainforest has highly heterogeneous hydroclimatology and is strongly associated with its surrounding atmospheric and hydrological cycle [1]. Covering more than 6 million km2, it represents approximately 50% of the world’s tropical forest area [2,3], with the greatest biodiversity per area of all tropical forests in the world [4]. The average annual rainfall in the Amazon Basin is around 2300 mm year−1 [5,6], with marked spatial variability. Thus, it is possible to identify up to six regions with well-defined rainfall regimes that are associated with the local conditions of the region and the performance of the main meteorological systems that generate rain. Further details on the six rainfall regimes found in the Amazon are described by [7]. In addition, the Amazon River has an average discharge of 194,100 m3 s−1 year−1 into the tropical Atlantic Ocean, which is equivalent to one-fifth of the world’s freshwater reserves [8].
Changes in the vegetation cover of tropical forests, which occur mainly through the conversion of forest to pasture or cropland, can lead to changes in the thermodynamic characteristics of the lower atmosphere, influencing the regional and global climate [5,9,10,11,12,13]. Studies have been carried out to assess the impacts of deforestation in the Amazon on the climate from the perspective of regional and global climate models [9,14,15,16,17,18]. At the same time, these interactions have been investigated through comprehensive observational studies, such as “Anglo-Brazilian Climate Observations in the Amazon” (ABRACOS) [19], “Large scale Biosphere-Atmosphere experiment in Amazonia” (LBA) [20], “Amazonian Aerosol Characterization Experiment” (AMAZE-08) [21], “South American Biomass Burning Analysis” (Sambba) [22], and “Observations and Modeling of the Green Ocean Amazon Experiment” (GoAmazon 2014/5) [23]. These studies, in general, have shown that anthropogenic processes can produce visible impacts on the energy balance of the Earth’s surface, including the hydrological and biogeochemical cycle, modifying the physical properties of the Earth’s surface.
Regarding the analysis of the direct influence of deforestation on the intensity of precipitation in the Amazon, the study by [24] presented a binomial probability distribution with data from orbital radar and ground surface coverage from the MODIS sensor to investigate the way that rainfall frequency changes as a function of distance to the forest edge. They showed that rain is more frequent in forested areas than in deforested areas. In addition, the authors observed that the transition area between forest and deforestation presented higher occurrence of precipitation, indicating a mechanism of mesoscale circulation between forested and deforested patches. However, these analyses were restricted to elucidating the precipitation component, which has been the subject of several previous reviews. For example, ref. [25], showed that southeastern Rondônia, Brazil, is 25% drier in the less rainy season. Refs. [18,26] show that reductions in rainfall are directly proportional to the extent of deforestation. In contrast, other studies show increased rainfall in deforested areas adjacent to the forest due to mesoscale circulations [27,28,29]. Despite these studies addressing the effects of deforestation on various aspects of rainfall, there are no observational studies that demonstrate the influence of deforestation on the microphysical properties of clouds through comparative analysis.
Once an area of native forest is removed, there is an imbalance in the supply of energy, mass, and moisture flows to the atmosphere [30]. These impacts can be manifested through sudden changes in albedo, which affect evaporation and transpiration, as well as the partitioning of sensible, latent, and soil heat fluxes [30,31]. Analyses with satellite data, field measurements, and numerical models have shown that extensive deforestation in the last three decades in the state of Rondônia in southern Amazonia has altered the mechanism of precipitation, which has shifted from thermal conduction to being dynamically driven [25], in addition to a significant reduction in dry-season evapotranspiration [32].
The Amazon Rainforest, particularly during the dry season, has one of the highest concentrations of aerosol particles in the tropics [33]. These particles emitted by vegetation, and mainly by seasonal biomass burning, are linked to cloud microphysics and rain production processes, which can modify the interactions at the biosphere–atmosphere interface and produce significant effects on the net exchange of CO2, the climate, and human health [23]. Changes in concentrations and type of aerosols imply the formation of cloud drops with implications for the type of precipitation, affecting the life cycle of clouds and the rainfall regime of a region [34,35,36,37,38,39]. In general, a more polluted atmosphere tends to produce more intense precipitation events, with stronger wind gusts and more frequent electrical discharges [27,30,40,41,42,43,44,45].
These more intense rainfall events observed in deforested regions are generally associated with differences in heat fluxes over forested and deforested areas. As turbulence predominates over deforested areas associated with a higher flow of sensible heat, the formation of mesoscale circulations, also called deforestation breezes [46], occurs, as indicated by a series of studies of different types of vegetation [24,47,48,49]. These studies suggest that the length scale required for the development of these circulations is approximately between 10 and 100 km, although at low latitudes this spatial scale may be smaller [50].
The study of cloud microphysics is based on the analysis of the particles (liquid or solid-ice crystals) that make up the cloud, that is, physical processes within the cloud [51]. Remote sensing products, via data collected by sensors onboard satellites, provide good spatial coverage and are able to describe finer-scale physical and microphysical processes [1]. With the increasing advances in the estimation of environmental variables through remote sensing, the detection of this association is more easily achieved in comparison with macro- and mesoscale numerical models. While in situ measurements can provide direct and accurate high-resolution local data, satellites provide broader spatial and temporal coverage, allowing refined statistical analysis [52].
In this context, in 1997, the Tropical Rainfall Measurement Mission (TRMM) was launched with the objective of estimating spatialized rainfall data for the tropical region, as well as expanding and improving existing limitations in rainfall estimation techniques, such as those using the lengths of visible and infrared waves [53,54,55]. The TRMM includes, among other sensing instruments, a passive and an active microwave radiometer, which makes it possible to generate integrated information of water and ice hydrometeors, as well as the three-dimensional distribution of the vertical profile of rainfall rates, eliminating, thus, the additional restrictions hitherto existing in the recovery of precipitation [53,56].
The validations (quantitative and physical) of the TRMM precipitation recovery algorithms were carried out through field campaigns in tropical and subtropical regions. [57]. In Amazonia, these data were evaluated through the Brazilian Large-Scale Biosphere–Atmosphere–TRMM-LBA experiment [20,57]. In general, the results showed good agreement with the observed precipitation data, while for the microphysical data the TRMM tends to be underestimated by a factor of 3 when compared to the observed surface radar data being successfully applied in studies in the region Amazon [29,58,59]. However, other studies have observed precipitation underestimations due to the horizontal spacing of the product, which is not capable of representing processes with a spatial scale smaller than 0.25°, and overestimations associated with large-scale systems due to the strong emissivity of clouds. [60,61,62,63].
Some studies have been carried out to evaluate microphysical properties of clouds using TRMM data; for example, in Brazil, [64] used data from the Microwave Imager (TMI) sensor to estimate ice particles in Mesoscale Convective Systems, while [65] used data from Lightning Imaging Sensor (LIS), TMI, and Precipitation Radar (PR) to analyze microphysical characteristics of clouds in precipitating systems with and without lightning. Ref. [66] used rainfall measurement radar (PR), TMI, and visible and infra-red sensor (VIRS) data to verify the impacts of smoke from biomass burning on rainfall processes for Indonesia. Previously, [67] used LIS and PR data to analyze the relationship between ice mass and lightning density for the warm seasons of the Northern and Southern Hemispheres. Other studies with orbital data have also investigated the role of aerosols in modifying the microphysical properties of clouds [52,67,68,69,70].
As verified by the above analyses, these studies have mainly focused on investigating the effects of land cover change on biogeochemical (aerosols, CO2) and biophysical (energy, moisture flows) flows from precipitating systems, improving our understanding of the effects of deforestation on Amazonian hydrology. To date, no studies have been conducted that investigate the impacts of deforestation on the microphysical properties of clouds through comparative statistical analysis. For example, the difference between total water and ice hydrometeors in precipitating clouds of continental areas, compared to deforested and non-deforested areas of Amazonia, is not known quantitatively. The effects of deforestation on rainfall, energy flows, and aerosols have been extensively studied, as summarized by [71]. Thus, improving this understanding depends on a deep understanding of the changes in microphysical properties on contrasting surfaces in tropical regions such as the Amazon, and this is an open scientific question.
The objective of this study was to investigate for the first time the hypothesis of variance between the content of microphysical parameters on contrasting surfaces of southwestern Amazonia; that is, we aimed to analyze through comparative statistics the manner in which changes in land cover impact the microphysical properties of clouds on a regional scale using observations from the active and passive sensors of the TRMM satellite.

2. Material and Methods
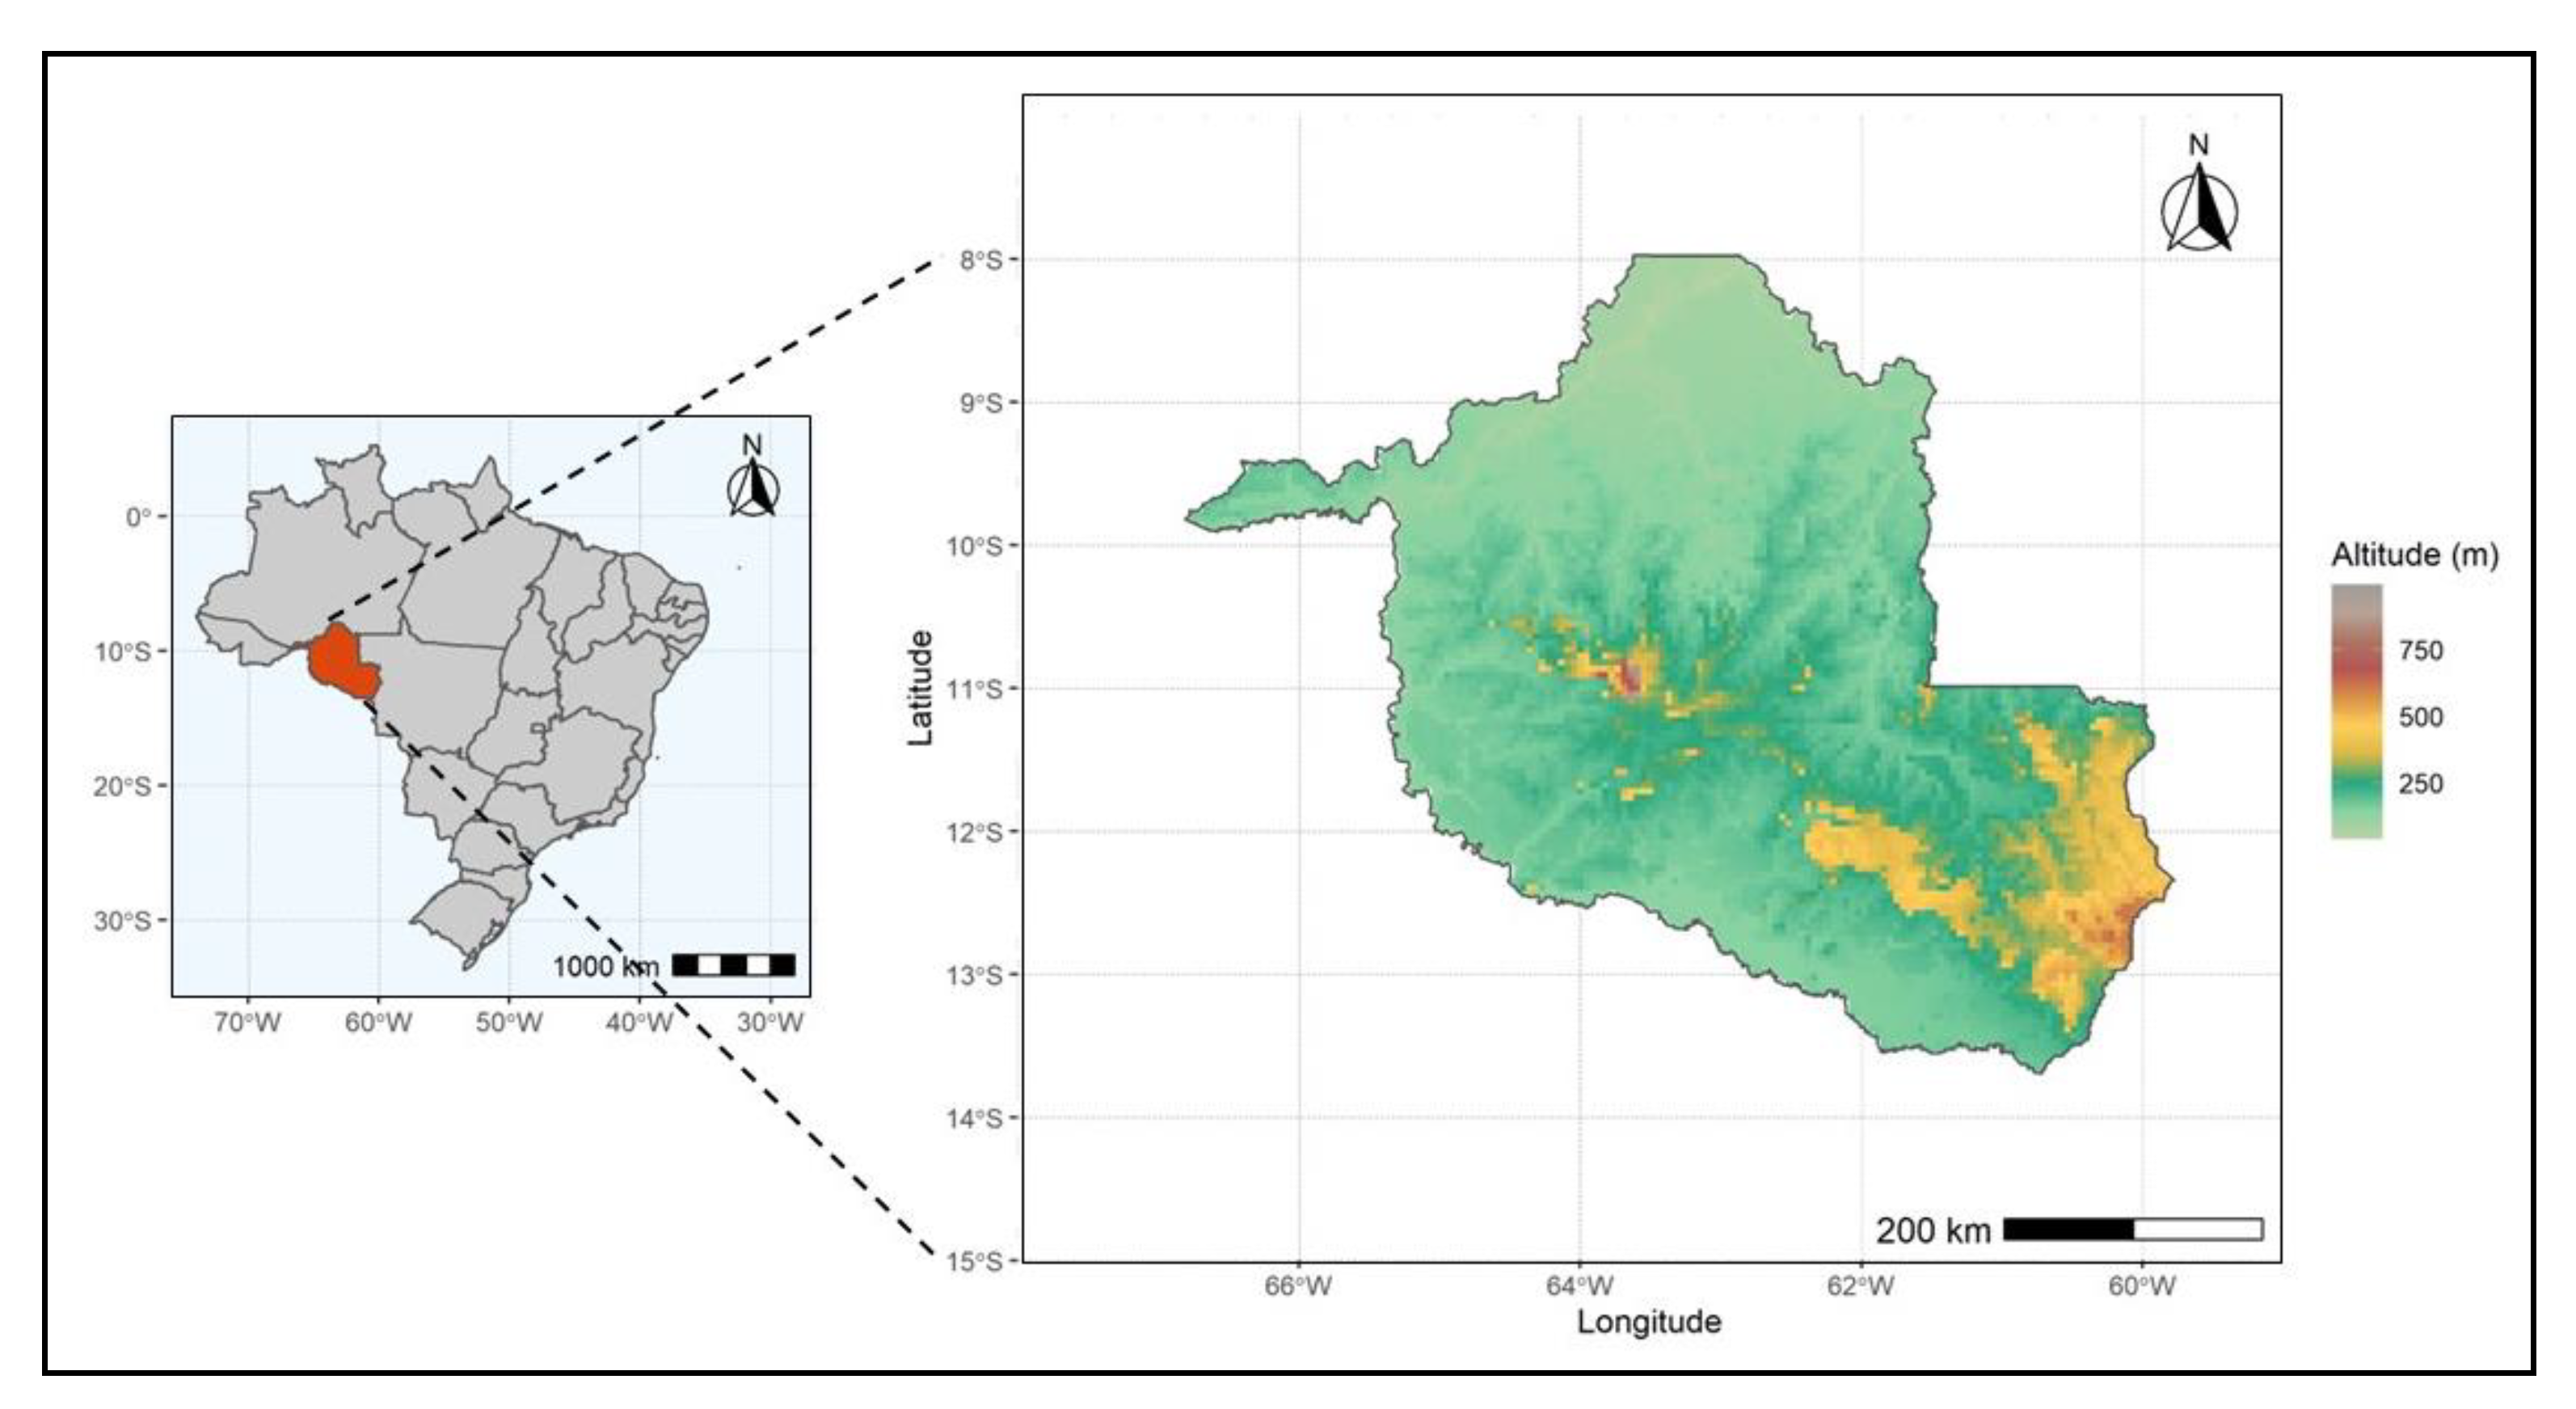
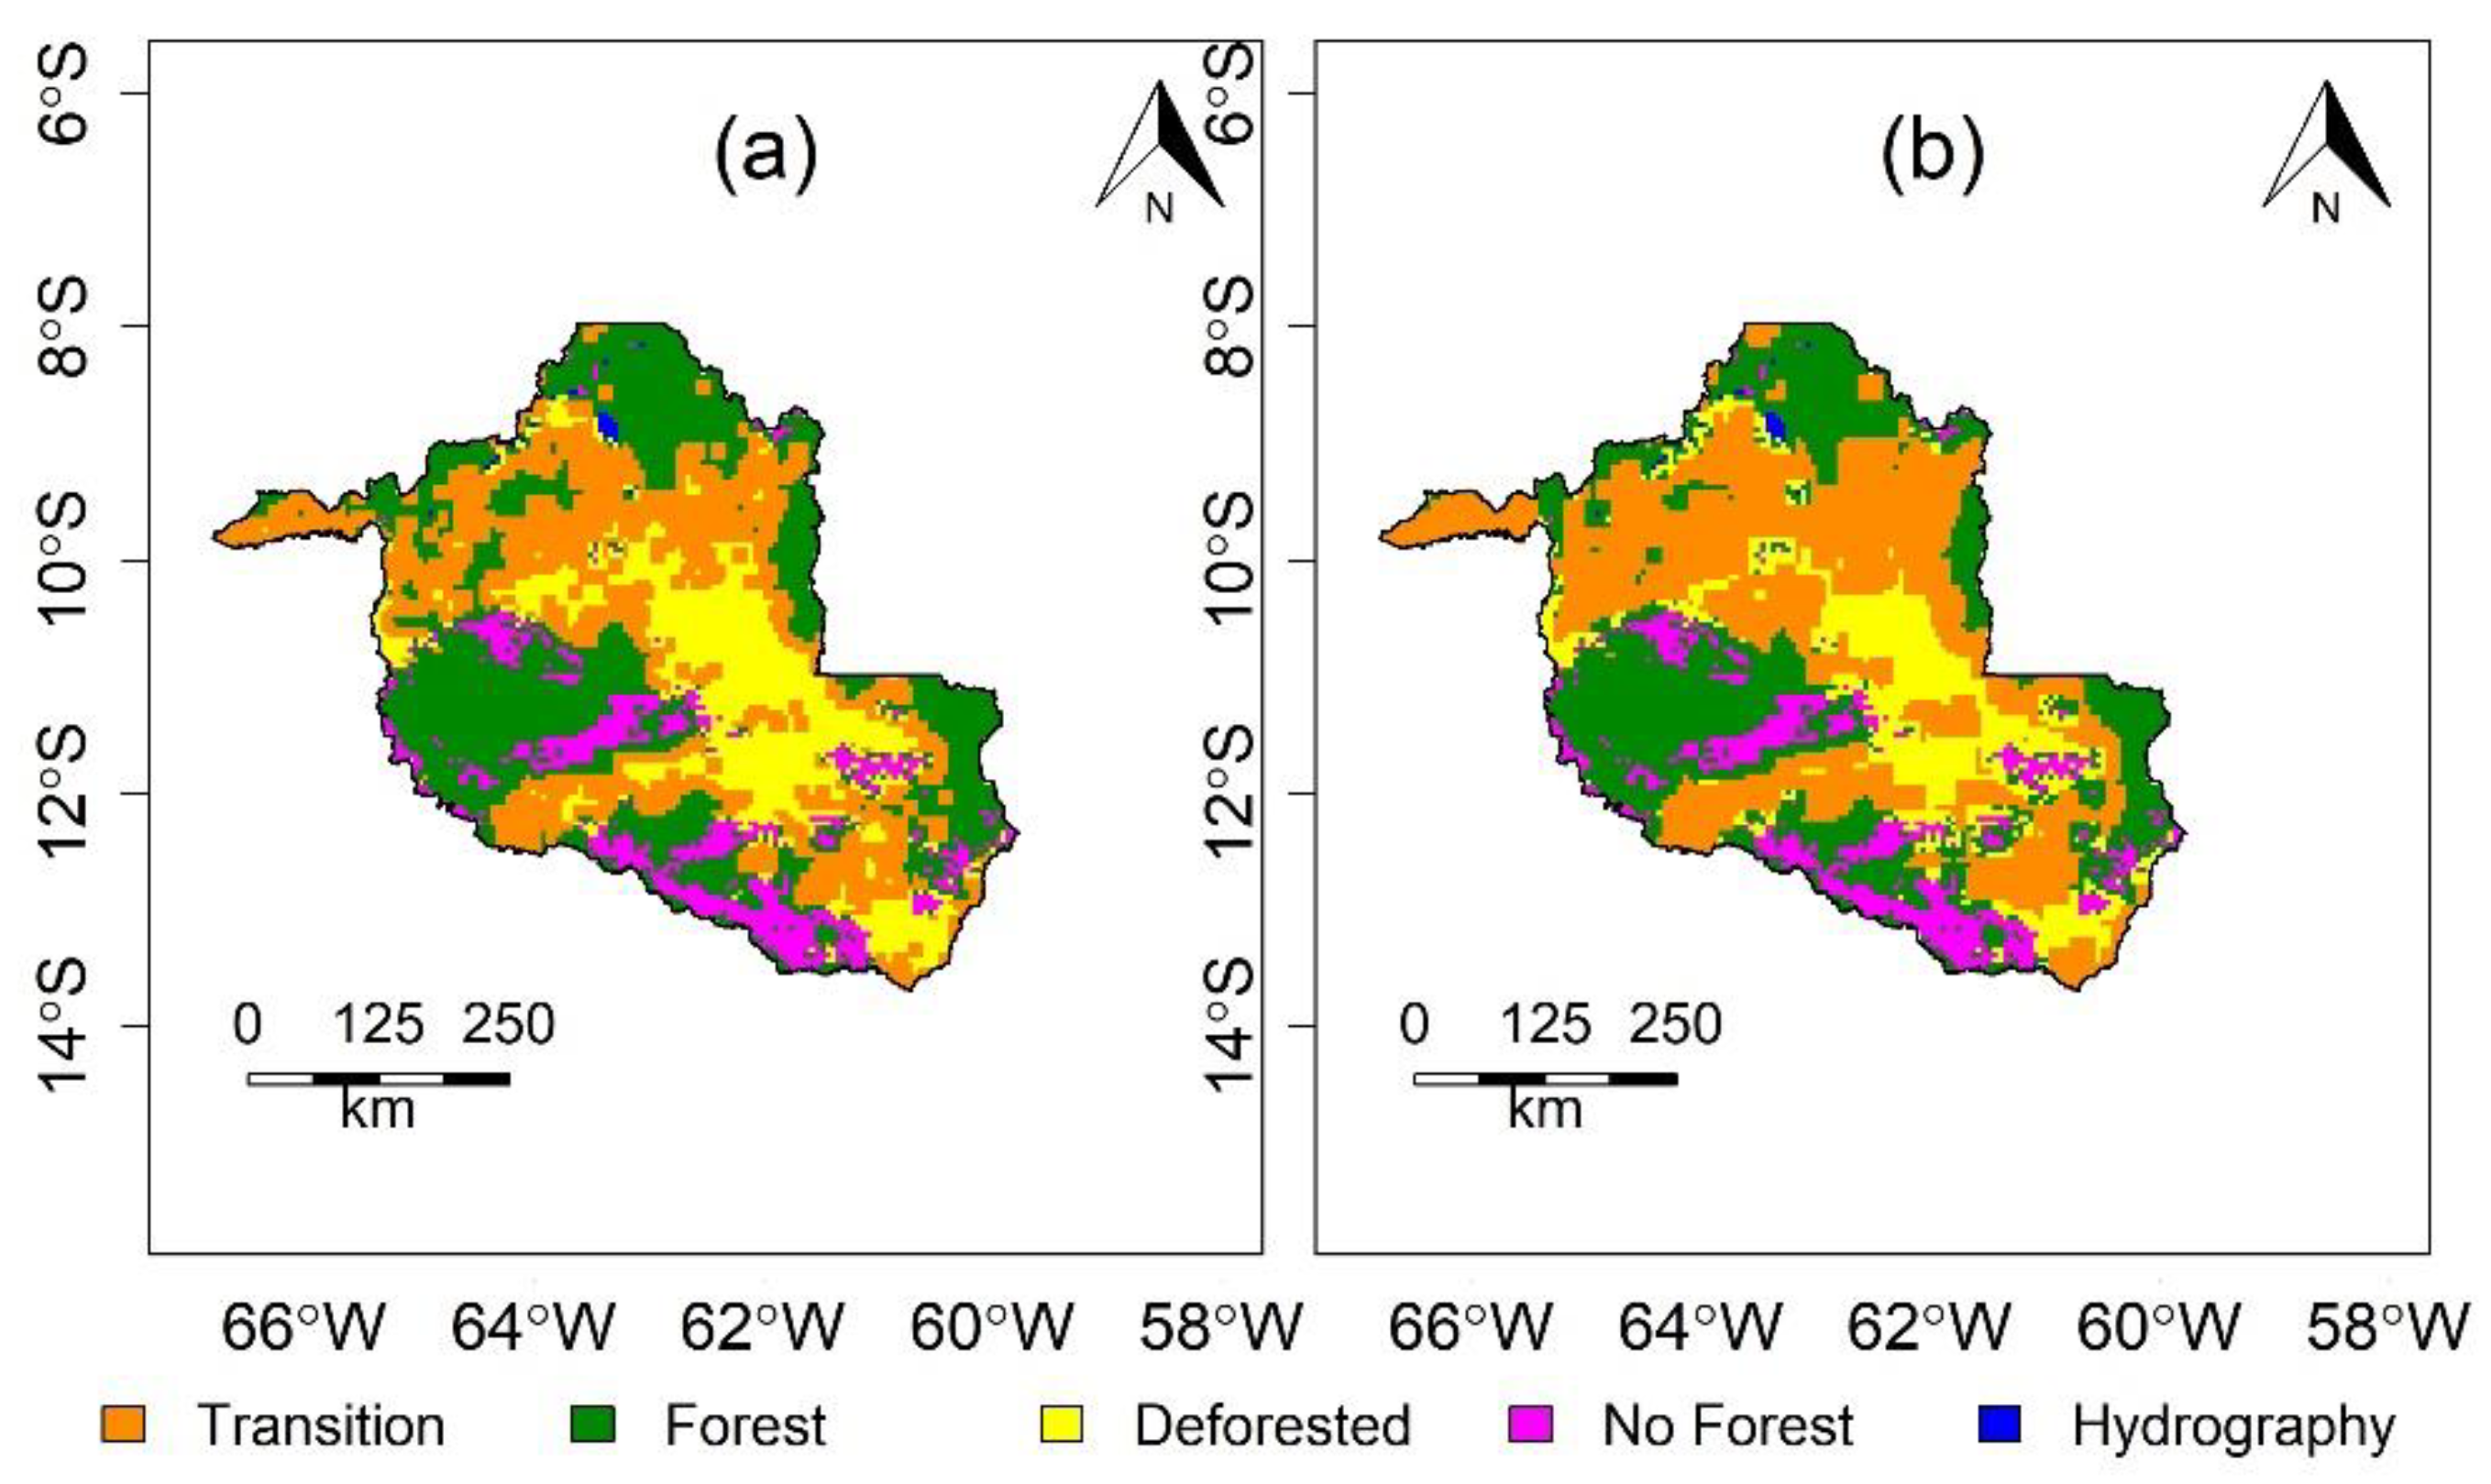
2.1. Study Area

The study area corresponds to the state of Rondônia, Brazil (southwest Amazon), situated between latitudes 7°58′S and 13°4″S, and longitudes 59°5″W and 66°4″W (Figure 1). The state covers an area of approximately 240,398 km2, with a population of around 1,600,000 inhabitants (IBGE, 2010). According to the Kôppen classification, the region has an Am climate (Rainy Tropical Climate), with a climatological average air temperature above 18 °C–megathermal [72].
The average annual precipitation in the study region is approximately 2000 mm (32,47). The distribution of precipitation shows strong seasonality: during the months of November to March (rainy season), the precipitation is above 200 mm/month, associated with precipitating systems such as the Intertropical Convergence Zone (ITCZ) and the South Atlantic Convergence Zone (SACZ), among others, while the months from May to September (dry season) are less rainy, with averages below 100 mm, associated with the weakening of these systems and local convection [46,73,74]. Occasionally, the state suffers the action of the phenomenon known locally as “friagem”, which is related to the incursions of polar air masses (dry and cold) from southern Brazil [5,75]. Information on land cover characteristics in the study region is provided in the next section.

2.2. Data and Methods

2.2.1. PMDA Product

The brazilian project to Monitoramento do Desmatamento da Floresta Amazônica Brasileira por Satélite – PRODES, henceforth Monitor Deforestation in the Legal Amazon (PMDA) is a program that monitors clear-cut deforestation in the “Legal Amazon” for the establishment of public policies. In the last three decades, it has produced estimates of the annual rates of deforestation in the region [76,77]. PMDA uses images from LANDSAT satellites, whose products have a spatial resolution of 30 m and a revisit rate of 16 days. Currently, the project uses images from the LANDSAT-8 and Operational Land Imager (OLI) sensor, as well as products from other satellites such as China–Brazil Earth Resources (CBERS 4) and Indian Remote Sensing (IRS-2) [78,79]. With this structure, the minimum area mapped by PMDA is 6.25 hectares, which minimizes the problem of cloud coverage and guarantees interoperability and reliability criteria [80,81]. Made available through the website: http://www.obt.inpe.br/OBT/assuntos/programas/amazonia/prodes [accessed on 10 April 2021].
The land cover classes adopted by PMDA are composed of Water Bodies, Native Forest, Deforested (of the “shallow cut” type, total removal of forest cover), and Non-Forest, comprised of natural savannah, regrowth, urban centers, and wetlands, among others. In 2020, according to PMDA, the forested surface coverage in the state of Rondônia corresponded to 117,856 km2 (49%), while the deforested area covered 96,093 km2 (39.9%). The remainder, approximately 26,447 km2 (11%), was non-forest. Since 2000, the deforested area has increased by around 35,398 km2. The evolution of deforestation in the study domain can be seen in Figure 2.

2.2.2. Products of the 2A-CLIM and 2A25 Algorithms

The data referring to the estimates of the microphysical parameters and rainfall were extracted from the products 2A-CLIM (from the Microwave Imager—TMI sensor) and 2A25 (from the Precipitation Radar—PR) from the TRMM satellite, which relate to surface precipitation and vertical profiles of hydrometeors made available by the STORM platform: https://storm.pps.eosdis.nasa.gov/storm/., accessed on 20 March 2019.
The TMI sensor is a five-frequency passive microwave multichannel radiometer; four frequencies have dual polarization (10.65, 19.35, 37.00, and 85.50 GHz) and one has single polarization (21.30 GHz) [54,82]. The PR radar was the first rain radar to be placed in orbit. According to [54], its main objectives are to identify the three-dimensional structure of the vertical distribution of precipitation simultaneously with cloud microphysics, as well as to improve the overall accuracy of the TRMM precipitation measurement by the combined use of data from active (PR) and passive sensors (TMI and VIRS). The PR is a 13.8 GHz active radar, which records energies reflected from atmospheric and surface targets with electronic scanning, with a bandwidth of 215 km pre-boost and 247 km post-boost (Ref. [57]. The publications by [55,56] provide more detailed information about the types of microphysical measurements of clouds estimated by the algorithms, as well as technical analysis of the strengths and weaknesses of measurements from the TRMM satellite.
From the TMI, the parameters analyzed were Rain Water Path (RWP), Ice Water Path (IWP), and Surface Precipitation (SP), while for the parameters from the PR they were Freezing Height (FLH) and Rain Type (RT). Appendix A shows the spatial variability of the parameters, while Table 1 summarizes some characteristics associated with these products and parameters; details can be found in [83,84,85].
The RWP and IWP parameters consist of the total amount of water and ice, respectively, integrated in the vertical atmospheric column, given in kg/m2, while the SP is the instantaneous precipitation rate on the surface, in mm/h [85].
The Rain Type (RT) parameter has three categories: Stratiform, Convective, and Others, which are classified according to two methods called Vertical Profile Method–V_Method, and Horizontal Standard Method–H_Method [86]. According to these authors, the types of rainfall by the two methods are unified and expressed by a three-digit number of the form Type (V_Method, H_Method), whose first digit indicates the main category of the type: 1: Stratiform, 2: Convective, and 3: Others, while the second and third digits indicate the type of rain according to the method used. In that study, the results were presented in percentage normalized by the area of each type of surface considering only the type of stratiform and convective rain.
The Freezing Level Height (FLH) consists of the values of the isotherm heights of 0 °C above mean sea level, given in meters [87]. These data were obtained from the 2A25 product, originally estimated from the 2A23 algorithm with PR data. The FLH is estimated from the knowledge of climatological surface temperature data with a predefined constant lapse rate provided by the National Aeronautics and Space Administration (NASA) [86,88].
FLH is calculated according to Equation (1):
FLH = (Ts−273.15)/6.0
where Ts [K] is the interpolated climatological temperature (space/time) at mean sea level. The atmospheric temperature lapse rate is assumed to be 6.0 [K/km].
According to [86,87], sea-level temperature data were provided by NASA shortly before the launch of the TRMM satellite and consisted of 12 months of statistical data that have not been updated since.

2.2.3. Methodology

The data were selected considering the driest quarter in the region: June, July, and August—JJA [46,74], considering the initial interval from 2000 to 2013, which is the common period for all products. The use of data for this interval was necessary because the TRMM satellite started its downward trajectory in 2014, generating uncertainties in its measurements [88,89]. The choice of the dry period defined in this work was justified because it is the ideal period of the year to analyze the effects of deforestation on the microphysical parameters of clouds in the Amazon, since precipitation is generated mainly by local and topographic effects [42] without the influence of large-scale precipitation systems, low-frequency frontal systems, and relatively weak atmospheric instability [27,90]. Other works have analyzed the impacts of Amazon deforestation considering the dry season in the region, which is the period in which the impacts of deforestation are intensified [24,27,29,32,46,91].
As mentioned, the period initially considered was from 2000 to 2013. However, we performed an additional analysis using standardized precipitation anomalies and observed that there were years with anomalies (positive and negative) of precipitation with great spatial variability, as can be seen in Figure 3. Standardization was achieved by calculating the difference between the observed value and the mean value for the period (quarter mean—JJA) and dividing the difference by the standard deviation. In this way, and in order to minimize the generated precipitation from the large-scale effects as well as the spatial variability of rainfall, we chose to work with spatially homogeneous years with negative anomalies that might be associated with the occurrence of large-scale natural phenomena such as the El Niño Southern Oscillation (ENSO) in the Tropical Pacific Ocean, and the anomalous warming of the sea surface temperature (SST) in the Tropical Atlantic Ocean [92,93,94,95,96]. With this consideration, it was possible to work with a greater number of years with the same large-scale characteristic. Thus, this analysis included the years 2004, 2005, 2006, 2007, 2010, and 2012.
To verify the relationship between deforestation and the microphysical characteristics of the clouds, it was necessary to resample the PMDA data (30 m pixel), in order to match the spatial resolution of the microphysical and rainfall data products (5 km pixel). So that all data were analyzed on a spatial resolution grid of 5 km, the nearest-neighbor method was used, due to the processing time being faster when compared to other techniques [97,98]; furthermore, because the extreme subtleties are not lost, the method is ideal for categorical, nominal, and ordinal data [99,100]. Only pixels identified as Forest and Deforested, according to PMDA, were considered in the analyses, while pixels identified as Non-Forest and Water Body, as well as pixels that did not show rain according to TRMM, were disregarded.
Studies have shown that, in the transition between forested and deforested areas, convergence zones and mesoscale circulations can be produced [24,48,50,101]. Although circulations can develop at different spatial scales, according to [102,103], they are more efficient in Transition Zones (TZs) with lengths of 10 and 20 km. TZs, according to [24], are defined as locations where forested pixels are neighbors to deforested pixels; that is, both forested and deforested pixels are considered part of this region since there are one on each side. Therefore, there is a span of at least 10 km where a single forest pixel is next to a single deforested pixel (2 × 5 km pixels = 10 km). Comparatively, a 20 km ZT extends one more pixel on each side (4 × 5 km pixels = 10 km). A schematic diagram demonstrating the concept of ZTs is shown in Figure 4c. In this way, for this research, two ZTs were defined, one with 10 km and the other with 20 km in order to verify if there are differences in the influence of deforestation in these transitory strips of surface. This was accomplished by creating a modified land use cover map from the original binary land use cover map, where Deforested pixels bordering Forest pixels were identified with a third coding. Finally, a dynamic land use cover map was produced for all the years of the study. An example of this land use map with the three surfaces, namely: (i) Forest (F), (ii) Transition (T), and (iii) Deforested (D), can be seen in Figure 4. This map of Forest, Deforested, and Transition cells was used as the basis for comparing microphysical cloud and precipitation data in the following analyses.
Finally, operations were performed to delineate the study area, as well as to determine comparative statistics, such as mean and standard deviation, and to formulate graphs and tables. Subsequently, the nonparametric Wilcoxon–Mann–Whitney (WMW) test for means was applied, adopting a significance level of 5%, in which the null hypothesis was that the means between different groups were the same. This test was chosen because it does not consider the structure of the data (normality) and is an alternative to the Student t-test when the samples do not follow a normal distribution [104]. Details on the test can be found in [105,106]. For the application of the referred test, the averages of two types of surfaces were taken at a time. For example, first the differences in the averages between the Transition areas were compared with the averages of the Forest areas, then the averages of the Transition areas with those Deforested, and finally the averages of the Deforested areas with those of Forest. Finally, three groups of means were compared by the referred test.
To quantify the Relative Effect (RE) of deforestation on the microphysical parameters (Table 1), the absolute differences between the following combinations were calculated: Transition (T)–Forest (F); Transition (T)–Deforested (D) and Deforested (D)–Forest (F), where the results were divided by the surfaces F, D, and F, respectively, according to Equation (2):
R E = 100 ( P 1 P 2 P 2 )
where RE corresponds to the average relative effect given in percentage, P1 denotes the average values of the parameters of Deforested (D) and/or Transition (T) regions, and P2 denotes the average values of the parameters of Forest or Deforested regions. It is worth mentioning that the calculations were performed considering the average of all points for each type of surface.
Additionally, the degree of influence of deforestation on microphysical and rainfall parameters was verified, considering three precipitation classes. For this purpose, rainfall data were classified according to intensity using the percentile technique [107]. First, 50%, 5%, and 1% of the data were selected considering all points for each surface type (deforested, forest, and transition), so that the necessary comparisons could be made. Intense Precipitation Event (IPE) rates were defined as values above or equal to the 95th percentile (hereinafter, P95) and above the 99th percentile (hereinafter, P99), while the values considering the intervals between 45 and 55% were called P50, representing the central or average value of the data series.
In the dry season in the Amazon region, rainfall occurs mainly over elevated areas [42]. Thus, relief data were also obtained from the Shuttle Radar Topographic Mission (SRTM) project (http://www.dsr.inpe.br/topodata/, accessed on 1 August 2022), accessed on 8 January 2020, to complement the analyses, in order to filter out the influence of topography on the microphysical parameters. According to the analyses performed (not shown), surfaces with topographies above 721 m can influence the amount of precipitation and cloud microphysics in the study area. Thus, all regions (pixels) with topography above this threshold were disregarded.
In spatial data, in general, the attributes or phenomena analyzed present spatial autocorrelation or spatial correlation. Thus, it is important to verify and quantify the degree of spatial autocorrelation of the microphysical parameters used in this research (Table 1), since most statistical methods are based on the assumption that the samples are independent [105]. For this purpose, the Moran Global Index (MGI) was applied [108]. The MGI has been successfully applied in several areas of knowledge [109,110,111,112]. The MGI consists of a general measure that tests the degree of spatial autocorrelation existing in a dataset, in which the null hypothesis states that the analyzed attribute is randomly distributed among the characteristics of the study area [113]. It can range from −1 to +1, where positive values indicate direct/positive autocorrelation and negative values the opposite; a null value indicates that the data are randomly distributed [113,114]. The results showed that the MGI ranged between 0.017 and 0.038 (p-value < 0.05), which implies a weak positive spatial correlation; in other words, the spatial distribution of the microphysical processes that occur over a pixel, for example deforested, tends to be similar to the neighboring deforested pixel and different from distant pixels such as forest or transition, which is what we expected. Therefore, proceeding with a standard approach of comparative statistical analysis is acceptable and the results are valid.

3. Results

3.1. Influence of Amazon Deforestation on Cloud Microphysics

The results of the influence of deforestation on precipitation and cloud microphysical parameters for the years 2004, 2005, 2006, 2007, 2010, and 2012 considering TZs of 10 and 20 km are shown in Figure 5, Figure 6, Figure 7, Figure 8 and Figure 9, while the values of the absolute differences between the contrasting surfaces, as well as the statistics and their respective significance, are shown in Table 2, Table 3, Table 4 and Table 5. A three-way comparison was performed, where for each event the parameter values of each of the three surface coverages were compared and statistics were recorded.

3.1.1. Surface Precipitation (SP)

For the first parameter, surface precipitation (SP), it can be seen from Figure 5 that the rainfall rates are different between the analyzed areas. On average, SP is higher in the transition areas compared to the other two surfaces, regardless of their intensity or extent of the TZ (Figure 5a,b). For P50 events, the SP rates of deforested areas tend to be lower compared to forest, around 22% for the 10 km TZ and ~15% for the 20 km TZ (Table 2). However, for P95 and P99 class events, the opposite was observed, with increases between ~2 and ~10% of SP rates in deforested areas compared to forested areas, with the exception of P99 of the 10 km TZ, which showed a ~5% decrease (p-value > 5%). In summary, rainfall rates were higher in the transition area compared to the other two areas, regardless of rainfall class and TZ extension. In deforested regions in relation to forested ones, rates decreased or increased depending on the observed rainfall class (intensity).

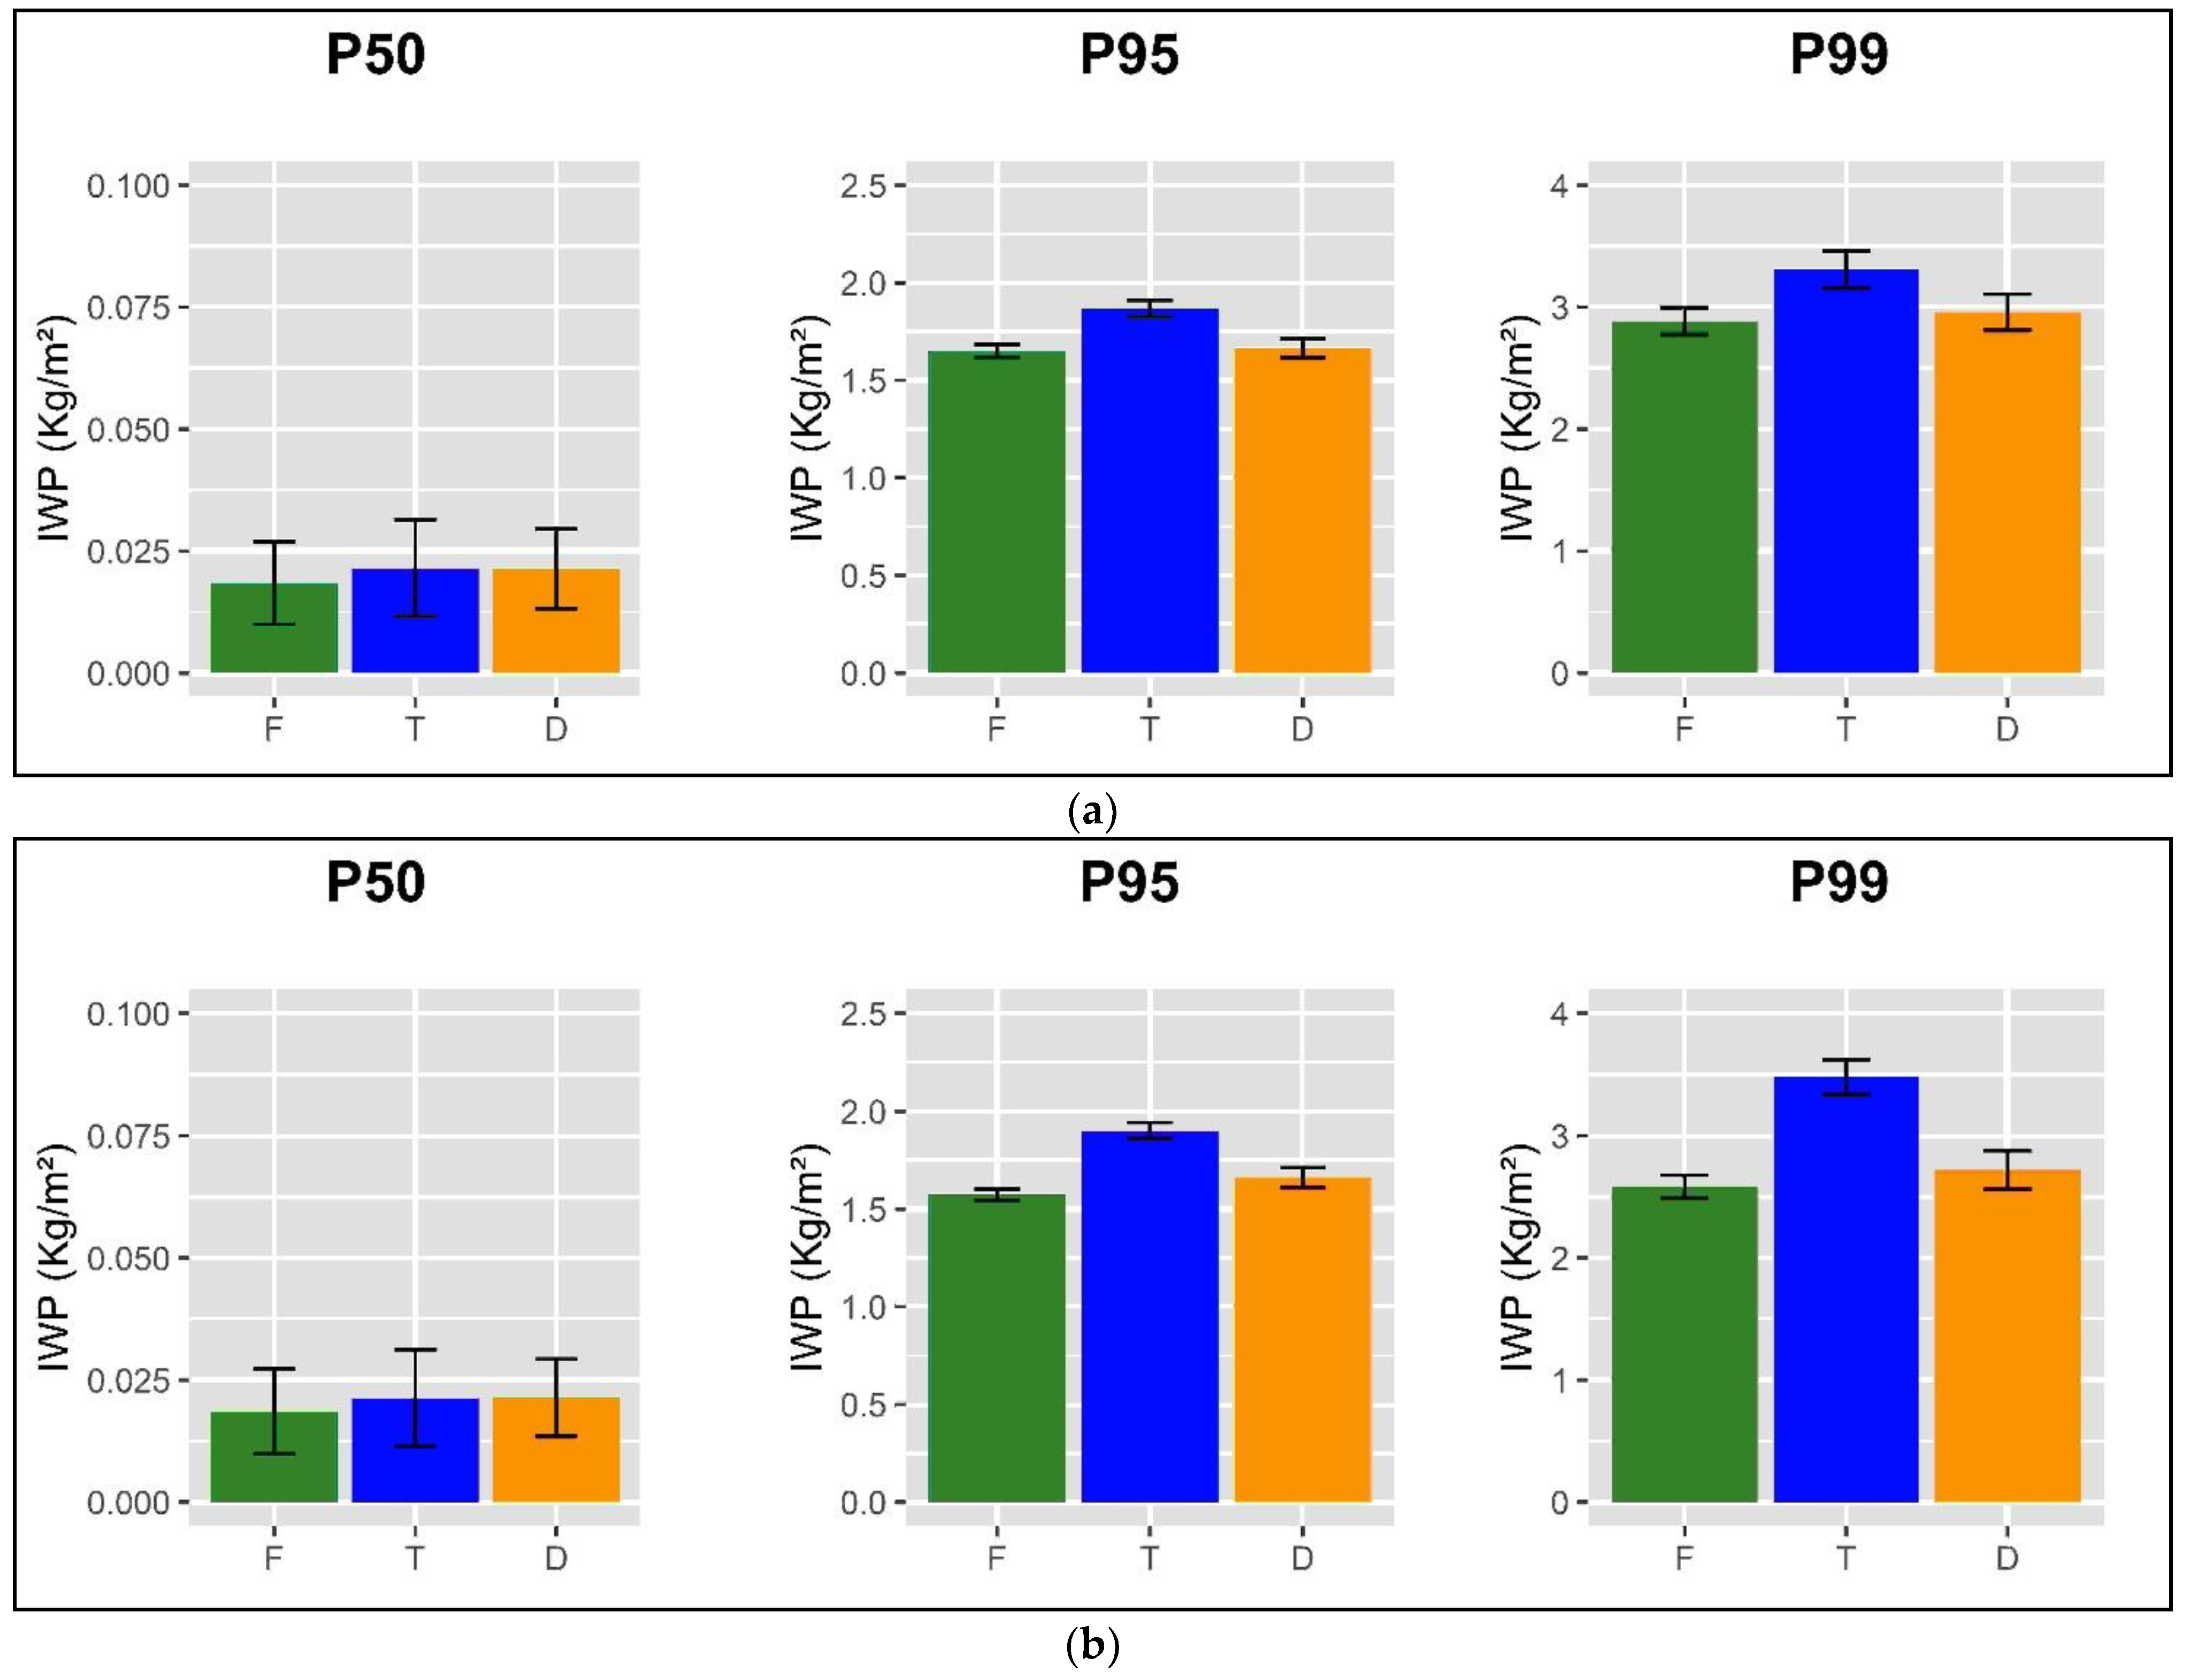
3.1.2. Ice Water Path (IWP)

For the microphysical parameter Ice Water Path (IWP), we observed that, similarly to the behavior of SP, the highest IWP values occurred in transition areas compared to forest and deforested areas (Figure 6). The exception is for the P50 (ZT of 20 km), where the transition and deforested areas presented the same values, and showed a decrease of ~0.5% (p-value > 5%) in relation to deforested areas, but an increase of 15% (p-value < 5%) in relation to forest areas (Figure 6b, Table 3). However, the value of IWP in deforested areas tended to be higher in relation to forest by around ~1 to 35%, depending on the rainfall range and the TZ considered (Table 3). These results suggest that, as one moves away from forested areas towards deforested areas, IWP values tend to increase in relation to forested areas. However, the transition areas continued to have higher values in relation to the other two (Figure 6a,b). These results reinforce the presence of the mesoscale circulation discussed earlier.

3.1.3. Rain Water Path (RWP)

The Rain Water Path parameter (RWP) was similar to SP and to IWP; that is, the transition areas presented the highest values of RWP in relation to the values of forest and deforested areas, regardless of the rain category and the extension of the TZ (Figure 7a,b). However, when observing the deforested areas in relation to the forest, both reductions and increases were observed. For example, reductions were observed for P50 and P99 of around 1 to 20%, but the reductions observed for P99 of deforested areas in relation to forested areas were not statistically significant (Table 4). Increases were observed only for P95 class events in both TZs.

3.1.4. Freezing Level Height (FLH)

For the Freezing Height (FLH) parameter, when the transition and deforested areas were compared with the forest, increases between ~2 and ~9% (p-value < 5%), respectively, were observed, as shown by Figure 8 and Table 5. While the transition areas in relation to deforested areas oscillated between increases and decreases depending on the category of rainfall event and the extent of the TZ considered, these differences were not statistically significant (p-value > 5%) (Table 5).

3.1.5. Rain Type (RT)
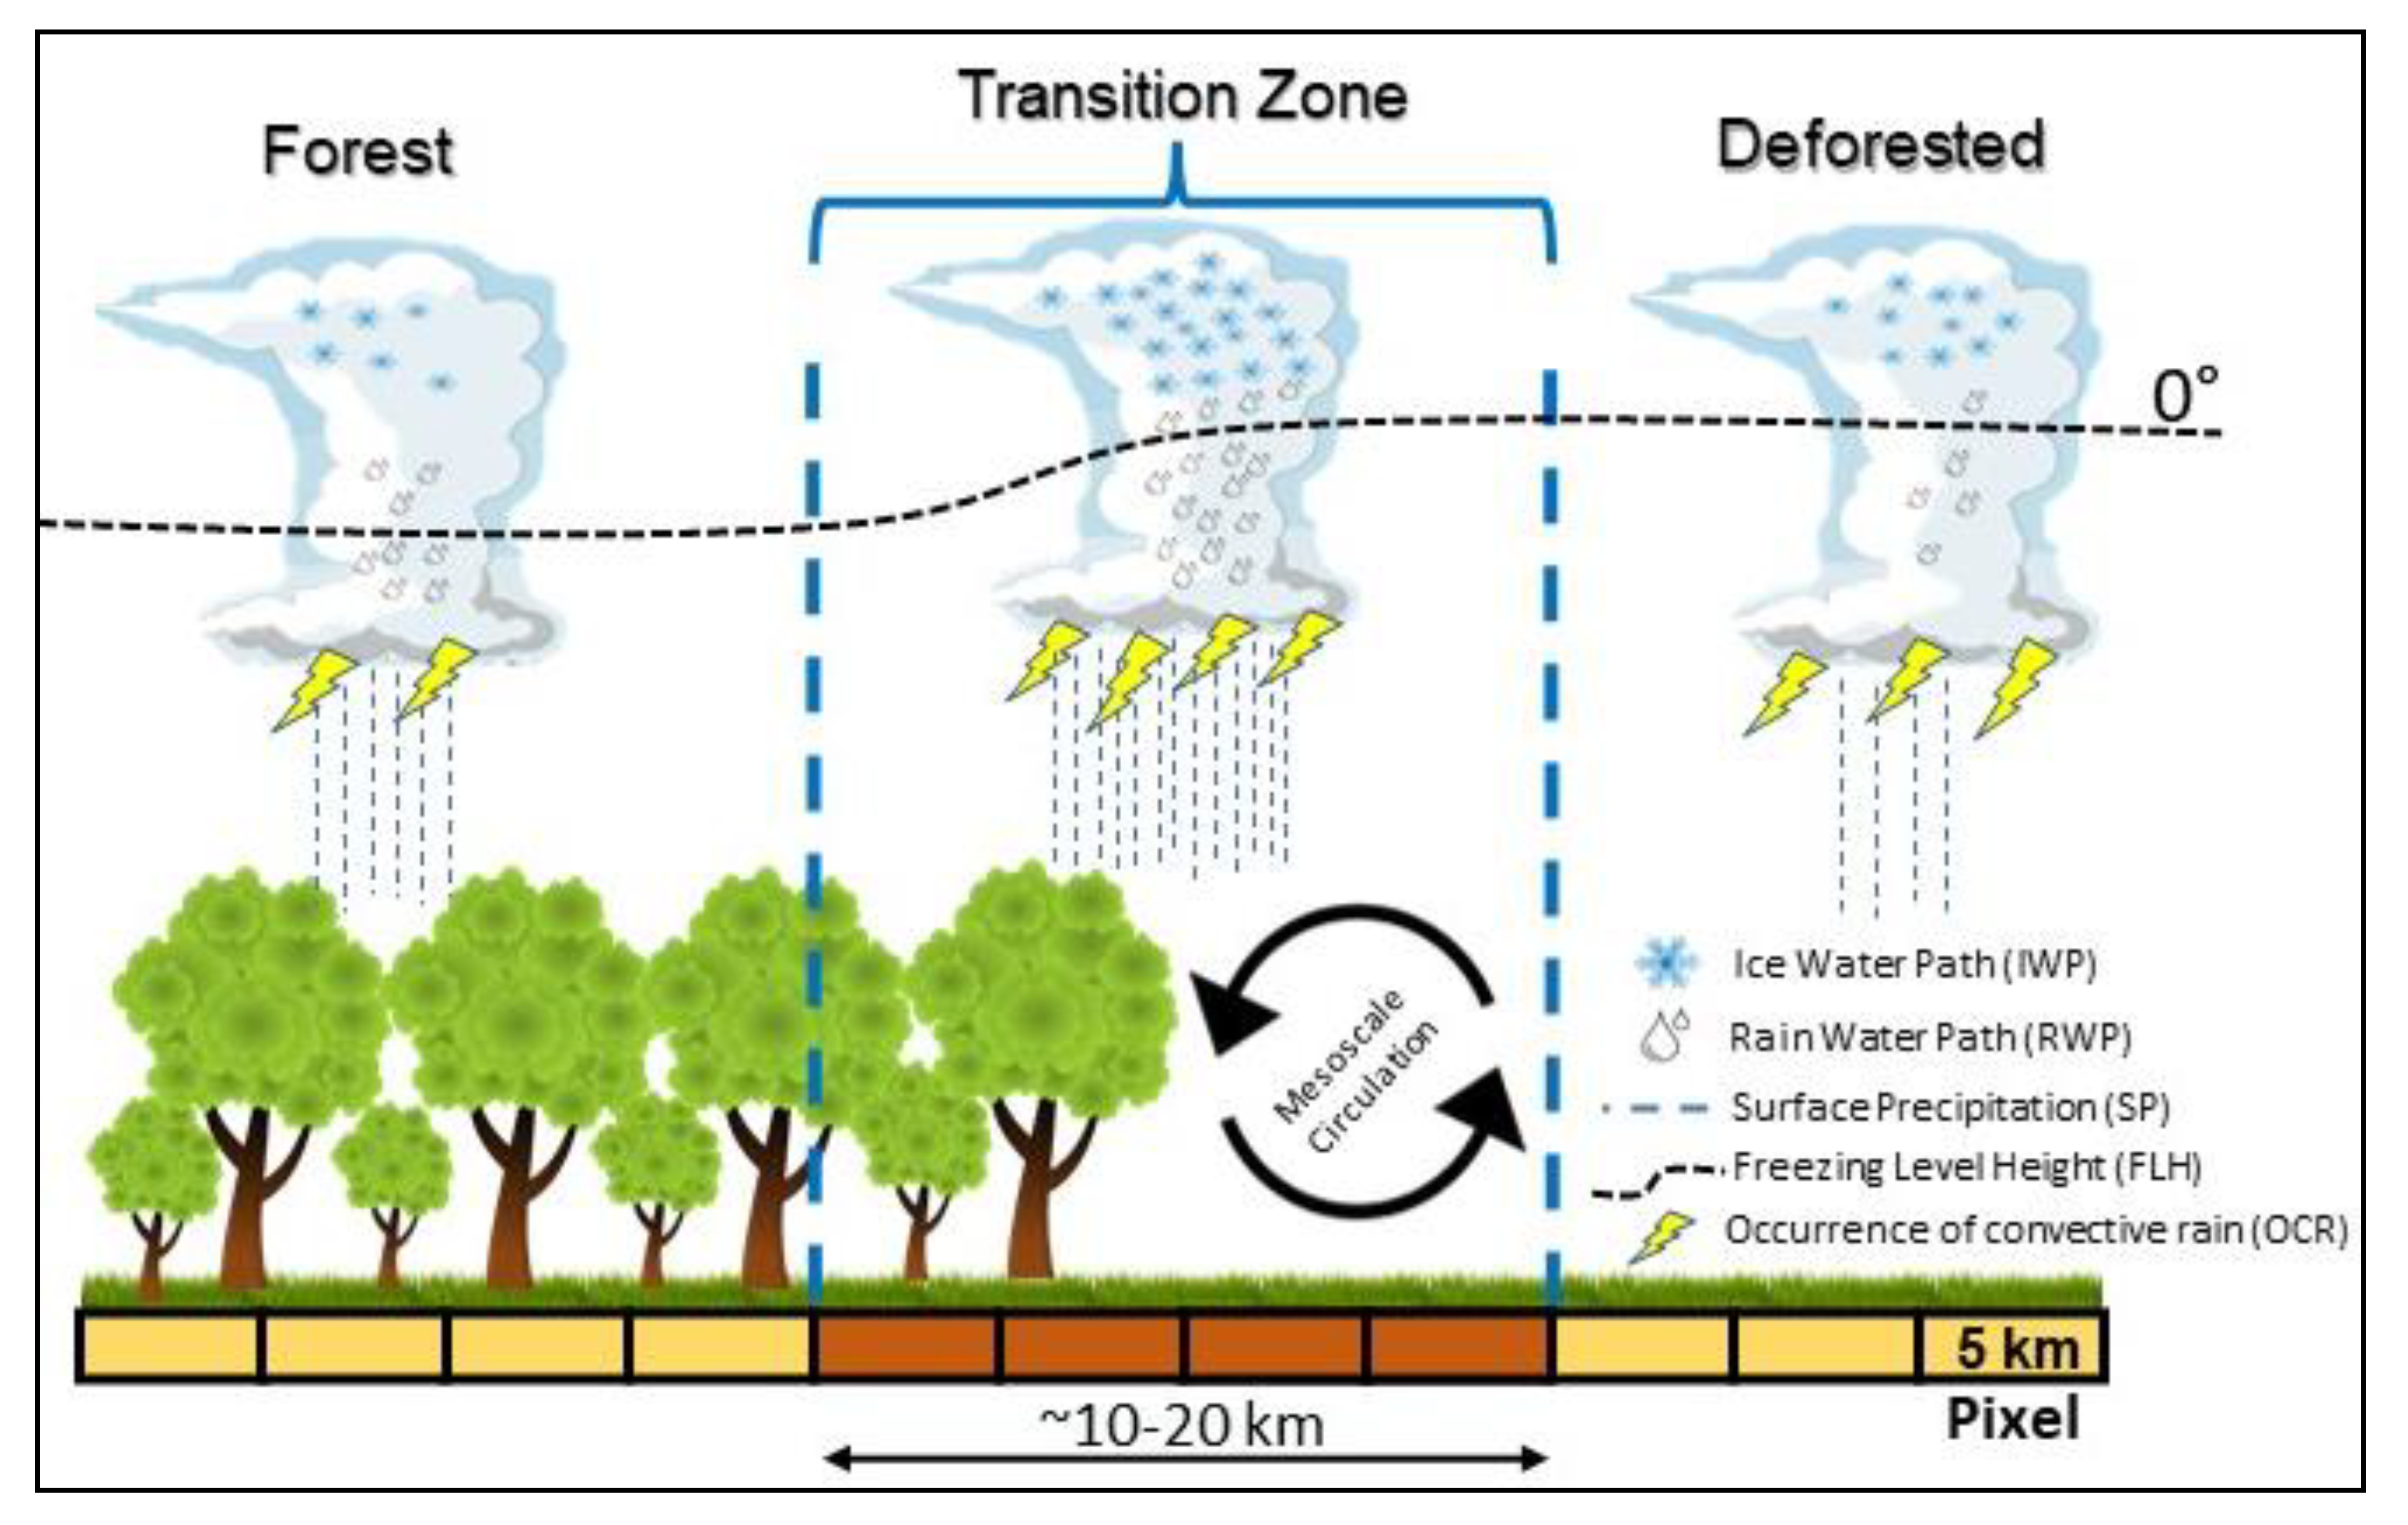
Regarding the Rain Type (RT) variable, we analyzed the frequency of stratiform and convective rainfall according to the type of surface. According to Figure 9, stratiform rainfall is more frequent in forested areas than in transition and deforested areas for both TZs (Figure 9a,b). However, convective rains are more frequent in transition regions followed by deforested ones for 10 km TZ (Figure 9a), while for 20 km TZ the deforested areas presented higher frequencies of convective rains in relation to the other two (Figure 9b).

4. Discussion

The observed reductions for P50 of the deforested areas in relation to the forests can be explained by changes in the surface properties of the vegetation. Deforested areas are characterized by having higher albedo, lower roughness length, and lower rooting depth, resulting in lower evapotranspiration and latent heat flux and higher sensible heat flux. [31,33,71]. These results corroborate the pioneering studies by [14,115], who showed that changes in soil surface characteristics cause a reduction in evapotranspiration rates, and therefore induce a decrease in rainfall in Amazonia. However, as the events become intense and rare (P95 and P99), relative increases were observed in deforested areas in relation to forest, which may be associated with increased cloud cover and rain over deforested areas due to mesoscale circulations [91,103]. These results are consistent with previous studies that showed that rainfall in deforested areas is higher than in forested areas due to increased surface heating in degraded areas, which induces upward air movements, increasing moisture generating rain in deforested areas [12,27,28].
Regarding the higher SP rates observed in transition areas compared to adjacent areas, these results can be explained by the vegetation heterogeneity that produces prominent gradients in surface flows due to land use change, which in turn can trigger thermally induced mesoscale circulations [101,116,117]. This heterogeneous environment can create zones of convergence. Physically, this corresponds to deforestation-induced mesoscale circulation, similar to sea breezes carrying moist air, with convective potential energy available from the forested region to the deforested area, where it rises and precipitates [24]. Consequently, rainfall may increase, associated with mesoscale circulation as a result of initial deforestation.
This observation corroborates what has already been shown by other studies: there is some type of mesoscale circulation between the limits of forest areas and deforested areas [24,103,118]. According to [71], these circulations are responsible for bringing the forest air to the deepest boundary layer on the warmer surface, favoring the beginning of convection on the deforested side. Moreover, according to these authors, the air over the forest tends to have a higher equivalent potential temperature, associated with a lower albedo and a shallower boundary layer. By comparison, the air over the deforested region tends to have less convective inhibition, due to warmer temperatures and a deeper boundary layer. In addition, the mesoscale convergence contributes to increasing the vertical velocity which, together with the humidity and convective energy from the forest region, contributes to the formation of convective precipitation clouds.
A series of studies including meso- and large-scale models in Amazonia [102,119], Africa [103,116], and Australia [120], among others [121,122], confirms the presence of breezes induced by the heterogeneity of vegetation. Our results suggest that these mesoscale circulations are more effective when rainfall events tend to be stronger, since increased SP values were observed in deforested areas 20 km away from the edge of the transition area.
As observed, the SP of deforested areas in relation to forest areas may decrease or increase depending on the intensity of the event. Alternatively, only increases in the IWP of the deforested areas were observed in relation to the forest, regardless of the intensity of the rainfall event and the TZ (Table 3). Therefore, a plausible explanation for the successive increase in the amount of IWP in transition and deforested areas in relation to forest is that changes caused by deforestation in energy flows between the surface and the atmosphere impact cloud patterns, the Atmospheric Boundary Layer (ABL) thickness, and the intensity and duration of precipitation [71]. That is, these changes observed in the IWP are due to the action of convective clouds that are frequent in deforested areas [27]. This type of cloud is characterized by producing severe storms with great vertical development, with a greater amount of ice and a thicker ABL, influencing the duration and intensity of precipitation. Convective rains, for example, associated with a more unstable atmosphere with high concentrations of anthropogenic aerosols, are characterized by being more intense, with strong winds and more abundant electrical discharges. These favor the transport of droplets to higher levels of the atmosphere, where convection can be renewed and the amount of ice increased [35,42,123].
In the Amazonian dry season, aerosol concentrations are high due to biomass burning, influencing the formation, duration, and amount of rain [34,39,43]. For example [124] reported that the increase in biomass in the atmosphere decreases the size of cloud droplets, in turn slowing their growth and shifting the initiation of rain to higher altitudes. This configuration increases the ice production associated with supercooled drops in the mixed-phase region. In addition, there will be increased electrification and lightning due to stronger updrafts and increased latent heat at higher levels [123]. This may also explain the higher values of the amount of ice and water in the atmospheric column observed in the deforested and transition regions (Figure 6 and Table 3).
The observed increases and decreases in FLH may be associated with the different behavior of the thermodynamic atmosphere structure caused by changes in energy flows due to deforestation. The surfaces of deforested regions, for example, are warmer and drier [35]. Accordingly, it can be considered by the boundary layer theory that the lapse rates over the forest and over the deforested regions are different; that is, the FLH value in the deforested areas will be higher than in the forest area [27,71]. These changes in thermodynamic behavior in deforested areas associated with changes in energy flows may explain the changes observed in these areas. However, the influence of other factors contributing to these changes in FLH cannot be ruled out. Ref. [87], studying the functional relationships of latent heat, latitude, and surface temperature between FLHs, found that latitude was the main controlling factor of FLH rather than temperature and latent heat. In addition, they found that the FLH depended on the time of year and responded differently between inland and coastal sites, whereas on an interannual basis, ENSO variations can play a critical role in modulating FLH [125,126]
During the Amazon dry season, convective rainfall over deforested areas is characterized by convective air currents controlled mainly by diurnal convective heating [124]. This thermodynamics raises the cloud base, favoring supersaturation and droplet concentration associated with improved conditional instability [127,128]. Our results agree with the findings of [27,41], who observed that deforested regions have higher frequency of storm convection.
Precipitation events and deforestation in the study region of southeastern Brazilian Amazon are part of a very dynamic system. Nonetheless, this study was subject to limitations, such as the data being representative only of the afternoon and dry-season rain events. In addition, events that were not stimulated locally (meso- and large-scale precipitating systems, occurrences of cold weather, etc.) were not fully filtered in this study. However, we empirically show, despite these sources of noise, that cloud microphysical parameters are, in fact, more abundant in transition areas compared to distant forested and deforested areas due to the higher frequency of convective rainfall episodes, possibly driven by mesoscale circulations associated with surface heterogeneity. This is consistent with the conceptual model shown in Figure 10.

5. Conclusions

The main objective of this study was to evaluate the effects of the current level of deforestation in the state of Rondônia, southwestern Brazilian Amazon, on rainfall rate and cloud microphysics parameters, using data extracted from orbital sensors, for the driest quarter in the region (JJA). The results described here point to possible changes in these parameters associated with regional deforestation.
Our results indicate that the deforestation produced statistically significant changes in the microphysical parameters of IWP, RWP, and FLH, and in SP rates. Despite this, the transition areas presented the highest values in relation to adjacent areas, which may be associated with mesoscale circulations. Among the transition zones (10–20 km ZT), these parameters, in general, showed similar behavior, but with different magnitudes, with a tendency to decrease as they advanced towards the interior of adjacent areas (deforested and forested). We also observed that convective rains tended to increase as the deforested area increased.
These results suggest that, in addition to rainfall rates, the microphysical structure of clouds has different characteristics when related to forested and deforested areas, in agreement with the changes observed in cloud patterns and precipitation amounts from previous research.
The potential impact of mesoscale circulation associated with surface heterogeneity on rainfall and cloud microphysics is critical for a proper understanding of the long-term impacts of deforestation, and for improving parameterizations in regional and global numerical models.
Deforestation in the Amazon region is a reality. If it continues, the changes in rainfall patterns will continue to evolve, and may even further harm the region’s hydrological and energy regime. The understanding of specific components of Amazonian hydrology (precipitation, evapotranspiration, aerosols, etc.) is hampered by geographic limitations and relies on numerical models rather than empirical data. Thus, further studies in this area of knowledge are recommended, such as investigating the impacts of Amazon deforestation on cloud microphysics for other regions of the Amazon, performing comparative analyses with data from mesoscale numerical models, and evaluating performance with orbital data.
This study is a first examination of the regional impacts of Amazonian deforestation on cloud microphysics. The approach carried out in this work provides unprecedented and general results with analyses that had not previously been carried out. However, our research was restricted to afternoon cycle rainfall events and to dry years (negatively homogeneous rainfall anomalies). A posteriori, more in-depth analysis should be carried out to investigate these differences in the daily cycle for rainfall events in rainy years (positively homogeneous rainfall anomalies) and for normal years considering a longer period.

Author Contributions

All authors contributed to this paper: Conceptualization, H.J.F.d.S. and W.A.G.; Formal analysis, H.J.F.d.S. and W.A.G.; Methodology, H.J.F.d.S., W.A.G., B.G.B., C.M.S.e.S., C.P.d.O. and P.R.M.; Validation, H.J.F.d.S., W.A.G., B.G.B., C.M.S.e.S. and C.P.d.O.; Writing – review & editing, H.J.F.d.S., W.A.G., B.G.B., C.M.S.e.S., C.P.d.O. and P.R.M. All authors have read and agreed to the published version of the manuscript.

Funding

This study was financed in part by the Coordenação de Aperfeiçoamento de Pessoal de Nível Superior—Brasil (CAPES)—Finance Code 001.

Data Availability Statement

The data used in this manuscript are available by writing to the corresponding authors.

Acknowledgments

To the Universidade Federal do Rio Grande do Norte (UFRN) for the financial support and encouragement of research through the Postgraduate Program in Climate Science (PPGCC), and to the Coordenação de Aperfeiçoamento de Pessoal de Nivel Superior–Brasil (CAPES).

Conflicts of Interest

The authors declare no conflict of interest.

Appendix A

Figure A1. Mean spatial variability of the microphysical parameters FZ (a), IWP (b), SP (c), and RWP (d) for the month of August 2007, Rondônia, Brazil.
Remotesensing 14 05353 g0a1

References

  1. Vergopolan, N.; Fisher, J.B. The impact of deforestation on the hydrological cycle in Amazonia as observed from remote sensing. Int. J. Remote Sens. 2016, 37, 5412–5430. [Google Scholar] [CrossRef]
  2. Eva, H.D.; Belward, A.S.; De Miranda, E.E.; Di Bella, C.M.; Gond, V.; Huber, O.; Jones, S.; Sgrenzaroli, M.; Fritz, S. A land cover map of South America. Glob. Chang. Biol. 2004, 10, 731–744. [Google Scholar] [CrossRef] [Green Version]
  3. Rocha, V.M.; Correia, F.W.S.; Fonseca, P.A.M. Reciclagem de Precipitação na Amazônia: Um estudo de revisão. Rev. Bras. De Meteorol. 2015, 30, 59–70. [Google Scholar] [CrossRef]
  4. Aragão, L.E.O.C.; Poulter, B.; Barlow, J.B.; Anderson, L.O.; Malhi, Y.; Saatchi, S.; Phillips, O.; Gloor, E. Environmental Change and the Carbon Balance of Amazonian Forests. Biol. Rev. 2014, 89, 913–931. [Google Scholar] [CrossRef]
  5. Marengo, A.; Nobre, C.A. Clima da Região Amazônica. In Tempo e Clima no Brasil; Oficina de Textos: São Paulo, Brazil, 2009; pp. 203–215. [Google Scholar]
  6. Santos, E.B.; Lucio, P.S.; Santos e Silva, C.M. Estimating return periods for daily precipitation extreme events over the Brazilian Amazon. Theor. Appl. Climatol. 2016, 126, 585–595. [Google Scholar] [CrossRef]
  7. Santos, E.B.; Lucio, P.S.; Silva, C.M.S. Precipitation regionalization of the Brazilian Amazon. Atmos. Sci. Lett. 2015, 16, 185–192. [Google Scholar] [CrossRef]
  8. Zakharova, E.A.; Kouraev, A.V.; Cazenave, A.; Seyler, F. Amazon River discharge estimated from TOPEX/Poseidon altimetry. Comptes Rendus Geosci. 2006, 338, 188–196. [Google Scholar] [CrossRef]
  9. Silva, R.R.; Werth, D.; Avissar, R. Regional Impacts of Future Land-Cover Changes on the Amazon Basin Wet-Season Climate. J. Clim. 2008, 21, 11153–11170. [Google Scholar] [CrossRef]
  10. Spracklen, D.V.; Arnold, S.R.; Taylor, C.M. Observations of Increased Tropical Rainfall Preceded by Air Passage over Forests. Nature 2012, 489, 282–285. [Google Scholar] [CrossRef]
  11. Collow, A.B.M.; Miller, M.A.; Trabachino, L.C. Cloudiness over the Amazon rainforest: Meteorology and thermodynamics. J. Geophys. Res. Atmos. 2016, 121, 7990–8005. [Google Scholar] [CrossRef]
  12. Chen, C.-C.; Lo, M.-H.; Im, E.-S.; Yu, J.-Y.; Liang, Y.-C.; Chen, W.-T.; Tang, I.; Lan, C.-W.; Wu, R.-J.; Chien, R.-Y. Thermodynamic and Dynamic Responses to Deforestation in the Maritime Continent: A Modeling Study. J. Clim. 2019, 32, 3505–3527. [Google Scholar] [CrossRef]
  13. Te Wierik, S.A.; Cammeraat, E.L.H.; Gupta, J.; Artzy-Randrup, Y.A. Reviewing the impact of land use and land-use change on moisture recycling and precipitation patterns. Water Resour. Res. 2021, 57, e2020WR029234. [Google Scholar] [CrossRef]
  14. Shukla, J.; Nobre, C.; Sellers, P. Amazon Deforestation and Climate Change. Science 1990, 247, 1322–1325. [Google Scholar] [CrossRef] [Green Version]
  15. Nobre, C.A.; Sellers, P.J.; Shukla, J. Amazonian deforestation and regional climate change. J. Clim. 1991, 4, 957–988. [Google Scholar] [CrossRef]
  16. Voldoire, A.; Royer, J.F. Tropical deforestation and climate variability. Clim. Dyn. 2004, 22, 857–874. [Google Scholar] [CrossRef]
  17. Avissar, R.; Werth, D. Global hydroclimatological teleconnections resulting from tropical deforestation. J. Hydrometeorol. 2005, 6, 134–145. [Google Scholar] [CrossRef]
  18. Spracklen, D.V.; Garcia-Carreras, L. The Impact of Amazonian Deforestation on Amazon Basin Rainfall. Geophys. Res. Lett. 2015, 42, 9546–9552. [Google Scholar] [CrossRef] [Green Version]
  19. Gash, J.H.C.; Nobre, C.A. Climatic effects of Amazonian deforestation: Some results from ABRACOS. Bull. Am. Met. Soc. 1997, 78, 823–830. [Google Scholar] [CrossRef]
  20. Avissar, R.; Nobre, C.A. Preface to special issue on the Large-Scale Biosphere-Atmosphere Experiment in Amazonia (LBA). J. Geophys. Res. 2002, 107, 8034. [Google Scholar] [CrossRef]
  21. Martin, S.T.; Artaxo, P.E.; Chen, Q.; Guenther, A.B.; Gunthe, S.S.; Jimenez, J.L.; Manzi, A.; Prenni, K.L.; Poschl, U.; Schneider, J.; et al. AMAZE-08 Aerosol Characterization and Meteorological Data, Central Amazon Basin: 2008; ORNL DAAC: Oak Ridge, TN, USA, 2016. [Google Scholar] [CrossRef]
  22. Brito, J.; Rizzo, L.V.; Morgan, W.T.; Coe, H.; Johnson, B.; Haywood, J.; Longo, K.; Freitas, S.; Andreae, M.O.; Artaxo, P. Ground-based aerosol characterization during the south merican biomass burning analysis (SAMBBA) field experiment. Atmos. Chem. Phys. 2014, 14, 12069–12083. [Google Scholar] [CrossRef] [Green Version]
  23. Cirino, G.; Brito, J.; Barbosa, H.M.; Rizzo, L.V.; Tunved, P.; de Sá, S.S.; Jimenez, J.L.; Palm, B.B.; Carbone, S.; Lavric, J.V.; et al. Observations of Manaus urban plume evolution and interaction with biogenic emissions in GoAmazon 2014/5. Atmos. Environ. 2018, 191, 513–524. [Google Scholar] [CrossRef]
  24. Knox, R.; Bisht, G.; Wang, J.; Bras, R. Precipitation Variability over the Forest-to-Nonforest Transition in Southwestern Amazonia. J. Clim. 2011, 24, 2368–2377. [Google Scholar] [CrossRef] [Green Version]
  25. Khanna, J.; Medvigy, D.; Fueglistaler, S.; Walko, R. Regional dry-season climate changes due to three decades of Amazonian deforestation. Nat. Clim. Chang. 2017, 7, 200–204. [Google Scholar] [CrossRef]
  26. D’almeida, C.; Vrsmarty, C.J.; Hurtt, G.C.; Marengo, J.A.; Dingman, S.L.; Keim, B.D. The Effects of Deforestation on the Hydrological Cycle in Amazonia: A Review on Scale and Resolution. Int. J. Climatol. 2007, 27, 633–647. [Google Scholar] [CrossRef]
  27. Negri, A.J.; Adler, R.F.; Xu, L.; Surrat, J. The impact of Amazonian deforestation on dry season rainfall. J. Clim. 2004, 17, 1306–1319. [Google Scholar] [CrossRef]
  28. Chagnon, F.J.F.; Bras, R.L. Contemporary climate change in the Amazon. Geophys. Res. Lett. 2005, 32, 1–4. [Google Scholar] [CrossRef]
  29. Funatsu, B.M.; Dubreuil, V.; Claud, C.; Arvor, D.; Gan, M.A. Convective activity in Mato Grosso state (Brazil) from microwave satellite observations: Comparisons between AMSU and TRMM data sets. J. Geophys. Res. Atmos. 2012, 117, 1–16. [Google Scholar] [CrossRef] [Green Version]
  30. Gonçalves, W.A.; Machado, L.A.T.; Alcântara, C.R. Precipitation changes due to the Amazon Deforestation. In Clênia Rodrigue Alcântara. (Org.). Amazon: Biodiversity Conservation, Economic Development and Human Impact, 1st ed.; Nova Science: New York, NY, USA, 2013; Volume 1, pp. 243–270. [Google Scholar]
  31. Pielke, R.A.; Marland, D.; Betts, R.A.; Chase, T.N.; Eastman, J.L.; Niles, J.O.; Niyogi, D.D.S.; Running, S.W. The influence of land-use change and landscape dynamics on the climate system: Relevance to climate-change policy beyond the radiative effect of greenhouse gases. Philos. Trans. R. Soc. Lond. 2002, 360A, 1705–1719. [Google Scholar] [CrossRef]
  32. Da Silva, H.J.F.; Gonçalves, W.A.; Bezerra, B.G. Comparative analyzes and use of evapotranspiration obtained through remote sensing to identify deforested areas in the Amazon. Int. J. Earth Obs. Geoinf. 2019, 78, 163–174. [Google Scholar] [CrossRef]
  33. Tolle, M.H.; Engler, S.; Panitz, H.J. Impact of Abrupt Land Cover Changes by Tropical Deforestation on Southeast Asian Climate and Agriculture. J. Clim. 2017, 30, 2587–2600. [Google Scholar] [CrossRef]
  34. Artaxo, P.; Rizzo, L.V.; Brito, J.F.; Barbosa, H.M.J.; Arana, A.; Sena, E.T.; Cirino, G.G.; Bastos, W.; Martin, S.T.; Andreae, M.O. Atmospheric aerosols in Amazonia and land use change: From natural biogenic to biomass burning conditions. Faraday Discuss 2013, 165, 203–235. [Google Scholar] [CrossRef] [Green Version]
  35. Silva Dias, M.A.F.; Rutledge, S.; Kabat, P.; Silva Dias, P.L.; Nobre, C.; Fisch, G.; Dolman, A.J.; Zipser, E.; Garstang, M.; Manzi, A.; et al. Clouds and rain processes in a biosphere atmosphere interaction context in the Amazon Region. J. Geophys. Res. 2002, 107, LBA 39-1–LBA 39-18. [Google Scholar] [CrossRef] [Green Version]
  36. Mei, F.; Wang, J.; Comstock, J.M.; Weigel, R.; Krämer, M.; Mahnke, C.; Shilling, J.E.; Schneider, J.; Schulz, C.; Long, C.N.; et al. Comparison of aircraft measurements during GoAmazon2014/5 and ACRIDICON-CHUVA. Atmos. Meas. Tech. 2020, 13, 661–684. [Google Scholar] [CrossRef] [Green Version]
  37. Machado, L.A.T.; Franco, M.A.; Kremper, L.A.; Ditas, F.; Andreae, M.O.; Artaxo, P.; Cecchini, M.A.; Holanda, B.A.; Pöhlker, M.L.; Saraiva, I.; et al. How weather events modify aerosol particle size distributions in the Amazon boundary layer. Atmos. Chem. Phys. 2021, 21, 18065–18086. [Google Scholar] [CrossRef]
  38. Braga, R.C.; Ervens, B.; Rosenfeld, D.; Andreae, M.O.; Förster, J.-D.; Fütterer, D.; Pardo, L.H.; Holanda, B.A.; Jurkat-Witschas, T.; Krüger, O.O.; et al. Cloud droplet formation at the base of tropical convective clouds: Closure between modeling and measurement results of ACRIDICON–CHUVA. Atmos. Chem. Phys. 2021, 21, 17513–17528. [Google Scholar] [CrossRef]
  39. Zaveri, R.A.; Wang, J.; Fan, J.; Zhang, Y.; Shilling, J.E.; Zelenyuk, A.; Mei, F.; Newsom, R.; Pekour, M.; Tomlinson, J.; et al. Rapid growth of anthropogenic organic nanoparticles greatly alters cloud life cycle in the Amazon rainforest. Atmos. Sci. 2022, 8, 1–16. [Google Scholar] [CrossRef]
  40. Franco, M.A.; Ditas, F.; Kremper, L.A.; Machado, L.A.T.; Andreae, M.O.; Araújo, A.; Barbosa, H.M.J.; de Brito, J.F.; Carbone, S.; Holanda, B.A.; et al. Occurrence and growth of sub-50 nm aerosol particles in the Amazonian boundary layer. Atmos. Chem. Phys. 2022, 22, 3469–3492. [Google Scholar] [CrossRef]
  41. Machado, L.A.T.; Laurent, H.; Dessay, N.; Miranda, I. Seasonal end diurnal variability of convection over the Amazonia: A comparison of different vegetation types and large scale forcing. Theor. Appl. Climatol. 2004, 78, 61–77. [Google Scholar] [CrossRef]
  42. Artaxo, P.; Silva Dias, M.A.F.; Nagy, L.; Luizão, F.J.; Cunha, H.B.; Quesada, C.A.N.; Marengo, J.A.; Krusche, A. Perspectivas de pesquisas na relação entre clima e o funcionamento da floresta Amazônica. Cienc. Cult. 2014, 66, 41–46. [Google Scholar] [CrossRef]
  43. Gonçalves, W.A.; Machado, L.A.T.; Kirstetter, P.E. Influence of biomass aerosol on precipitation over the Central Amazon: An observational study. Atmos. Chem. Phys. 2015, 15, 6789–6800. [Google Scholar] [CrossRef] [Green Version]
  44. Holanda, B.A.; Pöhlker, M.L.; Walter, D.; Saturno, J.; Sörgel, M.; Ditas, J.; Ditas, F.; Schulz, C.; Franco, M.A.; Wang, Q.; et al. Influx of African biomass burning aerosol during the Amazonian dry season through layered transatlantic transport of black carbon-rich smoke. Atmos. Chem. Phys. 2020, 20, 4757–4785. [Google Scholar] [CrossRef] [Green Version]
  45. Biscaro, T.S.; Machado, L.A.T.; Giangrande, S.E.; Jensen, M.P. What drives daily precipitation over the central Amazon? Differences observed between wet and dry seasons. Atmos. Chem. Phys. 2021, 21, 6735–6754. [Google Scholar] [CrossRef]
  46. Pardo, L.H.; Machado, L.A.T.; Morrison, H.; Cecchini, M.A.; Andreae, M.O.; Pöhlker, C.; Pöschl, U.; Rosenfeld, D.; Vendrasco, E.P.; Voigt, C.; et al. Observed and Simulated Variability of Droplet Spectral Dispersion in Convective Clouds Over the Amazon. J. Geophys. Res. Atmos. 2021, 126, e2021JD035076. [Google Scholar] [CrossRef]
  47. Fisch, G.; Tota, J.; Machado, L.A.T.; Silva Dias, M.A.F.; Lyra, R.F.D.A.F.; Nobre, C.A.; Dolman, A.J.; Gash, J.H.C. The convective boundary layer over pasture and forest in Amazonia. Theor. Appl. Climatol. 2004, 78, 47–59. [Google Scholar] [CrossRef] [Green Version]
  48. Hong, X.; Leach, M.J.; Raman, S. A sensitivity study of convective cloud formation by vegetation forcing with different atmospheric conditions. J. Appl. Meteorol. 1995, 34, 2008–2028. [Google Scholar] [CrossRef]
  49. Baldi, M.; Dalu, G.A.; Pielke, R.A. Vertical velocities and available potential energy generated by landscape variability—Theory. J. Appl. Meteorol. Climatol. 2008, 47, 397–410. [Google Scholar] [CrossRef] [Green Version]
  50. Garcia-Carreras, L.; Parker, D.J.; Taylor, C.M.; Reeves, C.E.; Murphy, J.G. Impact of mesoscale vegetation heterogeneities on the dynamical and thermodynamic properties of the planetary boundary layer. J. Geophys. Res. 2010, 115, 1–12. [Google Scholar] [CrossRef] [Green Version]
  51. Wang, J.F.; Bras, R.L.; Eltahir, E.A.B. A stochastic linear theory of mesoscale circulation induced by the thermal heterogeneity of the land surface. J. Atmos. Sci. 1996, 53, 3349–3366. [Google Scholar] [CrossRef]
  52. Lamb, D. Clouds and Fog|Cloud Microphysics. Encyclopedia of Atmospheric Sciences. In Encyclopedia of Atmospheric Sciences, 2nd ed.; Academic Press: Cambridge, MA, USA, 2015; Volume 2, pp. 133–140. [Google Scholar] [CrossRef]
  53. Tubul, Y.; Koren, I.; Altaratz, O.; Heiblum, R.H. On the link between precipitation and the ice water path over tropical and mid-latitude regimes as derived from satellite observations. Atmos. Meas. Tech. Discuss. 2017, 1–16. [Google Scholar] [CrossRef] [Green Version]
  54. Simpson, J.; Adler, R.F.; North, G.R. A proposed Tropical Rainfall Measuring Mission (TRMM) satellite. Bull. Amer. Meteor. Soc. 1988, 69, 278–295. [Google Scholar] [CrossRef]
  55. Kummerow, C.; Barnes, W.; Kozu, T.; Shiue, J.; Simpson, J. The Tropical Rainfall Measuring Mission (TRMM) sensor package. J. Atmos. Ocean. Technol. 1998, 15, 809–817. [Google Scholar] [CrossRef]
  56. Kingsmill, D.E.; Yuter, S.E.; Heymsfield, A.J.; Hobbs, P.V.; Korolv, A.V.; Stith, J.L.; Bansemer, A.; Haggerty, J.A.; Rangno, A.L. TRMM Common Microphysics Products: A Tool for Evaluating Spaceborne Precipitation Retrieval Algorithms. J. Appl. Meteorol. Climatol. 2004, 43, 1598–1618. [Google Scholar] [CrossRef] [Green Version]
  57. Fiorino, S.T.; Smith, E.A. Critical Assessment of Microphysical Assumptions within TRMM Radiometer Rain Profile Algorithm Using Satellite, Aircraft, and Surface Datasets from KWAJEX. J. Appl. Meteorol. Climatol. 2005, 45, 754–786. [Google Scholar] [CrossRef]
  58. Kummerow, C.; Hong, Y.; Olson, W.S.; Yang, S.; Adler, R.F.; McCollum, J.; Ferraro, R.; Petty, G.; Shin, D.-B.; Wilheit, T.T. The Evolution of the Goddard Profiling Algorithm (GPROF) for Rainfall Estimation from Passive Microwave Sensors. J. Appl. Meteorol. 2001, 40, 1801–1820. [Google Scholar] [CrossRef]
  59. Petersen, W.A.; Nesbitt, S.W.; Blakeslee, R.J.; Cifelli, R.; Hein, P.; Rutledge, S.A. TRMM Observations of Intraseasonal Variability in Convective Regimes over the Amazon. J. Clim. 2002, 15, 1278–1294. [Google Scholar] [CrossRef]
  60. Morales Rodriguez, C.A. Thunderstorm efficiency regimes in South America as observed by STARNET and TRMM. J. Geophys. Res. Atmos. 2019, 124, 11428–11451. [Google Scholar] [CrossRef]
  61. Huffman, G.J.; Bolvin, D.T.; Nelkin, E.J.; Wolff, D.B.; Adler, R.F.; Gu, G.; Hong, Y.; Bowman, K.P.; Stocker, E.F. The TRMM Multi-satellite Precipitation Analysis (TMPA): Quasi-Global, Multiyear, Combined Sensor Precipitation Estimates at Fine Scales. J. Hydrometeorol. 2007, 8, 38–55. [Google Scholar] [CrossRef]
  62. Franchito, S.H.; Rao, V.B.; Vasques, A.C.; Santo, C.M.E.; Conforte, J.C. Validation of TRMM precipitation radar monthly rainfall estimates over Brazil. J. Geophys. Res. 2009, 114, 1–9. [Google Scholar] [CrossRef]
  63. Santos e Silva, C.M.; Lucio, P.S.; Spyrides, M.H.C. Distribuição espacial da precipitação sobre o Rio Grande do Norte: Estimativas via satélites e medidas por pluviômetros. Rev. Bras. De Meteorol. 2012, 27, 337–346. [Google Scholar] [CrossRef] [Green Version]
  64. Mattos, E.V.; Machado, L.A.T. Cloud-to-ground lightning and Mesoscale Convective Systems. Atmos. Res. 2011, 99, 377–390. [Google Scholar] [CrossRef] [Green Version]
  65. Abreu, L.P.; Gonçalves, W.A.; Mattos, E.V.; Mutti, P.R.; Rodrigues, D.T.; da Silva, M.P.A. Clouds’ Microphysical Properties and Their Relationship with Lightning Activity in Northeast Brazil. Resmote Sens. 2021, 13, 4491. [Google Scholar] [CrossRef]
  66. Rosenfeld, D. TRMM observed first direct evidence of smoke from forest fires inhibiting rainfall. Geophys. Res. Lett. 1999, 26, 3105–3108. [Google Scholar] [CrossRef]
  67. Petersen, W.A.; Christian, H.J.; Rutledge, S.A. TRMM observations of the global relationship between ice water content and lightning. Geophys. Res. Lett. 2005, 32, 1–4. [Google Scholar] [CrossRef] [Green Version]
  68. Jiang, H.; Xue, H.; Teller, A.; Feingold, G.; Levin, Z. Aerosol effects on the lifetime of shallow cumulus. Geophys. Res. Lett. 2006, 33, 1–4. [Google Scholar] [CrossRef] [Green Version]
  69. Berg, W.; L’ecuyer, T.; van Den Heever, S. Evidence for the impact of aerosols on the onset and microphysical properties of rainfall from a combination of satellite observations and cloud-resolving model simulations. J. Geophys. Res. 2008, 113, 1–15. [Google Scholar] [CrossRef] [Green Version]
  70. Zhao, D.; Yu, Y.; Li, Y.; Xu, H.; Chen, L. Cloud Macro- and Microphysical Properties in Extreme Rainfall Induced by Landfalling Typhoons over China. Remote Sens. 2022, 14, 4200. [Google Scholar] [CrossRef]
  71. Spracklen, D.V.; Baker, J.C.A.; Garcia-Carreras, L.; Marsham, J. The Effects of Tropical Vegetation On Rainfall. Annu. Rev. Environ. Resour. 2018, 43, 193–218. [Google Scholar] [CrossRef]
  72. Alvares, C.A.; Stape, J.L.; Sentelhas, P.C.; de Moraes Gonçalves, J.L.; Sparovek, G. Köppen’s climate classification map for Brazil. Meteorol. Z. 2013, 22, 711–728. [Google Scholar] [CrossRef]
  73. Marengo, J.A.; Soares, W.R.; Saulo, C.; Nicolini, M. Climatology of the Low-Level Jet East of the Andes as Derived from the NCEP-NCAR Re-analyses: Characteristics and Temporal Variability. J. Clim. 2004, 17, 2261–2280. [Google Scholar] [CrossRef]
  74. Marengo, J.A. On the hydrological cycle of the Amazon basin: A historical review and current state-of-the-art. Rev. Bras. De Meteorol. 2006, 21, 1–19. [Google Scholar]
  75. Marengo, J.A.; Nobre, C.A.; Culf, A.D. Climatic impacts of “Friagens” in forested and deforested areas of the Amazon basin. J. Appl. Meteorol. 1997, 36, 1553–1556. [Google Scholar] [CrossRef]
  76. Shimabukuro, Y.E.; Santos, J.R.; Formaggio, A.R.; Duarte, V.; Rudorff, B.F.T. The Brazilian Amazon Monitoring Program: PRODES and DETER Projects. In Global Forest Monitoring from Earth Observation; Achard, F., Hansen, M.C., Eds.; CRC Press—Taylor & Francis Group: Boca Raton, FL, USA, 2012; pp. 153–168. [Google Scholar] [CrossRef]
  77. Assunção, J.; Gandour, C.; Rocha, R. Deforestation Slowdown in the Brazilian Amazon: Prices or Policies? Environ. Dev. Econ. 2015, 20, 697–722. [Google Scholar] [CrossRef] [Green Version]
  78. Valeriano, D.M.; Mello, E.M.K.; Moreira, J.C.; Shimabukuro, Y.E.; Duarte, V. Monitoring tropical forest from space: The PRODES digital project. Int. Arch. Photogramm. Remote Sens. Spat. Inf. Sci. 2004, 35, 272–274. Available online: http://citeseerx.ist.psu.edu/viewdoc/summary?doi=10.1.1.183.8466 (accessed on 5 March 2019).
  79. Valeriano, D.M.; Escada, M.I.S.; Camara, G.; Amaral, S.; Maurano, L.E.; Rennó, C.D.; Almeida, C.A.; Monteiro, A.M.V. O monitoramento do desmatamento. In População e Sustentabilidade na Era das Mudanças Ambientais Globais; George, M., Ricardo, O., Alisson, B., Roberto do, C., Eds.; ABEP: São Paulo, Brazil, 2012; pp. 223–238. ISBN 978-85-85543-25-9. [Google Scholar]
  80. Kintisch, E. Improved Monitoring of Rainforests Helps Pierce Haze of Deforestation. Science 2007, 316, 536–537. [Google Scholar] [CrossRef]
  81. Parente, L.; Nogueira, S.; Baumann, L.; Almeida, C.; Maurano, L.; Affonso, A.G.; Ferreira, L. Quality assessment of the PRODES Cerrado deforestation data. Remote Sens. Appl. Soc. Environ. 2020, 21, 100444. [Google Scholar] [CrossRef]
  82. Kummerow, C.; Giglio, L. A Passive Microwave Technique for Estimating Rainfall and Vertical Structure from Space. Part I: Algorithm Description. J. Appl. Meteorol. 1994, 33, 3–18. [Google Scholar] [CrossRef]
  83. NASA. In Global Precipitation Measurement Precipitation Processing System: File Specification 2AGPROFTMI; 2014. Available online: https://storm.pps.eosdis.nasa.gov/storm/filespec.GPM.V1.pdf (accessed on 5 March 2019).
  84. NASA. Tropical Rainfall Measuring Mission Precipitation Proceassing System: File Specification 2A25. Available online: https://storm-pps.gsfc.nasa.gov/storm/data/docs/filespec.TRMM.V7.2A25.pdf (accessed on 5 March 2019).
  85. Iguchi, T.; Meneghini, R. 2016. GPM GMI (GPROF) Radiometer Precipitation Profiling L2A 1.5 Hours 13 km V05; Greenbelt; National Aeronautics and Space Administration, U.S. Government, Goddard Earth Sciences Data and Information Services Center (GES DISC): Greenbelt, Maryland, USA, 2016; Volume 2, pp. 1–65. [Google Scholar] [CrossRef]
  86. Awaka, J.; Iguchi, T.; Okamoto, K. TRMM PR Standard Algorithm 2A23 and its Performance on Bright Band Detection. J. Meteorol. Soc. Jpn. 2009, 87, 31–52. [Google Scholar] [CrossRef] [Green Version]
  87. Jaiswal, R.S.; Fredrick, S.R.; Rasheed, M.; Neela, V.S.; Zaveri, L. Study of TRMM estimated freezing level height in the 36N—36S region. Indian J. Geo-Mar. Sci. 2015, 44, 1071–1095. Available online: http://nopr.niscpr.res.in/handle/123456789/34861 (accessed on 5 March 2019).
  88. Yamamoto, M.K.; Higuchi, A.; Nakamura, K. Vertical and horizontal structure of winter precipitation systems over the western Pacific around Japan using TRMM data. J. Geophys. Res. 2006, 111, 1–16. [Google Scholar] [CrossRef]
  89. Albrecht, R.I.; Goodman, S.J.; Buechler, D.E.; Blakeslee, R.J.; Christian, H.J. Where Are the Lightning Hotspots on Earth? Bull. Am. Meteorol. Soc. 2016, 97, 2051–2068. [Google Scholar] [CrossRef]
  90. Wang, J.; Chagnon, F.J.F.; Williams, E.R.; Betts, A.K.; Renno, N.O.; Machado, L.A.T.; Bisht, G.; Knox, R.; Bras, R.L. The impact of deforestation in the Amazon basin on cloud climatology. Proc. Natl. Acad. Sci. USA 2009, 106, 3670–3674. [Google Scholar] [CrossRef] [PubMed] [Green Version]
  91. Roy, S.B. Mesoscale vegetation-atmosphere feedbacks in Amazonia. J. Geophys. Res. Atmos. 2009, 114, 1–7. [Google Scholar] [CrossRef] [Green Version]
  92. Trenberth, K.E. The definition of El Niño. Bull. Am. Meteorol. Soc. 1997, 78, 2771–2778. [Google Scholar] [CrossRef]
  93. Marengo., J.A.; Valverde, M.C. Caracterização do clima no Século XX e Cenário de Mudanças de clima para o Brasil no Século XXI usando os modelos do IPCC-AR4. Rev. Multiciência Camp. 2007, 8, 5–28. [Google Scholar]
  94. Yoon, J.H.; Zeng, N. An Atlantic influence on Amazon rainafall. Clim. Dyn. 2010, 34, 249–264. [Google Scholar] [CrossRef]
  95. Dantas, L.G.; Brito, J.I.B.; Rodrigues, H.P.; Aires, R.A.; Cabral, D.E.C. Oscilação Decadal do Pacífico e Multidecadal do Atlântico no Clima da Amazônia Ocidental. Rev. Bras. De Geográfica Física 2012, 5, 600–611. [Google Scholar] [CrossRef]
  96. Borma, L.D.S.; Nobre, C.A. Secas na Amazônia: Causas e Conseqüências; Oficina de Textos: São Paulo, Brazil, 2013; pp. 20–33. [Google Scholar]
  97. Mazzini, P.L.F.; Schettini, C.A.F. Avaliação de metodologias de interpolação espacial aplicadas a dados hidrográficos costeiros quase-sinóticos. Braz. J. Aquat. Sci. Technol. 2009, 13, 53–64. [Google Scholar] [CrossRef]
  98. Baboo, S.S.; Devi, M.R. An Analysis of Different Resampling Methods in Coimbatore, District. Glob. J. Comput. Sci. Technol. 2010, 10, 61–66. Available online: https://coreacuk/outputs/231162144 (accessed on 5 March 2019).
  99. Practical Guide to Geostatistical Mapping of Environmental Variables. EUR 22904 EN. Luxembourg (Luxembourg): Office for Official Publications of the European Communities, 2007. JRC38153. Available online: https://publications.jrc.ec.europa.eu/repository/handle/JRC38153 (accessed on 13 September 2022).
  100. Dung, P.T.; Chuc, M.D.; Thanh, N.T.N.; Hung, B.Q.; Chung, D.M. Comparison of Resampling Methods on Different Remote Sensing Images for Vietnam’s Urban Classification. Res. Dev. Inf. Commun. Technol. 2018, 15, 8–20. [Google Scholar] [CrossRef]
  101. Wang, J.; Bras, R.L.; Eltahir, E.A.B. The impact of observed deforestation on the mesoscale distribution of rain fall and clouds in Amazonia. J. Hydrometeorol. 2000, 1, 267–286. [Google Scholar] [CrossRef]
  102. Roy, S.B.; Weaver, C.P.; Nolan, D.S.; Avissar, R. A preferred scale for landscape forced mesoscale circulations? J. Geophys. Res. Atmos. 2003, 108, 1–11. [Google Scholar] [CrossRef]
  103. Garcia-Carreras, L.; Parker, D.J.; Marsham, J.H. What is the mechanism for the modification of convective cloud distributions by land surface-induced flows? J. Atmos. Sci. 2011, 68, 619–634. [Google Scholar] [CrossRef]
  104. Wilcoxon, F. Individual comparisons by ranking methods. Biom. Bull. 1945, 1, 80–83. [Google Scholar] [CrossRef]
  105. Bussab, W.O.; Morettin, P.A. Estatística Básica, 4th ed.; Atual Editora: São Paulo, Brasil, 1987. [Google Scholar]
  106. Searle, S.R.; Casella, G.; Mcculloch, C.E. Analysis of Variance Estimation for Unbalanced Data, Wiley Series in Probability and Statistics; John Wiley: New York, NY, USA, 1992; Chapter 5; pp. 168–231. [Google Scholar] [CrossRef]
  107. Santos, E.B.; Lucio, P.S.; Santos e Silva, C.M. Synoptic patterns of atmospheric circulation associated with intense precipitation events over the Brazilian Amazon. Theor. Appl. Climatol. 2017, 128, 343–358. [Google Scholar] [CrossRef]
  108. Anselin, L. Local Indicators of Spatial Association—LISA. Geogr. Anal. 1995, 27, 93–115. [Google Scholar] [CrossRef]
  109. Waldhor, T. The spatial autocorrelation coefficient Moran’s I under heteroscedasticity. Stat. Med. 1996, 15, 887–892. [Google Scholar] [CrossRef]
  110. Benedetti-Cecchi, L.; Iken, K.; Konar, B.; Cruz-Motta, J.; Knowlton, A.; Pohle, G.; Castelli, A.; Tamburello, L.; Mead, A.; Trott, T.; et al. Spatial Relationships between Polychaete Assemblages and Environmental Variables over Broad Geographical Scales. PLoS ONE 2010, 5, 1–10. [Google Scholar] [CrossRef] [PubMed] [Green Version]
  111. Chen, S.; Hong, Y.; Gourley, J.J.; Huffman, G.J.; Tian, Y.; Cao, Q.; Yong, B.; Kirstetter, P.-E.; Hu, J.; Hardy, J.; et al. Evaluation of the successive V6 and V7 TRMM multisatellite precipitation analysis over the Continental United States. Water Resour. Res. 2013, 49, 8174–8186. [Google Scholar] [CrossRef]
  112. Oliveira, J.T.; Oliveira, R.A.; Cunha, F.F.; Santos, E.S. Spatial Autocorrelation of Physical Attributes of an Oxisol. Eng. Agrícola Jaboticabal 2021, 41, 255–262. [Google Scholar] [CrossRef]
  113. Gittleman, J.L.; Kot, M. Adaptation: Statistics and a Null Model for Estimating Phylogenetic Effects. Syst. Zool. 1990, 39, 227–241. [Google Scholar] [CrossRef]
  114. Pereira, V.H.C.; Rocha, G.C.; Diniz, M.T.M.; Oliveira Júnior, M.A.C. Análise de dependência espacial da taxa de mortalidade por Covid-19 nos municípios brasileiros. Rev. Fr.-Bras. De Geogr. 2021, 52, 1–18. [Google Scholar] [CrossRef]
  115. Lean, J.; Warrilow, D. Simulation of the regional climatic impact of Amazon deforestation. Nature 1989, 342, 411–413. [Google Scholar] [CrossRef]
  116. Garcia-Carreras, L.; Parker, D.J. How does local tropical deforestation affect rainfall? Geophys. Res. Lett. 2011, 38, 1–6. [Google Scholar] [CrossRef]
  117. Segal, M.; Arritt, R.W. Nonclassical mesoscale circulations caused by surface sensible heat-flux gradients. Bull. Am. Meteorol. Soc. 1992, 73, 1593–1604. [Google Scholar] [CrossRef]
  118. Bras, R.L. Complexity and organization in hydrology: A personal view. Water Resour. Res. 2015, 51, 6532–6548. [Google Scholar] [CrossRef]
  119. Alkana, R.; Cescatti, A. Impactos climáticos biofísicos das recentes mudanças na cobertura florestal global. Science 2016, 351, 600–604. [Google Scholar] [CrossRef] [Green Version]
  120. Esau, I.N.; Lyons, T.J. Effect of sharp vegetation boundary on the convective atmospheric boundary layer. Agric. For. Meteorol. 2002, 114, 3–13. [Google Scholar] [CrossRef]
  121. Avissar, R.; Schmidt, T. An evaluation of the scale at which ground-surface heat flux patchiness affects the convective boundary layer using large-eddy simulations. J. Atmos. Sci. 1998, 55, 2666–2689. [Google Scholar] [CrossRef]
  122. Suhring, M.; Maronga, B.; Herbort, F.; Raasch, S. On the effect of surface heat-flux heterogeneities on the mixed-layer-top entrainment. Bound. Layer Meteor. 2014, 151, 531–556. [Google Scholar] [CrossRef]
  123. Rosenfeld, D.; Lohmann, U.; Raga, G.B.; O’Dowd, C.D.; Kulmala, M.; Fuzzi, S.; Reisell, A.; Andreae, M.O. Flood or Drought: How Do Aerosols Affect Precipitation? Science 2008, 321, 1309–1313. [Google Scholar] [CrossRef]
  124. Wendisch, M.; Poschl, U.; Andreae, M.O.; Machado, L.O.; Albrecht, R. Convective clouds as observed during one of the research flights of HALO during the ACRIDICON-CHUVA campaign in September 2014. The clouds were directly penetrated by HALO, in-situ instruments were mounted below the wings. Bull. Am. Meteorol. Soc. 2016, 97, 1885–1908. [Google Scholar] [CrossRef]
  125. Weaver, C.P.; Baidya, R.S.; Avissar, R. Sensitivity of simulated mesoscale atmospheric circu-lations resulting from landscape heterogeneity to aspects of model configuration. J. Geophys. Res. 2002, 107, 1–21. [Google Scholar] [CrossRef] [Green Version]
  126. Bradley, R.S.; keimig, F.T.; Diaz, H.F.; Hardy, D.R. Recent changes in freezing level heights in the Tropics with implications for the deglacierization of high mountain regions. Geophys. Res. Lett. 2004, 36, 1–4. [Google Scholar] [CrossRef] [Green Version]
  127. Reutter, P.; Su, H.; Trentmann, J.; Simmel, M.; Rose, D.; Gunthe, S.S.; Wernli, H.; Andreae, M.O.; Pöschl, U. Aerosol- and updraft-limited regimes of cloud droplet formation: Influence of particle number, size and hygroscopicity on the activation of cloud condensation nuclei (CCN). Atmos. Chem. Phys. 2009, 9, 7067–7080. [Google Scholar] [CrossRef] [Green Version]
  128. Zheng, Y.; Rosenfeld, D. Linear relation between convective cloud base height and updrafts and application to satellite retrievals. Geophys. Res. Lett. 2015, 42, 6485–6491. [Google Scholar] [CrossRef]
Figure 1. Location and topography of the study area (Rondônia, Brazil).
Remotesensing 14 05353 g001
Figure 2. Land cover classifications according to PMDA for the years 2000 (a) and 2020 (b), Rondônia, Brazil.
Remotesensing 14 05353 g002
Figure 3. Standardized anomalies for the JJA quarter of spatialized precipitation for the period 2000 to 2014, Rondônia, Brazil.
Remotesensing 14 05353 g003
Figure 4. Map of land use and land cover with transition zone of 10 km (a) and 20 km (b). Schematic diagram of the 10 and 20 km transition zones (c).
Remotesensing 14 05353 g004aRemotesensing 14 05353 g004b
Figure 5. Bar graphs for the Surface Rain (SP) parameter in mm/h, for the years 2004, 2005, 2006, 2007, 2010, and 2012, considering the P50, P95, and P99 percentiles for 10 km (a) and 20 km (b) Transition Zones. Rondônia, Brazil. The barbell represents ± 1 standard deviation.
Remotesensing 14 05353 g005
Figure 6. Bar graphs for the IWP parameter in kg/m2, for the years 2004, 2005, 2006, 2007, 2010, and 2012, considering the P50, P95 and P99 percentiles for 10 km (a) and 20 km (b) Transition Zones. Rondônia, Brazil. The barbell represents ± 1 standard deviation.
Remotesensing 14 05353 g006
Figure 7. Bar graphs for the RWP parameter in Kg/m2, for the years 2004, 2005, 2006, 2007, 2010, and 2012, considering the P50, P95, and P99 percentiles for 10 km (a) and 20 km (b) Transition Zones, Rondônia, Brazil. The barbell represents represent ± 1 standard deviation.
Remotesensing 14 05353 g007
Figure 8. Bar graphs of the FLH parameter in meters (m), for the years 2004, 2005, 2006, 2007, 2010, and 2012, considering the P50, P95, and P99 percentiles for 10 km (a) and 20 km (b) Transition Zones, Rondônia, Brazil. The barbell represents represent ± 1 standard deviation.
Remotesensing 14 05353 g008
Figure 9. Bar graphs for the Rainfall Type (TC) parameter, for the years 2004, 2005, 2006, 2007, 2010, and 2012, considering 10 km (a) and 20 km (b) Transition Zones, Rondônia, Brazil.
Remotesensing 14 05353 g009
Figure 10. Conceptual model of the effects of Amazon deforestation on cloud microphysical parameters. Surface heterogeneity due to deforestation creates horizontal temperature gradients producing precipitation events in a convective manner, possibly originating from mesoscale circulations leading to an increase/decrease in cloud microphysical parameters.
Remotesensing 14 05353 g010
Table 1. Characteristics of 2A-CLIM and 2A25-TRMM products.
Geographic coverage38°N–38°S
Temporal resolution~16 orbits day−1
Spatial resolution~5 km
Parameters–Abbreviation (Product)Rain Water Path—RWP *
Ice Water Path—IWP *
Surface Precipitation Rate—SP **
Freezing Level Height—FLH **;
Rain Type—RT **.
* Product 2A-CLIM; ** Product 2A25.
Table 2. Tests, descriptive statistics, and percentage variation for rainfall rates (SP) in mm/h for Forest, Transition, and Deforested surfaces.
Surfaces10 km20 km
P50P95P99P50P95P99
Forest0.143 ± 0.016.187 ± 0.1511.530 ± 0.450.139 ± 0.015.764 ± 0.1210.539 ± 0.4
Transition0.146 ± 0.027.020 ± 0.1312.753 ± 0.590.146 ± 0.017.224 ± 0.513.347 ± 0.6
Deforested0.111 ± 0.026.292 ± 0.1610.966 ± 0.370.118 ± 0.016.331 ± 0.1510.594 ± 0.4
Percentage Change (%)
(T-F)/F+2.0 *+13.5 *+10.6 *+5.2 *+25.3 *+26.6 *
(T-D)/D+23.9 *+11.6 *+16.3 *+19.0 *+14.1 *+25.9 *
(D-F)/F−22.4 *+1.7 **−4.9−14.8 *+9.8 *+0.52 *
WMW Test: * Significant at 1%; ** Significant at 5%.
Table 3. Tests and descriptive statistics percentage variation in the amount of Ice Water Path (IWP) kg/m2, for Forest (F), Transition (T), and Deforested (D) surfaces.
Surfaces10 km20 km
P50P95P99P50P95P99
Forest0.019 ± 0.0081.650 ± 0.032.889 ± 0.110.018 ± 0.0091.574 ± 0.032.583 ± 0.09
Transition0.021 ± 0.0091.867 ± 0.043.306 ± 0.150.021 ± 0.0091.900 ± 0.043.476 ±0.14
Deforested0.020 ± 0.0071.664 ± 0.042.958 ± 0.150.021 ± 0.0071.661 ± 0.052.721 ± 0.16
Percentage Change (%)
(T-F)/F+10.5 *+13.2 *+14.6 *+15.1 *+20.7 *+34.6 *
(T-D)/D+4.8 *+12.2 *+11.8−0.5+14.4 *+27.9 *
(D-F)/F+5.3 *+0.85+2.6+15.7 *+5.5 *+5.3
WMW Test: * Significant at 1%; ** Significant at 5%.
Table 4. Tests and descriptive statistics percentage variation in Rain Water Path (RWP) for Forest, Transition, and Deforested surfaces.
Surfaces10 km20 km
P50P95IPE99P50P95P99
Forest0.035 ± 0.0041.677 ± 0.043.178 ± 0.130.034 ± 0.0031.577 ± 0.032.889 ± 0.12
Transition0.036 ± 0.0061.921 ± 0.043.640 ± 0.140.036 ± 0.0051.981 ± 0.043.455 ± 0.14
Deforested0.028 ± 0.0041.732 ± 0.053.155 ± 0.130.029 ± 0.0051.693 ± 0.042.821 ± 0.13
Percentage Change (%)
(T-F)/F+2.9 *+14.6 *+14.5 *+5.9 *+25.6 *+33.1 *
(T-D)/D+22.2 *+10.9 *+15.4 **+19.4 *+17.1 *+36.3 *
(D-F)/F−20.0 *+3.3 **−0.7−14.7 *+7.4 *−2.4
WMW Test: * Significant at 1%; ** Significant at 5%.
Table 5. Tests and descriptive statistics percentage change in Freezing Level Height (FLH) for Forest, Transition, and Deforested surfaces.
Surfaces10 km20 km
P50P95P99P50P95P99
Forest4679.1 ± 2024556.8 ± 2264413.5 ± 31.84696.5 ± 2264573.4 ± 2044458.0 ± 39
Transition4802.1 ± 1454788.6 ± 1574823.5 ± 1074798.1 ± 1244805.1 ± 1784569.5 ± 252
Deforested4817.1 ± 694880.8 ± 2264751.0 ± 0.04770.0 ± 1694813.5 ± 2724668.0 ± 174
Percentage Change (%)
(T-F)/F+2.6 **+5.1 *+9.3+2.2+5.1 **+2.5
(T-D)/D−0.32−1.9+1.5+0.6−0.2−1.3
(D-F)/F+3.0+7.1 *+7.7+1.6+5.3 **+3.8**
WMW Test: * Significant at 1%; ** Significant at 5%.
Publisher’s Note: MDPI stays neutral with regard to jurisdictional claims in published maps and institutional affiliations.

