Article

Capability of Phenology-Based Sentinel-2 Composites for Rubber Plantation Mapping in a Large Area with Complex Vegetation Landscapes

1
Shenzhen Institutes of Advanced Technology, Chinese Academy of Sciences, Shenzhen 518055, China
2
Beidou Research Institute, Faculty of Engineering, South China Normal University, Foshan 528000, China
3
Institute of Agricultural Information and Economics, Shandong Academy of Agricultural Sciences, Ji’nan 250100, China
*
Author to whom correspondence should be addressed.
Remote Sens. 2022, 14(21), 5338; https://doi.org/10.3390/rs14215338
Submission received: 19 August 2022 / Revised: 11 October 2022 / Accepted: 18 October 2022 / Published: 25 October 2022

Abstract

:
Mapping rubber plantations in a large area is still challenging in high-cloud-cover and complex-vegetation landscapes. Existing studies were often confined to the discrimination of rubber trees from natural forests and rarely concerned other tropical tree species. The Sentinel-2 constellation, with improved spatial, spectral, and temporal resolution, offers new opportunities to improve previous efforts. In this paper, four Hainan Sentinel-2 composites were generated based on the detailed phenological stages delineation of rubber trees. The random forest classifier with different phenological stage combinations was utilized to discuss the capability of Sentinel-2 composites to map rubber plantations. The optimal resultant rubber plantation map had a producer’s accuracy, user’s accuracy, and F1 score of 81%, 84.4%, and 0.83, respectively. According to the rubber plantation map in 2020, there was a total of 5473 km2 rubber plantations in Hainan, which was 2.93% higher than the statistical data from the Hainan Statistical Yearbook. According to the Hainan Statistical Yearbook, the area-weighted accuracy at the county level was 82.47%. The mean decrease in accuracy (MDA) was used to assess the feature importance of the four phenological stages. Results showed that the recovery growth stage played the most important role, and the resting stage was the least important. Moreover, in terms of the combinations of phenological stages, any dataset group with two phenological stages was sufficient for rubber tree discrimination. These findings were instrumental in facilitating the rubber plantation mapping annually. This study has demonstrated the potential of Sentinel-2 data, with the phenology-based image-compositing technique, for mapping rubber plantations in large areas with complex vegetation landscapes.

Graphical Abstract

1. Introduction

The rubber tree (Hevea brasiliensis) is the primary source of natural rubber, an essential industrial raw material. With the increasing demand for natural rubber, rubber plantations have expanded to almost every tropical forest region in the world. The expansion of rubber plantations has contributed to local economic development. However, the transition from natural forests to rubber plantations has significant ecological impacts on the water balance, carbon cycle, biodiversity, and ecosystem function [1,2,3,4]. Knowledge of the spatial extent and dynamic of rubber plantations is significant to ensure the sustainability of the natural rubber industry, including plantation management, rubber futures, national economic policy, and ecological conservation.
Remote sensing technology is an important tool in mapping rubber plantations at local and regional scales [5]. Since 2012, rubber’s unique phenological characteristics have been widely exploited in the delineation of rubber plantations [5]. When rubber trees were introduced from the Amazon to Southeast Asia in the nineteenth century, rubber trees became deciduous in the winter or dry season with seasonal drought and cold stresses [6]. For rubber trees, most leaves fall off during the defoliation process before new leaves emerge in the refoliation process [7]. In contrast, most other tropical forests are evergreen forests, having strong resistance against influences from the physical environment, such as temperature and precipitation. Multiple phenology-based features using vegetation indices [8,9,10,11,12,13,14,15,16] have been exploited to map rubber plantations and have shown some advantages [5]. (1) It is easier to distinguish rubber trees from cropland and natural forest [17]; (2) it helps to identify and outline rubber plantations within fragmented tropical mountainous lands [12].
Hainan Province is China’s second-largest natural rubber planting area after Yunnan Province. Several studies have been published to map rubber plantations in Hainan Province [8,13,15,16,18,19,20]. Among these studies, the decision tree classifier with multiple phenology vegetation indices was the most common approach. Dong et al. [16] and Chen et al. [18] utilized the L-band PALSAR product to map forests and then extracted rubber plantations from the forest map according to their phenological features based on MODIS and Landsat data, respectively. Han et al. [13] developed a simple decision rule based on band value changes, vegetation index changes, and phenological phase changes (defoliation and foliation) to distinguish rubber plantations from other land-cover types. Cui et al. [8] explored the suitability of Planet Scope imagery for mapping rubber plantations, and the spectral features, index features, and textural features were comprehensively utilized. These studies obtained high classification accuracies of 85%, 95.2%, 92.17%, and 95.18%, respectively, but there are still three major issues that influence the rubber plantation mapping results. (1) The mapping of rubber plantations in previous studies was mainly based on MODIS [16] or Landsat data [13,15,18]. The 250 m spatial resolution of MODIS products is relatively coarse, making it difficult to delineate the border of rubber plantations in Hainan Province with fragmented vegetation landscapes. As for Landsat data, it is difficult to obtain valid cloud-free imageries due to the cloudy weather condition in Hainan Province, the short period of rubber defoliation, and the 16-day repeat cycle of Landsat satellites. (2) Previous studies [8,9,13,15,16,21] focused on the discrimination of deciduous rubber plantations from evergreen natural forests, but little consideration was given to other tropical tree species. Hainan Province is abundant with tropical tree species, such as Eucalyptus, Areca Palm, and Coconut Palm, and they are widely distributed. Some tropical economic forests were mentioned briefly [16,22], but the difference between rubber tree plantations and the economic forests has not yet been explored. (3) The defoliation and foliation periods were regarded as the optimal timing for distinguishing rubber trees from evergreen natural forests [8,11,23]. These two key periods were also called the rubber defoliation and foliation (RDF) period [18], leaf-off and leaf-on phases [24], senescence and regreening periods [22], and the wintering period [5,25]. However, the timing of the two periods was defined differently, for example, late February to April [15], January to March [10,15], January to April [8], December to late February [23], and November to March [11]. This confusion may affect the selection of imageries.
As stated above, Hainan Province is a large cloudy area with complex vegetation landscapes. Cloud-free multiphenology imageries are necessary to generate an accurate map of rubber plantations, and these imageries must be able to distinguish rubber trees from other tropical tree species. Compared to MODIS and Landsat data, Sentinel-2 can acquire optical imagery at high spatial (maximum 10 m) and temporal resolution (2–5 days revisit time at the equator). The combination of freely available satellite imagery, high resolution, a swath width of 290 km, and frequent revisit times has greatly enhanced the feasibility of mapping rubber plantations in large cloudy areas. In addition, Sentinel-2 incorporates three new spectral bands in the red-edge region, centered at 705, 740, and 783 nm, respectively. Recently, many studies have investigated the utility of Sentinel-2 imageries for precise regional-tree-species mapping [26,27,28,29,30]. The novel red-edge bands are significant for tree species classification [26,31,32,33]. Particularly, multitemporal Sentinel-2 [26], dense Sentinel-2 time series [28], and phenology/seasonal Sentinel-2 composites [29] can improve the classification of tree species. For rubber plantation mapping, Xiao et al. showed the significant potential of Sentinel-2 imageries with red-edge spectral indices [9]. However, the nonrubber tree species distinguished from rubber plantations were still only natural forests.
This study’s main objective was to investigate the utility of phenology-based Sentinel-2 composites for rubber plantation mapping in a large cloudy area with complex vegetation landscapes. Specifically, the following questions were addressed: Which phenological stage of rubber trees is important for rubber plantation mapping? What combinations of rubber tree phenological stages contribute to increasing mapping results? Which bands of Sentinel-2 are important for rubber plantation mapping? How does the band importance of Sentinel-2 vary over the phenological stages of rubber trees?

2. Materials and Methods
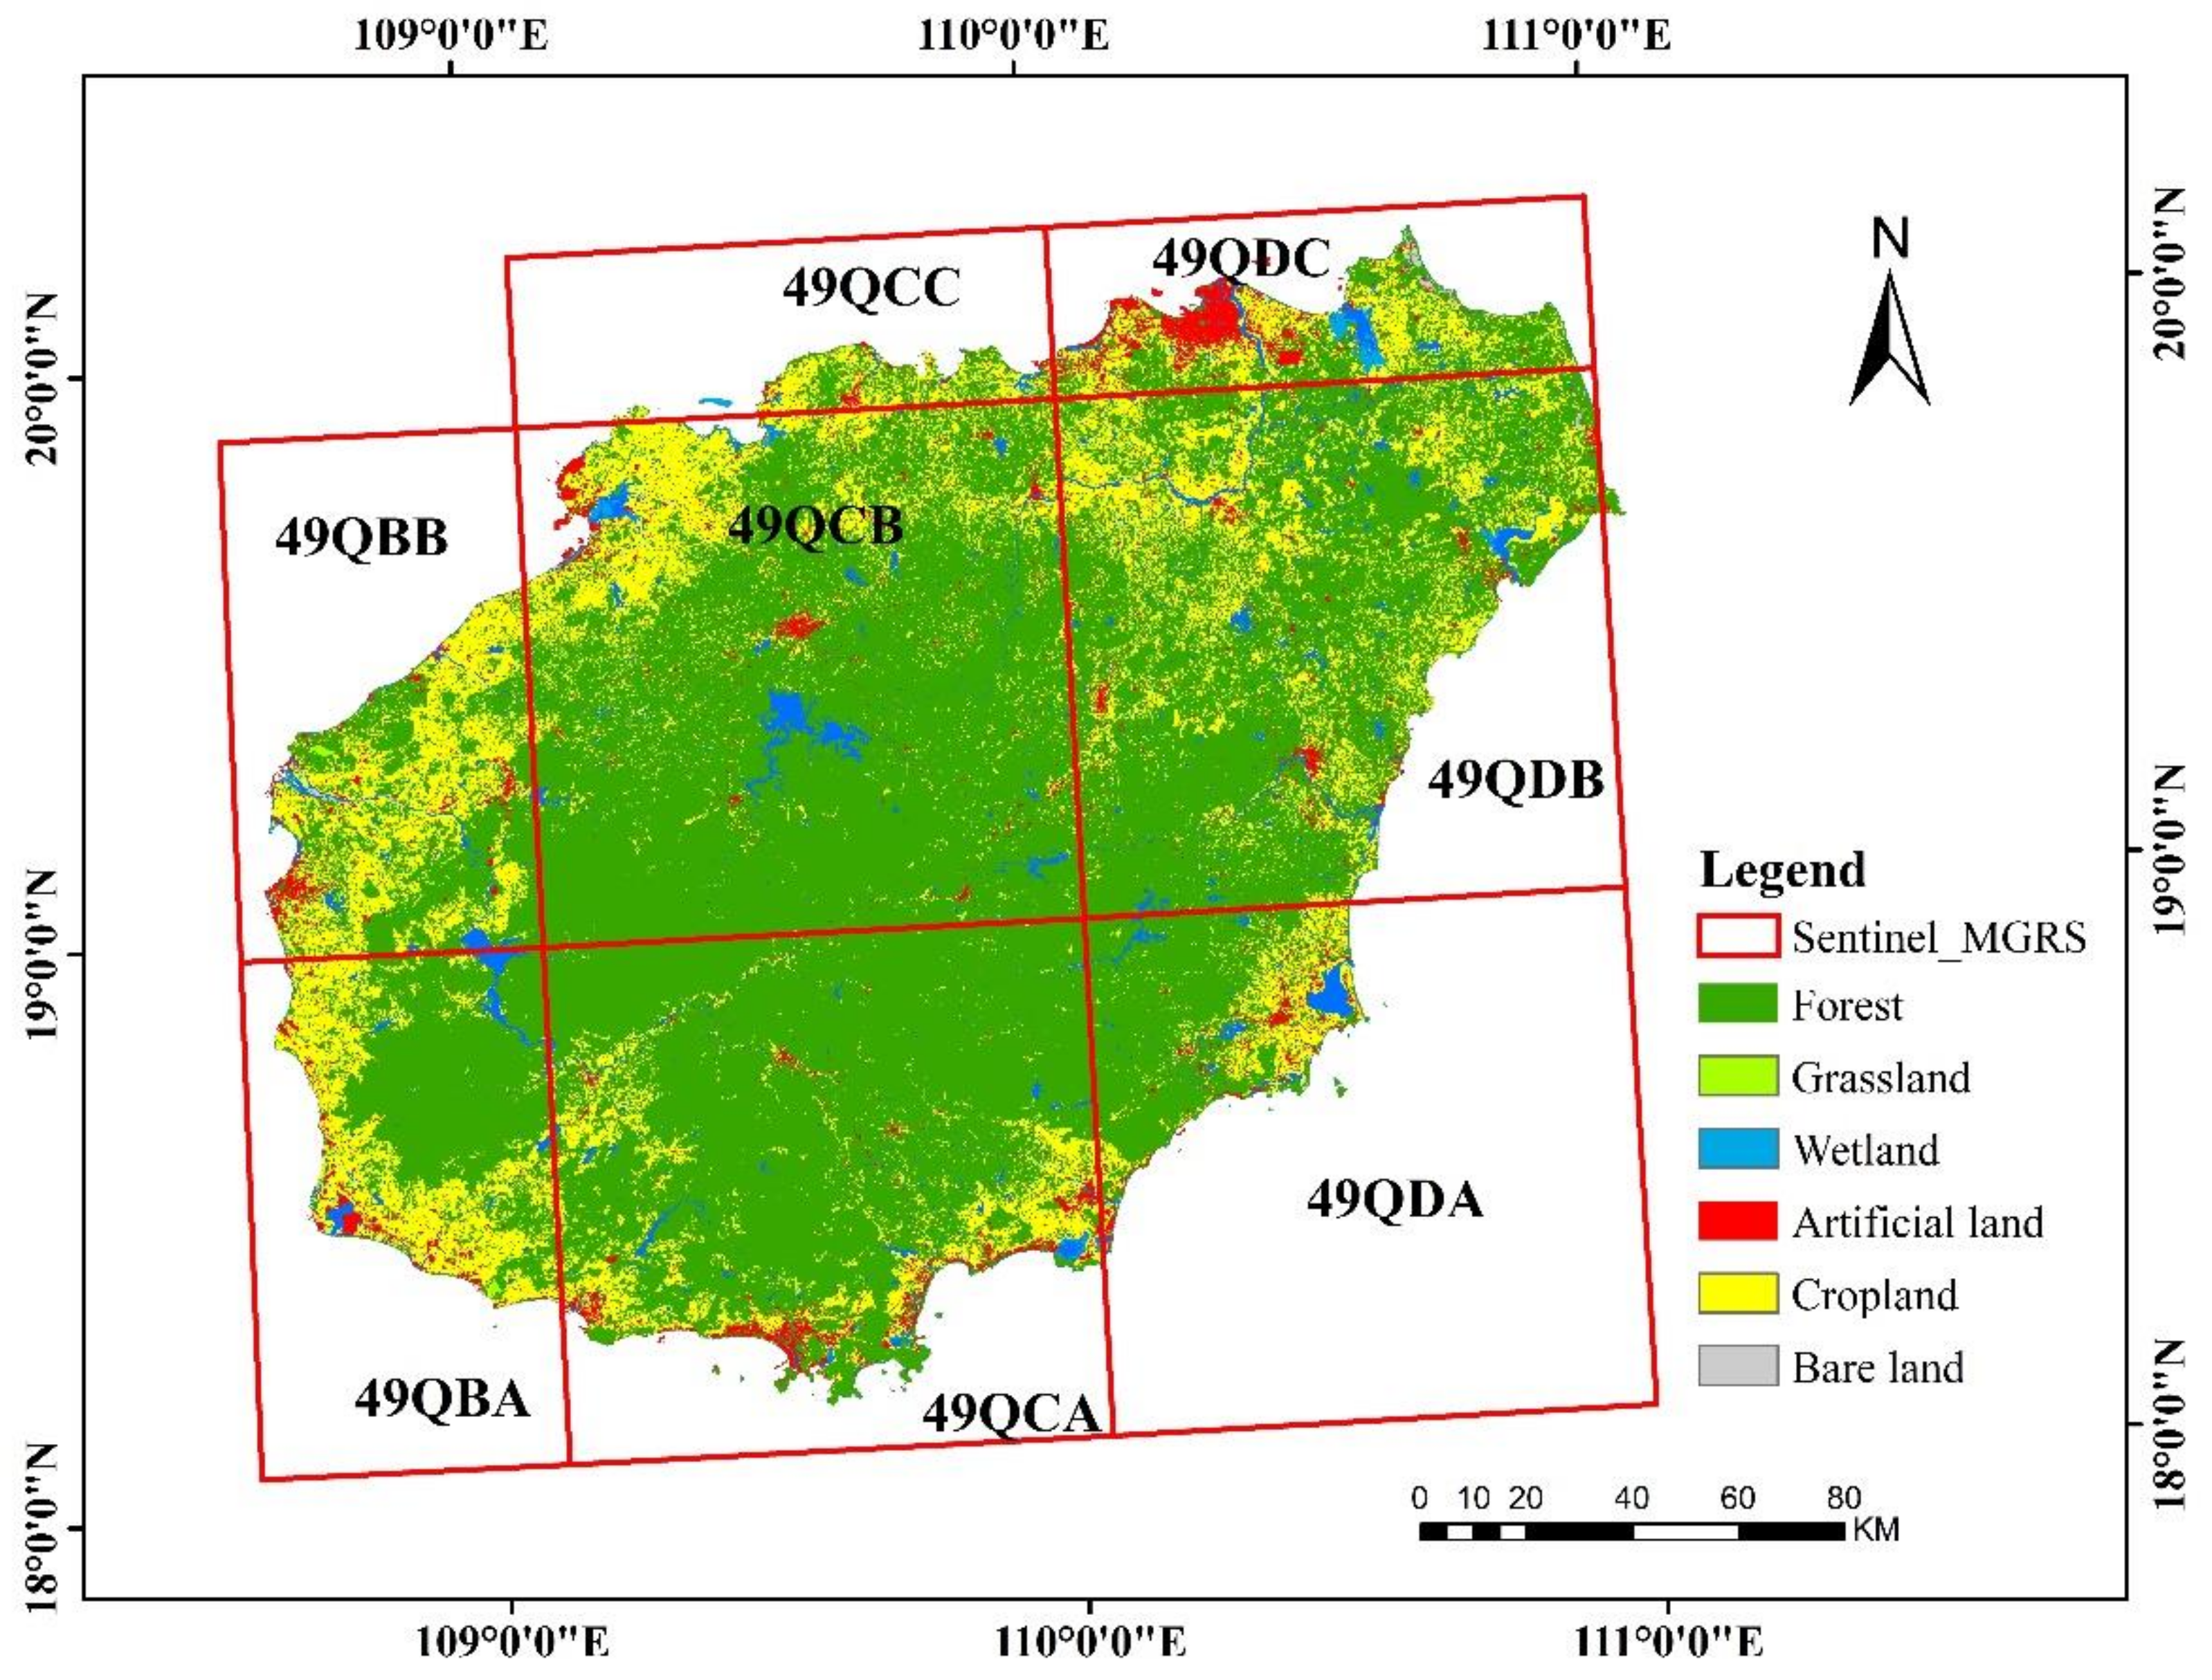
2.1. Study Area

Hainan Province is located in the southern part of China (Figure 1). It is characterized by a marine tropical monsoon climate. The annual average precipitation is more than 1600 mm, and the mean annual temperature is 23~25 °C. The annual minimum temperature is generally above 5 °C.
Before the 20th century, Hainan Province was dominated by tropical natural forests, and rubber trees were introduced from British Malaysia. Since the 1950s, rubber trees have been planted in large quantities through the deforestation of natural forests. After half a century of development, Hainan Province has become the second-largest rubber-planting area in China after Yunnan Province, and natural rubber production accounts for about 40.5% of China’s total production.
The deciduous habit of rubber trees is one of its most critical phenological characteristics, allowing annual leaf renewal [34]. Generally, the defoliation periods of rubber trees last for about one month between February and March [21]. In this study, according to rubber trees’ phenology and growth rhythms [35], the growth cycle of rubber trees was divided into four phenological stages: ① resting phase, ② recovery growth phase, ③ vigorous growth phase, and ④ slowdown growth phase. The photos in Figure 2 show the status of rubber trees at the four phenological stages, respectively. Detailed descriptions of the four phenological stages and their timing will be presented in Section 3.1.
In addition to rubber trees, there are a variety of tropical economic tree species in Hainan Province, such as Eucalyptus, Coconut, Areca nut, and Litchi. All the economic forests, including rubber trees, are widely distributed in the study area, with complex and fragmented landscapes.

2.2. Data

2.2.1. Sentinel-2 Data

The Sentinel-2 mission is based on a constellation of two satellites, Sentinel-2A (S2A) and Sentinel-2B (S2B). Combining S2A and S2B can provide a five-day revisit time at the equator and better temporal resolution at higher latitudes. In this study, we collected all the Sentinel-2 Level 2A products of the study area acquired from 1 January 2019 to 31 December 2021. The Sentinel-2 Level 2A products were downloaded from the Copernicus Open Access Hub of the European Space Agency (ESA). The Level-2A product is composed of 100 × 100 km2 tiles, and Hainan Province is covered by eight tiles, as shown in Figure 3.
Hainan Province has cloudy weather all year round. The average percentages of Sentinel-2 images with cloud cover (CC) less than 10% for the four phenological stages were 29.57%, 14.36%, 14.21%, and 16.65%, respectively. Therefore, for each phenological stage, it is tough to obtain less-cloud or cloud-free Sentinel-2 images for all eight tiles. In this study, to obtain four cloud-free composites for the entire study area in Section 2.4.1, Sentinel-2 images with an estimated CC ≤ 75% were selected for further preprocessing.
The preprocessing of Sentinel-2 imageries included cloud and cloud shadow masking. The cloud masks were converted from the layers of Sentinel-2 cloud probability, and the cloud shadow masks were generated based on the intersection of cloud projection and near-infrared (NIR) band darkness. Finally, the 20 m bands were resampled to 10 m resolution using nearest neighbor resampling, and the 10 Sentinel-2 10/20 m bands (B2, B3, B4, B5, B6, B7, B8, B8A, B11, and B12) were merged into a single raster dataset.

2.2.2. MODIS Data

Due to the frequent cloudy weather in Hainan Province, it is tough to construct consistent year-long Sentinel-2 time series with reliable data quality. Therefore, in this study, we used coarse spatial resolution MODIS data to delineate the phenological stages of rubber trees. The timing of the lowest NDVI according to the MODIS-NDVI time series curve has been used to determine the periods of rubber tree defoliation and foliation [8,13,36]. This study used two MODIS-NDVI products with 250 m resolution, MOD13Q1-NDVI and MYD13Q1-NDVI. The two products showed high compatibility [37,38], and it has been shown that they can be used in combination [25,39]. These products were obtained through the online MODIS data repository (https://modis.gsfc.nasa.gov/data/dataprod/mod13.php, accessed on 3 March 2022).
The two NDVI products for the study area from January 2019 to December 2021 were rearranged by the property of start time. Subsequently, the combined NDVI time series were smoothed using the locally linear regression smoothing technique [40].

2.2.3. Land Cover Data

The main objective of this study was to distinguish rubber plantations from other tropical tree species. Therefore, we used the Hainan land cover dataset from “ChinaCover2020” to mask non-forest land (Figure 3). The “ChinaCover” product was generated based on an object-based approach [41,42], and the latest version is “ChinaCover2020” with a 10 m resolution. The classification accuracy of the Hainan land cover dataset was evaluated using 1200 independent ground survey samples (712 samples for forest and 488 for non-forest) that were collected using a random sampling approach [43]. The producer’s accuracy and user’s accuracy for the forest category were higher than 95%. Therefore, the forest map can serve as a reliable base dataset for rubber plantations’ delineation.

2.2.4. Rubber Plantations’ Area Data from Statistical Yearbook

The Statistical Bureau of Hainan Province (SBHP) published annual reports on the rubber plantations’ statistical data [44]. The data on rubber plantations were from the Statistical Survey System on Agriculture, Forestry, Animal Husbandry and Fishery of Hainan Province. Statistical departments at all levels collected data by means of sample surveys, key surveys, or comprehensive surveys and reported them layer by layer according to the actual local conditions.
The area of rubber plantations was recorded for each of the 18 counties in Hainan Province. According to the statistical yearbook, in 2020, the rubber plantation area was 5316.72 km2. In this study, this dataset was used to assess the accuracy of the resultant rubber plantation map at the county level.

2.2.5. Field Survey Data

Two field works were conducted in August 2017 and October 2020. The primary purpose of the field surveys was to collect samples for updating the “ChinaCover” product. As shown in Figure 1, the field surveys cover all counties in Hainan Province. The reference samples were selected following two rules: the samples were located at the center of homogeneous forest patches, and all the trees in a plot were mature forests.
The typical tropical tree species in Hainan Province are Rubber tree, Eucalyptus, Litchi, Coconut Palm, Areca Palm, and Casuarina. In addition, the natural forest is mainly distributed in the central mountainous areas of Hainan, which the field surveys did not cover, so we collected the natural forest samples from the high-resolution images in Google Earth, as shown in Figure 1.
In total, 2604 reference samples were collected. All samples were divided into two sets, one designed for training and the other for assessing classification accuracy. For convenience, coded names were given for each tree species, as shown in Table 1.

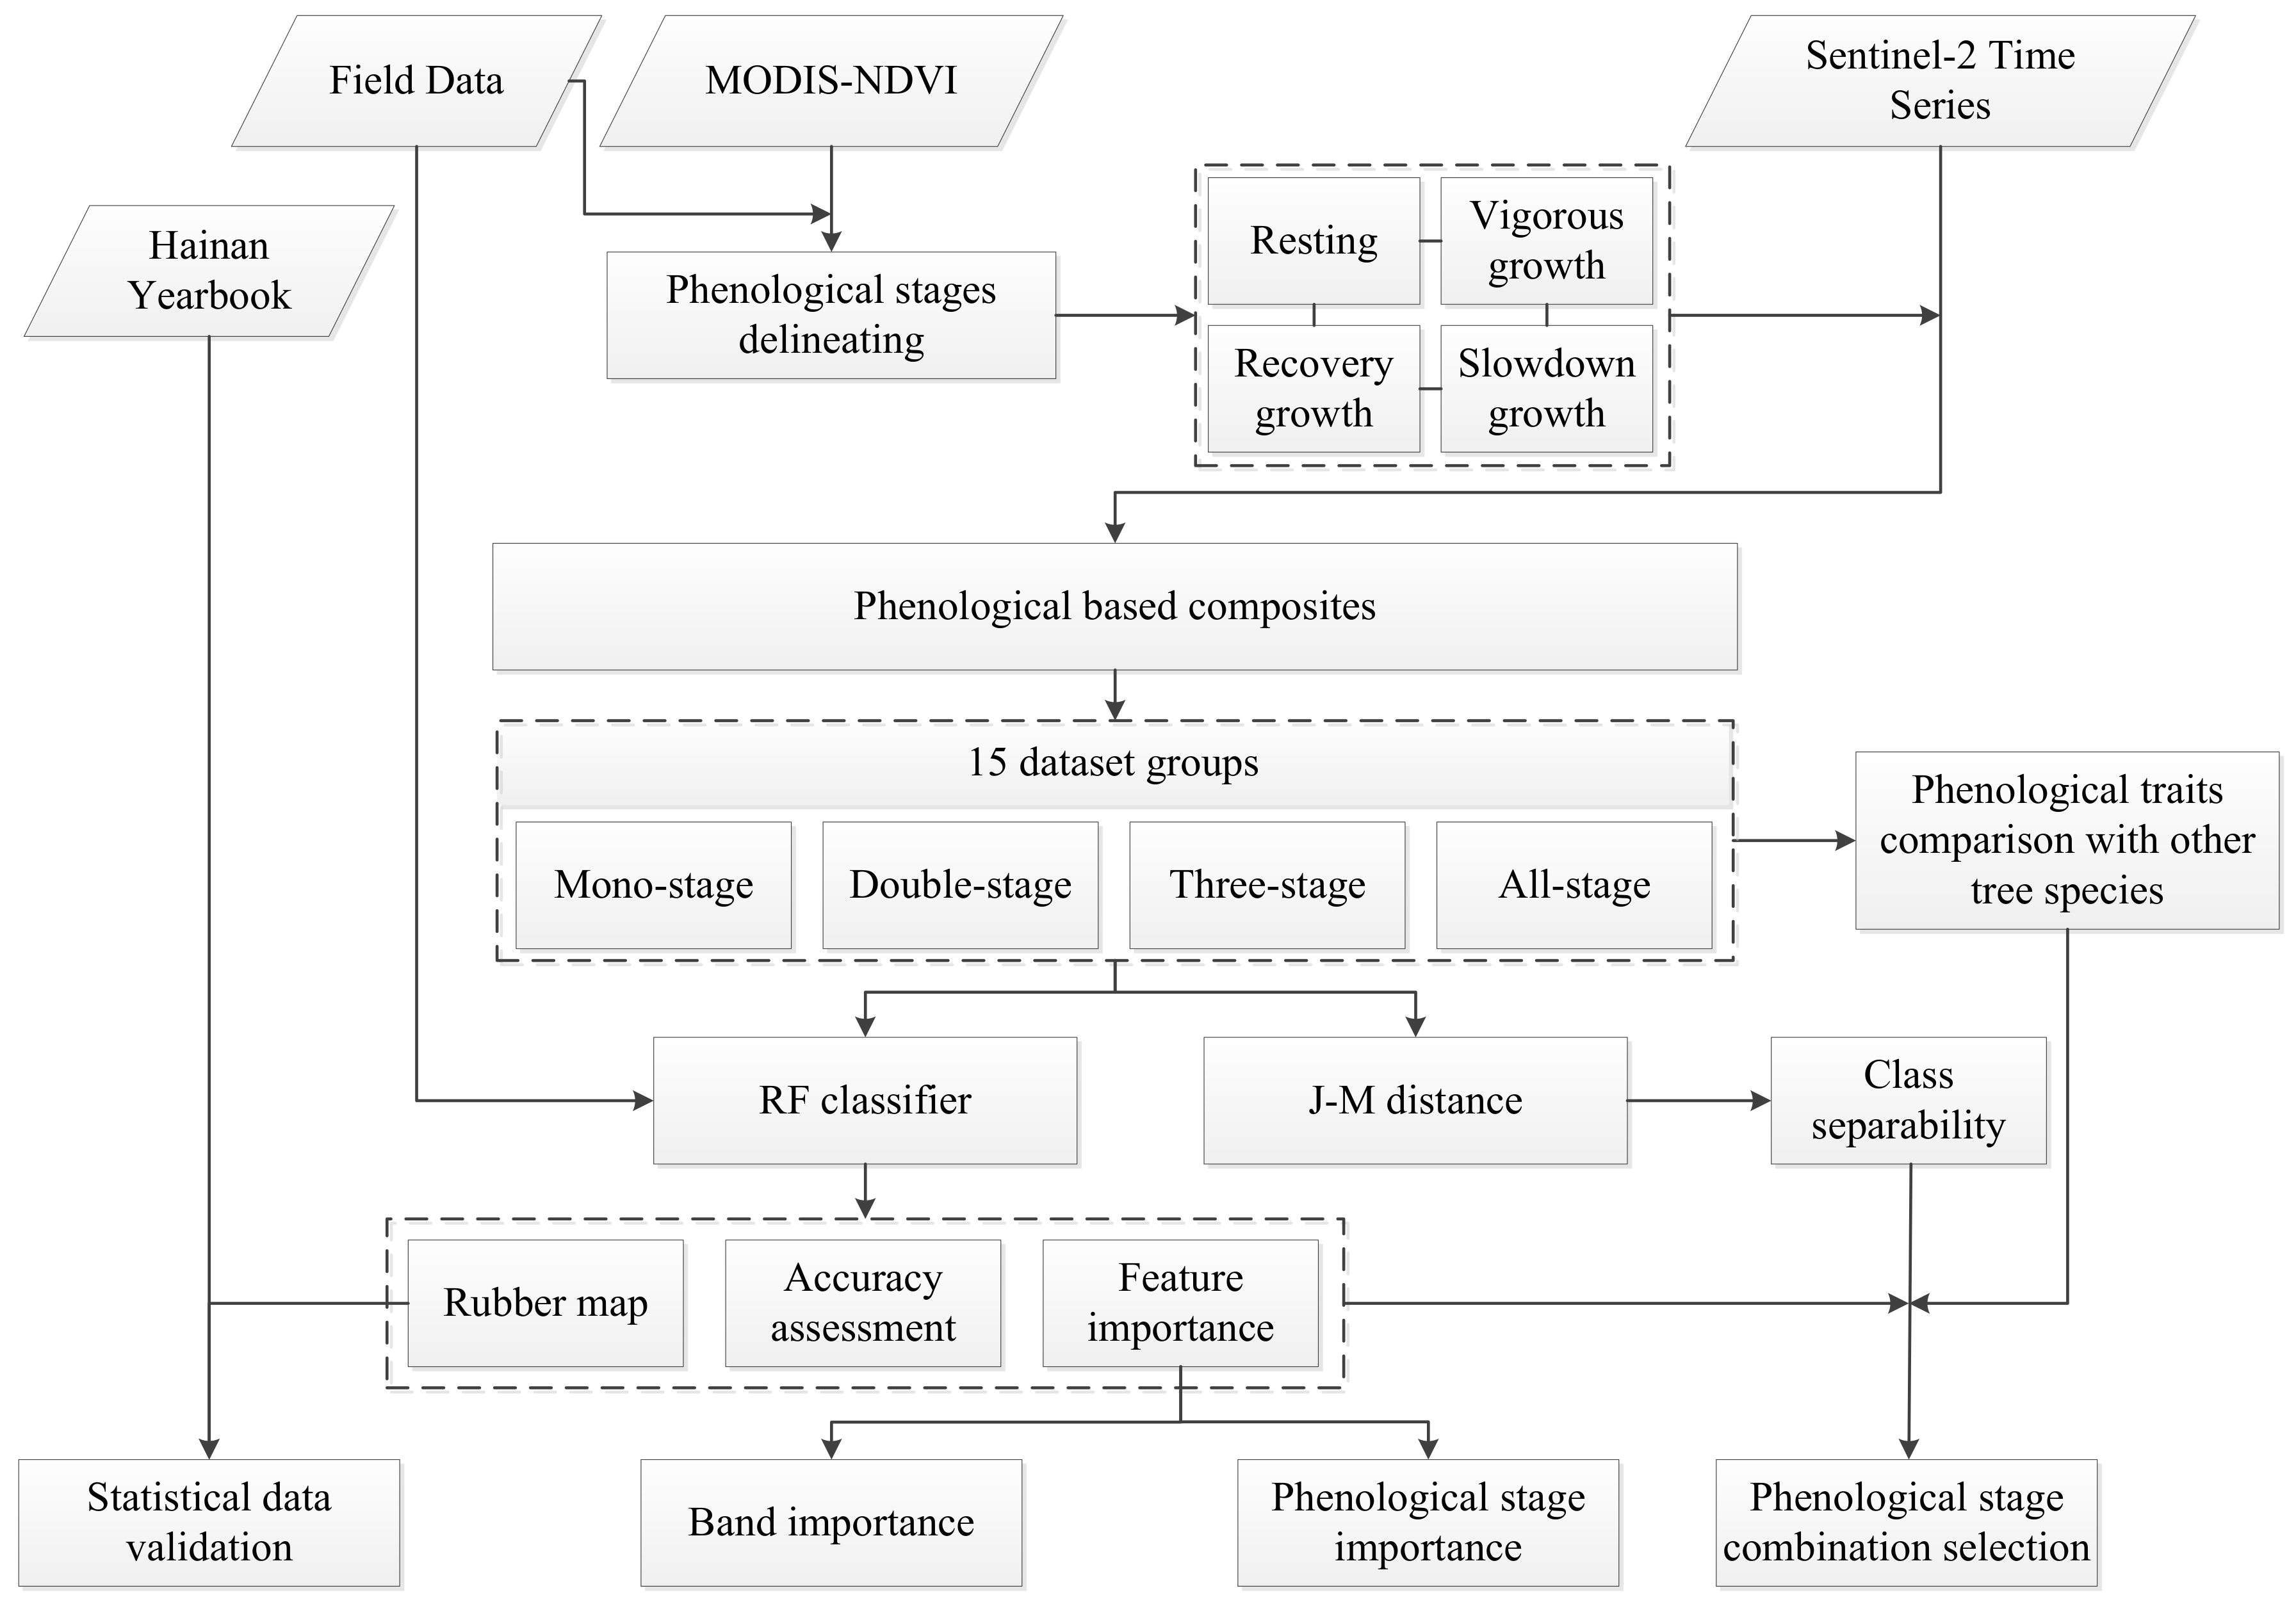
2.3. Experimental Design

A comprehensive overview of this study is shown in Figure 4. First, the temporal behaviors based on MODIS-NDVI were studied to delineate the phenological features of rubber trees and determine the timing of the four phenological stages. Next, phenology-based image compositing was used to generate four Sentinel-2 composites, and 15 dataset groups were generated with different phenological stage combinations. Then, using the random forest classifier and Jeffries Matusita distance, the classification accuracy and class separability were analyzed for the 15 dataset groups. After that, the spatial distribution of the resultant rubber plantation map was further validated based on the Statistical Yearbook of Hainan Province in 2020. At last, the mean decrease in accuracy was used to assess the feature importance of Sentinel-2 bands and rubber trees’ phenological stages for rubber plantation mapping.

2.4. Methodology

2.4.1. Phenology-Based Image Compositing

Image compositing is an approach to reduce a series of images into a single image [45]. Recently, it has been introduced to generate cloud-free Sentinel-2 composite datasets at large scales [46,47]. Additionally, the phenological and seasonal Sentinel-2 composites have been used for tree species mapping [29].
In this study, we adopted the technique of median compositing to generate compositing images for each Sentinel-2 tile and phenological stage. The temporal intervals in the compositing process were set following the timing of the corresponding phenological stages, which will be presented in Section 3.1. When there was no good-quality observation during the phenological stage, we filled the data gap with the nearest good-quality observation in the Sentinel-2 time series. At last, four Hainan Sentinel-2 composites were generated based on the seamless mosaic tool in ENVI 5.3. The four composites were named as ① Resting, ② Recovery, ③ Vigorous, and ④ Slowdown, respectively, corresponding to the four phenological stages.
To further evaluate the importance of the different phenological stages and the potential of multistage combinations for rubber plantation mapping, the four Hainan Sentinel-2 composites were rearranged as 15 dataset groups: four mono-stage images, six double-stage combinations, four three-stage combinations, and one all-stage combination. For convenience, the 15 dataset groups were named by the serial numbers of the corresponding phenological stages. Taking the all-stage combination as an example, it was called ①②③④ for short.

2.4.2. Class Separability Based on Jeffries Matusita Distance

The performance of the 15 dataset groups in separating rubber trees from other tree species was assessed using the Jeffries Matusita (JM) distance in this study. The JM distance is the average distance between two class density functions, and it can be calculated as [48]:
J M i j = 2 1 e B i j
where the B i j is Bhattacharyya distance as
B i j = 1 8 μ i μ j T c i + c j 2 1 μ i μ j + 1 2 l n 1 2 det c i + c j det c i det c j
where μ i and c i are the mean and covariance matrix of the i-th category. The JM distance is a parametric test, ranging between 0 and 2. It provides an easy comparison of class separability, with 0 indicating no separability and 2 complete separation.

2.4.3. Random Forest Classifier and Feature Importance

In this study, the random forest (RF) classifier was used to map rubber plantations. RF is a supervised machine learning algorithm for classification and regression. It is an ensemble of decision trees, which are constructed based on the bootstrap aggregated sampling (bagging). RF takes the majority vote of the decision trees for classification. In this study, the randomForest package in the software R was employed to build the RF model [49]. Unified parameters were set in the RF model for all 15 dataset groups. The number of features for each split (parameter mtry) was set as the square root of the total feature number. The number of decision trees (ntree) in the RF model was set to 500, as this value was commonly used for remote sensing classification [29].
In addition, the mean decrease in accuracy (MDA) was used to assess the importance of the 10 Sentinel-2 bands and four phenological stages for rubber plantation discrimination. MDA, also known as permutation importance, is one of the most efficient feature importance measures for the random forest.

2.4.4. Accuracy Assessment

To assess the performance of Sentinel-2 images on rubber plantations discrimination, we carried out two levels of classification accuracy. (1) Confusion matrix based on the validating samples, with the estimated user’s accuracy (UA), producer’s (PA) accuracy, and F1 score; (2) statistical data validation at the county scale.

3. Results

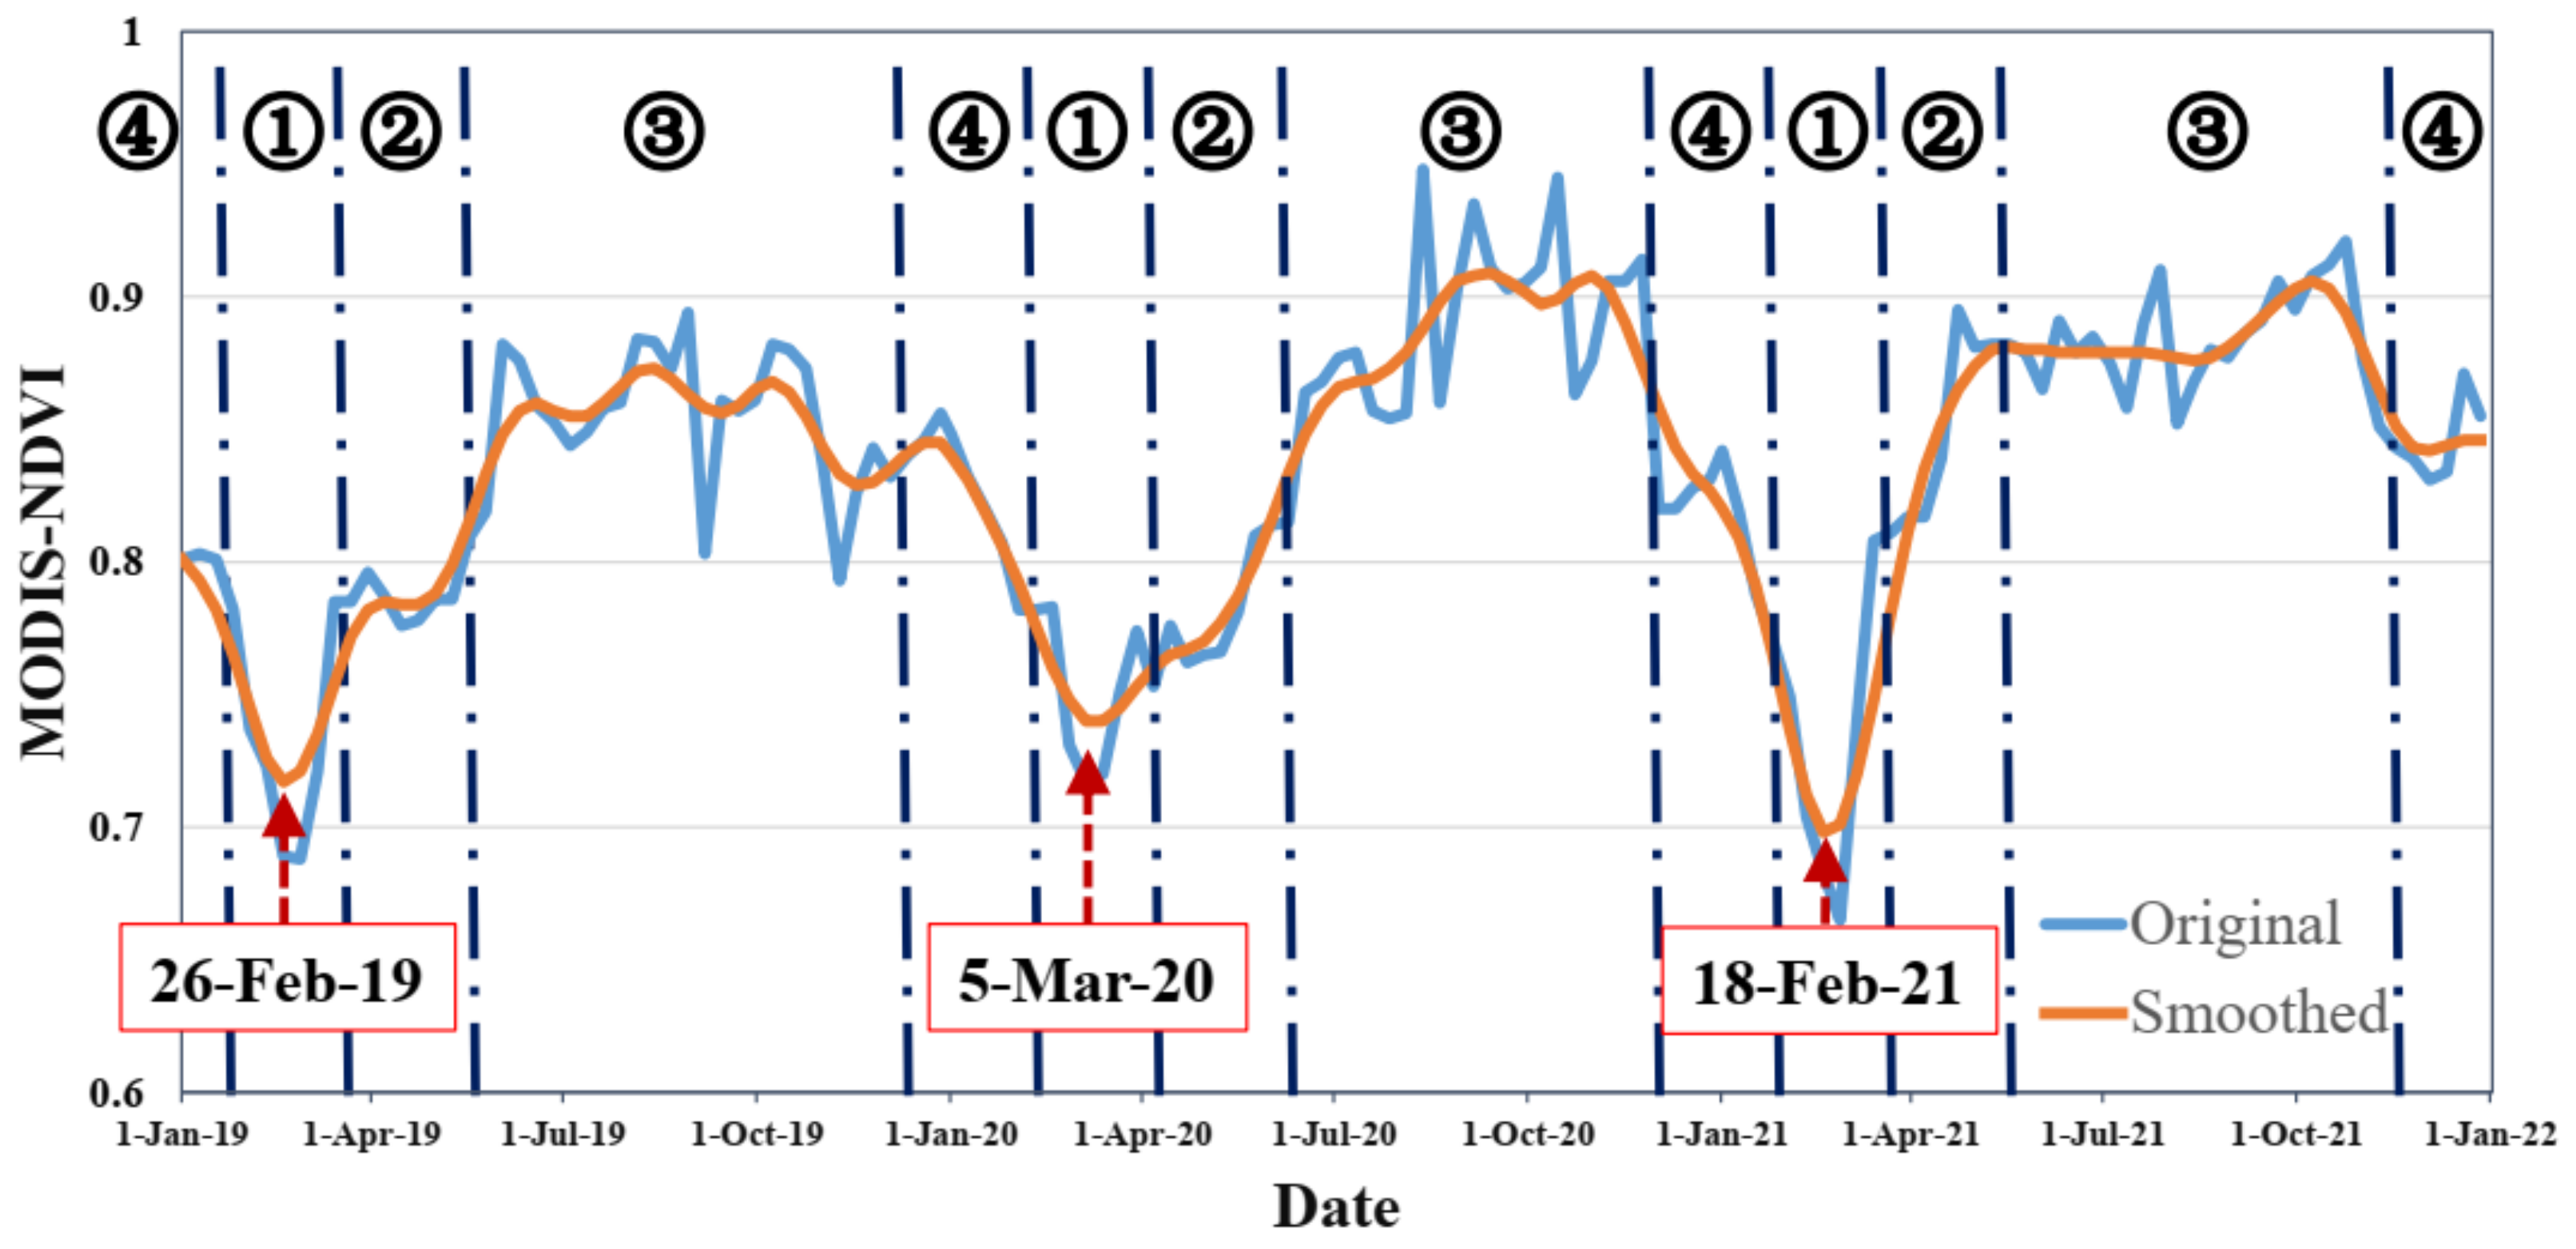
3.1. Phenological Stages Delineation of Rubber Trees

The temporal profile of rubber trees from 2019 to 2021 was plotted based on the MODIS-NDVI, as shown in Figure 5. The blue and orange curves represent the original and smoothed NDVI time series. The troughs of the smoothed curve are indicated with red arrows and the corresponding dates.
In Figure 5, the four phenological stages are labeled by the corresponding numbers, and the vertical blue dotted lines separate the timings of the stages. The resting stage lasts for about 50 days [50]. During this stage, the old leaves of rubber trees have turned red and yellow, and concentrate on falling off the rubber trees. According to the long-term collection of fallen leaves on a field, the amount of fallen leaves accounts for more than 70% of the whole year [50]. In this study, the resting stage’s start date and end date were set 25 days before and after the dates of troughs. In the recovery growth stage, the rubber trees sprout new leaves, and the first awning leaves complete the process of leaf development. During this stage, the number of leaves accounts for about 70% of the whole year [20]. This stage lasts for about 50 days after the resting stage. The slowdown growth stage lasts for about 50 days before the resting stage. In this stage, affected by cold air masses, the rubber trees gradually enter the defoliation period. The rubber growth tends to stop, and the old leaves begin to turn red. The vigorous growth stage is the longest stage in the rubber trees’ growth cycle, lasting for about 210 days, from middle May to late November. In this stage, the rubber trees’ leaf area index maintains a high level. The main causes of NDVI fluctuation are atmospheric conditions and precipitation.

3.2. Separability between Rubber Trees and Other Tree Species

Table 2 shows the J m distance between rubber trees and other tree species. In this study, we separated the J m distance into four levels and marked it with different colors: strong (1.9–2.0, blue), good (1.8–1.9, green), weak (1.7–1.8, yellow), and poor (<1.7, pink). Taking the dataset group ①③ (combination of the resting stage and vigorous growth stage) as an example, the J m distance between rubber trees and Lychee was 1.85, corresponding to the level of good separability.
The J m distance in Table 2 varied greatly with tree species and dataset groups (phenological stage combination). Casuarina and Coconut Palm were most easily distinguishable from rubber trees among the six tree species. For all the 15 dataset groups, the J m distances were larger than 1.9, which indicates strong separability. As for natural forest, when the dataset groups contained two or more phenological stages, it was easily distinguishable from rubber trees with strong separability. However, when only one phenological stage was contained, the separability between natural forest and rubber trees was less than 1.8, corresponding to weak or poor separability. As for Lychee, Areca Palm, and Eucalyptus, when three or more phenological stages were contained, the J m distance was at the level of strong separability. When a single phenological stage was contained, the J m distance was less than 1.7, and these three tree species were difficult to distinguish from rubber trees.
A J m distance larger than 1.8 is regarded as satisfactory discrimination between different classes. In general, based on Sentinel-2 data, any combination of two phenological stages was good enough for distinguishing rubber plantations from the other six tree species.

3.3. Accuracy Assessment Using Survey Data

The rubber plantation mapping results based on the 15 dataset groups were validated using the 1554 validating samples. The measures UA, PA, F1 score, and true positive (TP) for rubber plantations are shown in Table 3. In addition, the sources of commission and omission errors for rubber plantations are also included in Table 3.
Judging by the UA, PA, and F1 score, it was apparent that the dataset group of all-stage combination (①②③④) was superior to other 14 dataset groups. The UA, PA, and F1 score for rubber plantations were 81.0%, 81.4%, and 0.83, respectively. The best dataset group with three phenological stages was the combination of the resting, recovery growth, and slowdown growth stage (①②④), with a UA, PA, F1, and true positive of 79%, 83.6%, 0.81, and 158, respectively. The best dataset group with two phenological stages was the combination of recovery growth and slowdown growth stage (②④), with a UA, PA, F1, and true positive of 78.5%, 80.5%, 0.79, and 157, respectively. In general, the more phenological stage in the dataset group, the higher the F1 score. However, when the dataset group contained more than three phenological stages, the difference in mapping accuracy was slight.
As to the four mono-stage dataset groups, the recovery growth stage (②) performed best with a UA, PA, F1, and true positive of 77.5%, 79.1%, 0.78, and 155, while the resting stage (①) performed worst with a UA, PA, F1, and true positive of 71%, 73.1%, 0.72 and 142, respectively.
The commission and omission errors were mainly from Eucalyptus and Areca Palm, accounting for about two-thirds of the total errors. The rest of the classification errors were from Lychee and the natural forest. The classification errors from Casuarina and Coconut Palm were negligible.

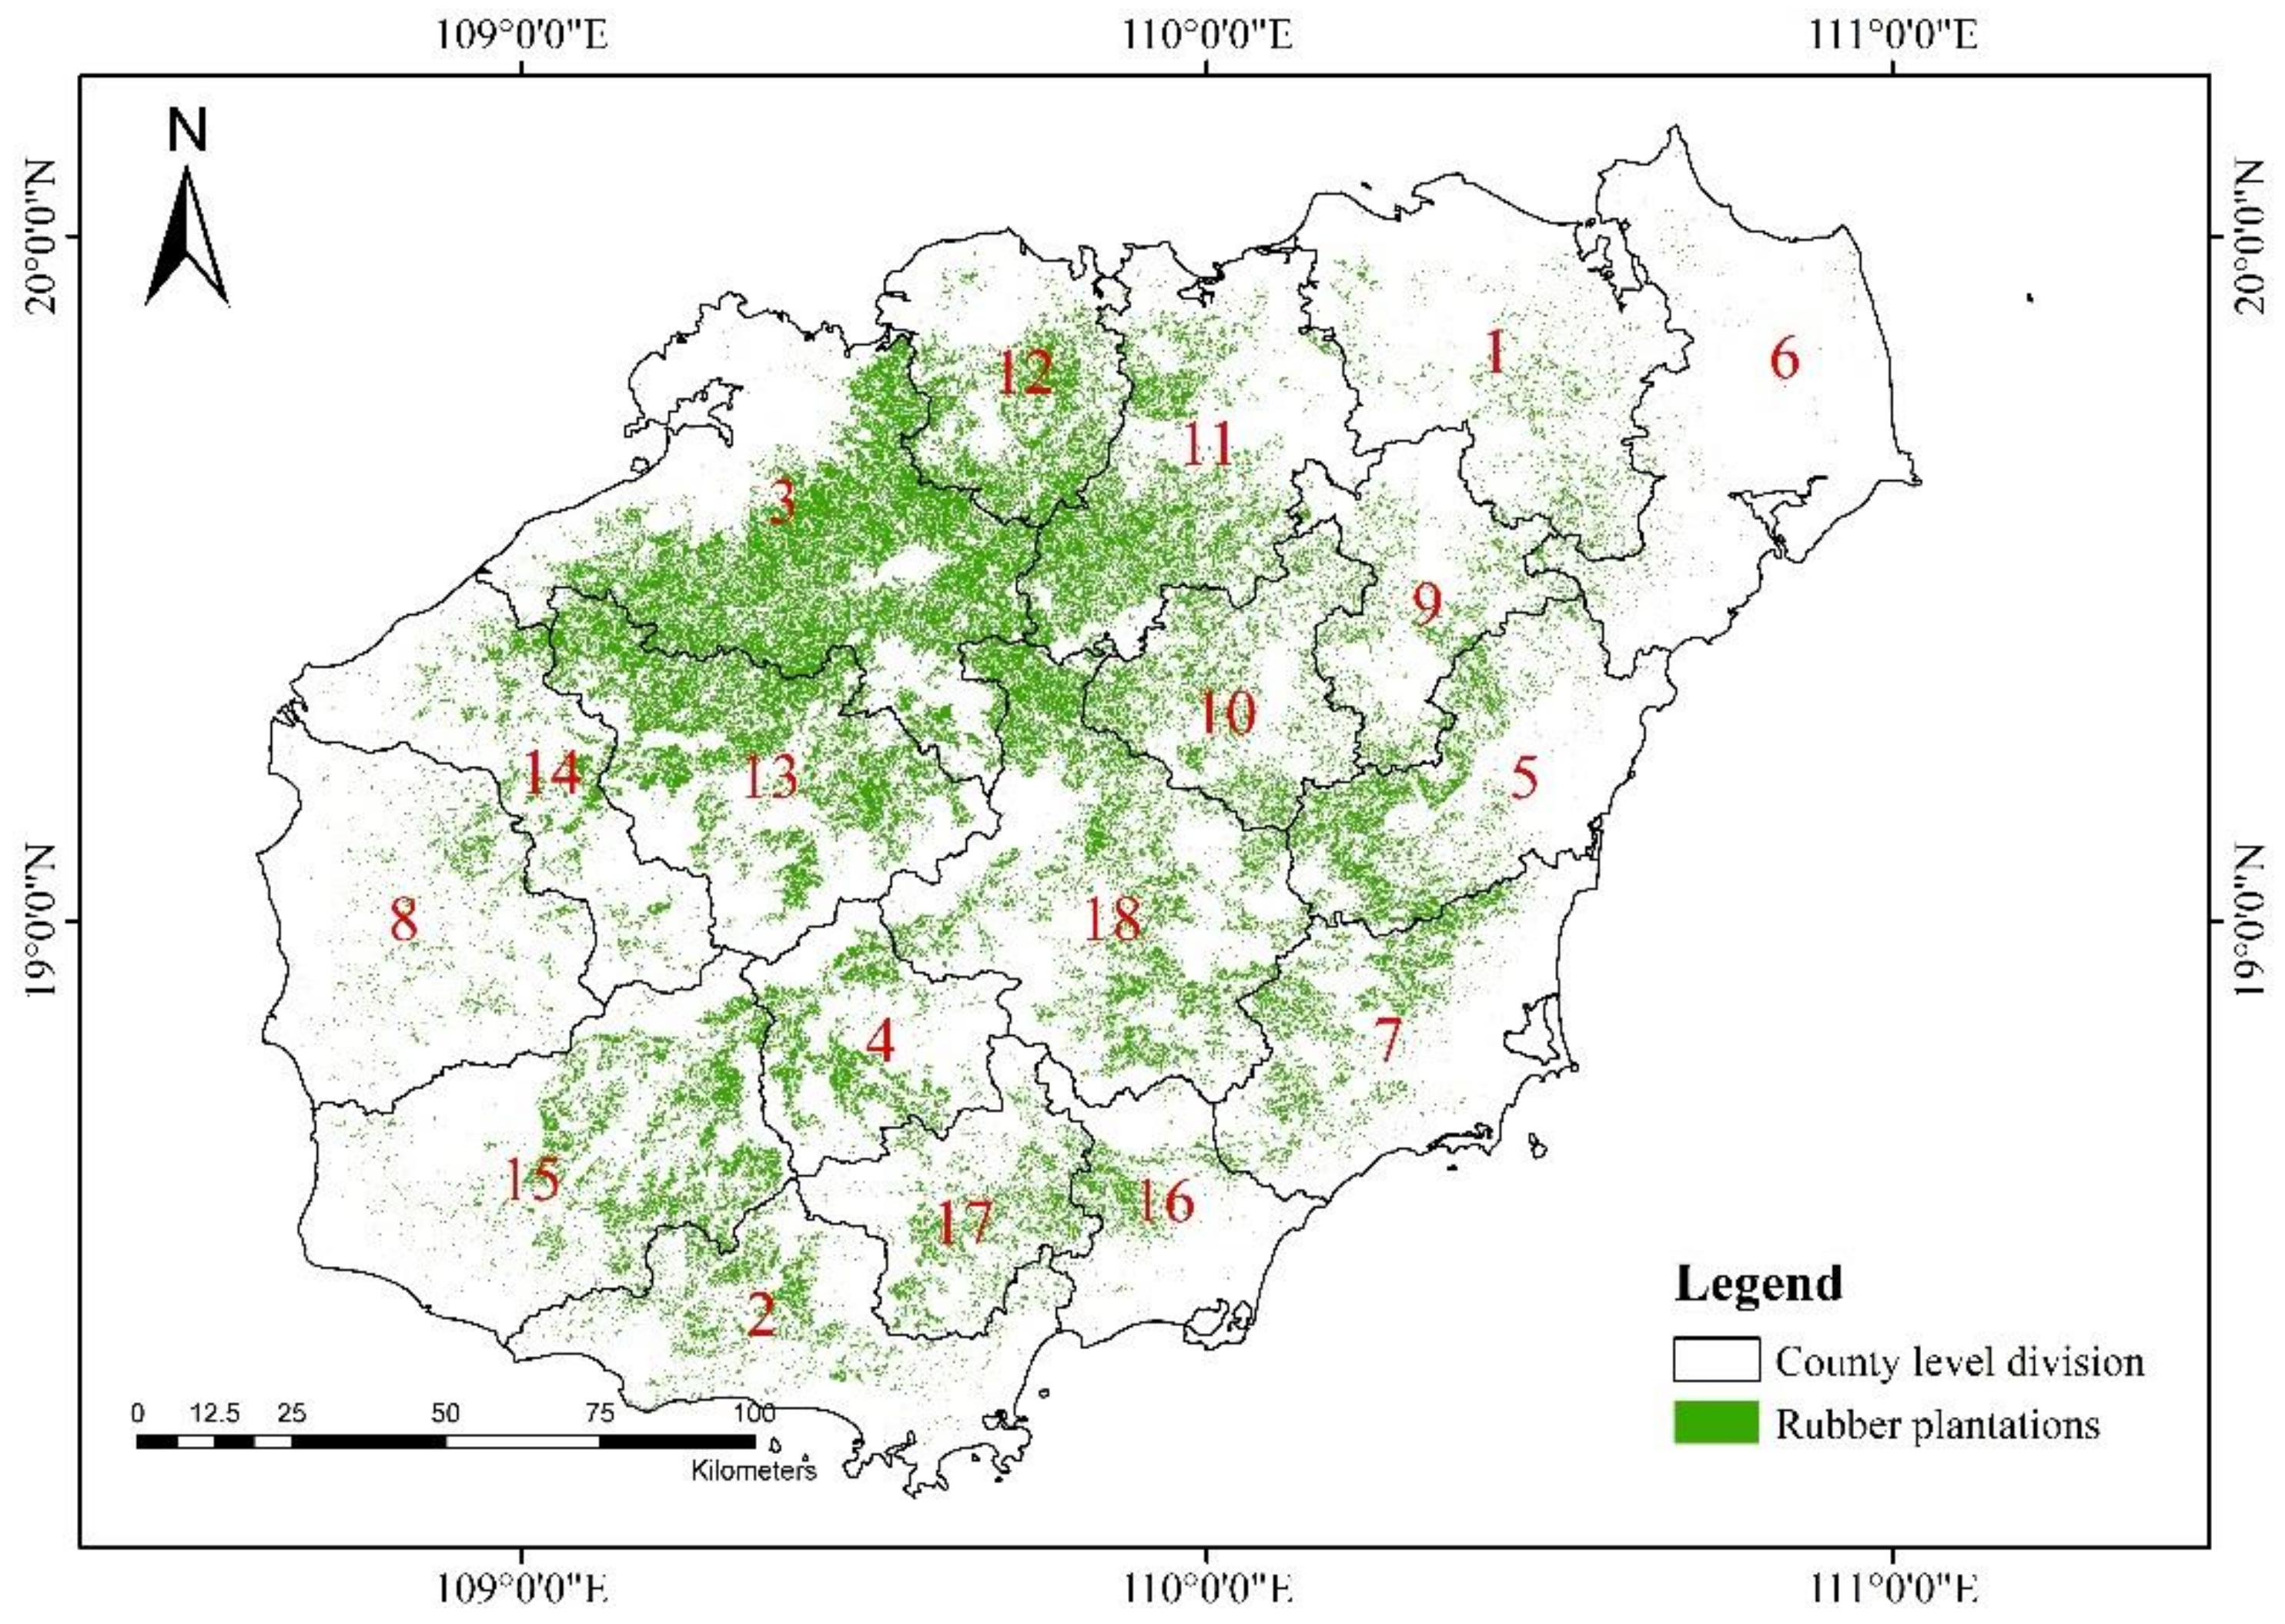
3.4. Rubber Plantation Map and Statistical Data Validation

The result of the rubber plantation map based on the all-stage combination dataset group (①②③④) is shown in Figure 6. The distribution of rubber plantations was in good agreement with the resultant maps in previous studies [13,15,16,18].
The codes labeled in Figure 6 correspond to the 18 counties in Hainan Province, and the one-to-one correspondence is shown in Table 4. The densest rubber plantation area was located in the northwest of Hainan Province, including the counties of Danzhou (3), Chengmai (11), Lingao (12), and Baisha (13), where there is the largest natural rubber production base in Hainan Province. The numbers behind the counties correspond to the codes in Figure 6.
The spatial distribution of the resultant map was further validated based on the Statistical Yearbook of Hainan Province in 2020. This study estimated the rubber plantation area of Hainan in 2020 was approximately 5473 km2, which is about 2.93% higher than the 2020 statistical data (5316 km2). Additionally, a county-level comparison of rubber plantation area between this study and the statistical yearbook is shown in Table 4. The 18 counties were sorted based on the rubber plantation area estimated in this work. In Table 5, the accuracy at the county level was calculated as follows:
Accuracy = 1 a b s D i f f e r e n c e Y e a r b o o k × 100
where the operator a b s ( ) denotes the absolute value, and the area weight is the proportion of each county’s total Hainan Province area. The area-weighted accuracy in total is the sum of the area-weighted accuracy for each county. The accuracy of the rubber plantations area at the county level ranged from 48.24% in Lingshui (16) to 95.09% in Chengmai (11). In total, the accuracy was as high as 97.05%, and the area-weighted accuracy was 82.47. Therefore, it could be concluded that the resultant map of rubber plantations had high accuracy in county-level spatial distribution.

3.5. Feature Importance

Table 5 shows the feature importance for the rubber tree discrimination that employed all four phenological stages (dataset group ①②③④). The colored cells denote the MDA values for each feature. The bottom row in Table 5 shows the sum of the feature importance for each phenological stage, and the last column offers the sum of the feature importance for each Sentinel-2 band.
The recovery growth stage was the most important phase, with a cumulative MDA of 109.88, followed by the vigorous and slowdown growth stages, with an MDA of 98.76 and 91.72, respectively. The resting stage was the least important phase with an MDA of 76.71.
The visible bands were much more important in the resting, recovery growth, and slowdown growth stages than in the vigorous growth stage. The SWIR bands showed much higher feature importance in the vigorous growth and slowdown growth stages than in the resting and recovery growth stages. Two red-edge bands (B6, B7) and the two NIR bands showed higher feature importance in the recovery growth and vigorous growth stages than in the resting and slowdown growth stages. Only the red-edge band B5 always had low importance values during all four phenological stages.
The importance of each Sentinel-2 band was uneven when summarized over the four phenological stages. The three visible bands (B2, B3, and B4) were the most important, followed by the two SWIR bands (B11 and B12) and red-edge band B6. The remaining bands in the red-edge region (B5 and B7) and the NIR region (B8 and B8A) showed low importance values.

4. Discussion

4.1. Capability of Sentinel-2 for Rubber Plantation Mapping

Xiao et al. [9] have presented the potential for mapping rubber plantations at a regional scale from three advantages of Sentinel-2 imagery, i.e., the three red-edge bands, 10/20 m spatial resolution, and 5 days’ revisiting time. The study area of this study [9] is a relatively small area, which facilitates the selection of cloud-free imagery. However, for a large area such as Hainan Province, with complex vegetation landscapes and frequent cloudy weather, the capability of Sentinel-2 for rubber plantation mapping needs to be further explored.
New in this study was the phenology-based image compositing for rubber tree discrimination. Recent studies have reported the advantages of time series images [28,29] or phenological features [51] for tree species classification. Compared to these studies, our approach is more suitable for rubber plantation mapping in a large area.
First, image compositing is necessary due to the high probability of CC in Hainan Province. The convolution filter to generate gap-free time series [28] is not recommended if the study area has high CC values as the Hainan Province. Due to climatological gradients and orbit swath overlaps, large areas exhibit higher variability in data availability [52,53]. In this case, image compositing with the same time intervals for different Sentinel-2 tiles can ensure the effectiveness of the rubber tree identification model for the whole area.
Second, the time intervals of image composition are set according to the timings of the rubber trees’ phenological stages. The timings of the phenological stages are determined based on the smoothed annual MODIS-NDVI curve. For tree species classification, it has been highlighted that input features should be chosen according to the considered species and their phenological characteristics in order to include key phenological stages that enhance their separability [29]. However, the phenology of rubber trees is highly sensitive to climate change, particularly rainfall and temperature [25,54,55]. The changes in climatic factors may delay or advance the defoliation period. As shown in Section 3.1, the timings of the phenological stages change over the three years. Additionally, the durations of the slowdown growth, resting, and recovery growth stages are short. Therefore, the three-monthly or seasonal compositing techniques [29] are unsuitable for rubber tree mapping.
Third, phenological features (e.g., the start time of the phenological stage and length of the growing season) have proven helpful in tree species classification [51]. However, these metrics have rarely been utilized in rubber tree mapping. The main reason is still the frequent cloudy weather in the distribution areas of the rubber trees. With poor temporal accuracy, the derived phenological features could have little impact on rubber tree mapping accuracy.

4.2. Phenological Stage Importance

Regarding the importance of phenological stage for rubber tree mapping, based on the J m distance in Table 2, the MDA in Table 5, and the F1-score in Table 3, it can be concluded that the recovery growth stage plays the most important role, while the resting phase plays the least important.
The importance of the phenological stage is directly associated with phenological events (or status) of rubber trees and other tree species. In the recovery growth stage, for rubber plantations, the canopy recovers with new leaves’ emergence and formation, while for other tree species, many leaves fall off trees due to spring drought. Shi et al. [56] analyzed the seasonal dynamics of litterfall production of tropical natural forests in Hainan Province. Results showed that spring (March and April) was one of the two peak seasons for litterfall production, and the main influencing factor was drought. In general, new leaves have higher chlorophyll contents than old leaves. The differences in phenological traits between leaf on and leaf off, coupled with the spectral differences between fresh leaves and old leaves, are the main reasons for the most important role of the recovery growth stage.
Unexpectedly, the resting stage plays the least important role among the four phenological stages. As almost all the leaves of rubber trees drop off in the resting stage, it was regarded as the optimal time window or the key phenological stage for mapping rubber trees [8,9,23]. The reason for the least important role of the resting stage could be twofold: understory vegetation in rubber plantations or unsynchronized phenology of rubber trees. Chen et al. [18] also noted they were the two important factors that affect the rubber tree mapping accuracy. In the resting stage, the canopy’s opening accelerates the growth of understory vegetation. The mixture of understory vegetation and withered leaves makes the spectrum signature of rubber plantations uncertain. As for the unsynchronized phenology, Hu et al. reported that the spatial characteristics of rubber tree phenology were consistent with the spatial distribution of terrain and elevation in Hainan Province [57]. Chen et al. [18] noted that the phenology of rubber trees was closely related to the factors of stand age, site-specific environment, etc.
The least important role of the resting stage may change if the texture features based on high spatial resolution images are considered for rubber tree mapping. The forest texture is closely related to the canopy structure, which is defined by foliage properties and branch arrangement [58]. In the resting phase, the defoliation of rubber trees exposes crown branches and increases canopy roughness. While for other tree species, leaves still dominate the crown. These differences enhance the separability between rubber trees and other tree species.

4.3. Band Importance

The feature importance of Sentinel-2 bands for rubber tree mapping partly agrees with previous studies using Sentinel-2 for tree species classification [26,29,31,33,59]. It should be noted that in previous studies, band importance was calculated for all tree species, but in this study, feature importance was quantified specifically for rubber trees. In this study, the band importance in different phenological stages can be associated with phenological events of rubber trees.
In the vigorous growth stage, all the tree species have lush foliage. The red-edge bands B6 and B7, the two NIR bands, and the two SWIR bands play important roles with high MDA values, which agree well with the results in [26,31,33,59]. Immitzer et al. [33] and Nelson et al. [59] reported that the red-edge bands B6 and B7, the narrow NIR band, and the SWIR 2 band were among the most important bands. Persson et al. [26] also reported that the two SWIR bands were among the highest-ranked bands. The red band (B4) and red-edge band (B5) showed the lowest importance, which partly agrees with the previous results that the red band of a summer acquisition ranked considerably lower than most other summer bands [29,31,32].
In the slowdown growth stage, the leaves of rubber trees gradually turn red and yellow, but for other tree species, the leaves are still green. The red-edge bands B6, B7, and the two NIR bands turn less important, while the SWIR band B11 still shows the second-highest importance. This result is also confirmed by Koller et al., that the SWIR region is especially sensitive to leaf water content, implying that species-specific dynamics of leaf water content during phases of phenological transition help to discriminate tree species [29]. The three visible bands (B2, B3, and B4) play important roles in the slowdown growth stage, since the difference between the yellow (or red) leaves and the green leaves is visible to the naked eye.
In the resting stage, as discussed in Section 4.2, the spectral signatures of rubber plantations are actually from the mixture of understory vegetation and withered leaves. Due to the uncertainty of the mixing ratio, the bands from red-edge to SWIR further decline in importance; however, the three visible bands show higher importance.
In the recovery growth stage, new green leaves are gradually restored in the canopy. Due to the clear difference between fresh leaves and old leaves in the visible region, the three visible bands remain the top three important features. This result is also confirmed by Persson et al., that the blue and green bands from May were in the top seven highest-ranked bands [26]. In addition, Immitzer et al. showed the importance of the blue band [33], and Nelson reported that the red band was more important, probably since an image from early May was included [59].

4.4. Research Limitations and Prospects

(1)
Previous studies [28,29,60] have confirmed the usefulness of vegetation indices (such as NDVI and EVI) for tree species classification. In the scope of rubber tree mapping, the spectral-indices-based decision trees have been used to discriminate rubber trees from natural forests. It can be expected that the spectral indices are helpful for rubber tree mapping. In addition, several red-edge-related spectral indices can be obtained based on Sentinel-2 imagery [61], and the importance of red-edge bands can be explored deeply.
(2)
In this study, based on the RF algorithm, the MDA was used to evaluate the feature importance of the phenological stages and the Sentinel-2 bands for rubber plantation discrimination. However, the selection of features with high importance does not warrant that this is the best set of features for a given problem [62]. Features with high correlation may reduce the reliability of the RF-based MDA importance, and have a negative effect on the feature selection. Different solutions have been proposed to overcome some of the known flaws of MDA [63], and several methods have been proposed to select the optimal subset of features [64]. These techniques have been used in forest parameter monitoring, such as tree species diversity [65], growing stock volume [66], and forest stand parameters [66]. However, the impacts of dependent input features on the RF-based MDA importance for tree species classification have not been discussed. In this study, there is no doubt that there is a high correlation between the Sentinel-2 imageries with adjacent phenological stages. In addition, the adjacent bands of Sentinel-2 data are possibly correlated to each other because of the continuity of the bands. Therefore, the feature importance of the phenological stages and the Sentinel-2 bands for rubber tree discrimination needs to be explored deeply in the future.
(3)
In this study, the four Hainan Sentinel-2 composites were generated based on imageries of three years due to the high cloud cover. This technique is time-consuming and easily affected by the frequent deforestation and reforestation in Hainan Province. Our results showed that any dataset group with two phenological stages was sufficient for rubber tree mapping. Actually, for each Sentinel-2 tile, it is achievable to composite two cloud-free images annually with different phenological stages. Therefore, based on the four Hainan Sentinel-2 composites, future studies should tap the potential of dataset groups with double phenological stages. Standardizing the rule sets for identifying rubber plantations, especially in decision trees, could facilitate the rubber plantation mapping annually.
(4)
As we know, the first Sentinel-2 satellite was launched in 2015. If we want to map the rubber plantations in Hainan Province before the Sentinel-2 data was available, we still have to resort to Landsat series data. Given the high cloud cover in Hainan Province and the 16-day repeat cycle of Landsat satellites, it is tough to generate four Hainan compositing Landsat images corresponding to the four phenological stages. Recent studies have shown the harmonization of Landsat and Sentinel-2 data [67], and the combination of Sentinel-2 and Landsat for land surface phenology characterizing [68,69]. Therefore, simulated Hainan Landsat images can be generated by adjusting Sentinel-2 radiometry to replicate the spectral bandpasses of Landsat 5/TM or 8/OLI for the bands common to both sensors. In the future, the rubber tree mapping model based on the simulated Landsat images should be explored and will be used to monitor the dynamics of rubber plantations during 1990–2020.

5. Conclusions

Knowledge of the spatial extent of rubber plantations at a regional scale is significant to ensure the sustainability of the natural rubber industry and ecological conservation. This work used three years of Sentinel-2 data to map rubber plantations in Hainan Province, China. Unlike previous studies, six tropical tree species were involved in being distinguished from rubber trees, and the growth cycle of rubber trees was divided into four stages: resting, recovery growth, vigorous growth, and slowdown growth stage. A detailed MODIS-NDVI curve was used to determine the timings of the four phenological stages, and accordingly, four Sentinel-2 composites were generated. The random forest classifier and the four phenological stage composites were used to identify rubber trees. The capability of phenology-based Sentinel-2 composites for mapping rubber plantations was shown in two levels of classification accuracy: the F1 score based on survey samples was 0.83, and the area-weighted accuracy at the county level based on the Statistical Yearbook of Hainan Province was 82.47%.
Although our study demonstrated the capability of the phenology-based Sentinel-2 image compositing approach for mapping rubber plantations, it is time-consuming and easily affected by frequent deforestation and reforestation. In the future, the utilization of vegetation indices and red-edge-related spectral indices will be specifically addressed. Rule-based decision trees should be built for any two phenological stages to facilitate the rubber plantation mapping annually. Moreover, based on the four compositing images in this work, the potential of Landsat data in mapping rubber plantations deserves further exploration.

Author Contributions

Conceptualization, H.L., S.L. and J.C.; methodology, H.L., L.S. and J.W.; validation, S.L. and Y.H.; investigation, H.L. and Y.H.; writing—original draft preparation, H.L., L.Z. and L.S.; writing—review and editing, H.L., L.Z. and X.L.; funding acquisition, J.C., S.L. and X.L. All authors have read and agreed to the published version of the manuscript.

Funding

This work was funded by the Strategic Priority Research Program of the Chinese Academy of Sciences (No. XDA19030301), the Fundamental Research Foundation of Shenzhen Technology and Innovation Council (No. JCYJ20200109115637548), the Shandong Provincial Natural Science Foundation (No. ZR2020MD019), and the National Natural Science Foundation of China (No. 42001286).

Data Availability Statement

Not applicable.

Acknowledgments

The authors are grateful to the European Space Agency (ESA) for providing the Sentinel-2 data.

Conflicts of Interest

The authors declare no conflict of interest.

References

  1. Foley, J.A.; DeFries, R.; Asner, G.P.; Barford, C.; Bonan, G.; Carpenter, S.R.; Chapin, F.S.; Coe, M.T.; Daily, G.C.; Gibbs, H.K.; et al. Global Consequences of Land Use. Science 2005, 309, 570–574. [Google Scholar] [CrossRef] [Green Version]
  2. Li, H.; Aide, T.M.; Ma, Y.; Liu, W.; Cao, M. Demand for rubber is causing the loss of high diversity rain forest in SW China. Biodivers. Conserv. 2007, 16, 1731–1745. [Google Scholar] [CrossRef]
  3. Ziegler, A.D.; Fox, J.M.; Xu, J. The Rubber Juggernaut. Science 2009, 324, 1024–1025. [Google Scholar] [CrossRef]
  4. Singh, A.K.; Liu, W.; Zakari, S.; Wu, J.; Yang, B.; Jiang, X.J.; Zhu, X.; Zou, X.; Zhang, W.; Chen, C.; et al. A global review of rubber plantations: Impacts on ecosystem functions, mitigations, future directions, and policies for sustainable cultivation. Sci. Total Environ. 2021, 796, 148948. [Google Scholar] [CrossRef]
  5. Azizan, F.A.; Kiloes, A.M.; Astuti, I.S.; Aziz, A.A. Application of Optical Remote Sensing in Rubber Plantations: A Systematic Review. Remote Sens. 2021, 13, 429. [Google Scholar] [CrossRef]
  6. Li, Y.; Lan, G.; Xia, Y. Rubber Trees Demonstrate a Clear Retranslocation Under Seasonal Drought and Cold Stresses. Front. Plant Sci. 2016, 7, 1907. [Google Scholar] [CrossRef] [Green Version]
  7. Carr, M.K.V. The water relations of rubber (hevea brasiliensis): A review. Exp. Agric. 2011, 48, 176–193. [Google Scholar] [CrossRef]
  8. Cui, B.; Huang, W.; Ye, H.; Chen, Q. The Suitability of PlanetScope Imagery for Mapping Rubber Plantations. Remote Sens. 2022, 14, 1061. [Google Scholar] [CrossRef]
  9. Xiao, C.; Peng, L.; Feng, Z.; Liu, Y.; Zhang, X. Sentinel-2 red-edge spectral indices (RESI) suitability for mapping rubber boom in Luang Namtha Province, northern Lao PDR. Int. J. Appl. Earth Obs. Geoinf. 2020, 93, 102176. [Google Scholar] [CrossRef]
  10. Xiao, C.; Li, P.; Feng, Z. Monitoring annual dynamics of mature rubber plantations in Xishuangbanna during 1987–2018 using Landsat time series data: A multiple normalization approach. Int. J. Appl. Earth Obs. Geoinf. 2019, 77, 30–41. [Google Scholar] [CrossRef]
  11. Gao, S.; Liu, X.; Bo, Y.; Shi, Z.; Zhou, H. Rubber Identification Based on Blended High Spatio-Temporal Resolution Optical Remote Sensing Data: A Case Study in Xishuangbanna. Remote Sens. 2019, 11, 496. [Google Scholar] [CrossRef] [Green Version]
  12. Zhai, D.; Dong, J.; Cadisch, G.; Wang, M.; Kou, W.; Xu, J.; Xiao, X.; Abbas, S. Comparison of Pixel- and Object-Based Approaches in Phenology-Based Rubber Plantation Mapping in Fragmented Landscapes. Remote Sens. 2018, 10, 44. [Google Scholar] [CrossRef] [Green Version]
  13. Han, P.; Chen, J.; Han, Y.; Yi, L.; Zhang, Y.; Jiang, X. Monitoring rubber plantation distribution on Hainan Island using Landsat OLI imagery. Int. J. Remote Sens. 2018, 39, 2189–2206. [Google Scholar] [CrossRef]
  14. Chen, B.; Xiao, X.; Ye, H.; Ma, J.; Doughty, R.; Li, X.; Zhao, B.; Wu, Z.; Sun, R.; Dong, J.; et al. Mapping Forest and Their Spatial–Temporal Changes From 2007 to 2015 in Tropical Hainan Island by Integrating ALOS/ALOS-2 L-Band SAR and Landsat Optical Images. IEEE J. Sel. Top. Appl. Earth Obs. Remote Sens. 2018, 11, 852–867. [Google Scholar] [CrossRef]
  15. Dong, J.; Xiao, X.; Chen, B.; Torbick, N.; Jin, C.; Zhang, G.; Biradar, C. Mapping deciduous rubber plantations through integration of PALSAR and multi-temporal Landsat imagery. Remote Sens. Environ. 2013, 134, 392–402. [Google Scholar] [CrossRef]
  16. Dong, J.; Xiao, X.; Sheldon, S.; Biradar, C.; Xie, G. Mapping tropical forests and rubber plantations in complex landscapes by integrating PALSAR and MODIS imagery. ISPRS J. Photogramm. Remote Sens. 2012, 74, 20–33. [Google Scholar] [CrossRef]
  17. Fan, H.; Fu, X.; Zhang, Z.; Wu, Q. Phenology-Based Vegetation Index Differencing for Mapping of Rubber Plantations Using Landsat OLI Data. Remote Sens. 2015, 7, 6041–6058. [Google Scholar] [CrossRef] [Green Version]
  18. Chen, B.; Li, X.; Xiao, X.; Zhao, B.; Dong, J.; Kou, W.; Qin, Y.; Yang, C.; Wu, Z.; Sun, R.; et al. Mapping tropical forests and deciduous rubber plantations in Hainan Island, China by integrating PALSAR 25-m and multi-temporal Landsat images. Int. J. Appl. Earth Obs. Geoinf. 2016, 50, 117–130. [Google Scholar] [CrossRef]
  19. Liang, S.; Chen, J.; Wu, B.; Chen, G. Extracting rubber plantation with decision tree model based on object-oriented method. J. Remote Sens. 2015, 19, 485–494. [Google Scholar] [CrossRef]
  20. Chen, H.; Chen, X.; Chen, Z.; Zhu, N.; Tao, Z. A Primary Study on Rubber Acreage Estimation From MODIS-Based Information in Hainan. Chin. J. Trop. Crops 2010, 31, 1181–1185. [Google Scholar]
  21. Xiao, C.; Li, P.; Feng, Z.; Lin, Y.; You, Z.; Yang, Y. Mapping rubber plantations in Xishuangbanna, southwest China based on the re-normalization of two Landsat-based vegetation–moisture indices and meteorological data. Geocarto Int. 2021, 36, 1923–1937. [Google Scholar] [CrossRef]
  22. Xiao, C.; Li, P.; Feng, Z. How Did Deciduous Rubber Plantations Expand Spatially in China’s Xishuangbanna Dai Autonomous Prefecture During 1991–2016? Photogramm. Eng. Remote Sens. 2018, 85, 687–697. [Google Scholar] [CrossRef]
  23. Li, Y.; Liu, C.; Zhang, J.; Zhang, P.; Xue, Y. Monitoring Spatial and Temporal Patterns of Rubber Plantation Dynamics Using Time-Series Landsat Images and Google Earth Engine. IEEE J. Sel. Top. Appl. Earth Obs. Remote Sens. 2021, 14, 9450–9461. [Google Scholar] [CrossRef]
  24. Kou, W.; Dong, J.; Xiao, X.; Hernandez, A.J.; Qin, Y.; Zhang, G.; Chen, B.; Lu, N.; Doughty, R. Expansion dynamics of deciduous rubber plantations in Xishuangbanna, China during 2000–2010. GIScience Remote Sens. 2018, 55, 905–925. [Google Scholar] [CrossRef]
  25. Azizan, F.A.; Astuti, I.S.; Aditya, M.I.; Febbiyanti, T.R.; Williams, A.; Young, A.; Abdul Aziz, A. Using Multi-Temporal Satellite Data to Analyse Phenological Responses of Rubber (Hevea brasiliensis) to Climatic Variations in South Sumatra, Indonesia. Remote Sens. 2021, 13, 2932. [Google Scholar] [CrossRef]
  26. Persson, M.; Lindberg, E.; Reese, H. Tree Species Classification with Multi-Temporal Sentinel-2 Data. Remote Sens. 2018, 10, 1794. [Google Scholar] [CrossRef] [Green Version]
  27. Axelsson, A.; Lindberg, E.; Reese, H.; Olsson, H. Tree species classification using Sentinel-2 imagery and Bayesian inference. Int. J. Appl. Earth Obs. Geoinf. 2021, 100, 102318. [Google Scholar] [CrossRef]
  28. Hemmerling, J.; Pflugmacher, D.; Hostert, P. Mapping temperate forest tree species using dense Sentinel-2 time series. Remote Sens. Environ. 2021, 267, 112743. [Google Scholar] [CrossRef]
  29. Kollert, A.; Bremer, M.; Löw, M.; Rutzinger, M. Exploring the potential of land surface phenology and seasonal cloud free composites of one year of Sentinel-2 imagery for tree species mapping in a mountainous region. Int. J. Appl. Earth Obs. Geoinf. 2021, 94, 102208. [Google Scholar] [CrossRef]
  30. Ma, M.; Liu, J.; Liu, M.; Zeng, J.; Li, Y. Tree Species Classification Based on Sentinel-2 Imagery and Random Forest Classifier in the Eastern Regions of the Qilian Mountains. Forests 2021, 12, 1736. [Google Scholar] [CrossRef]
  31. Grabska, E.; Hostert, P.; Pflugmacher, D.; Ostapowicz, K. Forest Stand Species Mapping Using the Sentinel-2 Time Series. Remote Sens. 2019, 11, 1197. [Google Scholar] [CrossRef]
  32. Puletti, N.; Chianucci, F.; Castaldi, C. Use of Sentinel-2 for forest classification in Mediterranean environments. Ann. Silvic. Res. 2017, 42, 32–38. [Google Scholar] [CrossRef]
  33. Immitzer, M.; Vuolo, F.; Atzberger, C. First Experience with Sentinel-2 Data for Crop and Tree Species Classifications in Central Europe. Remote Sens. 2016, 8, 166. [Google Scholar] [CrossRef]
  34. Furtado, E.; Moraes, W.B.; Cintra, W.; dos Anjos, B.B.; da Silva, L. Epidemiology and Management of South American Leaf Blight on Rubber in Brazil. In Horticultural Crops; IntechOpen: London, UK, 2020. [Google Scholar] [CrossRef] [Green Version]
  35. Zhou, W.; Sha, L.Q.; Shen, S.; Zheng, Z. Seasonal change of soil respiration and its influence factors in rubber (Hevea brasiliensis) plantation in Xishuangbanna, SW China. J. Mt. Sci. 2008, 26, 317–325. [Google Scholar]
  36. Li, Z.; Fox, J.M. Mapping rubber tree growth in mainland Southeast Asia using time-series MODIS 250m NDVI and statistical data. Appl. Geogr. 2012, 32, 420–432. [Google Scholar] [CrossRef]
  37. Gallo, K.; Ji, L.; Reed, B.; Eidenshink, J.; Dwyer, J. Multi-platform comparisons of MODIS and AVHRR normalized difference vegetation index data. Remote Sens. Environ. 2005, 99, 221–231. [Google Scholar] [CrossRef] [Green Version]
  38. Jing, W.; Ni, G.; Xiaoping, W.; Jia, Y. Comparisons of normalized difference vegetation index from MODIS Terra and Aqua data in northwestern China. In Proceedings of the 2007 IEEE International Geoscience and Remote Sensing Symposium, Barcelona, Spain, 23–28 July 2007; pp. 3390–3393. [Google Scholar]
  39. Leinenkugel, P.; Kuenzer, C.; Oppelt, N.; Dech, S. Characterisation of land surface phenology and land cover based on moderate resolution satellite data in cloud prone areas—A novel product for the Mekong Basin. Remote Sens. Environ. 2013, 136, 180–198. [Google Scholar] [CrossRef]
  40. Cleveland, W.S.; Devlin, S.J. Locally Weighted Regression: An Approach to Regression Analysis by Local Fitting. J. Am. Stat. Assoc. 1988, 83, 596–610. [Google Scholar] [CrossRef]
  41. Lei, Z.; Wu, B.; Li, X.; Qiang, X. Classification system of China land cover for carbon budget. Acta Ecol. Sin. 2014, 34, 7158–7166. [Google Scholar] [CrossRef] [Green Version]
  42. Wu, B.; Zeng, Y.; Zhao, D. Land cover mapping and above ground biomass estimation in China. In Proceedings of the 2016 IEEE International Geoscience and Remote Sensing Symposium (IGARSS), Beijing, China, 10–15 July 2016; pp. 3535–3536. [Google Scholar]
  43. Lei, Z.; Xiaosong, L.; Quanzhi, Y.; Yu, L. Object-based approach to national land cover mapping using HJ satellite imagery. J. Appl. Remote Sens. 2014, 8, 083686. [Google Scholar] [CrossRef]
  44. SBHP; SONBSH. Hainan Statistical Yearbook. China Statistics Press: Beijing, China, 2020. [Google Scholar]
  45. Ruefenacht, B. Comparison of Three Landsat TM Compositing Methods: A Case Study Using Modeled Tree Canopy Cover. Photogramm. Eng. Remote Sens. 2016, 82, 199–211. [Google Scholar] [CrossRef]
  46. Corbane, C.; Politis, P.; Kempeneers, P.; Simonetti, D.; Soille, P.; Burger, A.; Pesaresi, M.; Sabo, F.; Syrris, V.; Kemper, T. A global cloud free pixel-based image composite from Sentinel-2 data. Data Brief 2020, 31, 105737. [Google Scholar] [CrossRef]
  47. Simonetti, D.; Pimple, U.; Langner, A.; Marelli, A. Pan-tropical Sentinel-2 cloud-free annual composite datasets. Data Brief 2021, 39, 107488. [Google Scholar] [CrossRef]
  48. Richards, J.A.; Jia, X. Remote Sensing Digital Image Analysis; Springer: Berlin/Heidelberg, Germany, 1999. [Google Scholar]
  49. Liaw, A.; Wiener, M. Classification and Regression by randomForest. R News 2002, 23, 18–22. [Google Scholar]
  50. Xue, X.; Ren, C.; Xu, Z.; Wang, W.; Zhang, Y.; Luo, X.; Zhao, C. Characteristic of Defoliation of Rubber Plantations (Hevea brasiliensis) in Hainan, China. Chin. J. Trop. Crops 2022, 43, 377–384. [Google Scholar] [CrossRef]
  51. Pasquarella, V.J.; Holden, C.E.; Woodcock, C.E. Improved mapping of forest type using spectral-temporal Landsat features. Remote Sens. Environ. 2018, 210, 193–207. [Google Scholar] [CrossRef]
  52. Schwieder, M.; Leitão, P.J.; da Cunha Bustamante, M.M.; Ferreira, L.G.; Rabe, A.; Hostert, P. Mapping Brazilian savanna vegetation gradients with Landsat time series. Int. J. Appl. Earth Obs. Geoinf. 2016, 52, 361–370. [Google Scholar] [CrossRef]
  53. Rufin, P.; Frantz, D.; Ernst, S.; Rabe, A.; Griffiths, P.; Özdoğan, M.; Hostert, P. Mapping Cropping Practices on a National Scale Using Intra-Annual Landsat Time Series Binning. Remote Sens. 2019, 11, 232. [Google Scholar] [CrossRef] [Green Version]
  54. Golbon, R.; Cotter, M.; Sauerborn, J. Climate change impact assessment on the potential rubber cultivating area in the Greater Mekong Subregion. Environ. Res. Lett. 2018, 13, 084002. [Google Scholar] [CrossRef]
  55. Zhai, D.L.; Yu, H.; Chen, S.C.; Ranjitkar, S.; Xu, J. Responses of rubber leaf phenology to climatic variations in Southwest China. Int. J. Biometeorol. 2019, 63, 607–616. [Google Scholar] [CrossRef]
  56. Shi, J.; Xu, H.; Lin, M.; Li, Y. Dynamics of litterfall production in the tropical mountain rainforest of Jianfengling, Hainan Island, China. Plant Sci. J. 2019, 37, 593–601. [Google Scholar] [CrossRef]
  57. Hu, Y.; Dai, S.; Luo, H.; Li, H.; Li, M.; Zheng, Q.; Yu, X.; Li, N. Spatio-temporal change characteristics of rubber forest phenology in Hainan Island during 2001–2015. Remote Sens. Nat. Resour. 2022, 34, 210–217. [Google Scholar] [CrossRef]
  58. Ferreira, M.P.; Wagner, F.H.; Aragão, L.E.O.C.; Shimabukuro, Y.E.; de Souza Filho, C.R. Tree species classification in tropical forests using visible to shortwave infrared WorldView-3 images and texture analysis. ISPRS J. Photogramm. Remote Sens. 2019, 149, 119–131. [Google Scholar] [CrossRef]
  59. Nelson, M. Evaluating Multitemporal Sentinel-2 data for Forest Mapping using Random Forest. Master’s Thesis, Stockholm University, Stockholm, Sweden, 2017. [Google Scholar]
  60. Immitzer, M.; Neuwirth, M.; Böck, S.; Brenner, H.; Vuolo, F.; Atzberger, C. Optimal Input Features for Tree Species Classification in Central Europe Based on Multi-Temporal Sentinel-2 Data. Remote Sens. 2019, 11, 2599. [Google Scholar] [CrossRef] [Green Version]
  61. Fernández-Manso, A.; Fernández-Manso, O.; Quintano, C. SENTINEL-2A red-edge spectral indices suitability for discriminating burn severity. Int. J. Appl. Earth Obs. Geoinf. 2016, 50, 170–175. [Google Scholar] [CrossRef]
  62. Izquierdo-Verdiguier, E.; Zurita-Milla, R. An evaluation of Guided Regularized Random Forest for classification and regression tasks in remote sensing. Int. J. Appl. Earth Obs. Geoinf. 2020, 88, 102051. [Google Scholar] [CrossRef]
  63. Chavent, M.; Lacaille, J.; Mourer, A.; Olteanu, M. Handling Correlations in Random Forests: Which Impacts on Variable Importance and Model Interpretability? ESANN: Bruges, Belgium, 2021; pp. 569–574. [Google Scholar] [CrossRef]
  64. Speiser, J.L.; Miller, M.E.; Tooze, J.; Ip, E. A comparison of random forest variable selection methods for classification prediction modeling. Expert Syst. Appl. 2019, 134, 93–101. [Google Scholar] [CrossRef]
  65. Mallinis, G.; Chrysafis, I.; Korakis, G.; Pana, E.; Kyriazopoulos, A.P. A Random Forest Modelling Procedure for a Multi-Sensor Assessment of Tree Species Diversity. Remote Sens. 2020, 12, 1210. [Google Scholar] [CrossRef] [Green Version]
  66. Chrysafis, I.; Mallinis, G.; Tsakiri, M.; Patias, P. Evaluation of single-date and multi-seasonal spatial and spectral information of Sentinel-2 imagery to assess growing stock volume of a Mediterranean forest. Int. J. Appl. Earth Obs. Geoinf. 2019, 77, 1–14. [Google Scholar] [CrossRef]
  67. Claverie, M.; Ju, J.; Masek, J.G.; Dungan, J.L.; Vermote, E.F.; Roger, J.-C.; Skakun, S.V.; Justice, C. The Harmonized Landsat and Sentinel-2 surface reflectance data set. Remote Sens. Environ. 2018, 219, 145–161. [Google Scholar] [CrossRef]
  68. Bolton, D.K.; Gray, J.M.; Melaas, E.K.; Moon, M.; Eklundh, L.; Friedl, M.A. Continental-scale land surface phenology from harmonized Landsat 8 and Sentinel-2 imagery. Remote Sens. Environ. 2020, 240, 111685. [Google Scholar] [CrossRef]
  69. Kowalski, K.; Senf, C.; Hostert, P.; Pflugmacher, D. Characterizing spring phenology of temperate broadleaf forests using Landsat and Sentinel-2 time series. Int. J. Appl. Earth Obs. Geoinf. 2020, 92, 102172. [Google Scholar] [CrossRef]
Figure 1. Location of Hainan Province in China and field samples.
Remotesensing 14 05338 g001
Figure 2. Photos of rubber plantations at different phenological stages. (a) Resting phase. (b) Recovery growth phase. (c) Vigorous growth phase. (d) Slowdown growth phase.
Remotesensing 14 05338 g002
Figure 3. Hainan land cover from “ChinaCover2020” and Sentinel-2 tiles for the study area.
Remotesensing 14 05338 g003
Figure 4. The framework of rubber plantation mapping for the study area using phenology-based Sentinel-2 composites.
Remotesensing 14 05338 g004
Figure 5. MODIS-NDVI variation curves for rubber plantations from 2019 to 2021. ①: Resting stage, ②: Recovery growth stage, ③: Vigorous growth stage, ④: Slowdown growth stage.
Remotesensing 14 05338 g005
Figure 6. Spatial distribution of rubber plantations in Hainan Province in 2020.
Remotesensing 14 05338 g006
Table 1. Number of training and validating samples.
Coded NameTree SpeciesTraining SamplesValidating SamplesTotal
RTRubber tree150200350
LCLychee150225375
CACasuarina150191341
CPCoconut Palm150218368
EUEucalyptus150221371
APAreca Palm150212362
NFNatural forest150287437
Total105015542604
Table 2. Class separability between rubber trees and other tree species based on J m distance.
Tree speciesLCCACPEUAPNF
1.50 1.98 1.96 1.21 1.62 1.70
1.58 1.97 1.98 1.57 1.67 1.77
1.47 1.98 1.97 1.41 1.63 1.74
1.59 1.98 1.98 1.41 1.58 1.68
①②1.88 1.99 1.99 1.84 1.93 1.96
①③1.85 1.99 1.99 1.80 1.91 1.93
①④1.86 1.99 1.99 1.84 1.89 1.95
②③1.86 1.99 1.99 1.87 1.90 1.94
②④1.88 1.99 1.99 1.89 1.88 1.96
③④1.87 1.99 1.99 1.86 1.86 1.93
①②③1.96 1.99 1.99 1.97 1.97 1.99
①②④1.97 1.99 1.99 1.97 1.98 1.99
①③④1.96 1.99 1.99 1.96 1.97 1.99
②③④1.96 1.99 1.99 1.96 1.98 1.99
①②③④1.99 1.99 1.99 1.99 1.99 1.99
Remotesensing 14 05338 i001. LC: Lychee, CA: Casuarina, CP: Coconut Palm, EU: Eucalyptus, AP: Areca Palm, NF: Natural Forest. ①: Resting stage, ②: Recovery growth stage, ③: Vigorous growth stage, ④: Slowdown growth stage.
Table 3. Accuracy assessment of rubber plantation mapping results.
Tree LCCACPEUAPNFRT
SpeciesEC/EOEC/EOEC/EOEC/EOEC/EOEC/EOTPPA%UAF1
10/51/01/118/2614/814/1214271.00%73.10%0.72
6/50/10/016/1314/149/815577.50%79.10%0.78
13/91/11/218/1511/116/215075.00%78.90%0.77
14/52/01/122/196/910/1614572.50%73.20%0.73
①②8/50/01/112/1314/148/1115777.50%78.10%0.78
①③8/30/02/114/1214/167/915678.00%78.80%0.78
①④12/21/01/022/1411/135/1114874.00%78.70%0.76
②③9/30/00/015/1415/137/715477.00%80.60%0.79
②④9/30/00/014/1714/126/615778.50%80.50%0.79
③④15/60/01/018/176/410/515075.00%82.40%0.79
①②③7/30/00/113/1416/127/515778.50%81.80%0.80
①②④8/30/00/012/1516/106/315879.00%83.60%0.81
①③④10/20/00/120/1210/107/815376.50%82.30%0.79
②③④8/20/10/013/1516/88/215577.50%84.70%0.81
①②③④7/30/00/013/1212/126/316281.00%84.40%0.83
EC: errors of commission, EO: errors of omission, TP: true positive, PA: producer’s accuracy, UA: user’s accuracy, F1: F1 score; LC: Lychee, CA: Casuarina, CP: Coconut Palm, EU: Eucalyptus, AP: Areca Palm, NF: Natural Forest, RT: Rubber tree; ①: Resting stage, ②: Recovery growth stage, ③: Vigorous growth stage, ④: Slowdown growth stage.
Table 4. Accuracy assessment at the county level using statistical data.
IDCountyOur Work YearbookDifferenceAccuracyArea WeightArea-Weighted
(km2)(km2)(km2)(%)Accuracy
3Danzhou1055.07 870.84 184.23 78.84 0.10 7.88
18Qiongzhong595.91 559.12 36.79 93.42 0.08 7.47
13Baisha579.16 632.81 −53.65 91.52 0.06 5.49
11Chengmai483.52 508.47 −24.95 95.09 0.06 5.71
15Ledong356.14 315.88 40.26 87.25 0.08 6.98
12Lingao322.54 219.91 102.63 53.33 0.04 2.13
5Qionghai314.61 350.46 −35.85 89.77 0.05 4.49
10Tunchang279.10 364.67 −85.57 76.53 0.04 3.06
7Wanning228.17 265.62 −37.45 85.90 0.06 5.15
14Chanjiang205.56 153.60 51.96 66.17 0.05 3.31
17Baoting187.25 224.79 −37.54 83.30 0.03 2.50
4Wuzhishan186.59 161.38 25.21 84.38 0.03 2.53
9Dingan174.33 205.62 −31.29 84.78 0.04 3.39
2Sanya156.48 122.54 33.94 72.30 0.05 3.62
1Haikou136.16 161.38 −25.22 84.37 0.06 5.06
8Dongfang94.62 99.89 -5.27 94.72 0.07 6.63
16Lingshui81.22 53.52 27.70 48.24 0.03 1.45
6Wenchang37.04 46.22 −9.18 80.14 0.07 5.61
Total5473.475316.72156.7597.05 82.47
Table 5. Feature importance for S2 bands and rubber tree phenological phases.
RestingRecoveryVigorousSlowdownSum
VisibleB217.6416.657.6714.0155.97
B313.7416.038.2311.1349.14
B413.6213.794.9712.7445.11
Red edgeB58.128.394.537.2628.29
B63.919.6413.728.5235.79
B73.0811.0912.985.5332.69
NIRB83.48.9211.065.1828.55
B8A3.779.1510.444.6528.01
SWIRB114.968.5514.2113.2841.02
B124.467.6710.959.6332.71
Sum76.71109.8898.7691.92
Remotesensing 14 05338 i002
Publisher’s Note: MDPI stays neutral with regard to jurisdictional claims in published maps and institutional affiliations.

