Article

Tracking Atmospheric Moisture Changes in Convective Storm Environments Using GEO ABI and LEO CrIS Data Fusion

Cooperative Institute for Meteorological Satellite Studies, Space Science and Engineering Center, University of Wisconsin-Madison, Madison, WI 53706, USA
*
Author to whom correspondence should be addressed.
Remote Sens. 2022, 14(21), 5327; https://doi.org/10.3390/rs14215327
Submission received: 14 September 2022 / Revised: 11 October 2022 / Accepted: 17 October 2022 / Published: 25 October 2022
(This article belongs to the Special Issue Nowcasting of Convective Storms Based on Remote Sensing Data Fusion)

Abstract

:
The synergistic use of data from advanced space-borne instruments of different designs onboard different satellite platforms with different orbital tracks provides advantages in various applications over the use of individual data sets alone. For example, high vertical resolution sounding profiles from advanced sounders like CrIS (Cross-track Infrared Sounder) in a low Earth orbit (LEO) and a high horizontal plus temporal resolution radiance measurements from geostationary (GEO) imagers like ABI (Advanced Baseline Imager) can be effectively combined to benefit severe weather monitoring, prediction, and warning systems. The spatial and temporal fusion approach allows LEO products, such as atmospheric moisture, to be created with increased spatial detail at every GEO measurement time, generating a GEO hyperspectral sounder-like perspective. To demonstrate the potential benefit of a GEO and LEO (i.e., ABI and CrIS) data fusion to real-time applications, time sequences of the moisture profile fusion results are presented in two case studies, namely a tornado outbreak in Nebraska on 5 May 2021 and a severe storm occurrence in Texas on 24 May 2022. The implications of the fusion results for nowcasting and warning operations via comparisons to numerical model forecasts and weather radar reflectivity data are discussed.

Graphical Abstract

1. Introduction

Real-time rapid refresh high information content measurements are critical to enable the understanding, interpretation, and forecasting of severe weather events. Basic physical parameters (e.g., temperature, moisture, pressure, and wind) are being measured with instruments at a range of scales from a variety of sources such as radiosondes, aircrafts, and satellites. The key ingredients for nowcasting the likelihood of severe weather conditions are rapidly updated satellites and/or radar data. These can provide the continual monitoring of boundary-layer convergence lines that can reveal the locations where storms are likely to first develop. The measurements and products from polar orbiting hyperspectral sounders when combined with geostationary continuous multispectral imaging offer an opportunity to improve the monitoring of the likelihood of severe weather. In particular, the high vertical resolution of hyperspectral sounding products and the high horizontal and temporal resolution of imager radiances can be blended to benefit severe weather monitoring and prediction systems. This blending of an LEO sounder and a GEO imager also foreshadows the enhanced capability that future geostationary hyperspectral sounders will offer. The “imager plus sounder” (or imager/sounder) data fusion method to construct a high spatial resolution radiance and retrieval products has been previously described [1,2]. The temperature and moisture profiles achieved with the imager/sounder data fusion have been validated in a study by the Department of Energy Atmospheric Radiation Measurement Southern Great Plains Site in [3]. Additionally, trace gas concentrations and their movement have been inferred with increased detail via imager/sounder fusion in [4].
Severe weather nowcasting relies on timely information and therefore benefits from measurements made by instruments with a regional view of the atmospheric state at a high temporal frequency. For example, geostationary (GEO) multispectral imagers, like the Geostationary Operational Environmental Satellite (GOES) Advanced Baseline Imager (ABI) [5], provide full disk imagery and radiometric information of the Earth’s surface and atmosphere. The ABI covers the full disk every ten minutes in 16 spectral bands, including 10 infrared bands at a 2 km nadir spatial resolution. On the other hand, polar orbiting (low Earth orbiting—LEO) advanced infrared (IR) sounders each offer a twice daily global coverage of the top of the atmosphere infrared radiance emitted by the Earth system. Measurements are made with a nadir spatial resolution of approximately 14 km in several thousand channels within the 650–2700 cm−1 (or 3.7–15.4 μm) spectral range. These LEO sounders include AIRS (Atmospheric Infrared Sounder) on the NASA EOS (Earth Observing System) Aqua satellite, IASI (Infrared Atmospheric Sounding Interferometer) on the European MetOp satellites, and CrIS (Cross-track Infrared Sounder) [6] on the Suomi NPP (SNPP or SN) and the NOAA-20 platforms. It is noted that NOAA-20 is also called JPSS-1 (Joint Polar Satellite System-1). Since a high spectral (or hyperspectral) resolution translates to a high vertical resolution (~1 km) through the profile retrieval process, hyperspectral sounders provide more detailed information about the vertical atmospheric structure and composition than current broadband imagers and sounders, including the ABI. For example, Schmit et al. [7] note that the ABI legacy soundings rely heavily on the NWP (Numerical Weather Prediction) model’s first guess and lack the vertical information content. On the other hand, several studies have shown that additional information about the initial weather conditions, as provided by hyperspectral measurements, contribute to the improvement of the global and convective-scale numerical weather prediction [8,9], as well as operational severe weather forecasting [10,11]. Furthermore, when the temporal frequency of polar-orbiting hyperspectral sounding instruments is increased, by including all operational advanced sounders of different equatorial crossing times, valuable mesoscale detail is added to the horizontal and vertical analysis of a storm system [12]. In this paper, we attempt to further increase the temporal frequency (as well as the spatial detail) of satellite hyperspectral data products through the GEO/LEO spatial and temporal fusion approach, providing a look at the potential of a geostationary hyperspectral infrared sounder.
We present two case studies where the fusion of the LEO sounding and GEO imaging capabilities provides additional information that could improve severe weather watch area delineation and, in some cases, may offer an earlier warning of a tornado occurrence. We describe the type and quality of information that the imager/sounder fusion adds to weather monitoring and short-term forecasting. We find that the fusion method efficiently combines the sounders’ high vertical resolution profiles with the high frequency of geostationary radiance measurements, so that a fast detection of the rapid atmospheric changes causing severe weather is possible. In Section 2, an overview of the fusion method is given, and in Section 3, we present the information from the fusion retrievals in two different severe weather situations, namely a tornado outbreak in Nebraska on the 5 May 2021 and a severe storm occurrence in Texas on 24 May 2022 during the NOAA Hazardous Weather Testbed. The conclusions are given in Section 4.

2. GEO and LEO Fusion Methodology

In these case studies, the GEO imager plus the LEO sounder spatial and temporal fusion utilizes the GOES-16 ABI infrared radiances in combination with the SNPP and NOAA-20 (or JPSS-1) CrIS brightness temperatures, as well as the CrIS retrieval products. The CrIS retrieval products are generated using the dual regression (DR) method [13,14] that derives atmospheric temperature and moisture profiles, surface parameters, and cloud properties simultaneously under clear and cloudy conditions at a single field-of-view (FOV) resolution. Under clear skies, the DR method retrieves a full profile from the Earth’s surface to the top of the atmosphere (TOA). When opaque cloud conditions are present, sounding profiles are given from the cloud top to the TOA. Under semi-transparent and broken clouds, the levels below the cloud tops are provided as well.
The imager plus sounder fusion process has been described previously in [2,4] and is illustrated in Figure 1. In general, step 1 consists of a multi-dimensional nearest neighbor (or k-d tree) search between two sets of imager radiances and their associated latitudes and longitudes. These search input datasets are normalized to values between 0 and 1 to provide an equal weighting within the search. The search finds the sounder FOVs or imager pixels—also referred to as the best matches—that are the closest in radiance and geolocation to a single imager pixel. In step 2, a fused product is obtained for each imager pixel by computing the mean of the sounder retrievals associated with the best matches found in step 1.
Specifically in the ABI/CrIS spatial fusion, the inputs to the k-d tree search in step 1 are the radiances of the eight ABI IR bands at the original high spatial resolution (HIRES) as well as the same radiances converted to a low (i.e., CrIS FOV) spatial resolution (LORES). The center wavelengths of the eight bands are 6.2, 7.0, 7.3, 8.5, 10.3, 11.2, 12.3, and 13.3 μm, which correspond to ABI bands 8 through 11, and 13 through 16. These eight ABI bands have a sensitivity to the vertical distributions of temperature and moisture and thus improve the search for radiometric similarities with the CrIS. For each 2 km resolution ABI pixel (HIRES), the search finds the five ABI 14 km FOVs (LORES) that are closest in radiance and geographic space. In step 2, the original CrIS retrieval data for the five selected FOVs are averaged to generate a fusion product for each ABI pixel. In this way, spatial fusion transfers the CrIS retrieval products to the ABI spatial resolution by utilizing the ABI measurements coincident with the CrIS at the time of overpass.
Next, temporal fusion transfers the spatial fusion results from the overpass time (referred to as t0 in Figure 1) to different times (e.g., t1) using prior and subsequent ABI measurements, all at HIRES. The inputs to the k-d tree search are the HIRES imager radiances (and latitudes/longitudes), associated with the times t1 and t0 to find the best matching ABI pixels from t0 for each t1 pixel. In step 2, the ABI/CrIS fusion products from t0, associated with the five single pixels selected in step 1, are averaged to generate the fusion product for that t1 pixel. This process is then repeated for the adjacent times, e.g., timesteps t1 and t2 and so on. In short, temporal fusion finds the best matching GEO imager radiances at adjacent times via a k-d tree search, and the associated fusion retrievals are averaged to transfer the fusion retrievals to a new time.
Hence, the spatial and temporal fusion process allows high spectral (which translates to high vertical) resolution retrieval products to be generated not only at a high spatial, but also at a high temporal resolution. This creates high spatial resolution soundings that can capture the kilometer-scale atmospheric water vapor variations that are currently missing [15] and generates a ten-minute temporal rapid refresh that helps to improve the monitoring of the convective initiation.

3. Severe Weather Case Studies

3.1. Tornado Outbreak in Nebraska on 5 May 2021

The NOAA National Weather Service (NWS) Storm Prediction Center (SPC) provides daily weather information including storm reports, convective outlooks, and mesoscale analysis at https://www.spc.noaa.gov/ (accessed on 10 October 2022) According to the SPC storm report for 5 May 2021 (
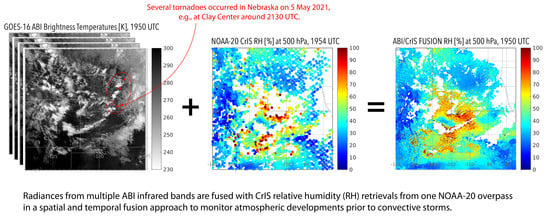
https://www.spc.noaa.gov/climo/reports/210505_rpts.html, accessed on 10 September 2022) several tornadoes occurred in Nebraska; for example, the towns of Meadow Grove and Clay Center were hit by tornadoes at 2110 UTC and 2130 UTC, respectively. The NWS SPC mesoscale discussion at 2100 UTC noted that convection continues to intensify ahead of a slowly east–southeastward advancing cold front across portions of the Central Plains. A weather watch was not issued for eastern Nebraska, but severe hail and strong winds were not ruled out. The atmospheric changes that happened in the pre-convective environment of the Clay Center tornado, not included in the NWS SPC mesoscale analysis, are the focus of our first case study. Specifically, coincident GOES-16 ABI infrared radiances with a 2 km spatial resolution are combined with the CrIS single field-of-view (SFOV ~14 km) moisture retrievals from one LEO overpass in a spatial fusion approach. Thereafter, these moisture retrievals—here in terms of relative humidity (RH), which is expressed as a percentage [%]—are transferred to a 2 km spatial and a 10 min temporal resolution at the subsequent (or earlier) ABI measurement times. This spatial plus temporal fusion is an attempt to capture the vertical detail from the hyperspectral sounder as though it was from a geostationary perspective. Could this additional information have enabled forecasters to increase the lead time for the tornado watch and possibly warning?
Our fusion investigation starts at the time of the LEO overpass. The SNPP and the NOAA-20, which is hereafter referred to as JPSS-1 (or simply J1), overpasses occurred over Nebraska at approximately 1900 UTC and 1950 UTC, respectively, on 5 May 2021. The ABI radiances are fused with the relative humidity (RH) retrievals derived from the SNPP CrIS overpass at 1900 UTC to produce one sequence of ABI/CrIS-SNPP (or A/C-SN) fused RH data. Then, the ABI is also fused with the JPSS-1 CrIS overpass at 1950 UTC to produce another independent sequence of ABI/CrIS-J1 (or A/C-J1) fused RH data. These two data sets are compared to demonstrate the strengths and weaknesses of the fusion method. Since the SNPP overpass is earlier, it contains a more subtle indication of the moisture gradients that suggest the upcoming convective conditions; this makes it more challenging to transfer the initial information forward to the tornado touchdown time. On the other hand, the JPSS-1 CrIS retrievals of the RH at 500 and 850 hPa at 1950 UTC describe the foreboding convective storms credibly, albeit at a relatively coarse spatial resolution of 14 km, shown in Figure 2a,e and then as zoomed-in views in Figure 2c,g. We focus on the lower and upper tropospheric RH (at 850 and 500 hPa) to detect low-level moisture movement into drier regions as well as upward moisture movement in updrafts, which are associated with severe thunderstorm development.
It is noted that the retrieval gaps occur below thick and opaque clouds, since our retrieval algorithm is IR only; nonetheless, retrievals at levels above the clouds are available. The ABI/CrIS spatial fusion results where the RH is now at a 2 km spatial resolution are shown in Figure 2b,f, with enlargements over the area of interest in Figure 2d,h (marking the locations of the Clay Center and Meadow Grove). The increased detail in the RH depiction from the ABI/CrIS fusion retrievals is readily apparent, as is the relatively dry mid-level over the moist lower-level air.
To investigate the changes over time, the spatial fusion from the overpass time is enhanced by several temporal fusion steps to create a time series of the RH from 1800 to 2200 UTC in 10 min intervals. Figure 3a–c shows the GOES-16 ABI brightness temperatures (BTs) for band 15 (12.3 µm), together with the 500 hPa RH fusion results for the SNPP (overpass time is 1900 UTC) and NOAA-20 (overpass time is 1950 UTC). The changes in moisture low and aloft are seen in both fusion time series, but they are more distinct in the ABI/CrIS-J1 series. Note that the temporal fusion goes forward as well as backward in time to construct these images.
To lend confidence to the spatial and temporal fusion process, we investigated the changes in the RH between the two consecutive ABI time steps from the ABI/CrIS-SNPP fusion forward in time (starting at 1900 UTC) and compared them with those from the ABI/CrIS-J1 backward in time (starting at 1950 UTC) over the fifty minutes between their overpasses. Figure 4 shows the comparison. Some 10 min changes evident in the SNPP going forward are also found in the JPSS-1 going backward and vice versa, indicating that that space–time fusion agrees for the two ABI/CrIS fusion streams. Going forward in time with the ABI/CrIS-SNPP fusion, and backward with the ABI/CrIS-J1 fusion, features not in the initial overpass fusion appear after 50 min, coming into agreement with the opposite fusion loop. While the fusion results forward and backward in time do not entirely match, the gradient changes are reasonably comparable. Differences in the magnitude can be attributed to the different instruments making the measurements as well as the differing initial atmospheric conditions at the times of the two LEO overpasses. This includes an overall weaker moisture signal found in the retrievals at the earlier SNPP overpass time, which were stronger in the later JPSS-1 retrievals (see Figure 3).
Figure 5 shows the humidity information available from the ABI/CrIS-J1 fusion at 500 and 800 hPa in comparison with the 2-hour (2 h) forecast RAP (Rapid Refresh) [16] model moisture fields at a 13 km spatial resolution at 2000, 2100, and 2200 UTC. The scale of the moisture features resolved by the RAP model at 850 and 500 hPa is too coarse to resolve the convective development at Meadow Grove or the Clay Center. The area of upper-level moistening and lower-level drying is broadly suggested but not resolved. In addition, the RAP availability at only hourly intervals limits its ability to report more rapid changes. It is of note that these fusion results are solely based on satellite observations and are independent of the model data, whereas the model forecast data (i.e., the RAP) incorporates multiple data sources. Fusion soundings enhance the coverage of soundings in a close proximity to the supercell environments; an increased sounding coverage has been shown to improve the prediction of the location where a tornado is likely to occur [17].
To further illustrate the type of atmospheric detail fusion can provide, the ABI/CrIS fusion results at the 500 and 850 hPa pressure levels are shown superimposed on the ABI Band 15 (12.3 µm) cloud background every 30 min from 20 UTC to 22 UTC in Figure 6. Additionally, shown are the corresponding Next Generation Weather Radar (NEXRAD, https://www.ncei.noaa.gov/products/radar/next-generation-weather-radar, accessed on 10 September 2022) composite reflectivities from nearby radar stations. Signs of convective instability (i.e., dry mid-level air over warm moist low-level air) are already evident at 20 UTC in the ABI/CrIS fusion, confirmed by strong NEXRAD signals, especially within and east of the line of convective clouds (i.e., eastern half of the plots); this situation intensifies quickly, indicating an increasing possibility of severe thunderstorms and tornadoes. A convective boundary layer, possibly capped by a temperature inversion, is also apparent from the 850 hPa panels, where cold dry air moves in from the west towards the Clay Center, whereas the moisture content at the higher 500 hPa level stays relatively large (one example is marked by an oval in the 2100 UTC panel). The NEXRAD shows the location of increased reflectivity but does not indicate the strength of the forcing dynamics.
Next, the ABI/CrIS fusion approach is applied to every tropospheric level to confirm the presence of a convective boundary layer; the resulting fusion humidity profiles for one specific location (about 45 km west of the Clay Center) are shown in Figure 7. Starting at 1950 UTC (i.e., time of the JPSS-1 or NOAA-20 overpass), the profiles corroborate the existence of low-level cold dry air advection over a moistening boundary layer, which is most pronounced at 2100 UTC, just 30 min before the tornado touched down in Clay Center. At 2030 UTC, the sounding shows evidence of a temperature inversion; here, in terms of the RH, this is seen as a dent at 900 hPa above the moist air near the surface. Half an hour later at 2100 UTC, this feature—and the impact of cold dry air advection together with the further moistening boundary layer—is even more pronounced. This sequence of soundings implies that moisture, heat, and instability in the PBL built up to the point when strong updrafts must have been released, resulting in severe thunderstorms, which happened at 2130 UTC in CC. The hourly RAP 2 h forecast RH profiles valid at 20 and 21 UTC are also shown (in red); however, the RAP profiles show only slight vertical changes from one hour to the next, whereas the ABI/CrIS fusion profiles successfully capture the changes in the vertical moisture distribution from one ABI measurement time to the next.
Next, when zooming in a bit further on the map, Figure 8 shows the images and profiles for three timesteps starting at 2040 UTC, which are only 10 min apart. In Figure 8, the rapid atmospheric changes that occurred within a 20 min period are well captured, for example, in the 500 hPa images, the high moisture content moves quickly eastward towards the CC in an area that feeds the convection indicated in the NEXRAD images. The fusion profiles (Figure 8d), from a location approx. 60 km west of the Clay Center, describe the same environment as mentioned previously (Figure 7), that is that the atmosphere becomes very unstable with respect to the deep convection caused by the surface air being more moist and warmer compared to the air aloft. The associated radar trends (Figure 8a) pinpoint the activity within the cloud cover and complement the clear sky ABI/CrIS fusion images.
It may be concluded, from this 5 May 2021 case study, that the fusion of the CrIS high vertical resolution profiles with the high frequency of the ABI radiance measurements allows for a timely detection of the rapid horizontal and vertical changes in the atmosphere, that can cause severe thunderstorms. The NWS SPC convective outlook, issued that day at 1630 UTC, indicated a 10% probability of thunderstorms and less than a 2% probability for tornadoes for all of Nebraska. At 2100 UTC, a weather watch was still not issued, but a locally confined and brief severe threat area east of the front was mentioned (in the NWS SPC mesoscale discussion). The additional ABI/CrIS fusion information may have suggested an adjustment to the probabilities and enabled forecasters to consider issuing a tornado watch. These results would not have been possible with either the ABI data (which lacks the vertical resolution) or the CrIS data (which lacks the temporal and horizontal resolution) alone.

3.2. High Winds and Hail in Texas on 24 May 2022

A strong mesoscale convective system (MCS) produced strong winds and severe hail from the southeast New Mexico/Texas border into parts of west-central Texas on 24 May 2022 (https://www.spc.noaa.gov/climo/reports/220524_rpts.html, accessed on 10 September 2022). An early projection of the severe weather outlook is shown in Figure 9a, where the area with an enhanced risk of severe storms (highlighted in orange) was placed too far eastward. The NWS (National Weather Service) Storm Prediction Center (SPC) issues an enhanced severe weather outlook for an area when numerous severe storms are possible and likely more persistent and widespread. The focus of this second case study is whether the additional ABI/CrIS (or geostationary hyperspectral sounder) information would have suggested a better location of the enhanced outlook area. This severe weather event has been evaluated as part of the 2022 NOAA Hazardous Weather Testbed (HWT) experiment, which is a joint project of the NWS (National Weather Service) and the National Severe Storm Laboratory (https://hwt.nssl.noaa.gov/. accessed on 10 October 2022).
Figure 9a shows the Storm Prediction Center outlook issued at 1630 UTC on 24 May 2022 along with the subsequent wind and hail reports that started coming in around 2100 UTC (there was also one tornado sighting at 2300 UTC near Garden City, TX). Most of the severe weather reports, including those in western Texas near southeastern New Mexico, appear in the ‘slight risk’ severe weather outlook area (yellow), but not in the enhanced outlook area (orange). The GOES-16 ABI images at 2300 UTC in Figure 9b,c further illustrate the severity, location, and extent of the thunderstorms across western Texas and far southeastern New Mexico at 2100 UTC.
We investigate the potential for GEO/LEO fusion for improving the location and extent of the enhanced outlook area on 24 May 2022. The GOES-16 ABI infrared radiances with a 2 km spatial resolution are fused with the JPSS-1 (i.e., NOAA-20) CrIS SFOV (~14 km) relative humidity (RH) retrievals from the 1950 UTC LEO overpass and then transferred to a 2 km spatial and a 10 min temporal resolution. Additionally, low-level moisture gradients are studied using the information contained in the rotational water vapor lines in the IR window near 12 µm.
The spatially coarse CrIS RH retrievals and the associated 2 km ABI/CrIS fusion results at the time of the overpass, are shown in Figure 10. Although convective clouds in the northeastern portion of the region reduce the overall retrieval yield, the remaining retrieval data points are sufficient to adequately describe the atmospheric conditions at the overpass time. The CrIS RH retrievals show a strong moisture gradient parallel to the southwestern border of Texas, and the ABI/CrIS fusion further sharpens the gradient depiction and fills in the gaps at both the 500 and 850 hPa pressure levels. Furthermore, the ABI/CrIS fusion captures the changing distribution of the moisture with drying below and moistening aloft (e.g., just east of Fort Stockton, TX).
Next, temporal fusion is applied to the spatial fusion results that were shown in Figure 10 (right column). Going backwards in time in 10 min interval yields the temporal fusion results, i.e., the changes in 500 and 850 hPa RH, which are shown for every hour from 1600 to 2000 UTC in Figure 11. Clearly, the tropospheric moisture distribution seen in the fusion RH products at 1600 UTC suggest that the enhanced outlook issued for severe weather at 1630 UTC could have been extended further west, even though the NEXRAD images show little activity. At 2000 UTC, the NEXRAD does confirm the strong convective activity that is coming from the west. Additionally, shown are the fusion RH profiles (in black) and the 13 km RAP 2 h forecast RH profiles (in red) for Fort Stockton at these times (Figure 11d). Whereas the RAP profiles show little vertical change over the 4 h period, the fusion profiles describe the hourly changes in the water vapor content more realistically. The upward movement of moisture expected in developing convective storms is captured in the fusion profiles. While the JPSS-1 overpass time comes after the 1630 UTC outlook, the GEO/LEO fusion suggests retroactively that the enhanced outlook could have been extended further west. In the future, a geostationary hyperspectral sounder will be able to provide this information in a timely fashion.
Another perspective is offered by the depiction of low-level moisture through the difference of the brightness temperatures in the micro window at 786.25 cm−1, minus that in the rotational water vapor line at 784.38 cm−1. This micro split window is sensitive to the moisture gradients in the lowest 100 hPa of the boundary layer [18]. Figure 12 shows the hourly progression from 1600 to 2300 UTC of low-level (i.e., below 900 hPa) moisture from southeastern New Mexico into the region below the Texas panhandle, where high winds and hail occurred, starting at 2100 UTC. Larger differences (greater than 25 K) are evident in clear skies while smaller differences (less than 15 K) appear in cloudy skies. The strong low-level moisture movement starting at 1600 UTC into the enhanced weather outlook area also suggests that the risk area could have been extended further west at that time.

3.3. Further Discussion

Although both case studies reveal the potential of the synergistic use of the GEO and LEO assets via the current fusion technique to real-time applications, there remain certain challenges and limitations. For example, the success of the fusion process depends on the initial information inherent in the sounder products. That means that the minima and maxima created in the fusion process are those available within the granule from the initial CrIS overpass data. If more extreme values in temperature or moisture occur at the previous or subsequent times of the LEO overpass, fusion cannot create them. In clear skies, this limits the depiction of extreme drying or moistening, and in cloudy skies, the cloud top pressure of the deep overshooting domes is placed too low in the atmosphere. In addition, the ABI k-d tree search for 2 km gradients in an area of interest is limited by the averaging of the 14 km SFOV measurements (or derived parameters) made by CrIS. Adjustments to the cloud mask that increase the clear sky coverage as well as decreasing the number of similar CrIS SFOVs used in the averaging process can increase the small-scale gradients but also the scatter. Turning off the cloud mask and processing all the SFOVs in the k-d tree search results in unrealistically warm temperatures in the clouds and diminishes the narrative of strong updrafts within and near the clouds. Furthermore, as emphasized by Weisz and Menzel [2], improving the spatial and temporal resolution via fusion does not alleviate the sounder measurement and retrieval errors, and it is important to account for these errors during severe weather mesoscale analysis.
We also note that Smith et al. [19] have demonstrated that GEO plus LEO fusion has the potential to improve the NWP forecast and analysis on the small-scale. Their approach incorporates the RAP in the fusion process, and thus covers more of the cloudy areas. As mentioned earlier, the RAP was not used in the fusion presented here; it was only shown for a comparison. Nevertheless, our case studies corroborate the conclusion that integrating the information content, inherent in the fusion of GEO radiances with the CrIS soundings, into a forecast model enhances the model likelihood of forecasting incipient severe weather.

4. Conclusions

In ABI and CrIS product fusion, the ABI IR radiances at a 2 km spatial resolution are combined every 10 min with CrIS retrievals (e.g., atmospheric moisture profiles) at a 14 km spatial resolution from one LEO overpass. This process transfers the CrIS moisture soundings to the ABIs high spatial as well as temporal resolution. Its performance is analyzed in two severe weather case studies.
These two case studies, involving tornadoes, hail, and high winds, demonstrated that in conditions of precursor clear skies, the fusion of GEO multispectral radiances and LEO sounding measurements can enhance severe weather outlooks, watches, and possible warnings. It is found that the reach of either instrument can be extended through a combination via the fusion approach in an efficient manner, even allowing real-time applications. Rapidly evolving atmospheric changes during the 5 May 2021 storm event in Nebraska were well depicted by the GOES-16 ABI and JPSS-1 (i.e., NOAA-20) CrIS fusion process. When investigating the tropospheric moisture profiles created with fusion, we found that the vertical detail from the hyperspectral sounder humidity profiles was maintained and realistically transferred by the ABI radiances to earlier and subsequent times. Examining the 24 May 2022 severe weather occurrence in western Texas further confirmed that a time sequence of GEO+LEO fused products can add valuable information to traditional data sources (e.g., weather radar observations) and benefit environmental monitoring and weather nowcasting/forecasting operations.
The work presented here highlights how information extracted from LEO hyperspectral sounder data can be successfully enhanced through a synergistic use with geostationary imager radiance data. We have shown that (for at least these two specific cases) the GEO/LEO fusion technique can be used as an investigative tool, enhancing severe weather nowcasts and analyses. However, LEO sounder overpass timing must be favorable and cloud conditions must be conducive for a successful depiction of the precursor conditions; an equally capable GEO sounder would greatly enhance the likelihood of timely viewing. Complementary information in cloud obstructed regions from microwave and ground-based observations adds coverage. For example, Smith et al. [19] have shown early success in enhancing the forecasts of severe weather by adding model data (such as Rapid Refresh analysis and forecasts fields) in their GEO and LEO fusion process, wherein microwave and ground-based observations have also been included.
This GEO/LEO fusion work is providing an early look at the remote sensing capabilities that will be routinely available with a geostationary hyperspectral infrared sounder (e.g., Geostationary Interferometric InfraRed Sounder (GIIRS) on FengYun-4 since 2016, [20]; InfraRed Sounder (IRS) coming on Meteosat Third Generation in 2024, [21]). As the instruments on geostationary satellites continue to evolve [22], the addition of enhanced sounding capabilities offers the opportunity for some breakthroughs in remote sensing of the Earth’s boundary layer and the detection of the early signals of impending severe weather.

Author Contributions

Conceptualization and methodology, E.W. and W.P.M.; software and validation E.W.; formal analysis and investigation W.P.M.; writing—original draft preparation and editing, E.W. and W.P.M. All authors have read and agreed to the published version of the manuscript.

Funding

This research was funded by the National Oceanic and Atmospheric Administration (NOAA), grant number NA20NES4320003.

Data Availability Statement

CrIS Level 1 and ABI Level 1 data have been provided courtesy of the Space Science and Engineering Center/University of Wisconsin-Madison.

Acknowledgments

The authors gratefully acknowledge the support from NOAA (Grant No. NA20NES4320003) and the encouragement of Dan Lindsey (NOAA GOES Program Scientist). VIIRS, CrIS, and ABI Level 1 data have been provided courtesy of the Space Science and Engineering Center/University of Wisconsin-Madison. The GOES-16 ABI images (Figure 9) were extracted from animations prepared by the UW-Madison/Cooperative Institute for Meteorological Satellite Studies (CIMSS) Satellite Blog (https://cimss.ssec.wisc.edu/satellite-blog. accessed on 10 October 2022). We also acknowledge the use of Rapid Refresh (RAP) and radar data from the NOAA National Centers for Environmental Information (NCEI). Nowcasting perspectives regarding the Hazardous Weather Testbed case study of 24 May 2022 were provided by John Cintineo from SSEC/UW.

Conflicts of Interest

The authors declare no conflict of interest.

References

  1. Weisz, E.; Baum, B.A.; Menzel, W.P. Fusion of satellite-based imager and sounder data to construct supplementary high spatial resolution narrowband IR radiances. J. Appl. Remote Sens. 2017, 11, 036022. [Google Scholar] [CrossRef] [Green Version]
  2. Weisz, E.; Menzel, W.P. Imager and sounder data fusion to generate sounder retrieval products at an improved spatial and temporal resolution. J. Appl. Remote Sens. 2019, 13, 034506. [Google Scholar] [CrossRef] [Green Version]
  3. Anheuser, J.; Weisz, E.; Menzel, W.P. Low earth orbit sounder retrieval products at geostationary Earth orbit spatial and temporal scales. J. Appl. Remote Sens. 2020, 14, 048502. [Google Scholar] [CrossRef]
  4. Weisz, E.; Menzel, W.P. Approach to Enhance Trace Gas Determinations through Multi-Satellite Data Fusion. J. Appl. Remote Sens. 2020, 14, 044519. [Google Scholar] [CrossRef]
  5. Schmit, T.J.; Gunshor, M.M.; Menzel, W.P.; Gurka, J.J.; Li, J.; Bachmeier, S.A. Introducing the Next-Generation Advanced Baseline Imager (ABI) on GOES-R. Bull. Amer. Meteor. Soc. 2005, 86, 1079–1096. [Google Scholar] [CrossRef]
  6. Han, Y.; Revercomb, H.; Cromp, M.; Gu, D.; Johnson, D.; Mooney, D.; Scott, D.; Strow, L.; Bingham, G.; Borg, L.; et al. Suomi NPP CrIS measurements, sensor data record algorithm, calibration and validation activities, and record data quality. J. Geophys. Res. Atmos. 2013, 118, 12-734. [Google Scholar] [CrossRef]
  7. Schmit, T.J.; Li, J.; Li, J.; Feltz, W.F.; Gurka, J.J.; Goldberg, M.D.; Schrab, K.J. The GOES-R Advanced Baseline Imager and the Continuation of Current Sounder Products. J. Appl. Meteor. Clim. 2008, 47, 2696–2711. [Google Scholar] [CrossRef]
  8. Thepaut, J.-N.; English, S.; McNally, A.P.; Bauer, P. Use of Satellite data at ECMWF; Document C24_Thepaut_T217B.pdf; ECMWF: Reading, UK, 2011. [Google Scholar]
  9. Lin, H.; Weygandt, S.S.; Lim, A.H.N.; Hu, M.; Brown, J.M.; Benjamin, S.G. Radiance Preprocessing for Assimilation in the Hourly Updating Rapid Refresh Mesoscale Model: A Study Using AIRS Data. Weather and Forecasting (WAF) 2017, 32, 1781–1800. [Google Scholar] [CrossRef]
  10. Púcik, T.; Groenemeijer, P. Hyperspectral Sounding for Severe Weather Forecasting—Testbeds to Assess the Potential and Practical Requirements in Europe. ESSL (European Severe Storms Laboratory) Report 2020-01. Available online: https://www-cdn.eumetsat.int/files/2021-03/20200112-Final-Report-2020-01.pdf (accessed on 10 September 2022).
  11. Esmaili, R.B.; Smith, N.; Berndt, E.; Dostalek, J.F.; Kahn, B.H.; White, K.; Barnet, C.D.; Sjoberg, W.; Goldberg, M. Adapting Satellite Soundings for Operational Forecasting within the Hazardous Weather Testbed. Remote Sen. 2020, 12/5, 886. [Google Scholar] [CrossRef] [Green Version]
  12. Weisz, E.; Smith, N.; Smith, W.L., Sr. The use of hyperspectral sounding information to monitor atmospheric tendencies leading to severe local storms. Earth Space Sci. 2015, 2, 369–377. [Google Scholar] [CrossRef]
  13. Smith, W.L., Sr.; Weisz, E.; Kireev, S.; Zhou, D. Dual-regression retrieval algorithm for real-time processing of satellite ultraspectral radiances. J. Appl. Meteor. Clim. 2012, 51, 1455–1476. [Google Scholar] [CrossRef]
  14. Weisz, E.; Smith, W.L., Sr.; Smith, N. Advances in simultaneous atmospheric profile and cloud parameter regression-based retrieval from high spectral resolution radiance measurements. J. Geophys. Res. Atmos. 2013, 118, 6433–6443. [Google Scholar] [CrossRef]
  15. Di, D.; Li, J.; Li, Z.; Li, J.; Schmit, T.J.; Menzel, W.P. Can Current Hyperspectral Infrared Sounders Capture the Small Scale Atmospheric Water Vapor Spatial Variations? Geophys. Res. Lett. 2021, 48, e2021GL095825. [Google Scholar] [CrossRef]
  16. Benjamin, S.G.; Weygandt, S.S.; Brown, J.M.; Hu, M.; Alexander, C.R.; Smirnova, T.G.; Olson, J.B.; James, E.P.; Dowell, D.C.; Grell, G.A.; et al. A North American Hourly Assimilation and Model Forecast Cycle: The Rapid Refresh. Mon. Wea. Rev. 2016, 144, 1669–1694. [Google Scholar] [CrossRef]
  17. Thompson, R.L.; Edwards, R.; Hart, J.A.; Elmore, K.L.; Markowski, P. Close Proximity Soundings within Supercell Environments Obtained from the Rapid Update Cycle. Wea. Forecast. 2003, 18, 1243–1261. [Google Scholar] [CrossRef]
  18. Sieglaff, J.M.; Schmit, T.J.; Menzel, W.P.; Ackerman, S.A. Inferring Convective Weather Characteristics with Geostationary High Spectral Resolution IR Window Measurements: A Look into the Future. J. Atm. Oceanic Tech. 2009, 26, 1527–1541. [Google Scholar] [CrossRef]
  19. Smith, W.L., Sr.; Zhang, Q.; Shao, M.; Weisz, E. Improved Severe Weather Forecasts Using LEO and GEO Satellite Soundings. Jour. Atmos. Oceanic Tech. 2020, 37, 1203–1218. [Google Scholar] [CrossRef]
  20. Yang, J.; Zhang, Z.; Wei, C.; Lu, F.; Guo, Q. Introducing the new generation of Chinese geostationary weather satellites, Fengyun-4. Bull. Amer. Meteor. Soc. 2017, 98, 1637–1658. [Google Scholar] [CrossRef]
  21. Holmlund, K.; Grandell, J.; Schmetz, J.; Stuhlmann, R.; Bojkov, B.; Munro, R.; Lekouara, M.; Coppens, D.; Viticchie, B.; August, T.; et al. Meteosat Third Generation (MTG): Continuation and Innovation of Observations from Geostationary Orbit. Bull. Amer. Meteor. Soc. 2021, 102, 990–1015. [Google Scholar] [CrossRef]
  22. Menzel, W.P. History of Geostationary Weather Satellites. In The GOES-R Series; Goodman, S., Ed.; Elsevier: Amsterdam, The Netherlands, 2020; pp. 5–11. [Google Scholar] [CrossRef]
Figure 1. Schematic of the LEO sounder plus GEO imager spatial (in green) and temporal (blue) fusion approach. The fusion process starts at the sounder overpass time t0, and the first temporal fusion occurs between t0 and an adjacent timestep t1; temporal fusion is then repeated for the next neighboring times. LORES and HIRES refer to low spatial and high spatial resolution, respectively.
Remotesensing 14 05327 g001
Figure 2. Relative humidity (RH) in [%] for the 500 hPa (ad) and the 850 hPa (eh) pressure levels on 5 May 2021. RH retrievals derived from CrIS on JPSS-1 are shown in (a,e), and the boxed areas are shown enlarged in (c,g); ABI/CrIS RH fusion results are shown in (b,f), and the boxed areas are shown enlarged in (d,h), where the towns of Meadow Grove and Clay Center (Nebraska) are marked as black triangles.
Remotesensing 14 05327 g002
Figure 3. (a) ABI Band 15 (12.3 µm) brightness temperature (BT) measured every hour from 1800 to 2200 UTC; (b) 10 min temporal ABI/CrIS-SNPP (A/C-SN) fusion results of RH, starting at the SNPP overpass time at 1900 UTC, are shown every hour from 1800 to 2200 UTC; and (c) 10 min temporal ABI/CrIS-JPSS-1 (A/C-J1) fusion results of RH, starting at the JPSS-1 overpass time at 1950 UTC, are shown every hour from 1800 to 2200 UTC.
Remotesensing 14 05327 g003
Figure 4. Top: 10 min time differences in ABI/CrIS-SN fusion results of RH [%] at 500 hPa from 1900 to 1950 UTC over Nebraska, starting at the SNPP overpass time at 1900 UTC; bottom: 10 min time differences in ABI/CrIS-J1 fusion results of RH [%] at 500 hPa from 1900 to 1950 UTC over Nebraska, starting at the JPSS-1 overpass time at 1950 UTC. Examples of moisture changes that correctly reshape into the other instrument’s results are marked by ovals (dashed and solid lines refer to initial and created features, respectively).
Remotesensing 14 05327 g004
Figure 5. (a) ABI Band 15 (12.3 µm) brightness temperatures (B15 BT), (b) RAP RH [%] at 500 hPa, (c) ABI/CrIS-J1 fusion RH [%] at 500 hPa, (d) RAP RH [%] at 850 hPa, and (e) ABI/CrIS-J1 fusion RH [%] at 850 hPa, for 2000 UTC (top row), 2100 UTC (middle row), and 2200 UTC (bottom row) on 5 May 2021 over Nebraska. Locations of Meadow Grove (NE) and Clay Center (NE) are shown in middle panel of column (a).
Remotesensing 14 05327 g005
Figure 6. (a) NEXRAD composite reflectivity in [dBZ]; (b) ABI/CRIS-J1 fusion results for relative humidity (RH) in [%] at 500 hPa; and (c) ABI/CRIS-J1 fusion results for relative humidity (RH) in [%] at 850 hPa every 30 min from 2000 UTC to 2200 UTC on 5 May 2021 in Nebraska. ABI Band 15 (12.3 µm) brightness temperatures are shown in the background of panels (b,c). Tornado touchdown locations (MG and CC) are marked in the 2100 UTC panels, and an example of a low-level dry air pocket are highlighted and ovals panels (b,c) at 2100 UTC. Note the different color scale for panels b and c.
Remotesensing 14 05327 g006
Figure 7. ABI/CrIS-J1 RH fusion profiles at 1950 (JPSS-1 overpass time), 2030, 2100, and 2130 UTC at 40.48°N 98.74°W (indicated by a black star in the left plot showing the 850 hPa RH fusion results at 2100 UTC as in Figure 6), about 45 km west of Clay Center (CC). Fusion profiles are shown in black, and the RAP 2 h forecast RH profiles valid at 2000 and 2100 UTC are shown in red.
Remotesensing 14 05327 g007
Figure 8. (a) Regional NEXRAD composite reflectivity; (b) ABI/CrIS fusion RH [%] at 500 hPa; (c) ABI/CrIS fusion RH [%] at 850 hPa; and (d) ABI/CrIS fusion RH profiles for the location marked by a black asterisk in panels (b,c), about 60 km west of Clay Center (CC) at 2040 UTC (top row), 2050 UTC (middle row), and 2100 UTC (bottom row) on 5 May 2021. Note the different color scale for panels (b,c).
Remotesensing 14 05327 g008
Figure 9. (a) Storm Prediction Center Categorical Outlook (https://www.spc.noaa.gov/products/outlook/archive/2022/day1otlk_v_20220524_1630.gif, accessed on 10 September 2022) issued at 1548 UTC on 24 May 2022 valid for 1630 UTC until 1200 UTC the following day. Subsequent weather reports are indicated by the blue (wind) and green (hail) dots. (b) GOES-16 ABI visible (0.64 μm) image at 23:00 UTC; (c) GOES-16 ABI infrared window (10.35 μm) image at 23:00 UTC. Panels (b,c) are adapted from animations from https://cimss.ssec.wisc.edu/satellite-blog/archives/46521 (accessed on 10 September 2022).
Remotesensing 14 05327 g009
Figure 10. Left: CrIS on JPSS-1 RH [%] retrievals at 500 and 850 hPa at 1950 UTC on 24 May 2022; right: ABI/CrIS-J1 fusion of RH at 500 and 850 hPa, with ABI Band 15 (12.3 µm) brightness temperatures in the background.
Remotesensing 14 05327 g010
Figure 11. (a) Regional NEXRAD composite reflectivity [dBZ]; (b) ABI/CrIS fusion RH at 500 hPa; (c) ABI/CrIS fusion RH at 850 hPa; and (d) ABI/CrIS-J1 fusion RH profiles (black) and RAP RH profiles (red) for Fort Stockton hourly from 1600 UTC to 2000 UTC on 24 May 2022 over parts of western Texas (black crosses indicate locations of Midland, Garden City and Fort Stockton, TX).
Remotesensing 14 05327 g011
Figure 12. Hourly ABI/CrIS-J1 (A/C-J1) fusion results of the brightness temperature (BT) differences in [K] between CrIS channels at 786.25 cm−1 and 784.38 cm−1, are shown from 1600 to 2100 UTC on 24 May 2022 (black crosses indicate locations of Midland, Garden City and Fort Stockton, TX).
Remotesensing 14 05327 g012
Publisher’s Note: MDPI stays neutral with regard to jurisdictional claims in published maps and institutional affiliations.

