Article

Ship Classification in Synthetic Aperture Radar Images Based on Multiple Classifiers Ensemble Learning and Automatic Identification System Data Transfer Learning

College of Aerospace Science and Engineering, National University of Defense Technology, Changsha 410073, China
*
Author to whom correspondence should be addressed.
Remote Sens. 2022, 14(21), 5288; https://doi.org/10.3390/rs14215288
Submission received: 24 September 2022 / Revised: 17 October 2022 / Accepted: 20 October 2022 / Published: 22 October 2022

Abstract

:
With the continuous development of earth observation technology, space-based synthetic aperture radar (SAR) has become an important source of information for maritime surveillance, and ship classification in SAR images has also become a hot research direction in the field of maritime ship monitoring. In recent years, the remote sensing community has proposed several solutions to the problem of ship object classification in SAR images. However, it is difficult to obtain an adequate amount of labeled SAR samples for training classifiers, which limits the application of machine learning, particularly deep learning methods, in SAR image ship object classification. In contrast, as a real-time automatic tracking system for monitoring ships at sea, a ship automatic identification system (AIS) can provide a large amount of relatively easy-to-obtain labeled ship samples. Therefore, to solve the problem of SAR image ship classification and improve the classification performance of learning models with limited samples, we proposed a SAR image ship classification method based on multiple classifiers ensemble learning (MCEL) and AIS data transfer learning. The core idea of our method is to transfer the MCEL model trained on AIS data to SAR image ship classification, which mainly includes three steps: first, we use the acquired global space-based AIS data to build a dataset for ship object classification models training; then, the ensemble learning model is constructed by combining multiple base classifiers; and finally, the trained classification model is transferred to SAR images for ship type prediction. Experiments show that the proposed method achieves a classification accuracy of 85.00% for the SAR ship classification, which is better than the performance of each base classifier. This proves that AIS data transfer learning can effectively solve the problem of SAR ship classification with limited samples, and has important application value in maritime surveillance.

Graphical Abstract

1. Introduction

With the continuous development of remote sensing technology, space-based synthetic aperture radar (SAR) images have become an important source of information for maritime surveillance. The space-based SAR system uses electromagnetic waves to generate remote sensing images; therefore, it can eliminate the influence of complex weather and working time limits and has the characteristics of wide detection coverage. At present, SAR has been widely used in maritime ship monitoring and environment management, such as ship classification and recognition, maritime traffic control, oil spill detection, and sea ice classification [1,2,3,4,5,6]. In recent years, with the development and application of high-resolution SAR satellites such as the Gaofen-3, Sentinel-1A/B, and TerraSAR-X satellites, SAR images with richer object features can be obtained, which greatly promotes the application of SAR image ship classification in maritime surveillance.
As a key technology in maritime surveillance, SAR image ship classification has always been a hot and open issue in the field of remote sensing research. Therefore, for the classification of ship objects in SAR images, the remote sensing community has proposed many solutions, which are mainly divided into two categories: traditional classification methods based on manual feature extraction, and classification methods based on deep learning. Among them, the traditional SAR image ship classification methods have mainly been studied from two aspects: feature selection and classifier design. For example, Xing et al. [7] proposed to construct a sparse representation dictionary with the ship geometric features and electromagnetic scattering characteristics and used the sparse representation classification (SRC) method to classify ships in TerraSAR-X SAR images. Lang et al. [8] proposed a joint feature and classifier selection method to improve the performance of ship classification in SAR images by integrating the classifier selection strategy into the wrapper feature selection framework. Xu et al. [9] proposed a distribution shift metric learning (DML-ds) method by adding an inter-class distribution shift (ICDS) regularization term to distinguish the distribution differences between different subordinate-level categories, which improved inter-class separability and compactness, enabling performance for fine-grained ship object classification in SAR images. Wang et al. [10] proposed a hierarchical ship object classifier for COSMO-SkyMed SAR data based on the geometric and backscattering characteristics of ships, which realized classification for bulk carriers, container ships, and oil tankers. Ji et al. [11] proposed a ship classification method based on classifier combination and adopted the SVM combination strategy to realize the classification of container ships, oil tankers, and bulk carriers in TerraSAR-X SAR images. Margarit et al. [12] proposed a ship classification method for single-pol SAR images based on fuzzy logic (FL), which combined ship geometric features and radar cross-section (RCS) values. Zhang et al. [13] proposed a ship classification method based on scattering component analysis for COSMO-SkyMed SAR images by analyzing the scattering components of the superstructure of different ship types. Wu et al. [14] proposed a new ship classification model BDA-KELM by combining two key elements of traditional ship classification methods, i.e., feature selection and classifier design. This method combined the kernel extreme learning machine (KELM) and the dragonfly algorithm in binary space (BDA) for automatic feature selection and searching for the optimal parameter set of the classifier, and has been effectively verified in TerraSAR-X SAR images. Lang et al. [15] proposed naive geometric features (NGFs) for ship classification and adopted the multiple kernel learning (MKL) method to learn the combined weights of different features to improve the ship classification capabilities of medium-resolution SAR images. Leng et al. [16] proposed a new feature named “Comb” for high-resolution SAR image ship classification based on the analysis of ship object radar cross-section (RCS) statistics data related to ship structure. Jiang et al. [17] proposed a ship classification method for SAR images based on the ship superstructure scattering features. This method used the proposed ratio of dimensions (Rod) to describe ship structure in SAR images and classified bulk carriers, container ships, and oil tankers by constructing feature parameter vectors. It can be seen that there are many SAR image ship classification methods combined with traditional manual feature extraction. However, most of these SAR image ship classification methods use a single classifier. As an active sensor, SAR is almost free from all-weather conditions [18]. Owing to the unique imaging mode and complex electromagnetic wave scattering process of SAR [19], the image contains a large amount of object and non-object information and their complex features; thus, a single classifier trained with the manually extracted shallow features cannot accurately and effectively express the content in images, and the robustness and generalization performance of single classification method are relatively poor. Moreover, in addition to geometric features, these methods often extract electromagnetic scattering characteristics, which affects the efficiency of maritime ship monitoring to a certain extent.
In recent years, with the rise of data-driven deep learning technology, many researchers have attempted to develop SAR image ship classification algorithms based on convolutional neural networks (CNNs). Compared with traditional manual feature extraction methods, CNNs can automatically learn more nonlinear hierarchical deep features directly from a large number of training samples, which injects powerful vitality into the SAR image ship classification. He et al. [20] proposed a densely connected triplet CNN framework based on advanced densely connected convolutional networks (DenseNets), and combined the Fisher discrimination regularization term and deep metric learning for ship classification in medium-resolution SAR images. Lu et al. [21] applied CNNs to SAR ship classification and adopted data augmentation and transfer learning methods to solve the model overfitting problem that frequently occurs in training on small datasets. Zhang et al. [22] proposed a polarization fusion network with geometric feature embedding (PFGFE-Net) for SAR image ship classification by combining dual-polarization features and geometric features. The PFGFE-Net can effectively solve the problems of insufficient polarization utilization and traditional feature abandonment. Sharifzadeh et al. [23] proposed a neural network model based on the hybrid of CNN and multi-layer perceptron (CNN-MLP) for image classification, which improved the accuracy of SAR image ship classification. Dong et al. [24] proposed a ship classification framework for high-resolution SAR images based on a deep residual network (ResNet) and trained the model with three different fine-tuning strategies to achieve fine-grained ship classification. Bentes et al. [25] proposed a full workflow for SAR image maritime object detection and classification on TerraSAR-X high-resolution images and used CNN to classify five maritime classes. Xu et al. [26] proposed a SAR ship classification method based on a multi-scale convolutional neural network (MS-CNN), and employed the multi-scale feature fusion to enhance the feature expression ability through three steps, namely flattening, integrating, and classifying. Wu et al. [27] proposed a joint convolutional neural network framework for small-scale ship objects classification in SAR images by combining a generator and a classifier. Specifically, the generator was used to reconstruct small-scale low-resolution images to large-scale super-resolution images and the classifier was used for SAR image ship classification. Zeng et al. [28] proposed a CNN method based on a hybrid channel feature loss function for dual-polarized SAR image ship classification that can further classify ships into eight accurate categories by utilizing the polarization characteristics of different channels. Huang et al. [29] proposed a group squeeze excitation sparsely connected convolutional networks (GSESCNNs) for SAR image object classification by combining sparsely connected convolutional networks and group squeeze excitation module, and proved the effectiveness of this method by using moving and stationary target acquisition and recognition (MSTAR) SAR images. Although CNNs can effectively avoid the tedious manual feature extraction process, they require the use of massive samples to automatically learn the characteristics of different types of ships. In practical applications, it is relatively difficult to build a ship object dataset of SAR images. In addition, to obtain better classification performance, a more complex deep convolution neural network model is usually needed, which requires more time and computational power.
In contrast, the automatic identification system (AIS) can provide a large number of relatively easy-to-obtain labeled ship samples, which provides an effective solution for SAR ship object classification research with limited samples. AIS is a real-time tracking and self-reporting system for ships sailing around the world that can identify and locate maritime ships through communications between nearby ships, and space-based and shore-based stations. AIS adopts open broadcast technology; therefore, it can periodically broadcast rich ship information, including static information (such as ship identity, size, and type), dynamic information (such as ship position, speed, and heading), and voyage-related information (such as ship draught and destination), allowing us to classify ships in detail. Since 2002, the International Maritime Organization (IMO) has mandated that international navigation ships with 300 gross tonnage and upwards and all passenger ships must be equipped with AIS equipment; especially with the development and application of space-based AIS technology, the spatial-temporal data we obtained for ships has grown rapidly. AIS plays an important role in maritime surveillance and has been widely used for ship identification and tracking, ship collision avoidance, anomaly detection, marine traffic control, and trade analysis [30,31,32,33,34]. At present, some studies have attempted to transfer AIS data to SAR image ship classification. For example, Snapir et al. [35] used AIS data to train a random forest classifier and then transferred the trained model to SAR images for classifying fishing and non-fishing ships. Lang et al. [36] proposed an improved multi-class adaptive support vector machine (A-SVM) method, which significantly improved the classification performance of traditional methods through transfer learning between the AIS data and SAR image. Rodger et al. [37] used the transfer learning method to apply AIS data to ship classification in SAR images and proposed a classification-aided data association technique to improve the accuracy of SAR and AIS data association in dense shipping environments. It can be seen that there are relatively few studies on applying AIS data to SAR image ship classification, and the classification performance still needs to be improved. In addition, the remote sensing community also applies AIS data to other research activities in the SAR field, such as the development and verification of SAR image ship object detection and recognition algorithms, construction of SAR image open benchmark datasets, and synthesis of the AIS data and SAR images for maritime ship monitoring and control [38,39,40,41].
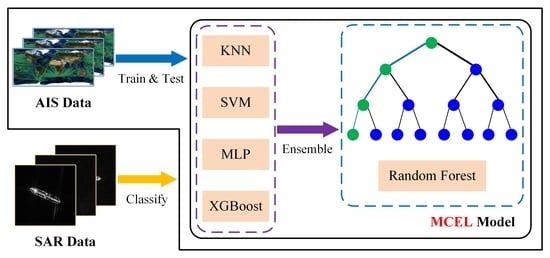
Through the above analysis, we can find that most existing SAR image ship classification and recognition methods use a single classifier, which does not fully consider the learning ability of different classifiers for ship features. However, in the SAR ship classification task, a single classifier cannot fully distinguish the differences between the sample attributes, resulting in a poor generalization of the model. In addition, ship classification in SAR images based on deep learning methods requires a large number of samples for training models. Therefore, to solve the problem of ship classification in SAR images with limited samples, we proposed a method of ship classification in space-based SAR images based on multiple classifiers ensemble learning and AIS data transfer learning, which is used to classify four types of ships at sea: cargo ships, tanker ships, fishing ships, and passenger ships. Experimental results show that the classification performance of our method is better than those of various base classifiers, which proves the feasibility and effectiveness of the method in improving the classification performance of SAR ships. The main contributions of this paper are as follows:
(i)
Considering the differences in the learning ability of different classifiers, this paper proposed an ensemble learning method that combines the classification probability strategy and successfully applies it to AIS data-aided SAR image ship classification. Our method realizes ship classification in SAR images with limited samples by using ensemble learning and AIS data transfer learning, which has good application value in maritime surveillance;
(ii)
In this paper, we transferred the ensemble learning model trained on AIS data to SAR images for ship classification. Therefore, comprehensive feature engineering was performed on the space-based AIS data and the influence of different ship geometric features on the model was studied. The superiority of the feature extraction method in this paper was verified through various benchmark tests, which provided a guarantee for a more accurate SAR ship classification;
(iii)
We conducted a detailed analysis of the received space-based AIS data and adopted the interquartile range (IQR) and SMOTE methods to solve the problem of outliers and class imbalance in AIS data to provide high quality samples for model training. These preprocessing methods could improve the classification performance of the ensemble learning model.
The remainder of this paper is organized as follows. Section 2 describes the proposed method, including the AIS data preprocessing, ship feature extraction, and the detailed implementation of our method. Section 3 presents experimental results and provides a comprehensive comparison with other classification methods. Finally, Section 4 concludes the paper and introduces future work.

2. Materials and Methods

This section describes the overall framework of our method for transferring AIS data to SAR images for high-accuracy ship type prediction, as shown in Figure 1. The implementation process of the proposed method mainly includes three steps. First, the AIS data is preprocessed, including data cleaning and denoising, outliers removal, and class imbalance processing, and then ship feature extraction is performed on the preprocessed AIS data to build the AIS dataset. Second, a random forest (RF) algorithm is adopted as the ensemble classifier, and four base classifiers (i.e., KNN, SVM, MLP, and XGBoost) are combined by the learning strategy to construct the multiple classifiers ensemble learning (MCEL) model, and then the classification model is trained and tested. In this step, the MCEL model trained on the AIS dataset is transferred to SAR image ship classification. The detailed process of this step is shown in Section 2.3. Finally, the geometric features of ship objects in SAR images are extracted and calculated, and the extracted features are input into the trained MCEL model for ship type prediction to obtain the final classification result.

2.1. AIS Data Preprocessing and Feature Extraction

2.1.1. AIS Data Preprocessing

The AIS data used in this paper to perform research on the SAR image ship classification method are received by the HaiYang-1C (HY-1C) and HaiYang-2B (HY-2B) satellites. Both satellites are equipped with high-sensitivity AIS receivers that can track and report global sailing ships. Figure 2 shows a chart drawn using part of the AIS data received by the HY-1C satellite.
AIS data contains rich ship information, such as ship identity, ship size, ship category, and ship position. In practical applications, AIS messages can be manually input, and there is a problem of missing transmission and receiving, which may lead to format errors, missing fields, data duplication, and other problems in the decoded space-based AIS data. Therefore, data cleaning and denoising are required. In this paper, data preprocessing mainly includes deleting the noise data in AIS messages that do not conform to the data format specification and omit important information. In addition, only one piece of duplicate data with the same maritime mobile service identity (MMSI) code was reserved. Through data preprocessing, reliable AIS data can be obtained for ship classification model training and testing.

2.1.2. AIS Data Ship Feature Extraction

The purpose of this paper is to transfer AIS data to SAR images for ship object classification research, so that the ship features extracted from AIS data can be extracted from SAR images. AIS data contains 27 types of messages, covering static information, dynamic information, and voyage-related information of ships sailing around the world. Among them, only some attribute fields in the messages obtained by AIS receivers are useful for SAR ship classification, specifically ship type and the attribute fields A, B, C, and D, reflecting the overall size of ships, which are the distances from the reference point O used to report the position of the ship to the bow, stern, port, and starboard, respectively, as shown in Figure 3. In other words, the length and width of ships contained in the AIS data in this paper are two basic features that can be transferred.
According to the ship size structure shown in Figure 3, the Length (f1) and Width (f2) of the ship in the AIS data are as follows:
{ L e n g t h   [ f 1 ] = A + B W i d t h   [ f 2 ] = C + D
Based on the ship Length and Width features, we extracted two types of commonly used geometric features by feature engineering: the strictly defined geometric features (SGFs) [7,36,42] and the naive geometric features (NGFs) [15,22,36]. In addition to the Length and Width, SGFs also include the Perimeter (f3), Area (f4), Aspect Ratio (f5 and f6), and Shape Complex (f7), which can be calculated using Equation (2):
{ P e r i m e t e r   [ f 3 ] = 2 × ( L e n g t h + W i d t h ) A r e a   [ f 4 ] = L e n g t h × W i d t h A s p e c t   R a t i o   ( 1 )   [ f 5 ] = L e n g t h / W i d t h A s p e c t   R a t i o   ( 2 )   [ f 6 ] = W i d t h / L e n g t h S h a p e   C o m p l e x   [ f 7 ] = ( L e n g t h + W i d t h ) 2 / ( L e n g t h × W i d t h )
Compared to SGFs, NGFs contain a wider range of geometric feature elements. Research results have shown that NGFs can ensure satisfactory classification performance while reducing the complexity of image processing [22,36]. Inspired by this, we expand the SGFs, that is, the extracted NGFs include not only features f1f7, but also f8f16 given by Equation (3) and other features, which focus on different aspects of ship characteristics. The relevant definitions of the extracted features f8f16 are shown in Equation (3).
{ f 8 = L e n g t h W i d t h f 9 = L e n g t h / ( L e n g t h + W i d t h ) f 10 = W i d t h / ( L e n g t h + W i d t h ) f 11 = ( L e n g t h W i d t h ) / ( L e n g t h + W i d t h ) f 12 = ( L e n g t h W i d t h ) × ( L e n g t h + W i d t h ) f 13 = L e n g t h 2 / ( L e n g t h 2 + W i d t h 2 ) f 14 = W i d t h 2 / ( L e n g t h 2 + W i d t h 2 ) f 15 = ( L e n g t h × W i d t h ) / ( L e n g t h 2 + W i d t h 2 ) f 16 = ( L e n g t h 2 W i d t h 2 ) / ( L e n g t h 2 + W i d t h 2 )
The message5 in AIS data is used to report the static and voyage-related information of ships, which contains the detailed ship types. We selected four main types of ships sailing at sea as the research objects: cargo ships, tanker ships, fishing ships, and passenger ships. Finally, the data format of the i-th ship in the AIS dataset can be obtained by combining the ship type, as shown in Equation (4).
S i = [ f 1 i ,   f 2 i ,   f 3 i , ,   f 16 i ,   T y p e i ] T

2.1.3. AIS Dataset Built

The static information in the obtained space-based AIS data can be manually input; therefore, there are some unreasonable anomalous data in the sample set. To ensure the reliability of the sample data used for training the classification model, we adopted the interquartile range (IQR) method to remove outliers, which is robust to anomalous data identification. The specific implementation process is as follows: first, the upper quartile Qu, the lower quartile Ql, and the interquartile range IQR (the difference between Qu and Ql, i.e., IQR = QuQl) of the AIS data samples are obtained; then, the data with the characteristic values outside [Ql 3IQR, Qu + 3IQR] in the AIS data are regarded as anomalous values, and the corresponding ship information entries are deleted. This paper takes the SGFs as an example and draws boxplots before and after removing outliers in AIS data. Figure 4a,b show the data distribution of passenger ship samples before and after removing outliers, respectively. Figure 4c,d show the data distribution of the four types of ships (cargo ships, tanker ships, fishing ships, and passenger ships) before and after removing outliers.
In addition, due to the imbalanced distribution of various types of ships in AIS data, most classifier models assume that the samples are balanced, which causes classifiers to ignore ship types with small sample sizes. Therefore, to overcome the adverse effect of class imbalance on training classifiers, we adopted the Synthetic Minority Over-sampling TEchnique (SMOTE) [43] method to reduce the prediction deviation of ship type caused by class imbalance. The core idea of the SMOTE is to synthesize new minority class samples by interpolating existing samples. The main flow of the algorithm is as follows:
(i)
First, for a minority class with T samples in the training set, calculate the k nearest neighbors xi(near) of sample xi in the class, where i { 1 , 2 , , T } , n e a r { 1   , 2 , , k } ;
(ii)
Then, a sample xi(nn) is randomly selected from its k nearest neighbors and a random value λ ( λ [ 0 , 1 ] ) is generated to create a new synthetic sample according to Equation (5):
x ^ i = x i + λ ( x i ( n n ) - x i )
(iii)
Finally, step (ii) is repeated N times to synthesize N new samples xi(new), where n e w { 1 , 2 , , N } .
Therefore, NT samples can be synthesized for all T samples of the minority class in the training set by performing the above operations. The pseudocode for the implementation of SMOTE can be found in [43].
Through the preprocessing steps in this section, the AIS dataset DAIS finally built in this paper can be expressed as:
D A I S = { S 1 , S 2 , , S n }

2.2. SAR Image Ship Feature Extraction

Space-based SAR is an active microwave imaging system that is not limited by the weather and time. However, owing to the interference of sea clutter and the influence of ship motion, SAR images will be blurred in the azimuth and range directions during imaging, resulting in “drag” and “cross” phenomena at the edge of the ship’s main area. Therefore, it is more difficult to extract the geometric features of SAR ships under such imaging characteristics, which makes it difficult for us to obtain the true contour of a ship, and greatly affects the classification and recognition performance of ship objects. Researchers usually use the minimum bounding rectangle (MBR) around a ship to solve the problem of geometric feature extraction of ship objects in SAR images. Therefore, to accurately extract the MBR of ships in SAR images, this paper adopted a method for extracting the MBR of ships that combines the Radon transform and mathematical morphology calculation. The main process is as follows:
(i)
Radon transform was performed on the original SAR image (as shown in Figure 5a) to obtain the rotation angle of the ship object area and the main axis direction (as shown in Figure 5b);
(ii)
The mathematical morphology calculations were performed on the radon transformed SAR images to perform operations such as edge “burr” removal and regional fracture filling on the ships (as shown in Figure 5c);
(iii)
This paper extracted the MBR of ship objects from the processed SAR images (see Figure 5c) and calculated the true length and width of ship objects according to the length and width of the MBR. Experimental results show that this method can simply and effectively extract the geometric features of ship objects in SAR images and ensure reliable classification accuracy.
Finally, we extract the geometric feature elements of ships in SAR images according to Equations (2) and (3) in Section 2.1, where the format of the m-th SAR ship sample is shown in Equation (7):
S S A R m = [ f S A R 1 m ,   f S A R 2 m ,   f S A R 3 m , ,   f S A R 16 m ,   T y p e S A R m ] T
Figure 6a,b show the length and width distributions of the various types of ships in the AIS data and SAR images, respectively. It can be seen that the AIS data have a similar ship feature distribution to SAR data, so it is reasonable to transfer AIS data to SAR image ship classification, which provides an effective way to solve the problem of SAR ship classification with limited samples.
As can be seen from Figure 6, passenger ships and fishing ships are mostly small- and medium-sized ships, while cargo ships and tanker ships are much larger. In addition, passenger ships and fishing ships, cargo ships and tanker ships are highly similar in terms of length and width. Therefore, to accurately predict ship types, this paper conducts comprehensive feature engineering in Section 2.1.2 to extract new distinguishing features. The experimental results show that the features extracted in this paper can better distinguish various types of ships and effectively improve the classification performance of ship objects.

2.3. Multiple Classifiers Ensemble Learning Model Construction

Owing to the differences in feature learning between different classifiers, this paper proposed a multiple classifiers ensemble learning model to improve the prediction accuracy of ship objects in SAR images. Multiple classifiers ensemble learning is used to construct and combine multiple base classifiers to complete the learning task. The MCEL model can compensate for the shortcomings of each classifier through the advantages of other classifiers to improve the final performance of object classification under uncertain conditions and can obtain better results than a single classifier. The overall framework of the MCEL model constructed in this paper is shown in Figure 7. The specific implementation process is as follows. First, we studied and implemented four types of base classifiers, namely KNN, SVM, MLP, and XGBoost, and trained and test each model. Then, we designed an ensemble learning strategy based on the random forest algorithm, which combines the outputs of the base classifiers and feeds them into the ensemble classifier RF for training. Finally, the MCEL model was evaluated. The experimental results show that our method can achieve better performance than a single classifier and improve the classification accuracy of SAR ship objects.
In this paper, we chose classic machine learning methods KNN, SVM, MLP, and XGBoost as the base classifiers [23,44,45,46]. These methods are the most commonly used and effective supervised learning algorithms, and have been widely used in object classification tasks. Among them, KNN measures the distance between the unknown samples (test samples) and known samples (training samples), and the mechanism of it is simple and easy to implement. This paper selected the Euclidean distance to calculate the distance between two feature vectors and used the KD-tree algorithm to optimize the calculation for the KNN model. The SVM method can reduce the sample error and maximize the generalization ability of the model using the structured risk minimization principle. SVM has many unique advantages in solving nonlinear and high-dimensional pattern recognition problems and can ensure better classification performance with limited samples. MLP is a classical forward structure artificial neural network that can solve linear inseparable problems that cannot be solved by a single-layer perceptron. An MLP consists of an input layer, an output layer, and one or more hidden layers, and each layer is connected by weight vectors. We used the ReLU activation function in each hidden layer and the Softmax function as the output function in the output layer of the MLP to support multi-class ship classification. XGBoost algorithm is a scalable end-to-end tree boosting system. Its scalability in all scenarios makes it widely used in many machine learning and data mining applications. In addition, XGBoost has the advantages of fast learning speed and high computational efficiency, and can ensure better classification accuracy. It can be seen that these methods have their characteristics and solve the problem of object classification from different perspectives, so these models are selected as the base classifiers. The parameter optimization of each classifier was performed by the grid search method to ensure that the best performance classification model could be obtained.
After completing the design of the four base classifiers, this paper adopted random forest [47] as the ensemble classifier. RF is an ensemble learning algorithm that completes learning tasks by constructing and combining multiple decision trees. Random forest introduces random feature selection in the training process of decision trees and trains multiple decision trees from the perspective of sample dimensions and feature dimensions, which can significantly reduce the overfitting risk of the model. The training and testing process of the random forest is simple and fast, and it has the advantages of processing high-dimensional data and strong generalization ability; therefore, we choose it as the ensemble classifier for the research of AIS data-aided SAR image ship classification.
When the construction of the base classifiers and ensemble classifier is completed, the overall process of training the MCEL model in this paper is shown in Figure 7, which mainly includes the following steps:
(i)
First, the dataset D is randomly divided into D1 and D2, and the data set D1 is used to train and test the four base classifiers, namely KNN, SVM, MLP, and XGBoost, to generate the learning models with the best performance;
(ii)
Then, the dataset D2 is input into the trained base classifiers, and the predicted value P (the probability that the sample belongs to each class, a vector of 4 × 1) of the base classifiers is combined with the ship type of D2 to form a new dataset Dnew. The format of the j-th sample in Dnew is given by Equation (8).
S new j = [ P 1 j , P 2 j , P 3 j , P 4 j , T y p e j ] T
where, Pij is the prediction result (probability value) of the i-th base classifier (KNN, SVM, MLP, and XGBoost) on sample j;
(iii)
Finally, Dnew is used to train the ensemble learning model, and the trained MCEL model is transferred to the SAR image test dataset for ship object classification. Experimental results show that our method can improve the performance of SAR image ship classification.
The pseudocode of the MECL algorithm flow is shown in Algorithm 1.
Algorithm 1. Pseudocode for the MCEL Algorithm
Input: training datasetD1 = {(x11, y11), (x12, y12),…,(x1m, y1m)},
D2 = {(x21, y21), (x22, y22),…,(x1m, y1m)},
   Base classifier algorithms: L1 = KNN, L2 = SVM, L3 = MLP, L4 = XGBoost;
   Ensemble classifier algorithm: L = RF.
Process:
1: for i = 1, 2, 3, 4 do
2:    hi = Li (D1);
3: end for
4: Dnew = Ø;
5: for j = 1,2,…,n do
6:    for i = 1, 2, 3, 4 do
7:      Pij = hi(x2j);
8:    end for
9:    Dnew = Dnew∪((P1j, P2j, P3j, P4j), y2j);
10: end for
11: h = L(Dnew);
Output:H(x) = h(h1(x), h2(x), h3(x), h4(x))

3. Experimental Results and Analysis

3.1. Datasets and Experimental Settings

AIS dataset. In this paper, the space-based AIS data received by the HY-1C and HY-2B satellites were preprocessed and ship features extracted, and 8000 samples, including four types of ships (cargo ships, tanker ships, fishing ships, and passenger ships), were selected to build the AIS dataset DAIS, in which the sample sizes of various ships are equivalent. We selected 100 samples of each type of ship for testing and the rest for classification model training.
SAR dataset. The SAR image dataset DSAR used in this paper consists of two parts: one part is the high-resolution SAR ship dataset built by us called HRSAR-Ship, and the other part comes from the FUSAR-Ship dataset [40]. Among them, the HRSAR-Ship dataset comes from high-resolution images received by the Gaofen-3 (GF-3) satellite. The GF-3 satellite is China’s first civil C-band high-resolution quad-polarization SAR satellite, and the nominal highest resolution of the images is up to 1 m. The GF-3 satellite has 12 observation modes. The spatial resolution is 1–500 m and the coverage width is 10–650 km in different application modes. It can realize the general and fine-grained investigation of an object and has been widely used in maritime surveillance. The imaging mode of the GF-3 satellite mainly includes the sliding spotlight (SL), ultrafine strip-map (UFS), fine strip-map 1 (FSI), and fine strip-map 2 (FSII), with corresponding resolutions of 1 m, 3 m, 5 m, and 10 m, respectively. In this paper, 100 images taken in the SL and UFS imaging modes of the GF-3 satellite were acquired and processed, and the size ranges of the high-resolution HRSAR-Ship dataset samples are 512 × 512, 256 × 256, and 128 × 128.
The high-resolution FUSAR-Ship dataset was built from 126 GF-3 satellite images with the UFS imaging mode and covered various ports, coasts, rivers, islands, and offshore scenes. The FUSAR-Ship dataset contains maritime target chips of many categories, including 15 main ship categories, 98 ship sub-categories, and many non-ship objects, which are suitable for vessel detection and classification on complex sea surfaces. In our experiment, by screening and processing the HRSAR-Ship and FUSAR-Ship datasets, 400 sample chips of four types of ships were obtained to build the SAR dataset DSAR, of which 200 were used for testing, and the rest were used for classification model training together with AIS dataset. Figure 8 shows ship samples of the DSAR dataset. All experiments were programmed in a python3.8 environment under Windows 10.

3.2. Evaluation Metrics

After completing the training of the MCEL model, it is important to choose appropriate performance evaluation metrics for machine learning methods. The most commonly used method to evaluate the performance of ship object classifiers is to adopt a confusion matrix for analysis, as shown in Table 1. The confusion matrix is also known as the error matrix, which can reflect the relevant information between the classification results and ground truth categories and is the basis for analyzing various evaluation metrics. In this paper, we selected the four most commonly used metrics to quantitatively evaluate the performance of our SAR image ship classification algorithm, including the Accuracy, Precision, Recall, and F1-Score. Based on the confusion matrix given in Table 1, the evaluation metrics are given by Equation (9).
A c c u r a c y = T P + T N T P + F N + F P + T N P r e c i s o n = T P T P + F P R e c a l l = T P T P + F N F 1 S c o r e = 2 × R e c a l l × P r e c i s i o n R e c a l l + P r e c i s i o n
where, TP, TN, FP, and FN are the number of true positive, true negative, false positive, and false negative ship objects, respectively.

3.3. Method Validation and Result Analysis

3.3.1. Experimental Results of the Base Classifiers and MCEL Model

The MCEL model proposed in this paper used KNN, SVM, MLP, and XGBoost as the base classifiers and random forest as the ensemble classifier. This section verifies the proposed method on the AIS test set and SAR test set.
To verify the effectiveness of the MCEL model and extracted NGFs, we first conducted experiments on the AIS test set. After completing the parameter settings for each classifier, we used the training set to train the base classifiers and MCEL model. The performance of the classifiers was evaluated using the metrics given by Equation (9) and the statistical results of model accuracy were listed in Table 2. By analyzing the experimental results of all classifiers, we find that the MCEL model in this paper has lower omission and misclassification errors than the base classifiers such as KNN and SVM. Moreover, compared to the classifiers trained using the SGFs, the NGFs can further improve the accuracy of classification models. Figure 9 shows the visualization results of the accuracy of each classifier. It can be seen that the MECL model shows the best performance under different features, and the ship classification accuracy is up to 87.25% when the NGFs are used for training. This shows that the multiple classifiers ensemble learning strategy and NGFs are effective methods for improving the performance of classification methods and can greatly improve the prediction ability of the final model. It also shows that the feature learning abilities of different classifiers can complement each other.
For ship object classification, a confusion matrix can be used to evaluate the advantages and disadvantages of different classification methods. The diagonal elements of the confusion matrix represent the correctly classified samples. Figure 10 shows the confusion matrix of the AIS test dataset ship classification when the MCEL model adopts the SGFs and NGFs. It can be seen that the introduction of the NGFs can reduce ship omission and misclassification errors, and improve the performance of classification methods. In addition, during the experiment, we find that passenger ships and fishing ships are more likely to be confused than cargo ships and tanker ships. This is mainly because these two types of ships have similar size characteristics and can even be converted into each other in function.
Furthermore, Table 3 shows a detailed performance comparison of different classification methods for various types of ships when the NGFs are adopted, including Accuracy, Recall, and F1-Score. It can be observed that the performance of the base classifiers differs in evaluation metrics. The MCEL model can integrate the advantages of each base classifier and achieve a better performance than the base classifiers, which shows that the proposed method has obvious advantages for ship classification. As the harmonic average of the accuracy and recall rates, the F1-Score can comprehensively reflect the performance of the classifiers. Figure 11 shows the F1-Score of the different classification methods for the four types of ships. It can be found that the MCEL model achieves the highest F1-Score for passenger ships, cargo ships, tanker ships, and fishing ships, reaching 82.52%, 91.92%, 90.82%, and 84.00%, respectively. The experimental results show that the MCEL model proposed and the NGFs used in this paper can effectively improve the comprehensive classification performance of ships, which lays a foundation for subsequent SAR ship classification experiments.

3.3.2. Experimental Results of SAR Ship Classification Based on the MCEL Model and AIS Data Transfer Learning

To verify the performance of the SAR image ship classification method based on the MCEL model and AIS data transfer learning (MCEL-TL) proposed in this paper, this section presents a comprehensive comparison of the SAR test set with and without the AIS data to participate in the model training. In addition, the experiments in Section 3.3.1 showed that the NGFs had better performance; therefore, the subsequent experiments were performed with the NGFs. Table 4 shows the ship classification accuracy of each classifier on the SAR test set, where SAR-TL represents the statistical results of the object classification accuracy with the AIS data transfer. Through a longitudinal comparison, it can be seen that various classification methods combined with the AIS data transfer have different degrees of improvement than the classification methods trained on the SAR dataset, and the classification accuracy was improved by 4.5% when the MCEL model was used. Through a horizontal comparison, we can see that the MCEL method achieves the best performance in both cases, which again proves the effectiveness of the classification model in this paper. Figure 12 shows the ship classification accuracy of each classifier on the SAR test set. It can be seen that the correct classification percentage of each classifier is different. Among them, the MCEL model combined with the AIS data transfer learning had the best performance in SAR image ship object classification, with a classification accuracy of 85.00%, which proves that our method is a very effective ship classification model in SAR images.
Table 5 provided detailed information on the performance comparison of the MCEL model with different training sets, where the MCEL-TL represents the MCEL model trained using the AIS dataset. It can be concluded from Table 5 that the MCEL-TL method has the best classification performance for the four types of ships in SAR images when the AIS dataset participates in the model training and has a great improvement in Precision, Recall, and F1-Score. In addition, to visually compare the misclassification of the four types of ships by various methods, Figure 13 shows the confusion matrix of each classifier with different training sets. Through an analysis of the experimental results of each classification model, it was found that the MCEL-TL method can significantly reduce the misclassification of various types of ships compared with the other classification method. However, the similarity in the spatial distribution of ship geometric features still confuses sample classification, such as passenger ships and fishing ships, cargo ships and tanker ships. These experimental results demonstrate that it is feasible to transfer AIS data to SAR images for ship classification, which can ensure good classification performance.
Table 6 further presents the detailed experimental results of each classification method in the case of AIS data transfer, and Figure 14 shows the F1-Score of each classification method for the four types of ships. It can be seen from Table 6 and Figure 14 that the proposed method is significantly better than base classifiers in terms of various evaluation metrics. This is because the ensemble learning method can synthesize the learning characteristics of base classifiers, and the AIS data transfer learning can enrich the ship feature space, so it can reduce the confusion between various types of ships and improve the classification performance of SAR image ship objects. The experiments fully verify the effectiveness of the multiple classifiers ensemble learning model and the AIS data transfer learning method constructed in this paper for SAR image ship classification.
Through the above experiments and analysis, the effectiveness of our method for SAR image ship classification was fully verified. However, this method also has some limitations, that is, the classification performance of the ensemble learning method depends mainly on its base classifiers, or the selected base classifiers determine the classification ability of the ensemble learning method to a certain extent. Therefore, the classification performance of the ensemble learning method is expected to be further improved by introducing new base classifiers and ensemble strategies in subsequent studies. In addition, to solve the misclassification of different types of ships, the electromagnetic scattering characteristics of SAR image ships can be introduced as auxiliary features. In conclusion, the following observations can be made:
(i)
The NGFs extracted in this paper enrich the ship feature space, which can effectively improve the performance of classifiers compared with the SGFs;
(ii)
The experimental results on the AIS and SAR test sets show that the MCEL model constructed in this paper is better than that of each base classifier, and the classification accuracy is improved by approximately 5–11% compared with the base classifiers;
(iii)
Experiments show that it is feasible to transfer AIS data to SAR images for ship classification, and the classification accuracy obtained is approximately 4% higher than that of the classification method trained with the SAR dataset, which provides an effective solution for SAR ship classification with limited samples;
(iv)
Owing to the similar spatial distribution of the geometric features of different types of ships, classification confusion can easily occur, such as passenger ships and fishing ships. The AIS data transfer can effectively solve the problem of SAR image ship misclassification. To further reduce classification confusion, SAR ship electromagnetic scattering characteristics can be extracted as auxiliary features;
(v)
This paper adopts the multiple classifiers ensemble learning to solve the problem of ship classification, which increases the complexity of the system. In addition, compared with the single classifier, the time cost of this method is relatively high.

4. Conclusions

In this paper, we proposed a SAR image ship classification method based on multiple classifiers ensemble learning and AIS data transfer learning. By combining the advantages of different classifiers and the transferability of AIS data, our method effectively solved the problem of SAR image ship classification with limited training samples. We conducted a large number of comparative experiments on the AIS and SAR test sets, and the experimental results showed that our method achieved a better performance than the base classifiers, which fully proves the feasibility and effectiveness of our method. In addition, the experiments also demonstrated that the extracted NGFs were effective and could achieve a higher classification accuracy by making full use of the different geometric features of ships.
In future work, it will be necessary to further study the reliability and combination strategies of different classifiers and consider the addition of object electromagnetic scattering characteristics for SAR ship classification. In addition, we will extend the method to the classification of more ship types.

Author Contributions

Conceptualization, Z.Y.; methodology, Z.Y.; software, Z.Y.; validation, X.S. and L.Y.; formal analysis, Z.Y. and X.S.; investigation, Z.Y.; resources, X.S. and L.Y.; data curation, Z.Y.; writing—original draft preparation, Z.Y.; writing—review and editing, Z.Y., X.S., L.Y., and Y.W.; visualization, Z.Y. All authors have read and agreed to the published version of the manuscript.

Funding

This work is supported by the Scientific Research Project of National University of Defense Technology (No.ZK22-02).

Data Availability Statement

Not applicable.

Acknowledgments

HY-1C/HY-2B data were obtained from https://osdds.nsoas.org.cn (accessed on 10 March 2022). The authors would like to thank National Satellite Oceanic Application Center (NSOAS) for providing the AIS data free of charge and the authors in [40] for providing the SAR data. The authors would also like to appreciate the reviewers for evaluating this work.

Conflicts of Interest

The authors declare no conflict of interest.

References

  1. Ma, M.; Chen, J.; Liu, W.; Yang, W. Ship classification and detection based on CNN using GF-3 SAR images. Remote Sens. 2018, 10, 2043. [Google Scholar] [CrossRef] [Green Version]
  2. Renga, A.; Graziano, M.D.; Moccia, A. Segmentation of marine SAR images by sublook analysis and application to sea traffic monitoring. IEEE Trans. Geosci. Remote Sens. 2019, 57, 1463–1477. [Google Scholar] [CrossRef]
  3. Zeng, K.; Wang, Y. A deep convolutional neural network for oil spill detection from spaceborne SAR images. Remote Sens. 2020, 12, 1015. [Google Scholar] [CrossRef] [Green Version]
  4. Ma, X.; Xu, J.; Wu, P.; Kong, P. Oil spill detection based on deep convolutional neural networks using polarimetric scattering information from Sentinel-1 SAR images. IEEE Trans. Geosci. Remote Sens. 2021, 60, 1–13. [Google Scholar] [CrossRef]
  5. Zakhvatkina, N.; Smirnov, V.; Bychkova, I. Satellite SAR data-based sea ice classification: An overview. Geosciences 2019, 9, 152. [Google Scholar] [CrossRef] [Green Version]
  6. Zhang, J.; Zhang, W.; Hu, Y.; Chu, Q.; Liu, L. An improved sea ice classification algorithm with Gaofen-3 dual-polarization SAR data based on deep convolutional neural networks. Remote Sens. 2022, 14, 906. [Google Scholar] [CrossRef]
  7. Xing, X.; Zou, H.; Chen, W. Ship classification in TerraSAR-X images with feature space based sparse representation. IEEE Geosci. Remote Sens. Lett. 2013, 10, 1562–1566. [Google Scholar] [CrossRef]
  8. Lang, H.; Jie, Z.; Xi, Z.; Meng, J. Ship classification in SAR image by joint feature and classifier selection. IEEE Geosci. Remote Sens. Lett. 2015, 13, 212–216. [Google Scholar] [CrossRef]
  9. Xu, Y.; Lang, H. Distribution shift metric learning for fine-grained ship classification in SAR images. IEEE J. Sel. Top. Appl. Earth Obs. Remote Sens. 2020, 13, 2276–2285. [Google Scholar] [CrossRef]
  10. Wang, C.; Zhang, H.; Wu, F.; Jiang, S. A novel hierarchical ship classifier for COSMO-SkyMed SAR data. IEEE Geosci. Remote Sens. Lett. 2013, 11, 484–488. [Google Scholar] [CrossRef]
  11. Ji, K.; Xing, X.; Chen, W.; Zou, H.; Chen, J. Ship classification in TerraSAR-X SAR images based on classifier combination. In Proceedings of the 2013 IEEE International Geoscience and Remote Sensing Symposium (IGARSS), Melbourne, Australia, 21–26 July 2013; pp. 2589–2592. [Google Scholar]
  12. Margarit, G.; Tabasco, A. Ship classification in single-pol SAR images based on fuzzy logic. IEEE Trans. Geosci. Remote Sens. 2011, 49, 3129–3138. [Google Scholar] [CrossRef]
  13. Zhang, H.; Tian, X.; Wang, C.; Wu, F.; Zhang, B. Merchant vessel classification based on scattering component analysis for COSMO-SkyMed SAR images. IEEE Geosci. Remote Sens. Lett. 2013, 10, 1275–1279. [Google Scholar] [CrossRef]
  14. Wu, J.; Zhu, Y.; Wang, Z.; Song, Z.; Liu, X.; Wang, W.; Zhang, Z.; Yu, Y.; Xu, Z.; Zhang, T. A novel ship classification approach for high resolution SAR images based on the BDA-KELM classification model. Int. J. Remote Sens. 2017, 38, 6457–6476. [Google Scholar] [CrossRef]
  15. Lang, H.; Wu, S. Ship classification in moderate-resolution SAR image by naive geometric features-combined multiple kernel learning. IEEE Geosci. Remote Sens. Lett. 2017, 14, 1765–1769. [Google Scholar] [CrossRef]
  16. Leng, X.; Ji, K.; Zhou, S.; Xing, X.; Zou, H. A comb feature for the analysis of ship classification in high resolution SAR imagery. In Proceedings of the 2016 CIE International Conference on Radar (RADAR), Guangzhou, China, 10–13 October 2016; pp. 1–4. [Google Scholar]
  17. Jiang, M.; Yang, X.; Dong, Z.; Shuai, F.; Meng, J. Ship classification based on superstructure scattering features in SAR images. IEEE Geosci. Remote Sens. Lett. 2016, 13, 616–620. [Google Scholar] [CrossRef]
  18. Shakya, A.; Biswas, M.; Pal, M. Fusion and classification of multi-temporal SAR and optical imagery using convolutional neural network. Int. J. Image Data Fusion 2022, 13, 113–135. [Google Scholar] [CrossRef]
  19. Fu, S.; Xu, F.; Jin, Y.-Q. Reciprocal translation between SAR and optical remote sensing images with cascaded-residual adversarial networks. Sci. China Inf. Sci. 2021, 64, 1–15. [Google Scholar] [CrossRef]
  20. He, J.; Wang, Y.; Liu, H. Ship classification in medium-resolution SAR images via densely connected triplet CNNs integrating Fisher discrimination regularized metric learning. IEEE Trans. Geosci. Remote Sens. 2020, 59, 3022–3039. [Google Scholar] [CrossRef]
  21. Lu, C.; Li, W. Ship classification in high-resolution SAR images via transfer learning with small training dataset. Sensors 2019, 19, 63. [Google Scholar] [CrossRef] [Green Version]
  22. Zhang, T.; Zhang, X. A polarization fusion network with geometric feature embedding for SAR ship classification. Pattern Recognit. 2022, 123, 108365. [Google Scholar] [CrossRef]
  23. Sharifzadeh, F.; Akbarizadeh, G.; Kavian, Y.S. Ship classification in SAR images using a new hybrid CNN–MLP classifier. J. Indian Soc. Remote Sens. 2019, 47, 551–562. [Google Scholar] [CrossRef]
  24. Dong, Y.; Zhang, H.; Wang, C.; Wang, Y. Fine-grained ship classification based on deep residual learning for high-resolution SAR images. Remote Sens. Lett. 2019, 10, 1095–1104. [Google Scholar] [CrossRef]
  25. Bentes, C.; Velotto, D.; Tings, B. Ship classification in TerraSAR-X images with convolutional neural networks. IEEE J. Ocean. Eng. 2017, 43, 258–266. [Google Scholar] [CrossRef] [Green Version]
  26. Xu, X.; Zhang, X.; Zhang, T. Multi-Scale SAR Ship Classification with Convolutional Neural Network. In Proceedings of the 2021 IEEE International Geoscience and Remote Sensing Symposium (IGARSS), Brussels, Belgium, 11–16 July 2021; pp. 4284–4287. [Google Scholar]
  27. Wu, Y.; Yuan, Y.; Guan, J.; Yin, L.; Feng, P. Joint convolutional neural network for small-scale ship classification in SAR images. In Proceedings of the 2019 IEEE International Geoscience and Remote Sensing Symposium (IGARSS), Yokohama, Japan, 28 July–2 August 2019; pp. 2619–2622. [Google Scholar]
  28. Zeng, L.; Zhu, Q.; Lu, D.; Zhang, T.; Yang, J. Dual-polarized SAR ship grained classification based on CNN with hybrid channel feature loss. IEEE Geosci. Remote Sens. Lett. 2021, 19, 1–5. [Google Scholar] [CrossRef]
  29. Huang, G.; Liu, X.; Hui, J.; Wang, Z.; Zhang, Z. A novel group squeeze excitation sparsely connected convolutional networks for SAR target classification. Int. J. Remote Sens. 2019, 40, 4346–4360. [Google Scholar] [CrossRef]
  30. Rong, H.; Teixeira, A.P.; Soares, C.G. Data mining approach to shipping route characterization and anomaly detection based on AIS data. Ocean. Eng. 2020, 198, 106936. [Google Scholar] [CrossRef]
  31. Mélanie, F.; R Casey, H.; Sara, R.; Ronald, P. Past, present, and future of the satellite-based automatic identification system: Areas of applications (2004–2016). Wmu J. Marit. Aff. 2018, 17, 311–345. [Google Scholar]
  32. Bakdi, A.; Glad, I.K.; Vanem, E.; Engelhardtsen, Y. AIS-based multiple vessel collision and grounding risk identification based on adaptive safety domain. J. Mar. Sci. Eng. 2019, 8, 5. [Google Scholar] [CrossRef] [Green Version]
  33. Yan, Z.; Xiao, Y.; Cheng, L.; Chen, S.; Zhou, X.; Ruan, X.; Li, M.; He, R.; Ran, B. Analysis of global marine oil trade based on automatic identification system (AIS) data. J. Transp. Geogr. 2020, 83, 102637. [Google Scholar] [CrossRef]
  34. Chen, X.; Liu, Y.; Achuthan, K.; Zhang, X. A ship movement classification based on Automatic Identification System (AIS) data using Convolutional Neural Network. Ocean. Eng. 2020, 218, 108182. [Google Scholar] [CrossRef]
  35. Snapir, B.; Waine, T.; Biermann, L. Maritime vessel classification to monitor fisheries with SAR: Demonstration in the North Sea. Remote Sens. 2019, 11, 353. [Google Scholar] [CrossRef]
  36. Lang, H.; Wu, S.; Xu, Y. Ship classification in SAR images improved by AIS knowledge transfer. IEEE Geosci. Remote Sens. Lett. 2018, 15, 439–443. [Google Scholar] [CrossRef]
  37. Rodger, M.; Guida, R. Classification-aided SAR and AIS data fusion for space-based maritime surveillance. Remote Sens. 2020, 13, 104. [Google Scholar] [CrossRef]
  38. Pelich, R.; Chini, M.; Hostache, R.; Matgen, P.; Lopez-Martinez, C.; Nuevo, M.; Ries, P.; Eiden, G. Large-scale automatic vessel monitoring based on dual-polarization Sentinel-1 and AIS data. Remote Sens. 2019, 11, 1078. [Google Scholar] [CrossRef] [Green Version]
  39. Huang, L.; Liu, B.; Li, B.; Guo, W.; Yu, W.; Zhang, Z.; Yu, W. OpenSARShip: A dataset dedicated to Sentinel-1 ship interpretation. IEEE J. Sel. Top. Appl. Earth Obs. Remote Sens. 2017, 11, 195–208. [Google Scholar] [CrossRef]
  40. Hou, X.; Ao, W.; Song, Q.; Lai, J.; Wang, H.; Xu, F. FUSAR-Ship: Building a high-resolution SAR-AIS matchup dataset of Gaofen-3 for ship detection and recognition. Sci. China Inf. Sci. 2020, 63, 1–19. [Google Scholar] [CrossRef] [Green Version]
  41. Achiri, L.; Guida, R.; Iervolino, P. SAR and AIS fusion for maritime surveillance. In Proceedings of the 2018 IEEE 4th International Forum on Research and Technology for Society and Industry (RTSI), Palermo, Italy, 10–13 September 2018; pp. 1–4. [Google Scholar]
  42. Chen, W.T.; Ji, K.F.; Xing, X.W.; Zou, H.X.; Sun, H. Ship recognition in high resolution SAR imagery based on feature selection. In Proceedings of the 2012 International Conference on Computer Vision in Remote Sensing, Xiamen, China, 16–18 December 2012; pp. 301–305. [Google Scholar]
  43. Chawla, N.V.; Bowyer, K.W.; Hall, L.O.; Kegelmeyer, W.P. SMOTE: Synthetic minority over-sampling technique. J. Artif. Intell. Res. 2002, 16, 321–357. [Google Scholar] [CrossRef]
  44. Saadatfar, H.; Khosravi, S.; Joloudari, J.H.; Mosavi, A.; Shamshirband, S. A new K-nearest neighbors classifier for big data based on efficient data pruning. Mathematics 2020, 8, 286. [Google Scholar] [CrossRef] [Green Version]
  45. Cortes, C.; Vapnik, V.N. Support Vector Networks. Mach. Learn. 1995, 20, 273–297. [Google Scholar] [CrossRef]
  46. Chen, T.; Guestrin, C. Xgboost. A scalable tree boosting system. In Proceedings of the 22nd ACM SIGKDD International Conference on Knowledge Discovery and Data Mining, San Francisco, CA, USA, 22 August 2016; pp. 785–794. [Google Scholar]
  47. Breiman, L. Random forests. Mach. Learn. 2001, 45, 5–32. [Google Scholar] [CrossRef]
Figure 1. The overall architecture of the proposed method.
Remotesensing 14 05288 g001
Figure 2. The chart drawn using part of the AIS data received by the HY-1C satellite.
Remotesensing 14 05288 g002
Figure 3. The reference point O and the overall dimensions of a ship.
Remotesensing 14 05288 g003
Figure 4. Visualization results of AIS data samples before and after removing outliers. (a) Distribution of original passenger ship SGFs; (b) distribution of passenger ship SGFs after removing outliers; (c) distribution of original AIS data ship SGFs; and (d) distribution of AIS data ship SGFs after removing outliers.
Remotesensing 14 05288 g004
Figure 5. Geometric feature extraction of ship objects in SAR images. (a) Original SAR images; (b) Radon-transformed SAR images; and (c) ship MBR extraction.
Remotesensing 14 05288 g005
Figure 6. The length and width distribution of various types of ships in AIS data and SAR images. (a) AIS data ship size distribution and (b) SAR image ship size distribution.
Remotesensing 14 05288 g006
Figure 7. The overall framework of the multiple classifiers ensemble learning model.
Remotesensing 14 05288 g007
Figure 8. Samples of DSAR dataset.
Remotesensing 14 05288 g008
Figure 9. Ship classification accuracy of different methods on the AIS test set.
Remotesensing 14 05288 g009
Figure 10. Confusion matrix of the MCEL model trained with different features on the AIS test set. (a) Confusion matrix using the SGFs and (b) confusion matrix using the NGFs.
Remotesensing 14 05288 g010
Figure 11. F1-Score of different classification methods for four types of ships.
Remotesensing 14 05288 g011
Figure 12. Ship classification accuracy of each classification method on the SAR test set.
Remotesensing 14 05288 g012
Figure 13. Confusion matrix of the MCEL model on the SAR test set with different training sets. (a) Confusion matrix of the MCEL model and (b) confusion matrix of the MCEL-TL model.
Remotesensing 14 05288 g013
Figure 14. The F1-Score of each ship classification method on the SAR test set.
Remotesensing 14 05288 g014
Table 1. Confusion matrix.
Actual ClassPredicted Class
PositiveNegative
PositiveTrue Positive (TP)False Negative (FN)
NegativeFalse Positive (FP)True Negative (TN)
Table 2. Ship classification accuracy of different methods on the AIS test set.
Vessel FeaturesMethods
KNNSVMMLPXGBoostRFMCEL
SGFs74.75%74.25%75.50%78.50%78.75%85.50%
NGFs76.00%75.75%76.25%80.25%79.75%87.25%
Table 3. The detailed experimental results of different classification methods on the AIS test set using the NGFs.
MethodsVessel TypesEvaluation Metrics
PrecisionRecallF1-ScoreSample Size
KNNPassenger66.67%56.00%60.87%100
Cargo86.14%87.00%86.57%100
Tanker87.10%81.00%83.94%100
Fishing65.57%80.00%72.07%100
SVMPassenger65.17%58.00%61.38%100
Cargo86.00%86.00%86.00%100
Tanker85.71%78.00%81.67%100
Fishing67.50%81.00%73.64%100
MLPPassenger68.93%71.00%69.95%100
Cargo74.19%92.00%82.14%100
Tanker90.79%69.00%78.41%100
Fishing75.26%73.00%74.11%100
XGBoostPassenger72.73%72.00%72.36%100
Cargo86.27%88.00%87.13%100
Tanker87.37%83.00%85.13%100
Fishing75.00%78.00%76.47%100
RFPassenger72.73%64.00%68.09%100
Cargo85.44%88.00%86.70%100
Tanker89.47%85.00%87.18%100
Fishing71.93%82.00%76.64%100
MCELPassenger80.19%85.00%82.52%100
Cargo92.86%91.00%91.92%100
Tanker92.71%89.00%90.82%100
Fishing84.00%84.00%84.00%100
Table 4. Ship classification accuracy of each classification method on the SAR test set.
Training DataMethods
KNNSVMMLPXGBoostRFMCEL
SAR71. 50%70.50%72.50%74.50%75.50%80.50%
SAR-TL74.50%73.50%75.00%78.50%79.00%85.00%
Table 5. SAR ship classification performance of the MECL with different training samples.
MethodsVessel TypesEvaluation Metrics
PrecisionRecallF1-ScoreSample Size
MCELPassenger82.00%82.00%82.00%50
Cargo76.79%86.00%81.13%50
Tanker84.78%78.00%81.25%50
Fishing79.17%76.00%77.55%50
MCEL-TLPassenger83.02%88.00%85.44%50
Cargo82.14%92.00%86.79%50
Tanker90.91%80.00%85.11%50
Fishing85.11%80.00%82.48%50
Table 6. The ship classification results of each classification method on the SAR test set with AIS data transfer.
MethodsVessel TypesEvaluation Metrics
PrecisionRecallF1-ScoreSample Size
KNN-TLPassenger74.14%86.00%79.63%50
Cargo81.40%70.00%75.27%50
Tanker67.24%78.00%72.22%50
Fishing78.05%64.00%70.33%50
SVM-TLPassenger69.09%76.00%72.38%50
Cargo70.31%90.00%78.95%50
Tanker85.71%72.00%78.26%50
Fishing71.79%56.00%62.92%50
MLP-TLPassenger75.00%78.00%76.47%50
Cargo74.51%76.00%75.25%50
Tanker77.36%82.00%79.61%50
Fishing72.73%64.00%68.09%50
XGBoost-TLPassenger79.25%84.00%81.56%50
Cargo75.44%86.00%80.37%50
Tanker78.72%74.00%76.29%50
Fishing81.40%70.00%75.27%50
RF-TLPassenger82.69%86.00%84.31%50
Cargo76.47%78.00%77.23%50
Tanker73.58%78.00%75.73%50
Fishing84.09%74.00%78.72%50
MCEL-TLPassenger83.02%88.00%85.44%50
Cargo82.14%92.00%86.79%50
Tanker90.91%80.00%85.11%50
Fishing85.11%80.00%82.48%50
Publisher’s Note: MDPI stays neutral with regard to jurisdictional claims in published maps and institutional affiliations.

