

Remote Sensing of Coastal Wetland Degradation Using the Landscape Directional Succession Model

Abstract
:1. Introduction
2. Data and Methods
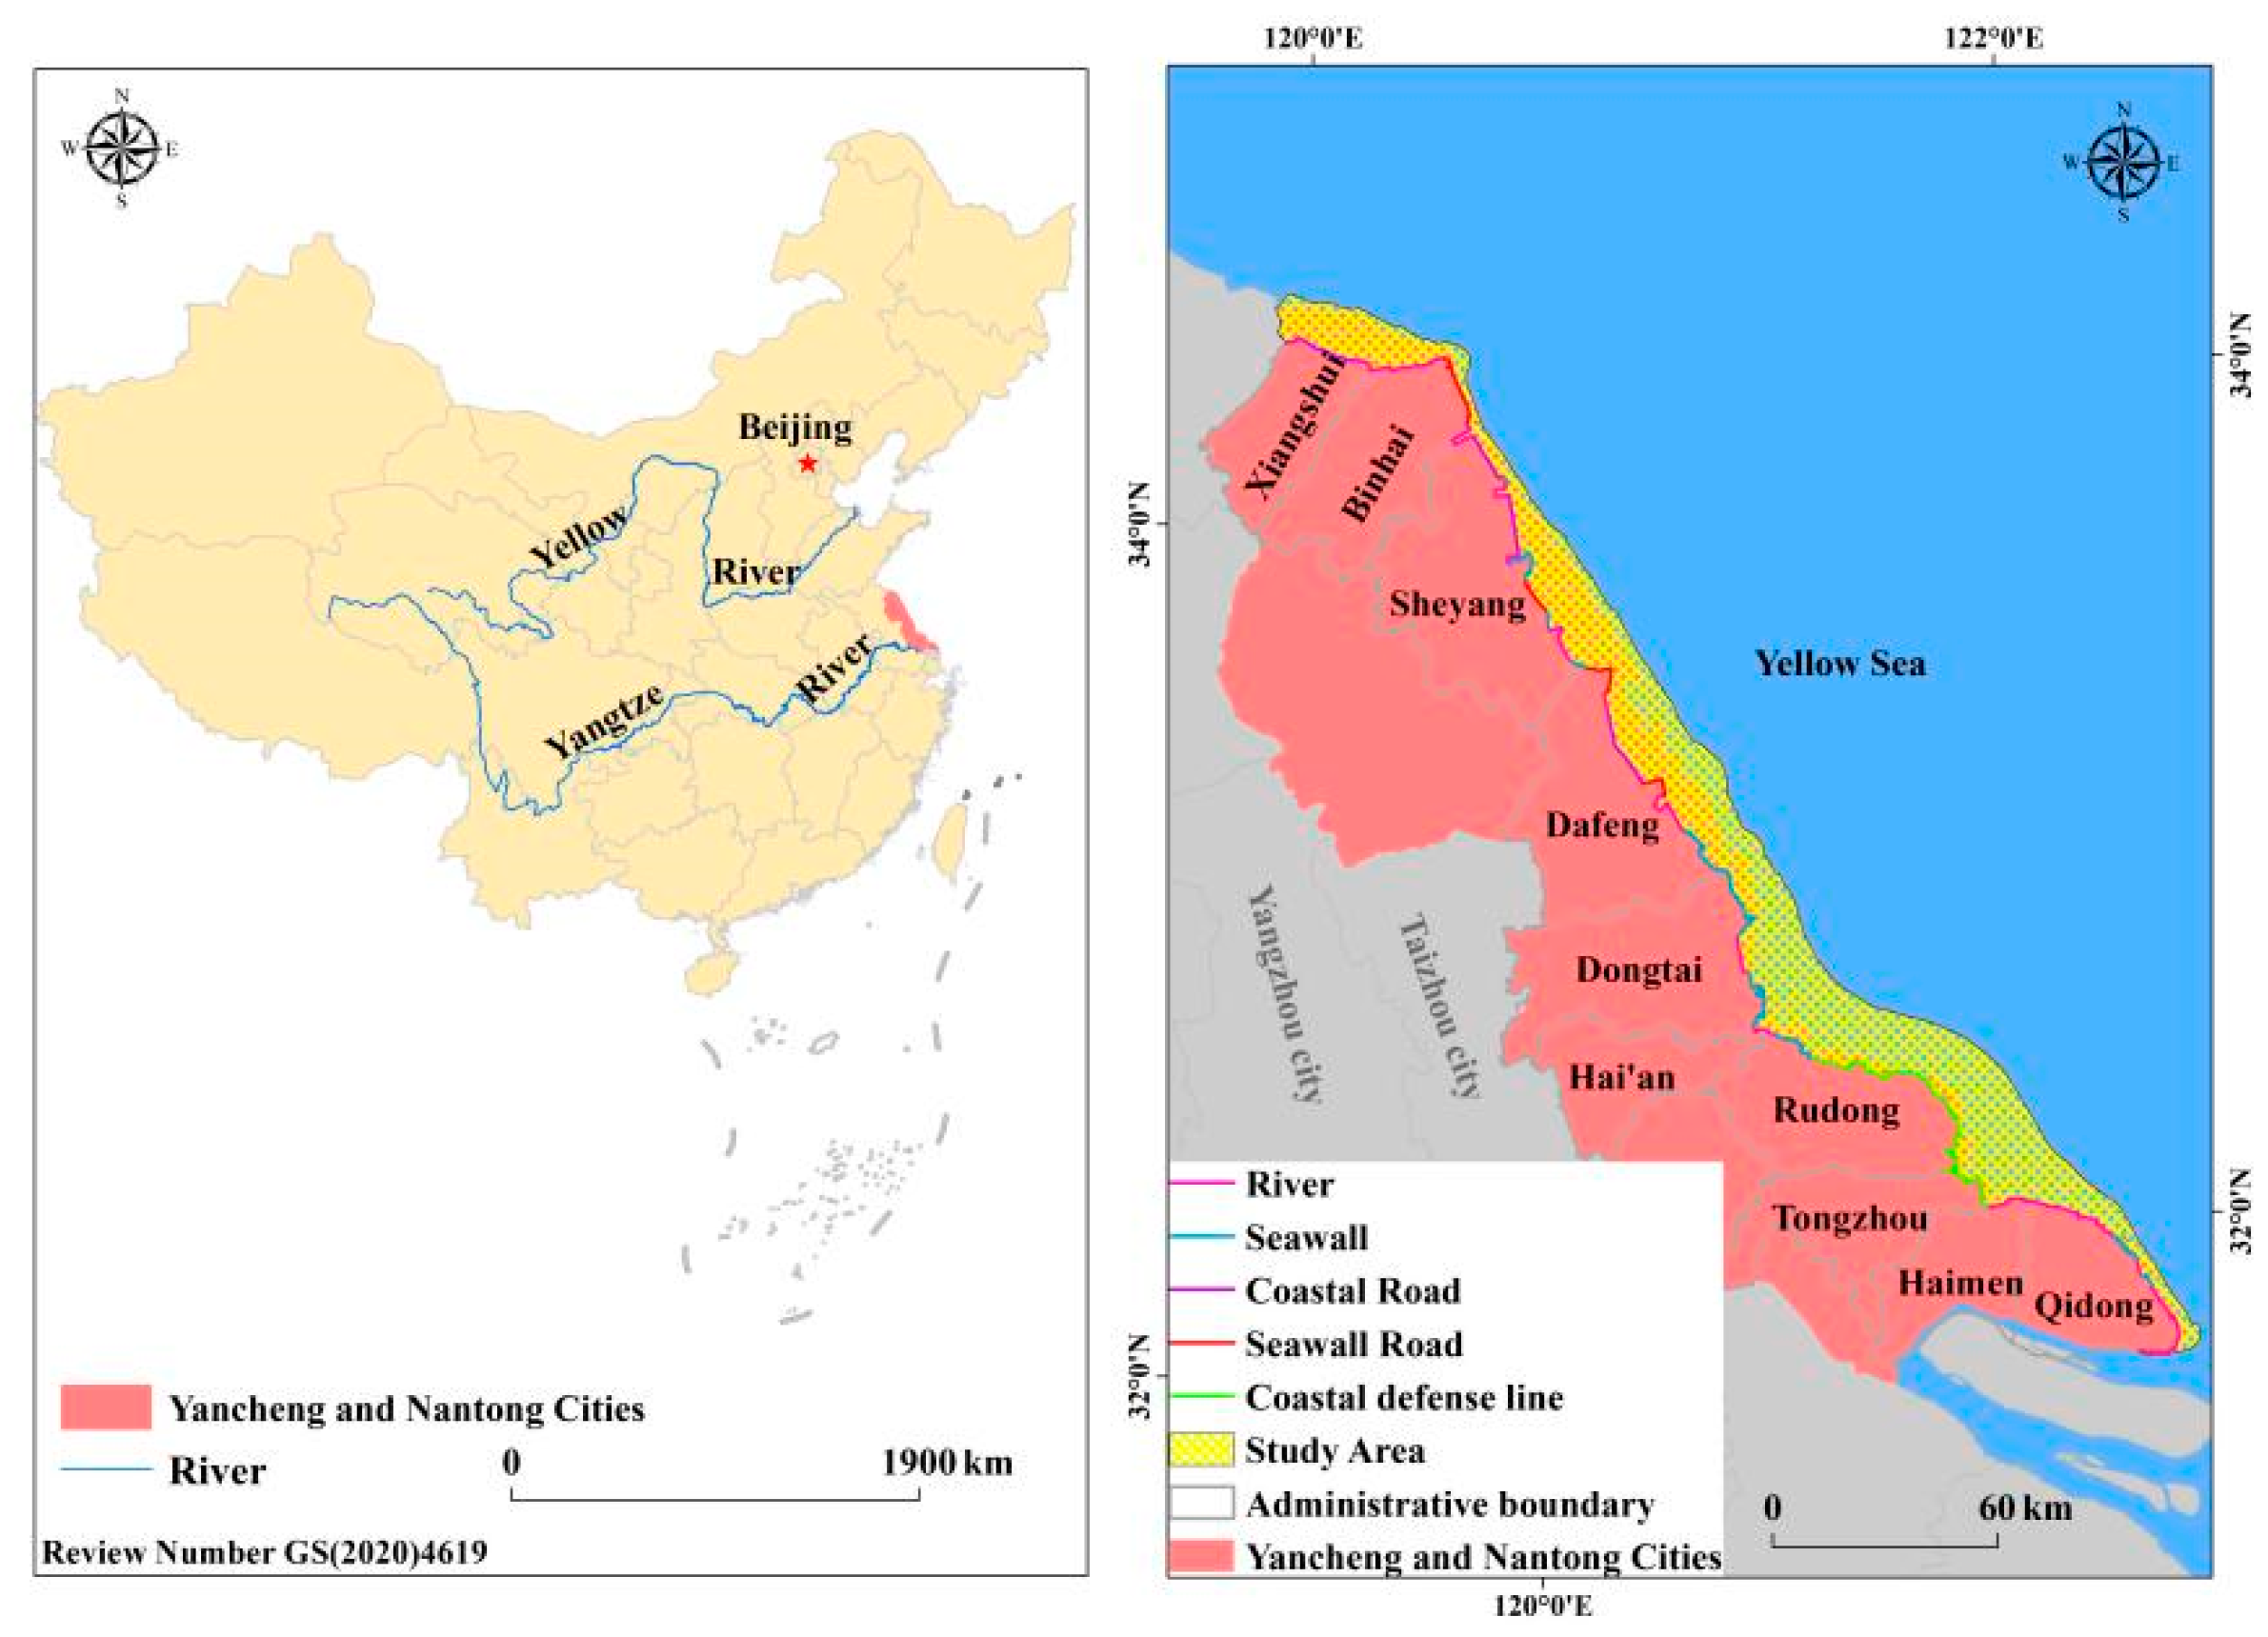
2.1. Study Area
2.2. Landscape Interpretation
2.2.1. Remote Sensing and Ancillary Data
2.2.2. Landscape Classification System
2.2.3. Accuracy Evaluation
- (1)
- Define the confidence level () and find out the corresponding value from the normal distribution table ();
- (2)
- Determine the number of validation samples (N);
- (3)
- Calculate the overall sample accuracy (P);
- (4)
- Determine the classification accuracy using the following inequality.
2.3. Evaluation Method of Coastal Wetland Degradation
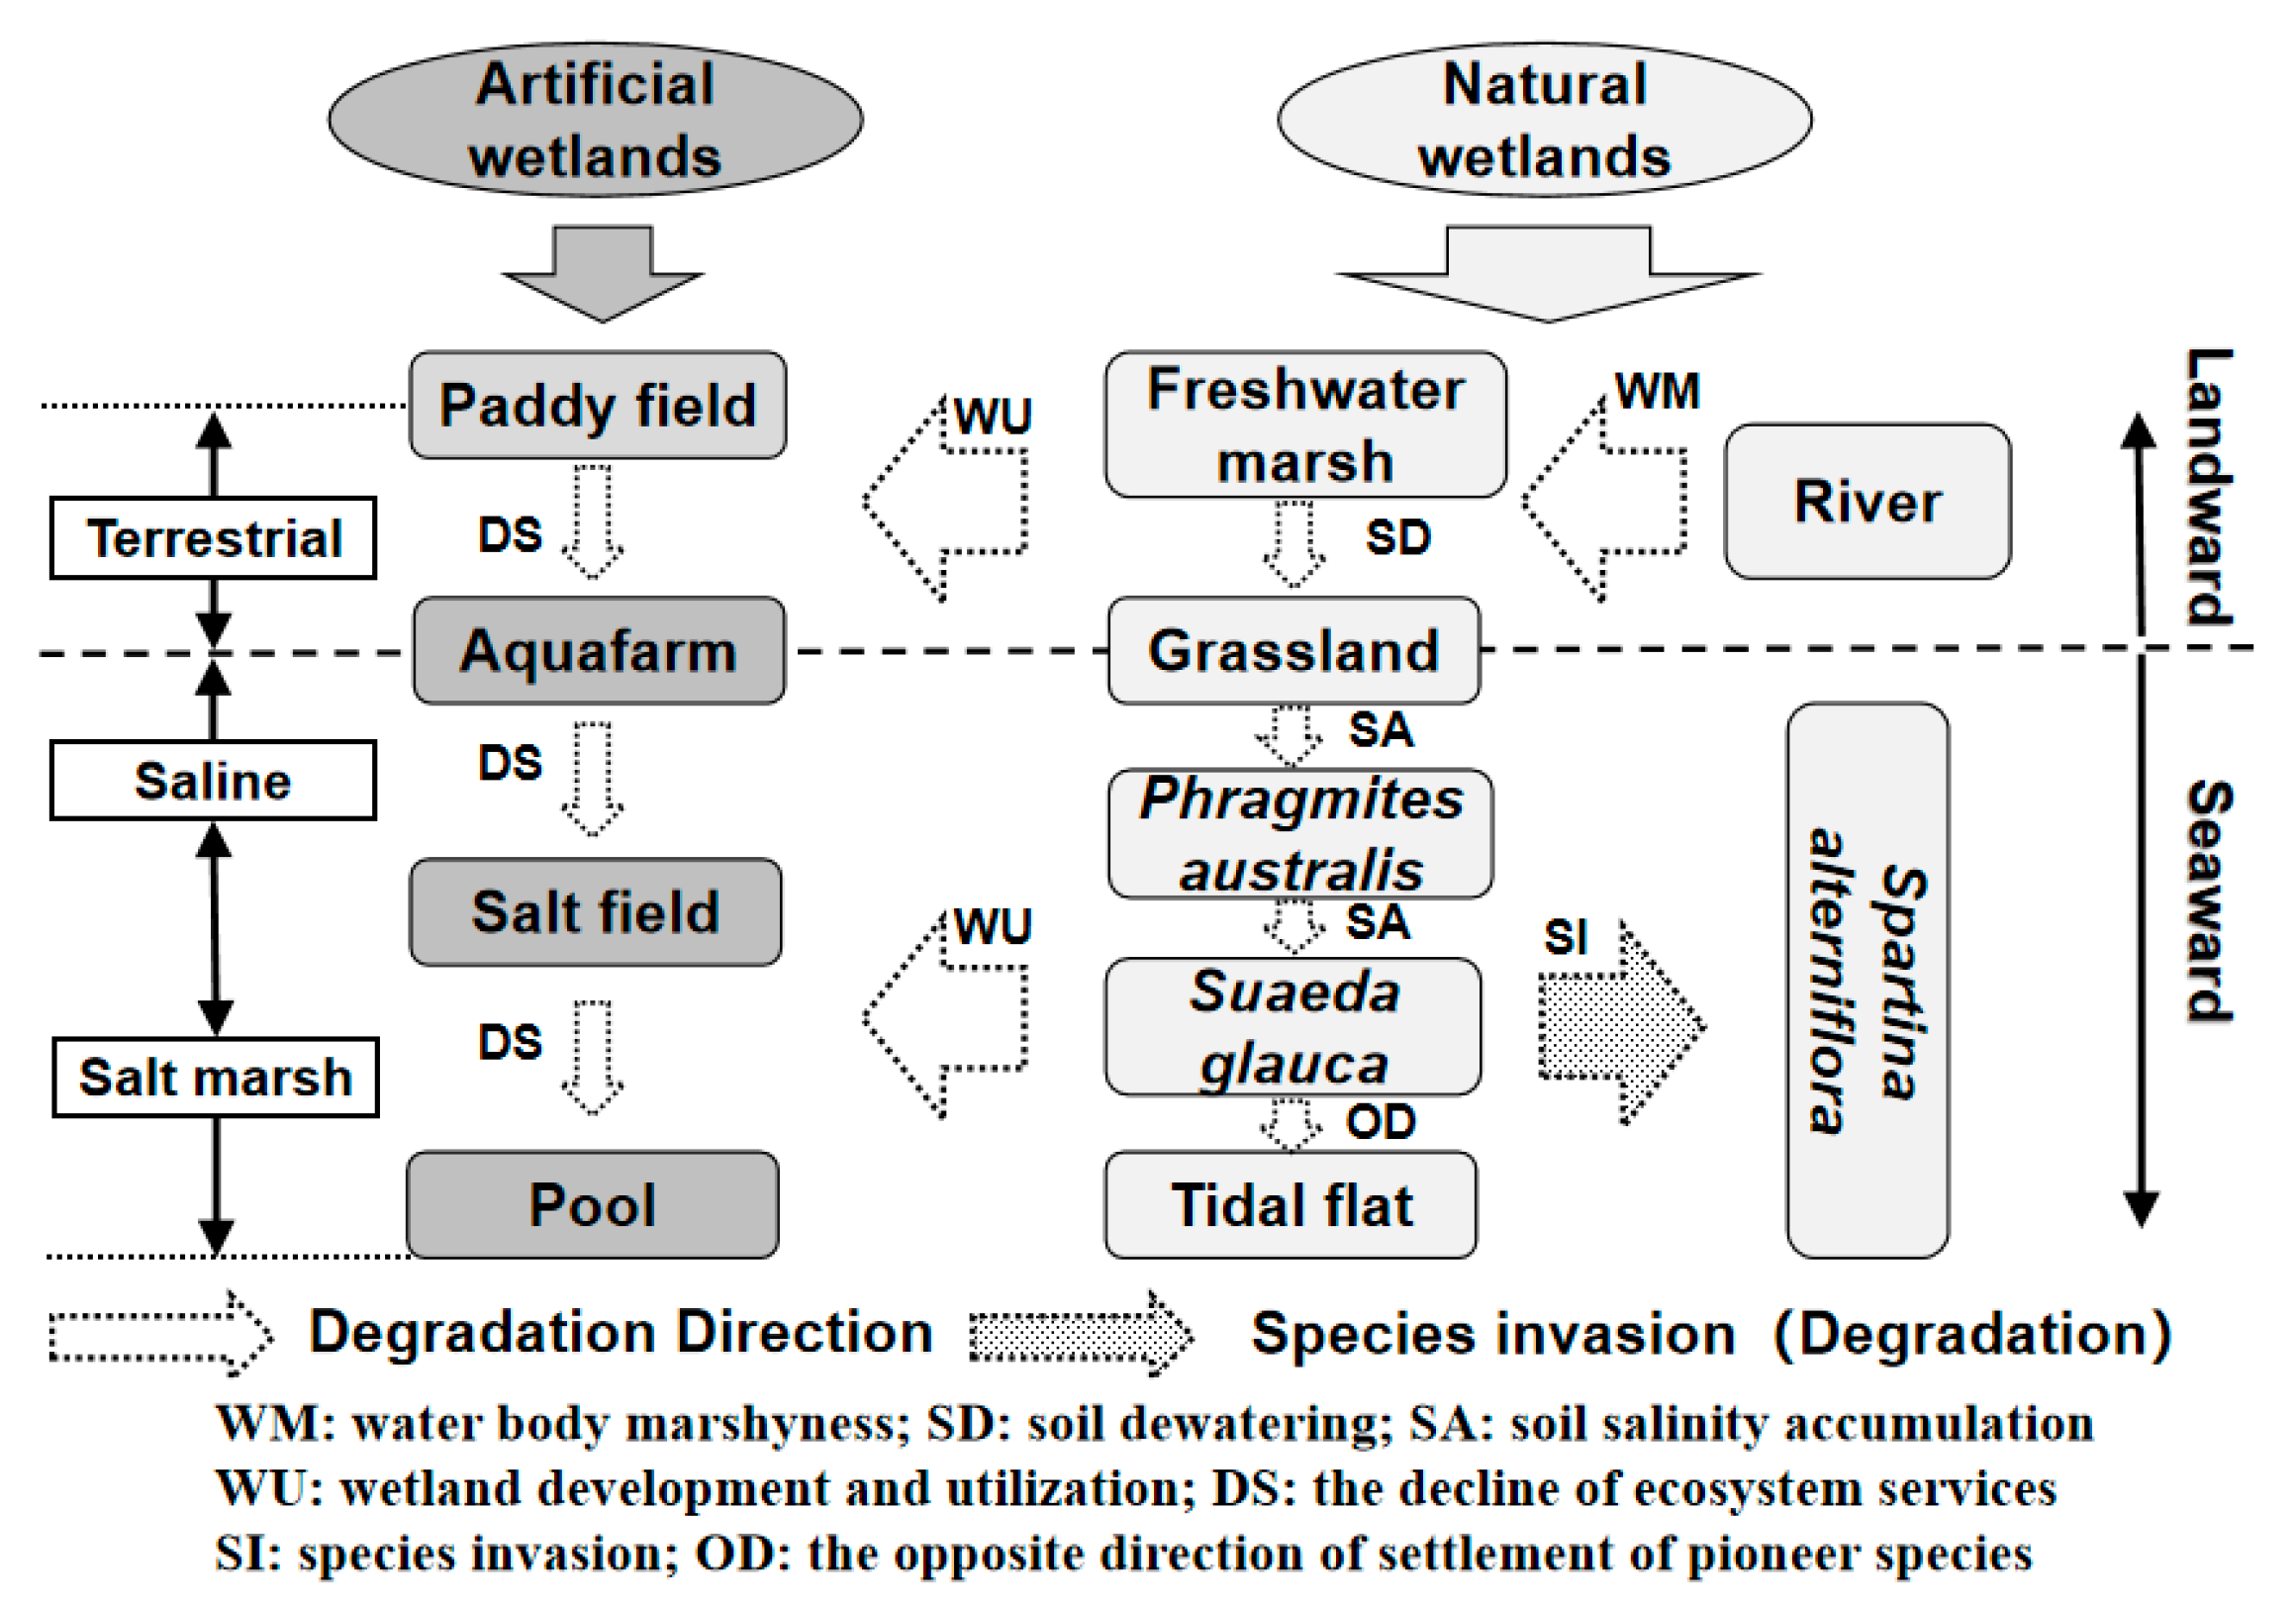
2.3.1. A Method for Identifying Wetland Degradation Based on Landscape Directional Succession Model
2.3.2. Diagnostic Method for the Degree of Wetland Degradation
2.3.3. Methodology for Analyzing the Evolution of Wetland Degradation Grades
3. Results
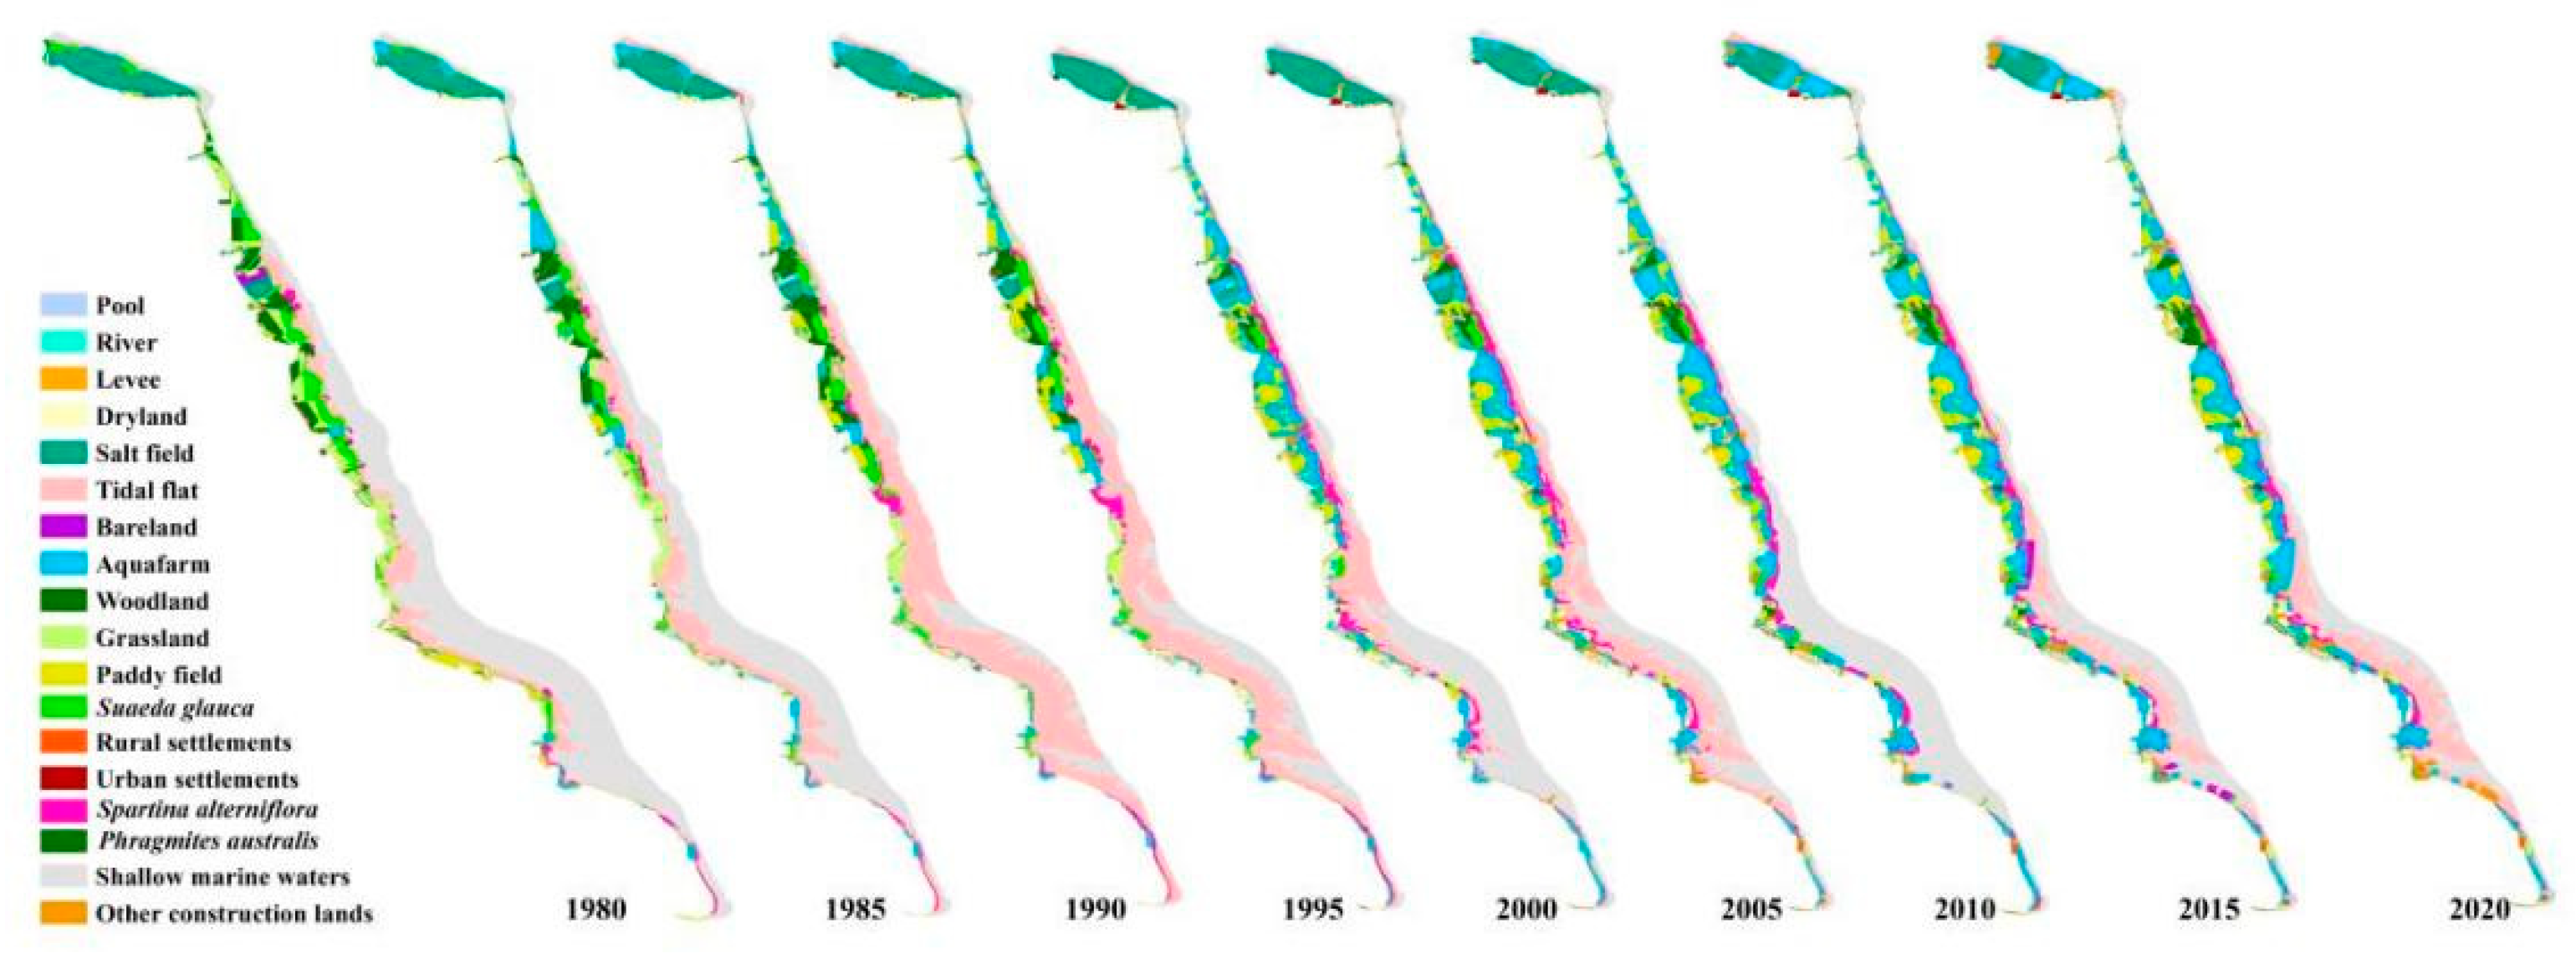
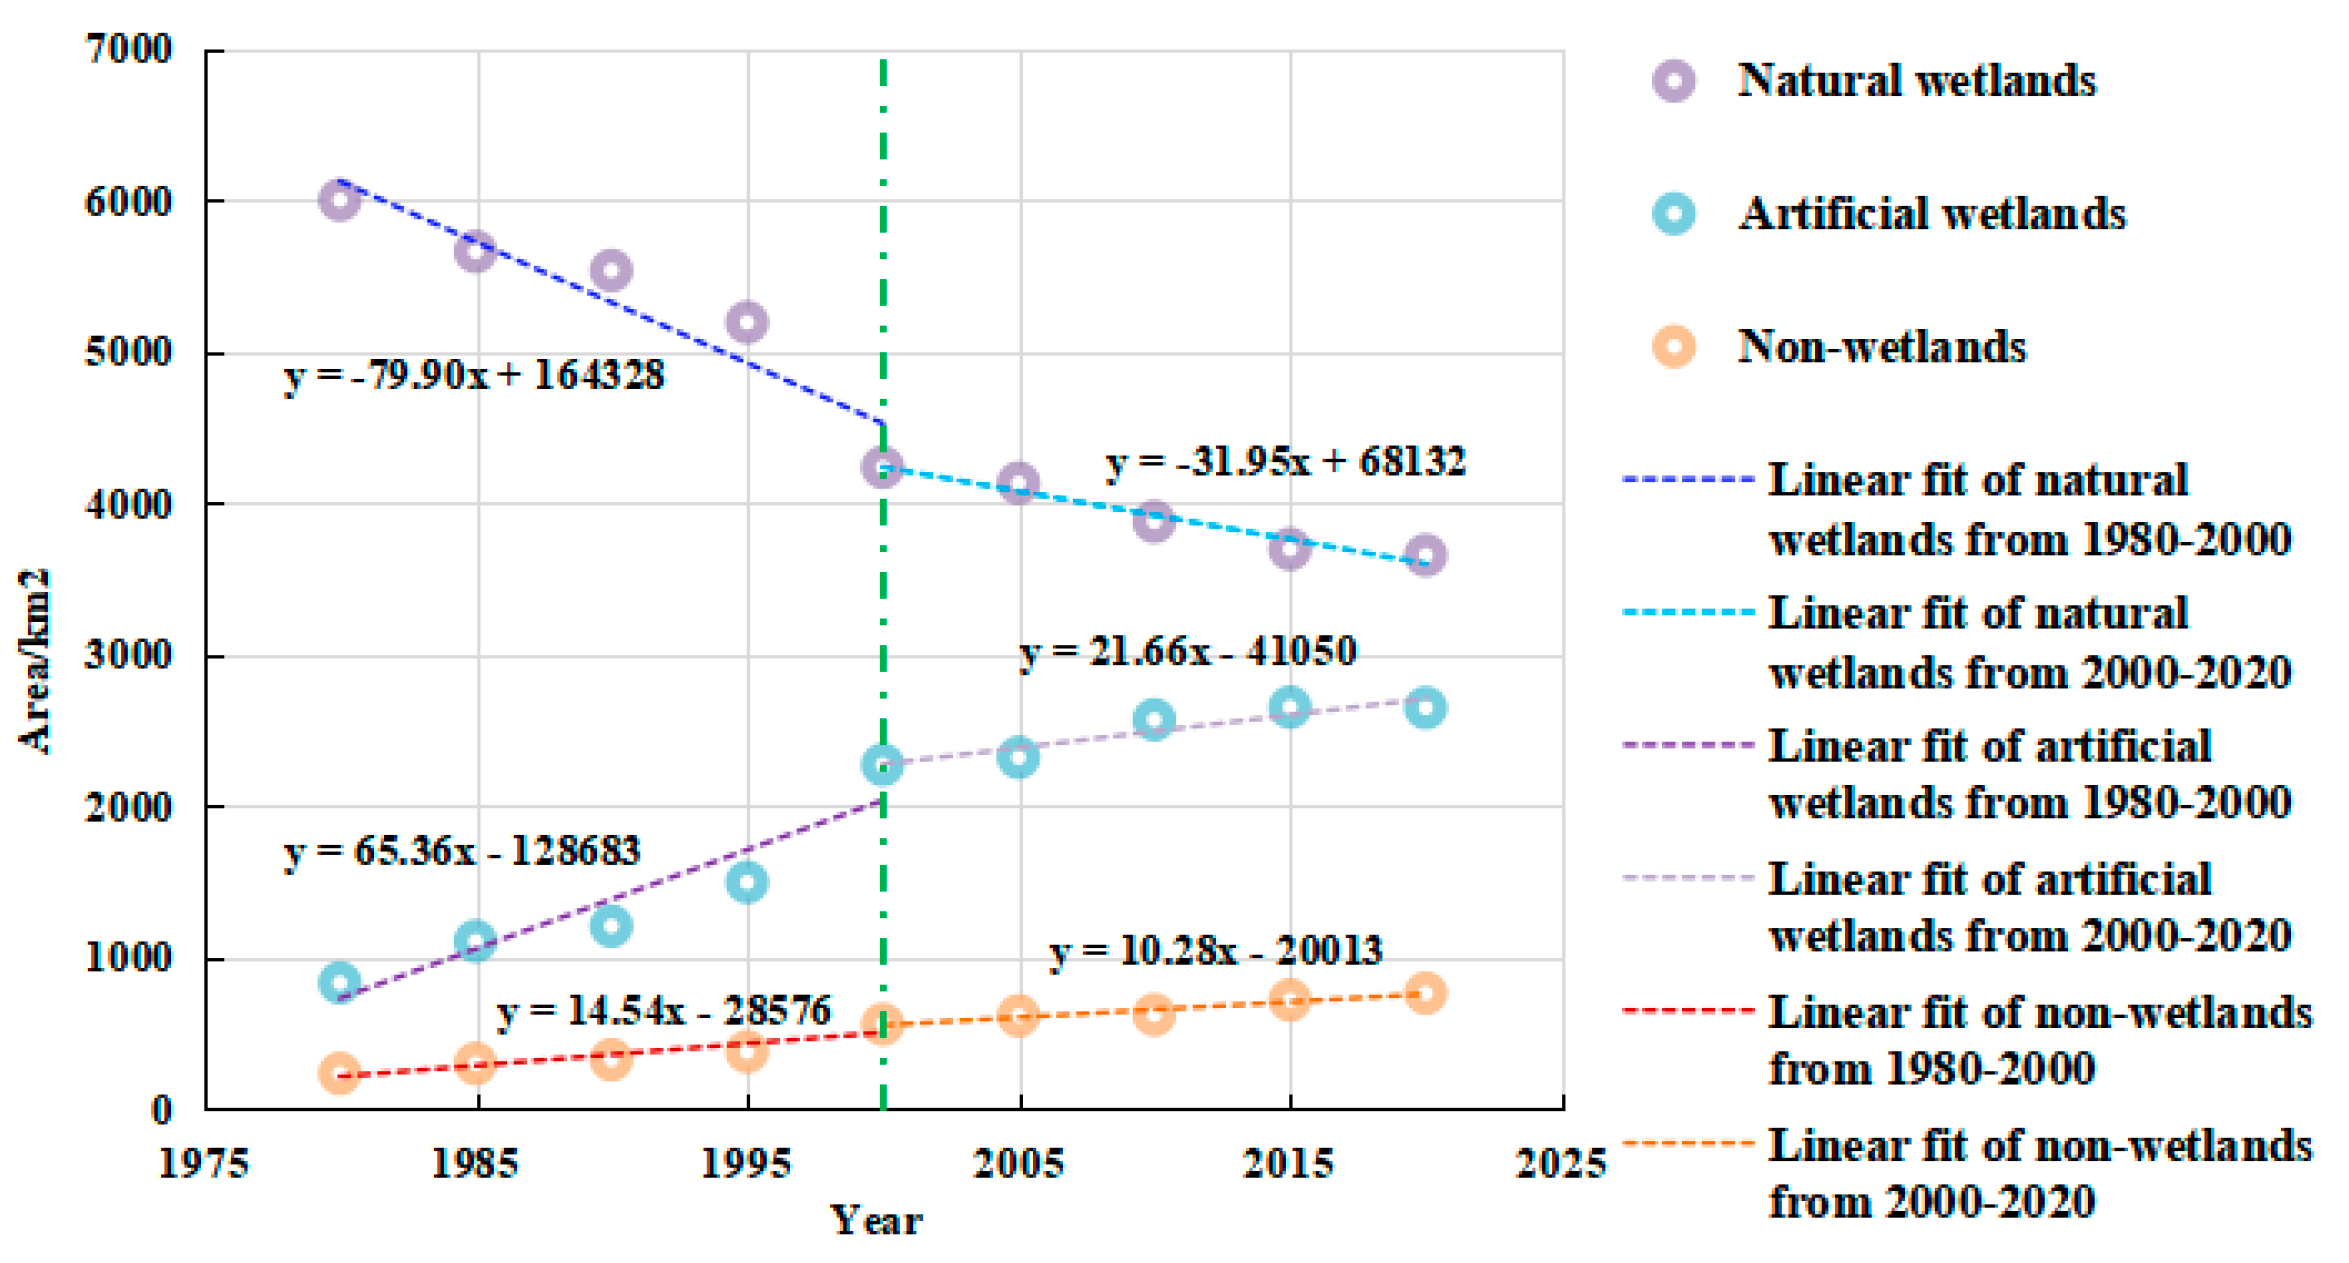
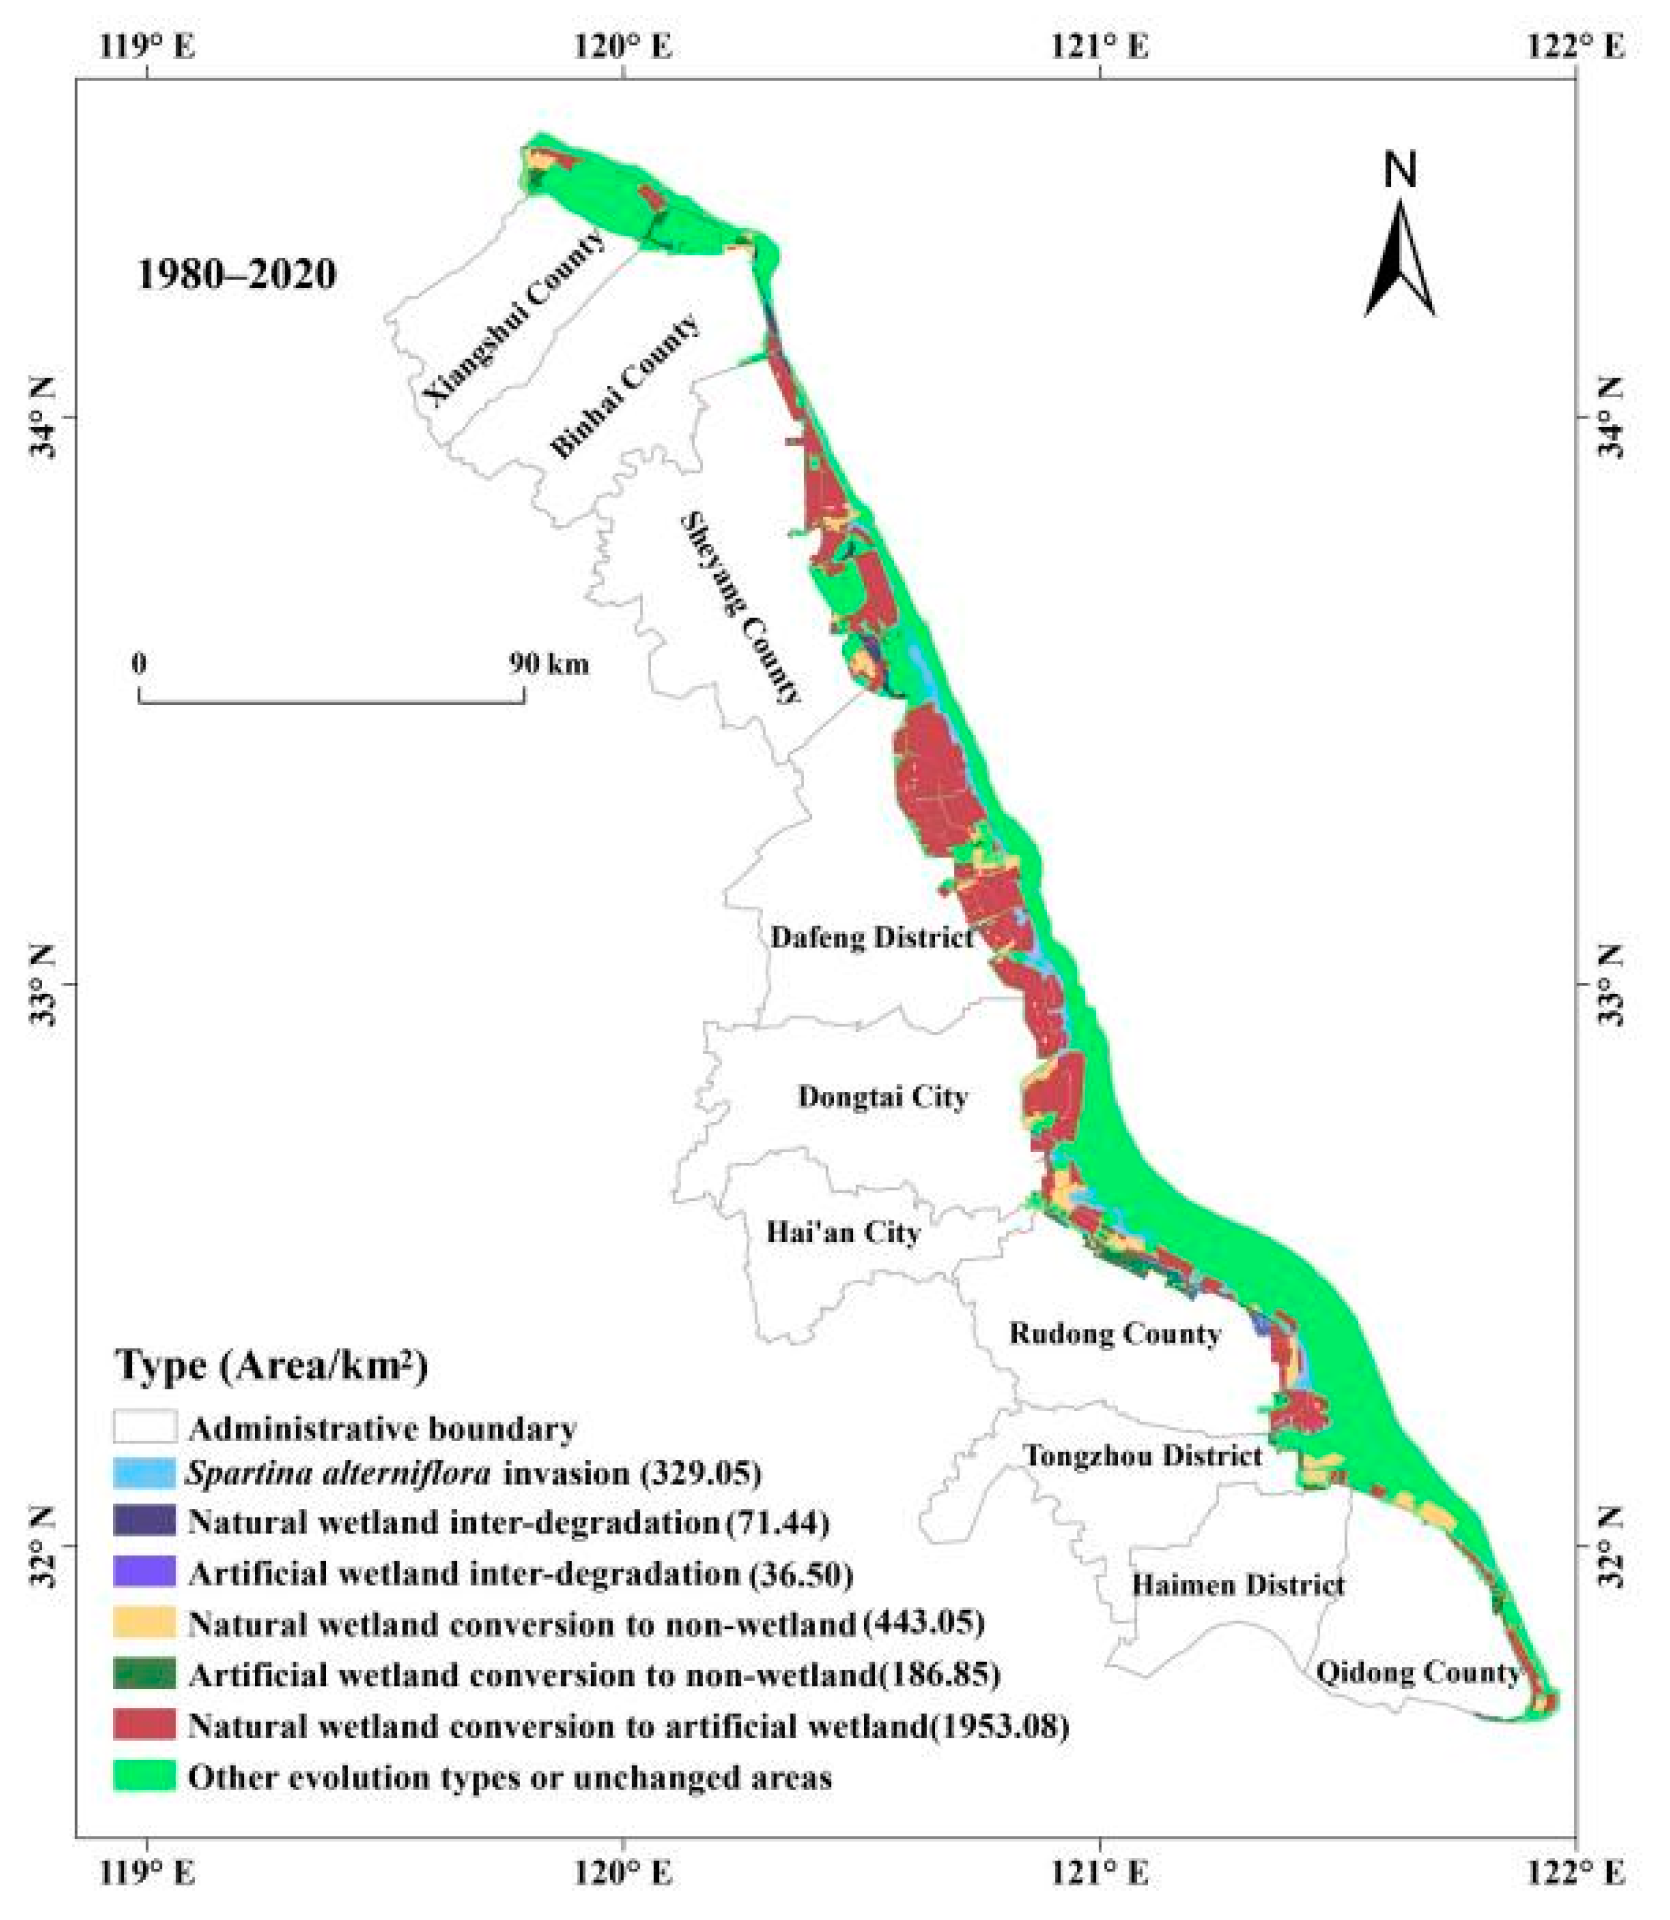
3.1. Time-Series Mapping and Area Statistics
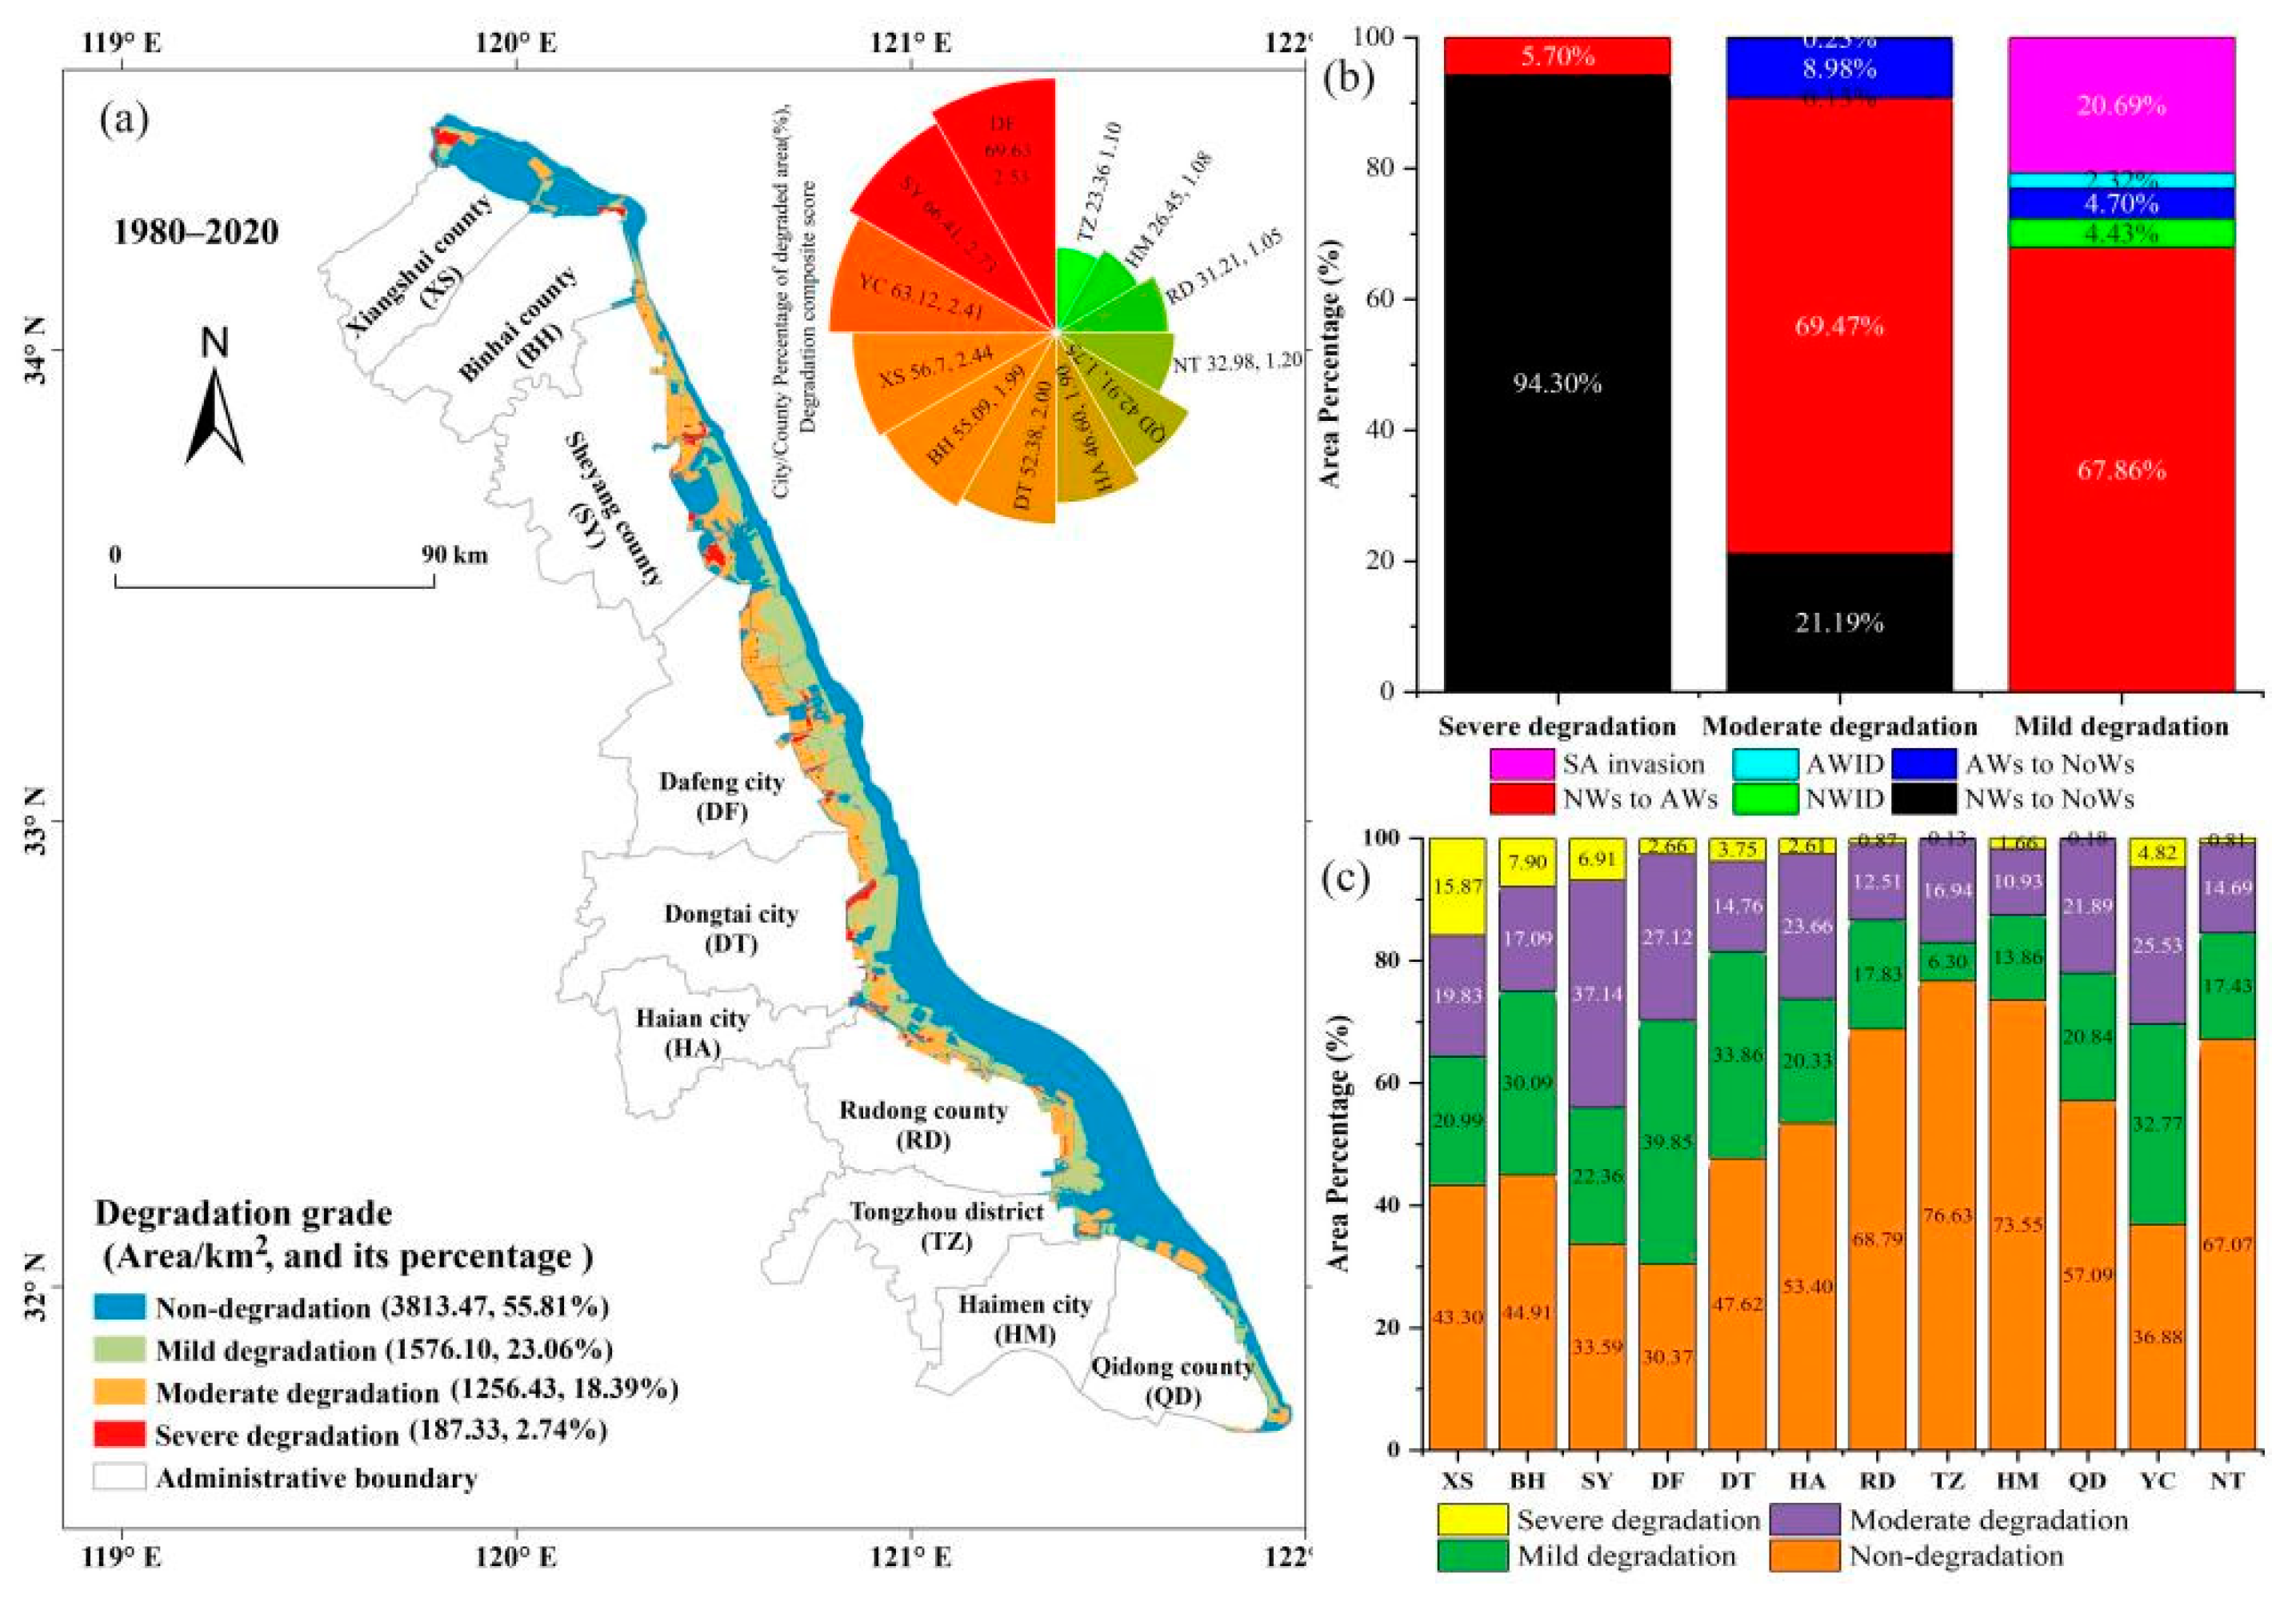
3.2. Spatial Distribution Characteristics of Degraded Areas
3.3. Analysis of Spatio-Temporal Changes in Wetland Degradation Grades
3.3.1. Analysis of Spatial Variation in Wetland Degradation Grades
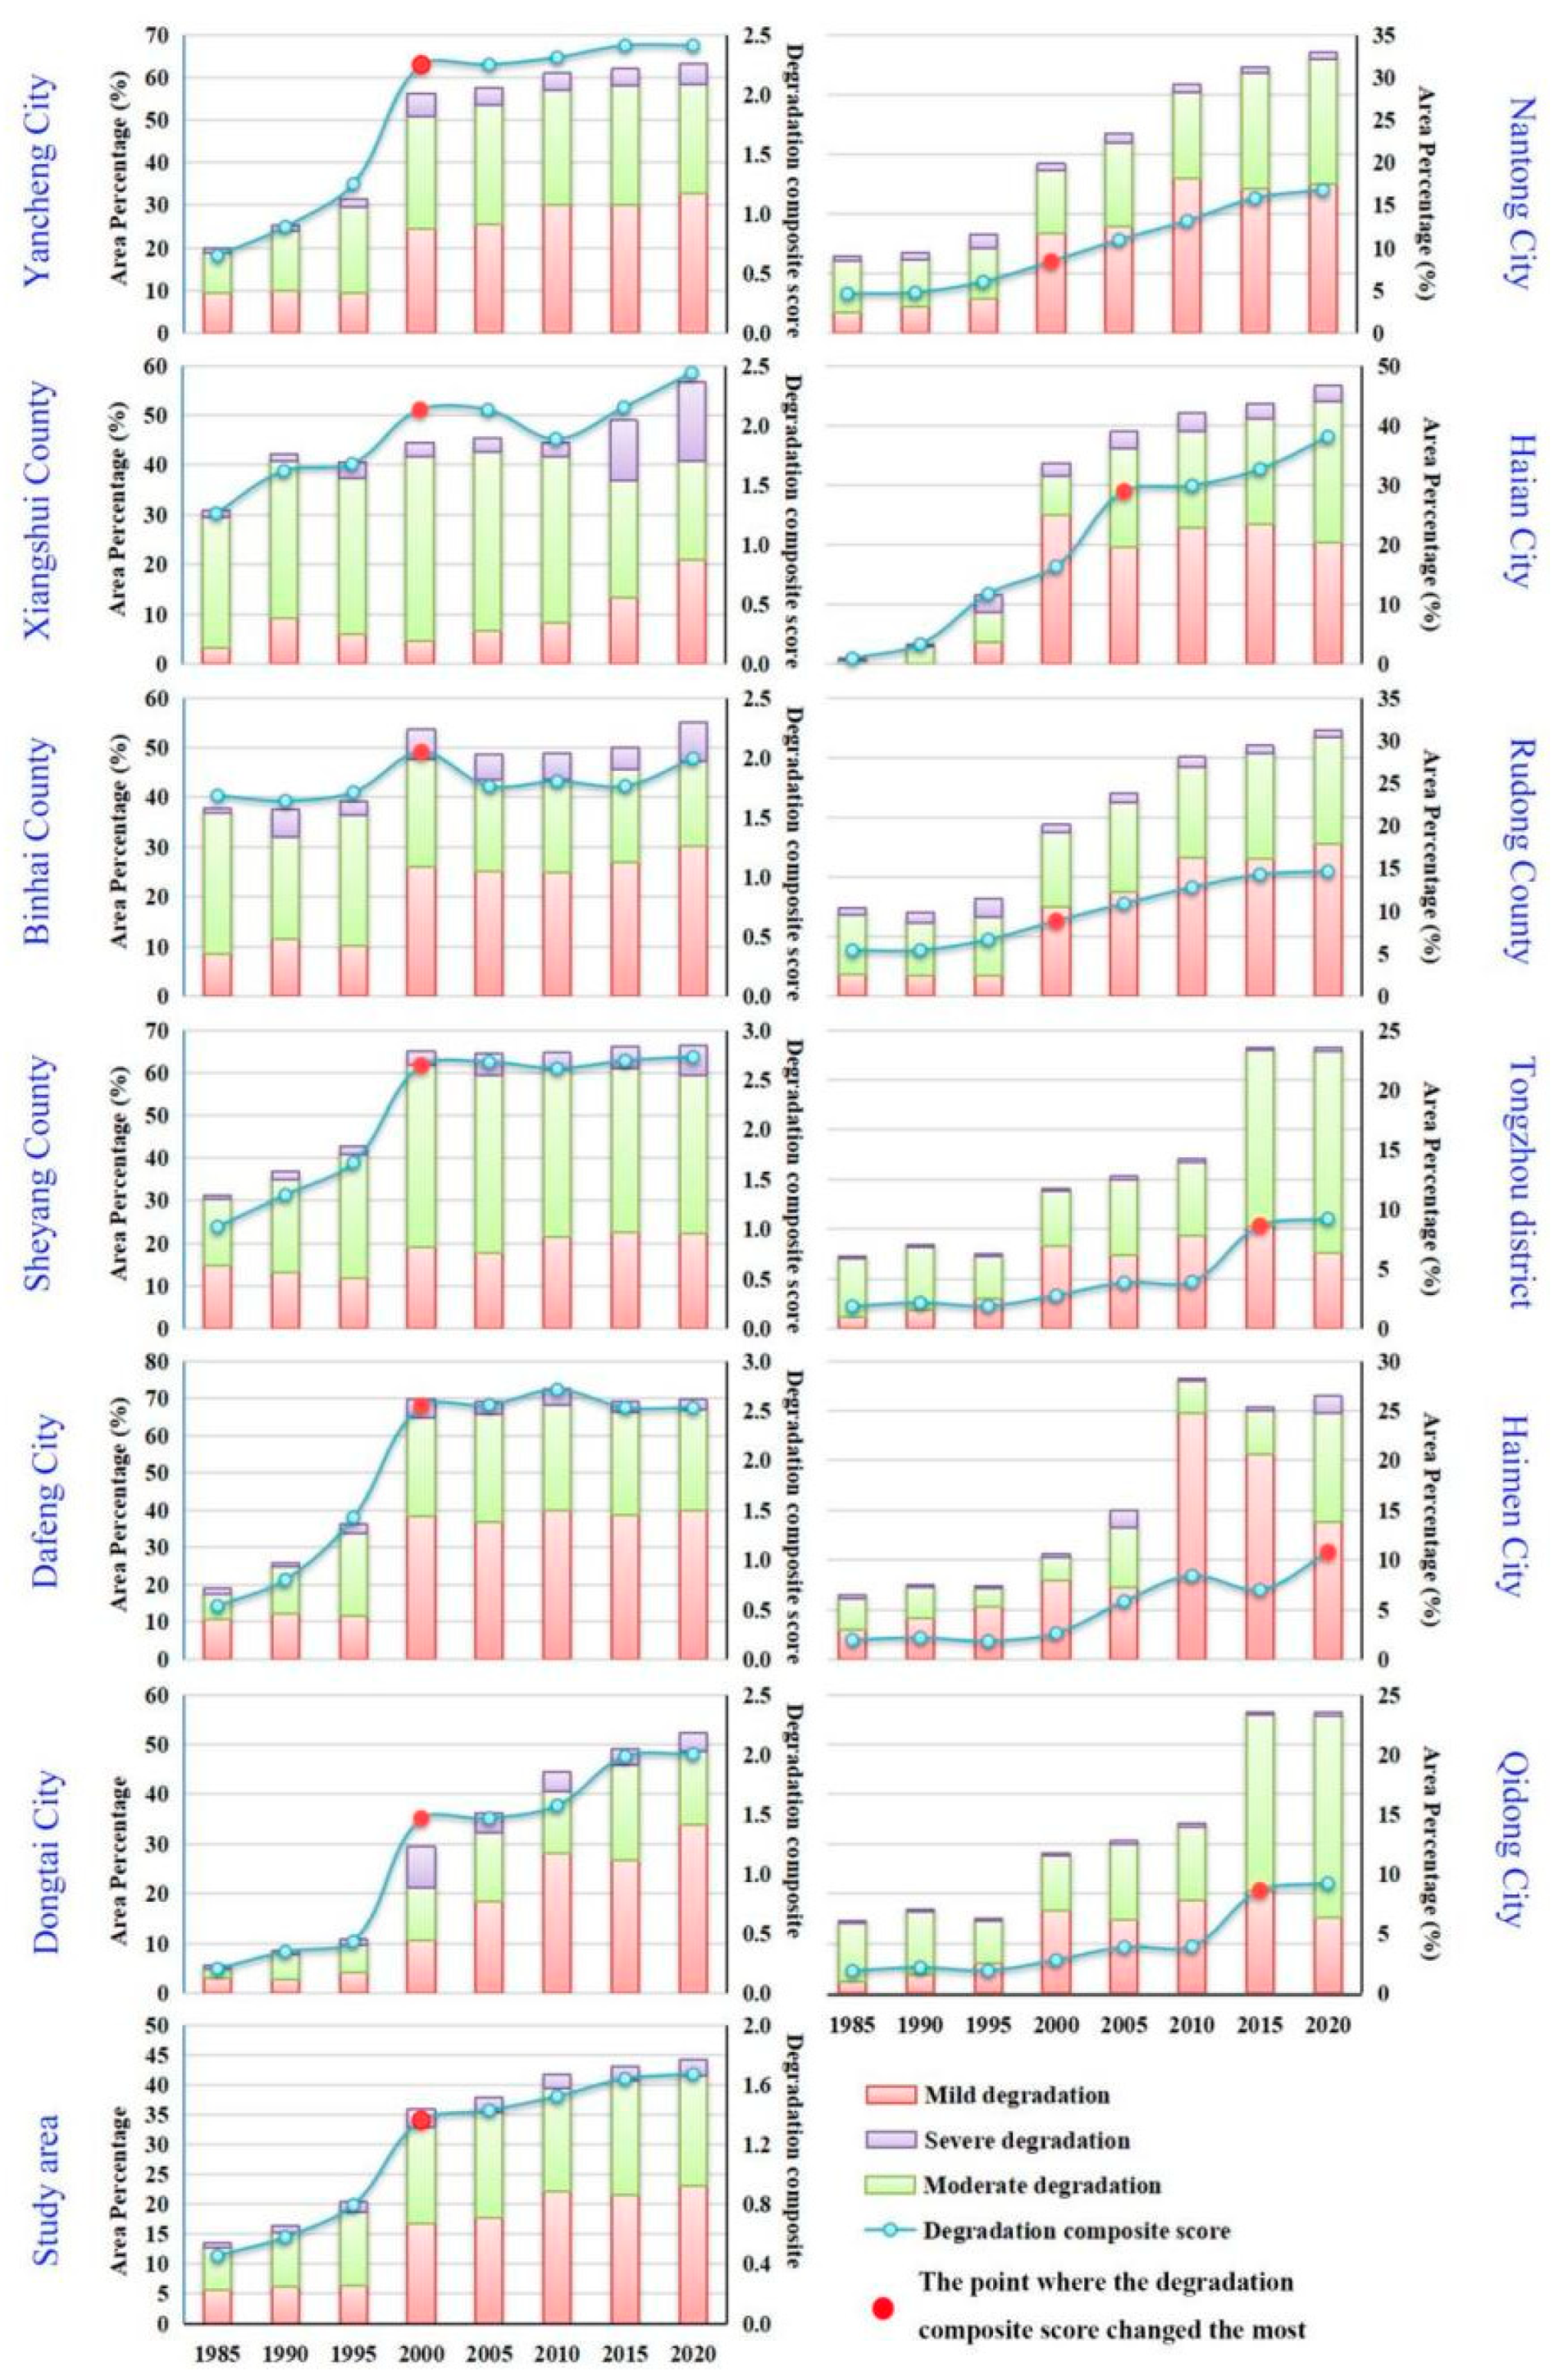
3.3.2. Analysis of Temporal Variation in Wetland Degradation Grades
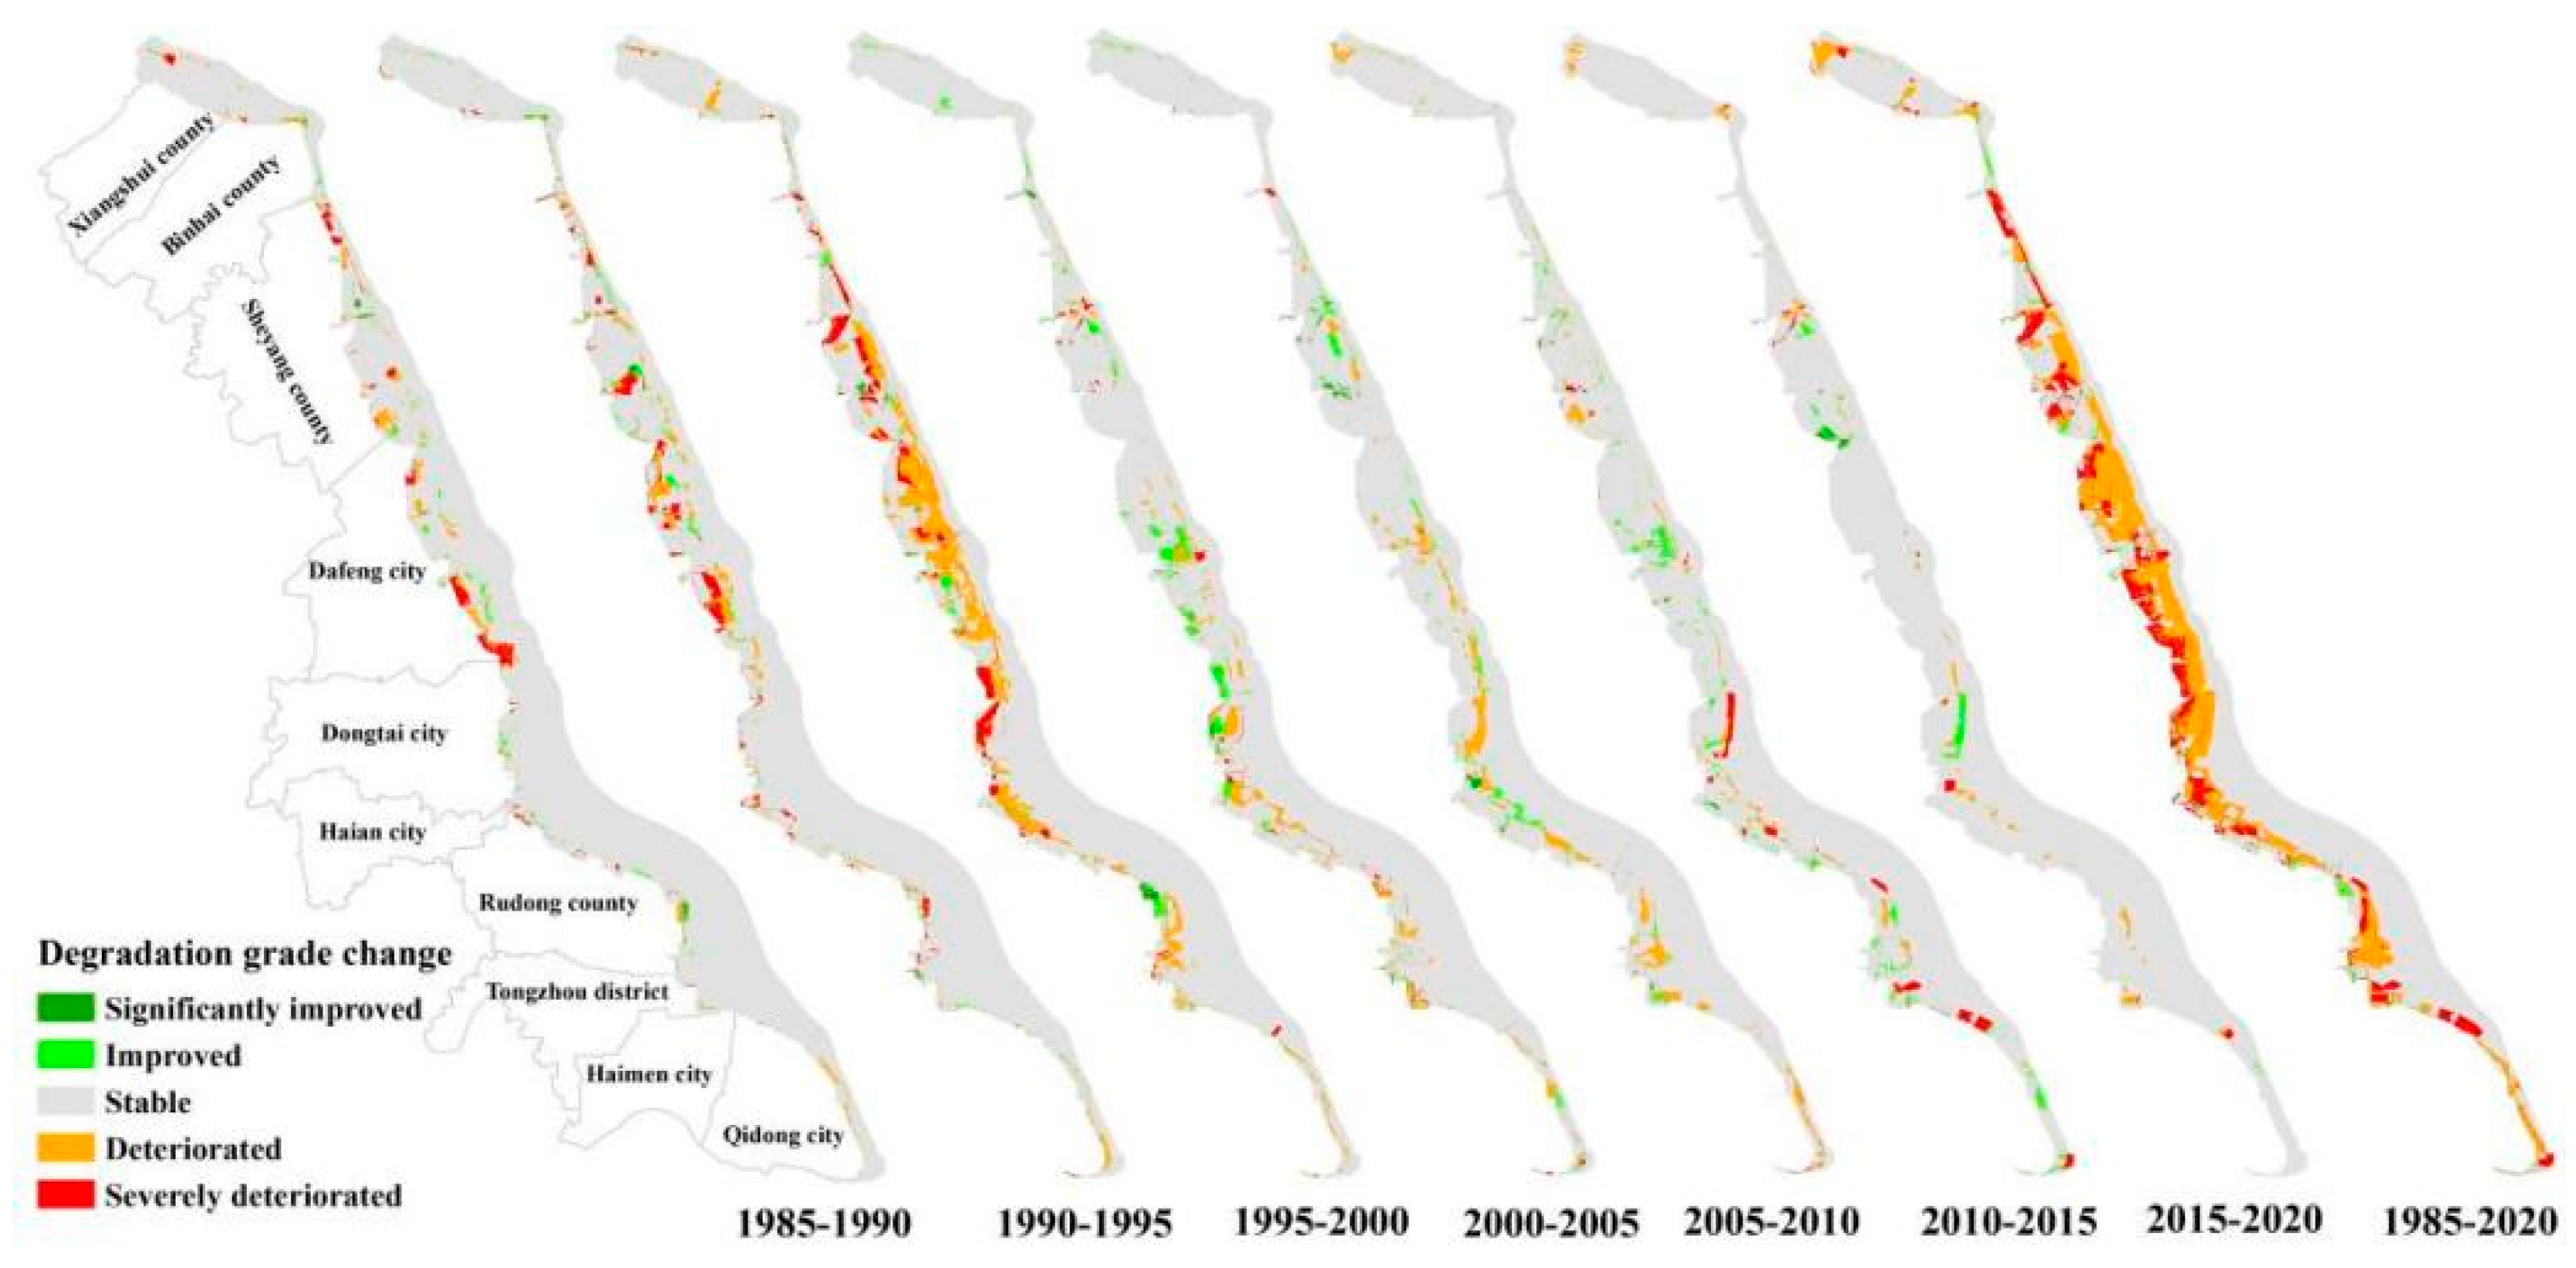
3.3.3. Pattern Analysis of the Evolution of Wetland Degradation Grades
4. Discussion
4.1. Regional Variability in Wetland Degradation
4.2. Stages of Wetland Degradation
4.3. Implications for Coastal Wetland Conservation Policies and Initiatives
4.4. Shortcomings and Prospects
5. Conclusions
Author Contributions
Funding
Data Availability Statement
Acknowledgments
Conflicts of Interest
References
- Zhou, Y.X.; Tian, B.; Huang, Y.; Wu, W.T.; Qi, X.Y.; Shu, M.Y. Degradation of coastal wetland ecosystem in China: Driver, Impacts, and Strategies. Bull. Chin. Acad. Sci. 2016, 31, 1157–1166. [Google Scholar]
- Shen, G.; Yang, X.C.; Jin, Y.X.; Xu, B.; Zhou, Q.B. Remote sensing and evaluation of the wetland ecological degradation process of the Zoige Plateau Wetland in China. Ecol. Indic. 2019, 104, 48–59. [Google Scholar] [CrossRef]
- Das, A.; Basu, T. Assessment of peri-urban wetland ecological degradation through importance-performance analysis (IPA): A study on Chatra Wetland, India. Ecol. Indic. 2020, 114, 106274. [Google Scholar] [CrossRef]
- Gu, J.L.; Luo, M.; Zhang, X.J.; Christakos, G.; Agusti, S.; Duarte, C.M.; Wu, J.P. Losses of salt marsh in China: Trends, threats and management. Estuar. Coast. Shelf Sci. 2018, 214, 98–109. [Google Scholar] [CrossRef] [Green Version]
- Liu, L.; Wang, H.J.; Yue, Q. China’s coastal wetlands: Ecological challenges, restoration, and management suggestions. Reg. Stud. Mar. Sci. 2020, 37, 101337. [Google Scholar] [CrossRef]
- Wang, X.X.; Xiao, X.M.; Xu, X.; Zou, Z.H.; Chen, B.Q.; Qin, Y.W.; Zhang, X.; Dong, J.W.; Liu, D.Y.; Pan, L.H.; et al. Rebound in China’s coastal wetlands following conservation and restoration. Nat. Sustain. 2021, 4, 1076–1083. [Google Scholar] [CrossRef]
- Cadier, C.; Bayraktarov, E.; Piccolo, R.; Adame, M.F. Indicators of Coastal Wetlands Restoration Success: A Systematic Review. Front. Mar. Sci. 2020, 7, 600220. [Google Scholar] [CrossRef]
- Zhang, J.; An, S.Q.; Leng, X. Status of wetland research in China. Mar. Freshw. Res. 2020, 71, 1572–1591. [Google Scholar] [CrossRef]
- Hu, T.G.; Liu, J.H.; Zheng, G.; Li, Y.; Xie, B. Quantitative assessment of urban wetland dynamics using high spatial resolution satellite imagery between 2000 and 2013. Sci. Rep. 2018, 8, 7409. [Google Scholar] [CrossRef] [Green Version]
- Zhang, Y.H.; Chen, J.H.; Zhang, J.C.; Zhang, Z.M.; Zhang, M.X. Novel indicator for assessing wetland degradation based on the index of hydrological connectivity and its correlation with the root-soil interface. Ecol. Indic. 2021, 133, 108392. [Google Scholar] [CrossRef]
- Cohen, M.J.; Dunne, E.J.; Bruland, G.L. Spatial variability of soil properties in cypress domes surrounded by different land uses. Wetlands 2008, 28, 411–422. [Google Scholar] [CrossRef]
- Souza, G.B.G.; Vianna, M. Fish-based indices for assessing ecological quality and biotic integrity in transitional waters: A systematic review. Ecol. Indic. 2020, 109, 105665. [Google Scholar] [CrossRef]
- Kim, J.; Kim, J.G.; Jung, J.; Han, D.; Choi, C.; Kim, H.S. Modified hydrogeomorphic approach for estimating quantitative change of riverine wetland functions. Ecol. Eng. 2020, 152, 105876. [Google Scholar] [CrossRef]
- Gu, D.Q.; Zhao, X.T.; Xia, D.X. A systemic analysis of the environmental pressure factors to the degradation of coastal wetlands in China. Acta Oceanol. Sin. 2003, 25, 78–85. [Google Scholar]
- Xu, H.T.; Zhou, L.F.; Cheng, Q. Study on ecosystem health evaluation and risk assessment for Linghekou wetlands based on a PRS model. Acta Ecol. Sin. 2017, 37, 8264–8274. [Google Scholar]
- Wu, X.C.; Dong, W.H.; Lin, X.Y.; Liang, Y.K.; Meng, Y.; Xie, W. Evolution of Wetland in Honghe National Nature Reserve from the View of Hydrogeology. Sci. Total Environ. 2017, 609, 1370–1380. [Google Scholar] [CrossRef] [PubMed]
- Müller, F.; Schrautzer, J.; Reiche, E.W.; Rinker, A. Ecosystem Based Indicators in Retrogressive Successions of an Agricultural Landscape. Ecol. Indic. 2006, 6, 63–82. [Google Scholar] [CrossRef]
- Cui, L.L.; Li, G.S.; Liao, H.J.; Ouyang, N.L.; Zhang, Y. Integrated Approach Based on a Regional Habitat Succession Model to Assess Wetland Landscape Ecological Degradation. Wetlands 2015, 35, 281–289. [Google Scholar] [CrossRef] [Green Version]
- Newman, E.A.; Kennedy, M.C.; Falkm, D.A.; Mckenzie, D. Scaling and Complexity in Landscape Ecology. Front. Ecol. Evol. 2019, 7, 293. [Google Scholar] [CrossRef] [Green Version]
- Wang, C.H.; Cui, L.J.; Mao, X.F. Study on human factor in wetland degradation—Experimental analysis based on diachronic and synchronic data. J. Nat. Resour. 2012, 27, 1677–1687. [Google Scholar]
- Jiang, T.T.; Pan, J.F.; Pu, X.M.; Wang, B.; Pan, J.J. Current Status of Coastal Wetlands in China: Degradation, Restoration, and Future Management. Estuar. Coast. Shelf Sci. 2015, 164, 265–275. [Google Scholar] [CrossRef]
- Gong, N.; Niu, Z.G.; Qi, W.; Zhang, H.Y. Driving forces of wetland change in China. J. Remote Sens. 2016, 20, 172–183. [Google Scholar]
- Tang, L.P.; Ke, X.L.; Chen, Y.Y.; Wang, L.Y.; Zhou, Q.S.; Zheng, W.W.; Xiao, B.Y. Which impacts more seriously on natural habitat loss and degradation? Cropland expansion or urban expansion? Land Degrad. Dev. 2020, 32, 946–964. [Google Scholar] [CrossRef]
- Zhang, R.S.; Lu, L.Y.; Wang, Y.H. The mechanism and trend of coastal erosion of Jiangsu Province in China. Geogr. Res. 2002, 21, 469–478. [Google Scholar]
- Liao, H.J.; Li, G.S.; Cui, L.L.; Ouyang, N.L.; Zhang, Y.; Wang, S.H. Study on Evolution Features and Spatial Distribution Patterns of Coastal Wetlands in North Jiangsu Province, China. Wetlands 2014, 34, 877–891. [Google Scholar] [CrossRef]
- Gu, D.Q.; Fu, J.; Yan, W.W.; Cong, B.L. Evaluation of coastal wetlands degradation in Yancheng City and Zonal Diagnosis. Wetl. Sci. 2012, 10, 1–7. [Google Scholar]
- He, J.; Fu, C.L.; Shu, L.Y.; Zhang, G.; Wan, K.C. Analysis on the status quo and causes of erosion and deposition of Yancheng coastline in Jiangsu Province. J. Geol. 2021, 45, 189–196. [Google Scholar]
- Zang, Z.; Zou, X.Q.; Zuo, P.; Song, Q.C.; Wang, C.L.; Wang, J.J. Impact of landscape patterns on ecological vulnerability and ecosystem service values: An empirical analysis of Yancheng Nature Reserve in China. Ecol. Indic. 2017, 72, 142–152. [Google Scholar] [CrossRef]
- Zhou, Y.K.; Ning, L.X.; Bai, X.L. Spatial and temporal changes of human disturbances and their effects on landscape patterns in the Jiangsu coastal zone, China. Ecol. Indic. 2018, 93, 111–122. [Google Scholar] [CrossRef]
- Cui, L.L.; Li, G.S.; Chen, Y.H.; Li, L.J. Response of Landscape Evolution to Human Disturbances in the Coastal Wetlands in Northern Jiangsu Province, China. Remote Sens. 2021, 13, 2030. [Google Scholar] [CrossRef]
- Song, W.; Deng, X.Z. Land-use/land-cover change and ecosystem service provision in China. Sci. Total Environ. 2017, 576, 705–719. [Google Scholar] [CrossRef] [PubMed]
- Hu, T.G.; Liu, J.h.; Zheng, G.; Zhang, D.R.; Huang, K.N. Evaluation of historical and future wetland degradation using remote sensing imagery and land use modeling. Land Degrad. Dev. 2020, 31, 65–80. [Google Scholar] [CrossRef]
- Mao, D.H.; Yang, H.; Wang, Z.M.; Song, K.S.; Thompson, J.R.; Flower, R.J. Reverse the hidden loss of China’s wetlands. Science 2022, 376, 1061. [Google Scholar] [CrossRef] [PubMed]
- Ma, L.; Li, M.; Ma, X.; Cheng, L.; Du, P.; Liu, Y. A review of supervised object-based land-cover image classification. ISPRS J. Photogramm. Remote Sens. 2017, 130, 277–293. [Google Scholar] [CrossRef]
- Cheng, J.C.; Guo, H.D.; Shi, W.Z. Uncertainty Problems in Remote Sensing Data; Science Press: Beijing, China, 2004; pp. 173–175. (In Chinese) [Google Scholar]
- Tana, G.; Letu, H.; Cheng, Z.K.; Tateishi, R. Wetlands mapping in North America by decision rule classification using MODIS and ancillary data. IEEE J. Sel. Top. Appl. Earth Obs. Remote Sens. 2013, 6, 2391–2401. [Google Scholar] [CrossRef]
- Chen, H.Y. Recent trend and protection of delta coast of old yellow river estuary. Mar. Sci. Bull. 1991, 10, 59–65. [Google Scholar]
- Yu, Z.Y.; Zhang, G.A.; Jin, L.; Bao, S.L.; Fan, S.J. Evolution prediction of the abandoned Yellow River submerged Delta under wave and current. Oceanol. Limnol. Sin. 2002, 33, 583–590. [Google Scholar]
- Liu, X.X.; Chen, S.L.; Jiang, C.; Hu, J.; Zhang, L. Vulnerability assessment of coastal erosion along the abandoned Yellow River Delta of northern Jiangsu, China. Acta Geogr. Sin. 2014, 69, 607–618. [Google Scholar]
- Li, J.G.; Pu, L.J.; Xu, C.Y.; Chen, X.J.; Zhang, Y.F.; Cai, F.F. The changes and dynamics of coastal wetlands and reclamation areas in central Jiangsu from 1977 to 2014. Acta Geogr. Sin. 2015, 70, 17–28. [Google Scholar]
- Wang, Y.X.; Liu, Y.X.; Jin, S.; Sun, C.; Wei, X.L. Evolution of the topography of tidal flats and sandbanks along the Jiangsu coast from 1973 to 2016 observed from satellites. ISPRS J. Photogramm. Remote Sens. 2019, 150, 27–43. [Google Scholar] [CrossRef]
- Wang, G.B.; Xu, C.L.; Huang, R.; Han, X.; Zhao, J.H.; She, D.L. Research on driving forces of reclamation dynamics and land use change in coastal areas of Jiangsu Province. J. Hohai Univ. (Nat. Sci.) 2020, 48, 163–170. [Google Scholar]
- Chen, C.; Feng, J.J.; Wang, C.Y.; Mao, L.J.; Zhang, Y.Z. Satellite-Based Monitoring of Coastal Wetlands in Yancheng, Jiangsu Province, China. J. Mar. Sci. Eng. 2022, 10, 829. [Google Scholar] [CrossRef]
- Xu, Y.; Pu, L.J.; Zhang, R.S.; Zhu, M.; Li, X.Y.; Shen, H.Y.; Mao, T.Y.; Xu, C.X. Cropland quality evolution following coastal reclamation at the prograding tidal flats of Jiangsu Province, China. Acta Geogr. Sin. 2017, 72, 2032–2046. [Google Scholar]
- Wang, W.; Liu, H.; Li, Y.Q.; Su, J.L. Development and management of land reclamation in China. Ocean. Coast. Manag. 2014, 102, 415–425. [Google Scholar] [CrossRef]
- Zhang, X.X.; Yan, C.Q.; Xu, P.; Dai, Y.X.; Yan, W.B.; Ding, X.R.; Zhu, C.X.; Mei, D.D. Historical evolution of tidal flat reclamation in the Jiangsu coastal areas. Acta Geogr. Sin. 2013, 68, 1549–1558. [Google Scholar]
- Jin, Y.; Gao, J.X.; Zhou, K.X.; Mu, S.J. Dynamic of land use/cover changes under reclamation and Spartina alterniflora invasion in Jiangsu central coastal wetlands. Geogr. Res. 2017, 36, 1478–1488. [Google Scholar]
- Zhang, X.X.; Wang, W.W.; Yan, C.Q.; Yan, W.B.; Dai, Y.X.; Xu, P.; Zhu, C.X. Historical coastline spatio-temporal evolution analysis in Jiangsu coastal area during the past 1000 years. Sci. Geogr. Sin. 2014, 34, 344–351. [Google Scholar]
- Li, H.F.; Li, L.F.; Su, F.L.; Wang, T.L.; Gao, P. Ecological stability evaluation of tidal flat in coastal estuary: A case study of Liaohe estuary wetland, China. Ecol. Indic. 2021, 130, 108032. [Google Scholar] [CrossRef]
- Choi, C.Y.; Xiao, H.; Jia, M.M.; Jackson, M.V.; Lai, Y.C.; Murray, N.J.; Gibson, L.; Fuller, R.A. An emerging coastal wetland management dilemma between mangrove expansion and shorebird conservation. Conserv. Biol. 2022, 36, e13905. [Google Scholar] [CrossRef]
- Liu, R.J.; Pu, L.J.; Zhu, M.; Qie, L.; Zhou, Y.F. Spatio-temporal evolution and influence mechanism of shorelines and tidal flat reclamation during 2000-2020 in Rudong, Jiangsu province. Geogr. Res. 2021, 40, 2367–2379. [Google Scholar]
- Iram, N.; Maher, D.T.; Lovelock, C.E.; Baker, T.; Cadier, C.; Adame, M.F. Climate change mitigation and improvement of water quality from the restoration of a subtropical coastal wetland. Ecol. Appl. 2022, 32, e2620. [Google Scholar] [CrossRef]
- Hagger, V.; Waltham, N.J.; Levelock, C.E. Opportunities for coastal wetland restoration for blue carbon with co-benefits for biodiversity, coastal fisheries, and water quality. Ecosyst. Serv. 2022, 55, 101423. [Google Scholar] [CrossRef]
- Zhou, X.; Zuo, P.; Teng, H.F.; Zou, X.Q.; Chen, H. Estimation of ecosystem service values based on land use changes: A case study of Yancheng coastal wetlands. Mar. Sci. Bull. 2011, 30, 656–661. [Google Scholar]
- Du, X.J.; Gao, X.M.; Ma, K.P. Diagnosis of the degree of degradation of an ecosystem: The basis and precondition of ecological restoration. Acta Phytoecol. Sin. 2003, 27, 700–708. [Google Scholar]
- Cazalis, V.; Loreau, M.; Henderson, K. Do we have to choose between feeding the human population and conserving nature? Modelling the global dependence of people on ecosystem services. Sci. Total Environ. 2018, 634, 1463–1474. [Google Scholar] [CrossRef] [PubMed] [Green Version]
- Zhao, Z.Y.; Yuan, L.; Li, W.; Tian, B.; Zhang, L.Q. Re-invasion of Spartina alterniflora in restored saltmarshes: Seed arrival, retention, germination, and establishment. J. Environ. Manag. 2020, 266, 110631. [Google Scholar] [CrossRef] [PubMed]
- Taylor, C.M.; Hastings, A. Finding optimal control strategies for invasive species: A density-structured model for Spartina alterniflora. J. Appl. Ecol. 2004, 41, 1049–1057. [Google Scholar] [CrossRef]
- Yang, D.; Zhang, P.Y.; Jiang, L.; Zhang, Y.; Liu, Z.Y.; Rong, T.Q. Spatial change and scale dependence of built-up land expansion and landscape pattern evolution—Case study of affected area of the lower Yellow River. Ecol. Indic. 2022, 141, 109123. [Google Scholar] [CrossRef]


| Year | Date | Sensor | Cloud Cover (%) | Path/Row | Year | Date | Sensor | Cloud Cover (%) | Path/Row |
|---|---|---|---|---|---|---|---|---|---|
| 1980 | 14/04/1980 | MSS | 0 | 129/36 | 2005 | 2/06/2005 | TM | 0.05 | 120/36 |
| 1/05/1980 | 0 | 128/37 | 24/04/2005 | 4.28 | 119/37 | ||||
| 5/11/1980 | 0 | 127/38 | 4/06/2005 | 0.43 | 118/38 | ||||
| 1985 | 23/03/1985 | TM | 0 | 120/36 | 2010 | 13/04/2010 | TM | 1 | 120/36 |
| 24/09/1985 | 7 | 119/37 | 31/10/2010 | 2 | 119/37 | ||||
| 20/11/1985 | 0 | 118/38 | 9/11/2010 | 9 | 118/38 | ||||
| 1990 | 8/05/1990 | TM | 0 | 120/36 | 2015 | 13/05/2015 | OLI | 15.87 | 120/36 |
| 15/04/1990 | 0 | 119/37 | 30/11/2015 | 7.03 | 119/37 | ||||
| 13/07/1990 | 6 | 118/38 | 3/08/2015 | 6.81 | 118/38 | ||||
| 1995 | 22/05/1995 | TM | 0 | 120/36 | 2020 | 26/05/2020 | OLI | 4.47 | 120/36 |
| 3/08/1995 | 0.41 | 119/37 | 19/05/2020 | 0.21 | 119/37 | ||||
| 12/08/1995 | 0 | 118/38 | 12/05/2020 | 2.74 | 118/38 | ||||
| 2000 | 17/04/2000 | TM | 0 | 120/36 | |||||
| 10/04/2000 | 0 | 119/37 | |||||||
| 21/05/2000 | 0 | 118/38 |
| Level I | Level II | Level III | Description |
|---|---|---|---|
| Wetlands | Natural wetlands | Grassland | The supratidal zone with grasses (Imperata cylindrica, Aeluropus sinensis, Apocynum venetum, etc.) growing |
| River | Permanent river, stream, or creek | ||
| Phragmites australis | Phragmites australis marsh | ||
| Suaeda glauca | Suaeda glauca marsh (Suaeda salsa, Salicornia europaea) | ||
| Spartina alterniflora | Spartina alterniflora marsh (Sporobolus anglicus, Spartina alterniflora) | ||
| Tidal flat | Intertidal mudflats | ||
| Shallow marine water | Marginal or inland extensions of ocean with maximum depths of approximately 6 m | ||
| Artificial wetlands | Paddy field | Farmland where rice is grown | |
| Pool | Artificially dug pools or low-lying catchment areas | ||
| Salt field | Site for salt production by evaporation | ||
| Aquafarm | Site for aquaculture | ||
| Non-wetland area | Non-wetland | Dryland, woodland, urban settlements, rural settlements, bare land, levee, other construction lands | |
| Landscape Type | 1980 | 2015 | ||
|---|---|---|---|---|
| User Accuracy | Producer Accuracy | User Accuracy | Producer Accuracy | |
| Tidal flat and shallow marine water | 91.18 | 96.88 | 90.00 | 90.00 |
| Suaeda glauca | 88.24 | 90.91 | 73.68 | 84.85 |
| Phragmites australis | 93.75 | 88.24 | 83.33 | 81.08 |
| Grassland | 95.12 | 95.12 | 94.74 | 87.80 |
| River | 96.43 | 90.00 | 90.00 | 90.00 |
| Paddy field | 88.24 | 93.75 | 69.44 | 78.13 |
| Aquafarm | 91.67 | 91.67 | 78.43 | 80.00 |
| Salt field | 89.47 | 87.18 | 82.50 | 75.00 |
| Pool | 91.89 | 94.44 | 74.36 | 80.56 |
| Spartina alterniflora | 96.15 | 94.34 | 86.27 | 83.02 |
| Urban settlememts | 96.77 | 96.77 | 90.00 | 87.10 |
| Levee | 96.55 | 93.33 | 92.00 | 76.67 |
| Rural settlements | 90.00 | 90.00 | 60.00 | 80.00 |
| Bareland | 82.35 | 93.33 | 81.82 | 90.00 |
| Woodland | 93.75 | 90.91 | 92.00 | 69.70 |
| Dryland | 88.89 | 86.96 | 73.33 | 71.74 |
| Other construction lands | 87.88 | 85.29 | 87.88 | 85.29 |
| Overall accuracy | 91.67 | 81.45 | ||
| Kappa coefficient | 0.88 | 0.80 | ||
| Classification accuracy | 88.65~93.93 | 77.55~84.81 | ||
| Type | Xiangshui County | Binhai County | Sheyang County | Dafeng District | Dongtai City | Hai’an City | Rudong County | Tongzhou District | Haimen District | Qidong City | ||||||||||
|---|---|---|---|---|---|---|---|---|---|---|---|---|---|---|---|---|---|---|---|---|
| Area/km2 | APDA | Area/km2 | APDA | Area/km2 | APDA | Area/km2 | APDA | Area/km2 | APDA | Area/km2 | APDA | Area/km2 | APDA | Area/km2 | APDA | Area/km2 | APDA | Area/km2 | APDA | |
| NWs to NoWs | 26.04 | 27.88 | 13.37 | 16.32 | 52.76 | 9.53 | 77.55 | 7.89 | 60.80 | 12.88 | 23.33 | 53.72 | 79.25 | 14.57 | 26.43 | 65.01 | 14.67 | 42.90 | 68.85 | 38.38 |
| AWs to NoWs | 17.58 | 18.82 | 31.08 | 37.93 | 7.55 | 1.36 | 1.46 | 0.15 | 1.83 | 0.39 | 0.00 | 0.00 | 84.42 | 15.52 | 7.95 | 19.56 | 6.36 | 18.59 | 28.62 | 15.95 |
| NWID | 1.26 | 1.35 | 18.95 | 23.12 | 34.79 | 6.29 | 13.70 | 1.39 | 2.37 | 0.50 | 0.00 | 0.00 | 0.35 | 1.04 | 0.00 | 0.00 | 0.02 | 0.05 | 0.00 | 0.00 |
| AWID | 0.46 | 0.49 | 1.94 | 2.37 | 2.90 | 0.52 | 0.64 | 0.06 | 0.00 | 0.00 | 0.00 | 0.00 | 28.47 | 5.23 | 1.03 | 2.53 | 0.02 | 0.06 | 1.04 | 0.58 |
| NWs to AWs | 44.87 | 48.04 | 14.87 | 18.14 | 410.18 | 74.11 | 765.58 | 77.91 | 367.98 | 77.93 | 8.06 | 18.55 | 253.69 | 46.64 | 2.51 | 6.18 | 10.79 | 31.55 | 74.55 | 41.55 |
| SA invasion | 3.19 | 3.42 | 1.74 | 2.12 | 45.26 | 8.18 | 123.70 | 12.59 | 39.20 | 8.30 | 12.04 | 27.73 | 92.49 | 17.00 | 2.73 | 6.71 | 2.35 | 6.86 | 6.35 | 3.54 |
| Total area(km2) | 93.40 | 81.95 | 553.45 | 982.63 | 472.18 | 43.43 | 538.67 | 40.66 | 34.20 | 180.10 | ||||||||||
| APCA | 19.04 | 22.49 | 54.62 | 66.57 | 51.64 | 42.10 | 28.43 | 20.54 | 24.36 | 37.91 | ||||||||||
| ADAPP | 19.38 | 26.08 | 59.34 | 67.99 | 52.18 | 46.58 | 28.86 | 20.91 | 24.52 | 38.93 | ||||||||||
| Region | 1985–1990 | 1990–1995 | 1995–2000 | 2000–2005 | 2005–2010 | 2010–2015 | 2015–2020 | Average | Trendline | Trend |
|---|---|---|---|---|---|---|---|---|---|---|
| Xiangshui County | 0.90 | 4.88 | 1.12 | 1.73 | 4.27 | 0.79 | 0.15 | 1.98 |  | Decrease with fluctuations |
| Binhai County | 9.64 | 9.52 | 5.55 | 5.70 | 0.71 | 1.49 | 0.53 | 4.73 |  | |
| Sheyang County | 18.41 | 32.78 | 19.09 | 14.50 | 35.31 | 12.65 | 20.81 | 21.94 |  | |
| Dafeng District | 34.75 | 28.81 | 26.91 | 35.07 | 10.09 | 32.86 | 29.58 | 28.29 |  | |
| Dongtai City | 9.67 | 3.32 | 4.88 | 27.78 | 18.20 | 10.21 | 46.35 | 17.20 |  | Increase with fluctuations |
| Hai’an City | 0.03 | 0.91 | 0.58 | 1.54 | 2.83 | 0.75 | 0.00 | 0.95 |  | |
| Rudong County | 23.09 | 8.74 | 33.91 | 5.67 | 22.59 | 20.50 | 0.00 | 16.36 |  | Decrease with fluctuations |
| Tongzhou District | 0.35 | 3.25 | 0.94 | 2.71 | 1.24 | 3.18 | 0.00 | 1.67 |  | |
| Haimen District | 0.35 | 2.26 | 1.89 | 0.60 | 4.22 | 2.85 | 0.00 | 1.74 |  | Increase with fluctuations |
| Qidong City | 2.81 | 5.53 | 5.13 | 4.71 | 0.54 | 14.72 | 2.59 | 5.15 |  | |
| Yancheng City | 73.37 | 79.31 | 57.54 | 84.78 | 68.59 | 58.01 | 97.41 | 74.15 |  | |
| Nantong City | 26.63 | 20.69 | 42.46 | 15.22 | 31.41 | 41.99 | 2.59 | 25.85 |  | Decrease with fluctuations |
| Study Area | 1.57 | 1.95 | 2.06 | 3.84 | 2.73 | 3.24 | 1.50 | 2.41 |  | Increase with fluctuations |
| Region | 1985–1990 | 1990–1995 | 1995–2000 | 2000–2005 | 2005–2010 | 2010–2015 | 2015–2020 | Average | Trendline | Trend |
|---|---|---|---|---|---|---|---|---|---|---|
| Xiangshui County | 5.22 | 1.16 | 0.96 | 1.09 | 0.60 | 7.21 | 10.85 | 3.87 |  | Increase with fluctuations |
| Binhai County | 3.96 | 2.22 | 2.13 | 0.61 | 0.56 | 0.91 | 7.90 | 2.61 |  | |
| Sheyang County | 28.36 | 21.93 | 18.51 | 11.01 | 9.37 | 16.83 | 17.05 | 17.58 |  | Decrease with fluctuations |
| Dafeng District | 37.52 | 50.90 | 44.28 | 18.14 | 18.28 | 7.59 | 4.66 | 25.91 |  | |
| Dongtai City | 11.05 | 6.04 | 14.37 | 22.54 | 24.50 | 21.80 | 19.94 | 17.18 |  | Increase with fluctuations |
| Hai’an City | 0.59 | 1.69 | 1.67 | 4.95 | 1.96 | 1.23 | 4.65 | 2.39 |  | |
| Rudong County | 7.20 | 9.73 | 14.19 | 26.63 | 27.16 | 22.47 | 18.39 | 17.97 |  | |
| Tongzhou District | 0.56 | 0.68 | 0.81 | 3.29 | 1.13 | 6.22 | 2.36 | 2.15 |  | |
| Haimen District | 0.53 | 0.36 | 0.54 | 3.52 | 4.43 | 0.96 | 7.08 | 2.49 |  | |
| Qidong City | 5.01 | 5.28 | 2.54 | 8.23 | 12.02 | 14.79 | 7.12 | 7.85 |  | |
| Yancheng City | 86.11 | 82.25 | 80.26 | 53.38 | 53.30 | 54.34 | 60.40 | 67.15 |  | Decrease with fluctuations |
| Nantong City | 13.89 | 17.75 | 19.74 | 46.62 | 46.70 | 45.66 | 39.60 | 32.85 |  | Increase with fluctuations |
| Study Area | 5.24 | 6.98 | 18.47 | 5.58 | 6.22 | 4.73 | 2.49 | 7.10 |  | Decrease with fluctuations |
Publisher’s Note: MDPI stays neutral with regard to jurisdictional claims in published maps and institutional affiliations. |
© 2022 by the authors. Licensee MDPI, Basel, Switzerland. This article is an open access article distributed under the terms and conditions of the Creative Commons Attribution (CC BY) license (https://creativecommons.org/licenses/by/4.0/).
Share and Cite
Cui, L.; Li, G.; Liao, H.; Ouyang, N.; Li, X.; Liu, D. Remote Sensing of Coastal Wetland Degradation Using the Landscape Directional Succession Model. Remote Sens. 2022, 14, 5273. https://doi.org/10.3390/rs14205273
Cui L, Li G, Liao H, Ouyang N, Li X, Liu D. Remote Sensing of Coastal Wetland Degradation Using the Landscape Directional Succession Model. Remote Sensing. 2022; 14(20):5273. https://doi.org/10.3390/rs14205273
Chicago/Turabian StyleCui, Linlin, Guosheng Li, Huajun Liao, Ninglei Ouyang, Xingyue Li, and Dan Liu. 2022. "Remote Sensing of Coastal Wetland Degradation Using the Landscape Directional Succession Model" Remote Sensing 14, no. 20: 5273. https://doi.org/10.3390/rs14205273