1. Introduction
The imaging effect of traditional optical sensing is always affected by many factors, such as clouds and illumination, while Synthetic Aperture Radar (SAR) is not. SAR has the characteristics of strong penetration and a durable working period, so it is more suitable for ever-changing marine scenes [
1,
2]. With the increasingly serious challenge of maritime rights, SAR technology has become one of the important tools for marine monitoring.
When processing SAR images, the detection of ships is mainly achieved by comparing changes in pixel grey values and extracting feature information, such as the structure and shape of ship objects [
3]. Poor visual effects lead to unsatisfactory detection in cluttered scenes, such as nearshore and harbors.
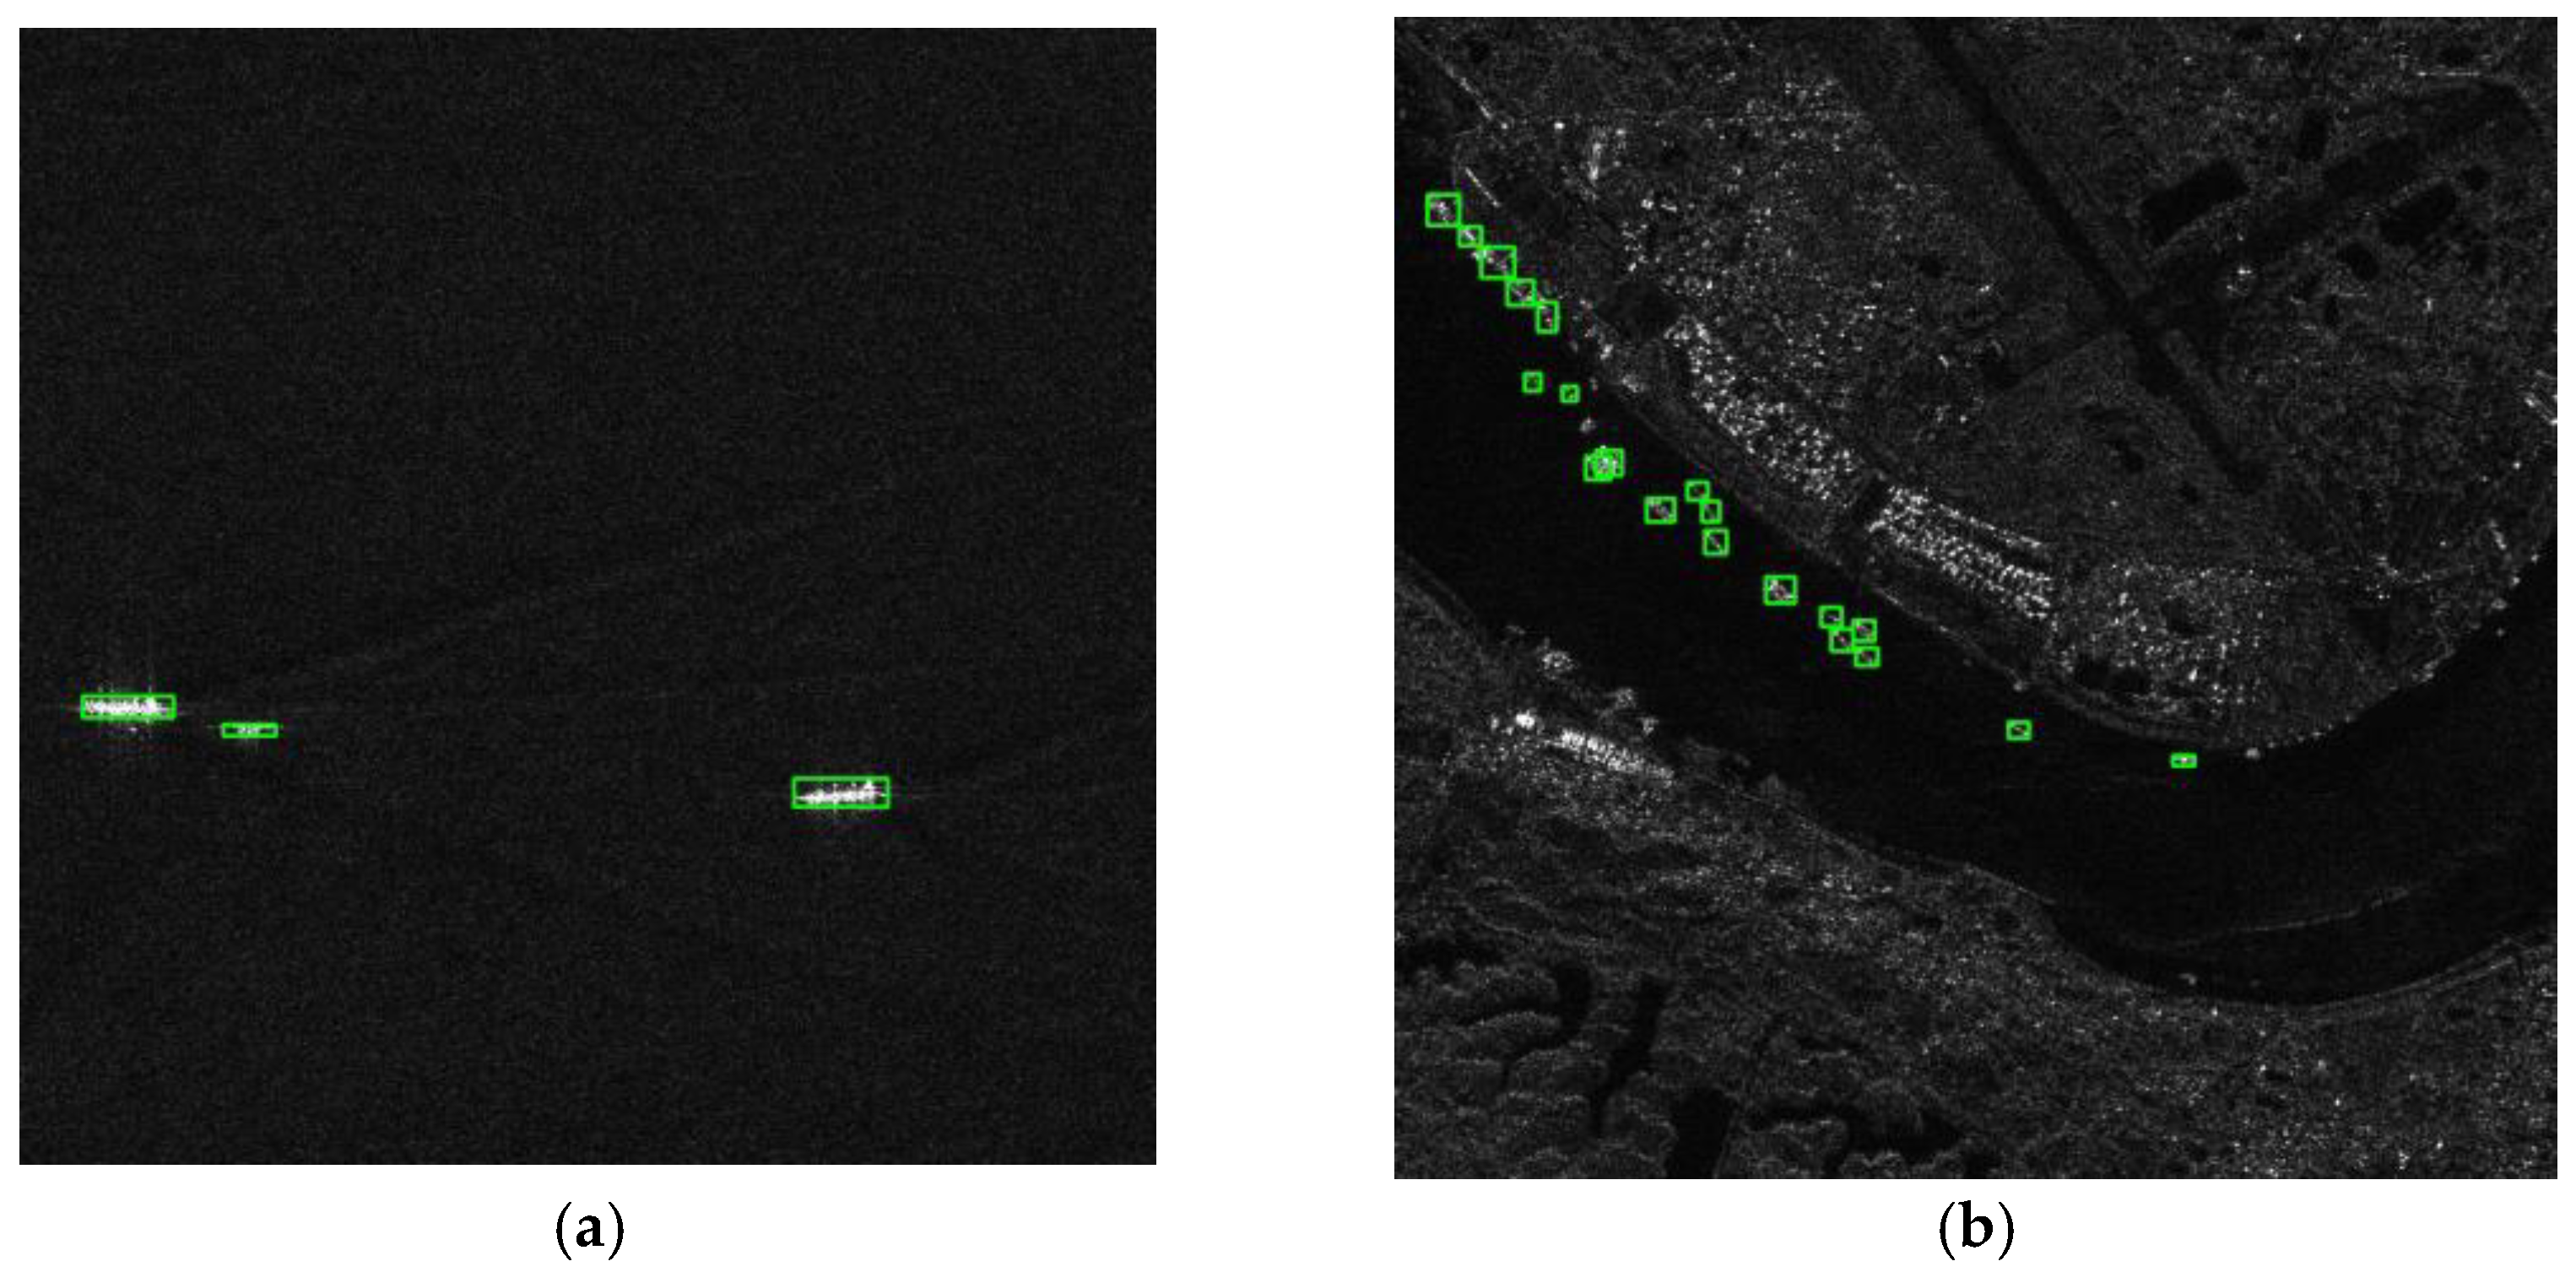
Figure 1 shows two SAR image examples in the HRSID, a simple off-shore image (a) and a complicated in-shore image (b). In
Figure 1a, the ships are large, sparsely distributed, and have a clear trail. The ships in
Figure 1b have the characteristics of a small area and dense distribution, which makes ship detection difficult and challenging.
For ship detection in SAR images, traditional methods are mainly based on the feature differences between sea clutter and ship objects. The traditional methods can be divided into two types depending on the object of concern, based on auxiliary features and on statistical features. Analyzing the trail and leaking oil traces behind the ships, the algorithm based on auxiliary features achieves the indirect detection of ship targets and eliminates false detection in the results [
4]. However, tail detection can only be performed if there are trails in the image, which makes the employment of this algorithm limited. The algorithm based on statistical features compares the marine background and ship objects in SAR images, analyzes the contrast information, and ultimately achieves ship detection. The Constant False Alarm Rate (CFAR) detection algorithm is the first and one of the most widely used [
5]. By statistical inference and probabilistic modeling, the CFAR algorithm estimates the probability density function of ocean clutter and sets an appropriate threshold to separate the objects from clutter. However, the accuracy of pixel-based CFAR detection is poor as it is easily influenced by serious clutter and other factors [
6]. According to different image characteristics, CFAR needs to select appropriate sea clutter distribution models. When the image resolution is low, a Gaussian distribution or negative exponential distribution is used to describe the sea clutter [
7]. Dealing with high-resolution SAR images, Qin et al. [
8] used the log-cumulants method to gain the parameters and proposed a CFAR detection algorithm based on a generalized gamma distribution, which showed better results. Linking the co-polarized channels to the burst time offset between the channels, Nunziata et al. [
9] proposed an innovative dual-polarization model and a CFAR method to process the full-resolution CSK PingPong SAR data to observe ships and oil platforms. Based on the scattering characteristics of ships at sea, Ferrara et al. [
10] proposed a physical model that processes full-resolution Single-Look Complex (SLC) SAR information combined with an efficient filtering technique designed to achieve the high-quality identification of targets and backgrounds at sea. The above traditional algorithms are suitable for processing single as well as simple SAR images, but are not quite effective when dealing with complex maritime situations.
Since the introduction of deep learning, it has continued to evolve and received widespread attention from scholars from all walks of life. By applying this technique to image processing, the detection accuracy and speed of tasks such as target detection and instance segmentation have been significantly improved [
11]. Depending on their structure, there are two types of deep learning-based detection algorithms: one-stage algorithms and two-stage algorithms [
12]. The principle of the two-stage algorithm is to generate candidate frames first and then classify them on the basis of whether they contain objects or not. As a pioneer in object detection using deep learning, the R-CNN [
13] algorithm has substantially improved detection accuracy compared with traditional detection algorithms. Based on R-CNN, scholars have made improvements, resulting in excellent algorithms such as Faster R-CNN [
14], Mask R-CNN [
15], Dynamic R-CNN [
16], Sparse R-CNN [
17], and Libra R-CNN [
18]. Meanwhile, the one-stage model samples the image uniformly at all locations and transforms the detection mission into a regression classification task; examples are YOLO series [
19,
20], RetinaNet [
21], YOLOF [
22], etc. Generally, the one-stage algorithm adopts the end-to-end training mode, which is usually faster but has low accuracy. The two-stage algorithm can achieve great accuracy, but its computational overhead remains large.
To make further breakthroughs in the field of machine vision, Dosovitskiy et al. [
23] redesigned the transformer, which was proposed by Vaswani et al. [
24,
25], to encode images as sequences and proposed the first visual transformer (ViT) for image classification. The best recognition results can be achieved by applying ViT in optically natural scenes. Carson et al. [
26] introduced the transformer to object recognition and proposed the Detection Transformer (DETR). To reduce the computational consumption and the false drop rate involved in SAR complex backgrounds, Li et al. [
27] added a transformer encoder after the backbone ResNet101 [
28] and fused semantic information and location information. Srinivas et al. [
29] combined the transformer with the backbone network and achieved the best results in areas of image generation and instance segmentation. These studies have all employed hybrid structures, combining CNN-based models with transformers to achieve excellent results on computer vision tasks. Inspired by this, this paper proposes the design of a kind of transformer structure for YOLOX [
30] to achieve the high-efficiency detection of small ships in SAR images.
The accurate detection of small ships has always been a challenging research topic due to the characteristics of SAR images [
31]. When the area of the ship is small (typically less than 48
2 pixels [
32,
33]), it is only shown as a bright spot. Lacking feature information during detection, these are easily confused with other interference, resulting in missed detection and affecting the final results. In order to improve the detection accuracy of small ships, scholars have performed a lot of research in this field.
For the poor detection of small objects caused by class imbalances, data augmentation is employed to expand the data of small ships, improve the model’s attention to them, and thus enhance the contribution of small objects to the loss function calculation during training. For the partial or even full feature loss of small objects due to down-sampling, model optimization strategies such as feature fusion are often used to increase feature information. Specifically, on the basis of the traditional SSD detector [
34], Juan et al. [
35] introduced the data augmentation of rotation and expansion, added dilated convolution in the backbone, and finally improved the adaptability of the model to small objects. Chen et al. [
36] inserted feature pyramids into the Region Proposal Network to compensate for the loss of small ships’ location information at the bottom of the network. Yang et al. [
37] designed a perceptual field enhancement module to integrate different convolutions and pooling, which enhanced the transfer of feature information and ultimately reduced the false alarms of small objects. To achieve small ship detection in PoISAR images, Jin et al. [
38] replaced all normal convolutions in the network with extended convolutions when expanding the perceptual field. In the FBR-Net network proposed by Fu et al. [
39], the designed ABP structure utilizes a layer-based attention method and spatial attention method to balance the semantic information of the features in each layer, which made the network more focused on small-scale ships. To improve the detection of small ships in SAR images with complex backgrounds, Guo et al. [
40] combined feature refinement, feature fusion, and head enhancement approaches to design a highly accurate detector, called CenterNet++. Chang et al. [
41] proposed a GPU-based deep learning detection method, called YOLOv2, which offers superior detection speed and accuracy and greatly improves the efficiency of ship detection in SAR images. To further enhance the detection effect of small-scale ships, Su et al. [
42] proposed a Spatial Information Integration Network (SII-Net). In SII-Net, a Channel-Location Attention Mechanism (CLAM) block and a multi-scale pooling layer were applied to obtain richer ship position information, and interpolations and poolings were employed after the PANet to enhance the model’s attention to targets. While the network does achieve a high overall detection accuracy, it is less effective for densely distributed ship groups. Considering that contextual information is crucial for the detection of small and dense ships, Zhao et al. [
43] proposed a novel CNN-based method. In this method, as many small ship proposals as possible are first made and then combined with contextual information to exclude spurious ships from the predictions.
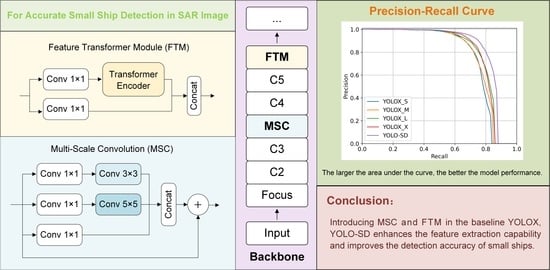
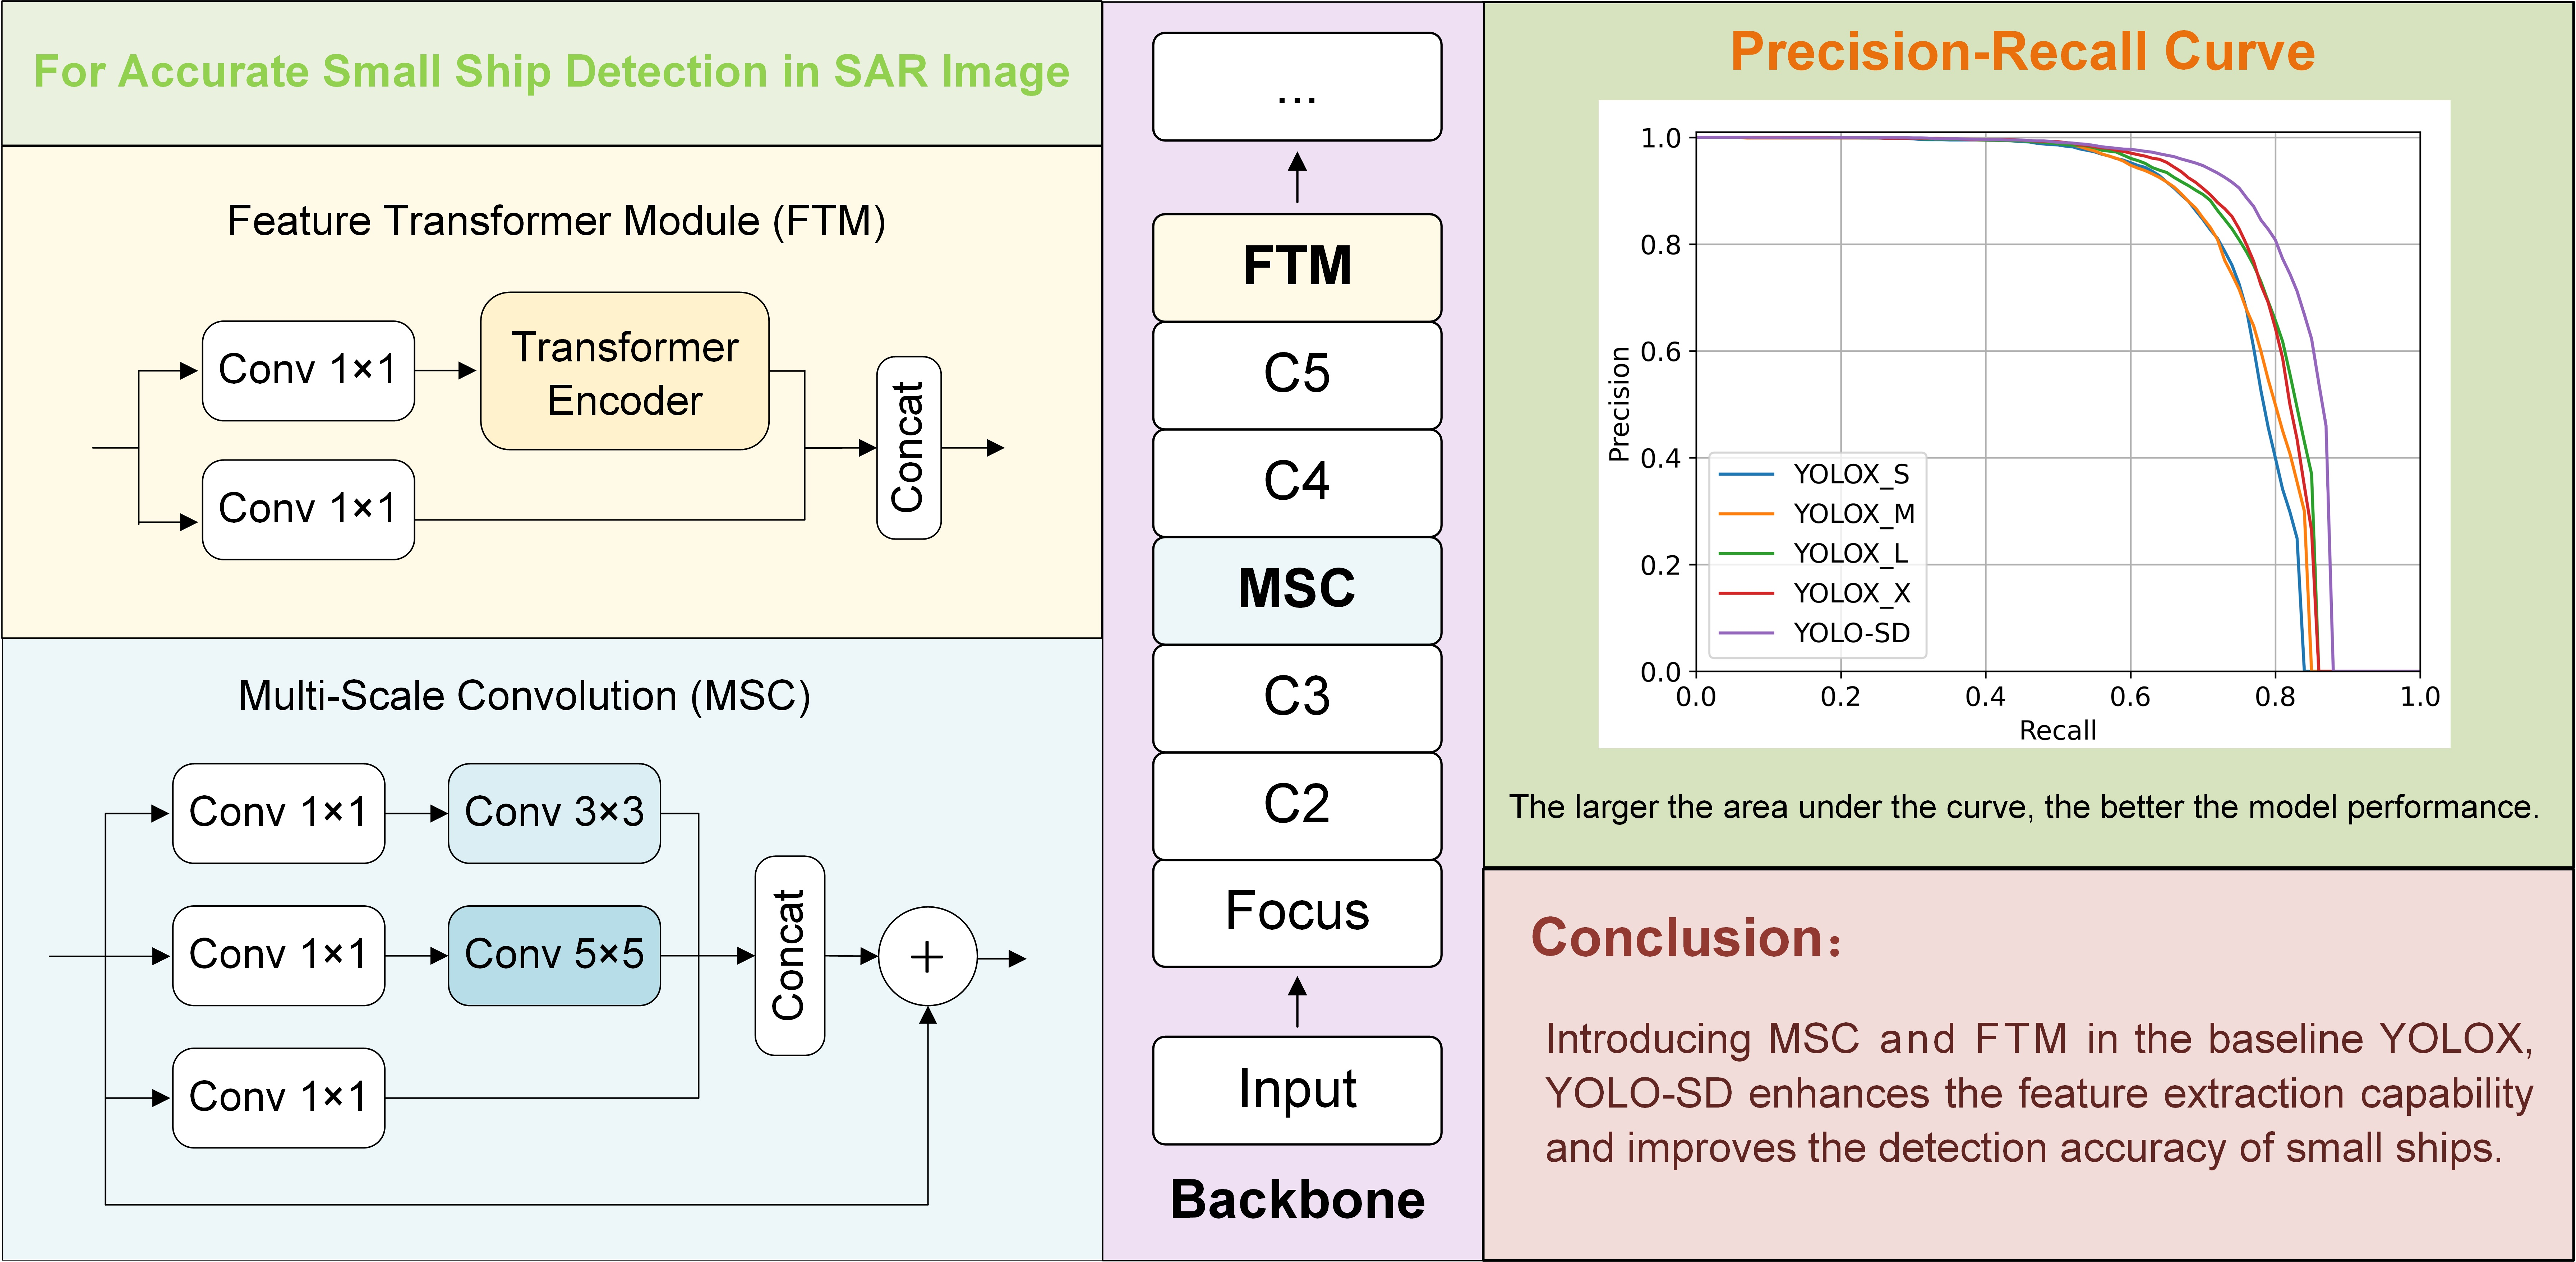
Based on the above analysis, this paper uses the latest YOLOX algorithm as the baseline, focuses on enhancing the feature extraction capability, captures richer contextual information, and ultimately strengthens the detection ability of ships in high-resolution SAR image datasets, especially small ships. Our contributions can be summarized as follows:
To improve the sensitivity of minor object detection, we designed an MSC block. It combines several parallel convolutions with the residual network, which can obtain feature information of different sizes and perform multi-scale fusion, further enhancing the representation of semantic information;
In addition, we proposed the FTM block. It divides the high-layer feature information into two parts, processes them using the transformer encoder, and finally merges them via a cross-stage structure. With this FTM module, our model can capture global features effectively and achieve higher detection accuracy;
Taking YOLOX as the baseline, we incorporated MSC and FTM, and proposed an efficient detection model YOLO-SD for ship detection in high-resolution SAR images;
YOLO-SD was tested on the HRSID [
32] and LS-SSDD-v1.0 datasets [
33]. According to the experimental results, our detection accuracy was improved dramatically compared with YOLOX, which indicates the effectiveness of our model. Besides this, we compared our design with some existing excellent networks when applied to the same dataset, and the results showed that ours still excels in overall performance.
2. Material and Methods
Firstly, our method is derived by analyzing the shortcomings of the existing method, YOLOX. Next, each key point is described in detail, including the specific architecture and working principles, and the overall structure of YOLO-SD is shown. Last, we introduce the environment’s setup, the datasets used, and the evaluation metrics.
2.1. Proposed Method Based on YOLOX
In the detection network, the bottom feature map has high resolution and rich detailed features, which makes it suitable for small ship detection. In the higher feature map, the image resolution seems low, but its semantic information becomes rich, which is appropriate for detecting large-scale ships [
44].
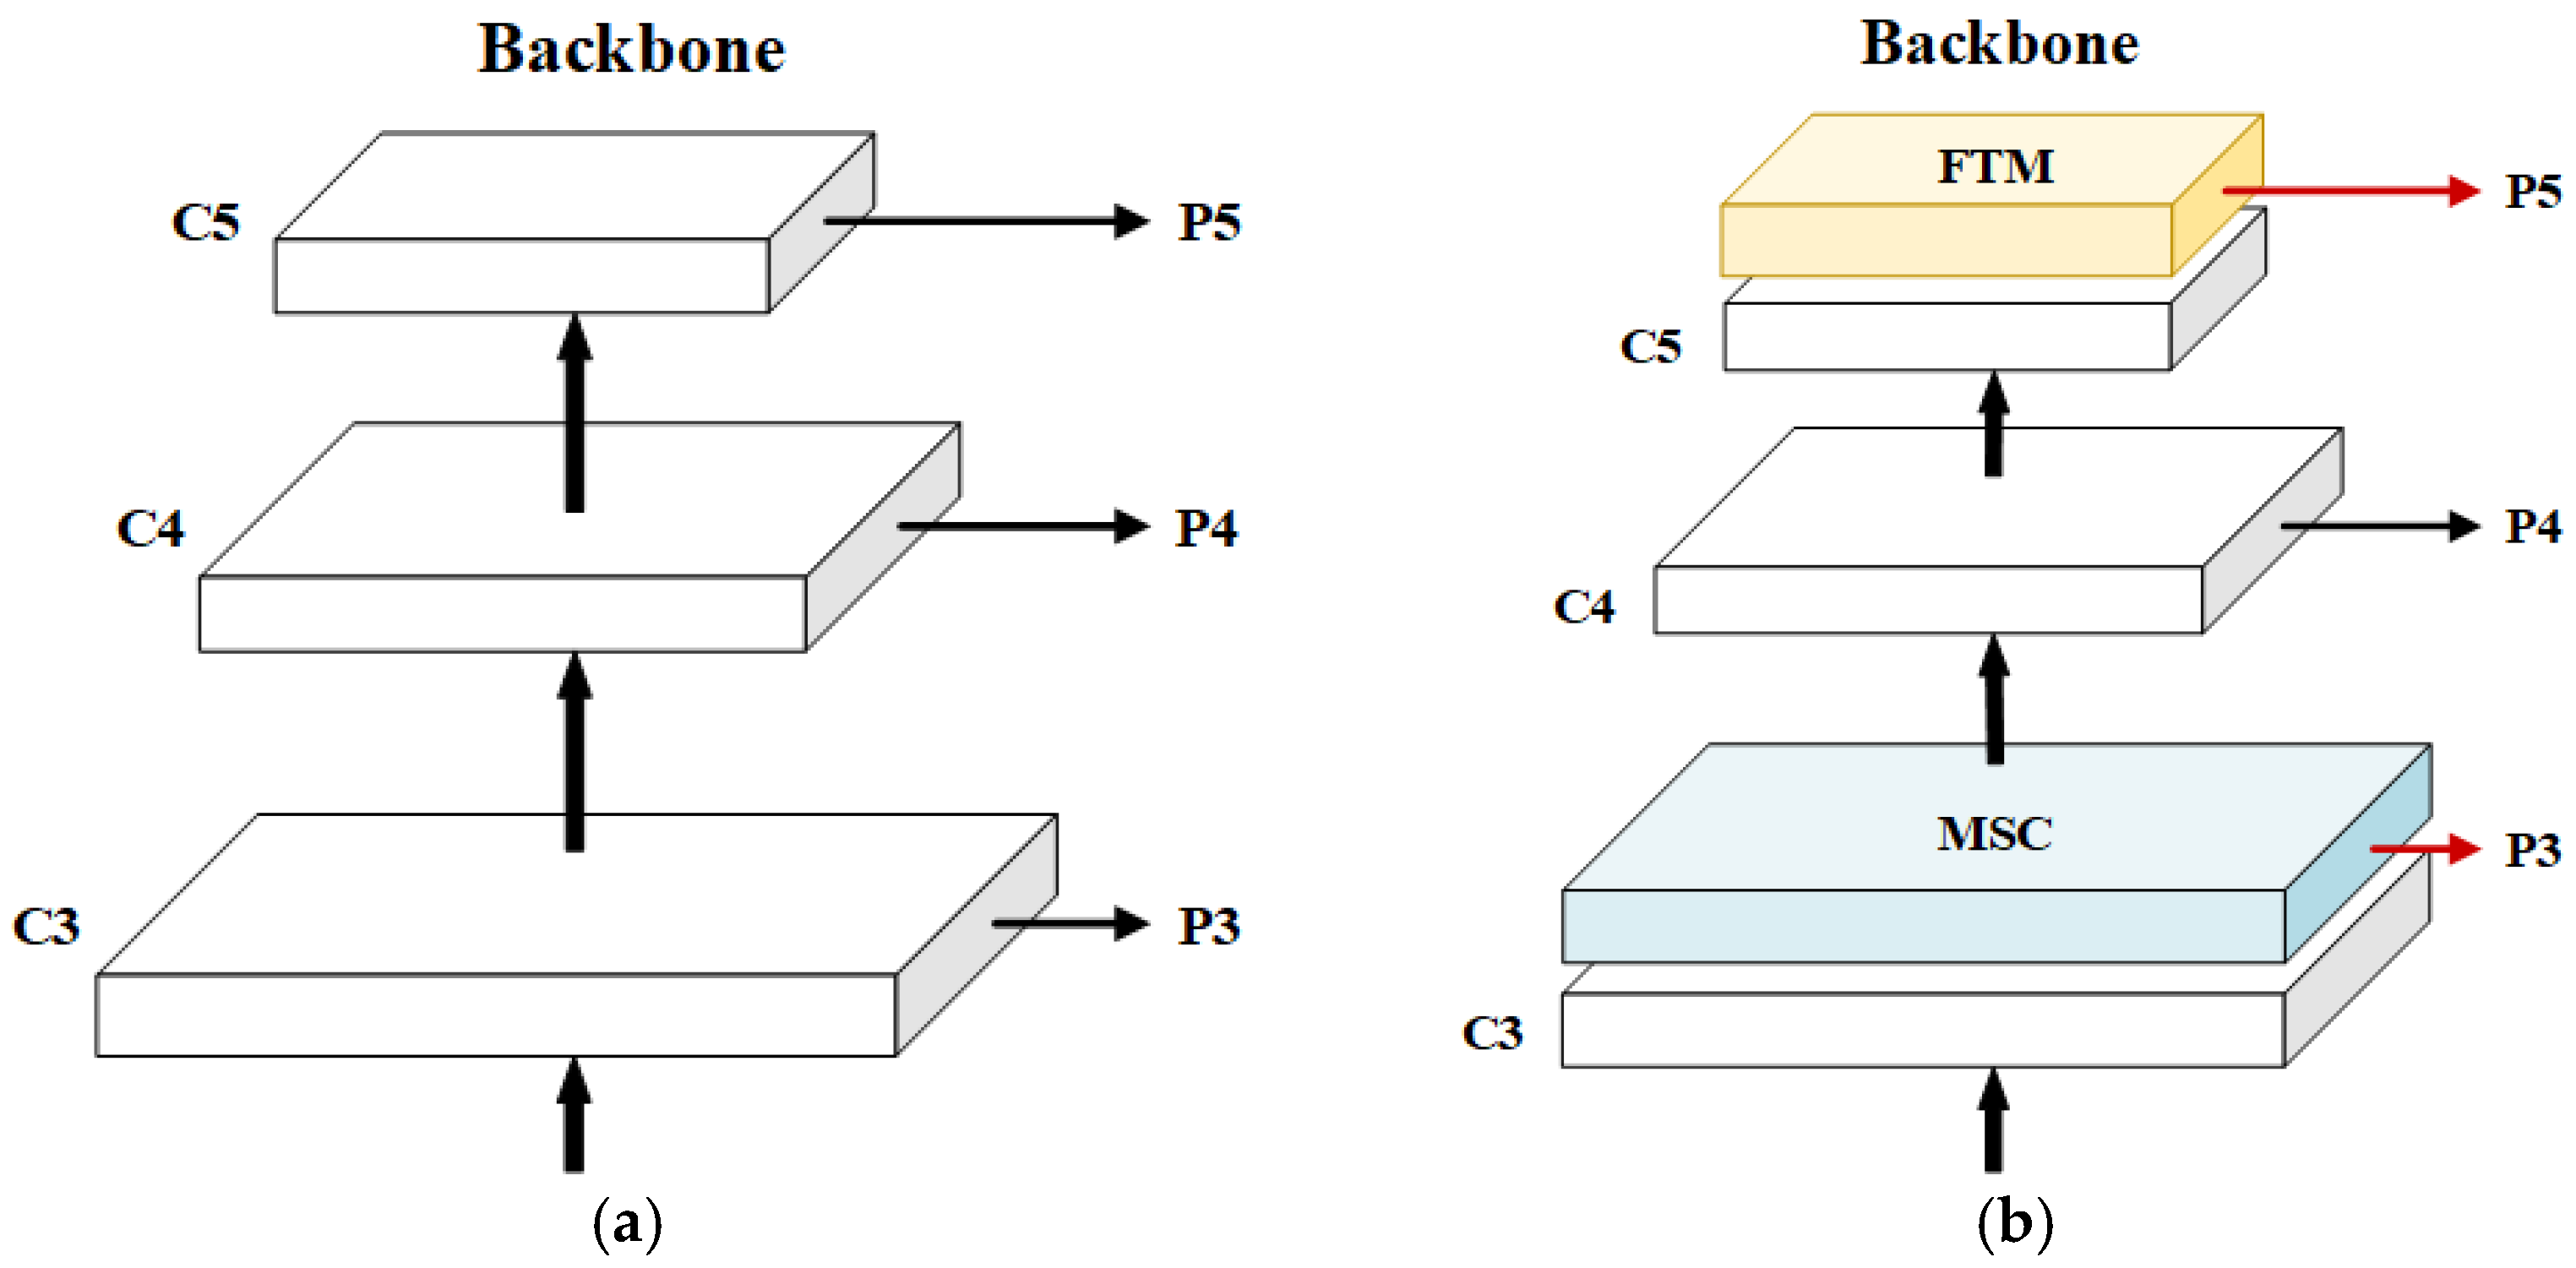
Figure 2a shows the partial structure of YOLOX. YOLOX applies CSPDarkNet53 as the backbone and mainly uses C3, C4, and C5 for feature fusion and classification, but its actual detection of small ships is poor. Firstly, the C3 layer is located in the shallower region of the network, with rich detailed information and high resolution. YOLOX mainly utilizes it for feature extraction to achieve small ship detection. However, due to the small reception field of the C3 layer, the semantic information [
45] obtained is weak. Thus, YOLOX will consider some real ships (especially small ships) as background, resulting in poor final detection. Next, the C5 layer has low resolution and is highly abstract, so lots of small ships have lost some or all of their detailed features, at which point it is no longer meaningful to process the C5 layer for small ship detection.
To solve these problems of YOLOX and improve the accuracy of small ship detection in SAR images, we have used YOLOX_L as our baseline to design a new detection model for small ships, called YOLO-SD. The partial structure of YOLO-SD is shown in
Figure 2b. The MSC and FTM in the backbone CSPDarkNet53 are our designs, while the red lines indicate the new connection between the backbone and the neck. Firstly, several parallel multi-scale convolutions were inserted after the C3 layer. These convolutions help the network to obtain feature information from different reception fields and enhance semantic information. Secondly, after layer C5, in which most of the detailed features were lost, we added a newly designed FTM block, mainly consisting of a multi-headed attention layer and a fully connected layer, to optimize the feature information. Lastly, to improve the effect of feature fusion, we modified the connection between the backbone and the neck. In
Figure 2b, P3, P4, and P5 are connected with MSC, C4, and FTM. In this method, we apply the newly improved feature maps to enhance the network’s attention to small ships, which in turn improves the network’s detection performance. The experiments demonstrate that YOLO-SD increases the computational overhead to a lesser extent than baseline YOLOX, but improves the accuracy significantly.
2.2. Specific Architecture of YOLO-SD
In order to optimize model performance, we considered deepening the backbone network as well as expanding its width. However, stacking structures directly not only increase the computational cost significantly, but also make the network prone to scattering [
46]. Therefore, we applied the basic structure of CSPDarkNet53 [
47] and improved on it by introducing the following design.
We propose the MSC module to improve the effect, as shown in the following Formulas (1) and (2):
where
x is the input feature map and
y is the output feature map. In Formula (2),
ci (
i = 0, 1, 2) represents the i-th convolution branch, and
i (
i = 1, 3, 5) represents the convolution with kernel size
i ×
i.
Wij (
j = 0, 1) means the weight parameters of convolution, and the lower corner indicates the
j-th convolution of the
i-th branch.
The diagram of the MSC feature enhancement structure is shown in
Figure 3. MSC is mainly a parallel filter structure, which connects the outputs of convolutions with different kernel sizes into a single output. These parallel convolutions are performed at different scales and can extract features from different receptive fields at the same time, which has two benefits. On the one hand, it improves the feature extraction effect for ships. On the other hand, deeper features can enhance the semantic information of the feature map and improve the model’s ability to detect small ships. These parallel convolution operations occupy a lot of computer resources, so we add 1 × 1 convolution before processing to alleviate the problem. The 1 × 1 convolution can both further increase the network depth and reduce the dimension (changing the number of channels to 0.5, 0.25, and 0.25 times the number of input channels), as well as reduce the computational consumption. However, network widening and deepening induces training difficulties and gradient disappearance problems while improving performance. For this reason, we introduce the ResNet structure, which directly connects the input of MSC with the output of the concatenation operation. Through this design, we process and aggregate the information while limiting the amount of computation, deepen the network while enhancing the expressive ability, and improve the sensitivity of the model to small ships.
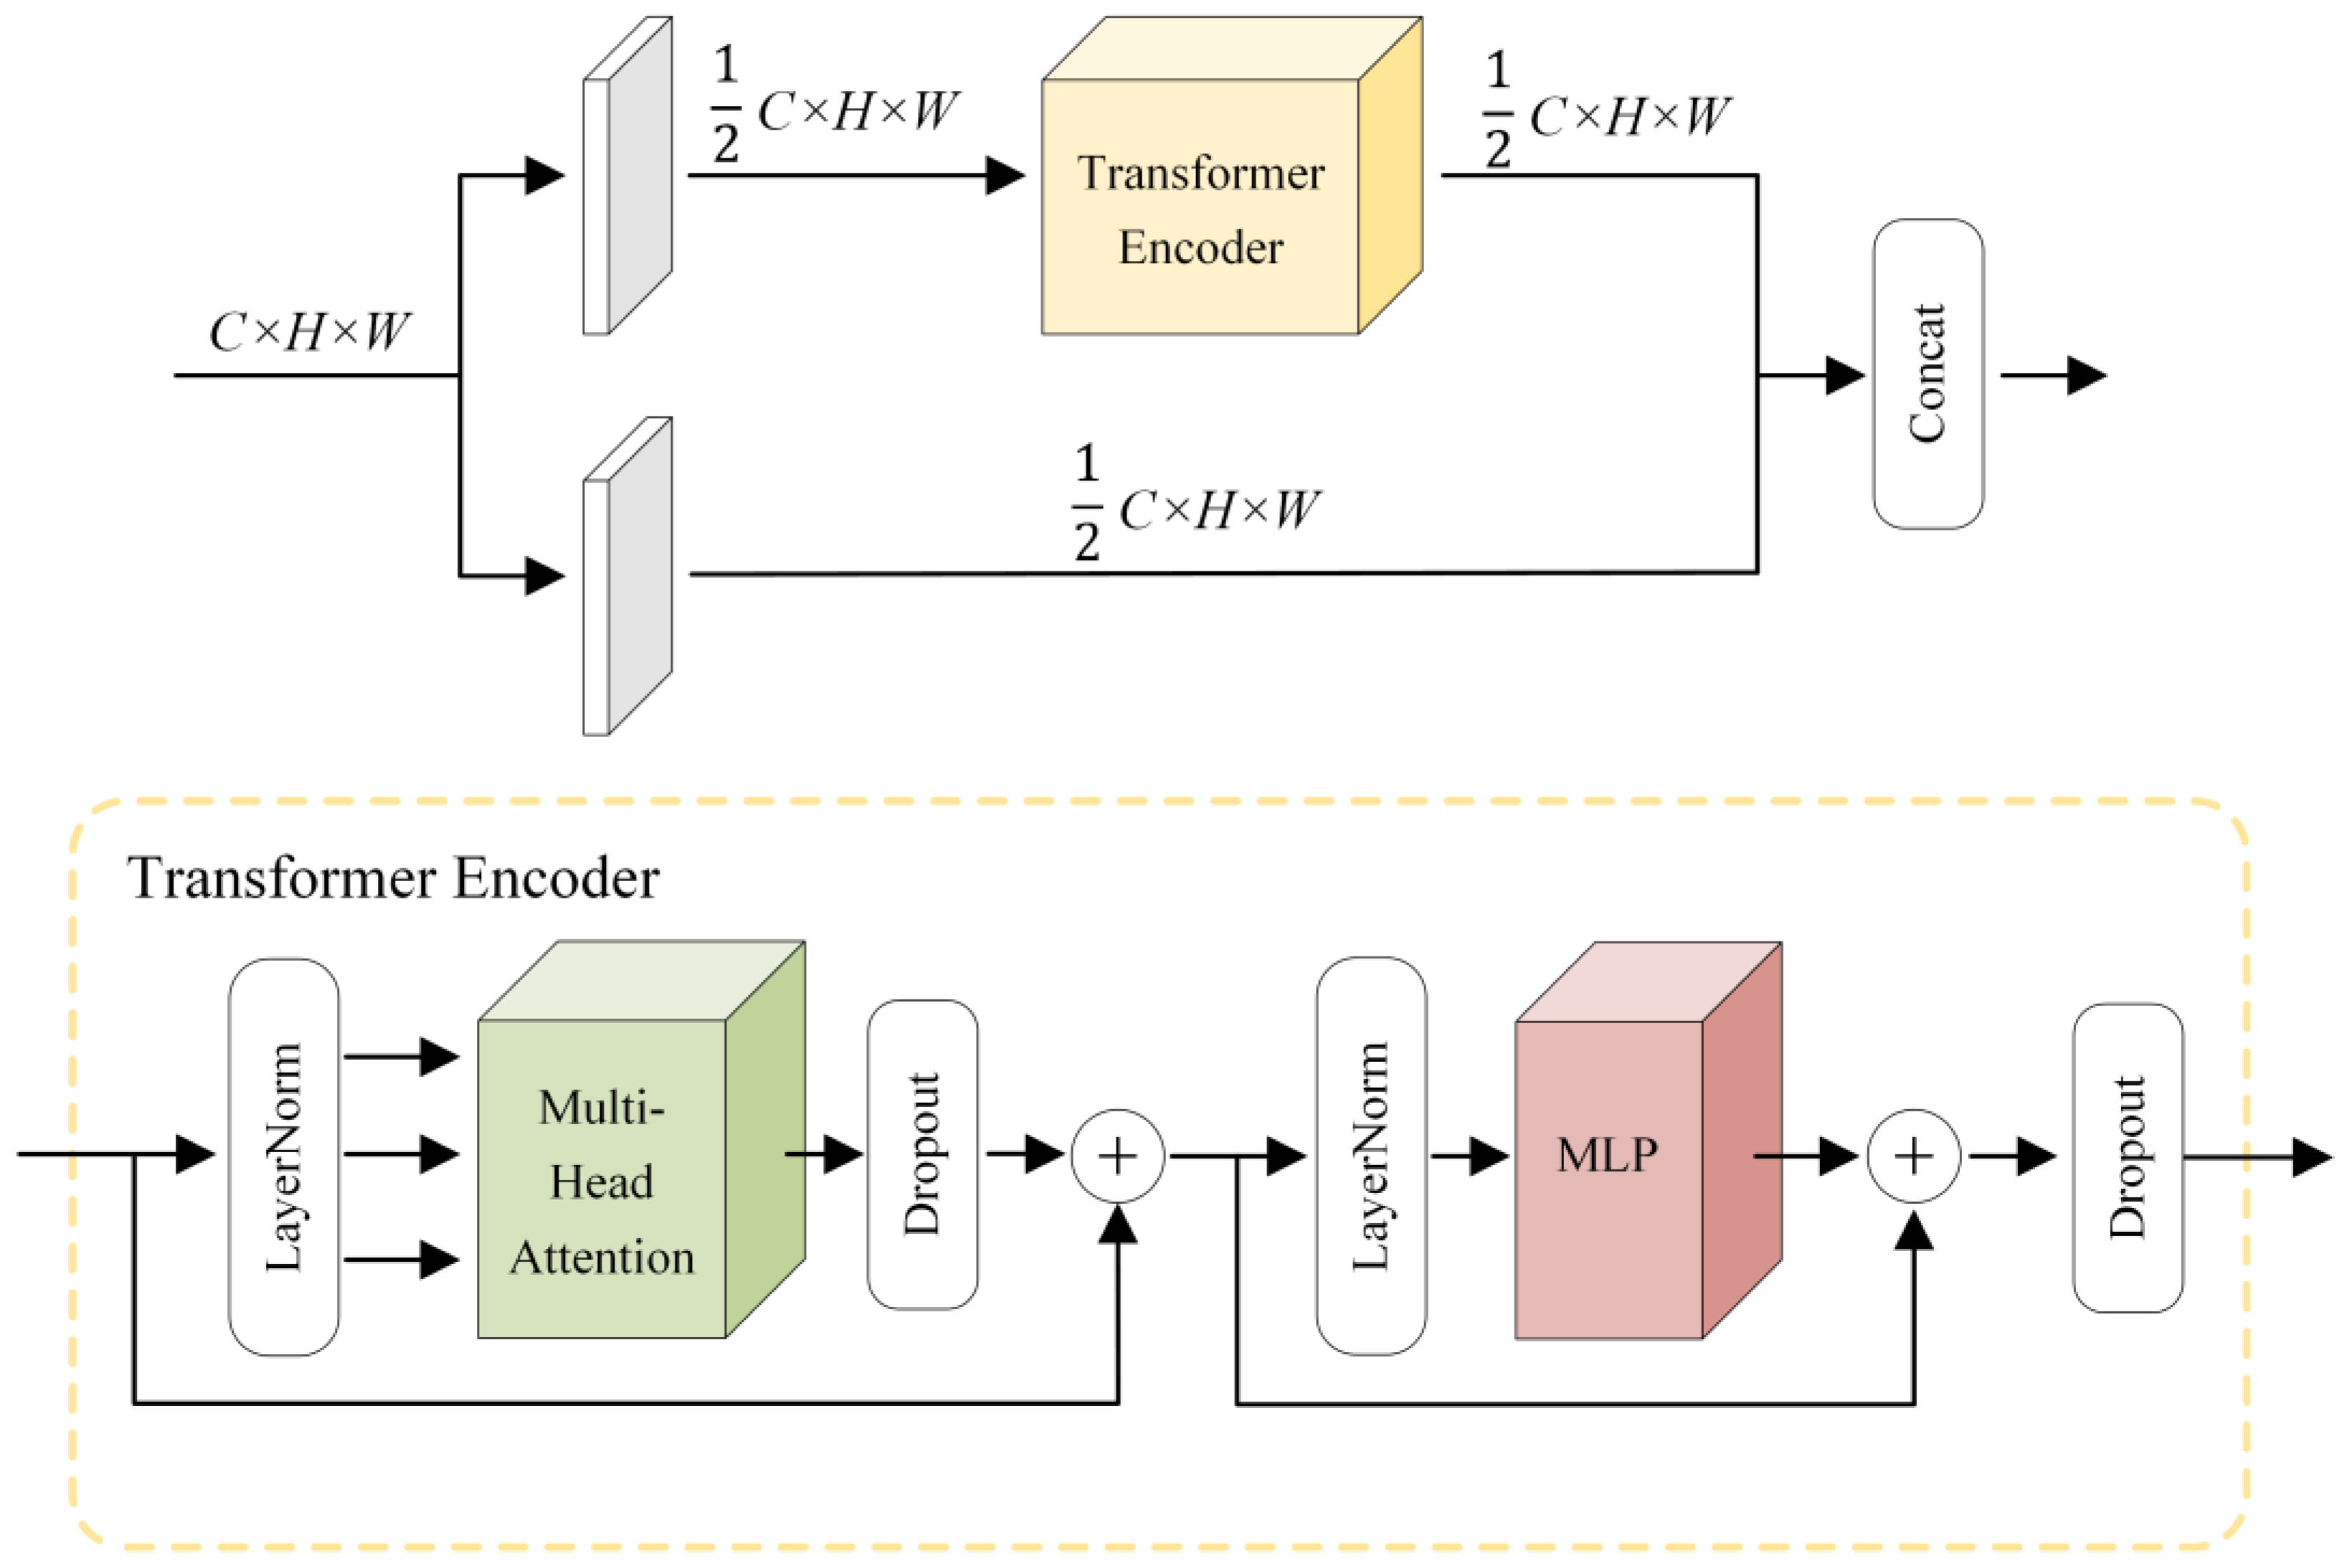
During detection, the model mainly relies on the backbone network to extract local feature information from SAR images. However, the large down-sampling factors involved in extraction may mean the model misses small-scale ships. In addition, the model is unable to capture sufficient global information due to the small actual receptive field of the convolutional neural network. To improve the capability of small ship detection in SAR images and minimize the leakage of small targets, we propose a Feature Transformer Module (FTM) that can capture rich global and contextual information, as shown in
Figure 4.
The core of the FTM is a transformer encoder, consisting of a Multi-Headed Attention (MHA) block and a Multi-Layer Perception (MLP) block overlay. As the input to the encoder is a sequence with certain orders, we partition feature maps into sequences of specific length and width patches before the encoder. Inside the encoder, MHA enables the network to obtain the location information of surrounding ships by acquiring the relationships between ships under a global receptive field. Due to the higher learning capability of the nonlinear transform, it consists of two fully connected layers with a large number of intermediate hidden units to form an MLP block, which analyzes contextual information and enhances the characterization of ship features. In addition, a residual structure is added to keep the FTM well trained even when the layers are deepened. Layer normalization is employed to normalize the feature sequence so that the ReLu activation function can play a better role afterward. To cope with the structural gradient disappearance problem, the FTM transforms the input features by two 1 × 1 convolutions, one retaining the original features and the other using the transformer encoder. Compared to dividing the channels directly, such a division allows all the input features to be transformed, improves the reusability of features effectively, and keeps the overall computing effort lower. Using the FTM at the top layer of the backbone network before inputting to the neck, through continuous learning, contextual information is linked to enhance the correlation between ships, and thus reduce the omission of small-scale ships and improve the network’s detection ability.
2.3. Overall Structure of YOLO-SD
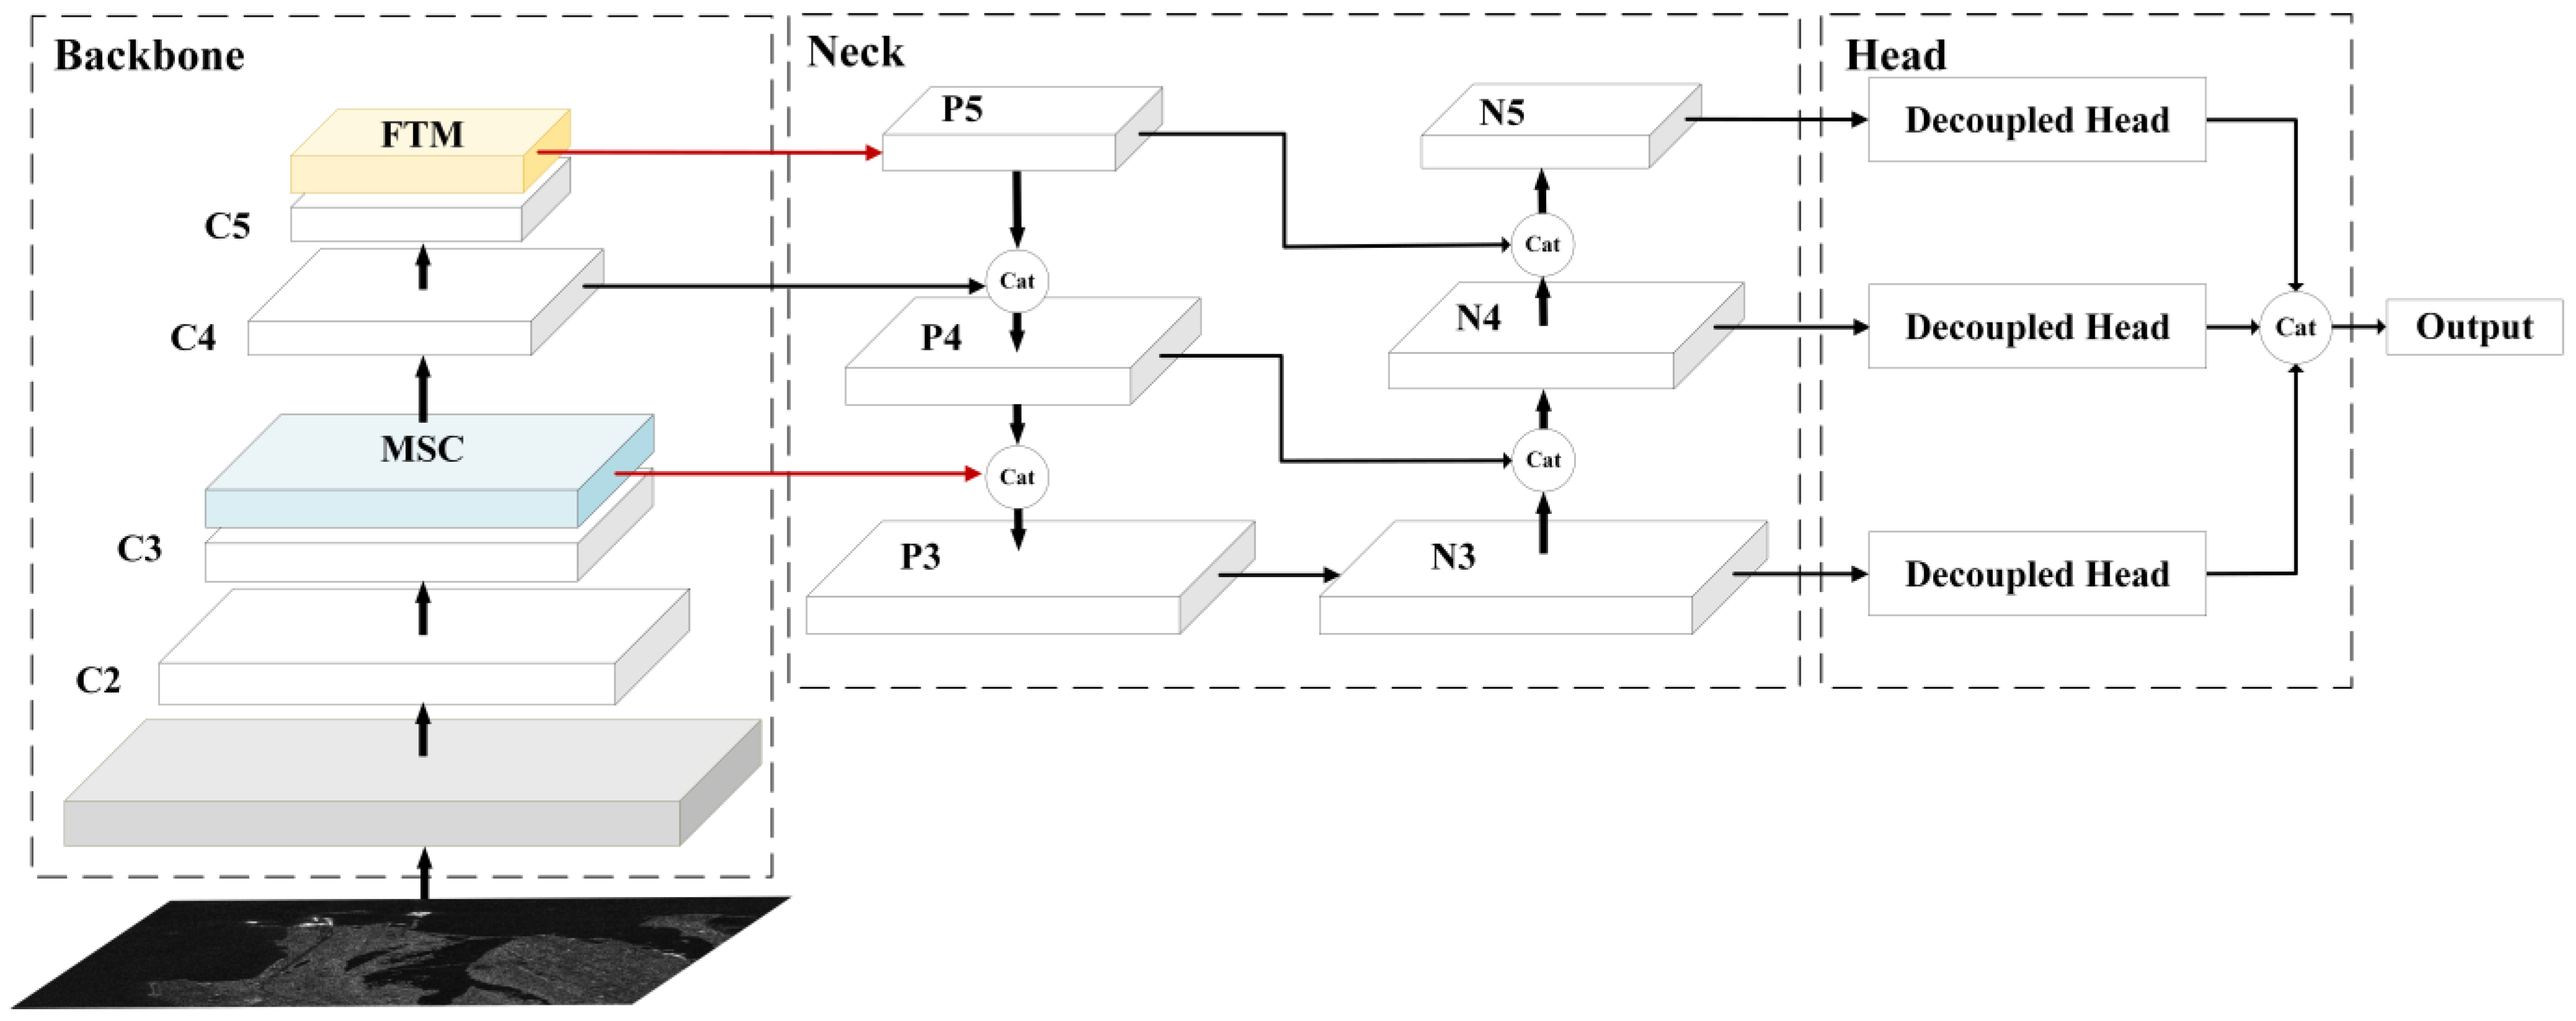
The overall framework of YOLO-SD is shown in
Figure 5. After the SAR images are input into our model, feature extraction is first implemented by the backbone network, a modified CSPDarknet. The MSC and FTM of the design are introduced to it, which means that the final feature map contains more valid small-scale ship features. In the neck network, the first fusion was performed from top to bottom to obtain P3, P4, and P5. To retain the shallow edge, shape, and other features, a bottom-up path enhancement structure was added later and achieved the second fusion to obtain N3, N4, and N5 feature maps. Finally, decoupling heads separate the classification and regression tasks to obtain more accurate detection results for small ships in SAR images.
2.4. Dataset
In order to test the practical effect of YOLO-SD, we employed the high-resolution SAR image dataset (HRSID) and LS-SSDD-v1.0 dataset. The specific information of these two datasets is shown in
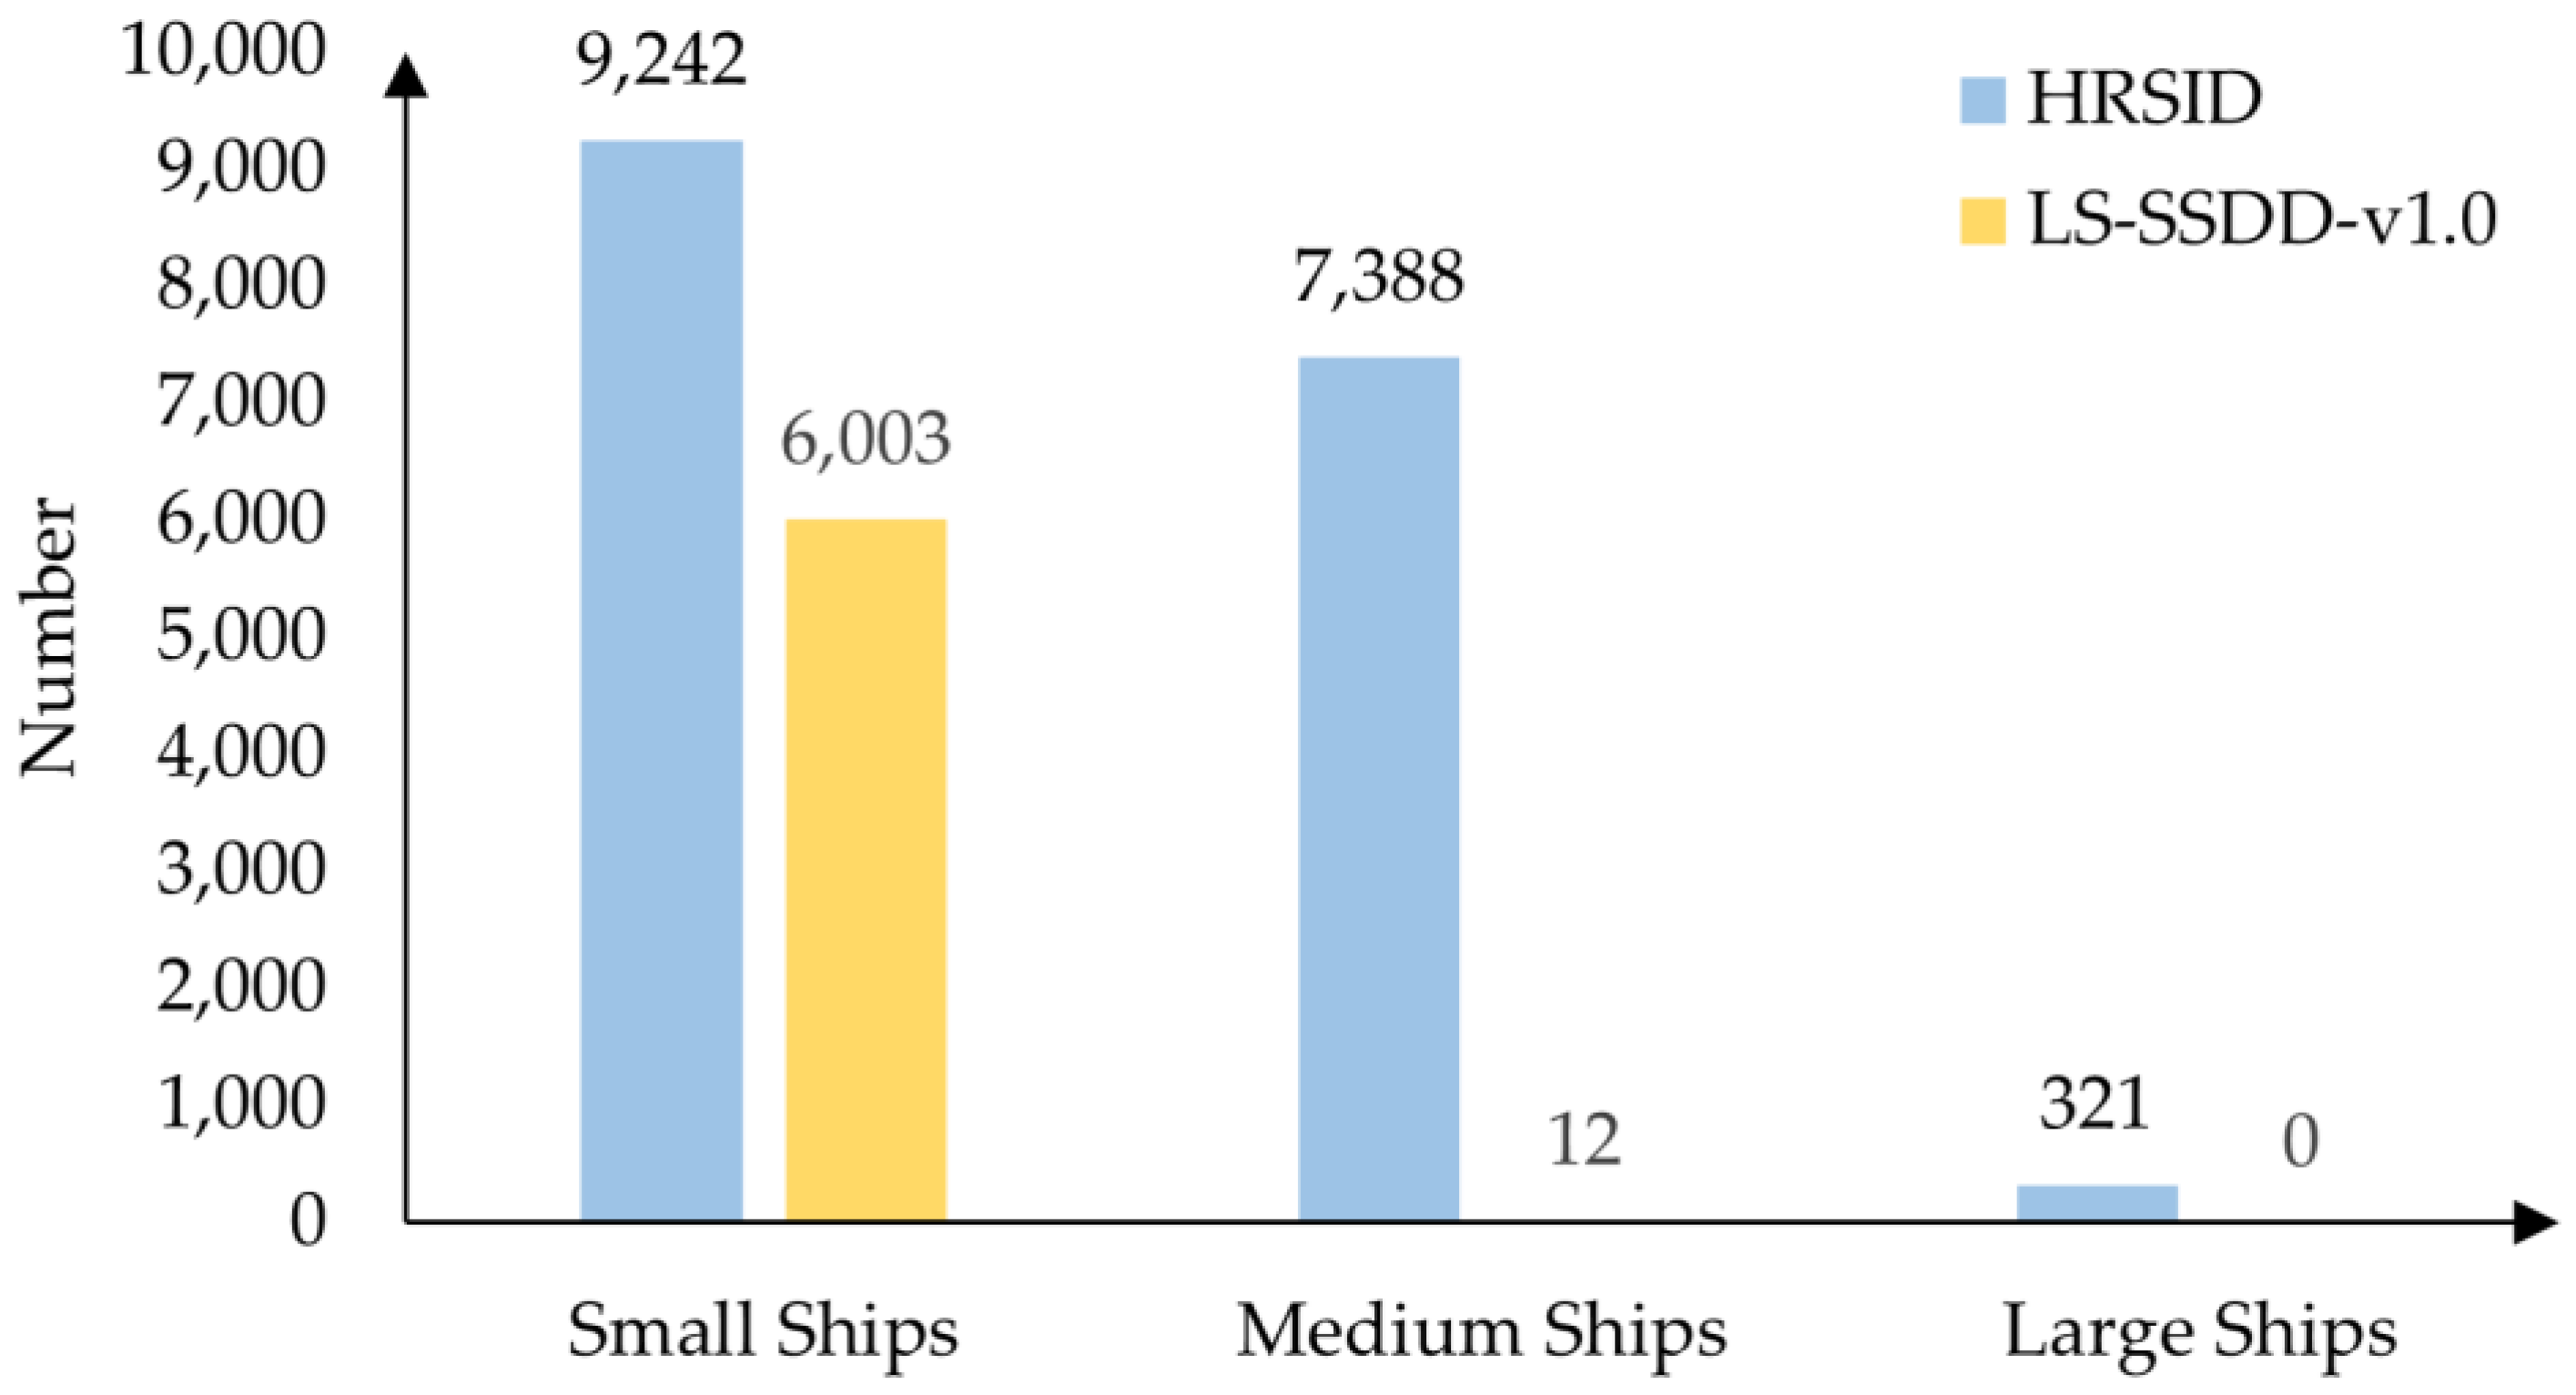
Table 1. The HRSID, including a total of 16,951 ship targets, cuts 136 panoramic SAR images into 5604 images with 800 × 800 pixels. In the LS-SSDD-v1.0 dataset, 15 images with 24,000 × 16,000 pixels are cut into 9000 sub-images, also with 800 × 800 pixels. The LS-SSDD-v1.0 dataset retains the pure background image, so the detection model can learn pure background features more effectively and reduce false alarms. The SAR images in two datasets were collected from Sentinel-1 and TerraSAR-X satellites with mixed HH, HV, VV and VH polarizations. With the help of Google Earth and the Automatic Identification System (AIS), all the ships in a SAR image can be completely labeled. When experimenting, the ratio of dataset division (training dataset:validation set:test set) was set to 13:7:7 and 2:1:1, respectively.
Figure 6 shows the comparison of the number of ships of three sizes in the two datasets. When the datasets processed the ship targets, they were divided into three types according to the area size: small ships (area less than 48
2 pixels), medium ships (area between 48
2 and 145
2 pixels), and large ships (area greater than 145
2 pixels). According to
Figure 6, the typical size of small ships in the two datasets is 48
2 pixels.
2.5. Evaluation Metrics
For the accurate evaluation of the detection performance of each model, the indexes, including the MS COCO evaluation indexes [
48], FPS, Parameters, and so on, were used in this work.
Intersection Over Union (
IoU) is an important and standard index to measure the accuracy of object detection in the dataset. Its calculation is defined as follows, where
A represents a real object box in the dataset, and
B represents the corresponding prediction box obtained by detection models:
Recall refers to the proportion of correctly predicted samples in all real objects, while
Precision means the proportion of correctly predicted samples in the objects targeted predicted by the model. Their calculation methods are shown in Formulas (2) and (3), where
TP refers to True Positive and
FN refers to False Negative.
The widely employed Mean Average Precision (mAP) is the average of the accuracy of all categories. Since there is only one type in the HRSID and LS-SSDD-v1.0 (ship), the result obtained by calculating
AP is the mAP. The derivation formula of AP is shown in Formula (6), where
R represents Recall and
P represents
Precision. Generally speaking, the higher the
AP corresponding to the model, the better the detection performance of this model. Since
AP is obtained by integrating
P(
R) with
R, the
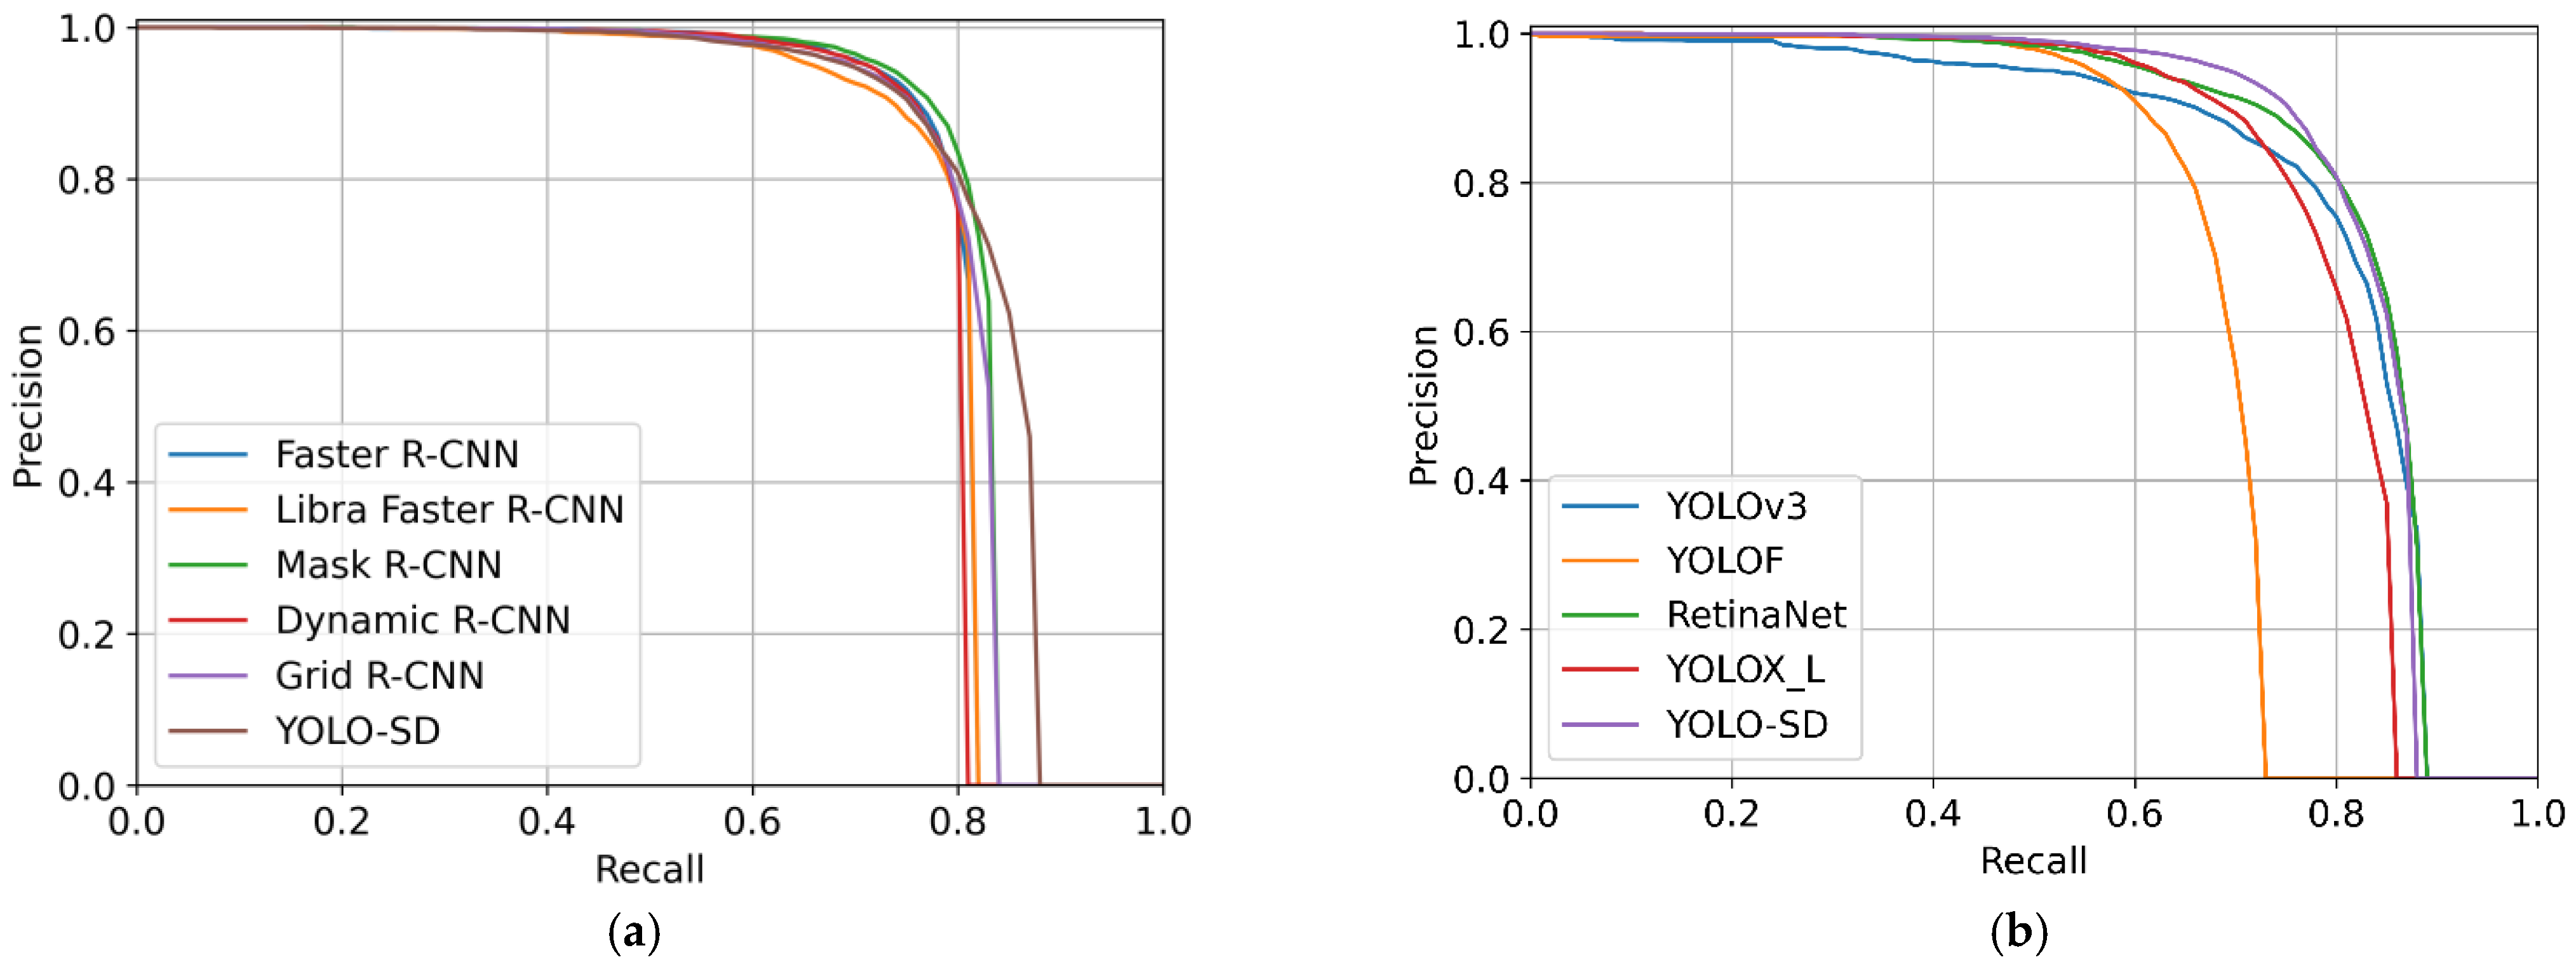
Precision-
Recall curve can display the overall performance of algorithms.
This work used MS COCO evaluation indexes to reliably compare the experimental results between different detection models. According to different IoU thresholds and various object characteristics, indexes can be divided into six different types, including AP, AP50, AP75, APS, APM, and APL. Once the mentioned IoU threshold is set to 0.5 and 0.75, the results obtained by Formula (6) are AP50 and AP75. If IoU gradually increases between 0.5 and 0.95 (by 0.05), the average of the ten values obtained is AP. When only objects of a specific size are calculated, such as small (the area of the detection object is less than 322 pixels), medium (322 < area < 962 pixels), and large (the area is greater than 962 pixels) objects, the averages obtained are APS, APM, and APL.
In addition to these indicators, we also introduced some other indexes, such as Frame Per Second (
FPS) to evaluate detection speed and Parameters to describe model complexity.
FPS represents the number of images that can be processed per second. The time required to detect each image can be obtained by taking the inverse of the
FPS, as shown in the following Formula (7). In the CNN network, the parameter can describe the complexity of the model, and its calculation formula is shown in Formula (8). In Formula (8),
Kh and
Kw represent the size of the convolution kernel,
Cin means the number of channels of the input feature map, and
Cout means the number of channels of the output feature map. Therefore, the parameter of a convolutional layer can be obtained by Formula (8), and the parameter of the entire model can be obtained by adding the parameters of all layers.
4. Discussion
As can be seen from the ablation experiments described in
Table 3, both MSC and the FTM contribute to the improved accuracy of ship detection. The FTM increases the AP metric by 3.2%, which is 2% higher than MSC’s 1.2%. The introduction of MSC improved the representation of feature maps in the backbone network, while also optimizing the fusion effect of the neck. With a large global field of perception, the FTM focuses on the feature information of the ship, while enhancing the correlation between ships, ultimately reducing the number of missed small objects. With a large global receptive field, the FTM focuses on the feature information of the ship while enhancing the correlation between ships, ultimately reducing the number of missed small objects. Due to the small area of ships in SAR images, feature loss becomes severe as the network deepens. Therefore, the FTM, which focuses on optimizing the depth of the network, can obtain higher detection accuracy. The two act at different network locations and there is no conflict between them, so YOLO-SD can achieve an accuracy improvement of up to 3.8%.
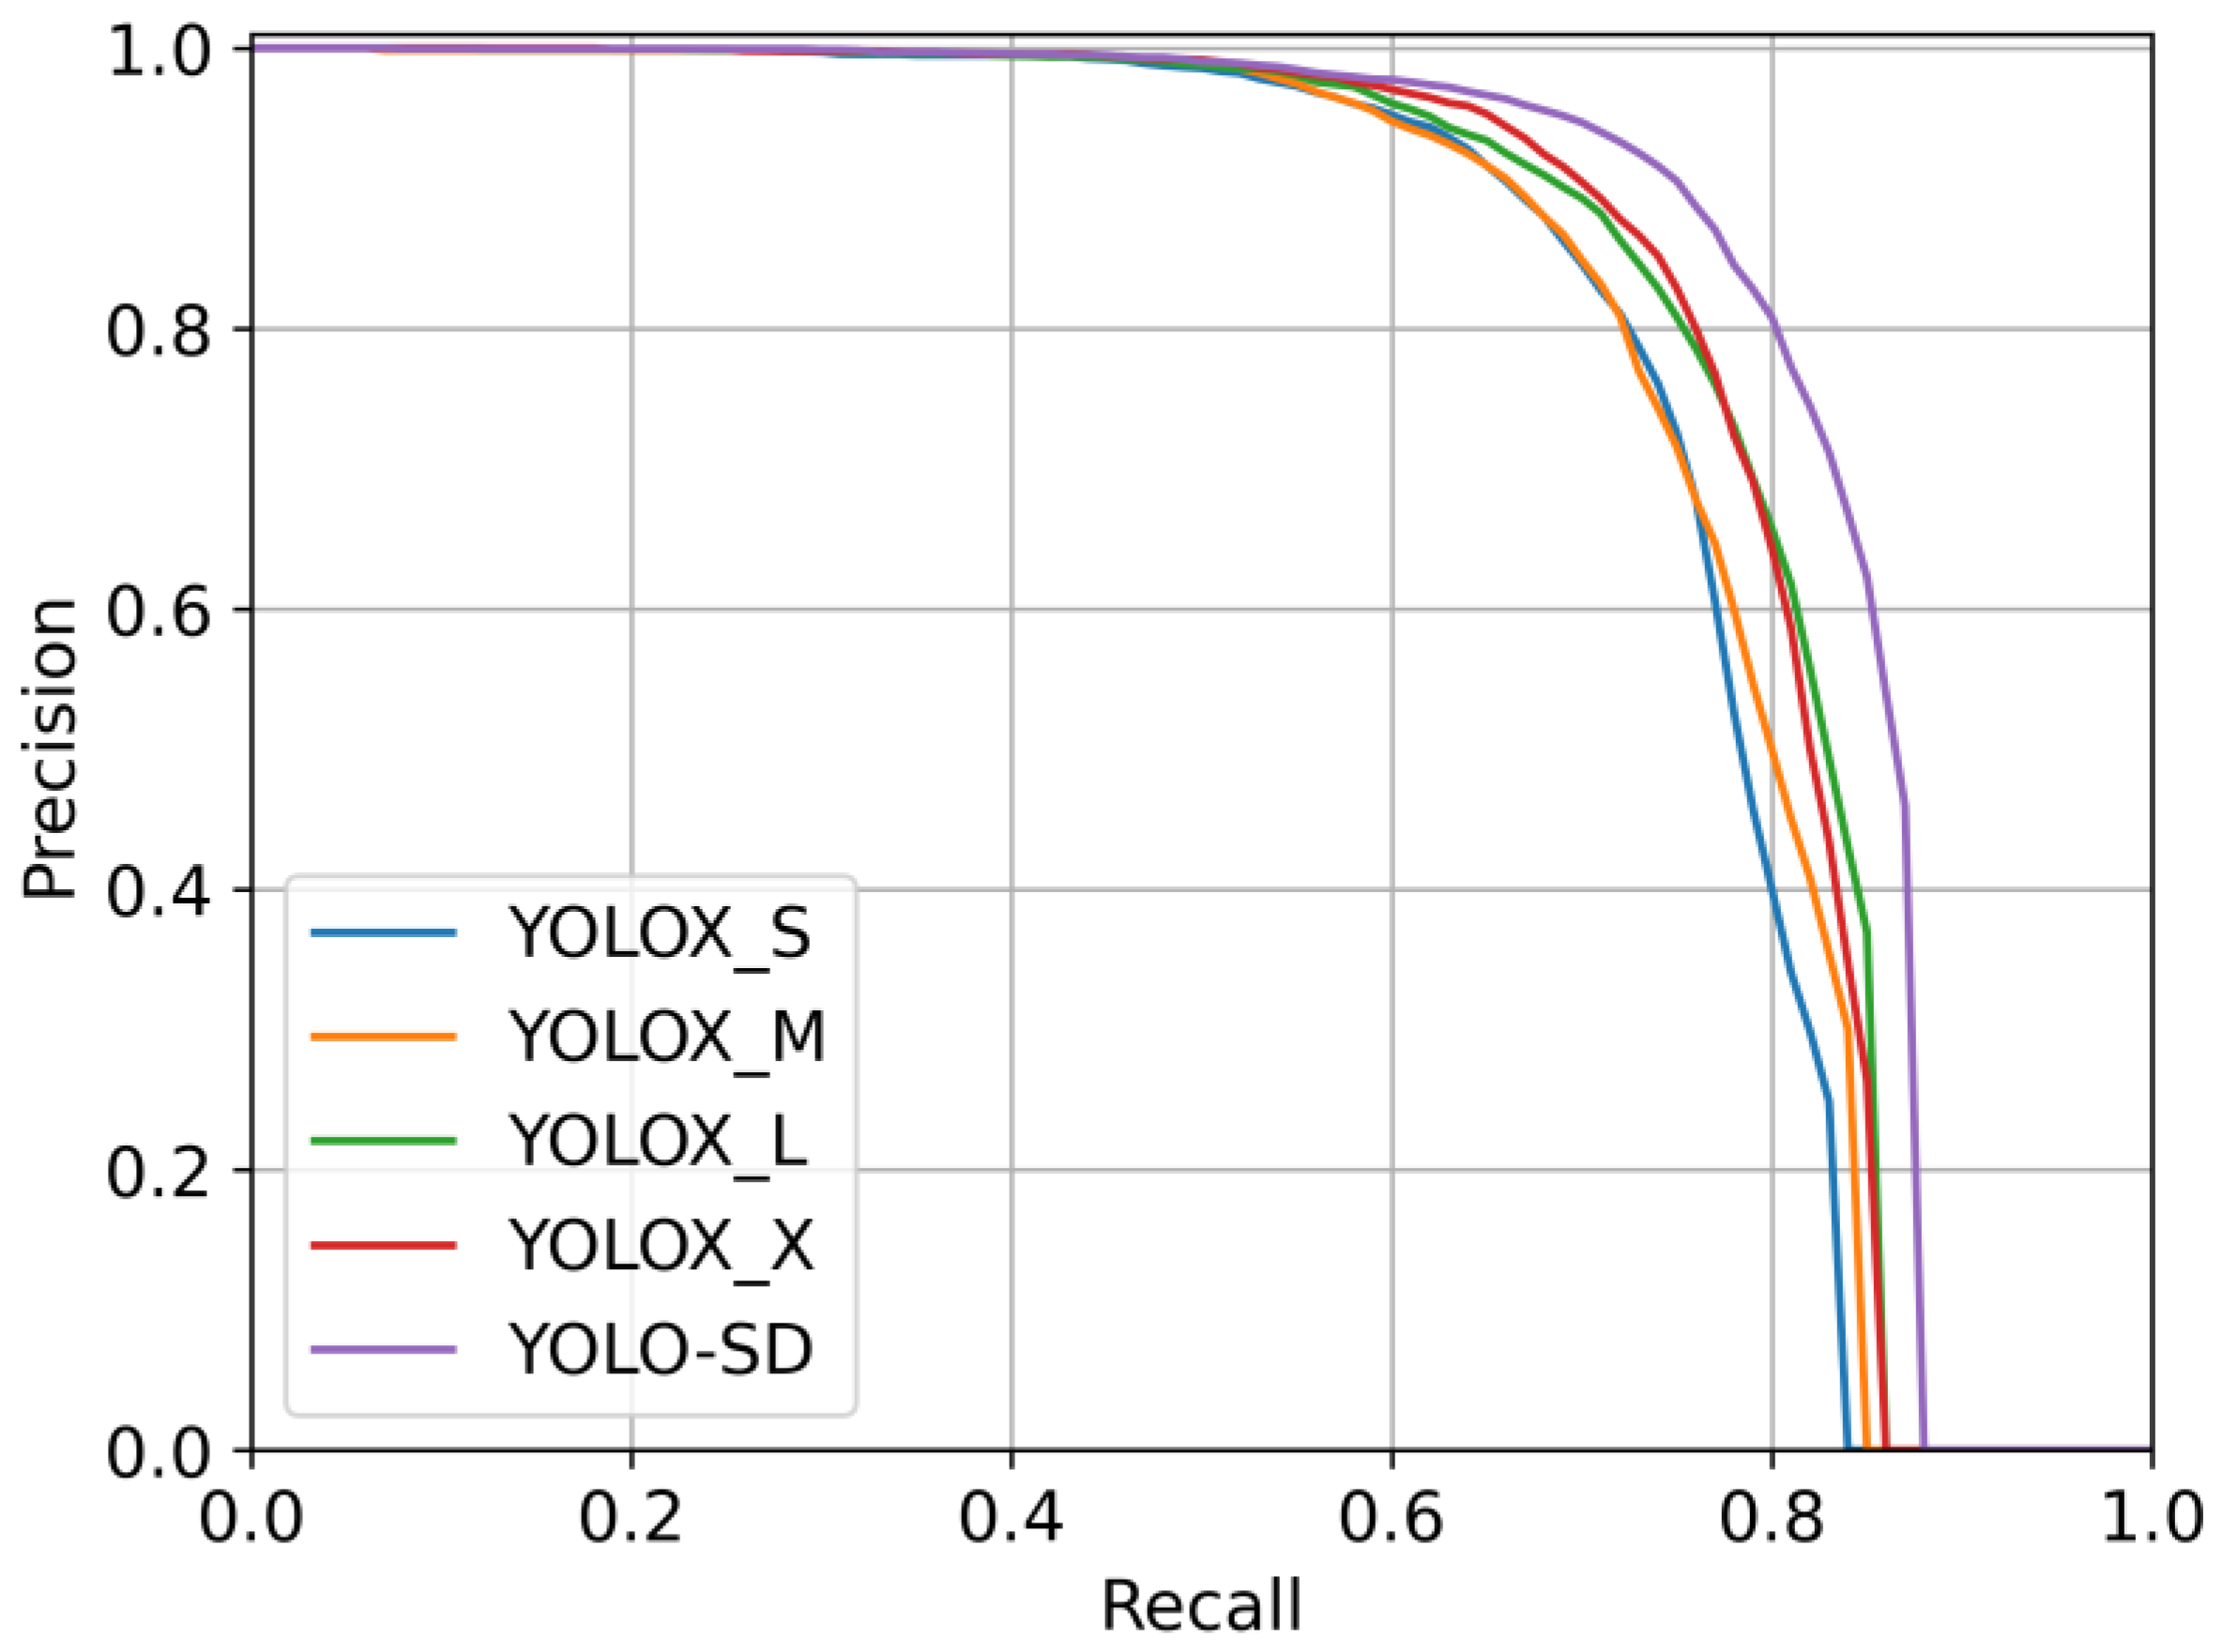
For YOLOX, different complexities have different advantages. YOLOX_S has the smallest number of parameters and the fastest calculation speed, while YOLOX_X has the highest detection accuracy. By comparing the PR curves, we objectively and equitably arrive at the best ground scale for YOLOX-L, and use it as the baseline for improvement. As the size of the input image was altered (from 800 to 640 and 512), the detection accuracy of all models decreased by varying degrees. In fact, when the SAR image was reduced, the ship object area became smaller and contained less feature information, making detection more difficult. Whereas MSC enables the model to detect targets from indistinguishable complex backgrounds by exploiting the rich semantic information, the FTM improves the correlation between all ships and enables the model to detect a larger number of ship objects. As a result, compared to the baseline, YOLO-SD is more capable of detecting ships and consistently obtains the highest AP.
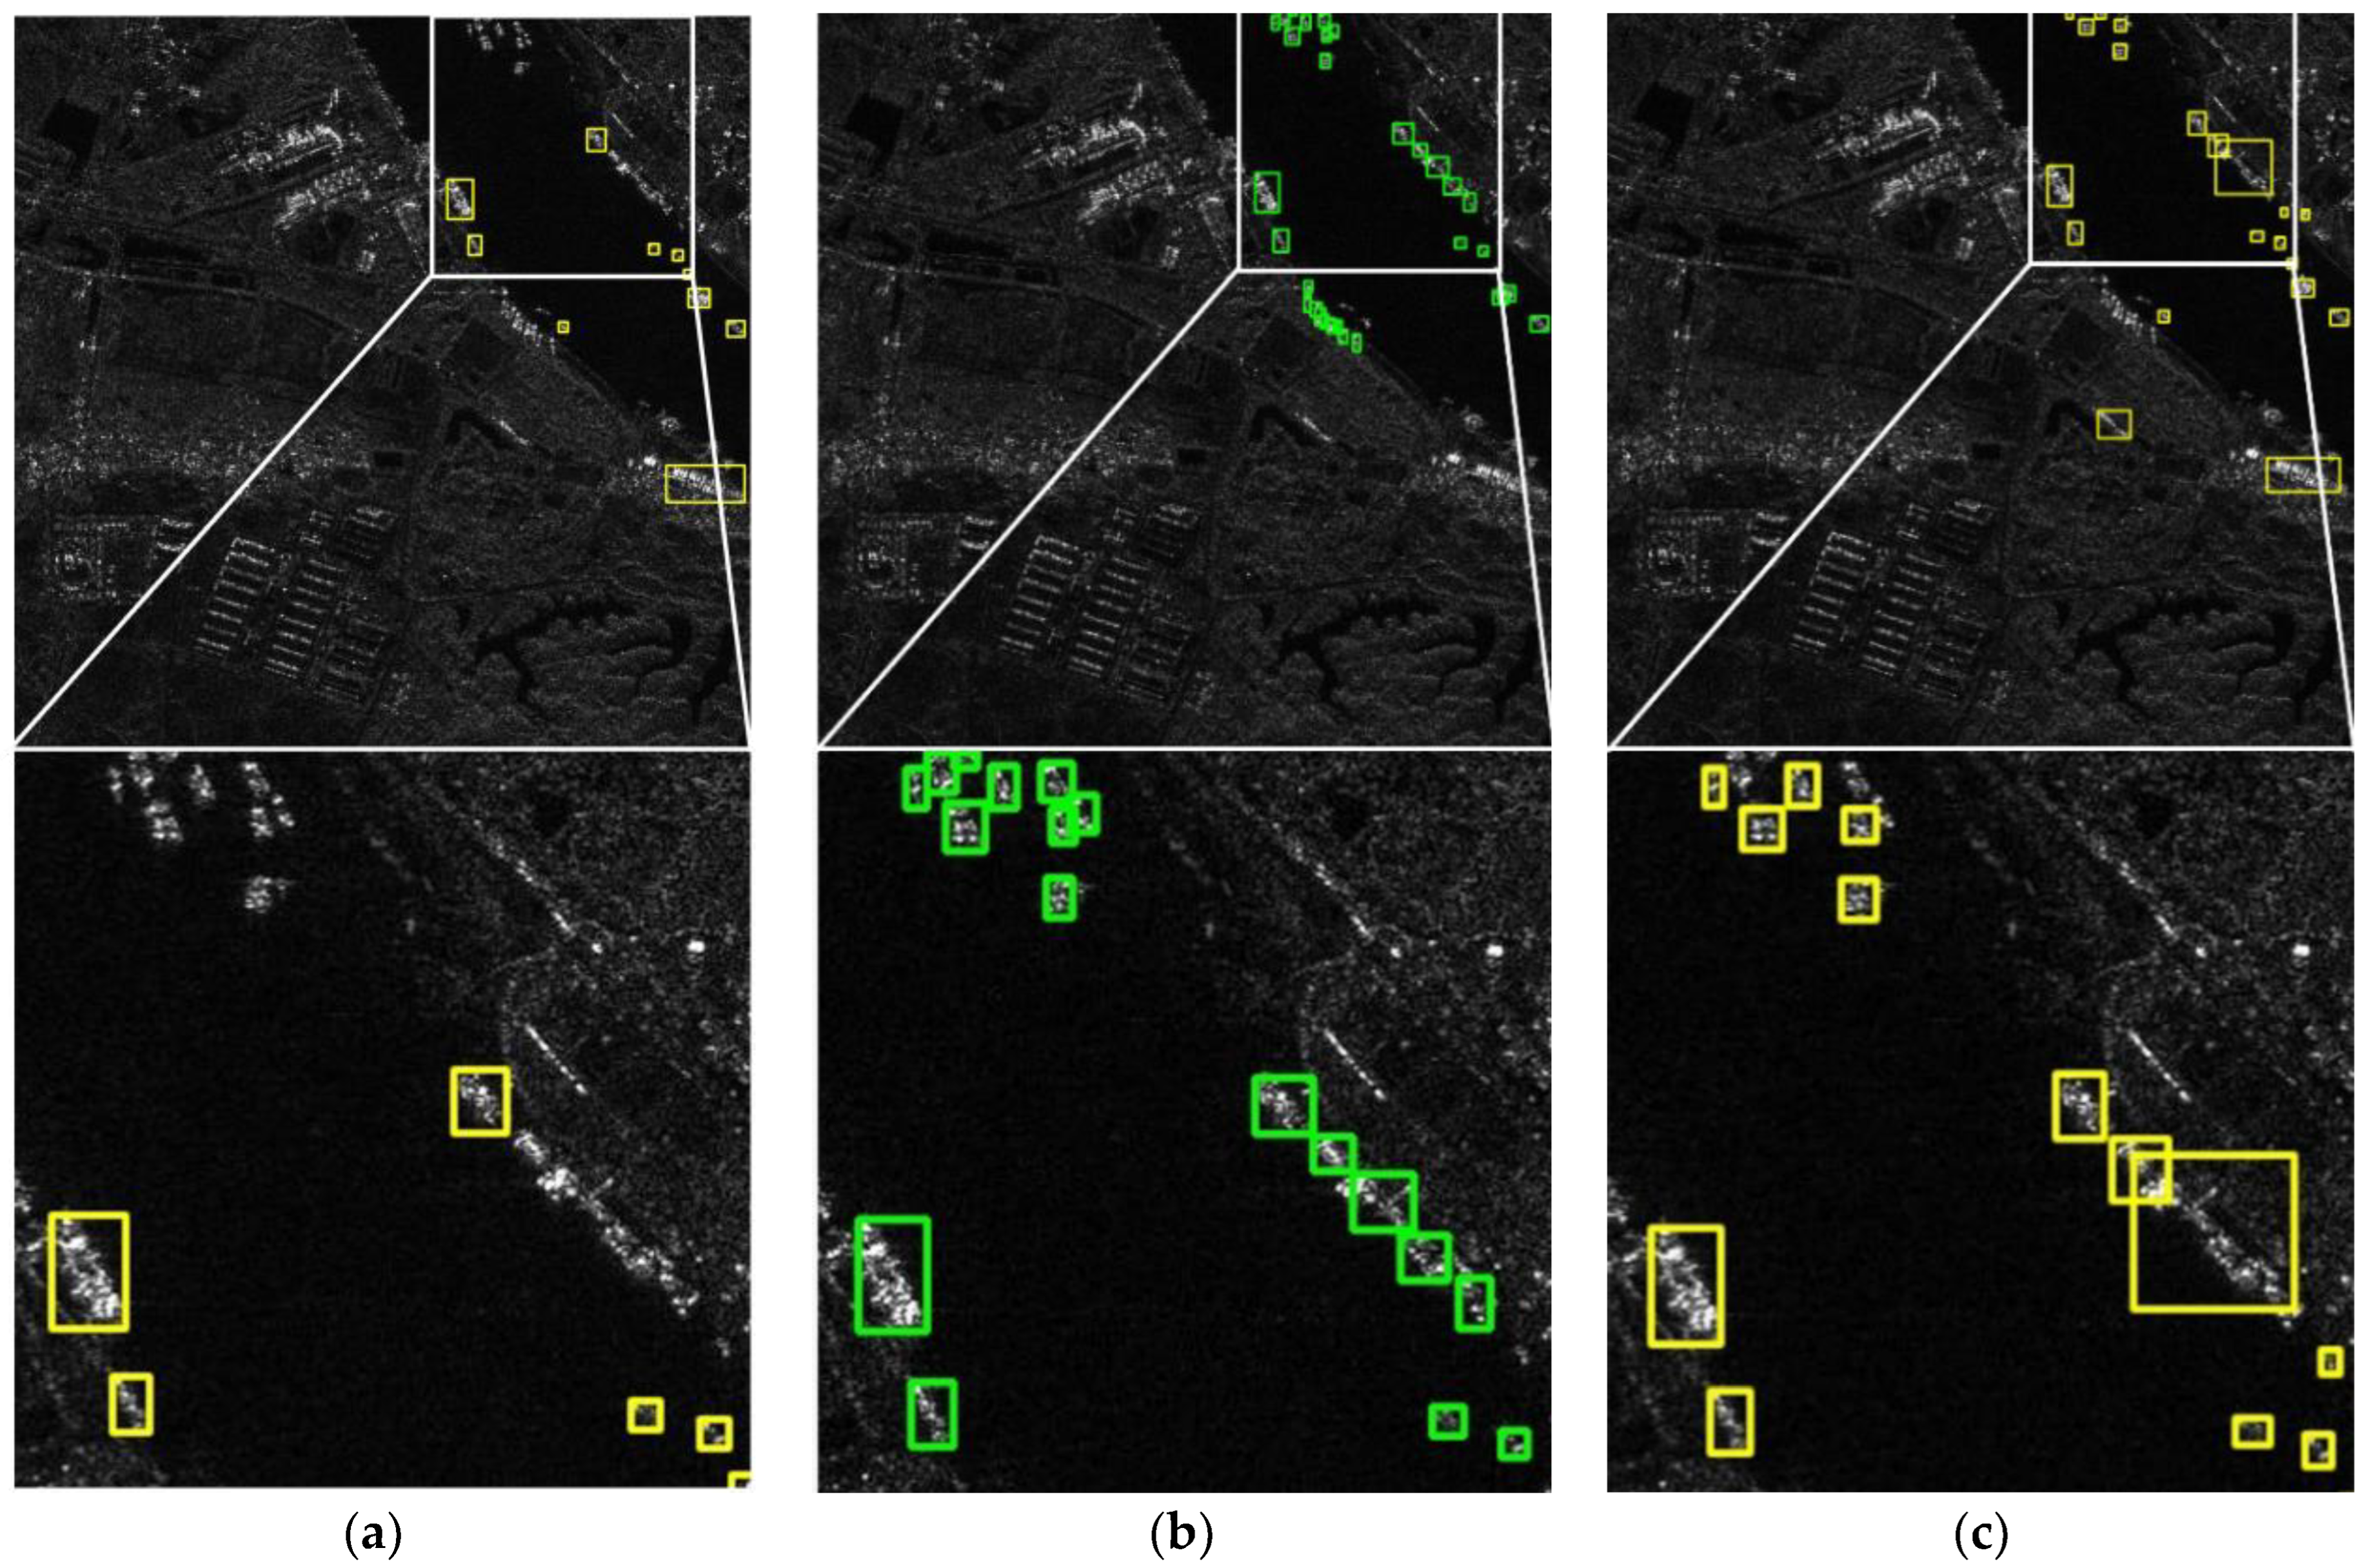
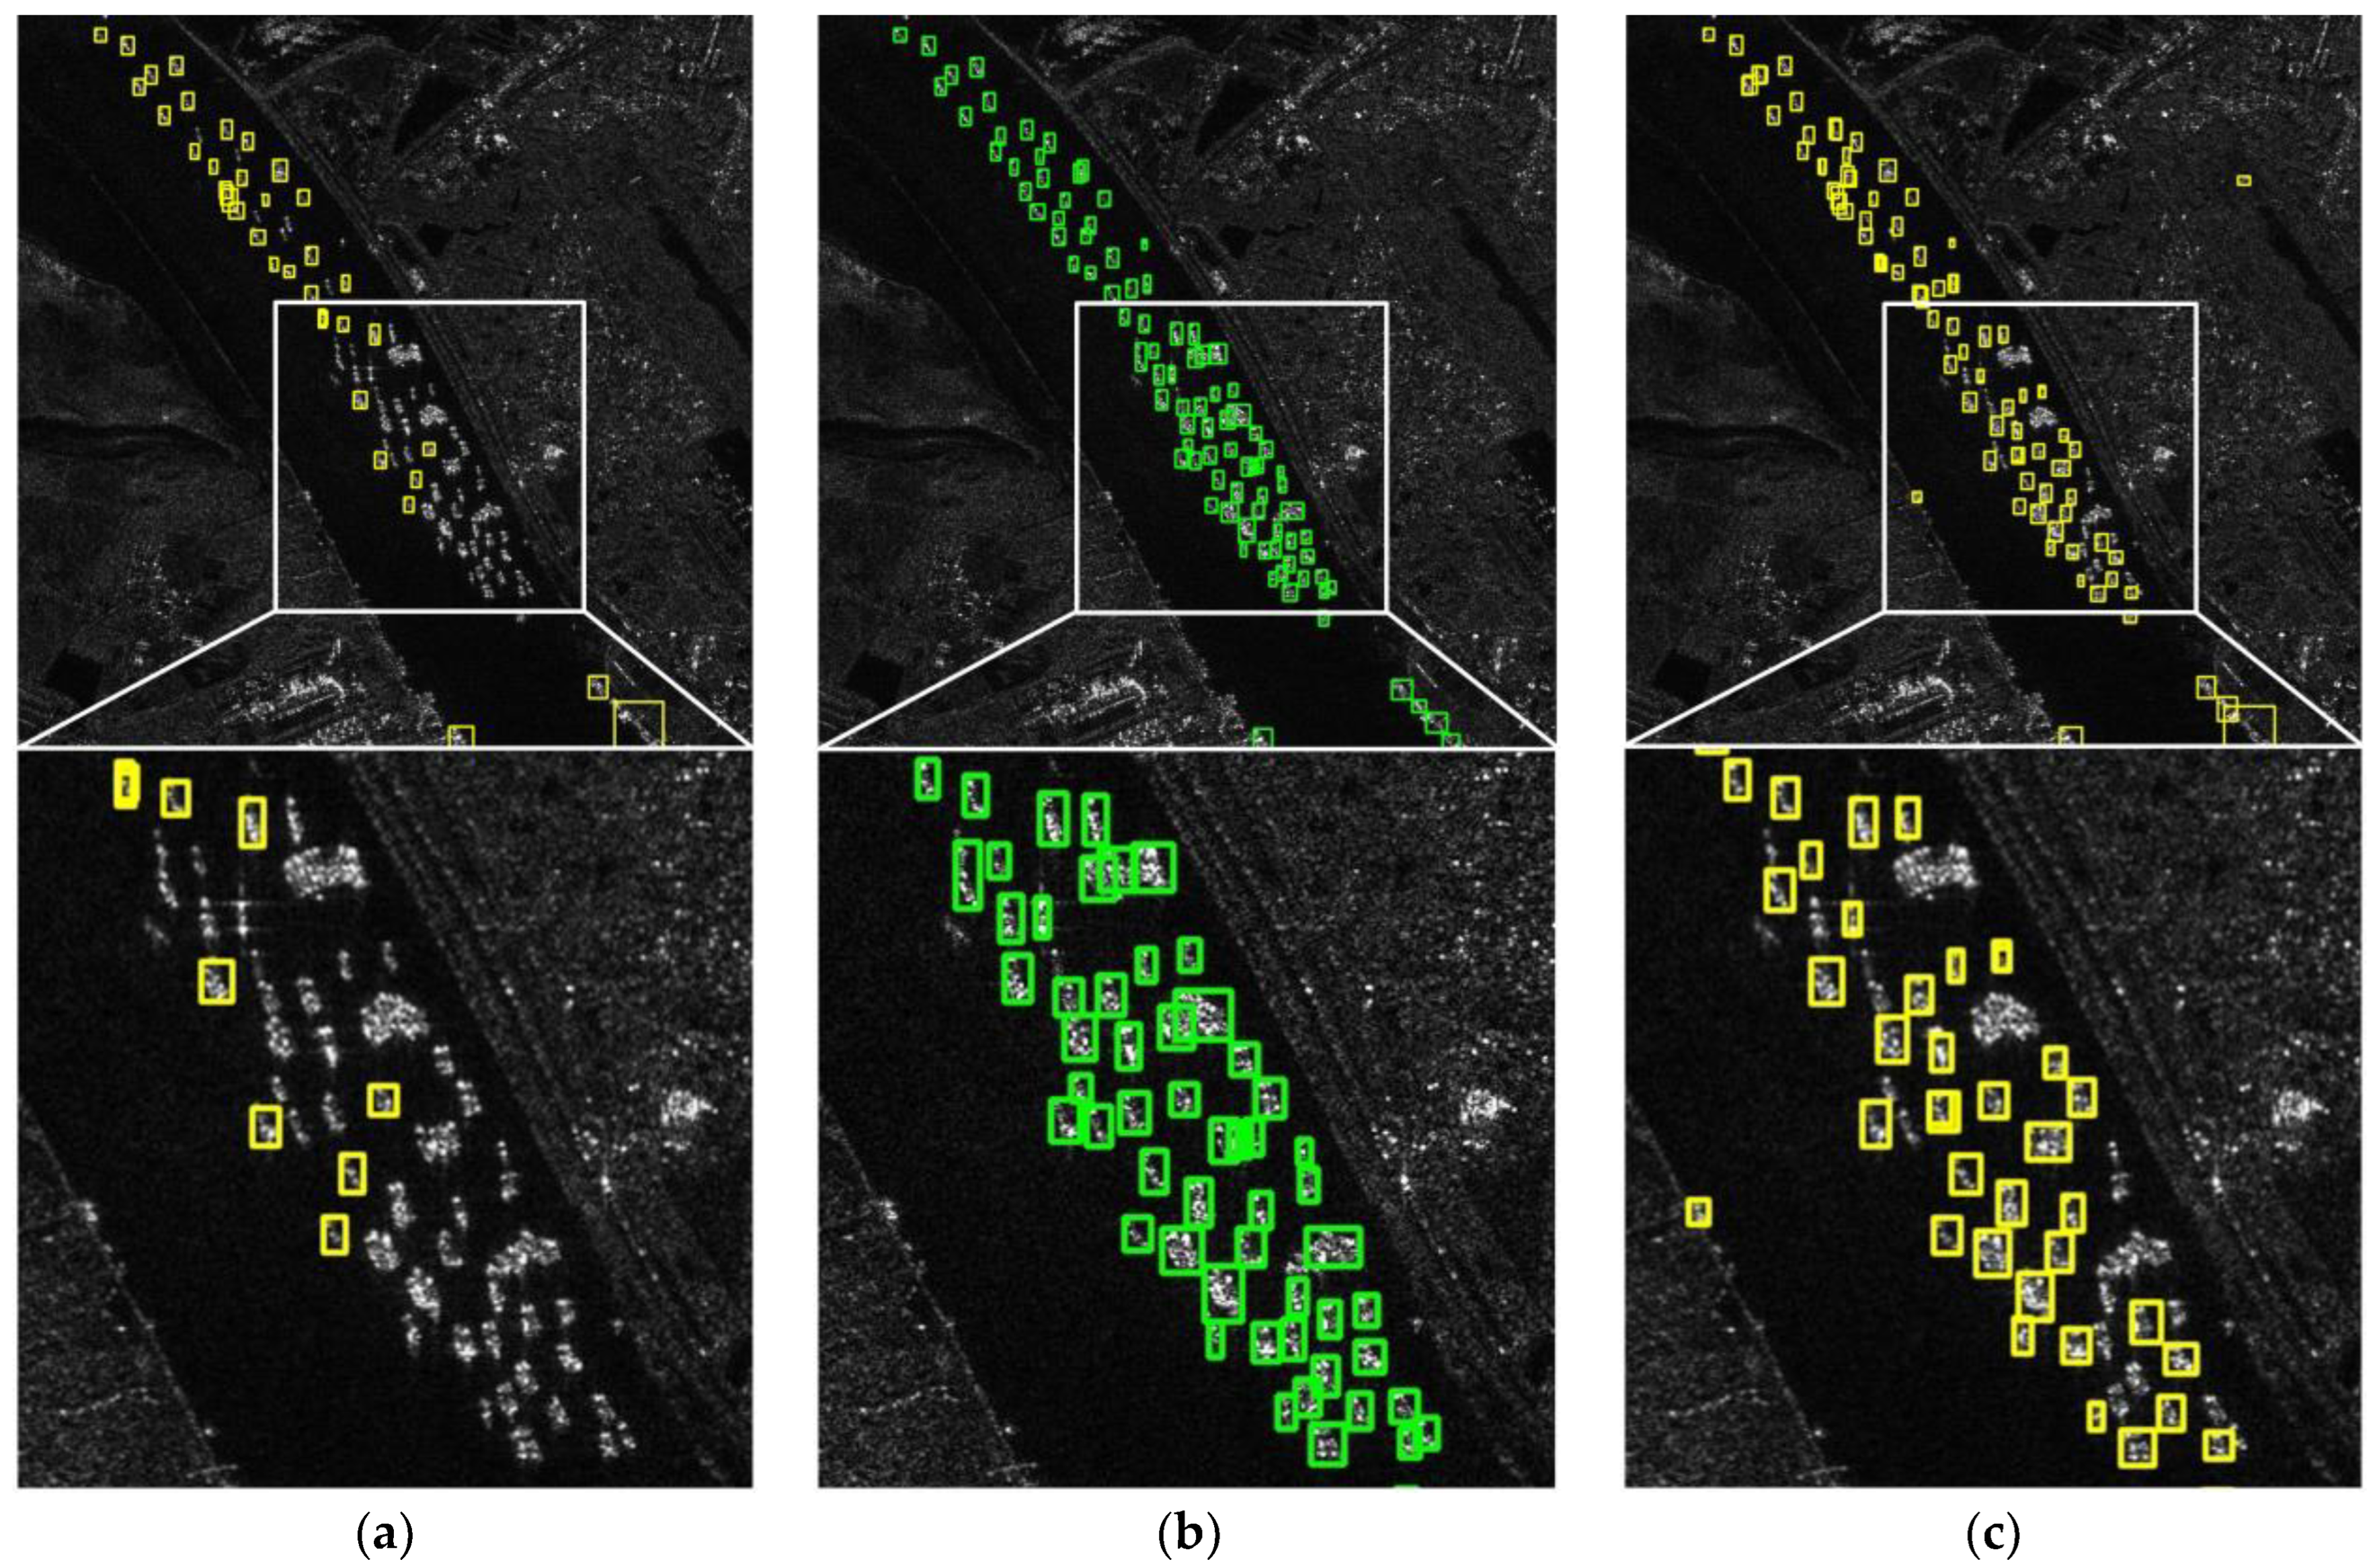
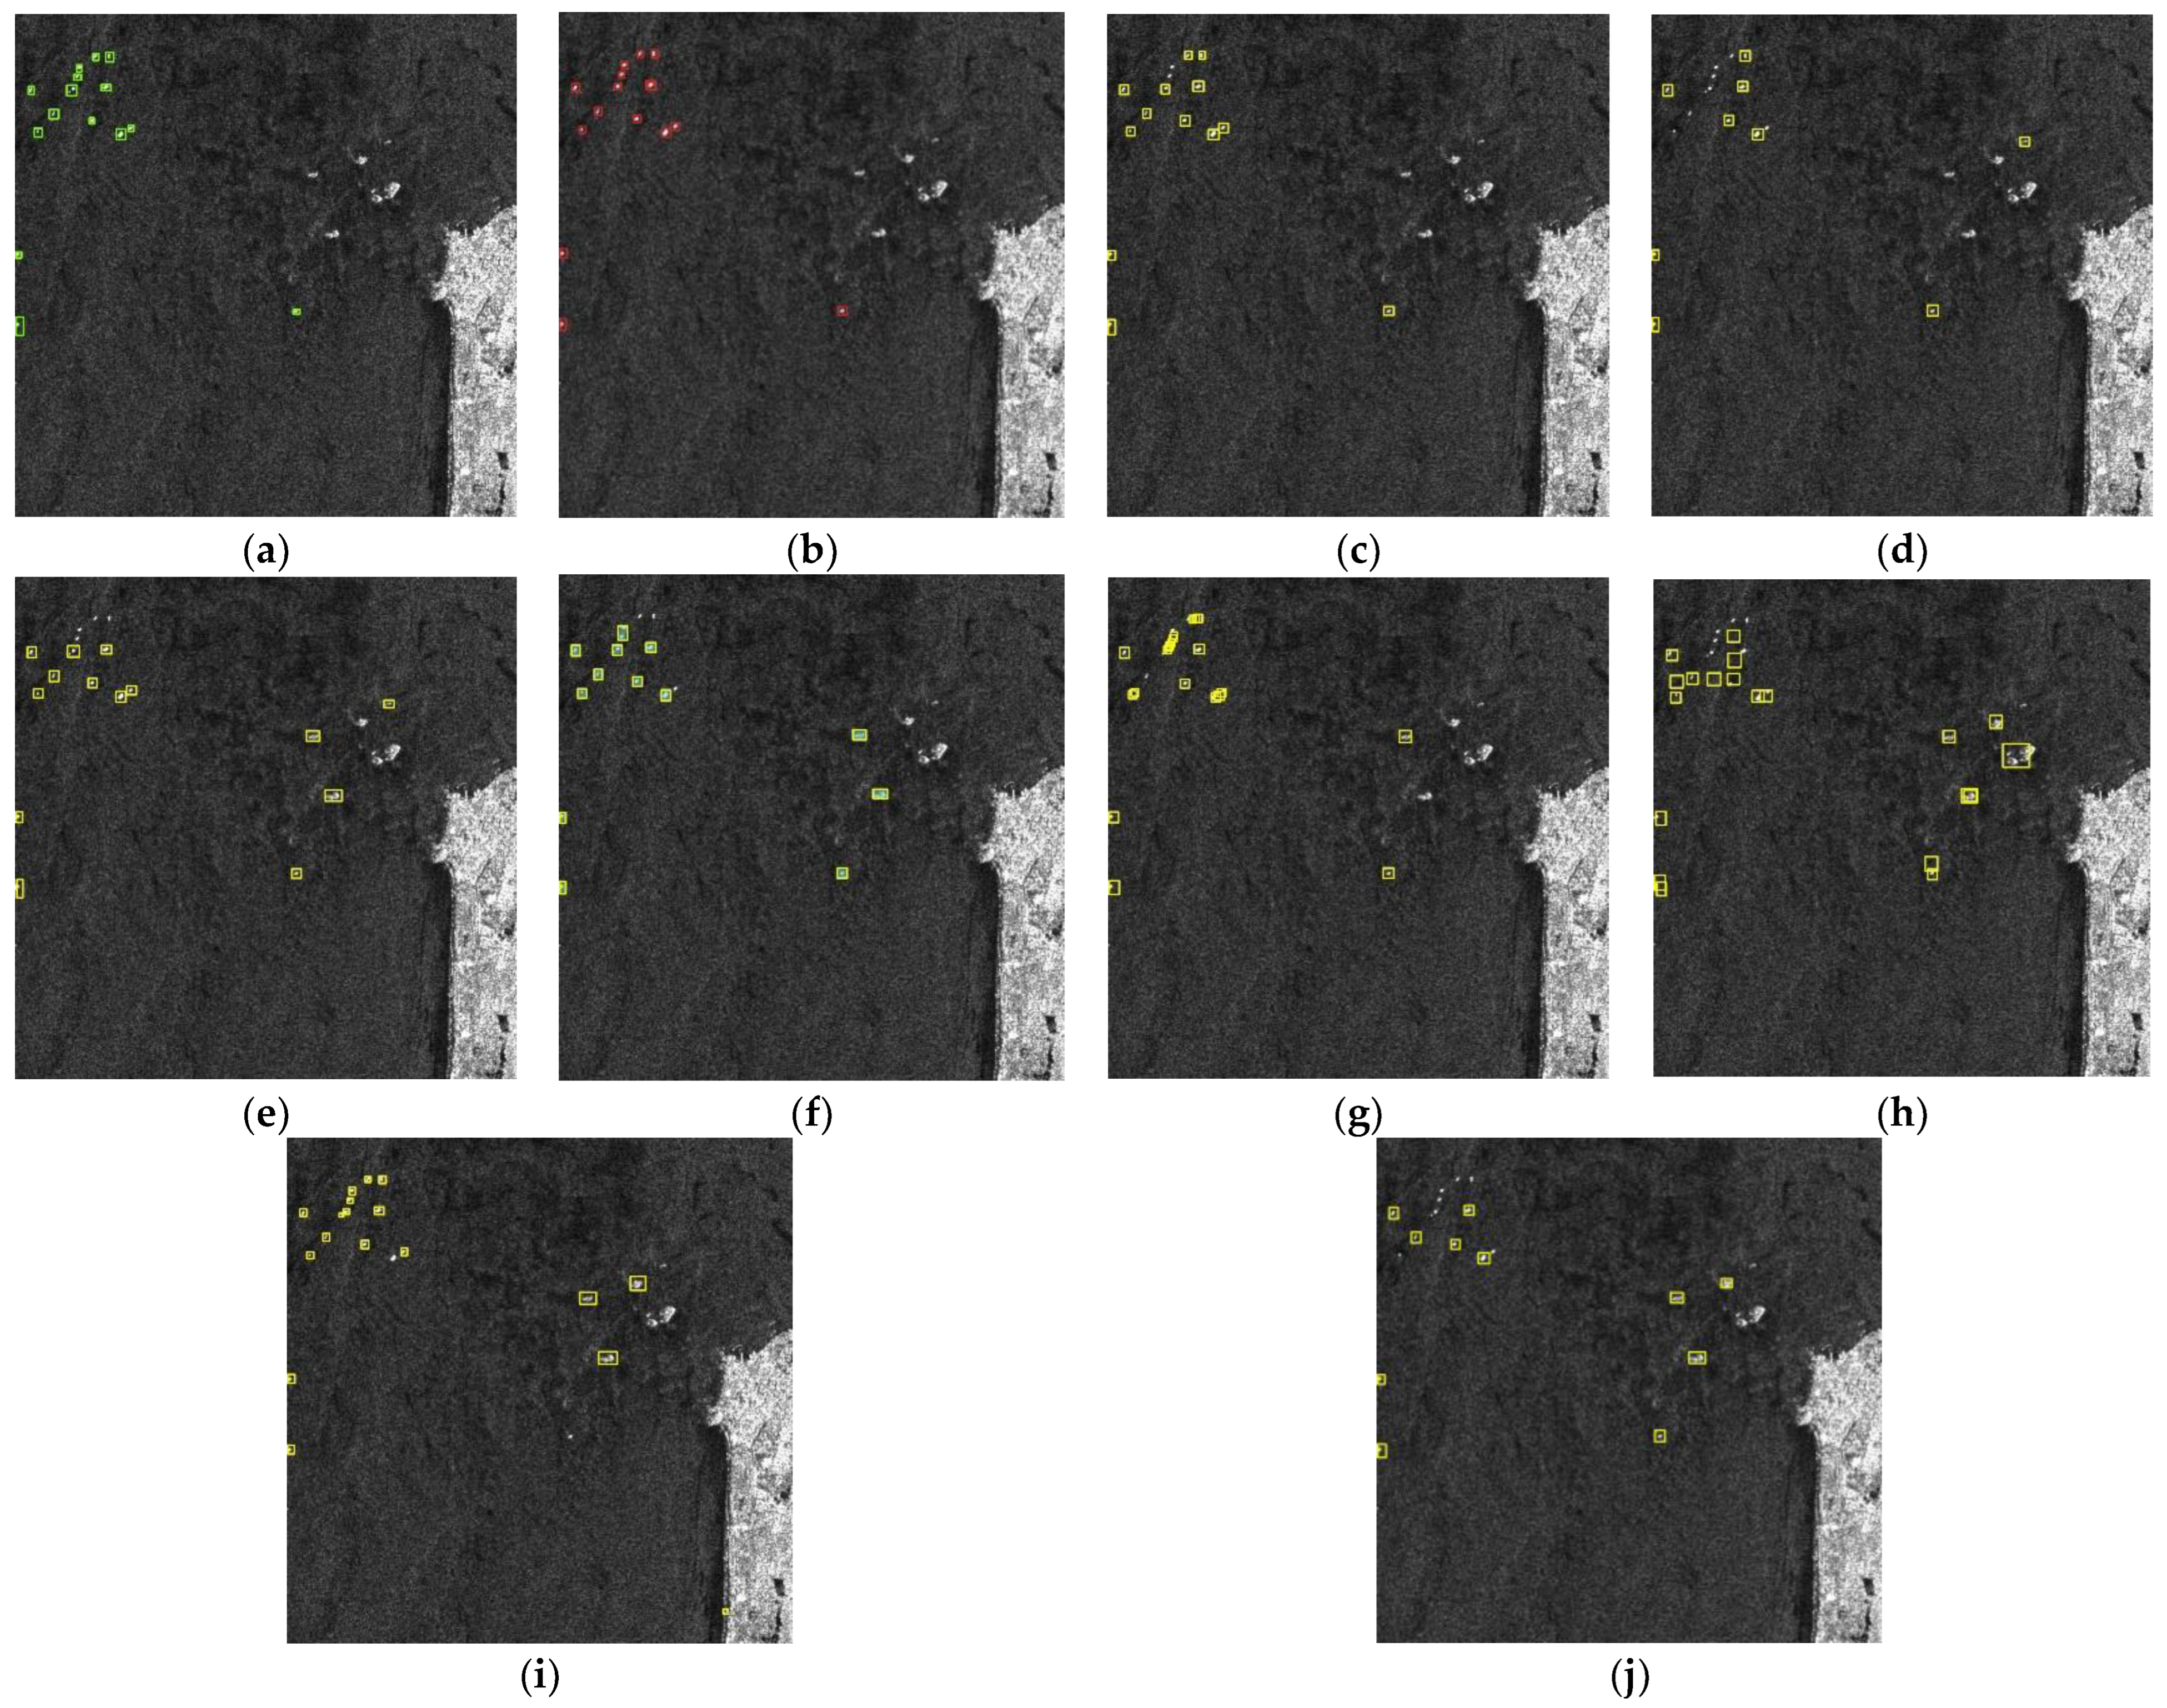
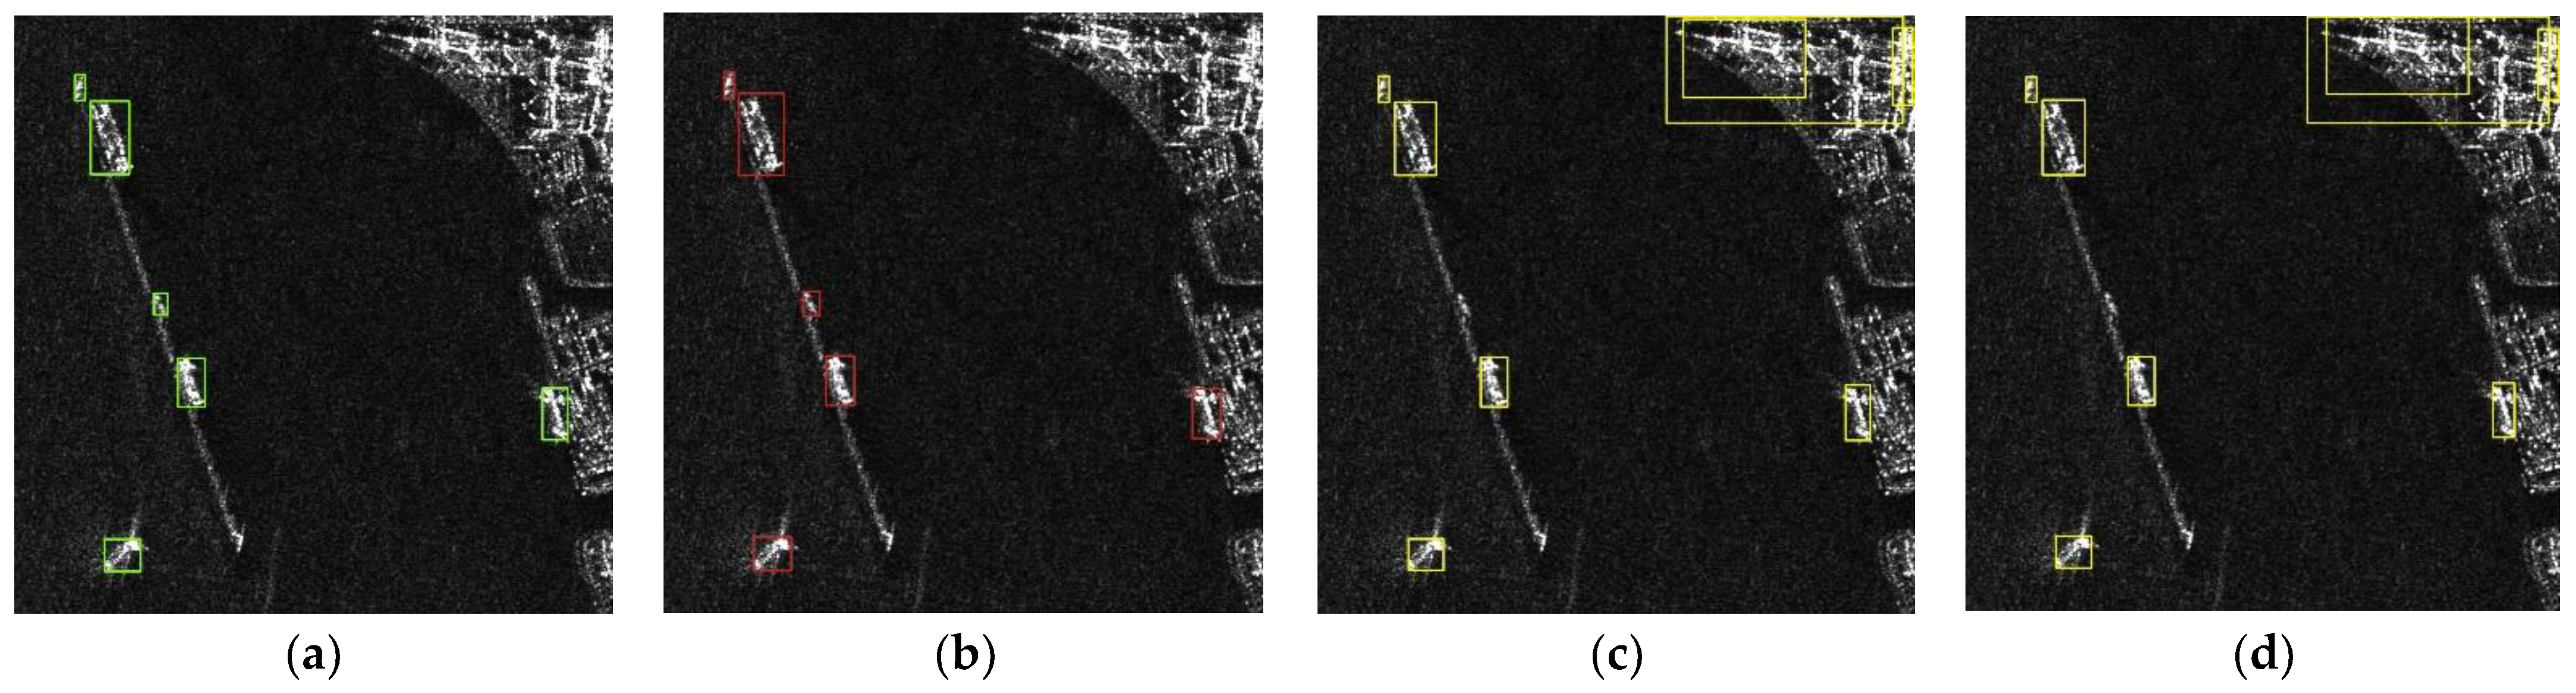
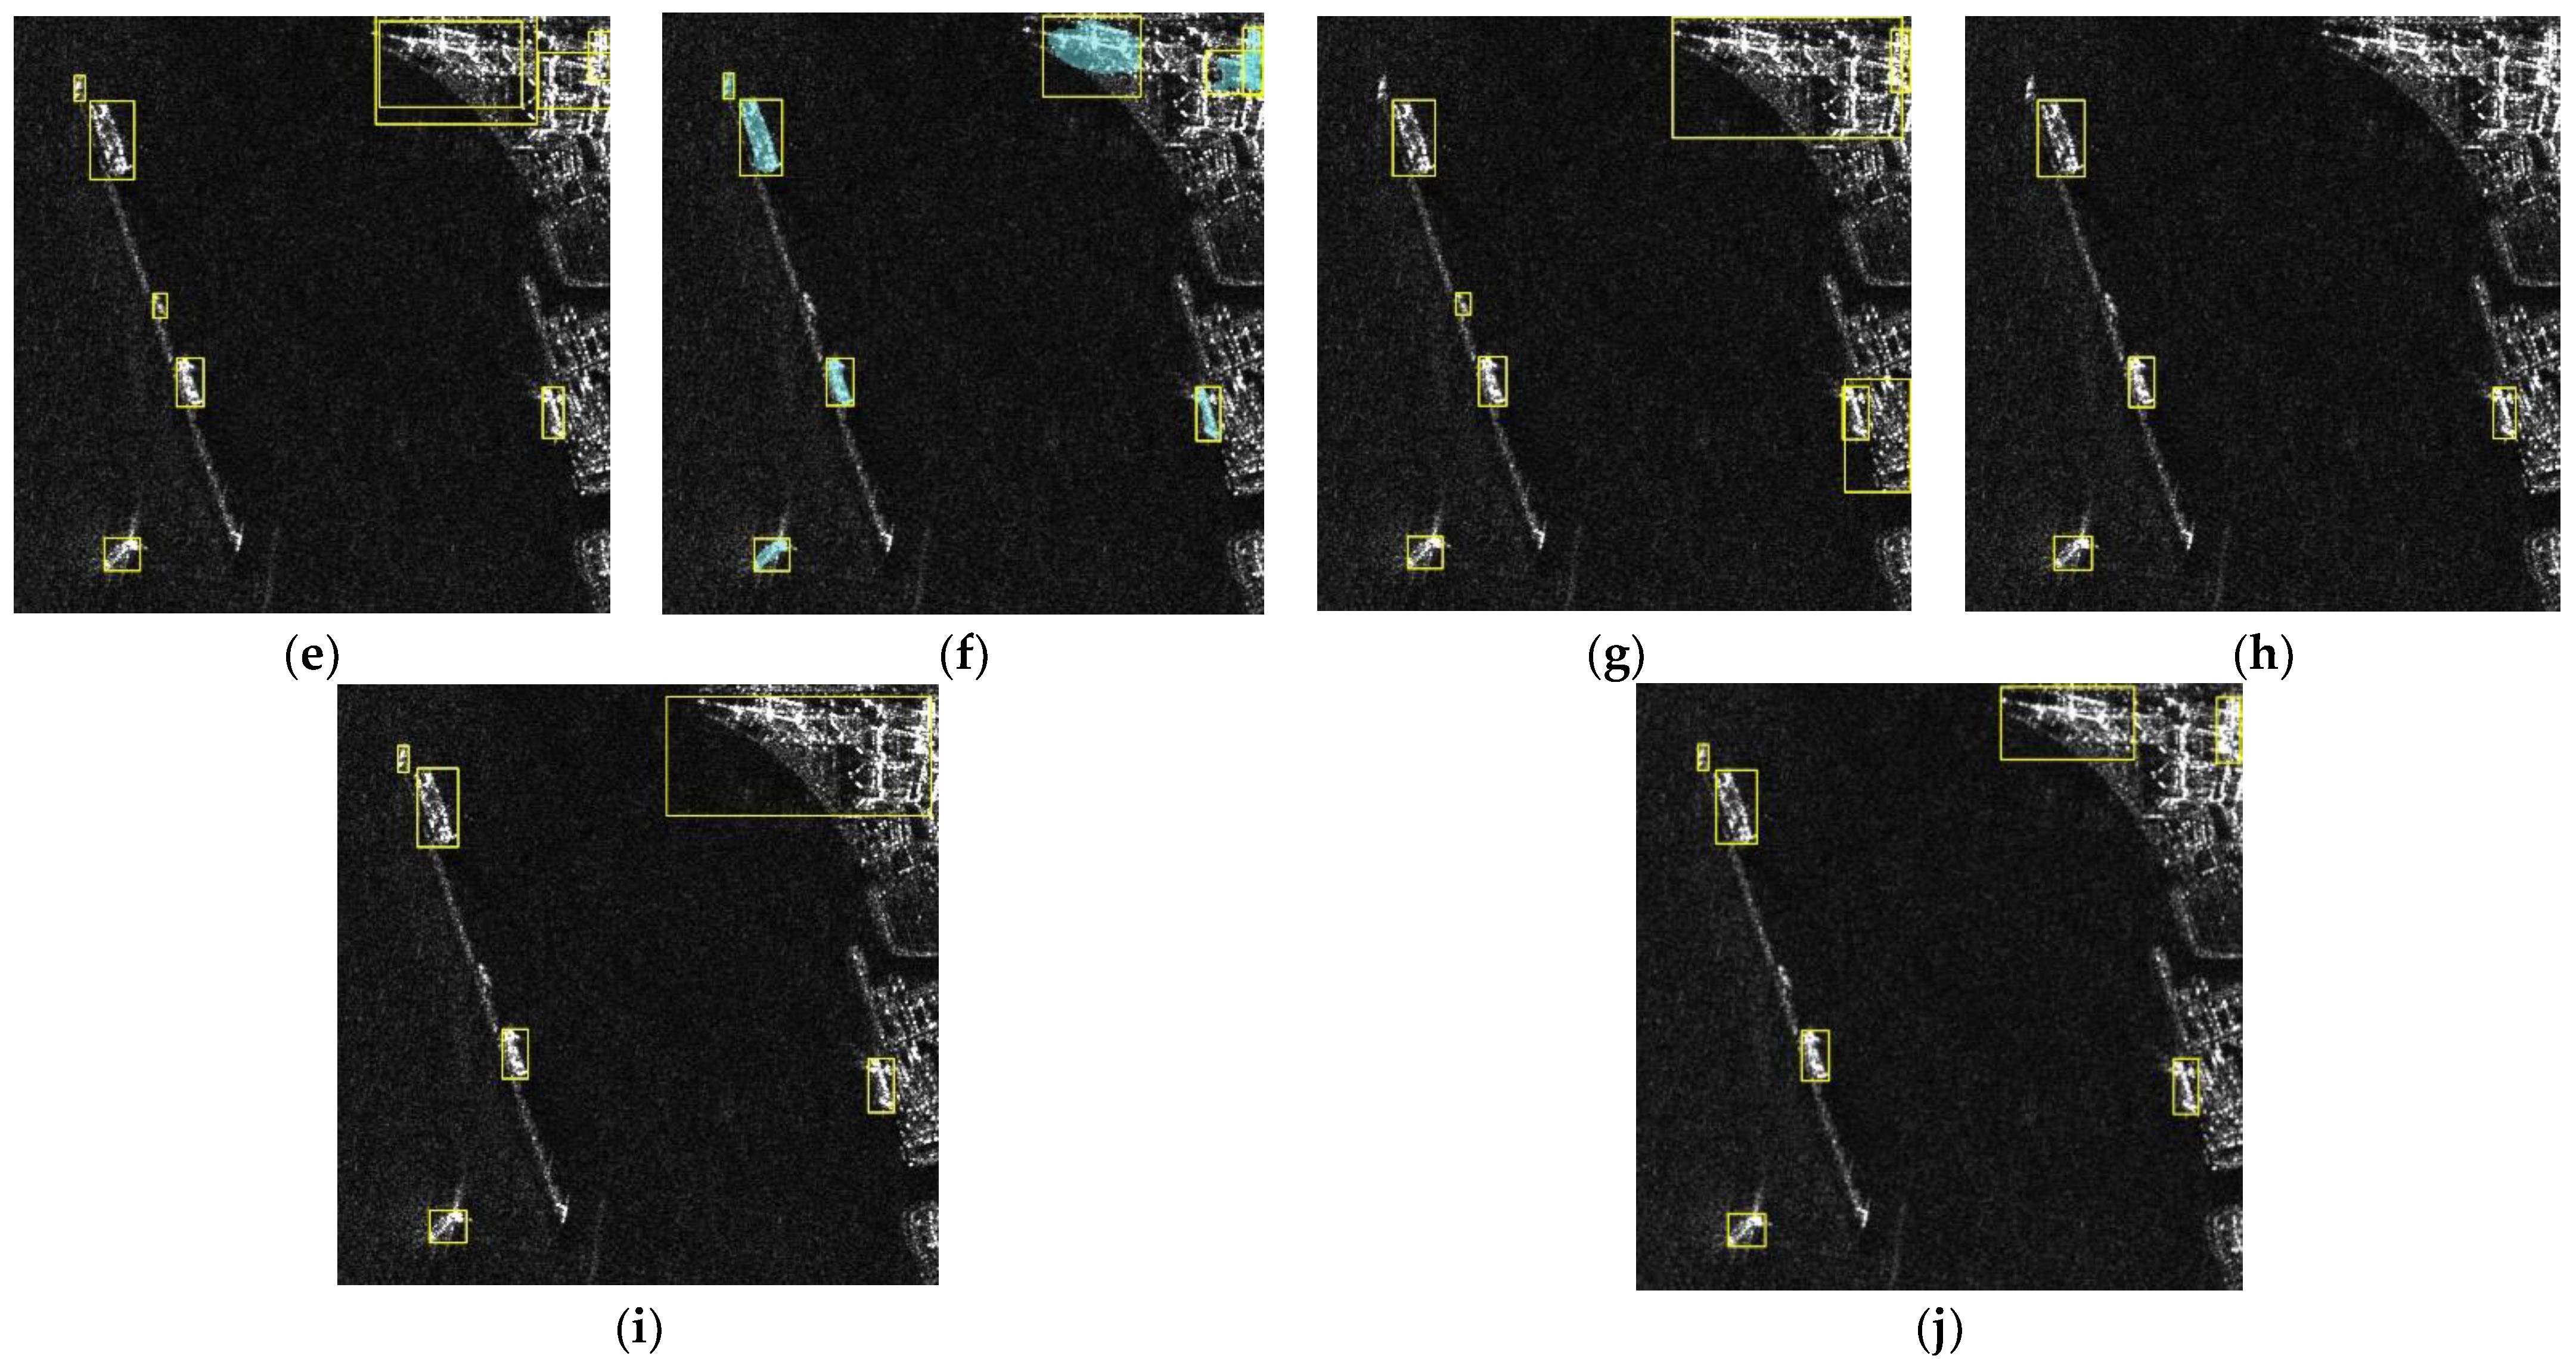
In practical experiments on two different datasets, our model maintained accurate detection results. YOLO-SD also has the highest detection accuracy compared to other superior models, which proves its advantages.

 ,
, 


