Article

Applicability Assessment of Coherent Doppler Wind LiDAR for Monitoring during Dusty Weather at the Northern Edge of the Tibetan Plateau

1
Institute of Desert Meteorology, China Meteorological Administration, Urumqi 830002, China
2
National Observation and Research Station of Desert Meteorology, Taklimakan Desert of Xinjiang, Urumqi 830002, China
3
Taklimakan Desert Meteorology Field Experiment Station of China Meteorological Administration, Urumqi 830002, China
4
Xinjiang Key Laboratory of Desert Meteorology and Sandstorm, Urumqi 830002, China
5
Key Laboratory of Tree-Ring Physical and Chemical Research, China Meteorological Administration, Urumqi 830002, China
6
Xinjiang Meteorological Service Center, Urumqi 830002, China
*
Author to whom correspondence should be addressed.
Remote Sens. 2022, 14(20), 5264; https://doi.org/10.3390/rs14205264
Submission received: 29 August 2022 / Revised: 17 October 2022 / Accepted: 19 October 2022 / Published: 21 October 2022

Abstract

:
Wind profile light detection and ranging (LiDAR) is an important tool for observing features within the atmospheric boundary layer. Observations of the wind field and boundary layer height from coherent Doppler wind LiDARs (CDWLs) under sandy and dusty weather conditions were evaluated using observations from two CDWLs and one GTS radio sounding located at the northern edge of the Tibetan plateau from 1 May to 30 August 2021. The results showed that CDWL has good applicability in reproducing wind fields in dust, precipitation, and in clear-sky conditions, and that it is superior to the v wind field for real measurements of the u wind fields. In terms of the planetary boundary layer height (PBLH), the validity of the inversion of PBLH in dusty weather was higher than that under clear-sky conditions. It was found that the PBLH retrieved by the CDWL at 20:00 (BJT) was better than that at 08:00 (BJT). The diurnal variation amplitude of the PBLH before the occurrence of a sandstorm was larger than the diurnal variation amplitude of the PBLH occurring during a sandstorm.

Graphical Abstract

1. Introduction

Sandy weather has a significant impact on arid regions, with the immediate effect of causing air pollution and mesoscale to large-scale climate change [1,2,3]. It was discovered that dust storms can affect the heat balance of planetary radiation, which in turn leads to climate change [4].
In recent years, scientists have conducted numerous studies on dust cycles, dust properties, and the environmental effects of dust using ground-based light detection and ranging (LiDAR) information such as the optical intensity, backscatter intensity, depolarization ratio, extinction coefficient, and dual-wavelength signal ratio [5,6,7]. Laser wind measurement techniques have developed rapidly during the past decades and are mostly used in wind field observation [8], aircraft wake measurements [9], turbulence measurements [10], cloud and atmospheric boundary layer characterization [11], and atmospheric aerosol optical characterization [12]. The fluctuation of boundary layer height with time and the effect of the entrainment layer and vertical wind speed on the boundary layer height were found using micro–pulse LiDAR observations [13]. The boundary layer height retrieved by direct detection LiDAR and coherent Doppler wind LiDAR (CDWL) were correlated with PM2.5 to study a precipitation event [14]. Ground–based and air–based LiDARs combined with ground–based aerosol mass concentrations were used to analyze the optical and physical properties of a dust process [15]. The characteristics of the dust aerosol backscattering coefficient, extinction coefficient, and depolarization ratio have been gradually studied by using polarization LiDAR to monitor pollution and dust storm weather in cities [16,17,18,19]. The direct observation of seasonal dust weather can be used to study the frequency and intensity of dust [20] and effectively evaluate the effect of air pollution control [21]. LiDAR was used to analyze the aerosol extinction coefficients for the inversion of dusty weather processes and to obtain correlations between the extinction coefficients and ground-level PM10 concentrations [22]. During the observation of the atmospheric boundary layer of an urban area using 3D scanning coherent Doppler LiDAR, multiple dust-devil-like vortices were detected in the area, and the temporal evolution of the precise 3D structure and vortex intensity was observed [23]. Detection means such as ground-based radar combined with satellite remote-sensing LiDAR can be used to analyze the transport characteristics and optical properties of sand and dust [24]. More novel experiments have been used in the past to quantify changes in aerosol transport and aerosol properties from the Sahara Desert to the Caribbean Sea by means of airborne coherent Doppler wind LiDAR experiments [25]. Observations of dust events in Iceland have confirmed the possibility of using Doppler wind LiDAR to monitor volcanic and sedimentary aerosols [26]. The simultaneous 3D monitoring of wind and pollution is performed using coherent Doppler wind LiDAR, which then generates a high-resolution wind field to track local air pollution sources and their dispersal, as well as to analyze transboundary air pollution events [27].
Previously, there have been no relevant observations and studies on the long duration and continuity of dust storms and floating dust weather at the northern edge of the Tibetan plateau using the coherent Doppler wind LiDAR (CDWL). The vertical evolution pattern of dust aerosol concentration and meteorological elements during the maintenance of dusty weather is not clear. This project proposes the use of CDWL installed at the Minfeng and Yeyik stations on the northern side of the Tibetan plateau region, combined with GTS ratio soundings, to conduct a study on the evolution of the atmospheric boundary layer before and after sand and dust storms and during persistent dusty weather. The objective was to evaluate the applicability of CDWL in the observation of boundary layer elements under sandy and dusty weather to provide new observational support for the development of currently stagnant sand and dust studies. This study was conducted as a basis for the quantitative assessment of the contribution of dusty weather to regional atmospheric dust aerosols and its impact on regional and global changes.
This paper is organized as follows: The site and data resources are described in Section 2. Section 3 provides a comparative analysis of the wind field data observed by CDWL and GTS soundings and evaluates the performance of CDWL wind field observations. Section 4 compares the effect of CDWL on the planetary boundary layer height (PBLH) inversion under different weather conditions. Finally, a discussion and conclusions are provided in Section 5 and Section 6. If not specified, Beijing time (BJT) is used in this paper.

2. Materials and Methods

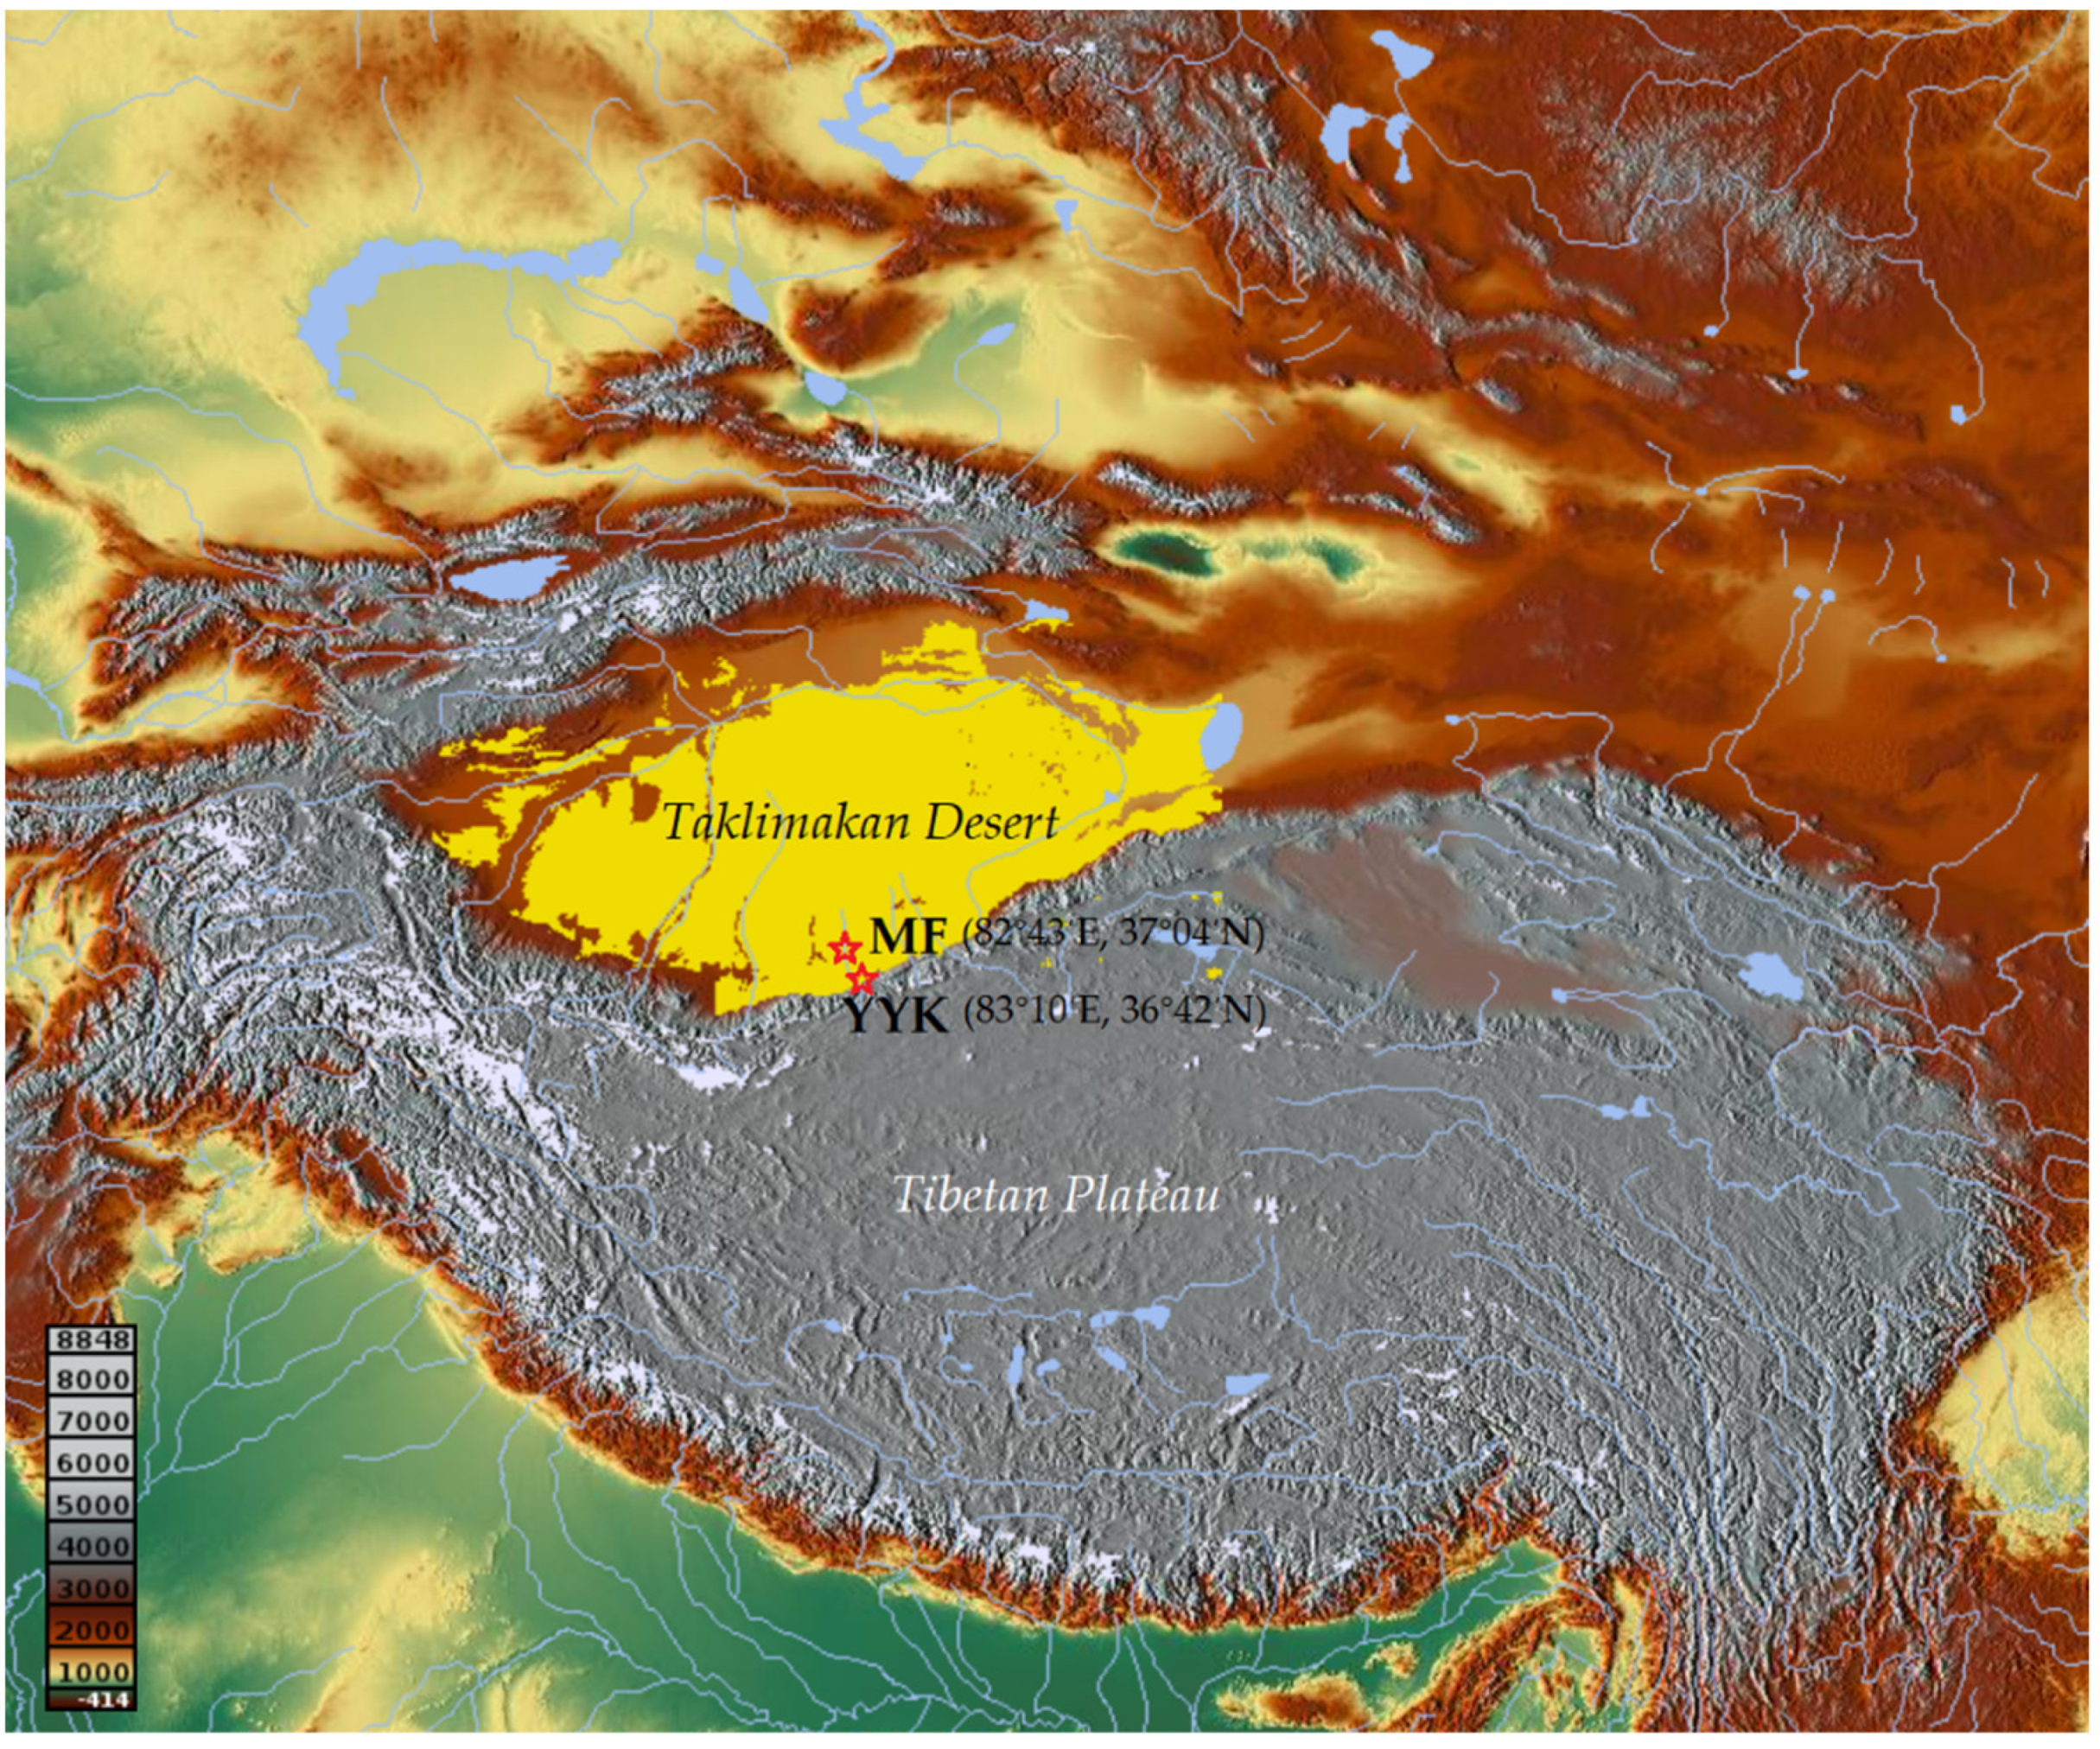
2.1. Data and Information

In this paper, ground-based coherent Doppler wind LiDAR data were acquired from 1 May to 31 August 2021 at Minfeng station, hereafter referred to as MF (82°43′E, 37°04′N, 1410.7 m) and Yeyik station, hereafter referred to as YYK (83°10′E, 36°42′N, 2499.0 m) on the northern edge of the Tibetan plateau (Figure 1). CDWL was obtained using the Wind3D 6000 produced by the Ocean University of China (OUC) and Qingdao Leice Transient Technology Co., Ltd., Qingdao, China. [28].
CDWL performs continuous observations, 24 h a day, with an average of 17 s for one set of observations, and the 10 min average data were used for the analysis in this paper. The maximum detection height of CDWL is around 6 km, the minimum detection height is around 45–100 m, the vertical resolution is 10–30 m, the wind speed measurement accuracy is below 0.1 m/s, and the wind direction measurement accuracy is below 3° [29]. CDWL can detect the horizontal wind direction, wind speed, vertical velocity, atmospheric refractive index structure constant, and atmospheric extinction coefficient, and can obtain more reliable information on the wind field and turbulence intensity in the boundary layer through the electromagnetic wave signals emitted and received back by CDWL. Level 0 is the radial wind speed data, Level 1 is the second level wind profile data, Level 2 is the 10 min average wind profile data, and Level 3 includes the PBLH and cloud height data products. The vertical height of the CDWL observation at the MF station is 51–5017 m with a vertical resolution of 26 m.
The GTS sounding observation data were taken from the Minfeng County Meteorological Bureau (82°43′E, 37°04′N), and the sounding instrument used was a GTS13 digital sounding instrument, which received data through the GFE (L)1 secondary wind radar. In order to facilitate the comparative analysis of the two types of data, the same vertical resolution of 26 m was chosen to match that of the CDWL in MF. The CDWL was selected based on the set of samples with the closest time to the GTS sounding release.

2.2. Research Methods

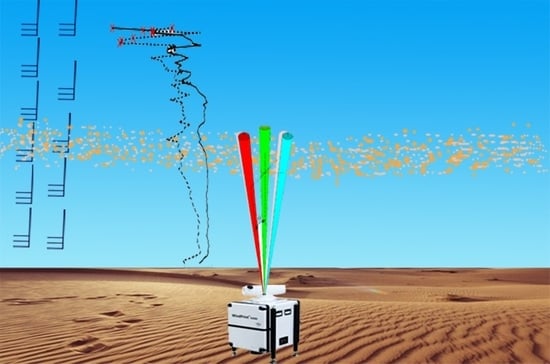
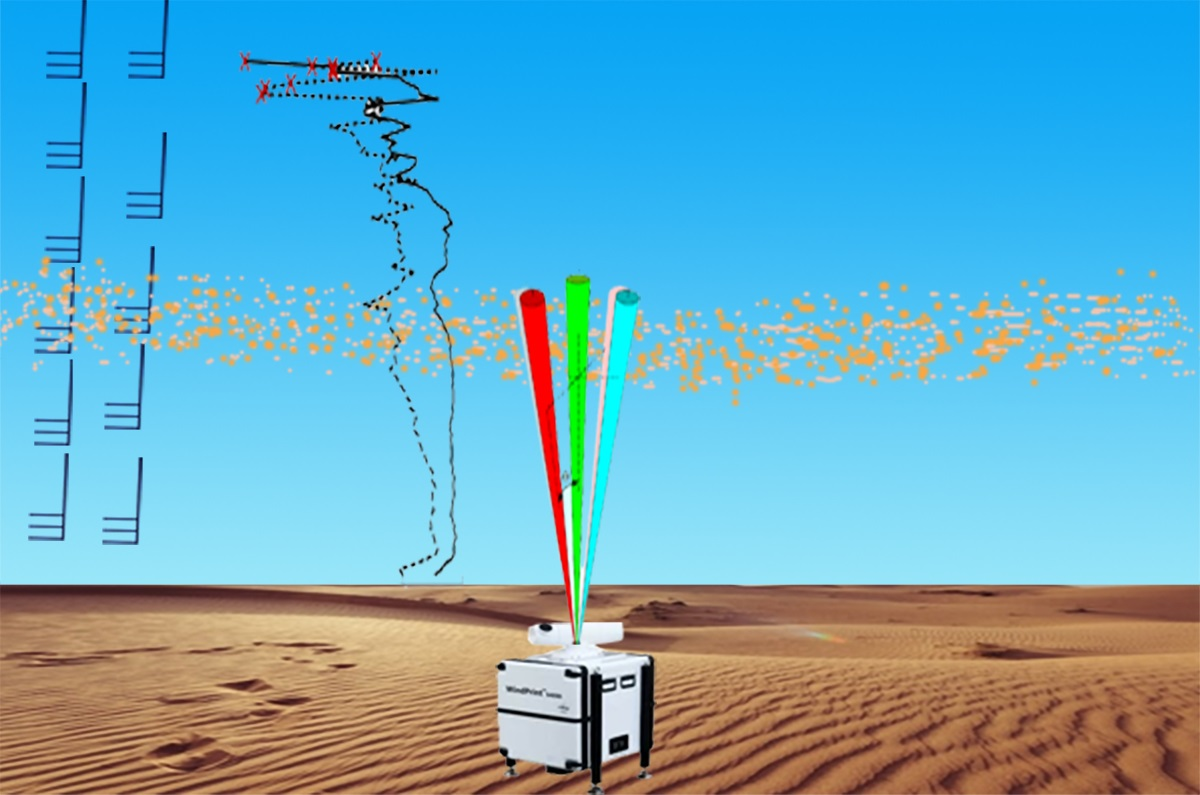
2.2.1. DBS Wind Field Inversion Method for CDWL

CWDL uses the Doppler effect of light to measure wind. This means that, when the laser propagates in the atmosphere, particles such as aerosols cause the laser to scatter, and the movement of the particles such as aerosols causes the received scattered echo to produce a differential frequency signal, i.e., the Doppler shift. The Doppler shift can be inverted by Formula (1) to show the component of aerosol motion in the direction of the laser beam, i.e., radial velocity or radial wind speed [28].
Δ f D = 2 V l o s λ
where Δ f D is the Doppler frequency shift, V l o s is the radial velocity, and λ is the wavelength of the emitted laser.
The Doppler Beam Swinging (DBS) method is a five-beam method (DBS-5) for the inversion of wind profiles, which requires radial data in five directions—east, west, south, north, and vertical—which can be used to invert horizontal and vertical wind fields [29].
{ u = V N V S 2 cos θ v = V E V W 2 cos θ V h = u 2 + v 2 w = V z
The wind direction is α = | t a n 1 u v |

2.2.2. PBLH Inversion Method for CDWL and GTS Soundings

The inversion of PBLH for CDWL uses a wavelet covariance transform based on the Haar function, which is as follows [14,30]:
h ( z b a ) = { 1 ,   b a 2 z < b 1 ,   b z < b + a 2 0 ,   other
where z is the height, b is the location where the function is located, and a is the spatial extent or calculation step, which can be formulated according to local characteristics. The covariance function W f of the Haar function is also defined and denoted as:
W f ( a , b ) = 1 a z b z t f ( z ) h ( z b a ) d z
In this paper, the vertical resolution of CDWL Δ z is 26 m, and a is 10 times the minimum height difference, which is 260 m. The lowest altitude observed by CDWL z m i n is 51 m. Therefore, the theoretical CDWL inversion of the PBLH is no less than z m i n + a / 2 , which is 181 m.
The determination of the PBLH in this study using GTS soundings is a method of determining the height of the boundary layer through thermal differences in the vertical direction. The specific method is the potential temperature gradient method used by Liu and Liang [31].

2.2.3. The k-Means Clustering Analysis

The k-means algorithm is a commonly used clustering method. This study used k-means clustering to classify the PBLH of CDWL and GTS sounding inversions and the difference between them. The aim was to analyze what weather type and other characteristics were present in clusters where the PBLH of the CDWL inversion was close to that of the soundings’ inversion. This facilitates an understanding of the conditions under which the CDWL inversion of the PBLH is applicable.
The k-means algorithm works by dividing n sample points into k clusters, with sample points within each cluster having a high degree of similarity and sample points between clusters having a low degree of similarity; moreover, the similarity is calculated based on the average of the sample points in a cluster.

3. Comparison of Wind Field Observations

The samples were analyzed and compared based on the results of u and v wind fields as well as on the wind direction and speed data recorded by CDWL and GTS sounding data at MF from May to August 2021.

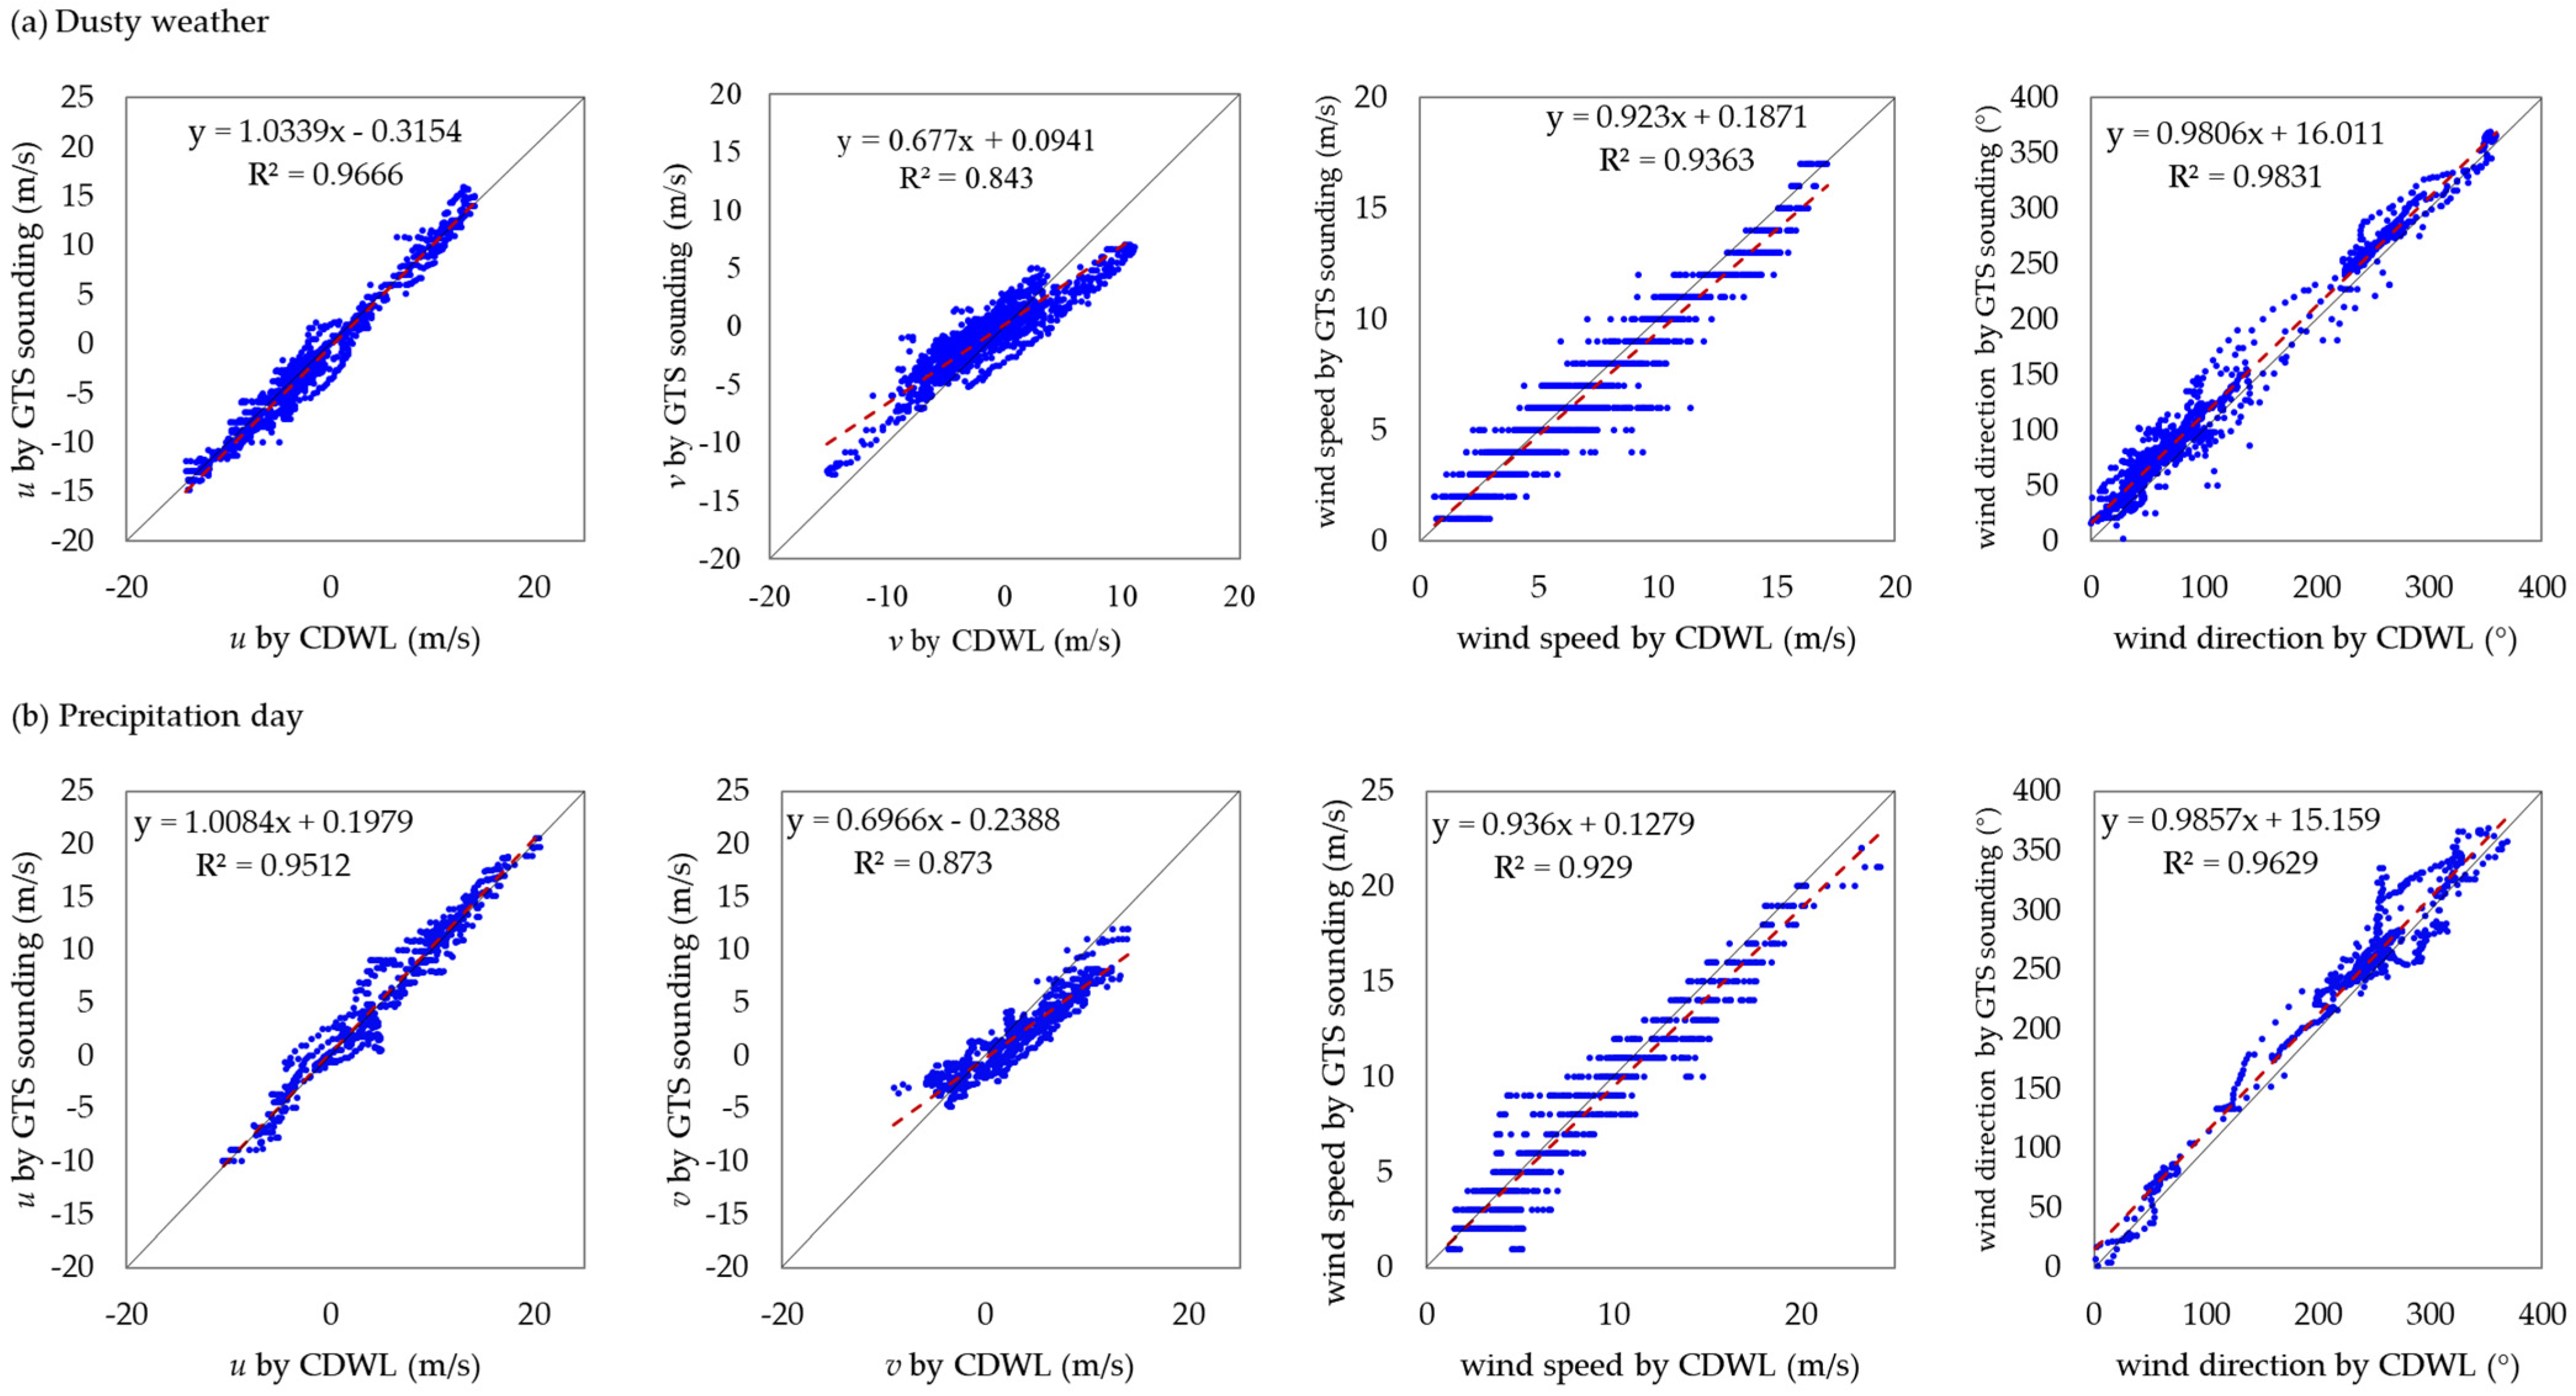
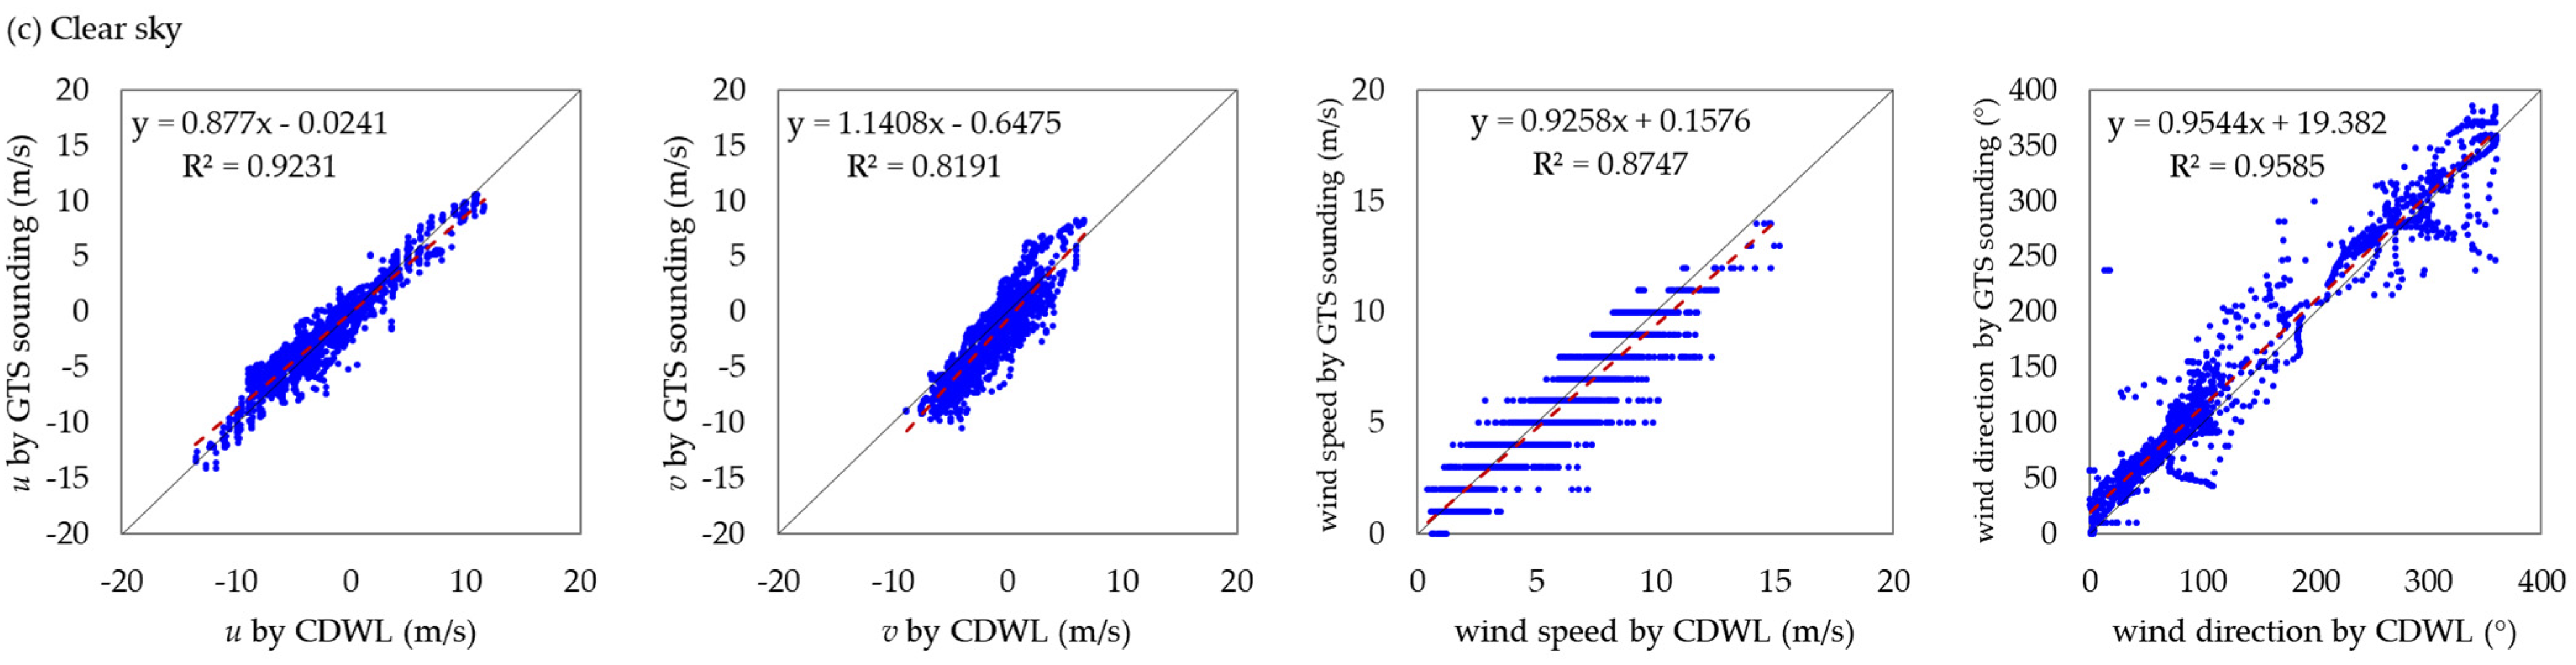
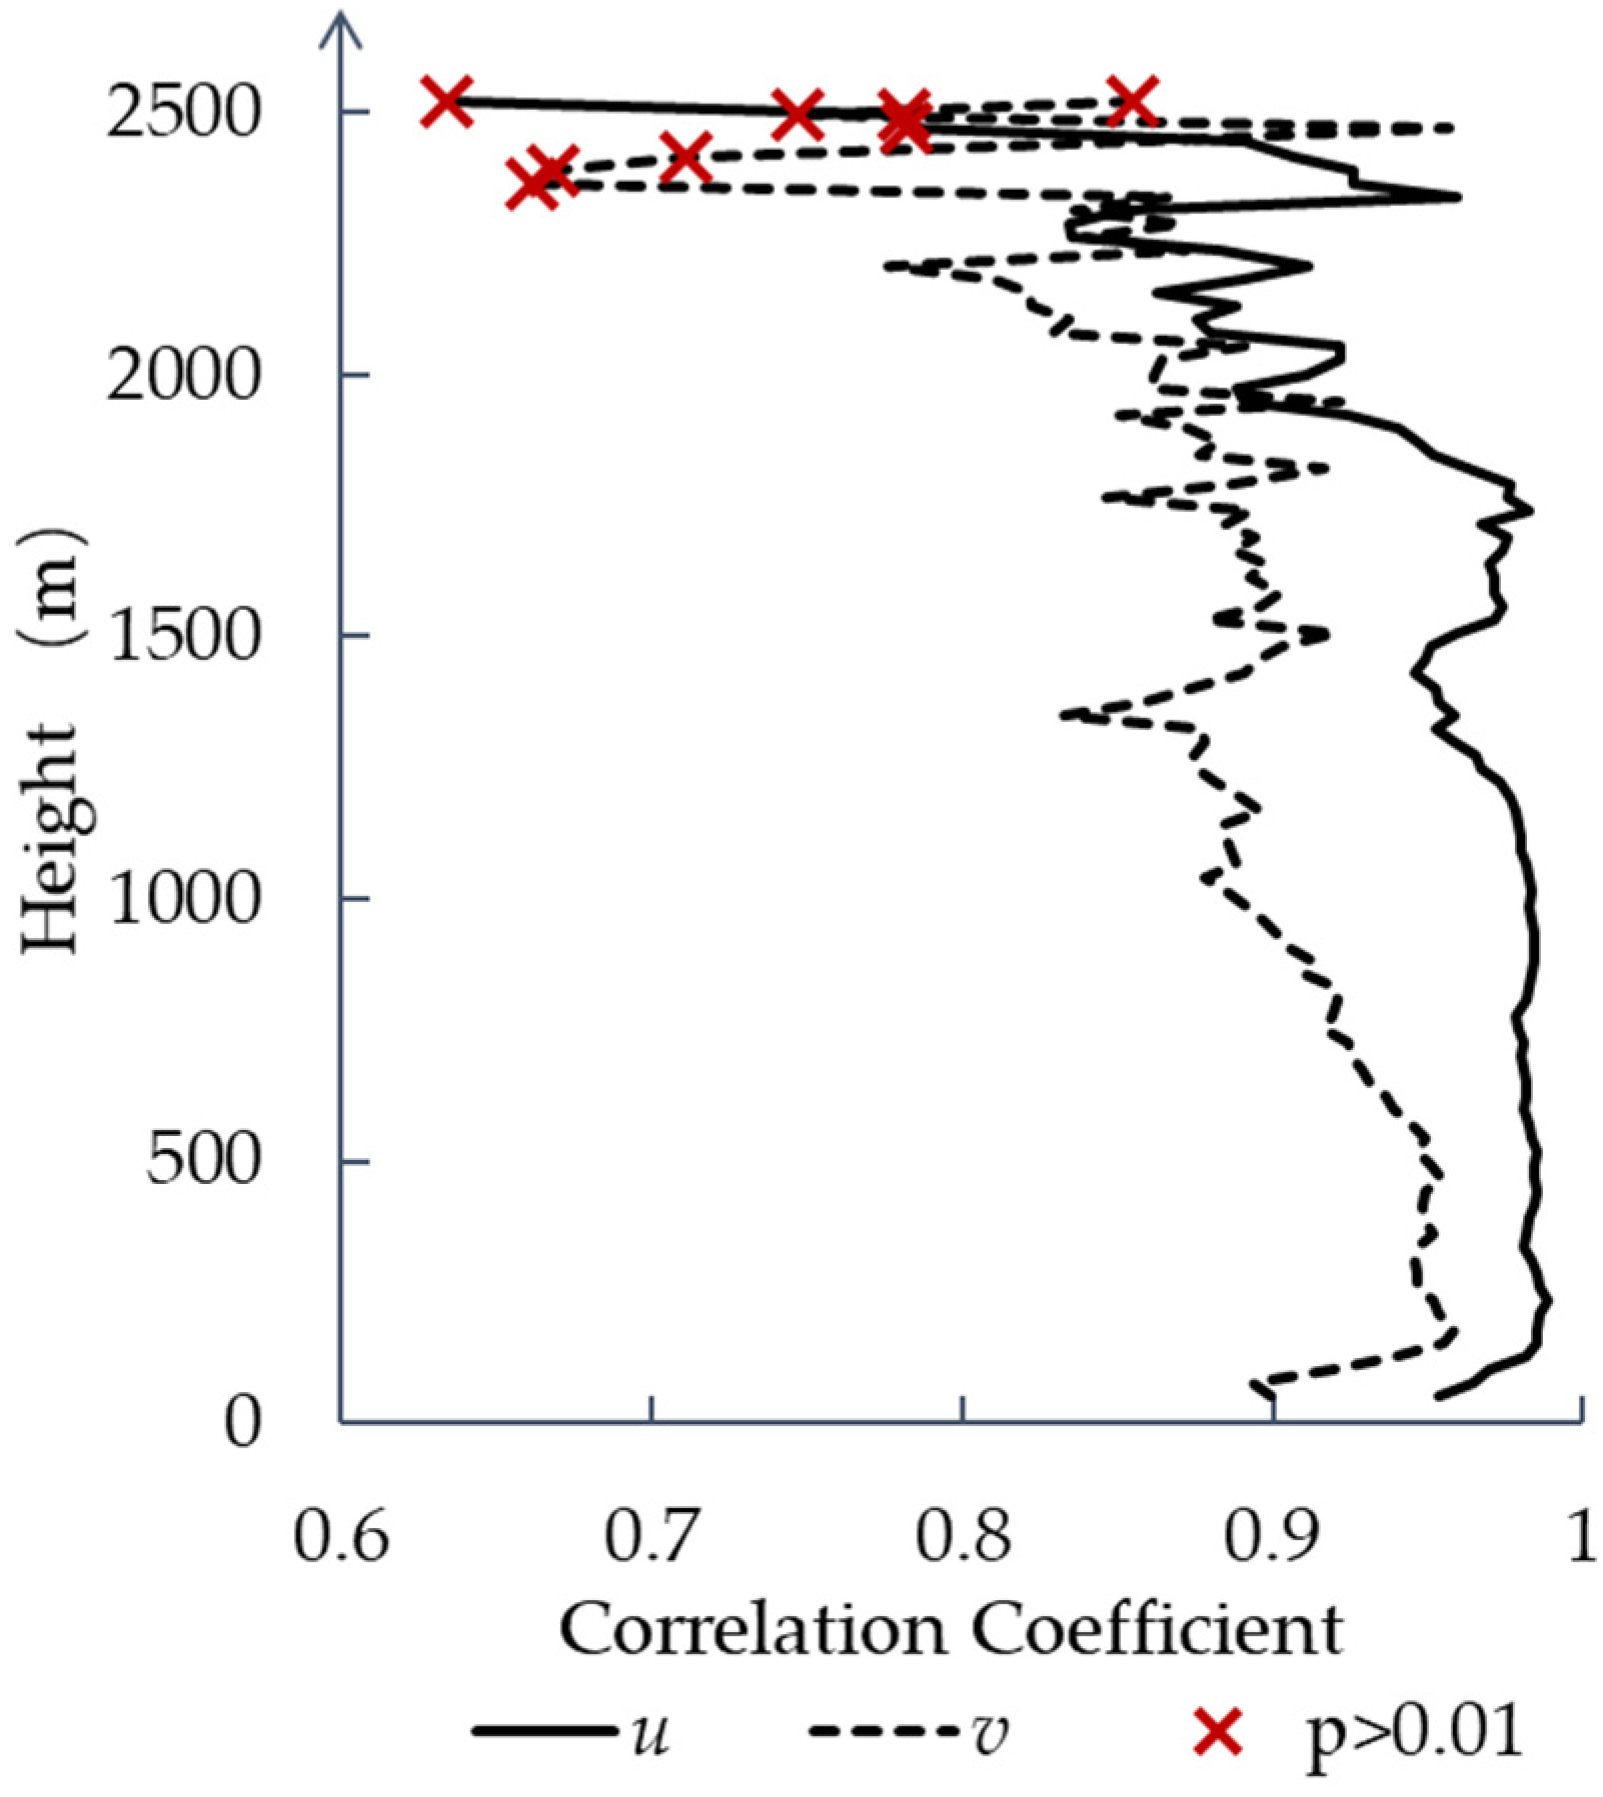
3.1. CDWL and GTS Soundings’ Observation Wind Field Assessment

Based on the hour-by-hour weather phenomenon records from the MF station, all available samples were classified into three categories: dusty weather (dust storms, blowing sand, and floating dust), precipitation, and a clear sky. All available samples were used for analysis. The CDWL and the horizontal wind field observations at the effective height of the soundings were compared for each of the three weather phenomena. The scatter plot is shown in Figure 2. There was a greater proportion of dusty weather and clear-sky days, with fewer precipitation weather samples. In terms of the linear fit results, the linear coefficients of determination R2 for wind speed during dusty weather, precipitation, and clear skies were 0.9361, 0.9715, and 0.8747, respectively, and the coefficients of determination R2 for wind direction were 0.9937, 0.9937, and 0.9592, respectively, all of which passed the significance test (p < 0.01, results omitted). The root mean square error (RMSE) of u and v recorded by CDWL and GTS sounding (Table 1) were approximately 2.0 m/s, while the wind speed and direction were less than 1.5 m/s and 40.0°, respectively. The above results are similar to those of previous studies [8,32,33,34]. The comparison results for the wind direction were also satisfactory and better than previous studies [35].
The atmosphere in desert areas is dry and, when there is no precipitation or dusty weather, the aerosol content in the atmosphere is low. When the air is too “clean”, the signal returned to the LiDAR is weakened and the signal-to-noise ratio of the LiDAR observation is reduced, which affects the accuracy of the observation to a certain extent. This is also a result of the fact that observations during dusty weather and precipitation are better than when there are clear sky events.
A further comparative analysis of the horizontal wind fields at various heights in the vertical direction at MF was carried out (Figure 3). Below, albeit close to 2300 m, the correlation between the u and v wind fields observed by both instruments passed the significance test (p < 0.01). The overall correlation of u was significantly better than the correlation of v. Due to the special nature of the soundings’ balloon observations, the balloon will drift with the wind field, and the higher the wind speed and height, the further the balloon will drift. This results in some differences between the balloon observations and the horizontal wind field over CDWL at MF. This also causes a difference in the correlation between u and v.

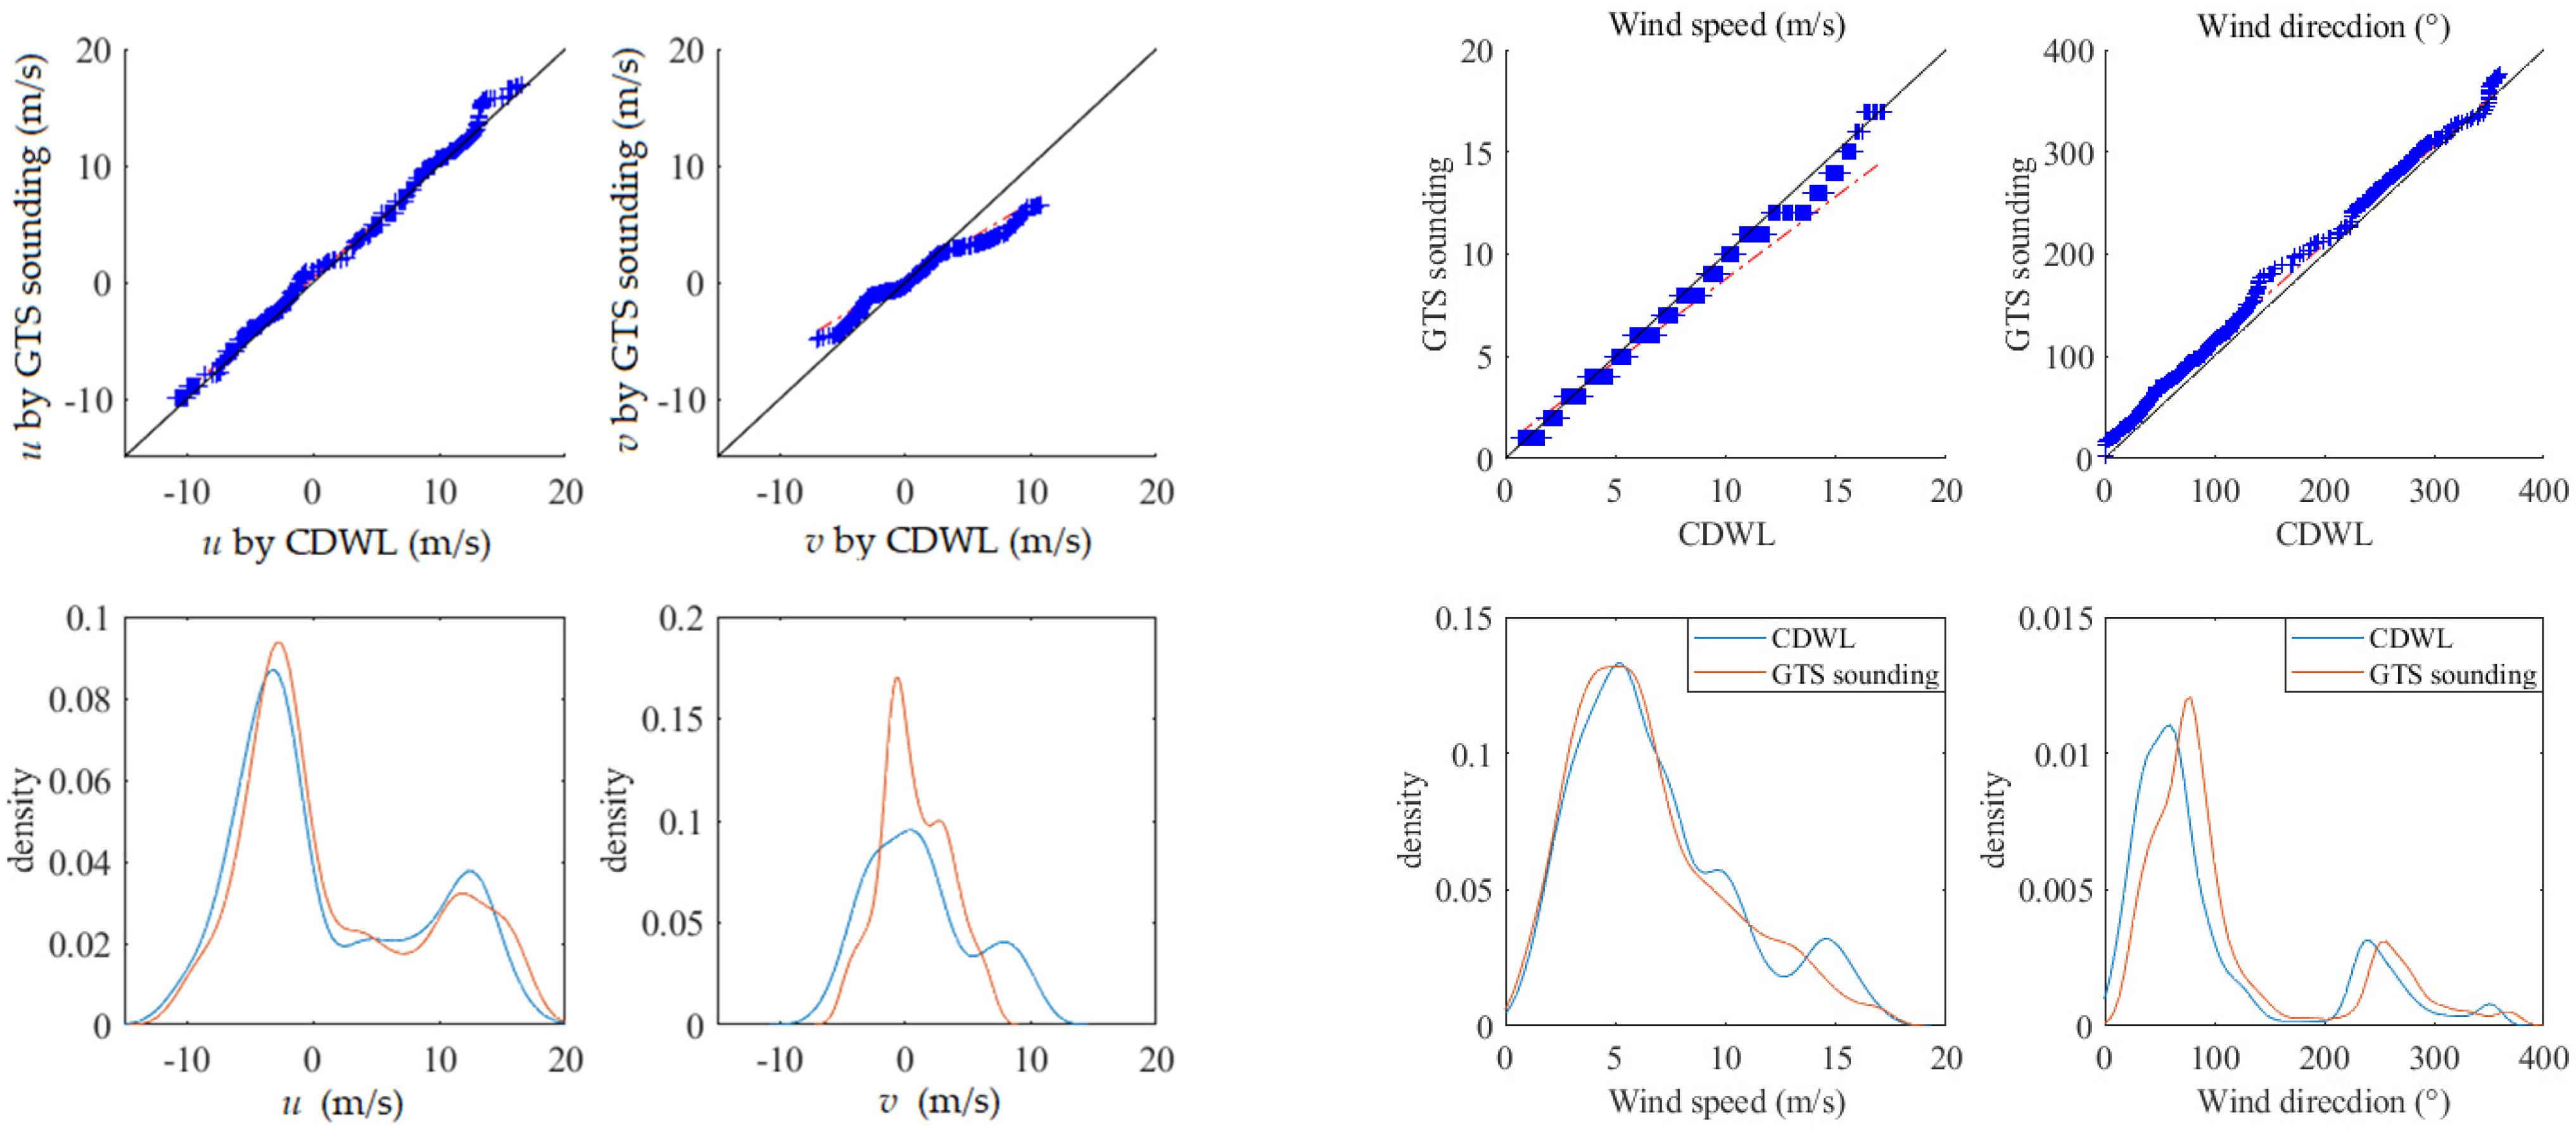
3.2. Quantile Distribution and Probability Density Analysis of Horizontal Wind Fields from CDWL and GTS Sounding Observations

The quantile–quantile plot (hereafter referred to as QQ plot) visualizes whether the distribution of the two variables is skewed or not. The probability density distribution plot allows a direct observation of the number of samples distributed in different intervals. Continuing the bias and probability distribution analysis of the horizontal wind field in MF, the QQ plots of the u and v wind fields show (Figure 4, left) that the two instrumental observations are the distribution of u around the 1:1 line and that the probability density distribution is consistent. Moreover, v shows a certain angle to the baseline and the sounding’s observation; the sounding’s observation was larger than the LiDAR observation when the wind was southerly, and the sounding’s observation was smaller than the LiDAR observation when the wind was northerly. The probability density was more concentrated around 0 m/s.
The QQ plots of wind direction and wind speed show (Figure 4 right) that the distributions of wind speed and wind direction observed by both instruments coincide more perfectly around the 1:1 line. The CDWL wind direction probability density distribution is, overall, around 10° smaller than the soundings’ observations. Therefore, errors were calculated for the wind directions of −9.69°, −9.96°, and −14.44° for CDWL and GTS soundings during dusty weather, precipitation, and clear skies, respectively. This error occurs because we cannot avoid the fact that the horizontal position of the GTS sounding changes with the increase in altitude in accordance with the wind field. This problem has also existed in previous studies [34].

4. Evaluation of PBLH Inversion Results

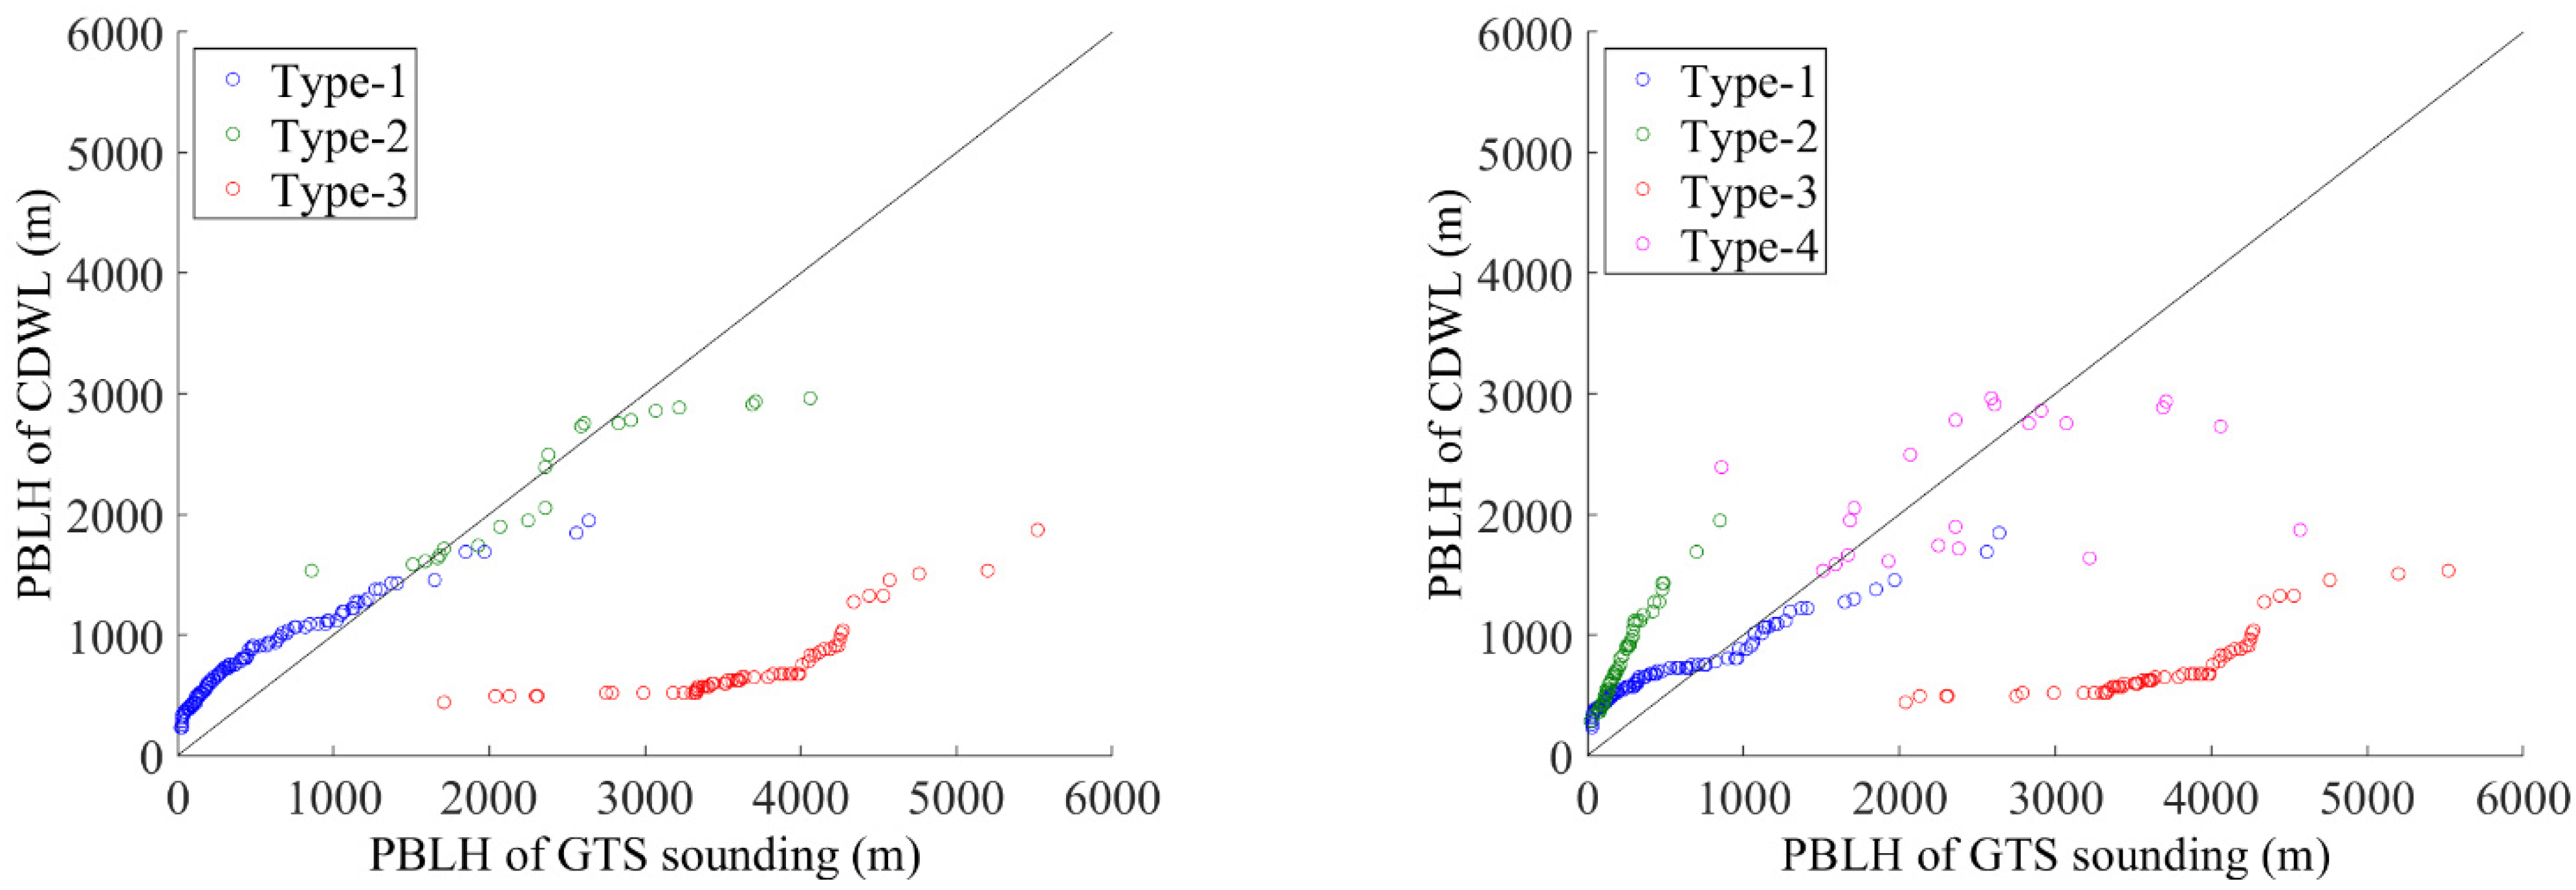
4.1. Analysis of PBLH Clustering Results

PBLH from soundings data via temperature contour inversions were used as the basis for clustering, based on the PBLH from CDWL and GTS sounding inversions from May to August 2021 and the difference between the two. The samples were classified into three and four types, respectively (Figure 5). The QQ plot of the classification results show that the distribution of the PBLH results from the CDWL inversions of Type 1 and Type 2 is closer to that of the sounding inversions when the first classification case is divided into three types. Type 3 shows that the PBLH of CDWL are generally smaller than GTS sounding inversions. The true atmospheric boundary layer heights of the GTS sounding inversions are in the range of 2000–6000 m, with a concentration of around 4000 m, which exceeds the effective detection height of CDWL.
The statistical results of each sample size for the first classification are shown in Table 2. Type 1 and Type 2 had a higher percentage of sample sizes where dusty weather and precipitation occurred, with 54.77% and 47.62% of the categories, respectively. In contrast, Type 3 had the largest proportion of results with clear-sky days, at 70.49%. PBLH in Type 1 was mainly concentrated below 2000 m, and most of the results were recorded at 8:00 am, accounting for 77.27% of the results of Type 1. The overall height of Type 2 was between 2000 and 4000 m, with a higher percentage, 88.89%, at 20:00. Almost all of the results for Type 3 were inversions from 20:00.
The PBLH of Type 1 was low overall, with a high proportion of cases occurring at 8:00 and during dusty weather. The PBLH of Type 2 was higher, mainly concentrated in the afternoon during dusty weather and when PBLH development was more vigorous. Type 3 accounted mainly for when PBLH development exceeded the effective height for CDWL detection, and this occurred more often in the late afternoon on clear-sky days.
The results of the second classification case in four types are similar to but different from the case in the three types. The QQ plot of the results of the four classification types shows that Type 1 and Type 4, with a better distribution, are similar to the results of Type 1 and Type 3 when classified into three types. Type 3, with an overall low PBLH from CDWL, is identical to the results of the three types. The difference is that Type 2 of the GTS soundings’ inversion of PBLH is also clustered as a whole below 1000 m, and the CDWL inversion is higher than that of the GTS soundings.
Combining the analysis of weather conditions and observation times after classification (Table 3), the characteristics of each type of PBLH were evident in different weather conditions or in the time of the day.
Combining the statistical results of the two classifications, it can be found that dusty weather often occurs when the PBLH inversions of the two are close to each other. When there is a clear-sky day, the surface can receive more solar shortwave radiation and the atmospheric boundary layer develops more vigorously, usually to heights above 4000 m; however, it is often beyond the effective and ineffective detection height of CDWL. Similarly, the PBLH in desert areas is very low before sunrise—below the minimum height for the PBLH inversion by CDWL. This provides the basis for the subsequent analysis of the PBLH inversion results in this study. For example, the analysis can be carried out for different weather types or within the effective height range.

4.2. Evaluation of PBLH Inversion Results

In order to give a comprehensive assessment of the PBLH inversion by CDWL, the samples in the effective height range were divided into three weather types—dust (D), precipitation (P) and clear skies (S)—based on the analysis of the results of the clustering in Section 3.1, and the PBLHs were compared separately (see Section 4.2.1.). The PBLHs were also compared separately for the two times of the day 8:00 and 20:00 (representing day and night, respectively). The inversions are shown in Section 4.2.2.

4.2.1. Evaluation of PBLH Inversion Results for Different Weather Types

In the QQ plot (Figure 6), which divides the samples in the effective height range into three weather types—dust (D), precipitation (P), and clear skies (S)—the PBLH distribution was closer to the 1:1 baseline for dusty weather, followed by the inversion results for precipitation, and again for clear skies. The probability density distribution graph shows that the PBLH is usually below 1000 m. Below 1000 m, the results of the CDWL inversions were higher than those of the GTS soundings for all three weather types, and the difference was more obvious for clear-sky days.
In order to quantify the effect of the PBLH inversions for the different weather types in the effective height range, a linear fit of the CDWL and GTS sounding inversions of the PBLH under different weather conditions was distributed (Figure 7). It is clear that the PBLH inversions for dust and precipitation were better than those for clear weather. The coefficients of determination R2 were 0.7666 and 0.6906 for dust and precipitation, respectively, and was 0.4926 for clear skies; the PBLH distributions for all three weather conditions passed the significance test (p < 0.001). The values of R2 are consistent in magnitude compared to past studies [30].

4.2.2. Evaluation of PBLH Inversion Results for Different Observation Times during Dusty and Precipitation Days

Figure 8 shows the correlation between the CDWL and GTS sounding inversions of the PBLH at 08:00 and 20:00 during dusty and precipitation days. The test samples were screened for the effective height of the CDWL inversion of the PBLH. The time around sunrise is represented by 8:00, when the PBLH is low and the observations within the effective height range are mainly concentrated below 1000 m, with an R2 of 0.5165, which passes the significance test (p < 0.01). The time when the PBLH has developed and accumulated over the day is represented by 20:00. The inversion of the PBLH (Figure 8b) within the effective height range was a better fit with an R2 of 0.8977, which passes the significance test (p < 0.001). The inversion of PBLH by CDWL has been effective in the past [10,30]. The inversion effect of this study on PBLH within the effective inversion height in the desert area is similar to the above study, which also proves the inversion ability of CDWL on the PBLH within the effective height, especially at 20:00.
In combination with the above analysis, we can obtain PBLH results very close to the true value through CDWL when the actual PBLH is within the effective height of the PBLH inversion by CDWL.

5. Discussion

Our comparison and analysis of the accuracy of CDWL observations in this particular region on the northern edge of the Tibetan plateau, where no similar studies have been carried out in the past, show that CDWL is suitable for the accurate observation of wind fields in this region under a variety of weather conditions; moreover, it is also efficient for the acquisition of the PBLH within the effective inversion height.
The detection of wind fields by CDWL is already a relatively mature observation technique. The advantages of this instrument are its large scanning volume, its mobility, and the fact that it provides three-dimensional wind measurements, as well as its relatively high temporal and spatial resolution compared to other measurement devices [36]. In the past, a wind profile radar was used to monitor a variety of weather processes and collect 3D wind field data. Typically, for urban air pollution in Beijing [8] and Binzhou [27], for the monitoring of Typhoon Lekima [32], and for Xiamen on clear and precipitation days [34], it showed good results in terms of wind direction and speed compared with sounding observations. The results of this study, using CDWL for wind field observation in the desert region, are similar to those of the previous studies mentioned above, and both R2 and RMSE are consistent in magnitude, which confirms that the CDWL used in this study is suitable for wind field detection in this region. The inversion of the PBLH using CDWL data is also a research direction that has been carried out more frequently. The inversion of the PBLH for Hefei city [10,14], Xilingol, Inner Mongolia [30], the seaside city of Xiamen [34], and an ocean island site in China [37] has been effective in the past. The inversion effect of this study on the PBLH within the effective inversion height in the desert area is similar to the above study, which also proves the inversion ability of CDWL on the PBLH within the effective height, especially during dusty weather.
In the meantime, we would like to analyze the inversion of the CDWL on the PBLH by means of an actual example of a dust event. Figure 9 shows a day of four GTS sounding inversions of the PBLH (02:00, 08:00, 14:00, 20:00) and the CDWL continuum inversions of the PBLH, where the full range of samples for the time period is shown, including samples that do not meet the valid inversion height of the CDWL. A correlation analysis for 02:00 and 14:00 was not performed in Section 4.2.2 because the regular GTS soundings only had two moments per day, 08:00 and 20:00, and only in July was an encrypted sounding experiment conducted to add two more moments, 2:00 and 4:00. However, the sample size was still less than 30, which was not enough to complete the correlation analysis. Nevertheless, for this study, 02:00 and 14:00 are also noteworthy moments. The individual case of dusty weather occurred on 17–20 July (Figure 9). The CDWL and GTS sounding inversions of the PBLH for this process showed a continuous elevation of the PBLH during clear-sky days prior to the onset of the dust storm process. It is clear to see that the PBLH inversion results at the time of the dust event are due both before and after the dust event. Moreover, the PBLH inversion results at 02:00 and 14:00 are overall better than 20:00 for PBLH. The heating effect of solar radiation, which is directly absorbed by the surface on clear-sky days when the atmosphere is dry and clean, causes the convective boundary layer to accumulate and thicken. When a dust storm occurs, there is a significant decrease in PBLH during the daytime and an increase in PBLH at night compared to sunny days. The decrease in the difference in the daily variation in the PBLH is due to the fact that the dust aerosols floating in the atmosphere block the solar radiation from reaching the surface and the surface heating atmospheric effect is weakened, which suppresses the elevation of PBLH during the daytime. Furthermore, the relatively stable atmosphere during the maintenance of floating dusty weather allows the residual layer to be maintained at a certain height during the night. When the atmospheric dust aerosols dissipate and the atmosphere returns to a dry and clean state, the daytime PBLH is developed again, and the daily variation in the PBLH varies significantly.
The limitation of this study is that, compared with other regions, the effect becomes worse when the effective inversion range of CDWL is exceeded because the PBLH is lower at night and lifts higher during midday hours in desert areas. This is due to the rapid absorption of solar short-wave radiation and the warming of the subsurface in the desert region during clear days; moreover, the atmosphere is subject to surface heating and turbulence, which may make the PBLH develop vigorously in the late afternoon. At night, the PBLH decreases to a lower altitude due to the thin atmospheric aerosol and excessively dry air in the desert area, as well as the rapid cooling of the surface and the large temperature difference formed during the day [38]. This may be the reason why the actual PBLH exceeds the effective inversion height of CDWL. Moreover, the release time of the GTS sounding used for the validation of the PBLH in this study is limited, and, to address this limitation and dilemma, we suggest increasing the number of daily sounding experiments in the next experimental design. In future experiments, to compensate for the shortcomings of the CDWL, the use of microwave wave radar and combined radar technology is proposed, such as, for example, a combination of microwave wave radar and LiDAR. In turn, a more comprehensive and better detection of the area will be carried out.

6. Conclusions

In this paper, ground-based CDWL data from two stations were collected over a 4-month period in 2021. The two stations were the MF station located at Minfeng County and the YYK observation station located at Yeyik Township, Minfeng County, on the northern side of the Tibetan plateau on the southern margin of the Taklimakan Desert. We also cooperated with the GTS sounding observation experiment in the same period, from the Minfeng County National Basic Meteorological Observatory. In order to verify the accuracy of the CDWL observations and analyze the applicability of CDWL monitoring in the Minfeng area, the wind field PBLH observed by CDWL and GTS sounding data were compared and analyzed. The results show that:
(1) CDWL has good applicability for wind field observations in dust storm, floating dust, and clear-sky conditions, and that it is superior to the v wind field for the real measurements of u wind fields;
(2) The results of the cluster analysis for the PBLH inversion show that, when the PBLH inversion results were good, dusty weather accounted for more than the other weather types, at approximately 50–70%, with more samples observed at 08:00. When the PBLH inversion results were not good, clear-sky weather accounted for a higher percentage, with more samples at 20:00. Limited by the effective observation height of CDWL, when the boundary layer developed vigorously during clear-sky days, the PBLH exceeded the highest effective detection height of CDWL. Therefore, this part of the data showed an overall underestimation;
(3) Within the effective inversion height of the PBLH by CDWL, the inversion of the PBLH for dusty weather and precipitation is better than that for sunny days. The inversion of the PBLH at 20:00 is better than that at 08:00, and both passed the significance test.

Author Contributions

Conceptualization, M.S. and A.M.; methodology, M.S. and A.A.; software, M.S. and Y.W.; validation, A.M., A.A. and J.G.; formal analysis, J.G.; investigation, Y.W.; resources, Y.W.; data curation, M.S.; writing—original draft preparation, M.S.; writing—review and editing, M.S.; visualization, M.S.; supervision, A.M. and F.Y.; project administration, C.Z. and W.H.; funding acquisition, C.W. and B.W. All authors have read and agreed to the published version of the manuscript.

Funding

This work was supported by the China Desert Meteorological Research Fund (Sqj2021007); Special funds for basic scientific research business expenses of central-level public welfare scientific research institutes (IDM2021001) and National Natural Science Foundation of China (41875023, 42030612).

Data Availability Statement

The data used in this paper can be provided by A.M. (ail@idm.cn) upon request.

Acknowledgments

The authors would like to acknowledge the GTS sounding data support of Minfeng County Meteorological Bureau, Hotan.

Conflicts of Interest

The authors declare no conflict of interest.

References

  1. Qian, W.; Quan, L.; Shi, S. Variations of the Dust Storm in China and its Climatic Control. J. Clim. 2002, 10, 1216–1229. [Google Scholar] [CrossRef]
  2. Adams, J.W.; Rodriguez, D.; Cox, R.A. The uptake of SO2 on Saharan dust: A flow tube study. Atmos. Chem. Phys. Discuss. 2005, 5, 2679–2689. [Google Scholar] [CrossRef] [Green Version]
  3. Brunekreef, B.; Forsberg, B. Epidemiological evidence of effects of coarse airborne particles on health. Eur. Respir. J. 2005, 26, 309–318. [Google Scholar] [CrossRef]
  4. Zakey, A.S.; Solmon, F.; Giorgi, F. Development and testing of a desert dust module in a regional climate model. Atmos. Chem. Phys. 2006, 6, 4687–4704. [Google Scholar] [CrossRef] [Green Version]
  5. Wang, Y.; Zhuang, G.; Tang, A.; Zhang, W.; Sun, Y.; Wang, Z.; An, Z. The evolution of chemical components of aerosols at five monitoring sites of China during dust storms. Atmos. Environ. 2007, 41, 1091–1106. [Google Scholar] [CrossRef]
  6. Du, W.; Xin, J.; Wang, M.; Gao, Q.; Wang, Y. Photometric measurements of spring aerosol optical properties in dust and non-dust periods in China. Atmos. Environ. 2011, 42, 7981–7987. [Google Scholar] [CrossRef]
  7. Zhang, Z.G.; Jiao, M.Y.; Bi, B.G.; Zhao, L.N.; Gao, Q.X.; Guo, J.H.; Ren, Z.H. Analysis of the Heavy Polluting Effects of Sand Dust Weather in Beijing. Res. Environ. Sci. 2009, 22, 309–314. [Google Scholar] [CrossRef]
  8. Dai, L.; Xin, J.; Zuo, H.; Ma, Y.; Zhang, L.; Wu, X.; Ma, Y.; Jia, D.; Wu, F. Multilevel Validation of Doppler Wind Lidar by the 325 m Meteorological Tower in the Planetary Boundary Layer of Beijing. Atmosphere 2020, 11, 1051. [Google Scholar] [CrossRef]
  9. Zhai, X.; Wu, S.; Liu, B. Doppler lidar investigation of wind turbine wake characteristics and atmospheric turbulence under different surface roughness. Opt. Express 2017, 25, A515–A529. [Google Scholar] [CrossRef] [PubMed]
  10. Jiang, P.; Yuan, J.; Wu, K.; Wang, L.; Xia, H. Turbulence Detection in the Atmospheric Boundary Layer Using Coherent Doppler Wind Lidar and Microwave Radiometer. Remote Sens. 2022, 14, 2951. [Google Scholar] [CrossRef]
  11. Dai, G.; Wu, S.; Song, X.; Liu, L. Optical and Geometrical Properties of Cirrus Clouds over the Tibetan Plateau Measured by LiDAR and Radiosonde Soundings during the Summertime in 2014. Remote Sens. 2019, 11, 302. [Google Scholar] [CrossRef] [Green Version]
  12. Zhang, Y.; Zheng, Y.; Tan, W.; Guo, P.; Xu, Q.; Chen, S.; Lin, R.; Chen, S.; Chen, H. Two Practical Methods to Retrieve Aerosol Optical Properties from Coherent Doppler Lidar. Remote Sens. 2022, 14, 2700. [Google Scholar] [CrossRef]
  13. Chen, W.; Kuze, H.; Uchiyama, A.; Suzuki, Y.; Takeuchi, N. One-year observation of urban mixed layer characteristics at Tsukuba, Japan using a micro pulse lidar. Atmos. Environ. 2001, 35, 4273–4280. [Google Scholar] [CrossRef]
  14. Wang, C.; Jia, M.; Xia, H.; Wu, Y.; Wei, T.; Shang, X.; Yang, C.; Xue, X.; Dou, X. Relationship analysis of PM2.5 and boundary layer height using an aerosol and turbulence detection lidar. Atmos. Meas. Tech. 2019, 12, 3303–3315. [Google Scholar] [CrossRef] [Green Version]
  15. Kim, S.W.; Yoon, S.C.; Kim, J.; Kang, J.Y.; Sugimoto, N. Asian dust event observed in seoul, korea, during 29-31 may 2008: Analysis of transport and vertical distribution of dust particles from lidar and surface measurements. Sci. Total Environ. 2010, 408, 1707–1718. [Google Scholar] [CrossRef] [PubMed]
  16. Liu, D.; Qi, F.D.; Jin, C.J.; Yue, G.M.; Zhou, J. Polarization Lidar Observations of Cirrus Clouds and Asian Dust Aerosols over Hefei. Chin. J. Atmos. Sci. 2003, 6, 1093–1100. [Google Scholar] [CrossRef]
  17. Xie, C.; Nishizawa, T.; Sugimoto, N.; Matsui, I.; Wang, Z. Characteristics of aerosol optical properties in pollution and Asian dust episodes over Beijing, China. Appl. Opt. 2008, 47, 4945–4951. [Google Scholar] [CrossRef]
  18. Dong, X.H.; Qi, H.; Ren, L.J.; Wang, Y.P.; Di, Y.A.; Sugimoto, N.; Sakmoto, K.; Wang, Q.Y. Application and Data Demonstration of Lidar in Sandstorm Observation. Res. Environ. Sci. 2007, 2, 106–111. [Google Scholar] [CrossRef]
  19. Guo, B.J.; Liu, L.; Huang, D.P.; Wang, L.L.; Li, X.L. Analysis of Lidar Measurements from a Dust Event. Meteorol. Mon. 2008, 5, 52–57. [Google Scholar] [CrossRef]
  20. Wang, Y.P.; Chen, Y.; Dong, X.H.; Yin, H.M. Observation of Sand-Dust Weather by Lidar in the Spring of 2005 at Beijing. Chin. J. Spectrosc. Lab. 2008, 25, 33–35. [Google Scholar] [CrossRef]
  21. Yang, T.; Wang, Z.F.; Zhang, B.; Wang, X.Q.; Wang, W.; Gbaguidi, A.; Gong, Y.B. Evaluation of the effect of air pollution control during the Beijing 2008 Olympic Games using Lidar data. Chin. Sci. Bull. 2010, 55, 1311–1316. [Google Scholar] [CrossRef]
  22. Huang, T.; Song, Y.; Hu, W.D.; Guo, B.J. Lidar Detection of a Sand-Dust Process in Dalian, Liaoning, China. J. Desert Res. 2010, 30, 983–988. [Google Scholar]
  23. Fujiwara, C.; Yamashita, K.; Nakanishi, M.; Fujiyoshi, Y. Dust Devil–Like Vortices in an Urban Area Detected by a 3D Scanning Doppler Lidar. J. Appl. Meteorol. Climatol. 2011, 3, 534–547. [Google Scholar] [CrossRef]
  24. Ma, J.H.; Gu, S.Q.; Chen, M.; Shi, H.; Zhang, G.L. Analysis of a dust case using lidar in Shanghai. Acta Ecol. Sin. 2012, 32, 1085–1096. [Google Scholar] [CrossRef] [Green Version]
  25. Chouza, F.; Reitebuch, O.; Groß, S.; Rahm, S.; Freudenthaler, V.; Toledano, C.; Weinzierl, B. Retrieval of aerosol backscatter and extinction from airborne coherent Doppler wind lidar measurements. Atmos. Meas. Tech. 2015, 8, 2909–2926. [Google Scholar] [CrossRef] [Green Version]
  26. Yang, S.; Preißler, J.; Wiegner, M.; von Löwis, S.; Petersen, G.N.; Parks, M.M.; Finger, D.C. Monitoring Dust Events Using Doppler Lidar and Ceilometer in Iceland. Atmosphere 2020, 11, 1294. [Google Scholar] [CrossRef]
  27. Yuan, J.; Wu, Y.; Shu, Z.; Su, L.; Tang, D.; Yang, Y.; Dong, J.; Yu, S.; Zhang, Z.; Xia, H. Real-Time Synchronous 3-D Detection of Air Pollution and Wind Using a Solo Coherent Doppler Wind Lidar. Remote Sens. 2022, 14, 2809. [Google Scholar] [CrossRef]
  28. Wang, X.; Dai, G.; Wu, S.; Sun, K.; Song, X.; Chen, W.; Li, R.; Yin, J.; Wang, X. Retrieval and Calculation of Vertical Aerosol Mass Fluxes by a Coherent Doppler Lidar and a Sun Photometer. Remote Sens. 2021, 13, 3259. [Google Scholar] [CrossRef]
  29. Song, X.; Wang, F.; Yin, J.; Wang, X.; Liu, X.; Ren, H.; Wu, S. Three-Beam Methodology and Observations of Wind Profiling with Doppler Lidar. Period. Ocean Univ. China 2020, 50, 136–144. [Google Scholar] [CrossRef]
  30. Wang, L.; Wei, Q.; Xia, H.; Wei, T.; Yuan, J.; Jiang, P. Robust Solution for Boundary Layer Height Detections with Coherent Doppler Wind Lidar. Adv. Atmos. Sci. 2021, 38, 1920–1928. [Google Scholar] [CrossRef]
  31. Liu, S.; Liang, X. Observed diurnal cycle climatology of planetary boundary layer height. J. Clim. 2010, 23, 5790–5809. [Google Scholar] [CrossRef]
  32. Tang, S.; Guo, Y.; Wang, X.; Tang, J.; Li, T.; Zhao, B.; Zhang, S.; Li, Y. Validation of Doppler Wind Lidar during Super Typhoon Lekima (2019). Front. Earth Sci. 2022, 16, 75–89. [Google Scholar] [CrossRef]
  33. Lin, X.; Wei, Y.; Chen, H.; Wang, Y. The effect assessment of wind field inversion based on WPR in precipitation. J. Appl. Meteor. Sci. 2020, 31, 361–372. [Google Scholar] [CrossRef]
  34. Ren, Y.; Chen, S.; Yu, A.; Fan, M. Reliability Analysis of Wind Field and Boundary Layer Height in Xiamen Retrieved by Coherent Doppler Wind Lidar. J. Arid Meteorol. 2021, 39, 514–523. [Google Scholar] [CrossRef]
  35. Wildmann, N.; Päschke, E.; Roiger, A.; Mallaun, C. Towards improved turbulence estimation with Doppler wind lidar velocity-azimuth display (VAD) scans. Atmos. Meas. Tech. 2020, 13, 4141–4158. [Google Scholar] [CrossRef]
  36. Liu, Z.; Barlow, J.F.; Chan, P.-W.; Fung, J.C.H.; Li, Y.; Ren, C.; Mak, H.W.L.; Ng, E. A Review of Progress and Applications of Pulsed Doppler Wind LiDARs. Remote Sens. 2019, 11, 2522. [Google Scholar] [CrossRef] [Green Version]
  37. Chen, Y.; Jin, X.; Weng, N.; Zhu, W.; Liu, Q.; Chen, J. Simultaneous Extraction of Planetary Boundary-Layer Height and Aerosol Optical Properties from Coherent Doppler Wind Lidar. Sensors 2022, 22, 3412. [Google Scholar] [CrossRef]
  38. Wang, Y.; Sayit, H.; Ali, M.; Zhu, J.; Zhou, C.; Huo, W.; Yang, F.; Yang, X.; Gao, J.; Zhao, X. Evaluation of five planetary boundary layer schemes in WRF over China’s largest semi-fixed desert. Atmos. Res. 2021, 256, 105567. [Google Scholar] [CrossRef]
Figure 1. Location map of field experiment station at northern edge of Tibetan plateau.
Remotesensing 14 05264 g001
Figure 2. Comparison of u, v, wind direction, and wind speed data from CDWL and GTS sounding samples during (a) dusty weather, (b) precipitation, and (c) a clear sky in MF in August 2021. The regression line (red line) and reference line y = x (black line) are also shown.
Remotesensing 14 05264 g002aRemotesensing 14 05264 g002b
Figure 3. Correlation curves of the CDWL observed u and v wind fields with the GTS sounding observations (p > 0.01 does not pass significance test).
Remotesensing 14 05264 g003
Figure 4. Quantile-quantile plot and probability density distribution of u and v wind fields and wind direction and speed from CDWL and GTS soundings’ observations. The regression line (red line) and reference line y = x (black line) are also shown.
Remotesensing 14 05264 g004
Figure 5. Quantile–quantile plot of the inversion of the PBLH of CDWL and GTS soundings after k-means clustering into three (left) and four (right) types.
Remotesensing 14 05264 g005
Figure 6. Quantile–quantile plot and probability density distribution of the PBLH inversions of CDWL and GTS soundings by (a) weather type and (b) overall sample for dust (D), precipitation (P), and clear skies (S).
Remotesensing 14 05264 g006
Figure 7. Comparison of CDWL and GTS sounding PBLH inversion results for (a) dusty weather, (b) precipitation, and (c) clear skies in the effective height range. Also shown is the regression line (red line) and reference line y = x (black line).
Remotesensing 14 05264 g007
Figure 8. Comparison of CDWL and GTS sounding PBLH inversions at (a) 08:00 BJT and (b) 20:00 BJT in the effective altitude range. The regression line (red line) and reference line y = x (black line) are also shown.
Remotesensing 14 05264 g008
Figure 9. PBLH of dusty weather processes and before and after soundings and the CDWL inversions at the MF station.
Remotesensing 14 05264 g009
Table 1. The root mean square error (RMSE) of each element observed by CDWL and GTS sounding for different weather types.
u (m/s)v (m/s)Wind Speed (m/s)Wind Direction (°)
Dusty weather1.181.791.0015.04
Precipitation1.531.901.0513.85
Clear sky1.341.971.4621.09
Table 2. Weather conditions and percentage of observed moments when PBLH inversion results of CDWL and GTS soundings were divided into three types.
Type123
Sample Size1992161
Dust109 (54.77%)10 (47.62%)12 (19.67%)
Precipitation29 (14.57%)5 (23.81%)6 (9.84%)
Clear Sky61 (30.65%)6 (28.57%)43 (70.49%)
Sample Size1541854
8:00199 (77.27%)2 (11.11%)1 (1.85%)
20:0035 (22.73%)16 (88.89%)53 (98.15%)
Table 3. PBLH inversion results of CDWL and GTS soundings by weather conditions and time of the day when divided into four types.
Type1234
Sample Size130705922
Dust89 (68.46%)21 (30.00%)10 (16.95%)13 (59.09%)
Precipitation18 (13.85%)11 (15.71%)6 (10.17%)5 (22.73%)
Clear Sky23 (17.69%)38 (54.29%)43 (72.88%)4 (18.18%)
Sample Size101545219
8:0070 (69.31%)49 (90.74%)0 (0.00%)3 (15.79%)
20:0031 (30.69%)5 (9.26%)52 (100.00%)16 (84.21%)
Publisher’s Note: MDPI stays neutral with regard to jurisdictional claims in published maps and institutional affiliations.

