

SUNS: A User-Friendly Scheme for Seamless and Ubiquitous Navigation Based on an Enhanced Indoor-Outdoor Environmental Awareness Approach

Abstract
:1. Introduction
- An enhanced I/O detector for smartphones with limited power budgets was proposed to achieve reliable environmental detection and maintain low power consumption;
- A seamless indoor-outdoor localization scheme based on extended Kalman filter (EKF) was proposed by leveraging the proposed I/O detection service as an automated handover mechanism. Furthermore, the proposed service is utilized to manage the collection process of crowdsourced data, reduce the cost borne by the user device, and ensure widespread adoption of SUNS.
2. Related Work
2.1. Handover Mechanism Based on Indoor-Outdoor Detection
2.2. Indoor Localization Systems for Ubiquitous Navigation
3. Methods
3.1. System Development
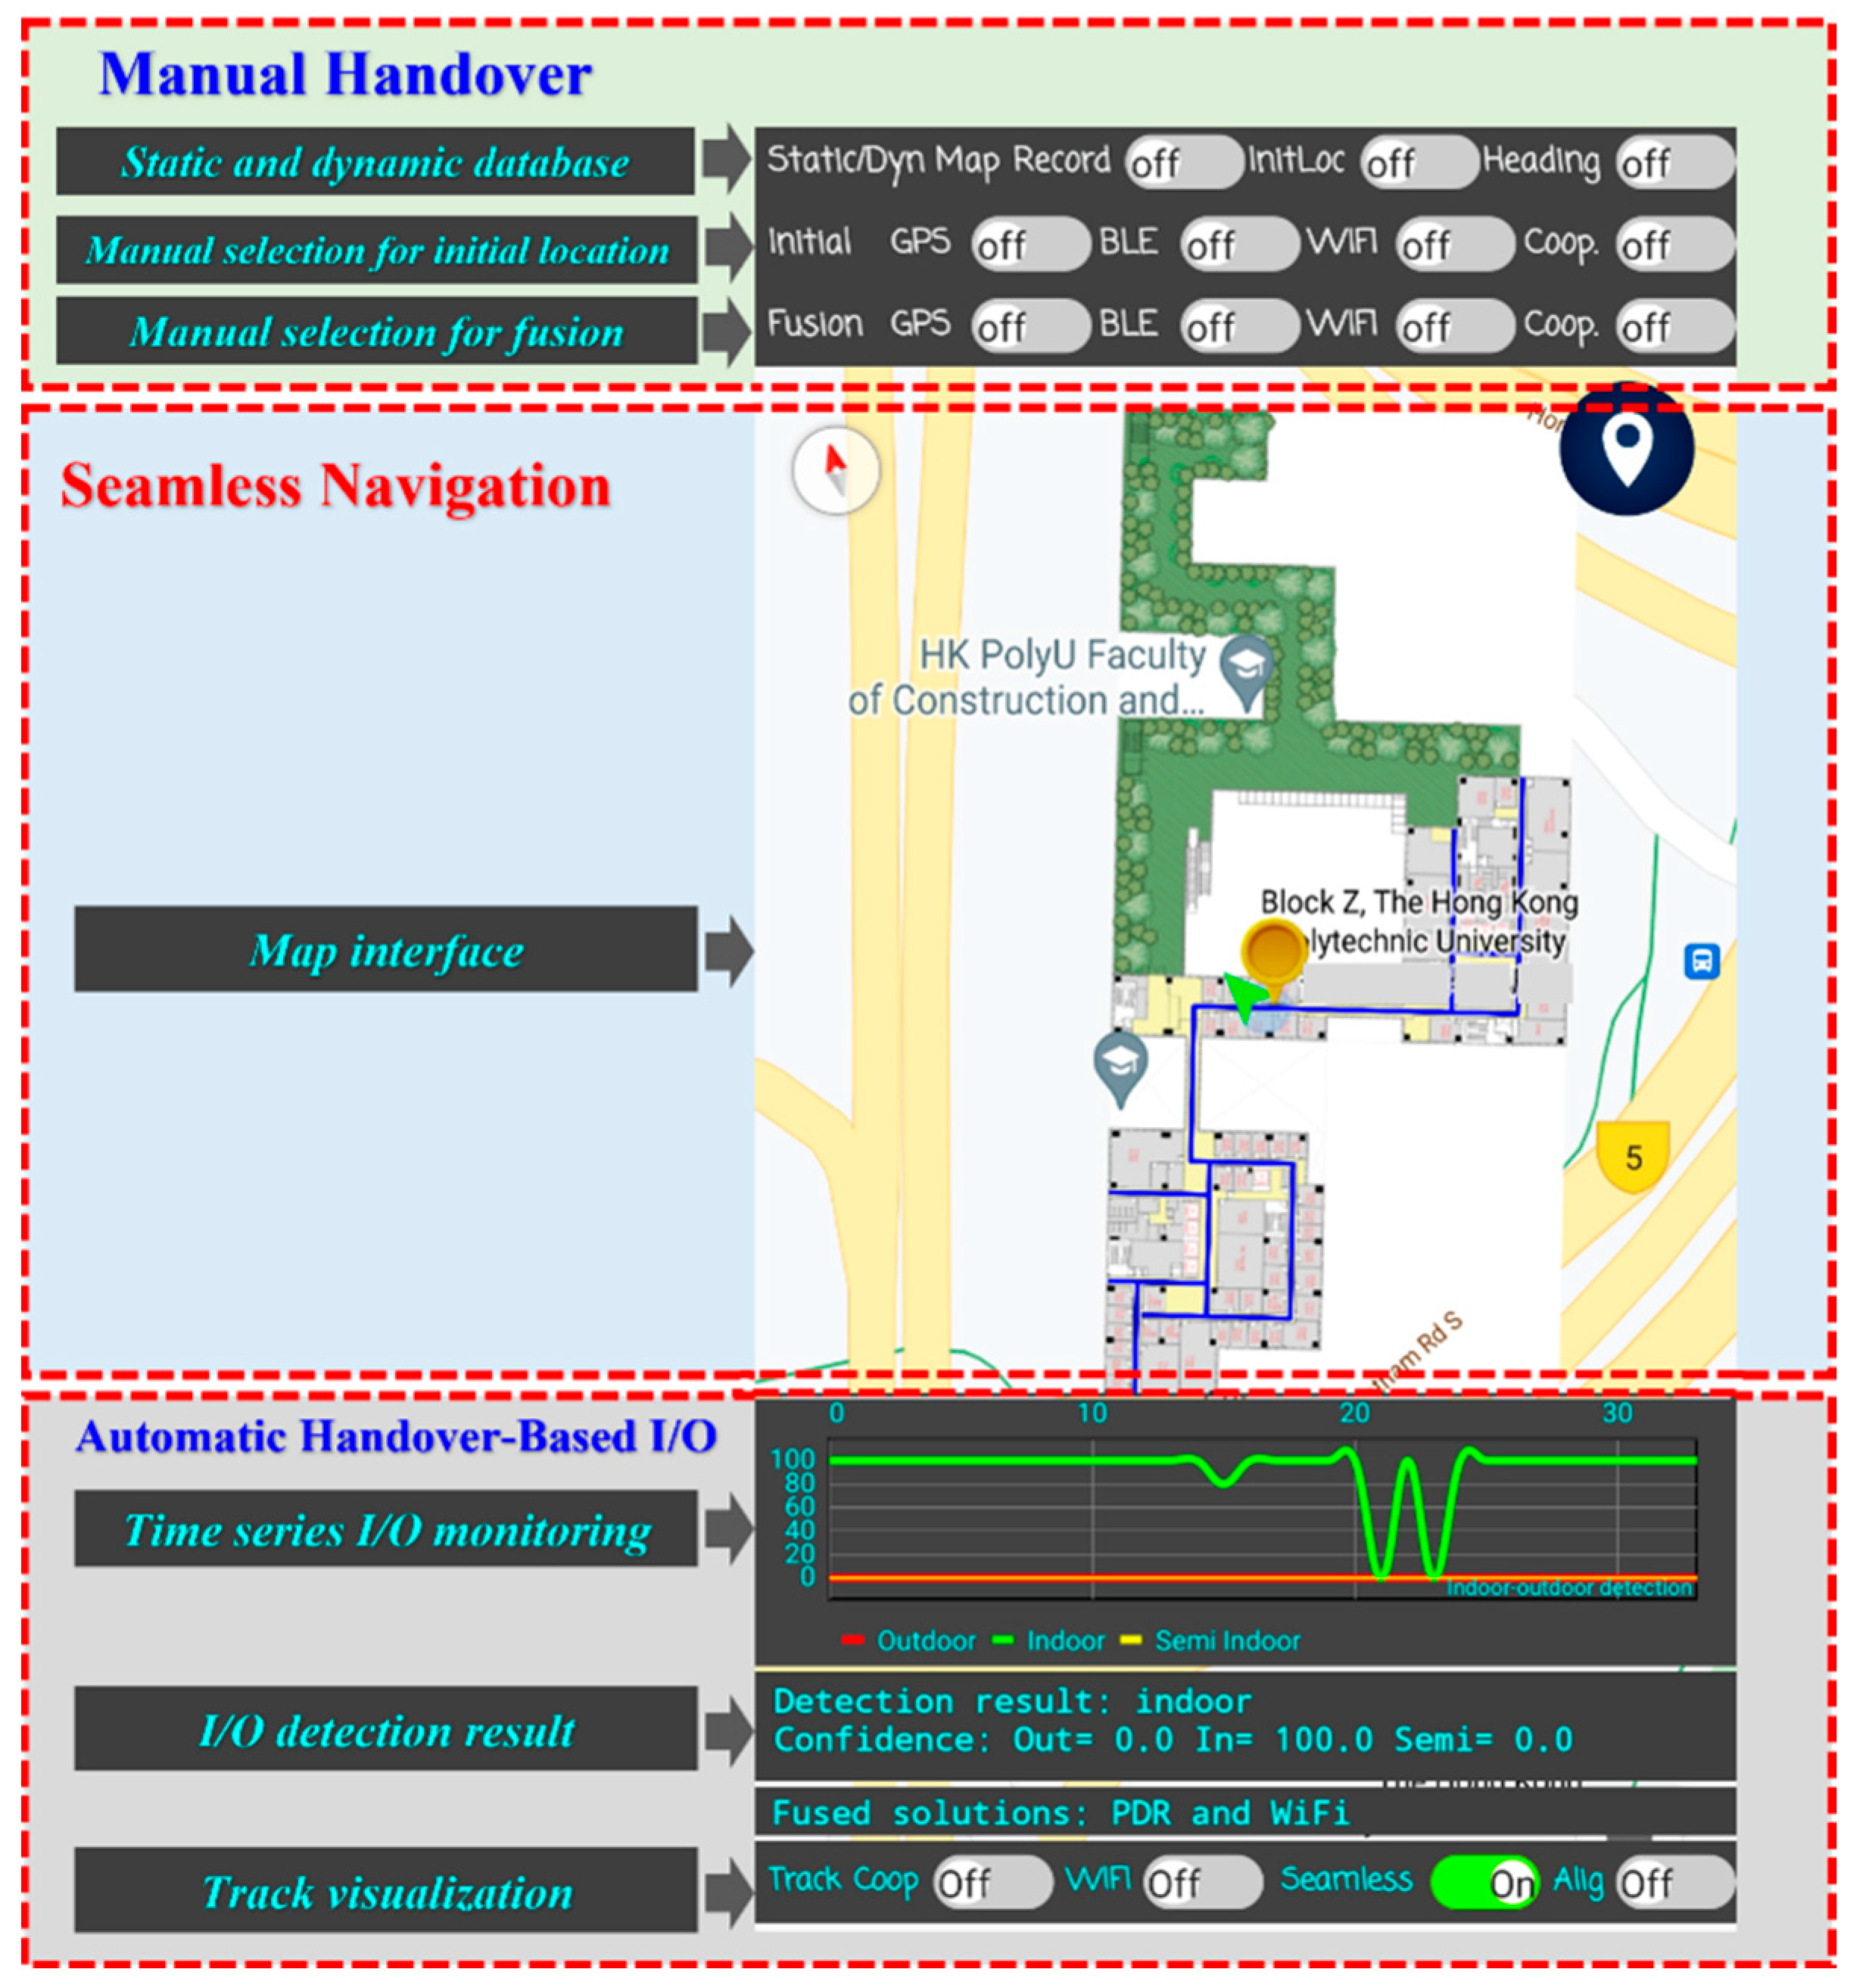
3.2. System Overview
3.3. Initial Position and Heading
3.4. Handover Mechanism Based on Environmental Awareness
3.4.1. Rationale
3.4.2. Utilizing Light Intensity as an I/O Detection Indicator
3.4.3. Utilizing Cellular RSS as an I/O Detection Indicator
3.4.4. Utilizing Magnetic Fields as an I/O Detection Indicator
3.4.5. Utilizing GNSS Measurements as an I/O Detection Indicator
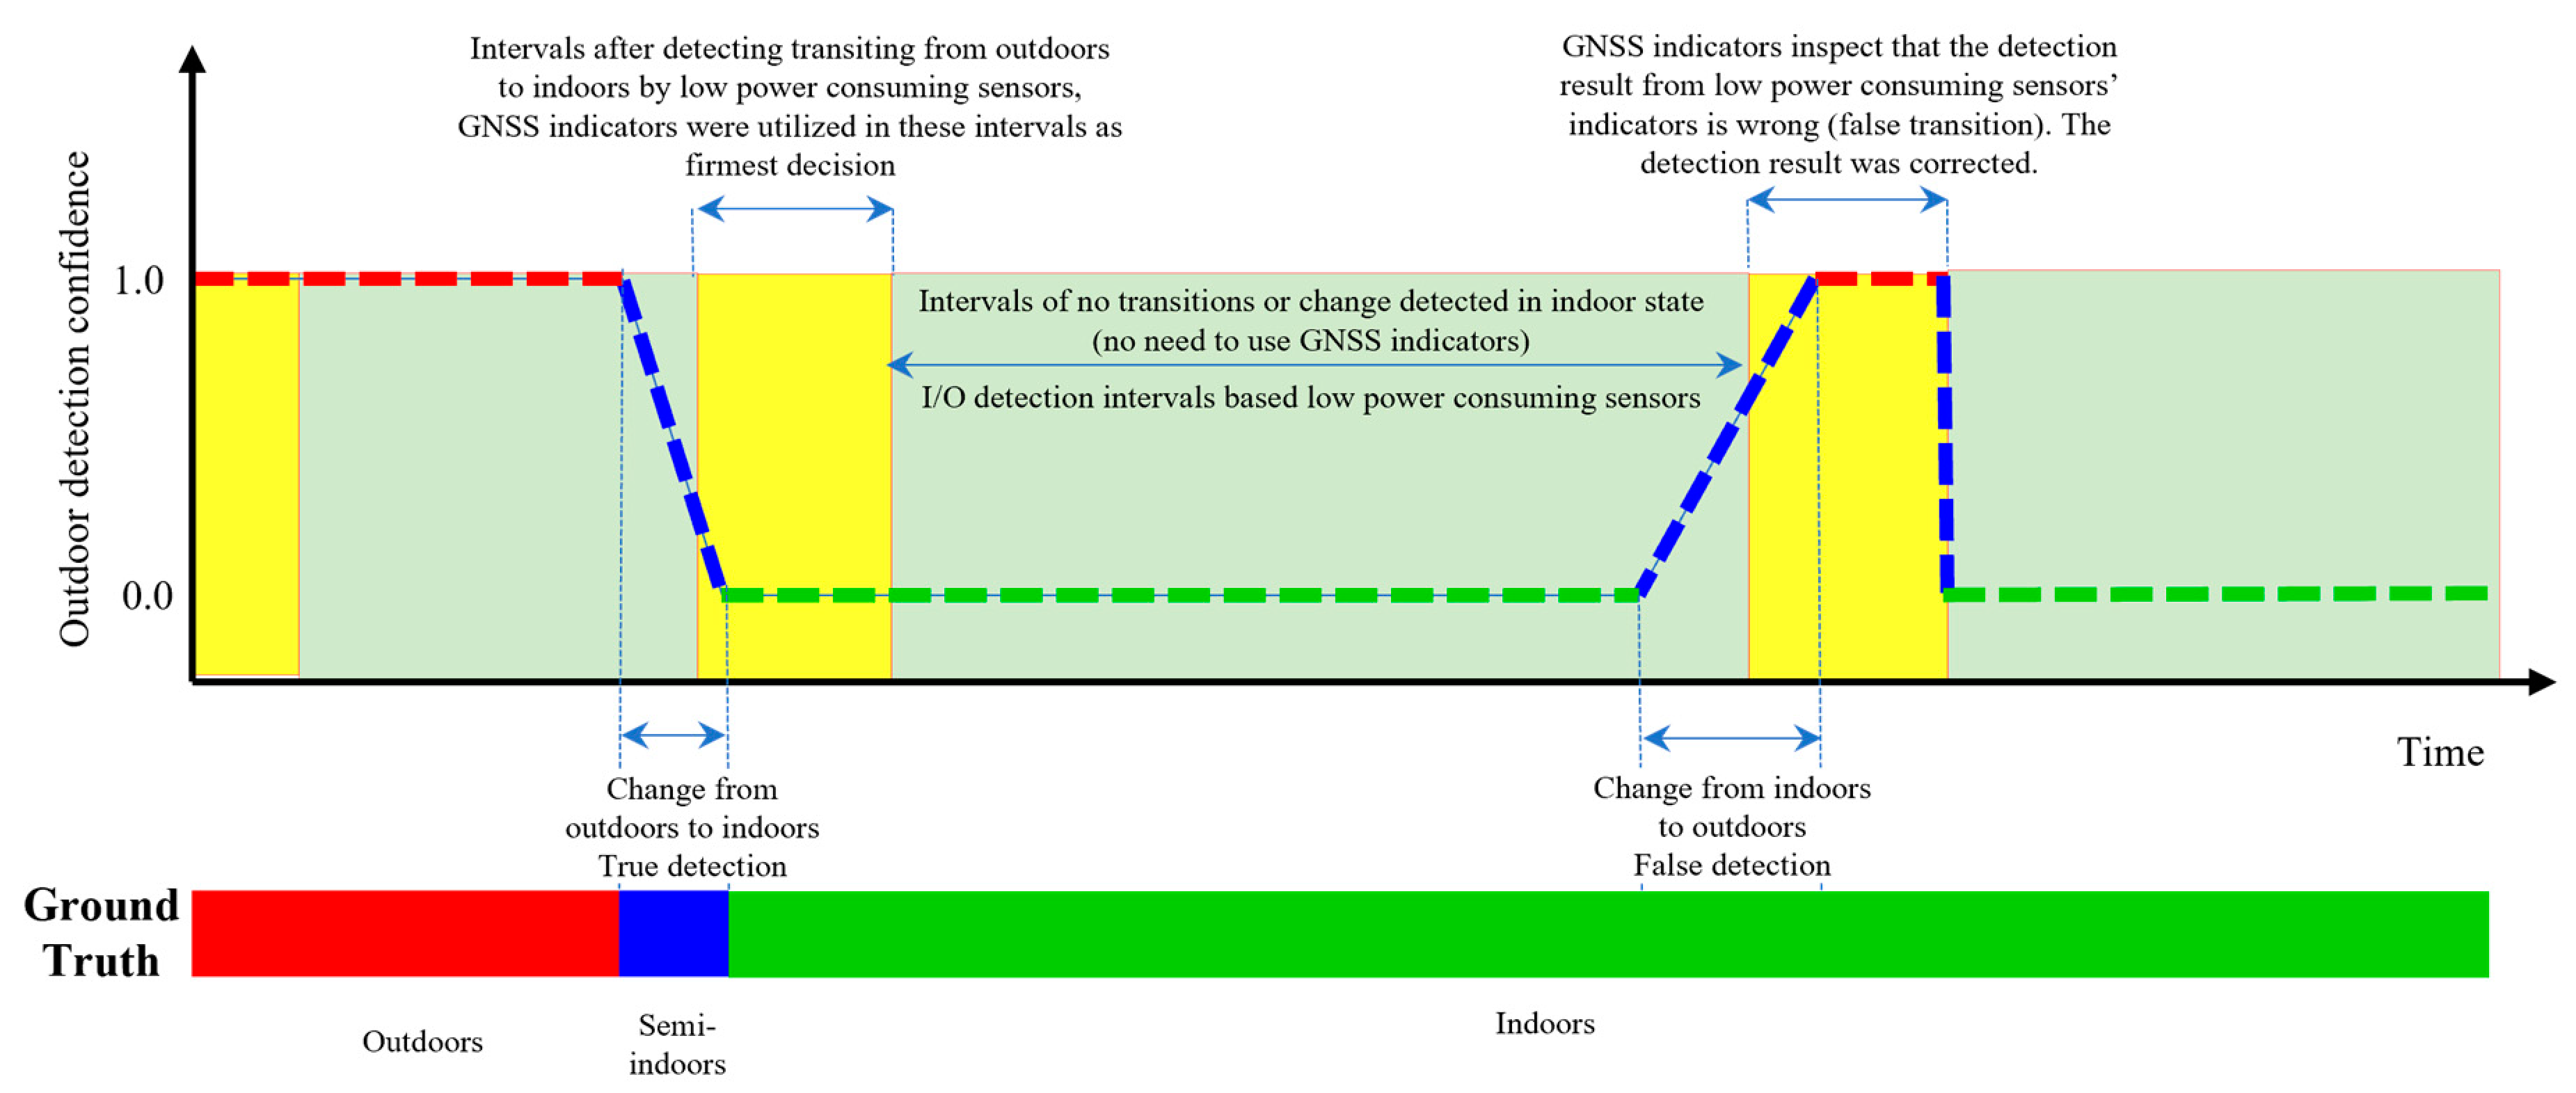
3.4.6. Integration of I/O Indicators
| Algorithm 1: Aggregated I/O decision-based LPCS and GNSS indicators |
 |
 |
| Algorithm 2: Aggregated I/O decision-based LPCS indicators |
 |
3.5. Position Estimation
3.5.1. Position Estimation Based on EKF
3.5.2. Inertial Positioning Based on PDR
3.5.3. Position Estimation in Indoor Environments
- (a)
- Merits of Crowdsourced Data Collection with the Proposed I/O detection Model
- 1-
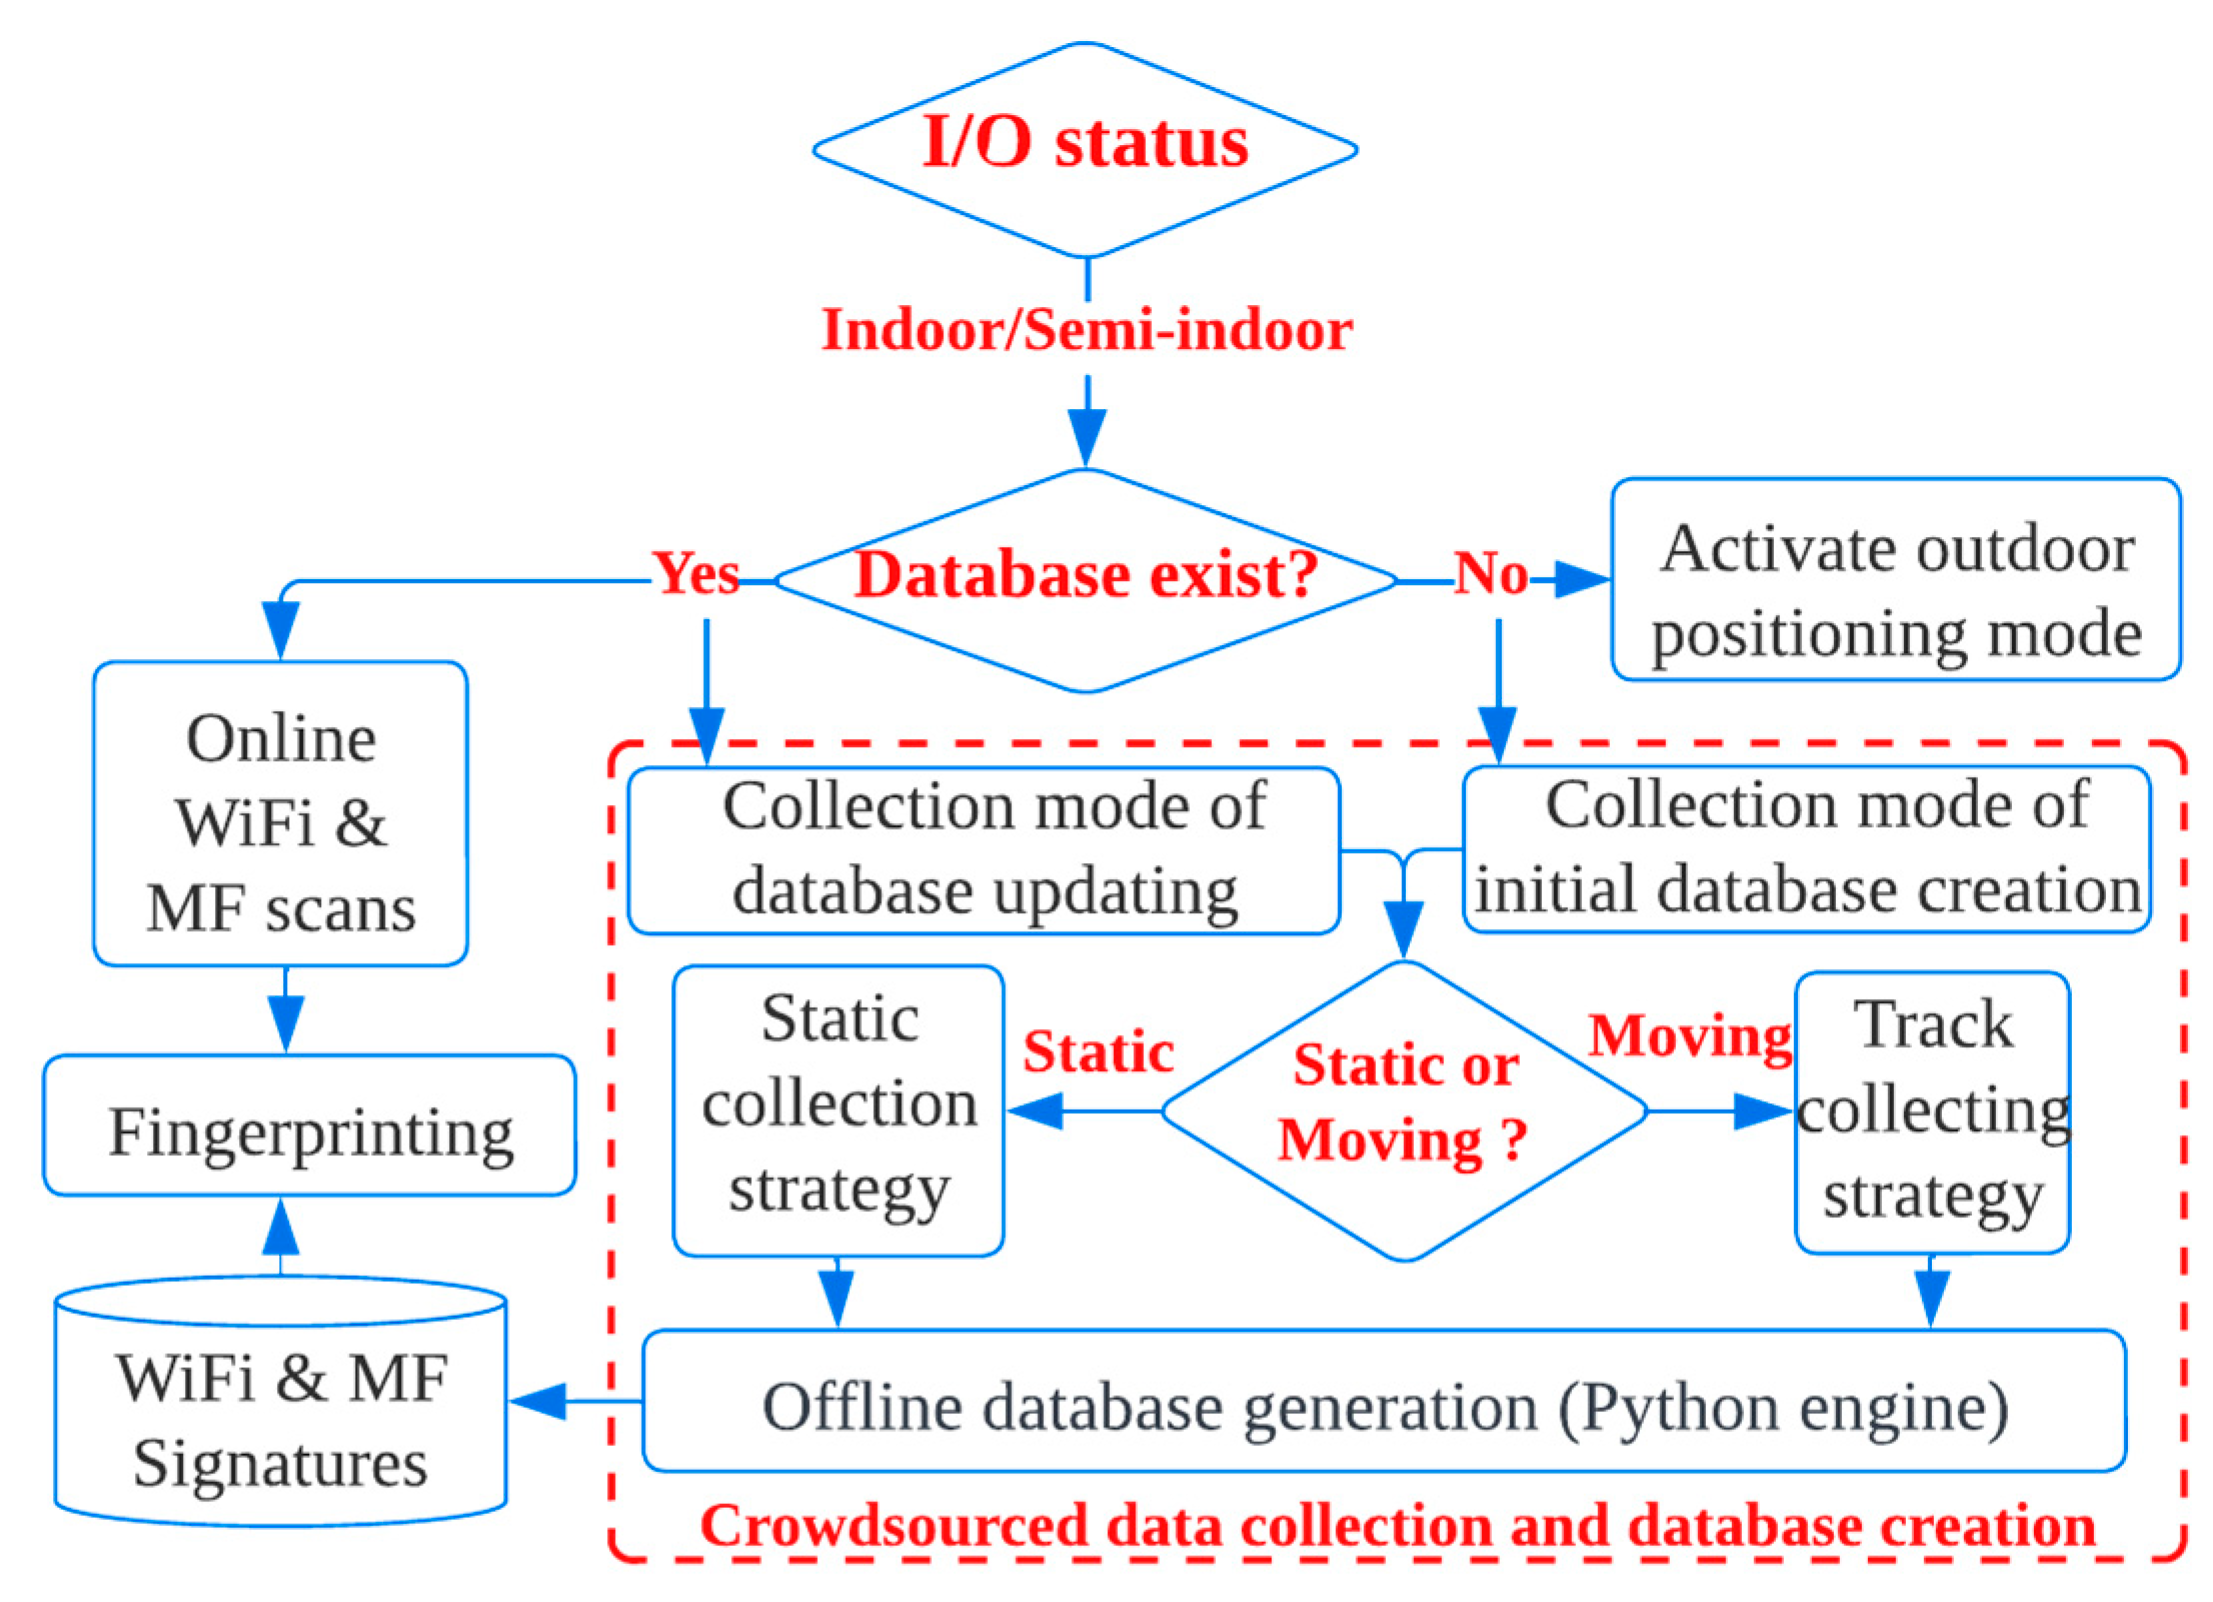
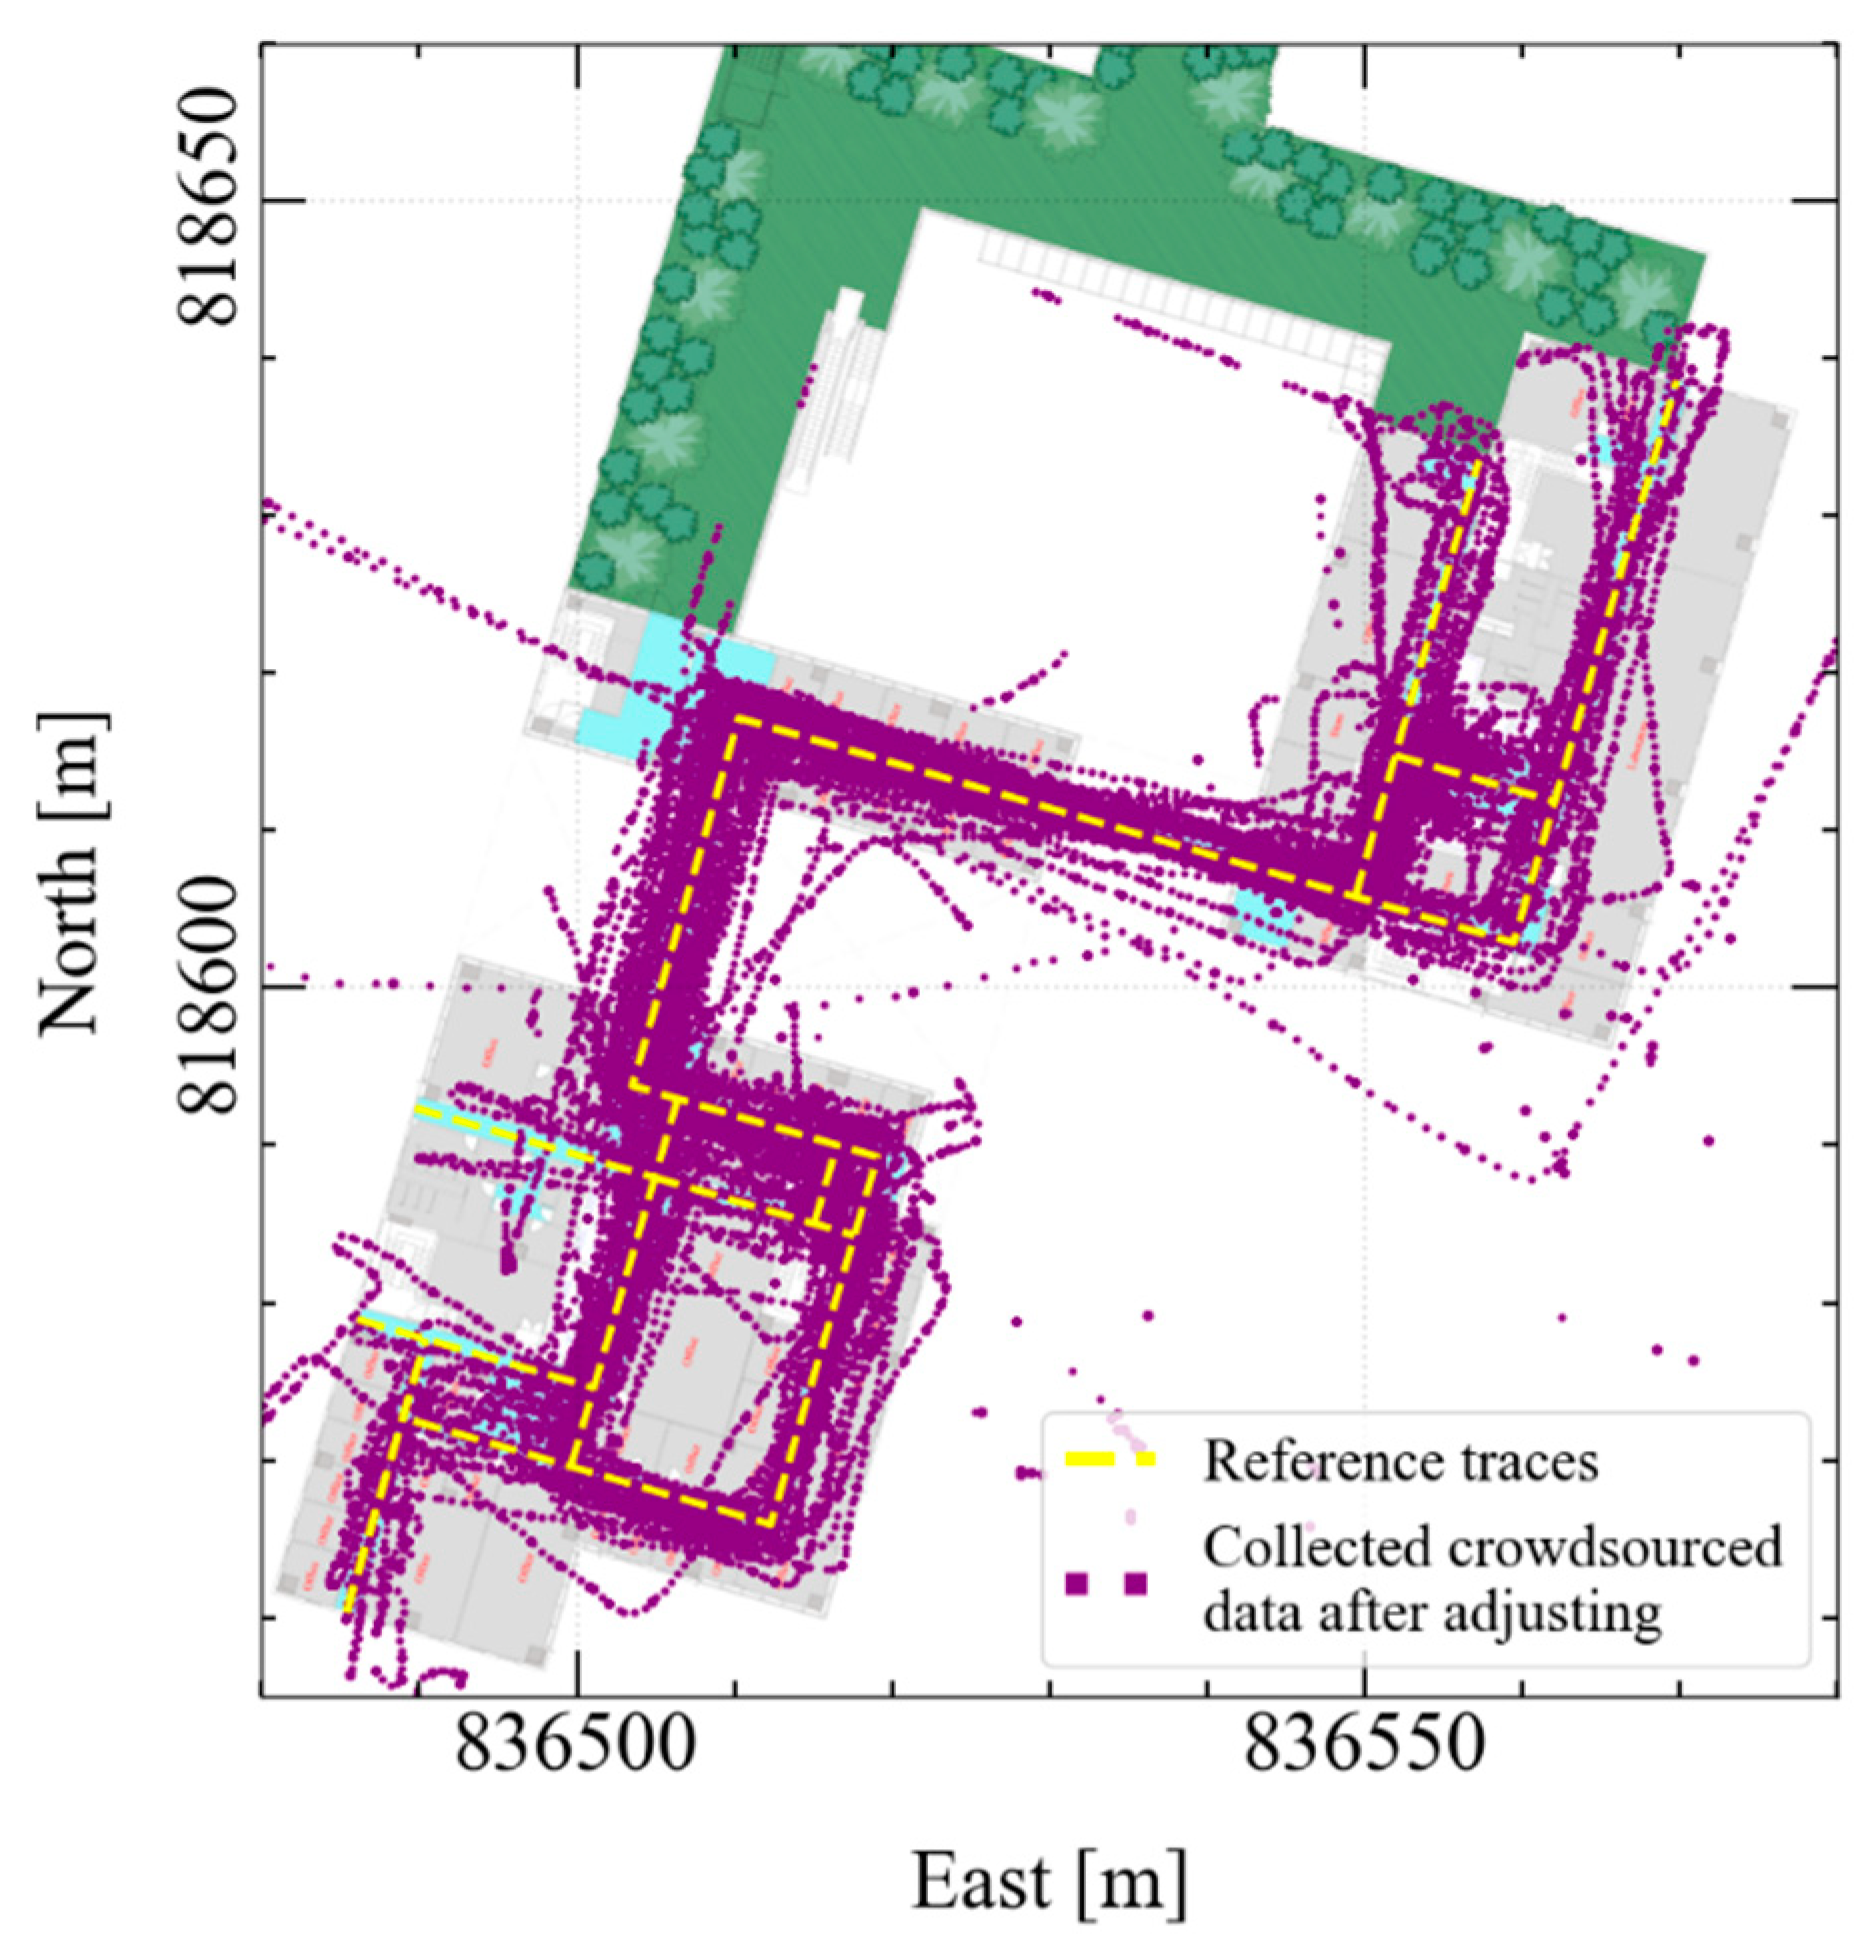
- I/O environmental awareness: Outdoors, the availability of GNSS eliminates the need to collect crowdsourced signatures. In contrast, in indoor areas or when transitioning from indoors to outdoors, owing to the absence of accurate GNSS localization, crowdsourced signatures must be collected to train fingerprint databases; consequently, once the proposed I/O detection service detects indoor or semi-indoor areas, the system activates the collection mode. Distinguishing the type of ambient environment accurately with low power consumption helped curb the collection of crowdsourced data in the required areas. This also helped reduce battery drain by preventing excess outdoor data collection. Notably, data collection was not immediately prevented after transiting from indoors to outdoors. Conversely, the system continued to collect data for a certain period. This period is permitted to detect GNSS observations with high accuracy (e.g., >5.0 m) and a low horizontal dilution of precision (HDOP) (e.g., <20) to act as an anchor node. With capturing anchor nodes, the localization of the collected traces was accordingly adjusted. Figure 7 depicts the impact of I/O discrimination on the overall collected traces after their adjustment, where it can be seen that: (1) the collected traces were densified in the indoor and semi-indoor areas; and (2) although serval traces were walked outdoors (in the garden), I/O discrimination confined data collection in the required areas.
- 2-
- Initial database generation or updating: In indoor environments, furniture layouts, WiFi APs settings, and network updates are likely to undergo frequent changes. Thus, although data for a specific area is collected and the database is already created, data collection should not be discontinued. Conversely, according to the related literature [52,53,54,55], data collection and database updating are frequently required to keep the pace with the frequent changes in indoor environments. Knowing that the equipped area lacks a database (i.e., requires initial generation) or that the database is already created (i.e., requires database updating) is beneficial for the data collection process for the following reason: if a specific area lacks localized signatures, the system collects crowdsourced data with a sampling rate higher than that used for updating to accelerate the initial generation and condense the collected signatures by each RP. Conversely, as long as the database of a certain area has already been trained, collecting excessive data is not required. Instead, only a small amount of data is required to assess any changes in the environment and update the database. Consequently, the subsequent collection was conducted at a lower sampling rate.
- 3-
- User motion mode: Identifying static and dynamic modes can help manage data collection and reduce excess collection in a static state, either for the initial creation or updating. The distinction between stationary and walking modes is usually performed using acceleration data and step detection results. From the perspective of power consumption, an accelerometer is an LPCS. Thus, the sensor used to observe these modes is not a power drainer. The decision based on the walking mode significantly helps to reduce the power consumption arising from excess collection. In static intervals, where a user occupies a fixed geographic position, the continuous collection of signatures for a fixed location does not extend the spatial database coverage; instead, it only measures the signature variation. Therefore, there was no need to collect much data and thus, a low collection rate was considered (i.e., a signature was recorded every 3 min). In contrast, continuous collection in the dynamic mode covers different locations and extends the spatial database coverage. Consequently, crowdsourced data were collected in the walking mode with a sampling rate higher than that of the static mode. In the dynamic mode, the raw inertial sensor data were recorded with a sampling frequency for the accelerometers and magnetometer equal to 50 Hz. A higher sampling frequency equal to 100 Hz was used for the gyroscope to allow for the accurate estimation of angular changes. The WiFi scan interval was 2 to 4 s.
- (b)
- Online Fingerprinting
3.5.4. Position Estimation in Outdoor Environments
4. Experiments, Results, and Evaluations
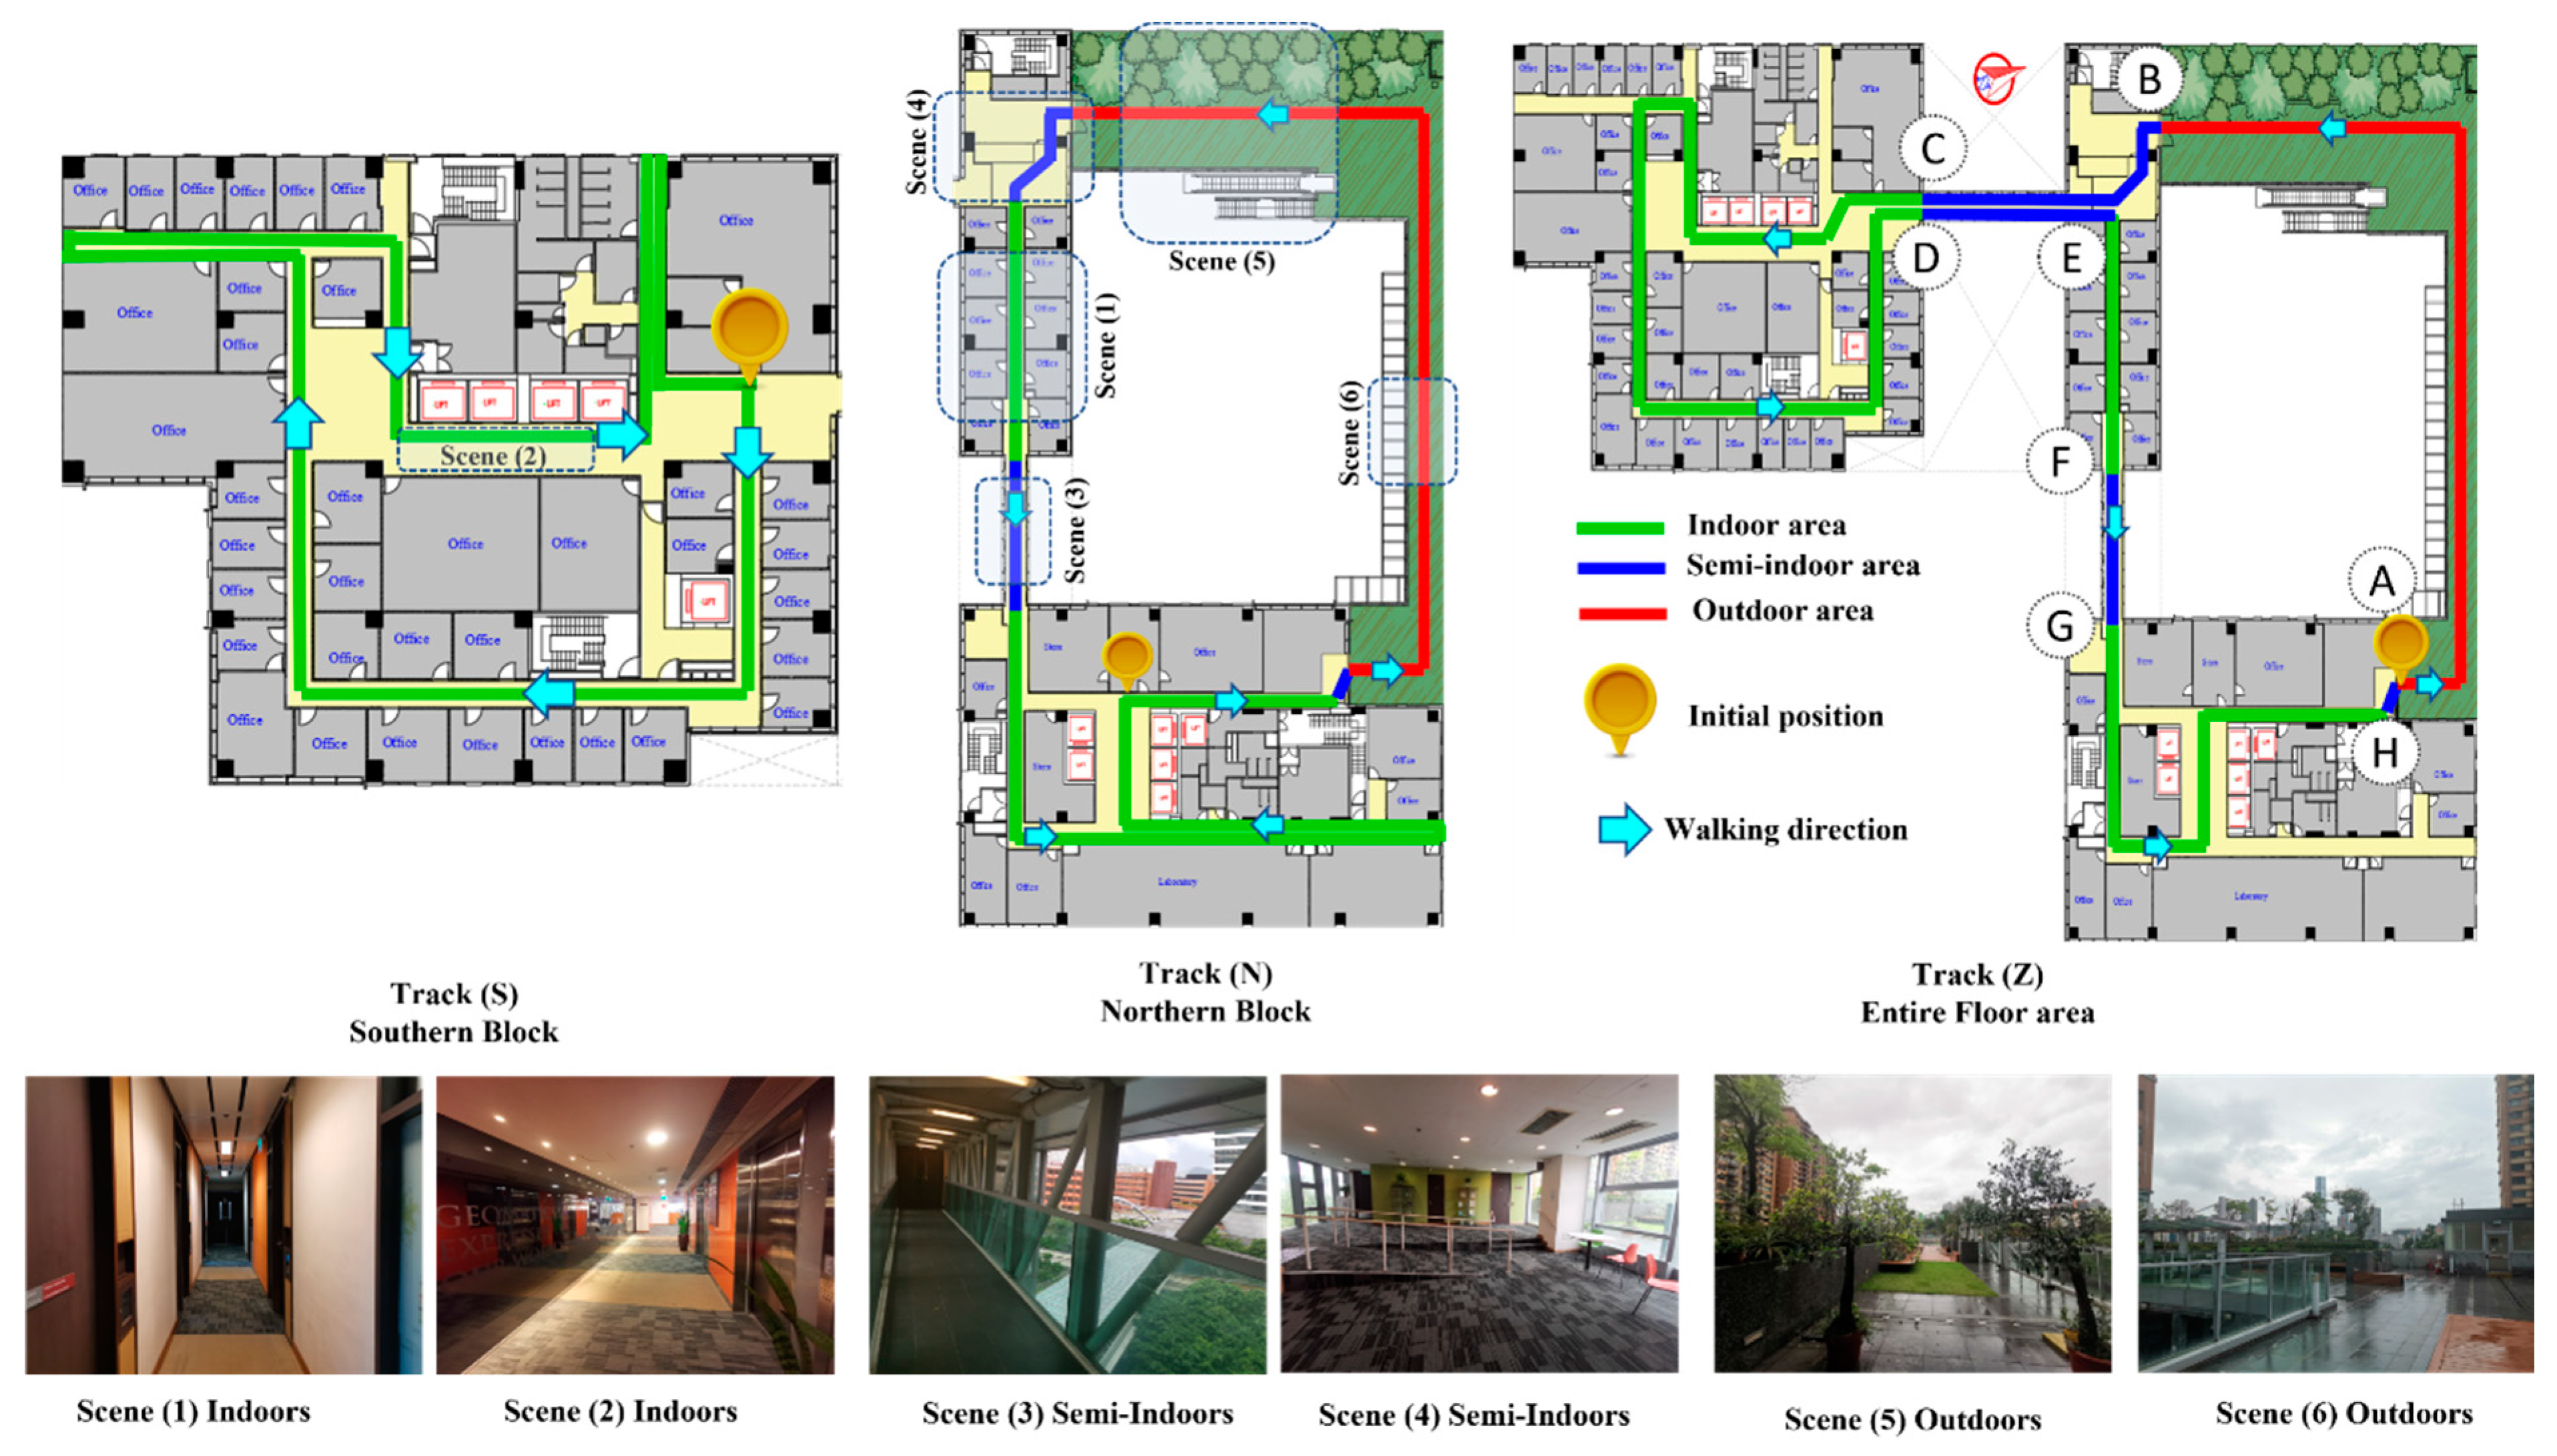
4.1. Test Area
4.2. Evaluation of I/O Detection
4.2.1. Detection Accuracy
4.2.2. Detection Latency
4.2.3. Power Consumption
4.3. Comparison with Existing I/O Detection Studies
4.4. Seamless Positioning Performance
4.5. Computational Complexity
5. Conclusions
Author Contributions
Funding
Conflicts of Interest
References
- Rizos, C.; Yang, L. Background and Recent Advances in the Locata Terrestrial Positioning and Timing Technology. Sensors 2019, 19, 1821. [Google Scholar]
- Kohtake, N.; Morimoto, S.; Kogure, S.; Manandhar, D. Indoor and outdoor seamless positioning using indoor messaging system and GPS. In Proceedings of the International Conference on Indoor Positioning and Indoor Navigation (IPIN2011), Guimarães, Portugal, 21–23 September 2011; pp. 21–23. [Google Scholar]
- Zou, D.; Niu, S.; Chen, S.; Su, B.; Cheng, X.; Liu, J.; Liu, Y.; Li, Y. A smart city used low-latency seamless positioning system based on inverse global navigation satellite system technology. Int. J. Distrib. Sens. Netw. 2019, 15. [Google Scholar] [CrossRef] [Green Version]
- Zou, D.; Meng, W.; Han, S.; He, K.; Zhang, Z. Toward Ubiquitous LBS: Multi-Radio Localization and Seamless Positioning. IEEE Wirel. Commun. 2016, 23, 107–113. [Google Scholar] [CrossRef]
- Li, Y.; Zhuang, Y.; Zhang, P.; Lan, H.Y.; Niu, X.J.; El-Sheimy, N. An improved inertial/wifi/magnetic fusion structure for indoor navigation. Inf. Fusion 2017, 34, 101–119. [Google Scholar] [CrossRef]
- Li, Y.; Zhuang, Y.; Lan, H.; Niu, X.; El-Sheimy, N. A Profile-Matching Method for Wireless Positioning. IEEE Commun. Lett. 2016, 20, 2514–2517. [Google Scholar] [CrossRef]
- Zhang, P.; Chen, R.; Li, Y.; Niu, X.; Wang, L.; Li, M.; Pan, Y. A Localization Database Establishment Method Based on Crowdsourcing Inertial Sensor Data and Quality Assessment Criteria. IEEE Internet Things J. 2018, 5, 4764–4777. [Google Scholar] [CrossRef]
- Li, Y.; He, Z.; Gao, Z.; Zhuang, Y.; Shi, C.; El-Sheimy, N. Toward Robust Crowdsourcing-Based Localization: A Fingerprinting Accuracy Indicator Enhanced Wireless/Magnetic/Inertial Integration Approach. IEEE Internet Things J. 2019, 6, 3585–3600. [Google Scholar] [CrossRef] [Green Version]
- Yu, T.; Gui, L.; Yu, T.; Wang, J. Walrasian Equilibrium-Based Incentive Scheme for Mobile Crowdsourcing Fingerprint Localization. Sensors 2019, 19, 2693. [Google Scholar] [CrossRef] [PubMed] [Green Version]
- Feriol, F.; Vivet, D.; Watanabe, Y. A Review of Environmental Context Detection for Navigation Based on Multiple Sensors. Sensors 2020, 20, 4532. [Google Scholar]
- Zhu, Y.; Luo, H.; Wang, Q.; Zhao, F.; Ning, B.; Ke, Q.; Zhang, C. A fast indoor/outdoor transition detection algorithm based on machine learning. Sensors 2019, 19, 786. [Google Scholar]
- Bui, V.; Le, N.T.; Vu, T.L.; Nguyen, V.H.; Jang, Y.M. GPS-Based Indoor/Outdoor Detection Scheme Using Machine Learning Techniques. Appl. Sci. 2020, 10, 500. [Google Scholar] [CrossRef] [Green Version]
- Balcazar Soto, J. Indoor-Outdoor Detection and Routing Using Bayesian Networks; Aalto University: Espoo, Finland, 2016. [Google Scholar]
- Zhu, Y.; Luo, H.; Zhao, F.; Chen, R. Indoor/outdoor switching detection using multisensor densenet and LSTM. IEEE Internet Things J. 2020, 8, 1544–1556. [Google Scholar] [CrossRef]
- Wang, L.; Sommer, L.; Riedel, T.; Beigl, M.; Zhou, Y.; Huang, Y. NeuralIO: Indoor Outdoor Detection via Multimodal Sensor Data Fusion on Smartphones. In Proceedings of the International Summit Smart City 360°, Braga, Portugal, 4–6 December 2019; pp. 127–138. [Google Scholar]
- Ali, M.; ElBatt, T.; Youssef, M. SenseIO: Realistic Ubiquitous Indoor Outdoor Detection System Using Smartphones. IEEE Sens. J. 2018, 18, 3684–3693. [Google Scholar] [CrossRef]
- Li, S.; Qin, Z.; Song, H.; Si, C.; Sun, B.; Yang, X.; Zhang, R. A lightweight and aggregated system for indoor/outdoor detection using smart devices. Future Gener. Comput. Syst. 2020, 107, 988–997. [Google Scholar] [CrossRef]
- Canovas, O.; Lopez-de-Teruel, P.E.; Ruiz, A. Detecting indoor/outdoor places using WiFi signals and AdaBoost. IEEE Sens. J. 2016, 17, 1443–1453. [Google Scholar] [CrossRef]
- Shtar, G.; Shapira, B.; Rokach, L. Clustering Wi-Fi fingerprints for indoor–outdoor detection. Wirel. Netw. 2019, 25, 1341–1359. [Google Scholar] [CrossRef] [Green Version]
- Wang, W.; Chang, Q.; Li, Q.; Shi, Z.; Chen, W. Indoor-Outdoor Detection Using a Smart Phone Sensor. Sensors 2016, 16, 1563. [Google Scholar] [CrossRef] [Green Version]
- Saffar, I.; Morel, M.L.A.; Singh, K.D.; Viho, C. Semi-Supervised Deep Learning-Based Methods for Indoor Outdoor Detection. In Proceedings of the ICC 2019–2019 IEEE International Conference on Communications (ICC), Shanghai, China, 20–24 May 2019; pp. 1–7. [Google Scholar]
- Montella, S.; Berruet, B.; Baala, O.; Guillet, V.; Caminada, A.; Lassabe, F. A Funnel Fukunaga-Koontz Transform for Robust Indoor-Outdoor Detection Using Channel State Information in 5G IoT Context. IEEE Internet Things J. 2022, 9, 14018–14029. [Google Scholar] [CrossRef]
- Sung, R.; Jung, S.-H.; Han, D. Sound based indoor and outdoor environment detection for seamless positioning handover. ICT Express 2015, 1, 106–109. [Google Scholar] [CrossRef] [Green Version]
- Ashraf, I.; Hur, S.; Park, Y. MagIO: Magnetic field strength based indoor-outdoor detection with a commercial smartphone. Micromachines 2018, 9, 534. [Google Scholar] [CrossRef] [Green Version]
- Zou, H.; Jiang, H.; Luo, Y.; Zhu, J.; Lu, X.; Xie, L. Bluedetect: An ibeacon-enabled scheme for accurate and energy-efficient indoor-outdoor detection and seamless location-based service. Sensors 2016, 16, 268. [Google Scholar] [CrossRef] [PubMed] [Green Version]
- Li, M.; Zhou, P.; Zheng, Y.; Li, Z.; Shen, G. IODetector: A generic service for indoor/outdoor detection. ACM Trans. Sens. Netw. TOSN 2014, 11, 1–29. [Google Scholar] [CrossRef]
- Radu, V.; Katsikouli, P.; Sarkar, R.; Marina, M.K. A semi-supervised learning approach for robust indoor-outdoor detection with smartphones. In Proceedings of the 12th ACM Conference on Embedded Network Sensor Systems, Memphis, TN, USA, 3–6 November 2014; pp. 280–294. [Google Scholar]
- Anagnostopoulos, G.G.; Deriaz, M. Automatic switching between indoor and outdoor position providers. In Proceedings of the 2015 International Conference on Indoor Positioning and Indoor Navigation (IPIN), Melbourne, Australia, 13–16 October 2015; pp. 1–6. [Google Scholar]
- Ye, J.; Li, Y.; Luo, H.; Wang, J.; Chen, W.; Zhang, Q. Hybrid Urban Canyon Pedestrian Navigation Scheme Combined PDR, GNSS and Beacon Based on Smartphone. Remote Sens. 2019, 11, 2174. [Google Scholar] [CrossRef]
- Zeng, Q.; Wang, J.; Meng, Q.; Zhang, X.; Zeng, S. Seamless pedestrian navigation methodology optimized for indoor/outdoor detection. IEEE Sens. J. 2017, 18, 363–374. [Google Scholar] [CrossRef]
- Tao, X.; Zhu, F.; Hu, X.; Liu, W.; Zhang, X. An enhanced foot-mounted PDR method with adaptive ZUPT and multi-sensors fusion for seamless pedestrian navigation. GPS Solut. 2022, 26, 13. [Google Scholar] [CrossRef]
- Zhu, X.; Qu, W.; Qiu, T.; Zhao, L.; Atiquzzaman, M.; Wu, D.O. Indoor Intelligent Fingerprint-Based Localization: Principles, Approaches and Challenges. IEEE Commun. Surv. Tutor. 2020, 22, 2634–2657. [Google Scholar] [CrossRef]
- Jiang, W.; Cao, Z.; Cai, B.; Li, B.; Wang, J. Indoor and Outdoor Seamless Positioning Method Using UWB Enhanced Multi-Sensor Tightly-Coupled Integration. IEEE Trans. Veh. Technol. 2021, 70, 10633–10645. [Google Scholar] [CrossRef]
- Pendão, C.; Moreira, A. FastGraph Enhanced: High Accuracy Automatic Indoor Navigation and Mapping. IEEE Trans. Mob. Comput. 2021, 20, 1027–1045. [Google Scholar] [CrossRef]
- Pendão, C.; Moreira, A. FastGraph—Organic 3D Graph for Unsupervised Location and Mapping. In Proceedings of the 2018 International Conference on Indoor Positioning and Indoor Navigation (IPIN), Nantes, France, 24–27 September 2018; pp. 206–212. [Google Scholar]
- Martínez-González, A.; Monzó-Cabrera, J.; Martínez-Sáez, A.J.; Lozano-Guerrero, A.J. Minimization of measuring points for the electric field exposure map generation in indoor environments by means of Kriging interpolation and selective sampling. Environ. Res. 2022, 212, 113577. [Google Scholar] [CrossRef]
- Mendoza-Silva, G.M.; Costa, A.C.; Torres-Sospedra, J.; Painho, M.; Huerta, J. Environment-aware regression for indoor localization based on WiFi fingerprinting. IEEE Sens. J. 2021, 22, 4978–4988. [Google Scholar] [CrossRef]
- Bi, J.; Wang, Y.; Li, Z.; Xu, S.; Zhou, J.; Sun, M.; Si, M. Fast radio map construction by using adaptive path loss model interpolation in large-scale building. Sensors 2019, 19, 712. [Google Scholar] [CrossRef] [PubMed] [Green Version]
- Google. Firestore. Available online: https://firebase.google.com/docs/firestore (accessed on 6 October 2022).
- Zhou, B.; Ma, W.; Li, Q.; El-Sheimy, N.; Mao, Q.; Li, Y.; Gu, F.; Huang, L.; Zhu, J. Crowdsourcing-based indoor mapping using smartphones: A survey. ISPRS J. Photogramm. Remote Sens. 2021, 177, 131–146. [Google Scholar] [CrossRef]
- Khan, I.; Khusro, S.; Ali, S.; Ahmad, J. Sensors are power hungry: An investigation of smartphone sensors impact on battery power from lifelogging perspective. Bahria Univ. J. Inf. Commun. Technol. BUJICT 2016, 9, 8–19. [Google Scholar]
- Mansour, A.; Chen, W.; Luo, H.; Li, Y.; Wang, J.; Weng, D. Drift Control of Pedestrian Dead Reckoning (PDR) for Long Period Navigation under Different Smartphone Poses. Eng. Proc. 2021, 10, 21. [Google Scholar]
- Julier, S.J.; Uhlmann, J.K. Unscented filtering and nonlinear estimation. Proc. IEEE 2004, 92, 401–422. [Google Scholar] [CrossRef]
- Li, Y.; Georgy, J.; Niu, X.; Li, Q.; El-Sheimy, N. Autonomous Calibration of MEMS Gyros in Consumer Portable Devices. IEEE Sens. J. 2015, 15, 4062–4072. [Google Scholar] [CrossRef] [Green Version]
- Wang, Q.; Ye, L.; Luo, H.; Men, A.; Zhao, F.; Ou, C. Pedestrian walking distance estimation based on smartphone mode recognition. Remote Sens. 2019, 11, 1140. [Google Scholar] [CrossRef] [Green Version]
- Kang, W.; Han, Y. SmartPDR: Smartphone-Based Pedestrian Dead Reckoning for Indoor Localization. IEEE Sens. J. 2015, 15, 2906–2916. [Google Scholar] [CrossRef]
- Pappas, I.P.I.; Popovic, M.R.; Keller, T.; Dietz, V.; Morari, M. A reliable gait phase detection system. IEEE Trans. Neural Syst. Rehabil. Eng. 2001, 9, 113–125. [Google Scholar] [CrossRef]
- Guo, G.; Chen, R.; Ye, F.; Chen, L.; Pan, Y.; Liu, M.; Cao, Z. A pose awareness solution for estimating pedestrian walking speed. Remote Sens. 2019, 11, 55. [Google Scholar] [CrossRef] [Green Version]
- Weinberg, H. Using the ADXL202 in pedometer and personal navigation applications. Analog. Devices AN-602 Appl. Note 2002, 2, 1–6. [Google Scholar]
- Li, Y.; Zahran, S.; Zhuang, Y.; Gao, Z.; Luo, Y.; He, Z.; Pei, L.; Chen, R.; El-Sheimy, N. IMU/Magnetometer/Barometer/Mass-Flow Sensor Integrated Indoor Quadrotor UAV Localization with Robust Velocity Updates. Remote Sens. 2019, 11, 838. [Google Scholar] [CrossRef] [Green Version]
- Ahmed Mansour, J.Y.; Li, Y.; Luo, H.; Wang, J.; Weng, D.; Chen, W. Everywhere: A Framework for Ubiquitous Indoor Localization. IEEE Internet Things J. 2022; submitted. [Google Scholar]
- Huang, B.Q.; Xu, Z.D.; Jia, B.; Mao, G.Q. An Online Radio Map Update Scheme for WiFi Fingerprint-Based Localization. IEEE Internet Things J. 2019, 6, 6909–6918. [Google Scholar] [CrossRef]
- Taniuchi, D.; Maekawa, T. Automatic update of indoor location fingerprints with pedestrian dead reckoning. ACM Trans. Embed. Comput. Syst. TECS 2015, 14, 1–23. [Google Scholar] [CrossRef]
- Chang, Q.; Van de Velde, S.; Wang, W.P.; Li, Q.; Hou, H.T.; Heidi, S. Wi-Fi Fingerprint Positioning Updated by Pedestrian Dead Reckoning for Mobile Phone Indoor Localization. Lect. Notes Electr. En. 2015, 342, 729–739. [Google Scholar] [CrossRef]
- Chang, K.; Han, D. Crowdsourcing-based radio map update automation for Wi-Fi positioning systems. In Proceedings of the 3rd ACM SIGSPATIAL International Workshop on Crowdsourced and Volunteered Geographic Information, Dallas, TX, USA, 4 November 2014; pp. 24–31. [Google Scholar]
- Chen, W.; Chang, Q.; Hou, H.-T.; Wang, W.-P. A novel clustering and KWNN-based strategy for Wi-Fi fingerprint indoor localization. In Proceedings of the 2015 4th International Conference on Computer Science and Network Technology (ICCSNT), Harbin, China, 19–20 December 2015; pp. 49–52. [Google Scholar]
- Lemelson, H.; Kjærgaard, M.B.; Hansen, R.; King, T. Error estimation for indoor 802.11 location fingerprinting. In Proceedings of the International Symposium on Location-and Context-Awareness, Tokyo, Japan, 7–8 May 2009; pp. 138–155. [Google Scholar]
- Zhu, F.; Tao, X.L.; Liu, W.K.; Shi, X.; Wang, F.H.; Zhang, X.H. Walker: Continuous and Precise Navigation by Fusing GNSS and MEMS in Smartphone Chipsets for Pedestrians. Remote Sens. 2019, 11, 139. [Google Scholar] [CrossRef]
- Bahadur, B. A study on the real-time code-based GNSS positioning with Android smartphones. Measurement 2022, 194, 111078. [Google Scholar] [CrossRef]
- Popleteev, A. Indoor positioning and floor plan based ground truth: Can you really click where you are? In Proceedings of the 15th International Conference on Mobile and Ubiquitious Multimedia (MUM-2016), Rovaniemi, Finland, 12–15 December 2016. [Google Scholar]


| Approach | Sensors Used for Detection | Low Power | High Reliability | Fast Switching | Ubiquity | ||||||||||
|---|---|---|---|---|---|---|---|---|---|---|---|---|---|---|---|
| BLE | MF | Light | Prox. | Cell | WiFi | GPS | Press. | Sound | Temp. | ||||||
| Power-consuming approaches | [11] | • | ✗ | ✗ | ✗ | ✓ | |||||||||
| [12] | • | ✗ | ✗ | ✗ | ✓ | ||||||||||
| [13] | • | • | • | • | ✗ | ✓ | ✗ | ✓ | |||||||
| [14] | • | • | • | • | • | ✗ | ✓ | ✗ | ✓ | ||||||
| NeuralIO [15] | • | • | • | • | • | • | • | • | ✗ | ✓ | ✗ | ✓ | |||
| SenseIO [16] | • | • | • | • | ✗ | ✗ | ✓ | ✓ | |||||||
| [17] | • | • | ✗ | ✗ | ✗ | ✓ | |||||||||
| WIFI Boost [18] | • | ✗ | ✗ | ✗ | ✓ | ||||||||||
| [19] | • | ✗ | ✗ | ✗ | ✓ | ||||||||||
| Power-saving approaches | [20] | • | ✓ | ✗ | ✓ | ✓ | |||||||||
| [21] | • | ✓ | ✗ | ✓ | ✓ | ||||||||||
| [22] | • | ✓ | ✗ | ✓ | ✓ | ||||||||||
| [23] | • | ✓ | ✗ | ✓ | ✓ | ||||||||||
| MagIO [24] | • | ✓ | ✗ | ✓ | ✓ | ||||||||||
| BlueDetect [25] | • | ✓ | ✗ | ✓ | ✗ | ||||||||||
| IODetector [26] | • | • | • | • | ✓ | ✗ | ✓ | ✓ | |||||||
| [27] | • | • | • | ✓ | ✗ | ✓ | ✓ | ||||||||
| [28] | • | • | • | • | ✓ | ✗ | ✓ | ✓ | |||||||
| System | Average Minutes to Reduce 1% of Battery Life | ||
|---|---|---|---|
| Environment | Indoors without Transitions | Outdoors without Transitions | Indoors and Outdoors with Transitions |
| GNSS | 4.72 | 4.95 | 4.65 |
| IODetector | 5.55 | 5.60 | 5.52 |
| LPCS+GNSS (continuous) | 4.55 | 4.22 | 4.10 |
| The proposed detection service | 5.50 | 5.58 | 5.45 |
| I/O Detection Approach | Sensors Used for Detection | Detection Accuracy | Power Consumption |
|---|---|---|---|
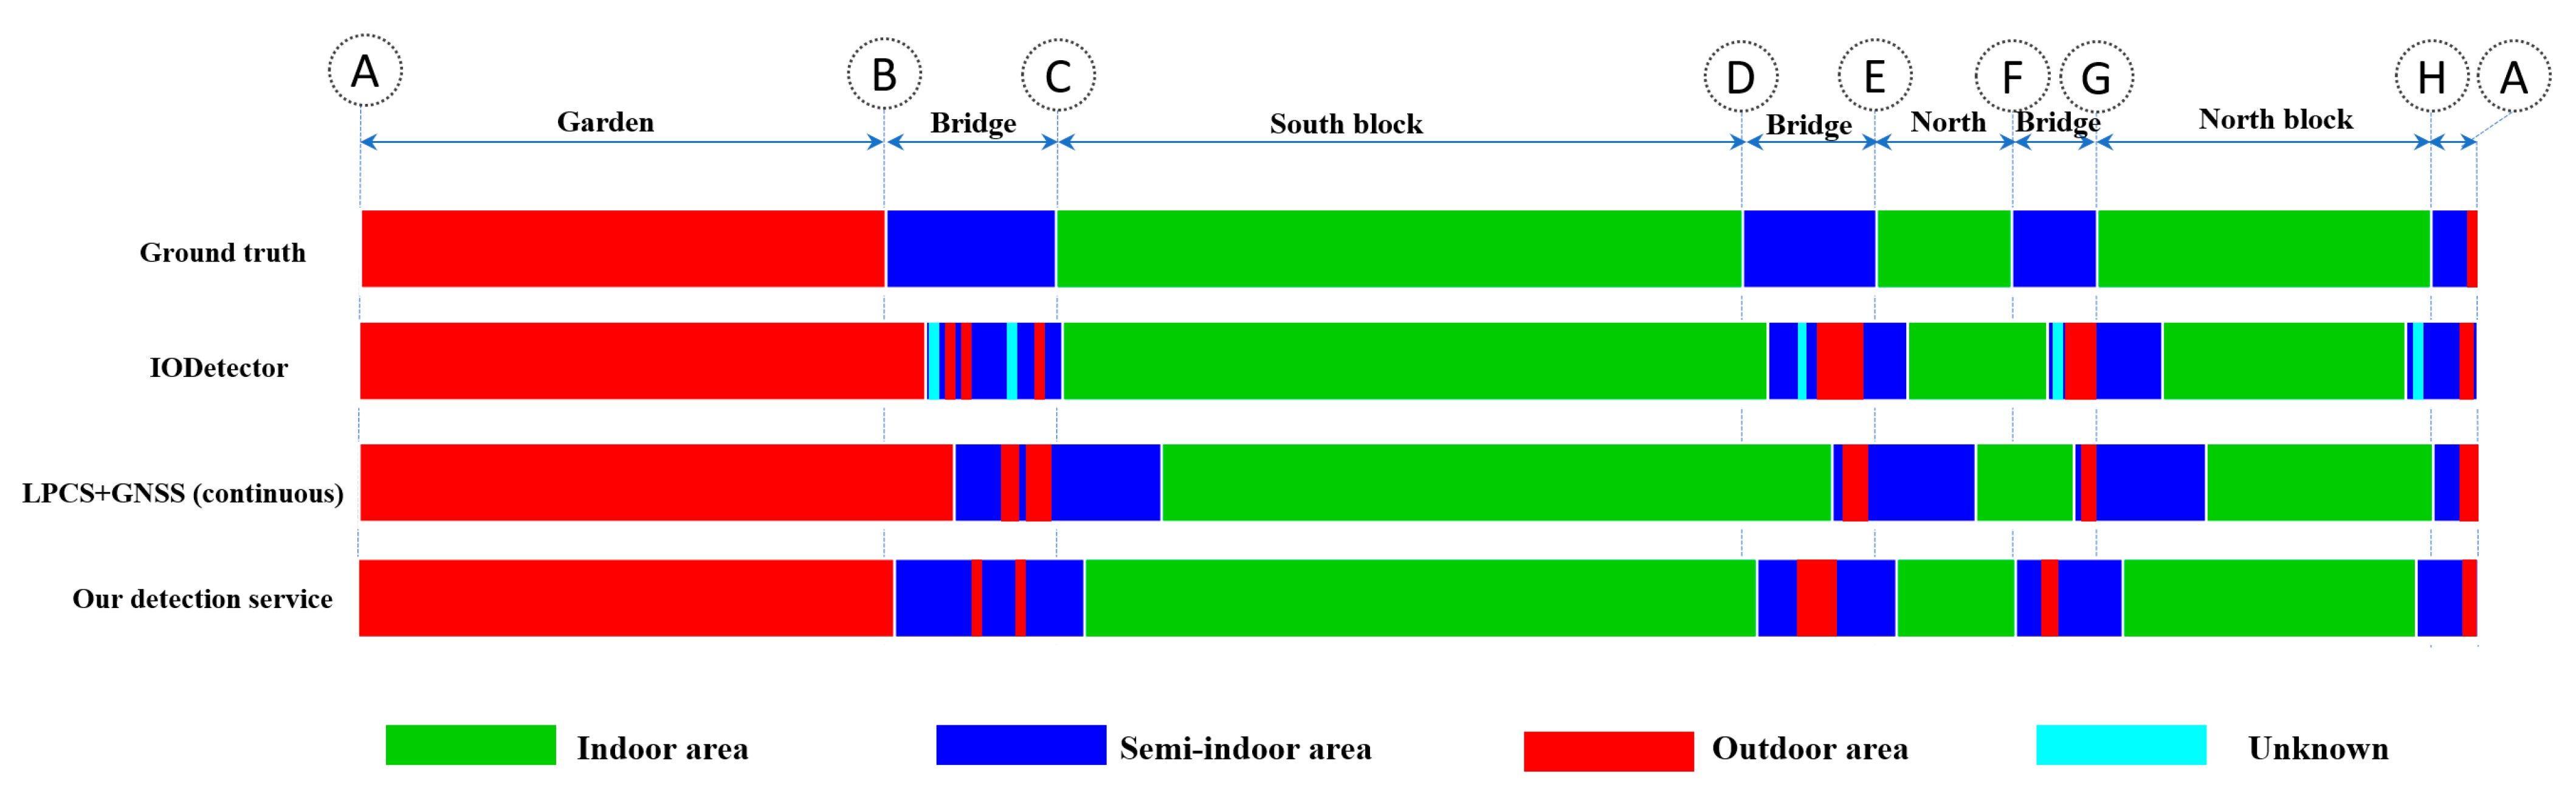
| IODetector [26] | Light, cellular, and magnetism | The overall accuracy was ~86%, reduced to 71% in the transition intervals (semi-indoor areas). | Low |
| [27] | Light, cellular, and magnetism | The overall accuracy was ~88% in familiar environments and 82% in unfamiliar environments. | Low |
| SenseIO [16] | Light, cellular, and WiFi | The overall accuracy of indoor and outdoor detection was ~91%, and the semi-indoor areas were not considered for detection. | High |
| [13] | Light, cellular, magnetism, and GNSS (continuous) | The overall accuracy of indoor and outdoor detection was ~89%, and the semi-indoor areas were not considered for detection. | High |
| [15] | Light, cellular, magnetism, GNSS, sound, and temperature | The overall accuracy of indoor and outdoor detection was ~94%, and the semi-indoor areas were not considered for detection. | High |
| The proposed approach | Light, cellular, magnetism, and GNSS (in the transition intervals) | The proposed approach achieved an overall accuracy of ~92%, with 82% in semi-indoor areas. | Low with a marginal increase in semi-indoor areas |
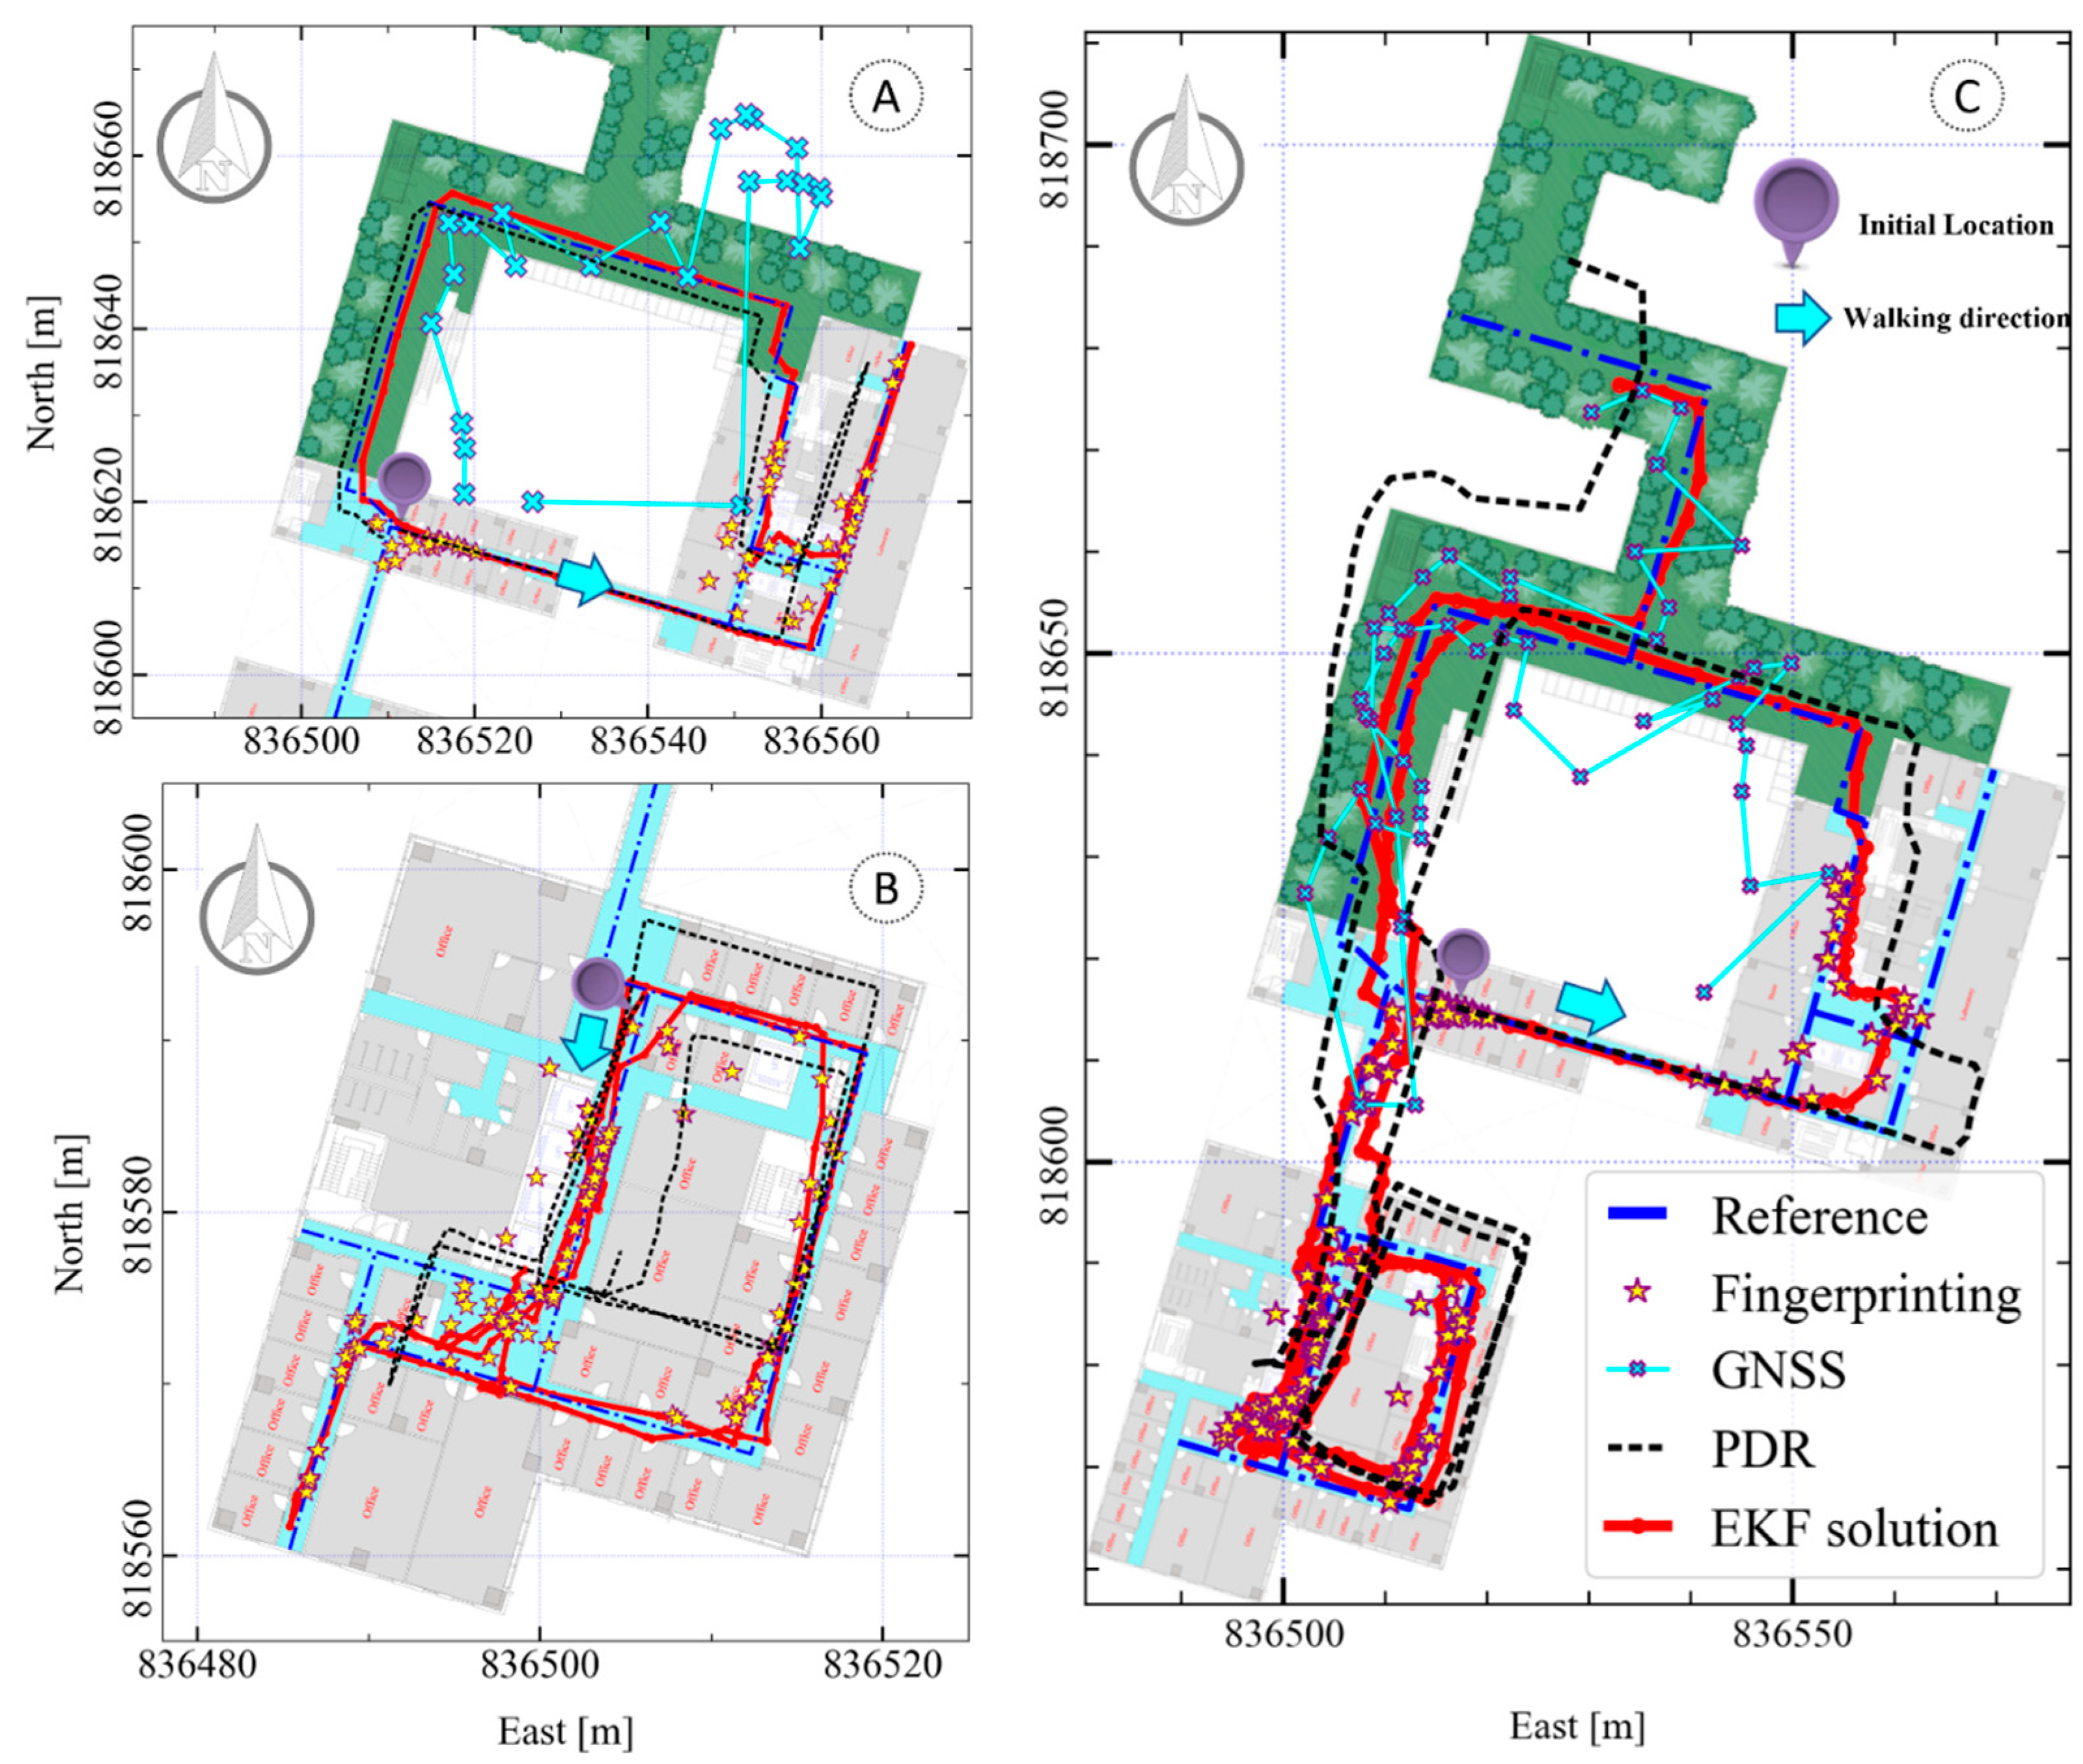
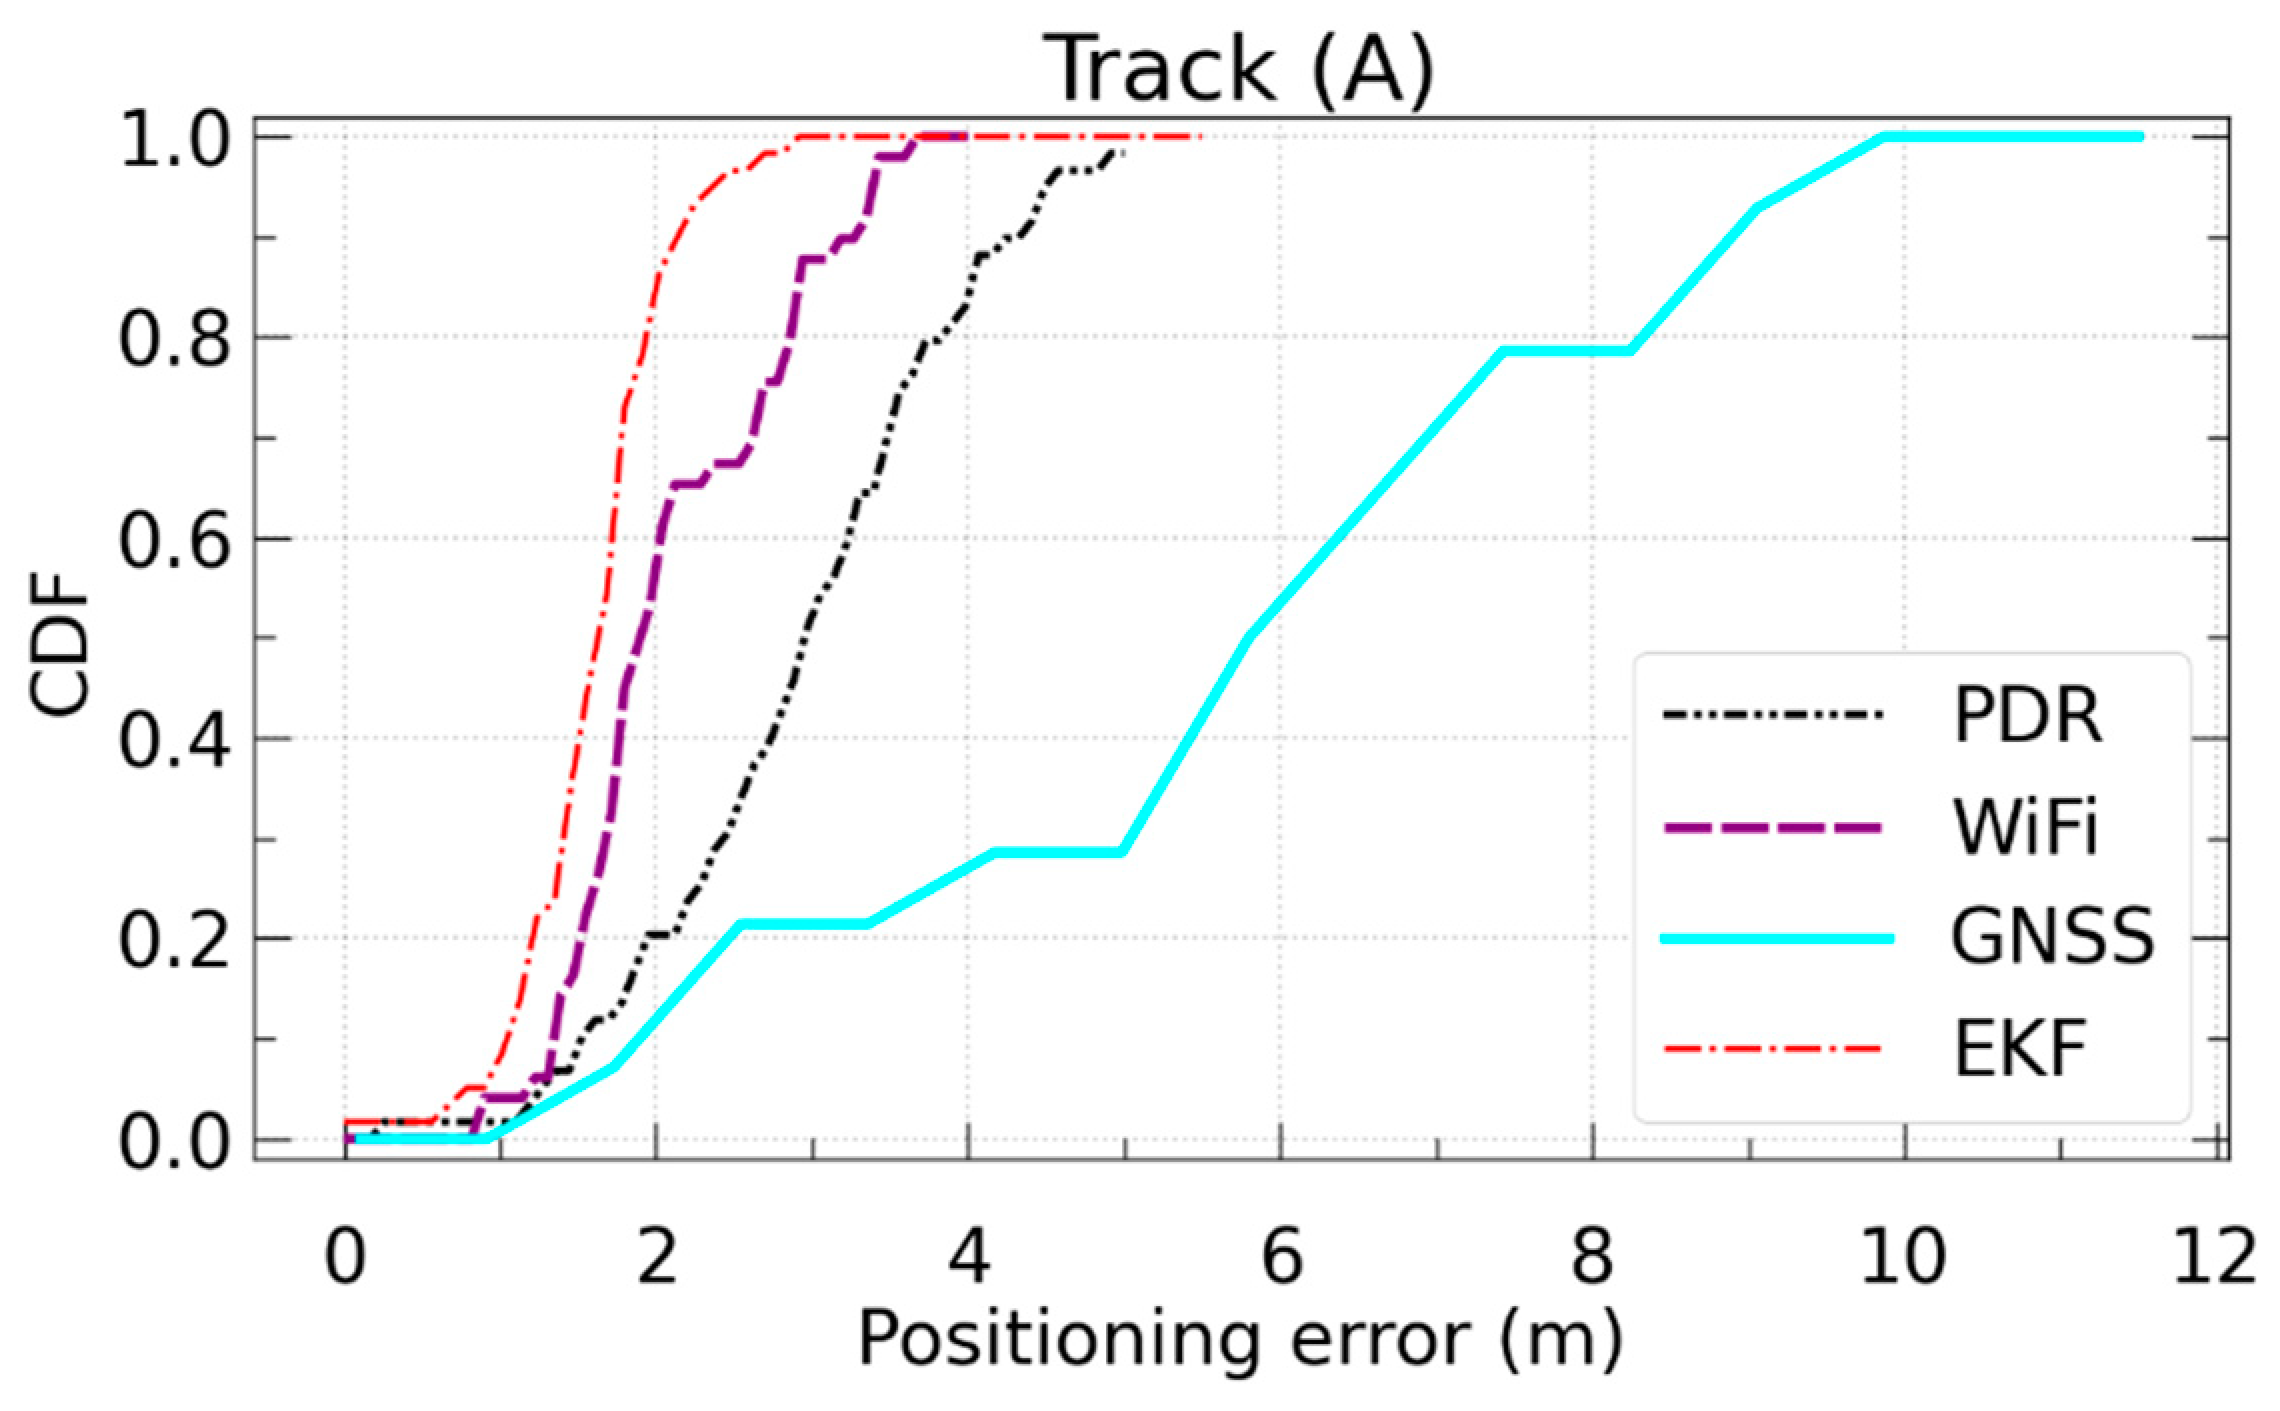
| Solution | Mean (m) | 90% (m) | ||||
|---|---|---|---|---|---|---|
| Track | A | B | C | A | B | C |
| PDR | 2.8 | 4.7 | 3.5 | 4.3 | 5.8 | 5.2 |
| Fingerprinting | 2.1 | 2.4 | 2.2 | 3.3 | 3.9 | 3.4 |
| GNSS | 4.8 | - | 4.4 | 9.2 | - | 8.5 |
| EKF | 1.6 | 2.2 | 2.4 | 2.4 | 2.7 | 3.5 |
Publisher’s Note: MDPI stays neutral with regard to jurisdictional claims in published maps and institutional affiliations. |
© 2022 by the authors. Licensee MDPI, Basel, Switzerland. This article is an open access article distributed under the terms and conditions of the Creative Commons Attribution (CC BY) license (https://creativecommons.org/licenses/by/4.0/).
Share and Cite
Mansour, A.; Chen, W. SUNS: A User-Friendly Scheme for Seamless and Ubiquitous Navigation Based on an Enhanced Indoor-Outdoor Environmental Awareness Approach. Remote Sens. 2022, 14, 5263. https://doi.org/10.3390/rs14205263
Mansour A, Chen W. SUNS: A User-Friendly Scheme for Seamless and Ubiquitous Navigation Based on an Enhanced Indoor-Outdoor Environmental Awareness Approach. Remote Sensing. 2022; 14(20):5263. https://doi.org/10.3390/rs14205263
Chicago/Turabian StyleMansour, Ahmed, and Wu Chen. 2022. "SUNS: A User-Friendly Scheme for Seamless and Ubiquitous Navigation Based on an Enhanced Indoor-Outdoor Environmental Awareness Approach" Remote Sensing 14, no. 20: 5263. https://doi.org/10.3390/rs14205263