Article

Synergistic Retrieval of Temperature and Humidity Profiles from Space-Based and Ground-Based Infrared Sounders Using an Optimal Estimation Method

1
School of Instrumentation and Optoelectronic Engineering, Key Laboratory of Precision Opto-Mechatronics Technology, Ministry of Education, Beihang University, 37 Xueyuan Road, Haidian District, Beijing 100191, China
2
Institute of Artificial Intelligence, Beihang University, 37 Xueyuan Road, Haidian District, Beijing 100191, China
*
Author to whom correspondence should be addressed.
These authors contributed equally to this work.
Remote Sens. 2022, 14(20), 5256; https://doi.org/10.3390/rs14205256
Submission received: 9 September 2022 / Revised: 14 October 2022 / Accepted: 16 October 2022 / Published: 20 October 2022
(This article belongs to the Special Issue Advances in Infrared Observation of Earth’s Atmosphere II)

Abstract

:
The atmospheric temperature and humidity profiles of the troposphere are generally measured by radiosondes and satellites, which are essential for analyzing and predicting weather. Nevertheless, the insufficient observation frequencies and low detection accuracy of the boundary layer restricts the description of atmospheric state changes by the temperature and humidity profiles. Therefore, this work focus on retrieving the temperature and humidity profiles using observations of the FengYun-4 (FY-4) Geostationary Interferometric Infrared Sounder (GIIRS) combined with ground-based infrared spectral observations from the Atmospheric Emitted Radiance Interferometer (AERI), which are more accurate than space-based individual retrieval results and have a wider effective retrieval range than ground-based individual retrieval results. Based on the synergistic observations, which are made by matching the space-based and ground-based data with those of different spatial and temporal resolutions, a synergistic retrieval process is proposed to obtain the temperature and humidity profiles at a high frequency under clear-sky conditions based on the optimal estimation method. In this research, using the line-by-line radiative transfer model (LBLRTM) as the forward model for observing simulations, a retrieval experiment was carried out in Qingdao, China, where an AERI is situated. Taking radiosonde data as a reference for comparing the retrieval results of the temperature and humidity profiles of the troposphere, the root-mean-square error (RMSE) of the synergistic retrieval algorithm below 400 hPa is within 2 K for temperature and within 12% for relative humidity. Compared with the GIIRS individual retrieval, the RMSE of temperature and relative humidity for the synergistic method is reduced by 0.13–1.5 K and 2.7–4.4% at 500 hPa, and 0.13–2.1 K and 2.5–7.2% at 900 hPa. Moreover, the forecast index (FI) calculated from the retrieval results shows reasonable consistency with the FIs calculated from the ERA5 reanalysis and from radiosonde data. The synergistic retrieval results have higher temporal resolution than space-based retrieval results and can reflect the changes in the atmospheric state more accurately. Overall, the results demonstrated the promising potential of the synergistic retrieval of temperature and humidity profiles at high accuracy and high temporal resolution under clear-sky conditions from FY-4/GIIRS and AERI.

Graphical Abstract

1. Introduction

Detecting and predicting severe convective weather activities has always been a focus and challenge in atmospheric research. Obtaining accurate atmospheric temperature and humidity profiles under clear-sky conditions before convective storms can improve the monitoring ability of mesoscale environmental characteristics such as atmospheric stability and boundary layer structure [1,2,3]. These data are essential for nowcasting and short-term forecasting of severe storms [4,5]. Radiosondes are the most conventional measurements, but radiosonde data with a temporal resolution of 8–12 h are insufficient to support nowcasting of severe convection and other weather phenomena [6,7,8,9].
In 1956, King proposed using space-based infrared spectral measurement data to obtain the vertical distribution of atmospheric temperature [10]. In 1959, Kaplan pointed out that the information in different spectral bands has different sensitivities to the atmosphere at different altitudes, which laid a theoretical foundation for remote sensing atmospheric temperature profiles [11]. The retrieval methods of atmospheric temperature and humidity profiles mainly include the statistical retrieval method and physical retrieval method. On the one hand, the statistical retrieval method does not consider the physical process of atmospheric radiation transmission, but only uses the spectral data of various bands to establish the regression relationship with the temperature and humidity parameter vector. Smith and Woolf proposed using the covariance matrix of eigenvectors to set spectral measurements and atmospheric temperature and humidity parameters [12]. Malmgren-Hansen et al. used a convolutional neural network to establish a nonlinear regression relationship [13]. On the other hand, the physical retrieval method uses the radiation transfer model to simulate the radiation observation according to the initial estimated atmospheric parameter profile, which is called the first guess, and compares the output with the actual observation value to optimize the atmospheric parameter profile iteratively [14,15]. In the early stage, for the Satellite Infrared Spectrometer’s (SIRS) multispectral observation data of Nimbus III and Nimbus IV, Smith used an iterative retrieval method in the form of unconstrained solutions to obtain the temperature and humidity profiles of the Earth’s atmosphere [16]. Based on the observation data of the High-Resolution Infrared Sounder (HIRS)/3 onboard the Advanced Television and Infrared Observation Satellite Operational Vertical Sounder (ATOVS), Li and Wolf used a nonlinear iterative physical retrieval method to retrieve the atmospheric temperature and humidity profile [17].
In recent years, the development of atmospheric detection technology has enabled space-based infrared hyperspectral detectors to obtain the vertical structure of atmospheric temperature and humidity [18]. The Atmospheric InfraRed Sounder (AIRS) can observe most of the spectral range from 3.74–15.4 μm with the spectral resolution of 2.0–0.5 cm−1, while more observation channels and higher spectral resolution can improve the accuracy of atmospheric parameter retrieval [19]. In the research of Wu et al., the RMSE of the temperature profile and humidity profile above 850 hPa under a clear-sky conditions was less than 1 K and 10%, respectively [20]. Zhou et al. developed a method based on one-dimensional variational retrieval to retrieve atmospheric parameters, including the temperature and humidity profiles, from the Infrared Atmospheric Sounding Interferometer (IASI) observation data. They compared the results of multiple observations, including the AIRS and NPOESS Airborne Sounder Testbed—Interferometer (NAST-I), with the results of IASI, showing that the standard deviation of the differences is less than 1 K for temperature and less than 10% above the ground boundary layer for humidity [21]. Combined with the preliminary estimated atmospheric information provided by the Numerical Weather Prediction (NWP), Zhu et al. used observations from the Fengyun-3D Hyperspectral Infrared Radiation Atmospheric Sounding (HIRAS) to retrieve the atmospheric temperature and humidity profiles by the 1D-Var method. The RMSE of retrieval was less than 1 K and 10% for temperature and humidity, respectively [22]. The FY-4/GIIRS, as the first infrared hyperspectral sounder onboard a geostationary weather satellite, has greatly enhanced weather observation capabilities [23]. Xue and Huang used GIIRS infrared hyperspectral data to conduct retrieval research on atmospheric temperature and humidity profiles, and the RMSE accuracy of retrieval was within 2 K and 2 g/kg for the entire depth of the troposphere under clear-sky conditions, except for near the surface [24].
In addition to spaceborne instruments, researchers have also developed ground-based infrared spectrometers, and one of the widely used instruments is AERI [25,26]. Turner et al. retrieved high-temporal-resolution temperature and humidity profiles of the boundary layer based on the optimal estimation method [27] from AERI, and the retrieval accuracy was approximately 1 K and 5% for the temperature and humidity, respectively [28].
In terms of the temporal resolution, both the ground-based and geostationary hyperspectral soundings are much higher than the radiosonde, while the geostationary hyperspectral sounding can also cover a wider observational range [29]. However, space-based infrared hyperspectral atmospheric detection is seriously affected by surface radiation, so it is difficult to accurately retrieve the temperature and humidity in the boundary layer. The satellite retrieval RMSE of the lower atmospheric temperature is approximately 1.5–3.5 K, and the RMSE of humidity retrieval can reach 20% [22]. At the same time, due to the atmospheric emission radiation near the surface, the atmosphere that the ground-based instruments can remotely sense is limited, and the high-precision retrieval part is less than 5 km [30]. Therefore, synergistic retrieval with different observations has become a new research direction. In 2002, Ho et al. combined an aircraft-based Scanning High-resolution Interferometer Sounder (S-HIS) and AERI for synergistic retrieval based on a nonlinear synergistic retrieval method. They found that synergistic retrieval combining S-HIS with AERI can significantly improve the retrieval accuracy of the temperature and humidity results in the boundary layer. The RMSE of the near-surface atmospheric water vapor mixing ratio was improved from approximately 2.5 g/kg to about 1.5 g/kg [31]. In 2013, Ebell et al. studied the synergistic retrieval effect of various ground-based and space-based remote sensors and analyzed the increase in the information content in the retrieval of different instrument combinations. The results showed that compared with the IASI individual retrieval, the IASI and AERI synergistic retrieval could improve the degrees of freedom for temperature and humidity retrieval by 3.5 and 6.0, respectively [32]. Based on regional reanalysis, Toporov and Löhnert proposed a synthetic retrieval neural network that utilizes simulated measurements of IRS (future geostationary IR sounder of EUMETSAT) and those of a ground-based microwave radiometer to retrieve the atmospheric stability index. They proved that the synergistic retrieval results have better consistency with the true values than the results calculated by a microwave radiometer or IRS only [33]. Loveless et al. used space-based infrared hyperspectral instruments and ground-based AERI to synergistically retrieve the atmospheric temperature and humidity profiles and evaluated the improvement in the degrees of freedom, vertical resolution, and uncertainty [34]. The above research shows that the ground-based and space-based synergistic retrieval of atmospheric temperature and humidity profiles is a vibrant research direction.
The current infrared hyperspectral payloads used in atmospheric profile retrieval, such as AIRS, CrIS, and IASI, are carried on polar orbiting satellites. Their observation positions change with the movement of the satellites, and they cannot observe the same place for a long time. On the one hand, it is difficult to match the locations of space-based and ground-based observation. On the other hand, it is difficult to analyze the influence of the spatial and temporal resolutions on the error distribution of the observation data due to the changing observation location and long revisit time.
Therefore, in the existing synergistic retrieval algorithms, the influence of spatial and temporal resolutions is not considered when calculating the instrument observation error covariance matrix. In the simulated retrieval experiment conducted by Ebell et al. and the synergistic retrieval experiment by Loveless et al., the noise characteristics of the instrument are directly used to calculate the observation error covariance matrix [32,34]. Moreover, the current retrieval results are mostly checked with a single reference [35,36,37].
In this study, a FY-4/GIIRS and AERI synergistic retrieval model is proposed by considering the influence of the spatial and temporal resolutions of observations when calculating the covariance matrix of the observation errors based on the high temporal resolution of AERI and the regional observation characteristics of GIIRS. Then, we match the observation scales of FY-4/GIIRS and AERI to retrieve the temperature and humidity profiles of the tropospheric atmosphere with a high temporal resolution and high accuracy based on the optimal estimation method. Finally, we compare the synergistic retrieval results with radiosondes and ERA5 atmospheric reanalysis data and analyze the feasibility of generating forecast indices with a high temporal resolution and accuracy from the results of the synergistic retrieval. The paper is organized as follows. In Section 2, the data and the model are introduced. The synergistic retrieval method is introduced in Section 3. In Section 4, the results and analysis are reported. In Section 5, a discussion is provided. Finally, in Section 6, the final conclusion is drawn.

2. Datasets and Model
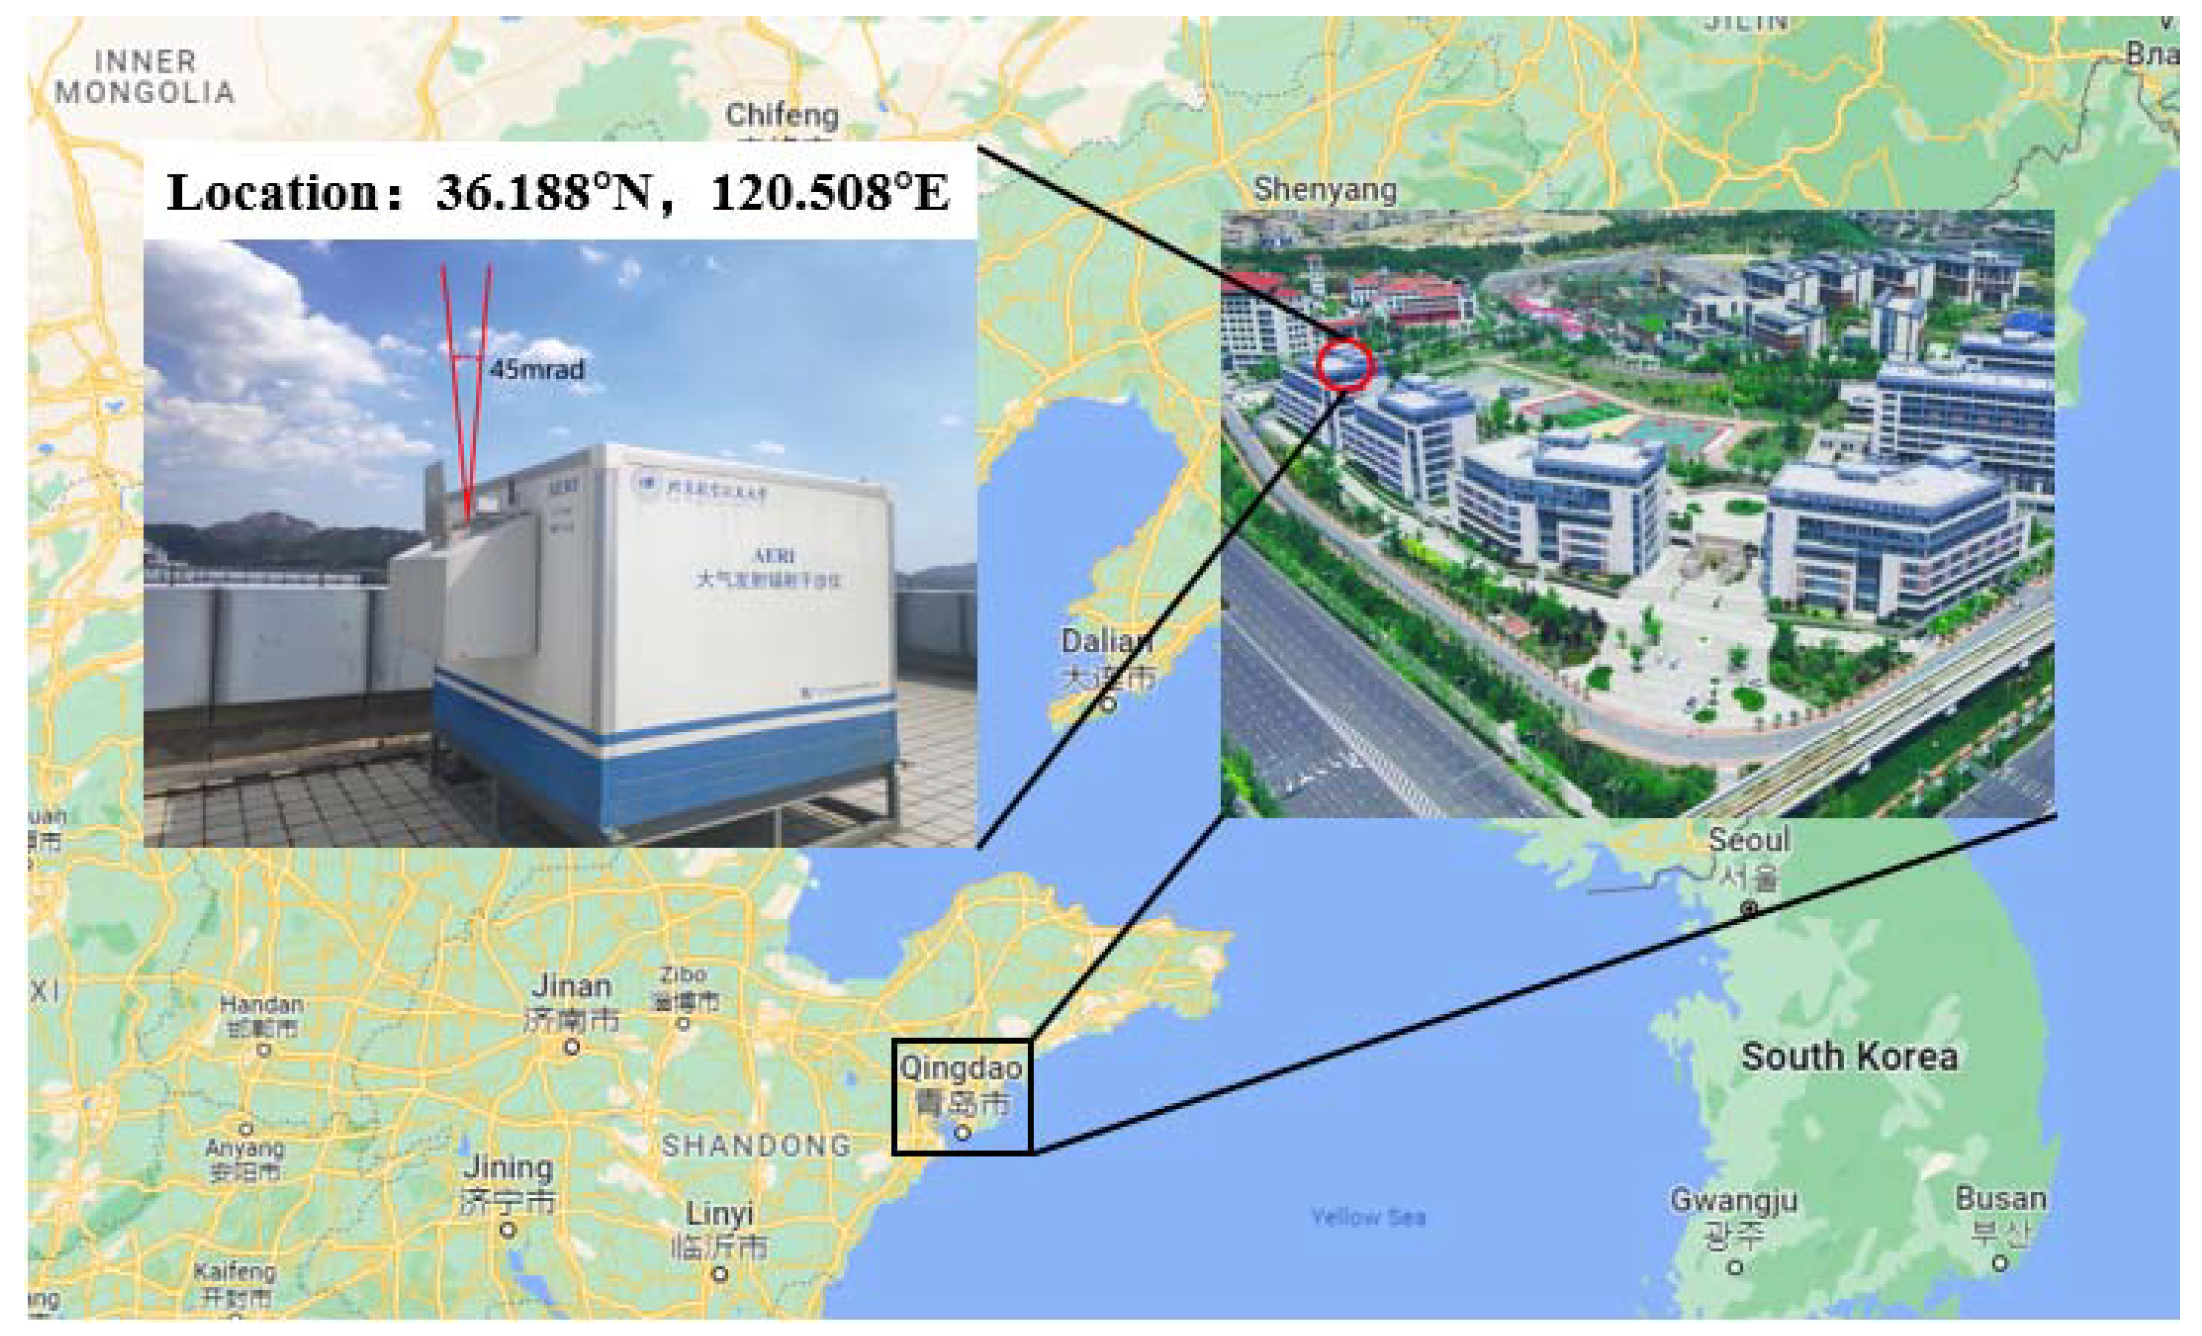
2.1. Data

2.1.1. AERI

In the 1990s, the University of Wisconsin Space Science and Engineering Center (UW-SSEC) designed the AERI for the Atmospheric Radiation Measurement (ARM) program of the U.S. Department of Energy [38]. AERI is a ground-based passive remote sensing instrument. Based on the principle of Fourier transform spectroscopy, The AERI uses two different band detectors to measure the downwelling infrared radiation of the atmosphere [25,26].
The AERI observation field angle is 45 mrad and its specific parameters are shown in Table 1. The characteristic bands of carbon dioxide and water vapor covered by AERI can be used to study the temperature and water vapor retrieval in the boundary layer [39]. As shown in Figure 1, the AERI system has been installed in Qingdao City, Shandong Province, China (36.53 degrees north latitude and 126.33 degrees east longitude). It has been in operation since 2018 and continues to measure atmospheric downward infrared radiation.

2.1.2. GIIRS

The FY-4A satellite, a second-generation geostationary earth orbiter meteorological satellite in China, was successfully launched on 11 December 2016, carrying GIIRS [40]. As the world’s first infrared hyperspectral atmospheric detection load operating in geostationary orbit, FY-4/GIIRS is capable of the three-dimensional detection of atmospheric temperature and humidity with high spatial resolutions (16 km), which is crucial for numerical weather prediction. The detailed features of the GIIRS instrument are listed in Table 2. The primary radiance data for the study on FY-4A/GIIRS were obtained from the Center for Earth System Modeling and Prediction of China Meteorological Administration [40,41].

2.1.3. Radiosonde and ERA5 Data

ERA5 reanalysis data were produced by the Integrated Forecast System (IFS) of the European Centre for Medium-Range Weather Forecasts (ECMWF) which offers hourly estimated values of atmospheric, land surface, and ocean related climate variables from 1950 to the present. The grid width of the horizontal data was 30 km. The atmosphere was vertically divided into 137 layers from the earth’s surface to a height of 80 km [42]. ERA5 data were obtained from the Copernicus Climate Data Store (https://cds.climate.copernicus.eu/cdsapp#!/home (accessed on 2 January 2022)). The radiosonde data was located at the Qingdao observation station. It launches daily at 00 UTC and 12 UTC. The meteorological elements include temperature, dew point temperature, and air pressure. Sounding data were acquired from the China Meteorological Administration.

2.2. Forward Model

To accurately simulate the AERI and FY-4A/GIIRS radiance measurement results, it is recommended to adopt an appropriate radiative transfer model to simulate the transfer process of atmospheric radiance. Hereby, we adopted the LBLRTM of Atmospheric and Environmental Research Inc. derived from the FASCODE model that was developed by the Air Force Research Laboratory (AFGL). LBLRTM is an internationally recognized algorithm for accurate radiative transfer [43]. We adopted the same spectral resolution and instrument spectral response function as AERI and FY-4A/GIIRS in the model, to simulate the actual observation process.

3. Method

3.1. Data Preprocessing

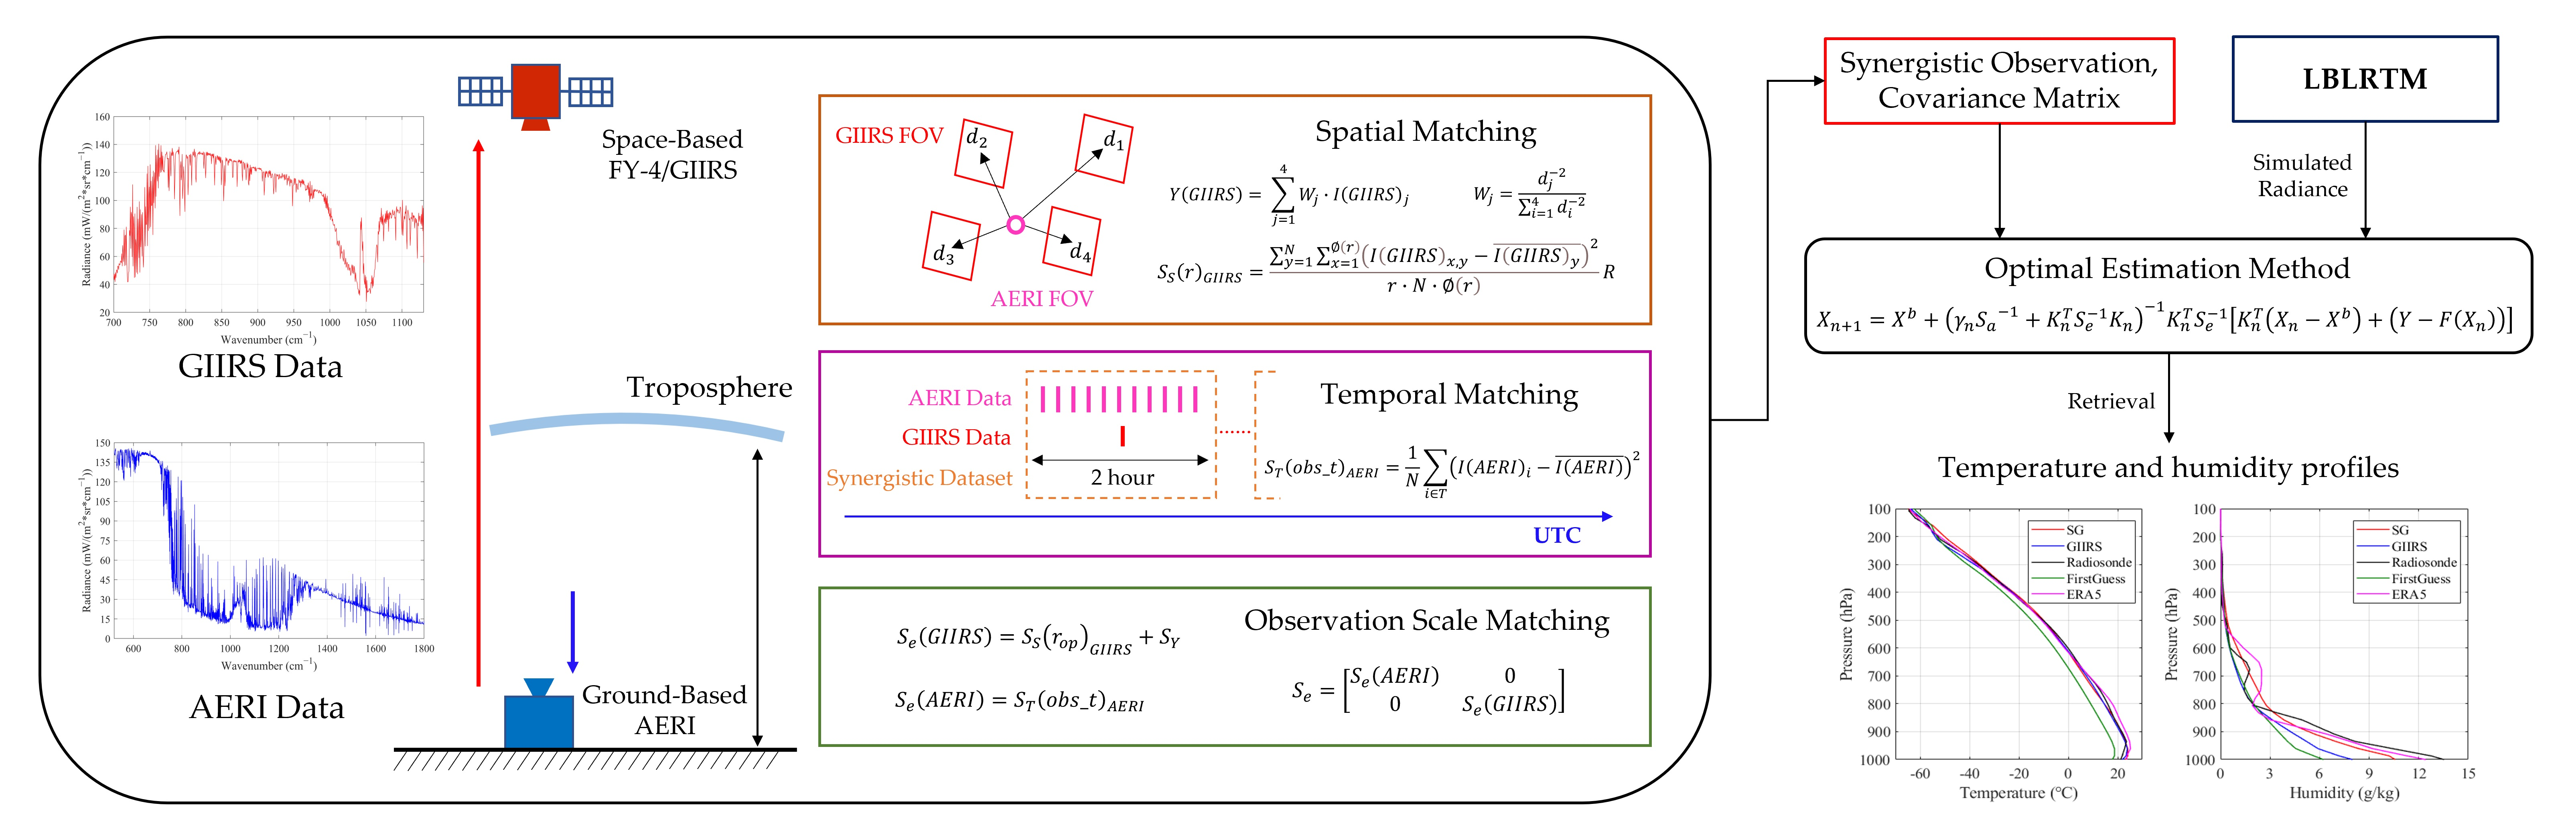
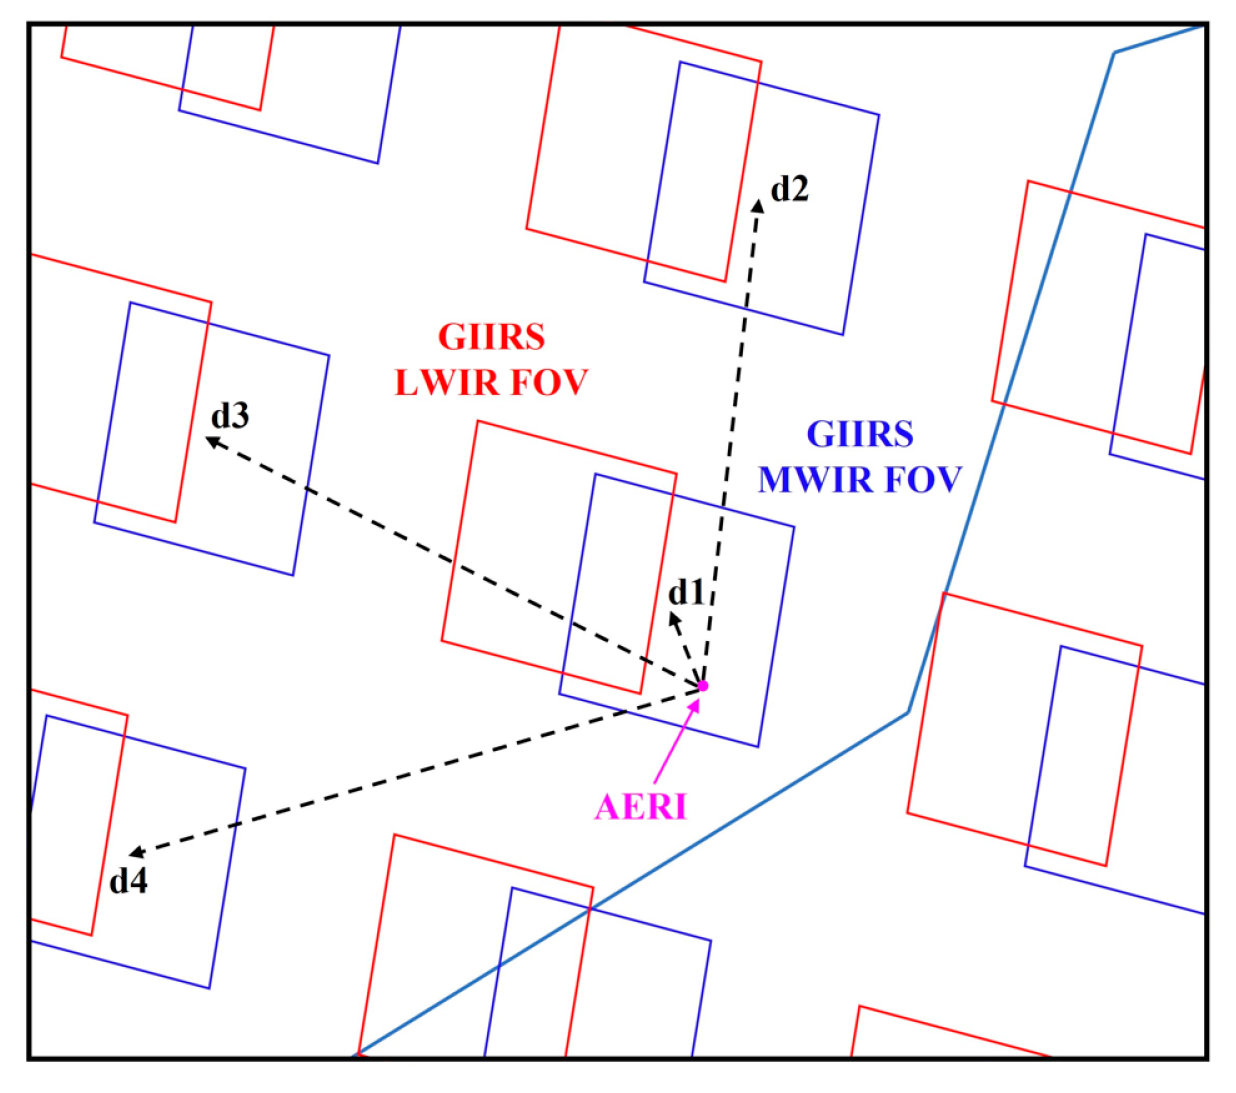
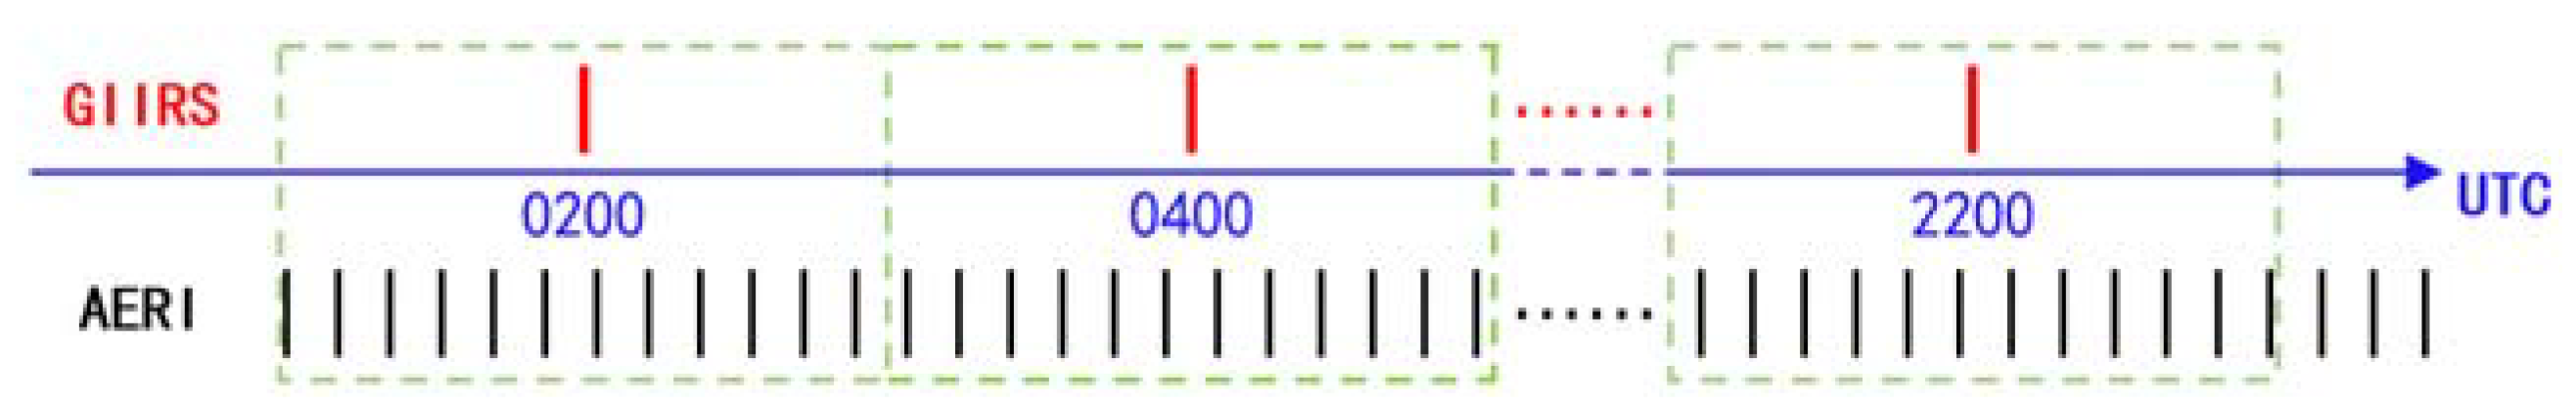
3.1.1. Spatial–Temporal Matching

Compared with the AERI that was placed in Qingdao and fixed to upward observation, The FY-4A/GIIRS has 128 fields of view (FOVs) arranged in a 32 × 4 array, and it performs the spatial scanning observation on geosynchronous orbit. Both observations should be matched to perform the synergistic retrieval, considering the imaging time and coordinate position of the observations. The AERI is located 11 km from the coastline, and the results revealed significant differences in radiance between the FY-4A/GIIRS sea and land FOVs under clear-sky conditions. Therefore, the FOVs whose footprints only include land were adopted in this paper.
Since the AERI data were obtained at a fixed location, the data may not completely correspond to the footprints of the GIIRS. To ensure the consistency of atmospheric synergistic observation data, it is assumed that the atmospheric status around the synergistic observation area is almost the same under local clear-sky conditions. As shown in Figure 2, the four nearest clear-sky FOVs of GIIRS are determined around the central AERI location, and then the spatially interpolated GIIRS observation on the location of the AERI is obtained with inverse-distance-weighted interpolation by the following form:
Y ( G I I R S ) = j = 1 4 W j · I ( G I I R S ) j
W j = d j 2 i = 1 4 d i 2
where I ( G I I R S ) j presents the original GIIRS FOV observation. W j is the inverse-distance-weighted coefficient in the position j, d j is denoted as the distance between the AERI and GIIRS FOV in the position j, and Y ( G I I R S ) is the interpolated GIIRS data on the position of AERI.
The GIIRS takes 2 h to complete the exploration for the Asia region, which is also the time interval for detection in the Qingdao area. AERI, however, can perform the measurement every 8 min. The high temporal resolution of the AERI was significantly superior to that of the GIIRS. Throughout the study, the observation time of the GIIRS data served as the basis for matching observation times in the synergistic retrieval. Based on the interpolation observation of GIIRS, registration was performed for the AERI data. Figure 3 illustrates the temporal matching process of GIIRS and AERI data. The AERI clear-sky data were selected 1 h before and after the GIIRS observation time for registration; that is, one GIIRS observation matches multiple AERI observations to obtain the matched synergistic retrieval observation dataset.

3.1.2. Cloud Screening

To reduce the interference of clouds and improve data quality, we preprocessed the data and retained only clear-sky FOVs before the retrieval experiments in the actual atmospheric temperature profile retrieval experiment. We applied the Himawari-8 L2 cloud parameter retrieval product (ftp:/ftp.ptree.jaxa.jp/pub/himawari/L2/CLP/ (accessed on 22 November 2021)) as the reference for identifying clear-sky regions and selected the observation data without the influence of clouds [44].

3.1.3. Sounding and ERA5 Data Processing

To generate the first guess profile from ERA5 data and conveniently compare radiosonde data with retrieval results, it is necessary to match the observation position and height of ERA5 reanalysis data and sounding data with the synergistic observation regional center. The specific methods are as follows. Step 1 is to use bilinear interpolation to interpolate the ERA5 data on the regular grid to the position of the AERI. Step 2 is the interpolation of ERA5 data in the time dimension. The ERA5 data were interpolated for one hour before and after each synergistic observation. Considering the vertical stratification of the temperature and humidity profile, we finally adopted the linear interpolation method to interpolate ERA5 data to a unified height layer. Interpolation is only performed on vertical sounding data when analyzing radiosonde data.

3.2. Synergistic Retrieval

3.2.1. Mathematical Background

To evaluate the distance between the atmospheric radiation observation vector Y and the simulated results calculated by the radiation transfer model F using the atmospheric state vector X , the cost function can be in the following form: J ( X ) = Y F ( X ) 2 .
Through retrieval optimization, the atmospheric state vector X , which includes the atmospheric temperature and humidity profile is gradually adjusted, so that the forward radiative transfer model-simulated observation F ( X ) approaches the radiation observation vector Y , where Y includes the observation values of the instruments AERI and GIIRS, and Y = [ Y ( G I I R S ) ,   Y ( A E R I ) ] T .
Assuming that the state vector X and observation vector Y conform to the Gaussian distribution, and considering the priori distribution of the atmospheric state vector to constrain the cost function solution process, the cost function can be expressed as:
J ( X ) = 1 2 [ ( X X b ) T S a 1 ( X X b ) ] + 1 2 [ ( Y F ( X ) ) T S e 1 ( Y F ( X ) ) ]
where S e and S a represent the observation error covariance matrix and background error covariance, respectively, and X b is a background atmospheric profile under local atmospheric conditions. S a is calculated from the sounding data over a month, while S e is usually determined by instrument calibration and radiative transfer model errors. The first and second terms of the cost function represent the background atmospheric state information constraint and the deviation between the simulated radiance and the actual observed, respectively. This study adopts the optimal estimation method to minimize the cost function. By performing a simplification and substitution, we calculate the derivatives of the cost function and obtain the iterative equation shown below [27]:
X n + 1 = X b + ( γ n S a 1 + K n T S e 1 K n ) 1 K n T S e 1 [ K n T ( X n X b ) + ( Y F ( X n ) ) ]
where n is the iterative index, and X n and X n + 1 represent the atmospheric state vector at steps   n and n + 1 in the iterative process, respectively. K is the Jacobian matrix F ( X ) X , that is, the sensitivity of the forward model results F ( X ) to the atmospheric state X , and γ n is the damping coefficient, and its value is the nth value of the vector [ 2000 ,   1000 , 800 ,   500 ,   300 ,   100 ,   1 ,   1 ,   1 ,   1 · · · · · · ] .
The convergence condition of the iteration can be expressed as:
| x n x n + 1 | 2 < 0.05
According to Masiello et al., the posterior covariance S , which is the error covariance of solution [45], is calculated as:
S = ( γ n S a 1 + K n T S e 1 K n ) 1 ( γ n 2 S a 1 + K n T S e 1 K n ) ( γ n S a 1 + K n T S e 1 K n ) 1
The averaging kernel A, which provides measurement of information content about the retrieved solution, is given as:
A = ( γ n S a 1 + K n T S e 1 K n ) 1 ( K n T S e 1 K n )
For retrieved profile, the diagonal elements of A represent the degrees of freedom for signal (DFS), and the square root of the diagonal components of S quantifies uncertainties [27].

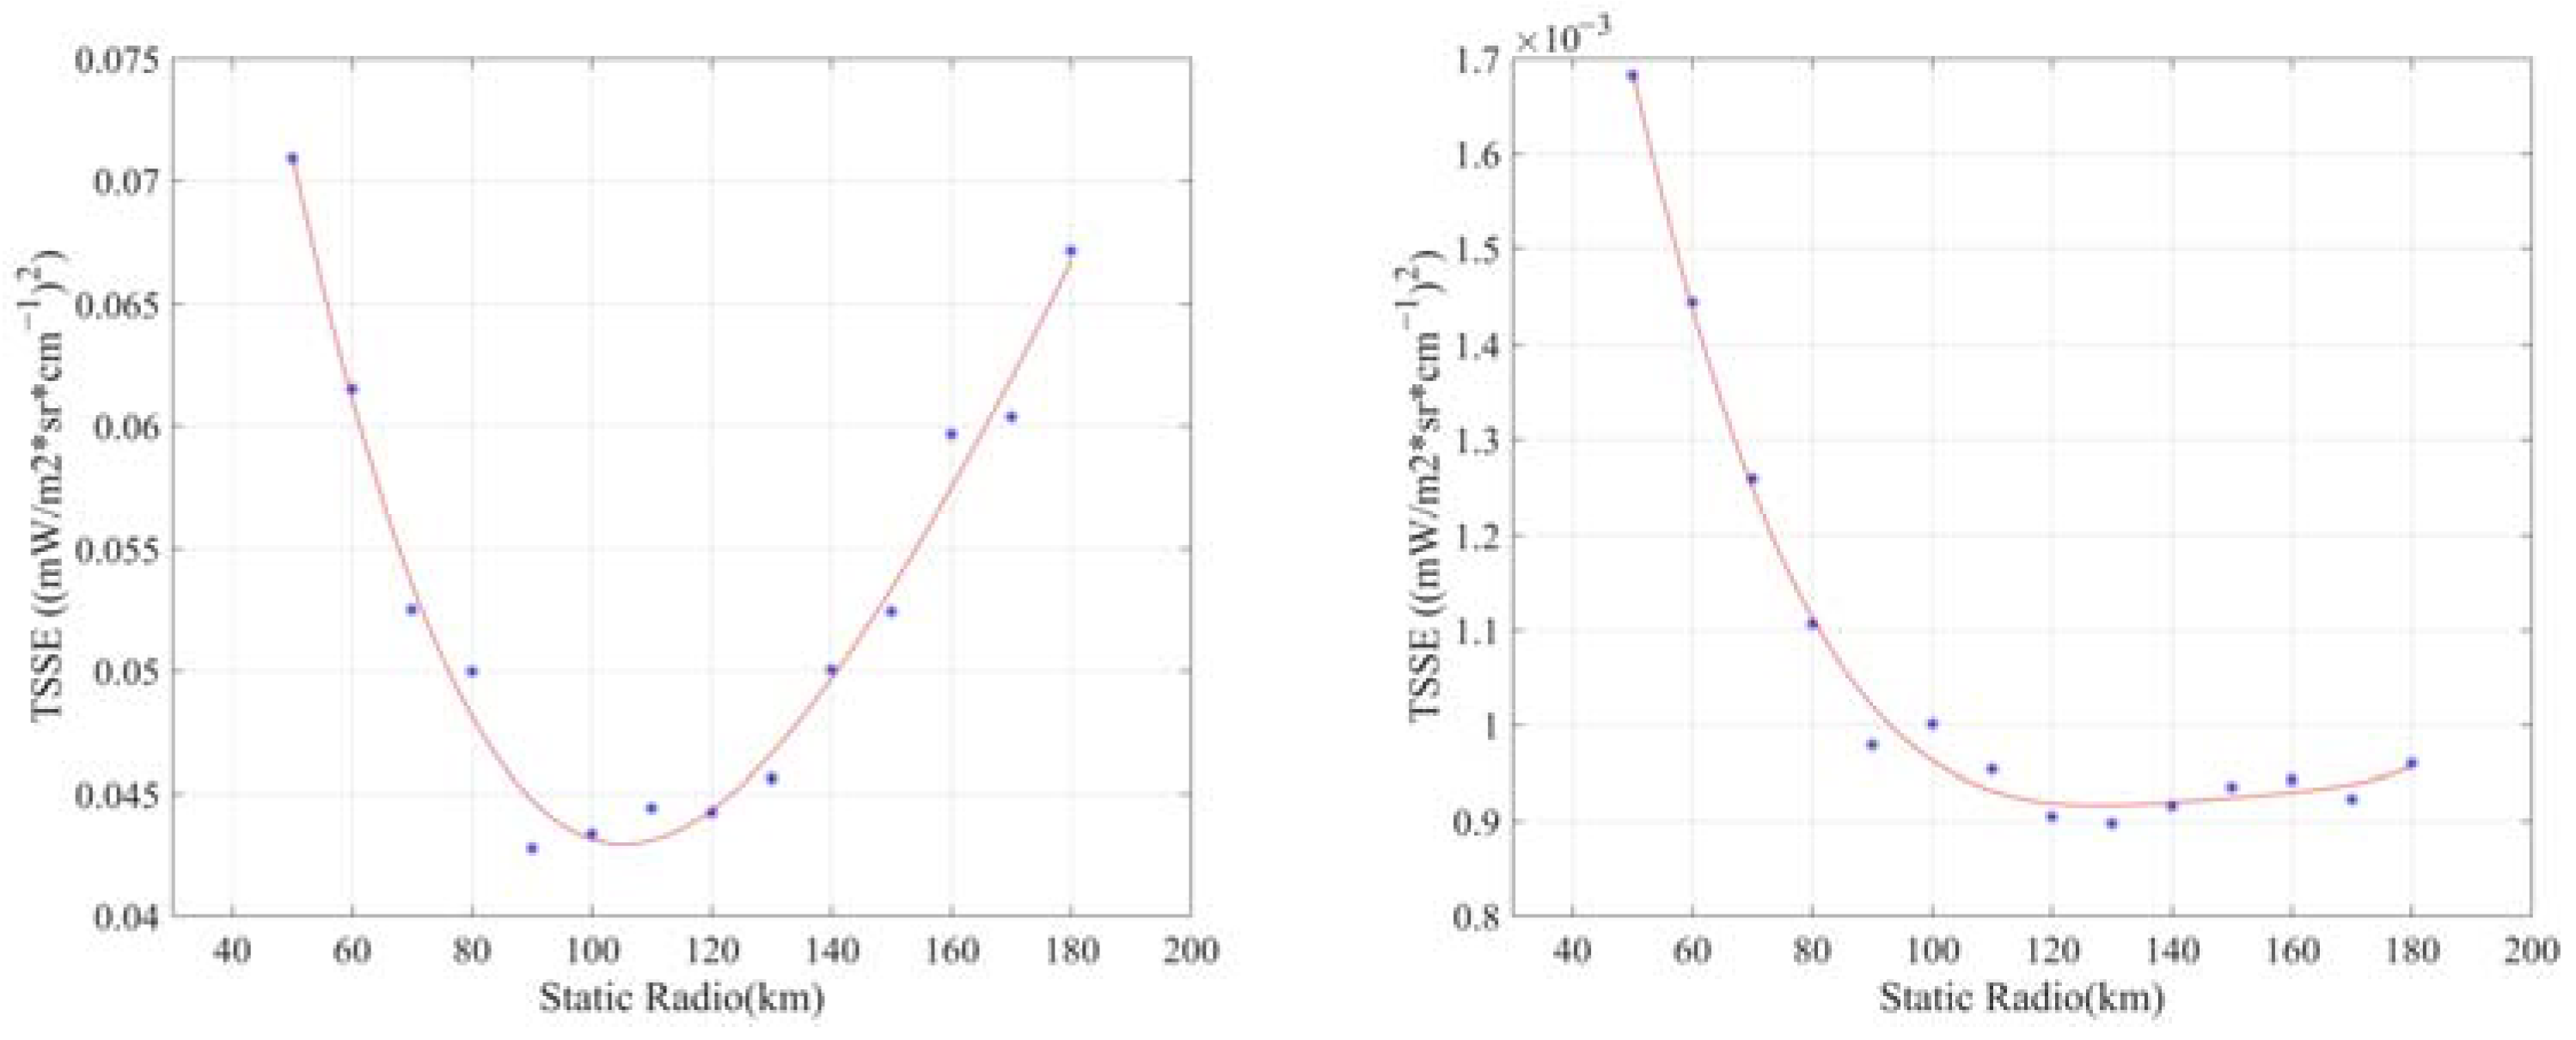
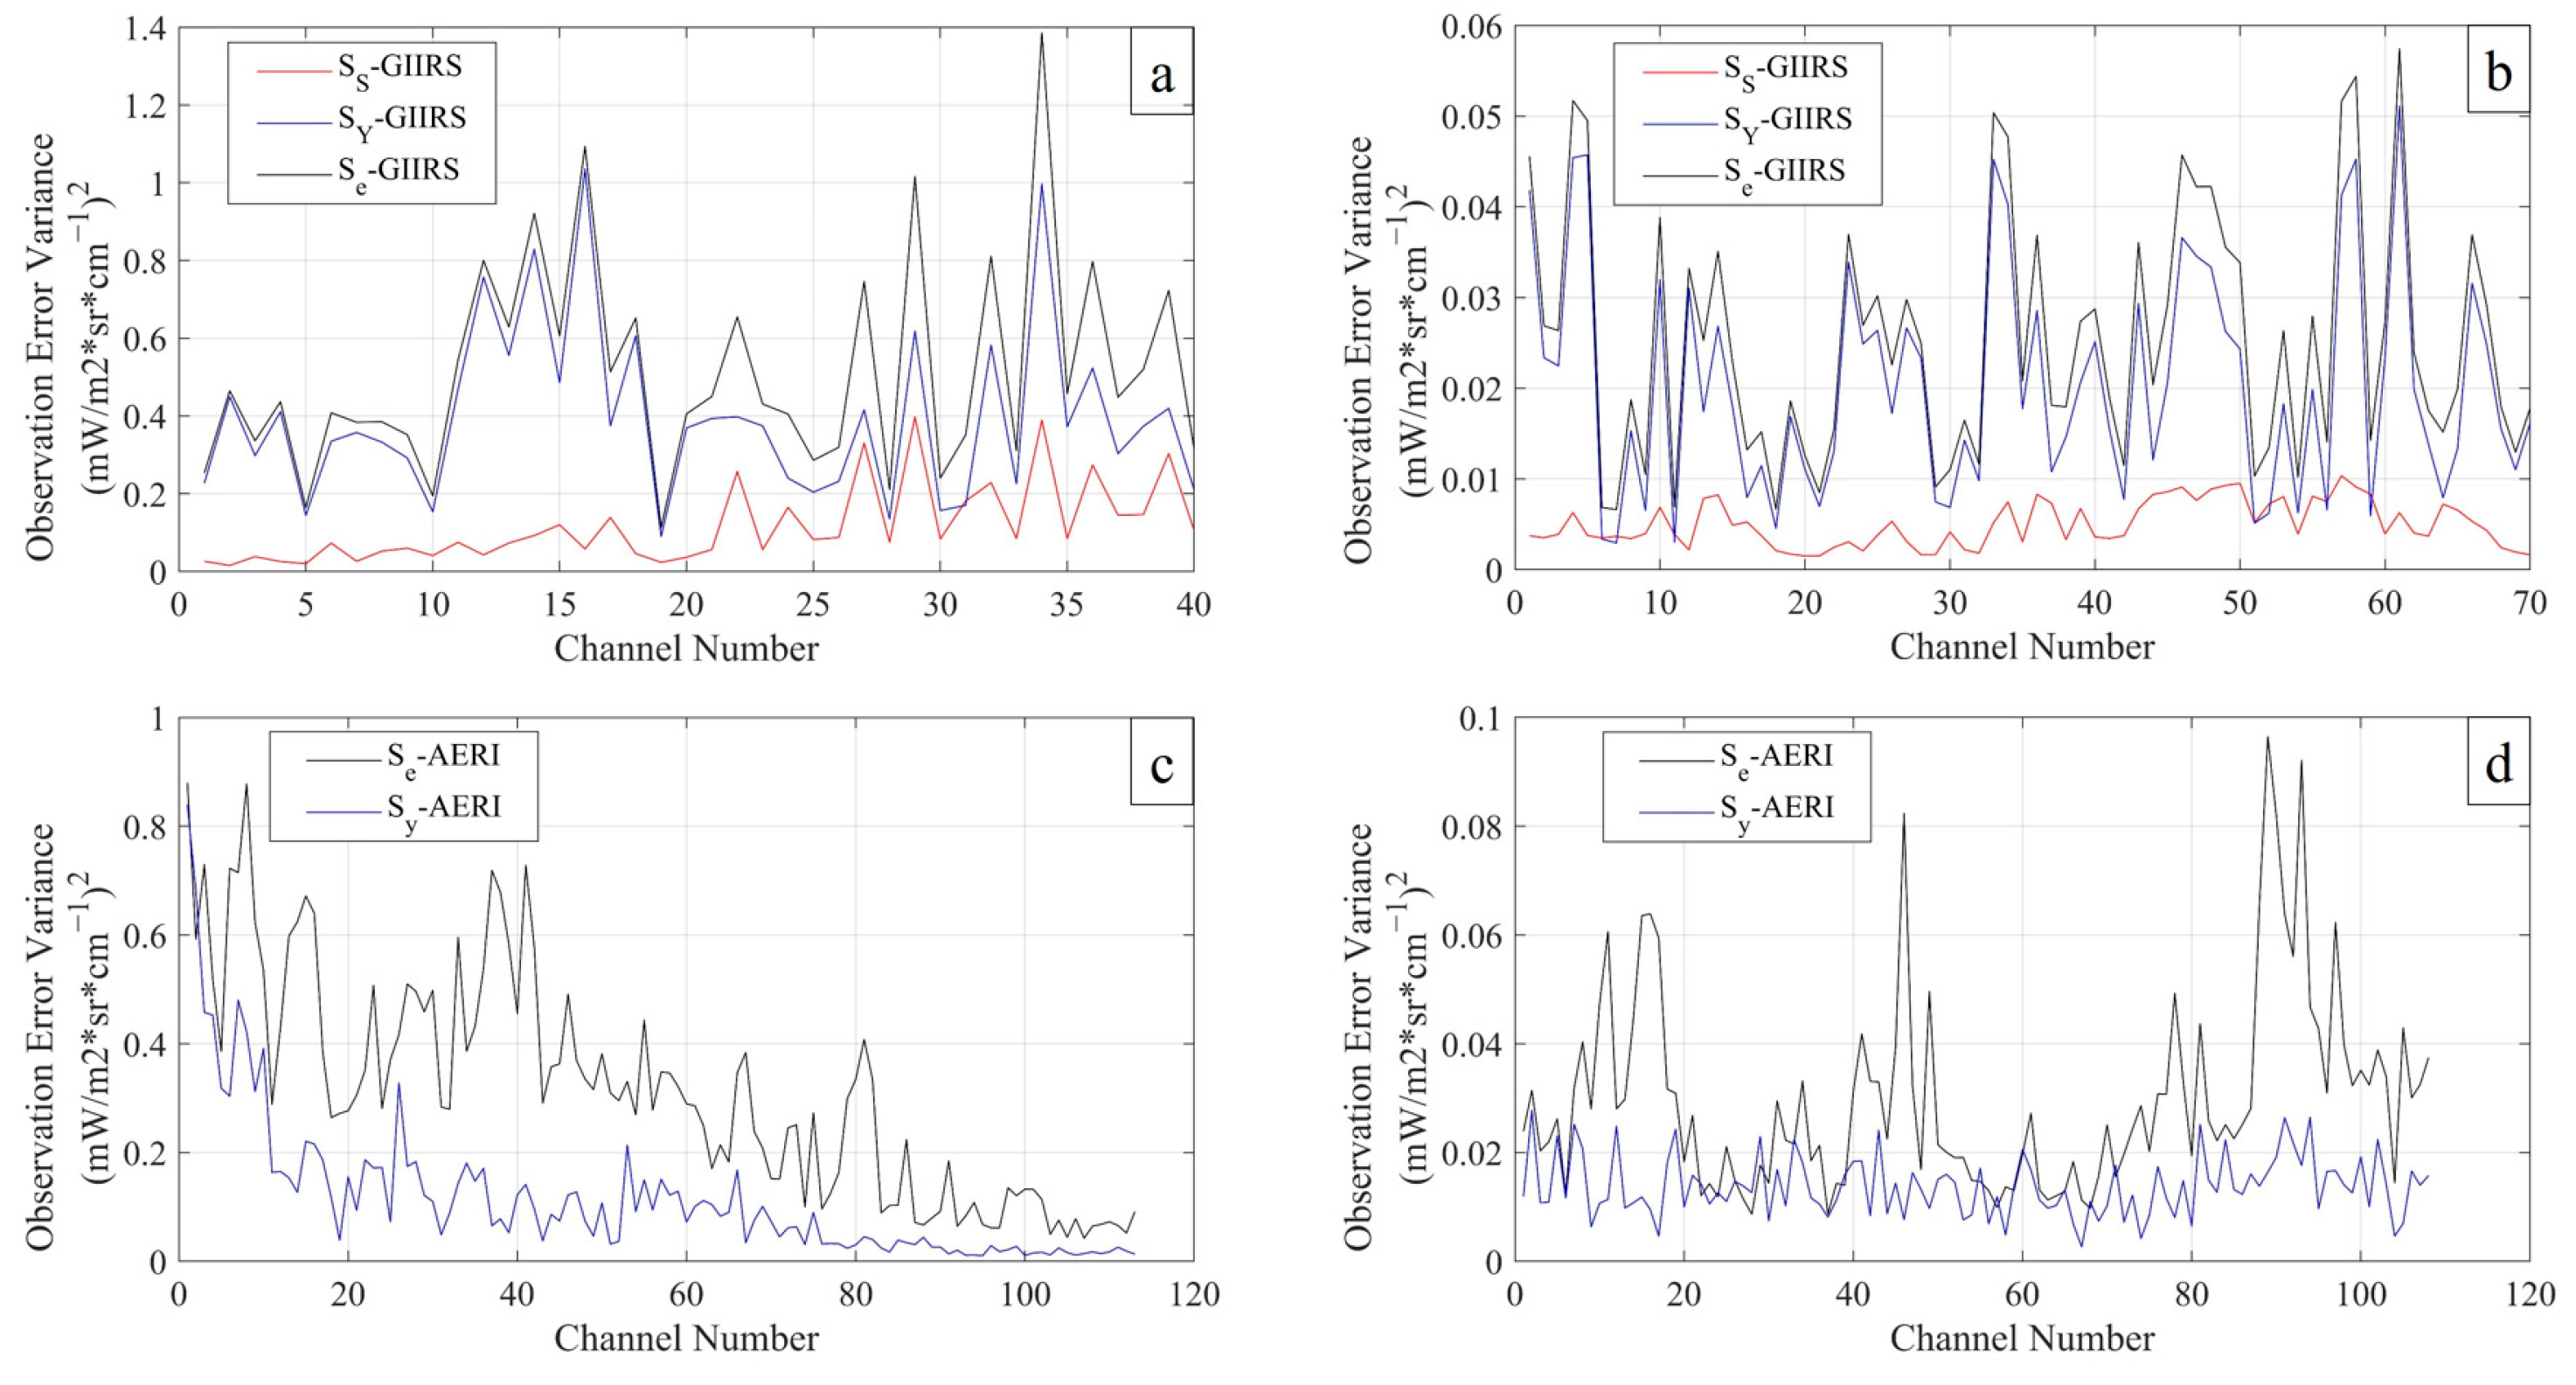
3.2.2. Observation Scale Matching

In synergistic retrieval, the spatial and temporal resolutions of AERI and GIIRS are quite different, so it is necessary to match the scale of the various observation data in the retrieval process. In this study, the error caused by the observation scale is considered in the observation error covariance matrix, and the observation error covariance is defined as the matrix S e .
S e = S Y + S F + S S + S T
S e is divided into four parts: (1) instrument observation error S Y , (2) radiative transfer process modeling error S F , (3) spatial distribution error s of the observation data S S , and (4) time variation error of the observation data S T . For the convenience of calculation and retrieval, a good compromise is to assume that S F is zero and to expand S Y by four times more than its original value [30].
For FY-4/GIIRS data, the temporal resolution is much lower than that of the AERI, and there is only one practical observation in one synergistic observation. Thus, the change in observation over time is negligible. Therefore, in addition to the instrument observation error S Y , the spatial distribution error is the primary source for GIIRS in synergistic retrieval. The observation field of the AERI (approximately 200 m projected to 5 km altitude) is far smaller than the spatial resolution of the GIIRS (approximately 16 km). In order to calculate the observation error covariance of matching FOV for the GIIRS, the observations of the GIIRS FOVs within radius r are selected as once regional sample with the AERI as the center of the circle for statistics. Then, the results are corrected according to the statistical radius r and the spatial resolution R of the GIIRS to estimate the observation error covariance of the GIIRS FOV observation, expressed as:
S S ( r ) G I I R S = y = 1 N x = 1 ( r ) ( I ( G I I R S ) x , y I ( G I I R S ) y ¯ ) 2 r · N · ( r ) R
where ( r ) is the number of GIIRS FOVs in one regional sample when the statistical radius is r , I represents the observed radiance, and N is the number of regional samples. To select the optimal statistical radius r o p , we define the total spatial statistical error (TSSE) under statistical radius r as follows:
T S S E = 1 M t r [ S S ( r ) G I I R S ]
For all channel variances under different statistical radii, t r [ S S ( r ) G I I R S ] is the trace of the observation error matrix S S ( r ) G I I R S , M is the number of channels used for retrieval, and the change in TSSE with statistical radius r is shown in the Figure 4:
When the local atmospheric environment is similar, it is evident that with the increase in the statistical radius, the gradually increasing statistical samples reduce the random error caused by the insufficient observation samples, making the TSSE close to the local atmospheric observation error. After more than 100 km, the atmospheric environment within the statistical radius no longer conforms to the similarity assumption and increases the TSSE. According to the principle of minimum variance, the optimal statistical radius r o p is approximately 100 km; that is, within this range, the S S of the GIIRS FOV in synergistic observation can be estimated according to the above formula. Therefore, the observation error covariance of the GIIRS is expressed as:
S e ( G I I R S ) = S S ( r o p ) G I I R S + S Y
For AERI, the observation method is fixed-location observation, there is no spatial distribution error, and the observation error is S T which caused by the change in atmospheric state within the matching observation time:
S e ( A E R I ) = S T ( o b s _ t ) A E R I = 1 N i T ( I ( A E R I ) i I ( A E R I ) ¯ ) 2
N is the number of observations in o b s _ t period, and o b s _ t is the time of synergistic observations. Finally, the error covariance matrix of the synergistic observation vector Y is:
S e = [ S e ( A E R I ) 0 0 S e ( G I I R S ) ]
The spectral channel variance and its components for GIIRS and AERI are shown in Figure 5.

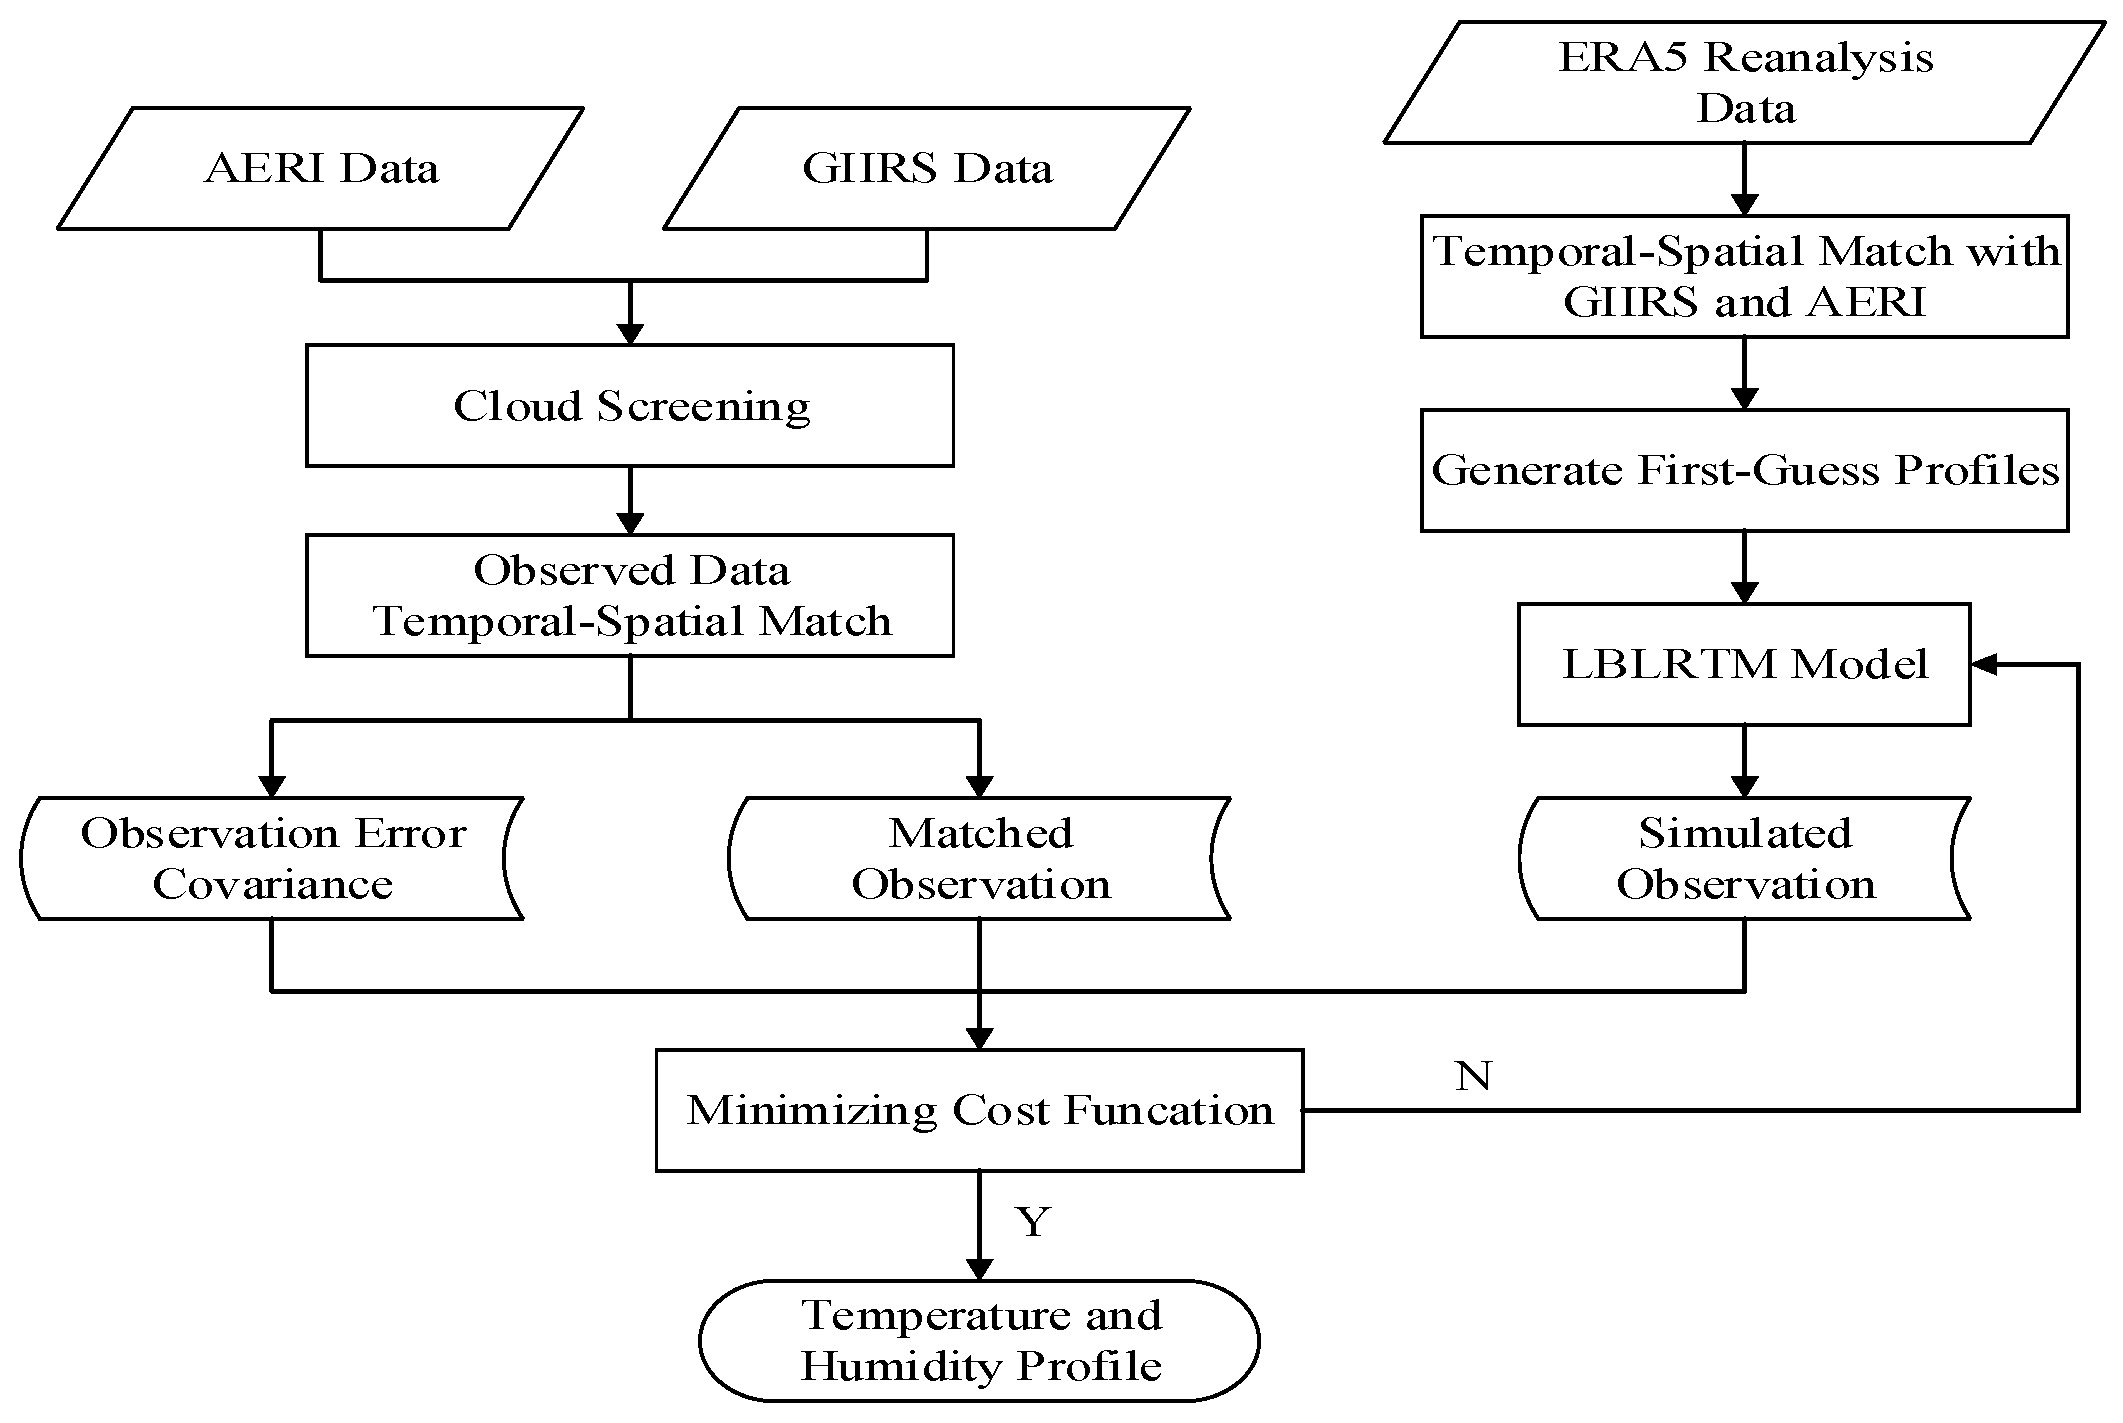
3.3. Retrieval Process Framework

The flow chart shown in Figure 6 summarizes the framework of the atmospheric temperature and humidity profile retrievals in synergistic observations. The algorithm flow includes screening GIIRS and AERI clear-sky observations combined with Himawari-8 cloud product data, calculating the observation error covariance matrix of space-based and ground-based data, spatial and temporal matching for space-based and ground-based observation data, and utilizing synergistic retrieval model based on the optimal estimation method.
In the retrieval process, the cloud-screened data are input into the spatial and temporal matching model to obtain the synergistic observation dataset of the radiance under clear-sky conditions. At the same time, taking the monthly means of ERA5 reanalysis data as the first guess profile, the radiative transfer forward model is run to calculate the simulated spectral observation and K matrix. Then, combined with the radiative transfer forward model results and the observation error covariance matrix that is scale-matched, the nonlinear iteration algorithm is executed, and the results are evaluated after each iteration. If the retrieval process does not converge, the atmospheric profile is updated and run in the radiative transfer mode until the final result is obtained or the maximum number of iterations is reached.

4. Results and Comparison
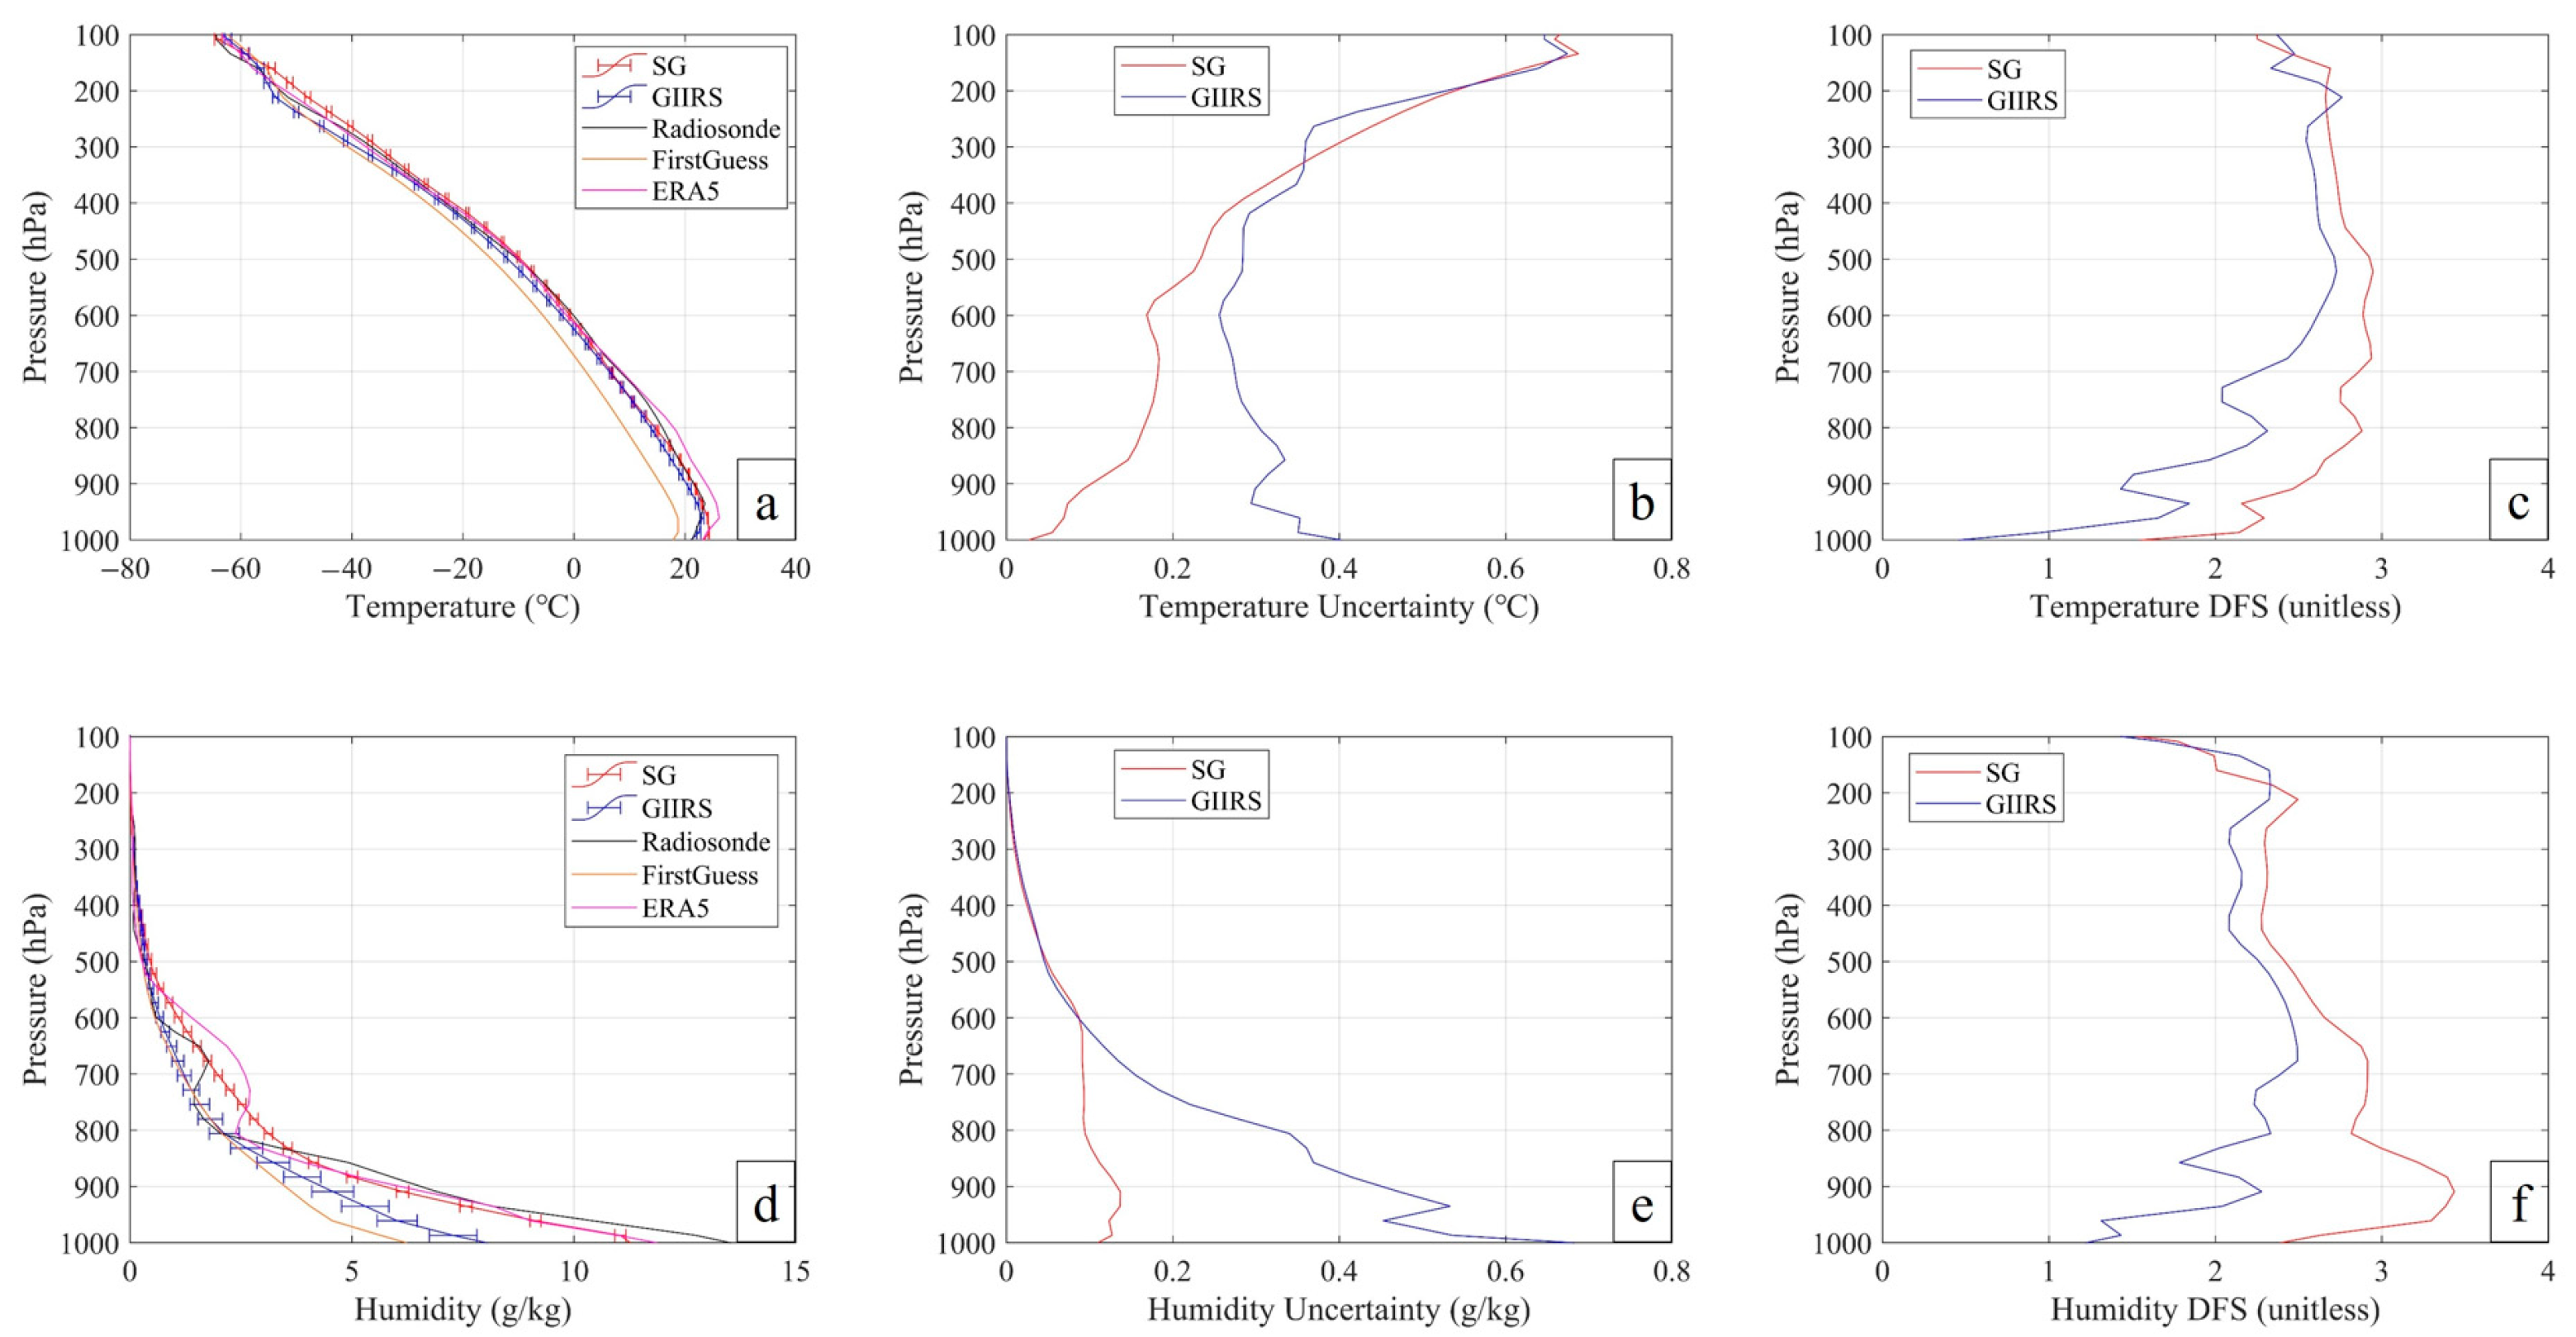
Qingdao was selected as the experimental research area, and the AERI was deployed in the Qingdao Research Institute of Beihang University. The altitude of the position of the AERI is 68 m, and the annual average pressure of Qingdao is approximately 1000 hPa. Considering that our research target is the troposphere, the results are interpolated between 1000–100 hPa. The summer and winter observation data from 2020 to 2021 were selected as research cases.
ERA5 data were obtained by the data assimilation process and reflect the vertical distribution of the atmospheric temperature and humidity at a fixed location in the regular grid. This process is similar to our retrieval algorithm, so the ERA5 and in situ radiosonde measurements are still different. In our analysis, the sounding results are taken as the reference true values. We regard the RMSE and Mean Bias (MB) profiles of ERA5 as the inherent error of the retrieval technology relative to the sounding measurements, taking cross verification. To facilitate the comparison of the temperature and humidity retrieval results, the humidity mixing ratio is converted into relative humidity, and the conversion formula is as follows:
e s = 6.108 · e x p [ 17.269 · T ( T + 273.15 ) 38 ]
e = P · q 0.622 + q
R H = e e s · 100 %  
where e is the steam pressure, q is the water vapor mixing ratio, P is the air pressure, T is the air temperature, e s is the saturated vapor pressure, and R H is the relative humidity.
The MB and RMSE are used as statistical indicators to evaluate the accuracy of the retrieval temperature and humidity profile results:
MB = i = 1 N ( x i x i ) n  
RMSE = i = 1 N ( x i x i ) 2 n  
where n represents the number of samples, x i represents the radiosonde value, and x i represents the retrieval result.
First, we show the advantages of the synergistic retrieval over GIIRS individual retrieval and then evaluate the accuracy of the synergistic retrieval results in different seasons. Finally, the high-temporal-resolution atmospheric stability index calculated from the synergistic retrieval results of GIIRS and AERI in the preconvective environment will be introduced.

4.1. Case Study

To illustrate the difference between GIIRS individual retrievals and synergistic retrievals, we selected a case from 2021 to study. Figure 7 shows the temperature and humidity profile (Figure 7a,d) obtained through retrieval, as well as the corresponding uncertainty (Figure 7b,e) and the information content (Figure 7c,f). The black line and magenta line represent sounding data and ERA5 reanalysis data, respectively; the orange line represents the first guess; and the red and blue lines with error bars represent synergistic retrieval (SG) results and GIIRS individual retrieval (GIIRS) results, respectively.
The individual retrieval and synergistic retrieval results reflect the changing trend of temperature and humidity, but the individual retrieval results at the bottom are not as good as the synergistic retrieval results, especially for the humidity results. Compared with the ERA5 data, there is a relatively obvious retrieval error at 700 hPa for humidity. In terms of uncertainty, the synergistic retrieval optimizes the uncertainty in the lower atmosphere below 600 hPa, making it stable below 0.2 K and 0.2 g/kg, while the maximum uncertainty of GIIRS is 0.4 K and 0.6 g/kg. Similarly, in terms of the DFS, the synergistic retrieval performs better in humidity results than GIIRS alone. The DFS provided by GIIRS in the lower atmosphere is less than that in the upper atmosphere. The synergistic method adding ground-based observations complements the lack of information in the boundary layer for space-based observations; thus, the accuracy and uncertainty of the synergistic retrieval for the lower atmosphere are improved.

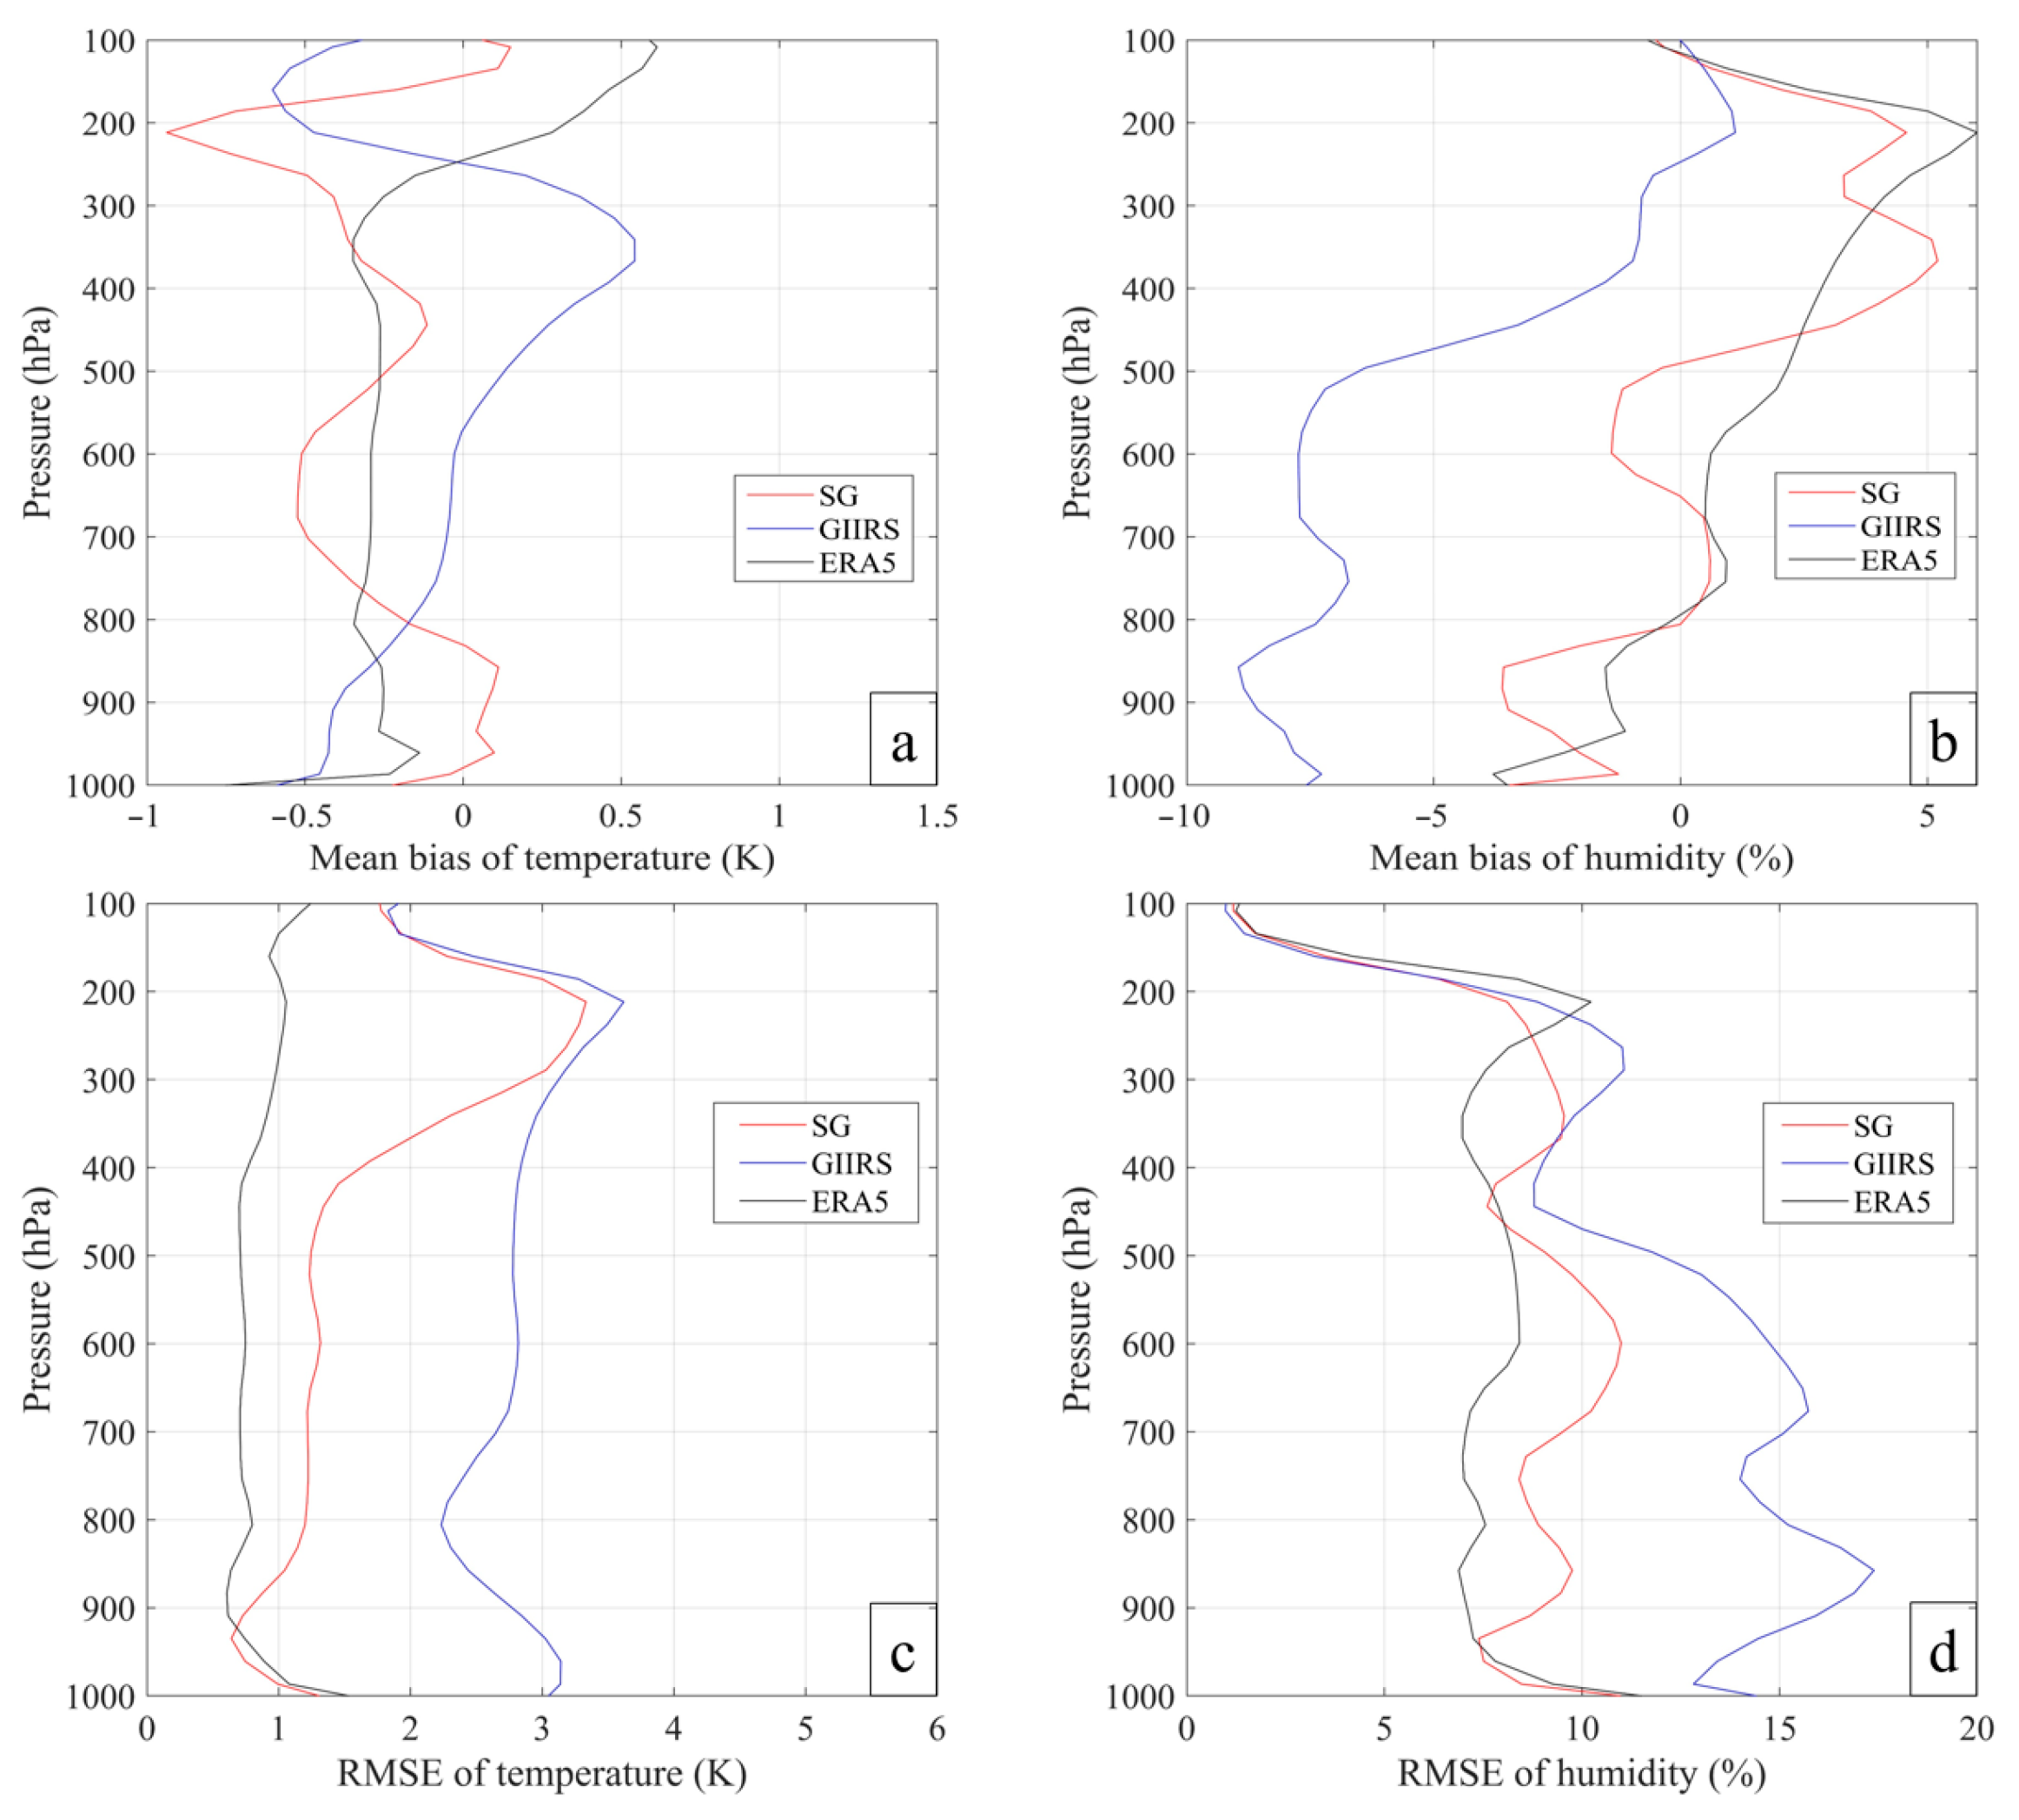
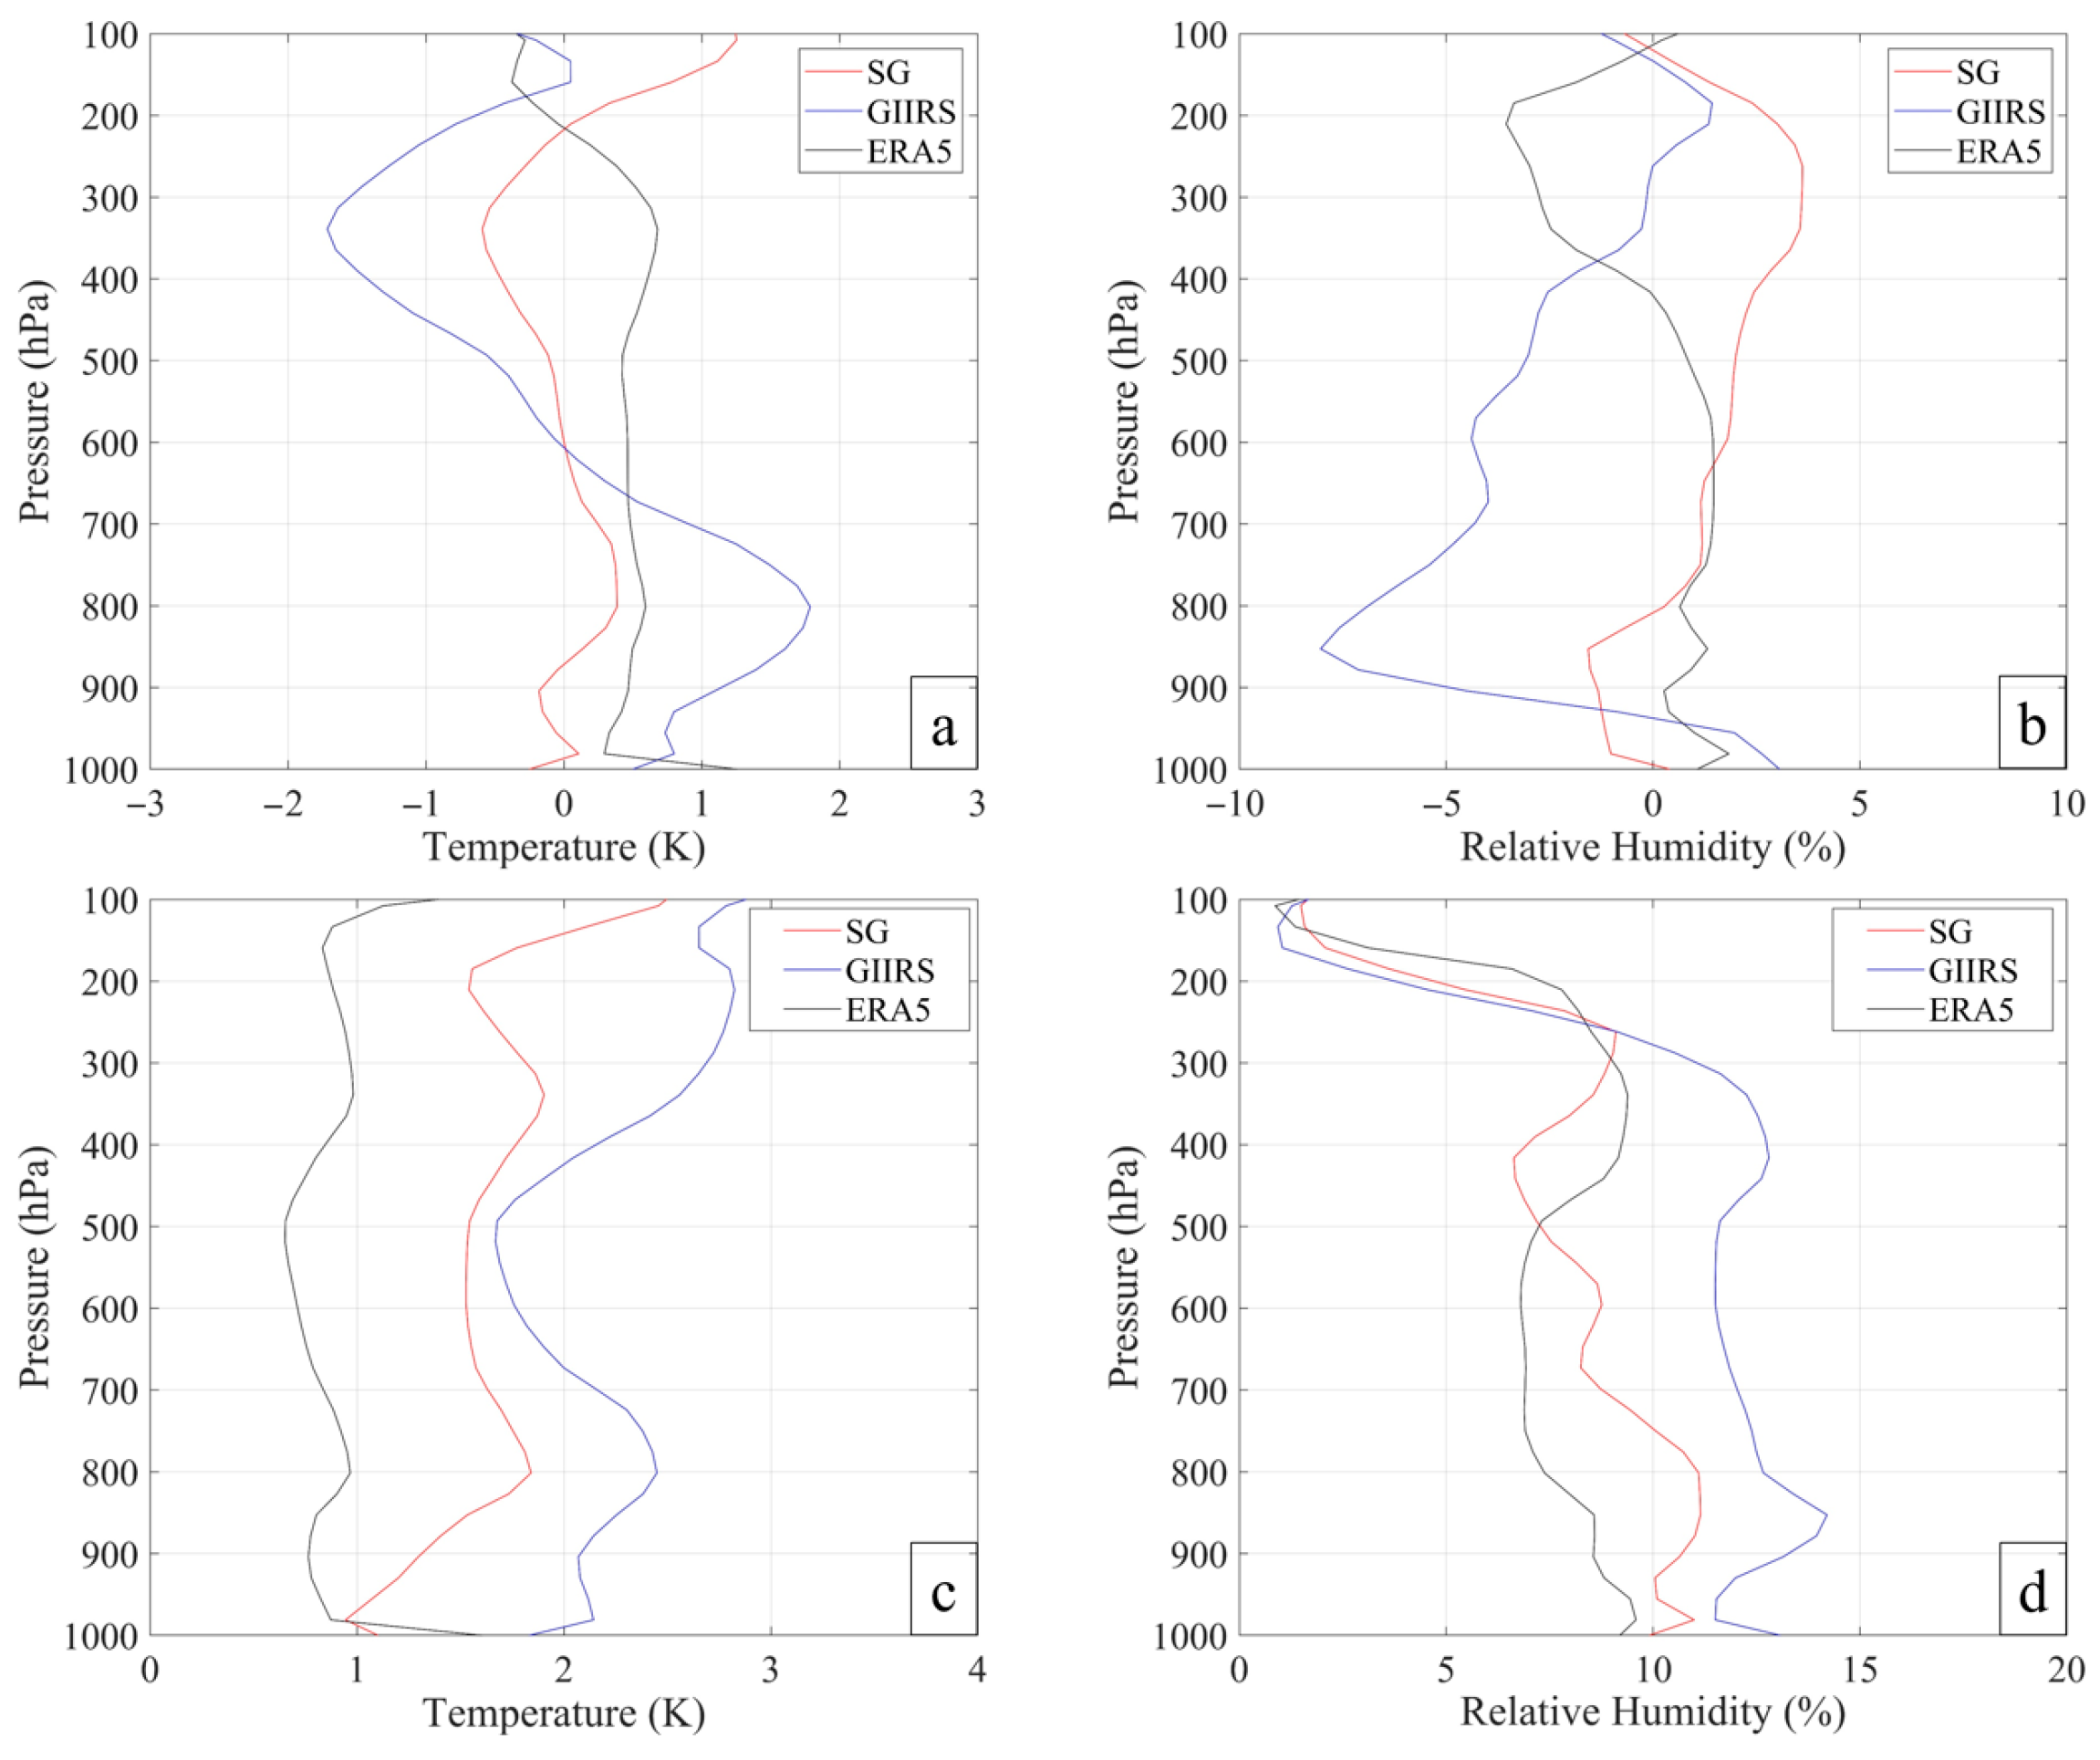
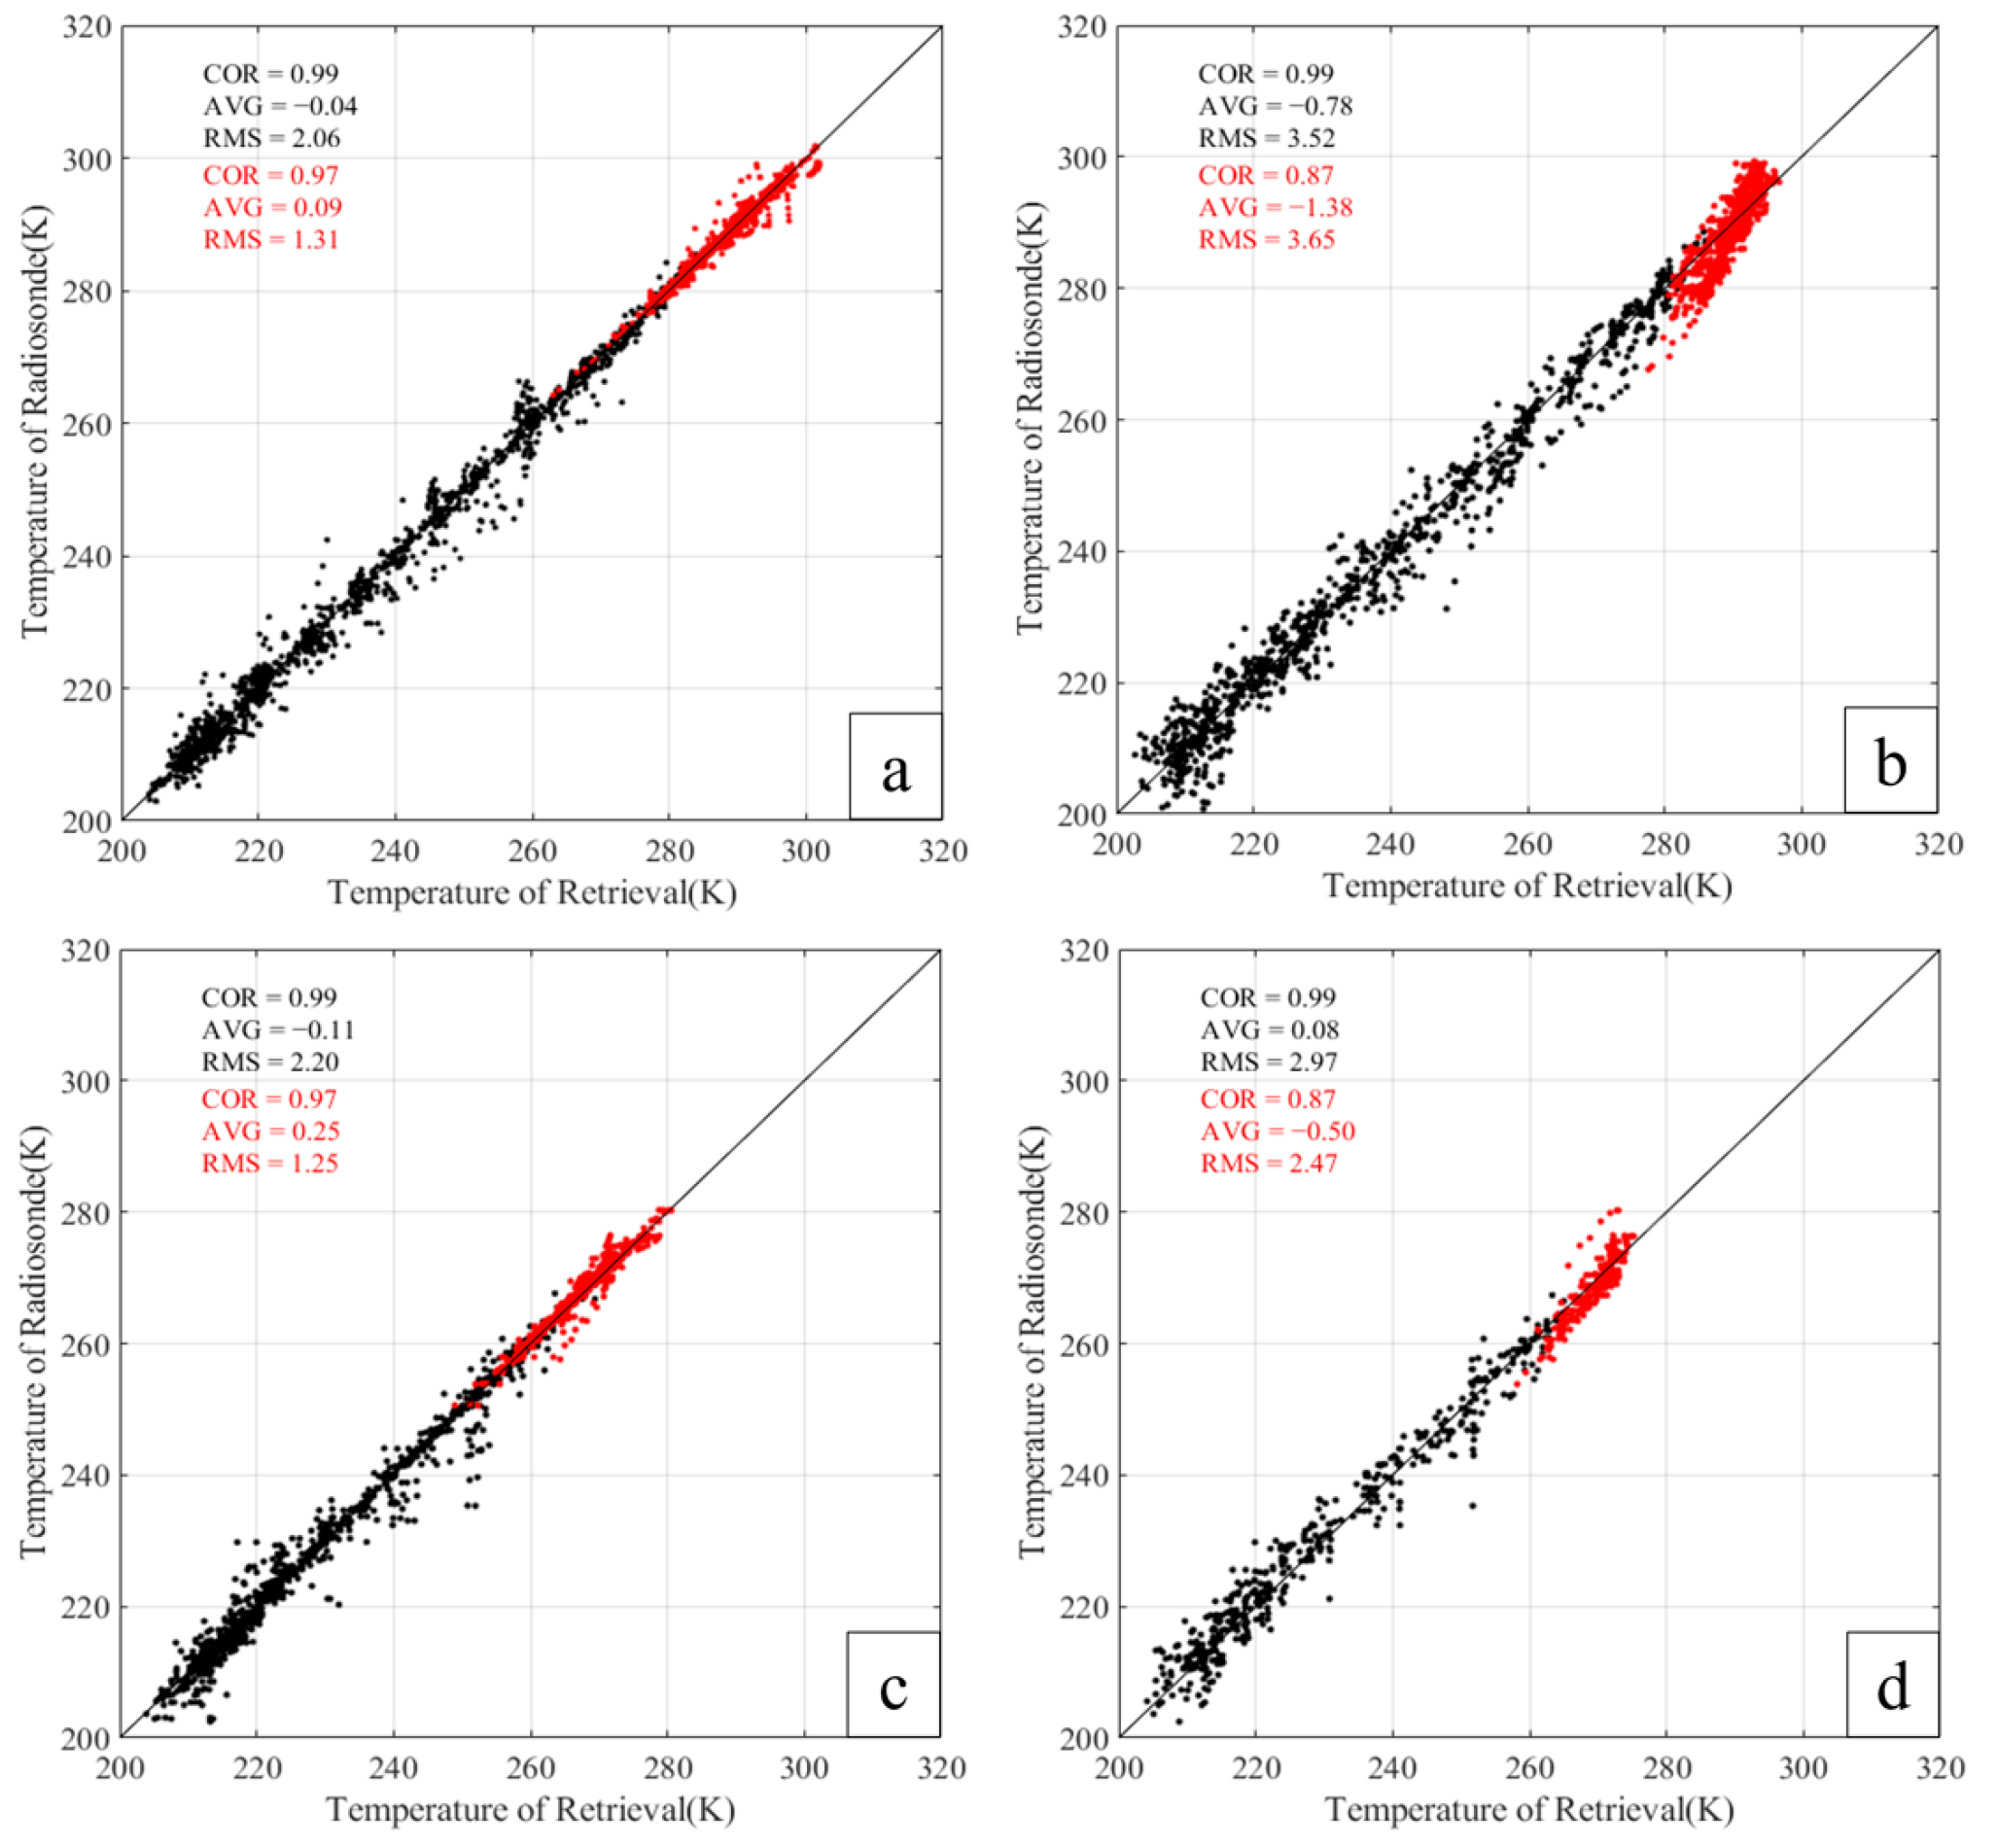
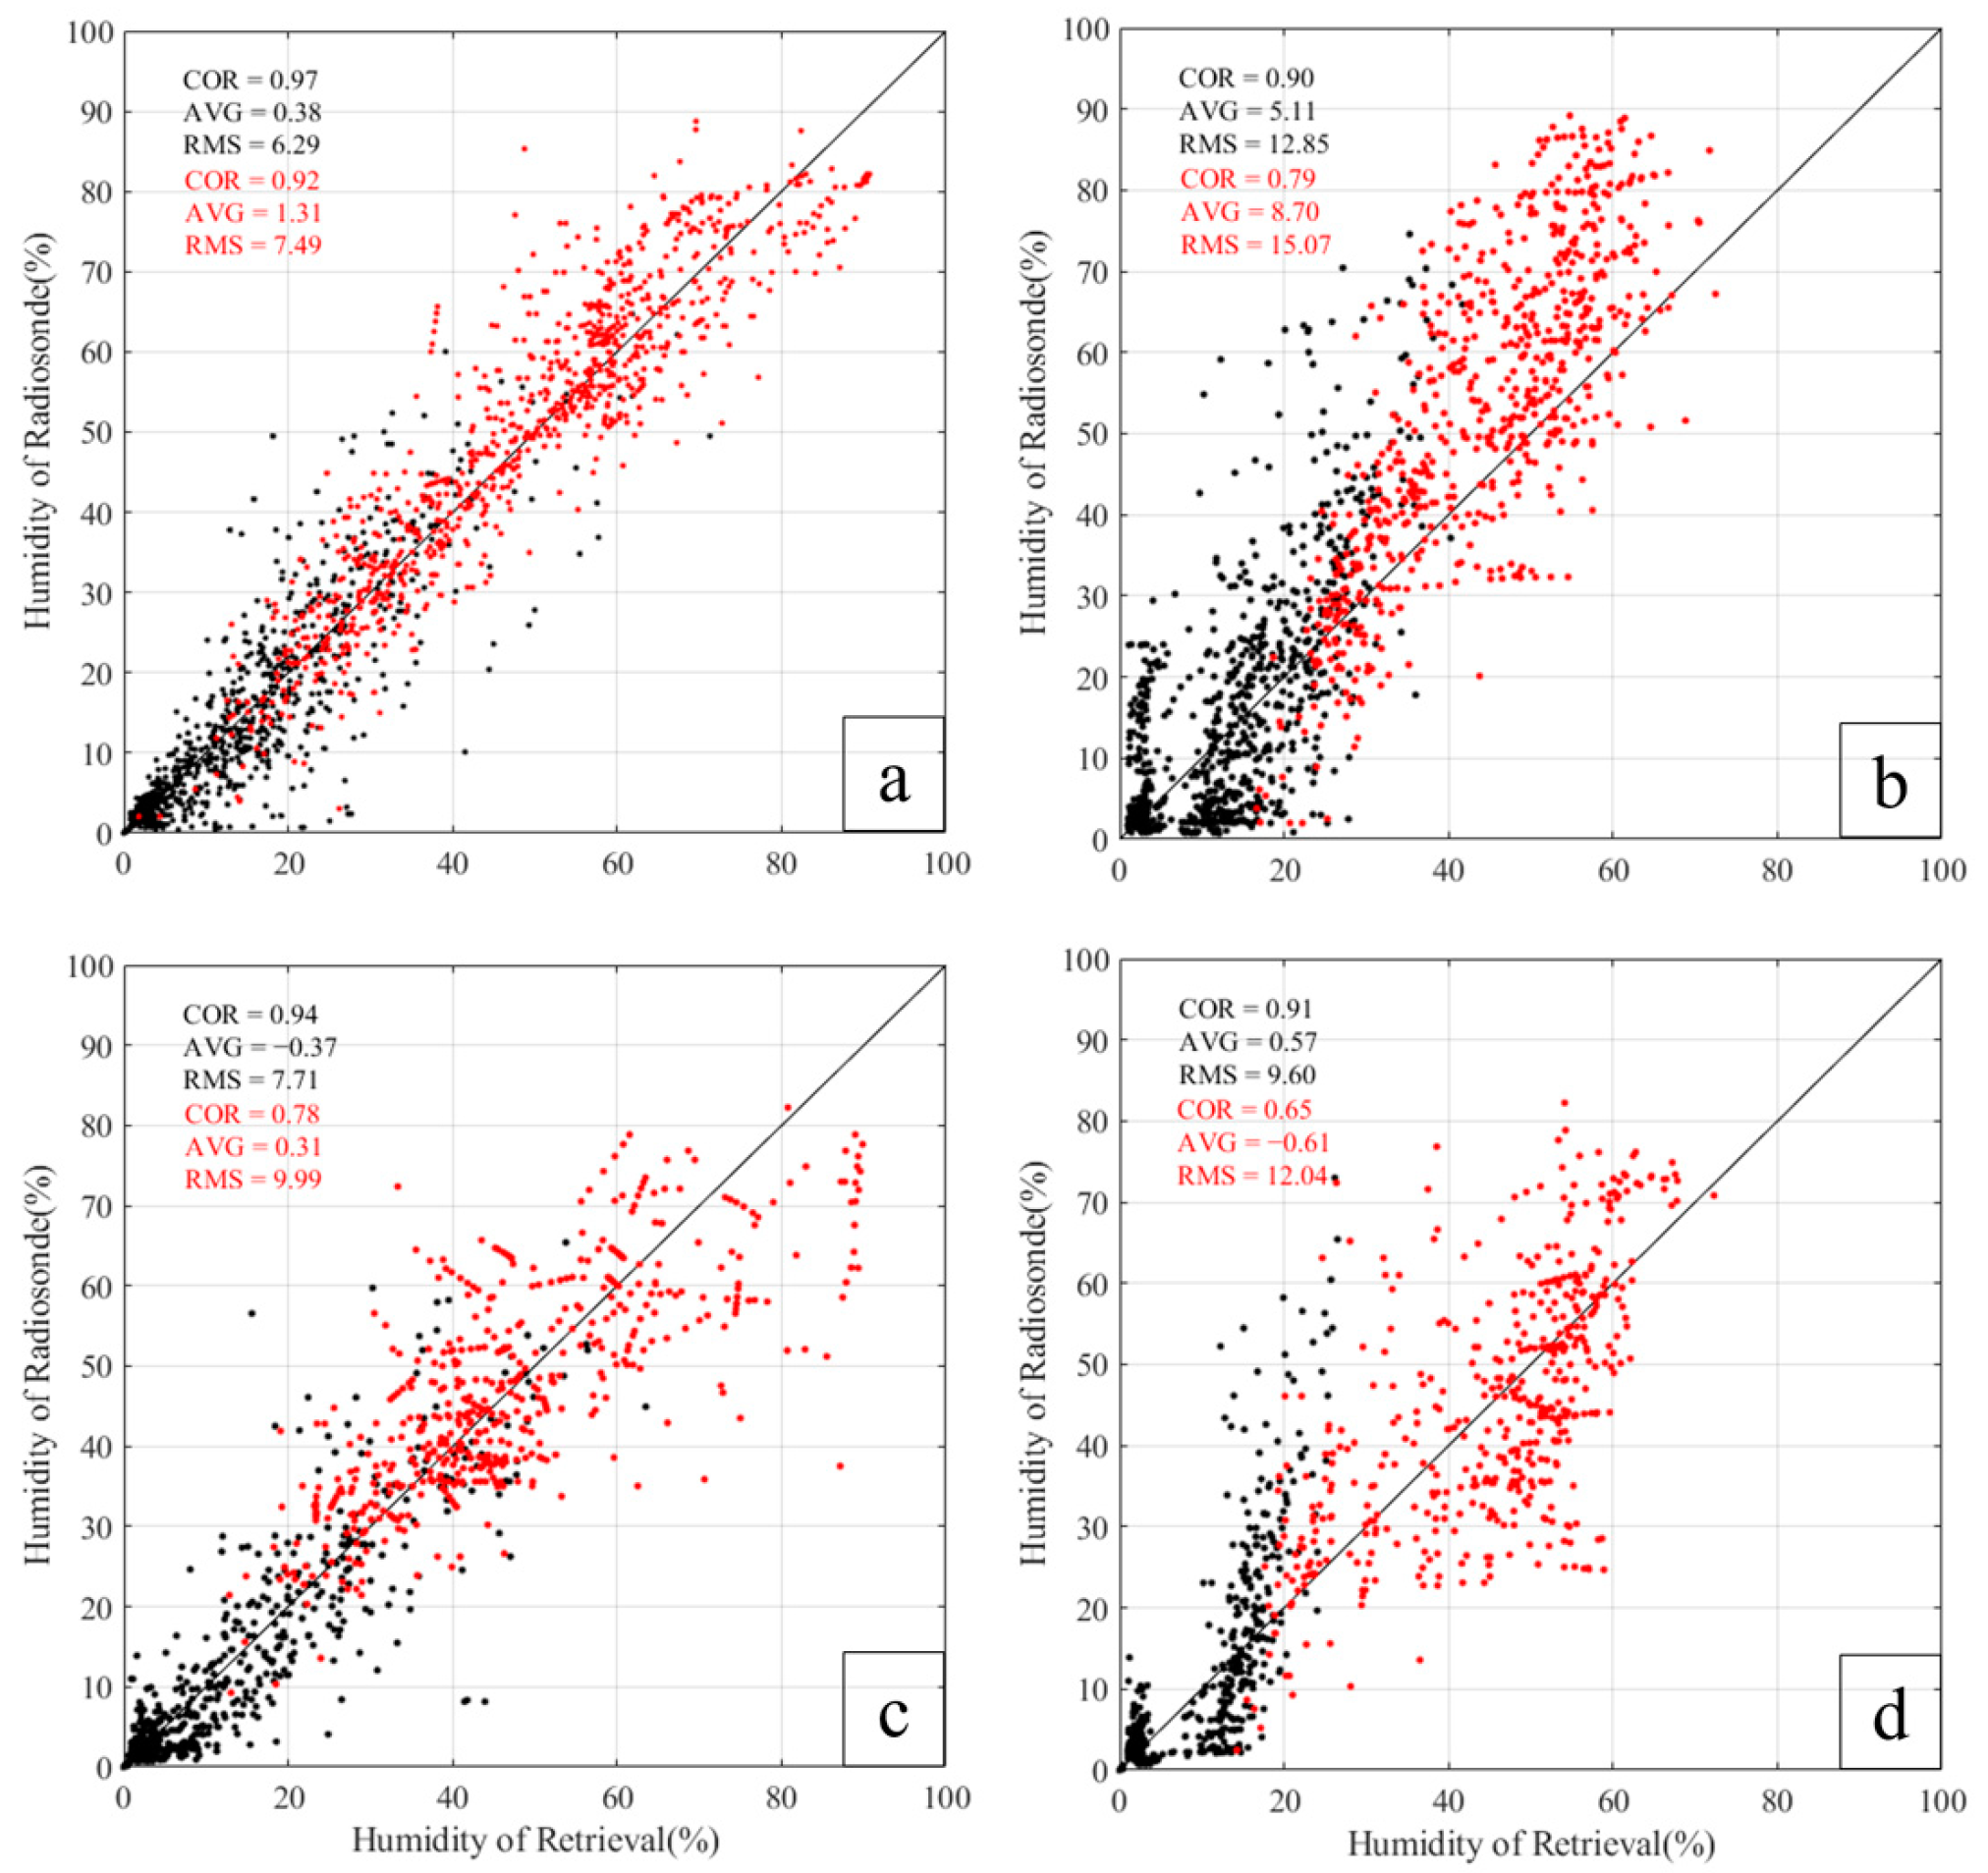
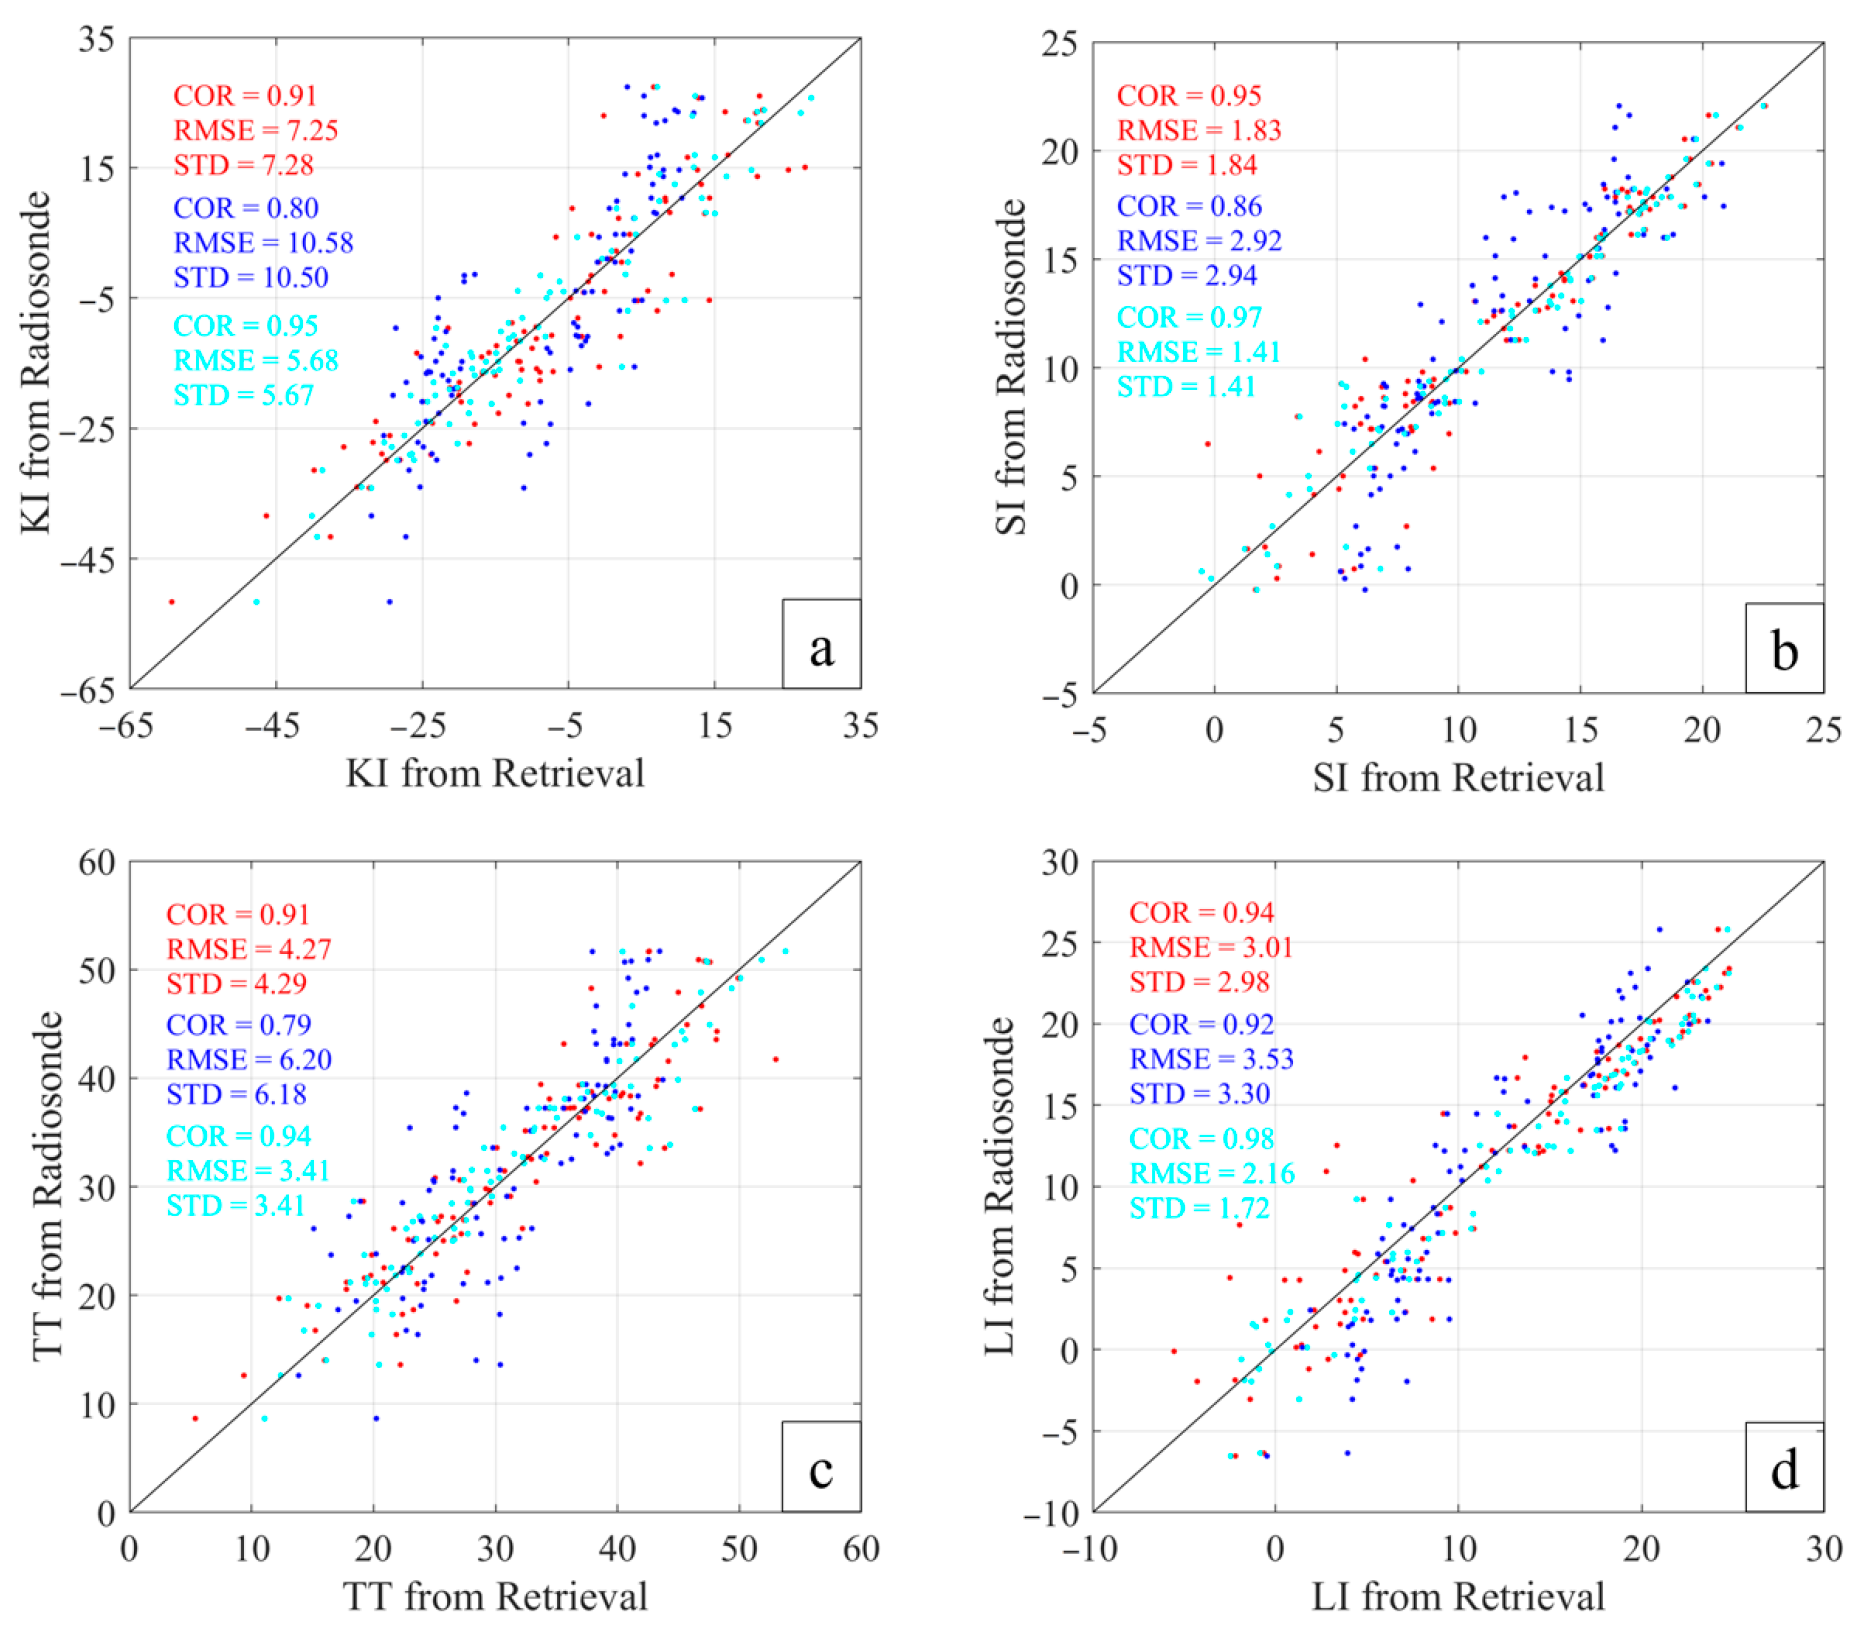
4.2. Statistical Results of Retrieval

Taking sounding data as a reference, we calculated the MB and RMSE of the retrieval results and ERA5 reanalysis data in different seasons and then analyzed the results objectively. The number of retrieved samples is 98 for summer and 110 for winter.
The summer retrieval results are shown in Figure 8. For the temperature and humidity results obtained through GIIRS, the MB of the temperature profile is between ±0.7 below 600 hPa, but it oscillates approximately 0 K from 1000–100 hPa. The MB of the humidity results is approximately −8% below 500 hPa and gradually decreases to 2% from 500 hPa to 200 hPa. Similarly, the RMSE results also reflect the problem of existing significant deviations in the lower atmosphere for space-based retrieval. In Figure 8c, due to the small nonlinearity of temperature retrieval, the temperature RMSE for the GIIRS remains at approximately 3 K below 200 hPa. In Figure 8d, the maximum deviation for humidity RMSE is approximately 17.5% at 950 hPa and gradually decreases with increasing altitude.
For the synergistic retrieval results, although the temperature results in MB generally tend to have a negative deviation of −0.5 K, the temperature results of ERA5 as a reference maintain a negative deviation of about −0.4 K below 300 hPa, which is very close to the MB profile of the synergistic retrieval. In the humidity deviation profile, the maximum deviation of ERA5 and the synergistic retrieval results between sonder data are less than ±5%, which is approximately 4% smaller than those of the GIIRS results below 500 hPa. The RMSE results clearly show the accuracy improvement of the synergistic retrieval in the lower atmosphere. Below 500 hPa, the temperature RMSE of the synergistic retrieval is less than 1.5 K, which is better than the RMSE of individual retrieval, which has a value of approximately 2.7 K. Above 500 hPa, the RMSE of the synergistic retrieval results gradually increases and is close to the RMSE of the GIIRS individual retrieval. For the humidity RMSE results, the synergistic retrieval method has a stable point of approximately 8% below 300 hPa, and the maximum error position appears at 600 hPa. The RMSE error of atmospheric humidity below 500 hPa is effectively reduced compared with the GIIRS individual retrieval. For the humidity RMSE results, the synergistic retrieval is stable at approximately 8% below 300 hPa, and the maximum error position appears at 800 hPa. The atmospheric humidity RMSE below 500 hPa is effectively reduced compared with the GIIRS individual retrievals. For the humidity RMSE results, the synergistic retrieval is stable at approximately 8% below 300 hPa, and the maximum error position appears at 800 hPa. The atmospheric humidity RMSE below 500 hPa is effectively reduced compared with the GIIRS individual retrievals.
For the winter retrieval results shown in Figure 9, the temperature MB of the synergistic retrieval results is basically less than ±1 K, and it is disturbed around the median value of 0 K. The temperature MB profile of the GIIRS individual retrieval is similar to that of the synergistic retrieval results, but the deviation range is more extensive, within ±2 K. The GIIRS individual retrieval temperature RMSE profile is approximately 2 K below 400 hPa and less than 3 K at 1000–100 hPa. Moreover, the humidity RMSE is less than 15%. The temperature RMSE of the synergistic retrieval is approximately below 2 K; the humidity RMSE profile is less than 12%. Due to the high humidity and hot atmosphere in summer, the intense radiation of water vapor will significantly reduce the retrieval effect [24,46]. Therefore, compared with the summer, the RMSEs of the synergistic and individual retrieval results are lower in winter.
The radiosonde does not fly vertically and has a horizontal motion component, which causes a large drift at high altitudes. The sounding data at high altitudes are misaligned with the synergistic retrieval (fixed position), which may lead to an increase in the synergistic retrieval RMSE profile at high altitudes. However, ERA5 assimilates multisource data, which include radiosonde data, so are closer to radiosonde data in the upper atmosphere. In general, the statistical error of synergistic retrieval is closer to the RMSE profile and MB profile of ERA5 than that of GIIRS individual retrieval.
The scatter plot of the temperature and humidity retrieval results take radiosonde data as the reference. In the scatter plot, the average bias (AVG), root-mean-square error (RMS), and correlation coefficient (COR) of the whole atmosphere are calculated to evaluate retrieval results. As shown in Figure 10, the temperature results of individual and synergistic retrieval are highly correlated with sounding data, and the RMS of the GIIRS individual retrieval method in summer is 3.52, which is an increase of 0.55 compared with 2.97 in winter. The RMS of the synergistic retrieval method in summer, however, is 2.06, which is a decrease of 0.14 compared with 2.20 in winter. To show the retrieval accuracy in the boundary layer, the retrieval results below 700 hPa and their statistical indicators are colored in red. In boundary layer, the COR of the GIIRS individual retrieval results is lower than 0.9, and the RMS of the synergistic retrieval results is 50% lower than that of the GIIRS individual retrieval.
Figure 11 shows that the COR of relative humidity between the synergistic retrieval results and the radiosonde data is 0.94 in winter and 0.97 in summer, indicating high correlation. For synergistic retrieval, the RMS in winter is 7.71 and AVG is −0.37, while in summer, RMS is 6.29 and AVG is 0.38. For relative humidity results below 700 hPa in summer, the COR and RMS of the synergistic retrieval method are 0.92 and 7.49, lower than those of the GIIRS individual retrieval results, which are 0.79 and 15.07.

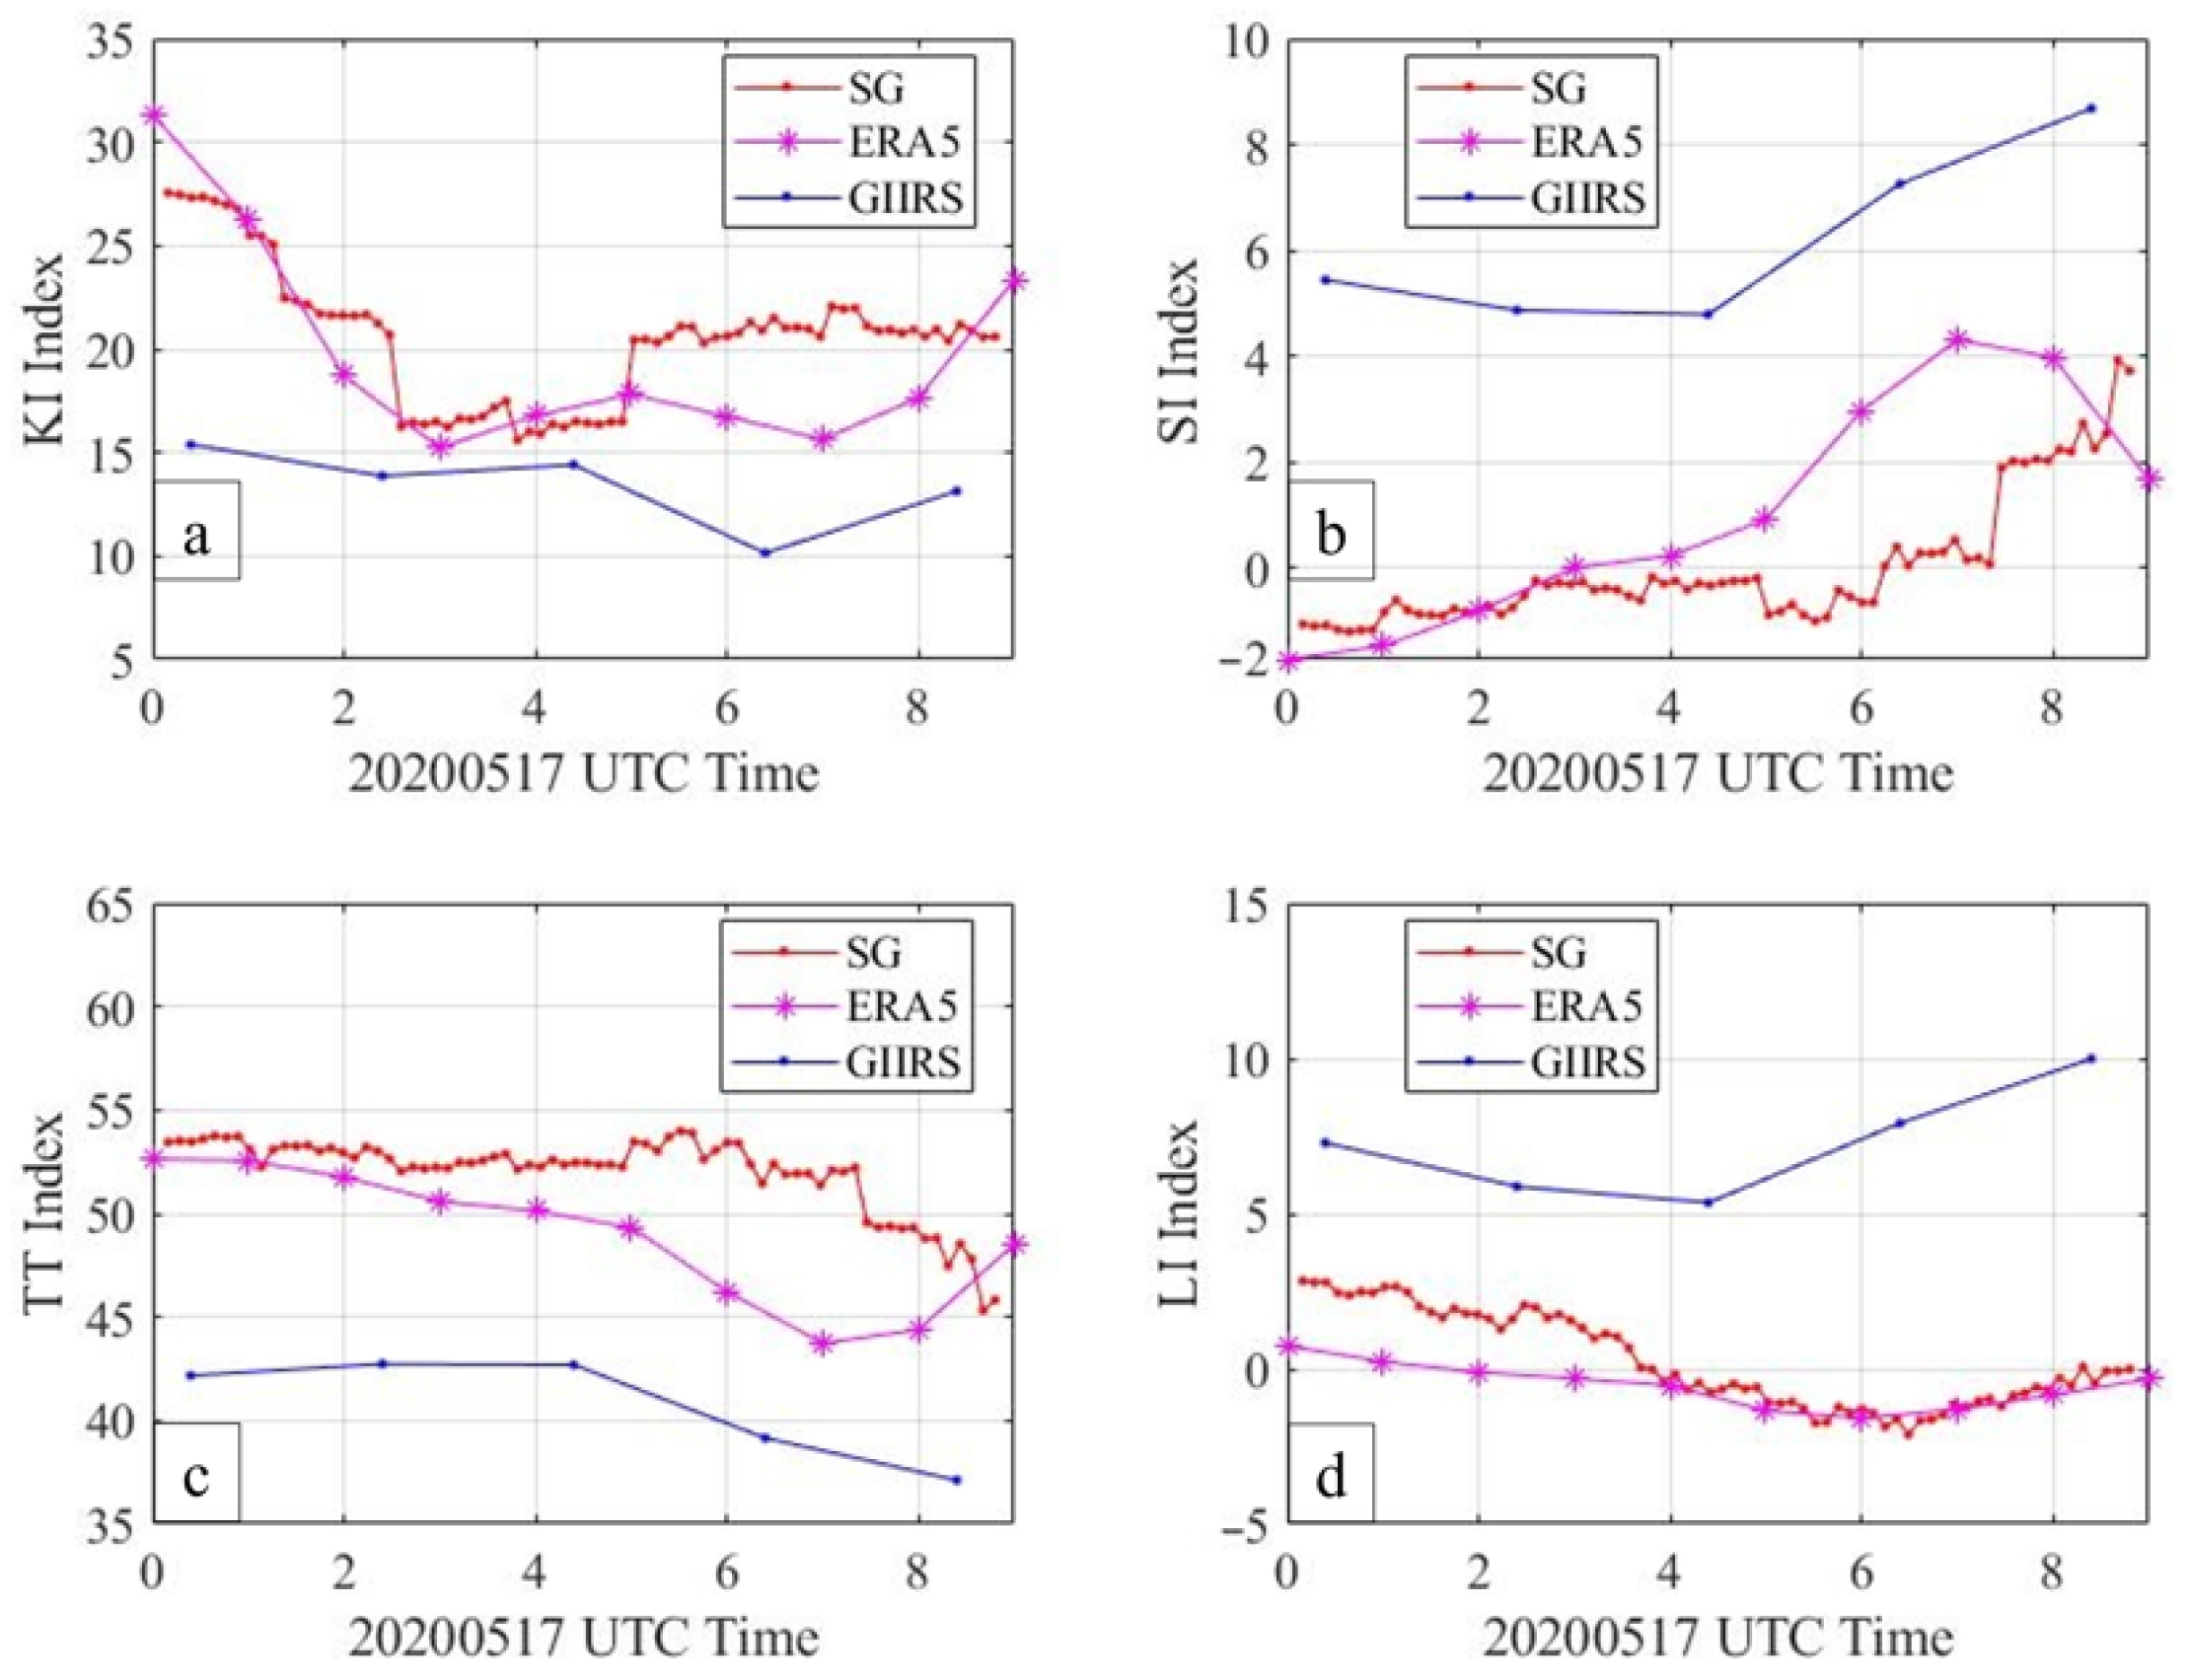
4.3. Calculation and Analysis of Forecast Index

As a standard forecast tool of nowcasting, the FIs provide objective and quantitative indicators to help determine severe weather [1,4,47]. More details of the FIs considered in this paper are provided in Appendix A. To evaluate the reliability and accuracy of the synergistic retrieval algorithm in terms of FI calculation relative to the GIIRS individual retrieval results, the FIs, which include K index (KI), Showalter Index (SI), total totals index (TT), and lifted index (LI), will be calculated in this section based on the temperature and humidity profiles obtained from the retrieval and compared with the sounding data calculation results. It is beyond the scope of this article to show the use and skills of FIs in proximity predictions. The purpose of this section is to discuss the improvement of the synergistic retrieval method in obtaining high-resolution and high-quality FIs, as well as the consistency and correlation with the calculation results of sounding data.
To quantitatively illustrate the consistency of the FIs calculated from the profiles obtained from the retrieval results, ERA5 data and radiosonde data, we selected the data in 2020 and 2021 summer to calculate the FIs and perform a statistical analysis. The considered statistics include RMSE, standard deviation (STD), and correlation coefficient (COR).
As shown in Figure 12, the KI index has an irregular discrete distribution, while the LI index is in the high-value part greater than 10 degrees. All the profile data calculation results and the sounding data results have a stronger linear relationship, and there is a larger divergence trend in the low-value part. The ERA5 reanalysis and sounding data have the best correlation and statistical error. The profile data obtained by synergistic retrieval have a good linear relationship with the sounding results, but the retrieval results of GIIRS alone still have a large deviation. The COR of the synergistic retrieval method is higher than 0.9 in both FIs, and the RMSE is lower than that of the GIIRS retrieval results alone, which is close to the ERA5 data.
According to the meteorological records, at 9:00 UTC on 17 May 2020, a thick cumulonimbus cloud started to appear in Qingdao, and severe convective precipitation began. Under the clear-sky condition of the preconvection environment, the synergistic retrieval and GIIRS individual retrieval were carried out based on the observation data of AERI and FY-4/GIIRS on 17 May 2020. Figure 13 shows the FIs calculated from the retrieved temperature and humidity profile results. Among the four types of FIs calculated above, the FIs based on the individual retrieval are consistent with the FIs calculated by ERA5 data, but their value differences are large. In Figure 13a, the GIIRS results do not reflect the sharp downward trend of the K index at 0–3 UTC. In contrast, the synergistic retrieval results are similar to the ERA5 results and reflect the downward trend of the K index with high temporal resolutions. In Figure 13a–c, the synergistic retrieval results are close to the ERA5 results before 5 UTC. However, the deviation from the ERA5 results increases. The possible reason for this is that from 5 UTC, clouds in the atmosphere began to increase, so cloud radiation noise reduced the retrieval accuracy and caused the FIs to result in deviations. However, the LI index in Figure 13d is close to the results of ERA5 before convection, showing the fine evolution process.

5. Discussion

Based on retrieval technology, infrared hyperspectral observation can obtain the vertical distribution of atmospheric temperature and humidity profiles in the preconvection environment and provide earlier warning information of severe convective weather. Improving severe convection nowcasting ability requires the temperature and humidity profiles of the boundary layer with high accuracy and high temporal resolution, but the existing synergistic retrieval algorithms are still unable to meet these requirements. On the one hand, the current infrared hyperspectral instruments are carried on polar orbiting satellites and have a long revisit period, resulting in low temporal resolution. On the other hand, the existing synergistic retrieval models do not consider the differences in spatial resolution and temporal resolution of different instruments in actual observations.
In this study, we proposed a synergistic retrieval algorithm based on the optimal estimation method with space-based and ground-based infrared spectral data. Through observation scale matching, the atmospheric temperature and humidity profiles under clear-sky conditions are retrieved, combined with the FY-4/GIIRS and ground-based AERI infrared hyperspectral observations. In the retrieval experiment in Qingdao, China, the accuracy of the synergistic retrieval was evaluated by taking the radiosonde data as the benchmark and combining the ERA5 reanalysis data and the GIIRS individual retrieval results as references.
The temperature and humidity retrieval results of the synergistic retrieval showed reasonable consistency with the reanalysis data of ERA5. Under 100 hPa, the synergistic retrieval MB is within ±1 K for temperature and within ±5% for humidity, and the RMSE is within 3.5 K and 12% for temperature and humidity, respectively. Compared with the ERA5 data, the synergistic retrieval results showed a great consistency from 1000–100 hPa, and the accuracy was greatly improved in contrast to that of GIIRS individual retrieval, especially at the boundary layer.
It is worth noting that the background error covariance and observation error covariance used in the synergistic retrieval are based on local observations in Qingdao. For synergistic retrieval in other regions, the corresponding background error covariance and observation error covariance used in retrieval should be calculated with local observation data.

6. Conclusions

Based on the infrared hyperspectral data of FY-4/GIIRS and the ground-based AERI, the synergistic retrieval algorithm can obtain temperature and humidity profiles of the whole troposphere atmosphere with high temporal resolution and high accuracy. In other words, compared with space-based individual retrieval and ground-based individual retrieval, the synergistic method improves the accuracy and temporal resolution of temperature and humidity profile results and extends the high-precision retrieval part to the whole troposphere.
In addition, there may still be other problems that can be improved in the retrieval process:
(1)
Influence of cloud radiation. The current retrieval model is applied to clear-sky regions without considering the cloud radiation transmission process. The cloud radiation component in the observation will reduce the accuracy of the retrieval results. However, it is difficult to find clear-sky condition FOVs in preconvection environment.
(2)
Observation matching. The ground-based AERI is not necessarily located at the center of the GIIRS FOV. In the coarse matching of observation data, the inverse-distance-weighted data cannot fully represent the actual observation directly above the AERI.
(3)
Forward model simulation. Although the calculation accuracy of the radiation transfer model used is very high, some simulation errors can still not be eliminated entirely compared with the actual atmospheric radiation.
The current space-based FY-4/GIIRS and ground-based AERI synergistic retrieval concentrate on the temperature and humidity profile of a single location. Future work of synergistic retrieval will focus on expanding the spatial dimension of the retrieval results to obtain the temperature and humidity profiles of multiple FOVs around the ground-based instruments at the same time. These retrieved profile data can be used to analyze the stability of the atmospheric structure and provide necessary information for the early warning of severe convective weather.

Author Contributions

Conceptualization, X.M., G.J. and H.Z.; methodology, X.M.; software, H.J.; validation, Z.M. and H.J.; formal analysis, Z.M.; investigation, G.J.; resources, H.Z.; data curation, X.M.; writing—original draft preparation, X.M. and G.J.; writing—review and editing, G.J.; visualization, Z.M.; supervision, H.Z.; project administration, H.Z. and G.J.; funding acquisition, H.Z. All authors have read and agreed to the published version of the manuscript.

Funding

This research was funded by the Civil Aerospace Technology Advance Research Project (grant number D040405), Applied Innovation Project of China Aerospace Science and Technology Corporation (grant number 6230111008).

Acknowledgments

We would like to thank the Center for Earth System Modelling and Prediction of China Meteorological Administration for sharing FY4-A/GIIRS data and giving advice on how to use these data. We are very grateful to Wei Han of Center for Earth System Modelling and Prediction for data processing guidance.

Conflicts of Interest

The authors declare no conflict of interest.

Appendix A. Interpretation of Forecast Indices

The definitions of the forecast indices are explained in this appendix. T ( p ) represents the atmospheric temperature at the altitude with p   pressure (in hPa). T d ( p ) represents the dewpoint temperature at the altitude with p pressure [48,49].

Appendix A.1. K Index

The K index (KI) is used to indicate the probability of a thunderstorm occurring: the higher the KI value, the higher the probability of thunderstorms.
K I = [ T ( 850 ) + T d ( 850 ) ] T ( 500 ) [ T ( 700 ) T d ( 700 ) ]

Appendix A.2. Showalter Index

The Showalter index (SI) is an important indicator to evaluate the stability of atmosphere.
S I = T ( 500 ) T s ( 500 )
Ts is the temperature of the parcel at 500 hPa when lifted from 850 hPa.

Appendix A.3. Total Totals

The total totals (TT) index was developed for forecasting severe convective weather: the higher the TT value, the higher the probability of thunderstorms.
T T = [ T ( 850 ) + T d ( 850 ) ] 2 × T ( 500 )

Appendix A.4. Lifited Index

The lifted index (LI) is basically the same as the Showalter index, except for the determination of the level from which the parcel is lifted.
L I = T ( 500 ) T L ( 500 )
TL is the temperature of a parcel lifted from the surface to 500 hPa.

References

  1. Cimini, D.; Nelson, M.; Güldner, J.; Ware, R. Forecast indices from a ground-based microwave radiometer for operational meteorology. Atmos. Meas. Technol. 2015, 8, 315–333. [Google Scholar] [CrossRef] [Green Version]
  2. Guldner, J.; Spankuch, D. Remote Sensing of the Thermodynamic State of the Atmospheric Boundary Layer by Ground-Based Microwave Radiometry. J. Atmos. Ocean. Technol. 2001, 18, 925. [Google Scholar] [CrossRef]
  3. Li, J.; Li, J.; Otkin, J.; Schmit, T.J.; Liu, C. Warning Information in a Preconvection Environment from the Geostationary Advanced Infrared Sounding System–A Simulation Study Using the IHOP Case. J. Appl. Meteorol. Clim. 2011, 50, 776–783. [Google Scholar] [CrossRef]
  4. Sahu, R.K.; Dadich, J.; Tyagi, B.; Vissa, N.K. Trends of thermodynamic indices thresholds over two tropical stations of north-east India during pre-monsoon thunderstorms. J. Atmos. Sol.-Terr. Phy. 2020, 211, 105472. [Google Scholar] [CrossRef]
  5. Esmaili, R.B.; Smith, N.; Barnet, C.D.; Berndt, E.B.; White, K.; Dostalek, J.F.; Kahn, B.H.; Sjoberg, W.; Goldberg, M. Adapting satellite soundings for operational forecasting within the hazardous weather testbed. Remote Sens. 2020, 12, 886. [Google Scholar] [CrossRef] [Green Version]
  6. Randel, W.J.; Wu, F. Biases in Stratospheric and Tropospheric Temperature Trends Derived from Historical Radiosonde Data. J. Clim. 2006, 19, 2094–2104. [Google Scholar] [CrossRef]
  7. Martinez, M.A.; Velazquez, M.; Manso, M.; Mas, I. Application of LPW and SAI SAFNWC/MSG satellite products in pre-convective environments. Atmos. Res. 2007, 83, 366–379. [Google Scholar] [CrossRef]
  8. Solheim, F.; Godwin, J.R.; Westwater, E.R.; Han, Y.; Keihm, S.J.; Marsh, K.; Ware, R. Radiometrie profiling of temperature, water vapor and cloud liquid water using various inversion methods. Radio Sci. 1998, 33, 393–404. [Google Scholar] [CrossRef] [Green Version]
  9. Gartzke, J.; Knuteson, R.; Przybyl, G.; Ackerman, S.; Revercomb, H. Comparison of Satellite-, Model-, and Radiosonde-Derived Convective Available Potential Energy in the Southern Great Plains Region. J. Appl. Meteorol. Clim. 2017, 56, 1499–1513. [Google Scholar] [CrossRef]
  10. King, J.I.F. The Radiative Heat Transfer of Planet Earth. In Scientific Uses of Earth Satellites; Van Allen, J.A., Ed.; NASA: Washington, DC, USA, 1958; Volume 133. [Google Scholar]
  11. Kaplan, L.D. Inference of Atmospheric Structure from Remote Radiation Measurements. J. Opt. Soc. Am. 1959, 49, 1004–1007. [Google Scholar] [CrossRef]
  12. Smith, W.L.; Woolf, H.M. The Use of Eigenvectors of Statistical Covariance Matrices for Interpreting Satellite Sounding Radiometer Observations. J. Atmos. Sci. 1976, 33, 1127–1140. [Google Scholar] [CrossRef]
  13. Malmgren-Hansen, D.; Laparra, V.; Aasbjerg Nielsen, A.; Camps-Valls, G. Statistical retrieval of atmospheric profiles with deep convolutional neural networks. ISPRS J. Photogramm. Remote Sens. 2019, 158, 231–240. [Google Scholar] [CrossRef] [Green Version]
  14. Chahine, M.T. Inverse Problems in Radiative Transfer: Determination of Atmospheric Parameters. J. Atmos. Sci. 1970, 27, 960–967. [Google Scholar] [CrossRef]
  15. Duncan, D.I.; Kummerow, C.D. A 1DVAR retrieval applied to GMI: Algorithm description, validation, and sensitivities. J. Geophys. Res. 2016, 121, 7415–7429. [Google Scholar] [CrossRef] [Green Version]
  16. Smith, W.L. Iterative solution of the radiative transfer equation for the temperature and absorbing gas profile of an atmosphere. Appl. Opt. 1970, 9, 1993–1999. [Google Scholar] [CrossRef]
  17. Li, J.; Wolf, W.W.; Menzel, W.P.; Zhang, W.; Huang, H.; Achtor, T.H. Global Soundings of the Atmosphere from ATOVS Measurements: The Algorithm and Validation. J. Appl. Meteorol. 2000, 39, 1248–1268. [Google Scholar] [CrossRef]
  18. Menzel, W.P.; Schmit, T.J.; Zhang, P.; Li, J. Satellite-Based Atmospheric Infrared Sounder Development and Applications. Bull. Am. Meteorol. Soc. 2018, 99, 583–604. [Google Scholar] [CrossRef]
  19. Aumann, H.H.; Chahine, M.T.; Gautier, C.; Goldberg, M.D.; Kalnay, E.; McMillin, L.M.; Revercomb, H.; Rosenkranz, P.W.; Smith, W.L.; Staelin, D.H.; et al. AIRS/AMSU/HSB on the Aqua mission: Design, science objectives, data products, and processing systems. IEEE Trans. Geosci. Remote Sens. 2003, 41, 253–264. [Google Scholar] [CrossRef] [Green Version]
  20. Wu, X.; Li, J.; Zhang, W.; Wang, F. Atmospheric Profile Retrieval with AIRS Data and Validation at the ARM CART Site. Adv. Atmos. Sci. 2005, 22, 647–654. [Google Scholar]
  21. Zhou, D.K.; Smith, W.L.; Larar, A.M.; Liu, X.; Taylor, J.P.; Schlüssel, P.; Strow, L.L.; Mango, S.A. All weather IASI single field-of-view retrievals: Case study–validation with JAIVEx data. Atmos. Chem. Phys. 2009, 9, 2241–2255. [Google Scholar] [CrossRef] [Green Version]
  22. Zhu, L.; Bao, Y.; Wu, Y.; Xu, D.; Petropoulos, G.P.; Zhang, P.; Lu, F.; Lu, Q. Temperature and humidity profiles retrieval in a plain area from fengyun-3D/HIRAS sensor using a 1D-VAR assimilation scheme. Remote Sens. 2020, 12, 435. [Google Scholar] [CrossRef]
  23. Yin, R.; Han, W.; Gao, Z.; Li, J. Impact of High Temporal Resolution FY-4A Geostationary Interferometric Infrared Sounder (GIIRS) Radiance Measurements on Typhoon Forecasts: Maria (2018) Case with GRAPES Global 4D-Var Assimilation System. Geophys. Res. Lett. 2021, 48, e2021GL093672. [Google Scholar] [CrossRef]
  24. Xue, Q.; Guan, L.; Shi, X. One-Dimensional Variational Retrieval of Temperature and Humidity Profiles from the FY4A GIIRS. Adv. Atmos. Sci. 2022, 39, 471–486. [Google Scholar] [CrossRef]
  25. Knuteson, R.O.; Revercomb, H.E.; Best, F.A.; Ciganovich, N.C.; Dedecker, R.G.; Dirkx, T.P.; Ellington, S.C.; Feltz, W.F.; Garcia, R.K.; Howell, H.B.; et al. Atmospheric Emitted Radiance Interferometer. Part II: Instrument Performance. J. Atmos. Ocean. Technol. 2004, 21, 1777–1789. [Google Scholar] [CrossRef]
  26. Knuteson, R.O.; Revercomb, H.E.; Best, F.A.; Ciganovich, N.C.; Dedecker, R.G.; Dirkx, T.P.; Ellington, S.C.; Feltz, W.F.; Garcia, R.K.; Howell, H.B.; et al. Atmospheric Emitted Radiance Interferometer. Part I: Instrument Design. J. Atmos. Ocean. Technol. 2004, 21, 1763–1776. [Google Scholar] [CrossRef]
  27. Clive, D.R. Inverse Methods for Atmospheric Sounding: Theory and Practice; World Scientific: Singapore, 2000. [Google Scholar]
  28. Turner, D.D.; Löhnert, U. Information Content and Uncertainties in Thermodynamic Profiles and Liquid Cloud Properties Retrieved from the Ground-Based Atmospheric Emitted Radiance Interferometer (AERI). J. Appl. Meteorol. Clim. 2014, 53, 752–771. [Google Scholar] [CrossRef]
  29. Che, Y.; Ma, S.; Xing, F.; Li, S.; Dai, Y. An improvement of the retrieval of temperature and relative humidity profiles from a combination of active and passive remote sensing. Meteorol. Atmos. Phys. 2019, 131, 681–695. [Google Scholar] [CrossRef]
  30. Turner, D.D.; Blumberg, W.G. Improvements to the AERIoe Thermodynamic Profile Retrieval Algorithm. IEEE J. Sel. Top. Appl. Earth Obs. Remote Sens. 2019, 12, 1339–1354. [Google Scholar] [CrossRef]
  31. Ho, S.P.; Smith, W.L.; Huang, H.L. Retrieval of atmospheric-temperature and water-vapor profiles by use of combined satellite and ground-based infrared spectral-radiance measurements. Appl. Opt. 2002, 41, 4057–4069. [Google Scholar] [CrossRef]
  32. Ebell, K.; Orlandi, E.; Löhnert, U.; Crewell, S.; Hünerbein, A. Combining ground-based with satellite-based measurements in the atmospheric state retrieval: Assessment of the information content. J. Geophys. Res. Atmos. 2013, 118, 6940–6956. [Google Scholar] [CrossRef]
  33. Maria, T.; Ulrich, L. Synergy of Satellite- and Ground-Based Observations for Continuous Monitoring of Atmospheric Stability, Liquid Water Path, and Integrated Water Vapor: Theoretical Evaluations Using Reanalysis and Neural Networks. J. Appl. Meteorol. Climatol. 2020, 59, 1153–1170. [Google Scholar]
  34. Loveless, D.M.; Wagner, T.J.; Knuteson, R.O.; Turner, D.D.; Ackerman, S.A. Information Content of a Synergy of Ground-Based and Space-Based Infrared Sounders. Part I: Clear-Sky Environments. J. Atmos. Ocean. Technol. 2022, 39, 771–787. [Google Scholar] [CrossRef]
  35. Gamage, S.M.; Sica, R.J.; Martucci, G.; Haefele, A. A 1D Var Retrieval of Relative Humidity Using the ERA5 Dataset for the Assimilation of Raman Lidar Measurements. J. Atmos. Ocean. Technol. 2020, 37, 2051–2064. [Google Scholar] [CrossRef]
  36. Meri, V.; Marja, B.; Jouni, R.; Victoria, A.S.; Heikki, J. Radiosonde comparison of ERA5 and ERA-Interim reanalysis datasets over tropical oceans. Tellus Ser. A Dyn. Meteorol. Oceanogr. 2021, 73, 1–7. [Google Scholar]
  37. Shikhovtsev, A.Y.; Khaikin, V.B.; Mironov, A.P.; Kovadlo, P.G. Statistical Analysis of the Water Vapor Content in North Caucasus and Crimea. Atmos. Ocean. Opt. 2022, 35, 168–175. [Google Scholar] [CrossRef]
  38. Lubin, D.; Damao, Z.; Silber, I.; Scott, R.C.; Kalogeras, P.; Battaglia, A.; Bromwich, D.H.; Cadeddu, M.; Eloranta, E.; Fridlind, A.; et al. The Atmospheric Radiation Measurement (ARM) West Antarctic Radiation Experiment. Bull. Am. Meteorol. Soc. 2020, 101, E1069-91. [Google Scholar] [CrossRef] [Green Version]
  39. Turner, D.D.; Feltz, W.F.; Ferrare, R.A. Continuous Water Vapor Profiles from Operational Ground-Based Active and Passive Remote Sensors. Bull. Am. Meteorol. Soc. 2000, 81, 1301–1317. [Google Scholar] [CrossRef]
  40. Yang, J.; Zhang, Z.; Wei, C.; Lu, F.; Guo, Q. Introducing the New Generation of Chinese Geostationary Weather Satellites, Fengyun-4. Bull. Am. Meteorol. Soc. 2017, 98, 1637–1659. [Google Scholar] [CrossRef]
  41. Feng, X.; Li, L.B.; Zou, Y.P.; Han, C.P.; Chen, B.Y. Post-launch calibration and validation of the Geostationary Interferometric Infrared Sounder (GIIRS) on FY-4A. Hongwai Yu Haomibo Xuebao/J. Infrared Millim. Waves 2019, 38, 648–654. [Google Scholar]
  42. Hersbach, H.; Bell, B.; Berrisford, P.; Horányi, A.; Muñoz-Sabater, J.; Nicolas, J.; Peubey, C.; Radu, R.; Schepers, D.; Simmons, A.; et al. The ERA5 global reanalysis. Q. J. Roy. Meteorol. Soc. 2020, 146, 1999–2049. [Google Scholar] [CrossRef]
  43. Shephard, M.W.; Clough, S.A.; Payne, V.H.; Smith, W.L.; Kireev, S.; Cady-Pereira, K.E. Performance of the line-by-line radiative transfer model (LBLRTM) for temperature and species retrievals: IASI case studies from JAIVEx. Atmos. Chem. Phys. 2009, 9, 7397–7417. [Google Scholar] [CrossRef] [Green Version]
  44. Nakajima, T.Y.; Tsuchiya, T.; Matsui, T.N.; Shimoda, H.; Ishida, H. Cloud detection performance of spaceborne visible-to-infrared multispectral imagers. Appl. Opt. 2011, 50, 2601–2616. [Google Scholar] [CrossRef] [PubMed] [Green Version]
  45. Masiello, G.; Serio, C.; Antonelli, P. Inversion for atmospheric thermodynamical parameters of IASI data in the principal components space. Q. J. Roy. Meteor. Soc. 2012, 138, 103–117. [Google Scholar] [CrossRef] [Green Version]
  46. Jang, H.; Sohn, B.; Chun, H.; Li, J.; Weisz, E. Improved AIRS Temperature and Moisture Soundings with Local A Priori Information for the 1DVAR Method. J. Atmos. Ocean. Technol. 2017, 34, 1083–1095. [Google Scholar] [CrossRef]
  47. Haklander, A.J.; Van Delden, A. Thunderstorm predictors and their forecast skill for the Netherlands. Atmos. Res. 2003, 67, 273–299. [Google Scholar] [CrossRef]
  48. Miller, R.C. Notes on Analysis and Severe-Storm Forecasting Procedures of the Air Force Global Weather Central; AWS: Washington, DC, USA, 1975. [Google Scholar]
  49. Galway, J.G. The Lifted Index as a Predictor of Latent Instability. Bull. Am. Meteorol. Soc. 1956, 37, 528–529. [Google Scholar] [CrossRef]
Figure 1. The AERI installed in the mobile container, it has been operating in Qingdao research institute of Beihang University since 2018.
Remotesensing 14 05256 g001
Figure 2. Observations of for GIIRS data: blue and red rectangles are medium-wave infrared (MWIR) and long-wave infrared (LWIR) observations of GIIRS; pink point is the location of AERI.
Remotesensing 14 05256 g002
Figure 3. AERI and GIIRS data matching (the red vertical line is the GIIRS observation time, the black is the AERI observation time, and the green wireframe is the synergistic retrieval dataset).
Remotesensing 14 05256 g003
Figure 4. Total spatial statistical error with statistical results, (left) for longwave and (right) for medium wave. The blue points are practical calculations, while the red line is the fitting curve of those statistical errors.
Remotesensing 14 05256 g004
Figure 5. Spectral channel variance. (a,b) are the long-wave and medium-wave channels of GIIRS used in retrieval, (c,d) are the long-wave and medium-wave channels of AERI; the red line represents S S , the blue line represents S Y , and the black line represents S e .
Remotesensing 14 05256 g005
Figure 6. The general framework of the synergistic retrieval algorithm.
Remotesensing 14 05256 g006
Figure 7. Display of GIIRS individual retrieval (GIIRS) and synergistic retrieval (SG) results. (a,d) are temperature and humidity profiles, (b,e) are uncertainties of retrieval results, (c,f) are degrees of freedom for signal.
Remotesensing 14 05256 g007
Figure 8. Statistical comparison of retrieval results in summer. (a,b) is the MB of temperature and humidity results, (c,d) is the RMSE, the red line is synergistic retrieval results (SG), blue line is GIIRS individual retrieval results (GIIRS), black line is ERA5 reanalysis (ERA5).
Remotesensing 14 05256 g008
Figure 9. MB (a,b) and RMSE (c,d) of the retrieval results in winter.
Remotesensing 14 05256 g009
Figure 10. Scatter plot of synergistic retrieval method (a,c) and GIIRS individual retrieval method (b,d) temperature results with radiosonde observations in summer (a,b) and winter (c,d). Data below 700 hPa (in boundary layer) are specifically marked red. The black text in the figure shows the statistical results of all data, while the red text only counts data below 700 hPa.
Remotesensing 14 05256 g010
Figure 11. Scatter plot of synergistic retrieval method (a,c) and GIIRS individual retrieval method (b,d) humidity results with radiosonde observations in summer (a,b) and winter (c,d). Data below 700 hPa are specially marked red. The black text in the figure shows the statistical results of all data, while the red text only counts data below 700 hPa.
Remotesensing 14 05256 g011
Figure 12. Scatter plot of FIs calculated from different profile data (synergistic retrieval results in red, GIIRS individual retrieval results in blue, ERA5 data in cyan). (a) is K index, (b) is Showalter index, (c) is total totals index, (d) is lifted index.
Remotesensing 14 05256 g012
Figure 13. The FIs of preconvection environment in 20200517. (a) is K index, (b) is Showalter index, (c) is total totals index, (d) is lifted index.
Remotesensing 14 05256 g013
Table 1. Performance specifications for AERI.
ParameterPerformance
Spectral coverage (wavenumber)550–3000 cm−1 (3.3–18.2 μm)
Spectral resolution0.5 cm−1, unapodized
Radiometric calibrationAbsolute accuracy: <1% of ambient blackbody radiance
Reproducibility: <0.2% of ambient blackbody radiance
Wavelength calibrationChannel wavenumber knowledge: better than 0.01 cm−1
Temporal samplingRepeat cycle: ≈ 10 min
Angular field of view<45 mrad
Table 2. Performance specifications for FY4-A/GIIRS.
ParameterPerformance
Spectral coverage (wavenumber)Long wave: 700–1130 cm−1
Medium wave: 1650–2250 cm−1
Spectral resolution0.625 cm−1
Spectral calibration accuracy10 ppm
Radiometric calibration accuracy1.5 K
Spatial resolution16 km (Nadir)
Time resolution<1 h (China regions)
Area of detection5000 × 5000 km2 (China regions)
Publisher’s Note: MDPI stays neutral with regard to jurisdictional claims in published maps and institutional affiliations.

