Article

LssDet: A Lightweight Deep Learning Detector for SAR Ship Detection in High-Resolution SAR Images

National Key Laboratory of Transient Physics, Nanjing University of Science and Technology, Nanjing 210094, China
*
Author to whom correspondence should be addressed.
Remote Sens. 2022, 14(20), 5148; https://doi.org/10.3390/rs14205148
Submission received: 29 July 2022 / Revised: 23 September 2022 / Accepted: 11 October 2022 / Published: 14 October 2022
(This article belongs to the Special Issue Remote Sensing in Intelligent Maritime Research)

Abstract

:
Synthetic aperture radar (SAR) ship detection has been the focus of many previous studies. Traditional SAR ship detectors face challenges in complex environments due to the limitations of manual feature extraction. With the rise of deep learning (DL) techniques, SAR ship detection based on convolutional neural networks (CNNs) has achieved significant achievements. However, research on CNN-based SAR ship detection has mainly focused on improving detection accuracy, and relatively little research has been conducted on reducing computational complexity. Therefore, this paper proposes a lightweight detector, LssDet, for SAR ship detection. LssDet uses Shufflenet v2, YOLOX PAFPN and YOLOX Decopuled Head as the baseline networks, improving based on the cross sidelobe attention (CSAT) module, the lightweight path aggregation feature pyramid network (L-PAFPN) module and the Focus module. Specifically, the CSAT module is an attention mechanism that enhances the model’s attention to the cross sidelobe region and models the long-range dependence between the channel and spatial information. The L-PAFPN module is a lightweight feature fusion network that achieves excellent performance with little computational effort and a low parametric count. The Focus module is a low-loss feature extraction structure. Experiments showed that on the Sar ship detection dataset(SSDD), LssDet’s computational cost was 2.60 GFlops, the model’s volume was 2.25 M and A P @ [ 0.5 : 0.95 ] was 68.1%. On the Large-scale SAR ship detection dataset-v1.0 (LS-SSDD-v1.0), LssDet’s computational cost was 4.49 GFlops, the model’s volume was 2.25 M and A P @ [ 0.5 : 0.95 ] was 27.8%. Compared to the baseline network, LssDet had a 3.6% improvement in A P @ [ 0.5 : 0.95 ] on the SSDD, and LssDet had a 1.5% improvement in A P @ [ 0.5 : 0.95 ] on the LS-SSDD-v1.0. At the same time, LssDet reduced Floating-point operations per second (Flops) by 7.1% and Paraments (Params) by 23.2%. Extensive experiments showed that LssDet achieves excellent detection results with minimal computational complexity. Furthermore, we investigated the effectiveness of the proposed module through ablation experiments.

1. Introduction

Synthetic aperture radar (SAR) is a high-resolution imaging radar with long-range, all-day, all-weather operation [1,2,3]. It plays an essential role in ship detection, environmental inspection, geological mapping and other applications [4,5,6]. As a fundamental maritime task [7,8,9], SAR ship detection has received significant attention in areas such as marine traffic control, maritime distress rescue and maritime defence warning [7,8,9]. The traditional and deep learning methods are the main methods of SAR ship detection [10].
Traditional methods generally complete SAR ship detection tasks by manually extracting the geometric structure features, the electromagnetic scattering features, the transformation features and the local invariant features. The constant false alarm rate (CFAR) is the most widely and deeply applied traditional SAR ship detection method. Novak et al. [11] proposed a two-parameter CFAR approach for modelling sea clutter using a Gaussian model. Gao et al. [12] proposed a method based on Parzen-window-kernel density estimation as an SAR image ship detection method based on non-parametric modelling. Sugimoto et al. [13] combined Yamaguchi decomposition theory with the CFAR method to accomplish SAR ship detection. Lang et al. [14] proposed a hierarchical SAR ship recognition scheme by extracting texture descriptors to construct a robust ship classification and recognition representation. Leng et al. [15] combined the SAR ship’s intensity and location information and proposed a bilateral CFAR method. Dai et al. [16] proposed a CFAR SAR ship detection method based on the supervised learning approach based on object candidate regions. However, the traditional methods rely excessively on manual feature extraction, so this one has a tedious computational process and poor generalisation, which cannot meet the needs of SAR ship detection. With the rise of deep learning technology, SAR ship detection algorithms based on deep learning have been widely studied in recent years [17,18,19,20].
Deep learning SAR ship detection methods have shown excellent performance. Kang et al. [17] used the object proposals generated by Faster R-CNN for the guard window of the CFAR algorithm to enhance the detection performance for small targets. Kang et al. [4] also proposed a multi-layer fused convolutional neural network based on contextual regions, fusing deep semantic features and shallow high-resolution features to improve detection performance for small ships. Chang et al. [18] developed a reduced YOLOv2 algorithm that has fewer layers than regular YOLOv2, and they achieved speed and accuracy improvements. Tang et al. [21] developed a noise level classifier (NLC), an SAR target potential area extraction module (STPAE) and a YOLOv5-based detection module, N-YOLO, and achieved competitive performance. Cui et al. [22] proposed a method based on CenterNet, which is based on spatial shuffle-group enhancement (SSE) attention, for large-scale SAR image ship detection. Zhu et al. [20] proposed an R-FCOS method that can detect dim and small ships in large-scale SAR images with higher accuracy than other that of methods.
Current SAR ship detection research is mainly based on computationally intensive neural networks. Although achieving high detection accuracy, the computational complexity of such models is unsatisfactory. However, computational complexity and detection accuracy are equally essential for SAR ship detection tasks. Yu et al. [23] designed the ASIR-Block, Focus-Block, SPP-Block and CAPE-Block modules based on the attention mechanism and feature pyramid network and constructed FASC-Net. Zhou et al. [24] proposed the CSPMRes2 module for improving feature representation and the FC-FPN module for adapting feature maps, and constructed MSSDNet based on YOLOv5s. Liu et al. [25] used YOLOV4-LITE and MobileNetv2 as the baseline network, proposed an improved receptive field block (RFB) structure to enhance the network’s feature extraction ability and proposed a sliding-window-block method to detect the whole SAR image, which can solve the problem of image input. Lightweight SAR ship detectors have excellent applications, especially in seaside defence warnings and sea distress rescue, which should not be neglected.
For this reason, we propose LssDet, an SAR ship detection method based on a lightweight convolutional neural network. LssDet implements a lightweight, anchor-free, one-stage SAR ship detection method which has sufficient robustness for multi-scale targets, complex backgrounds and large-scene SAR images; and it has a low computational cost and low parametric counts.
The main contributions of this paper are as follows:
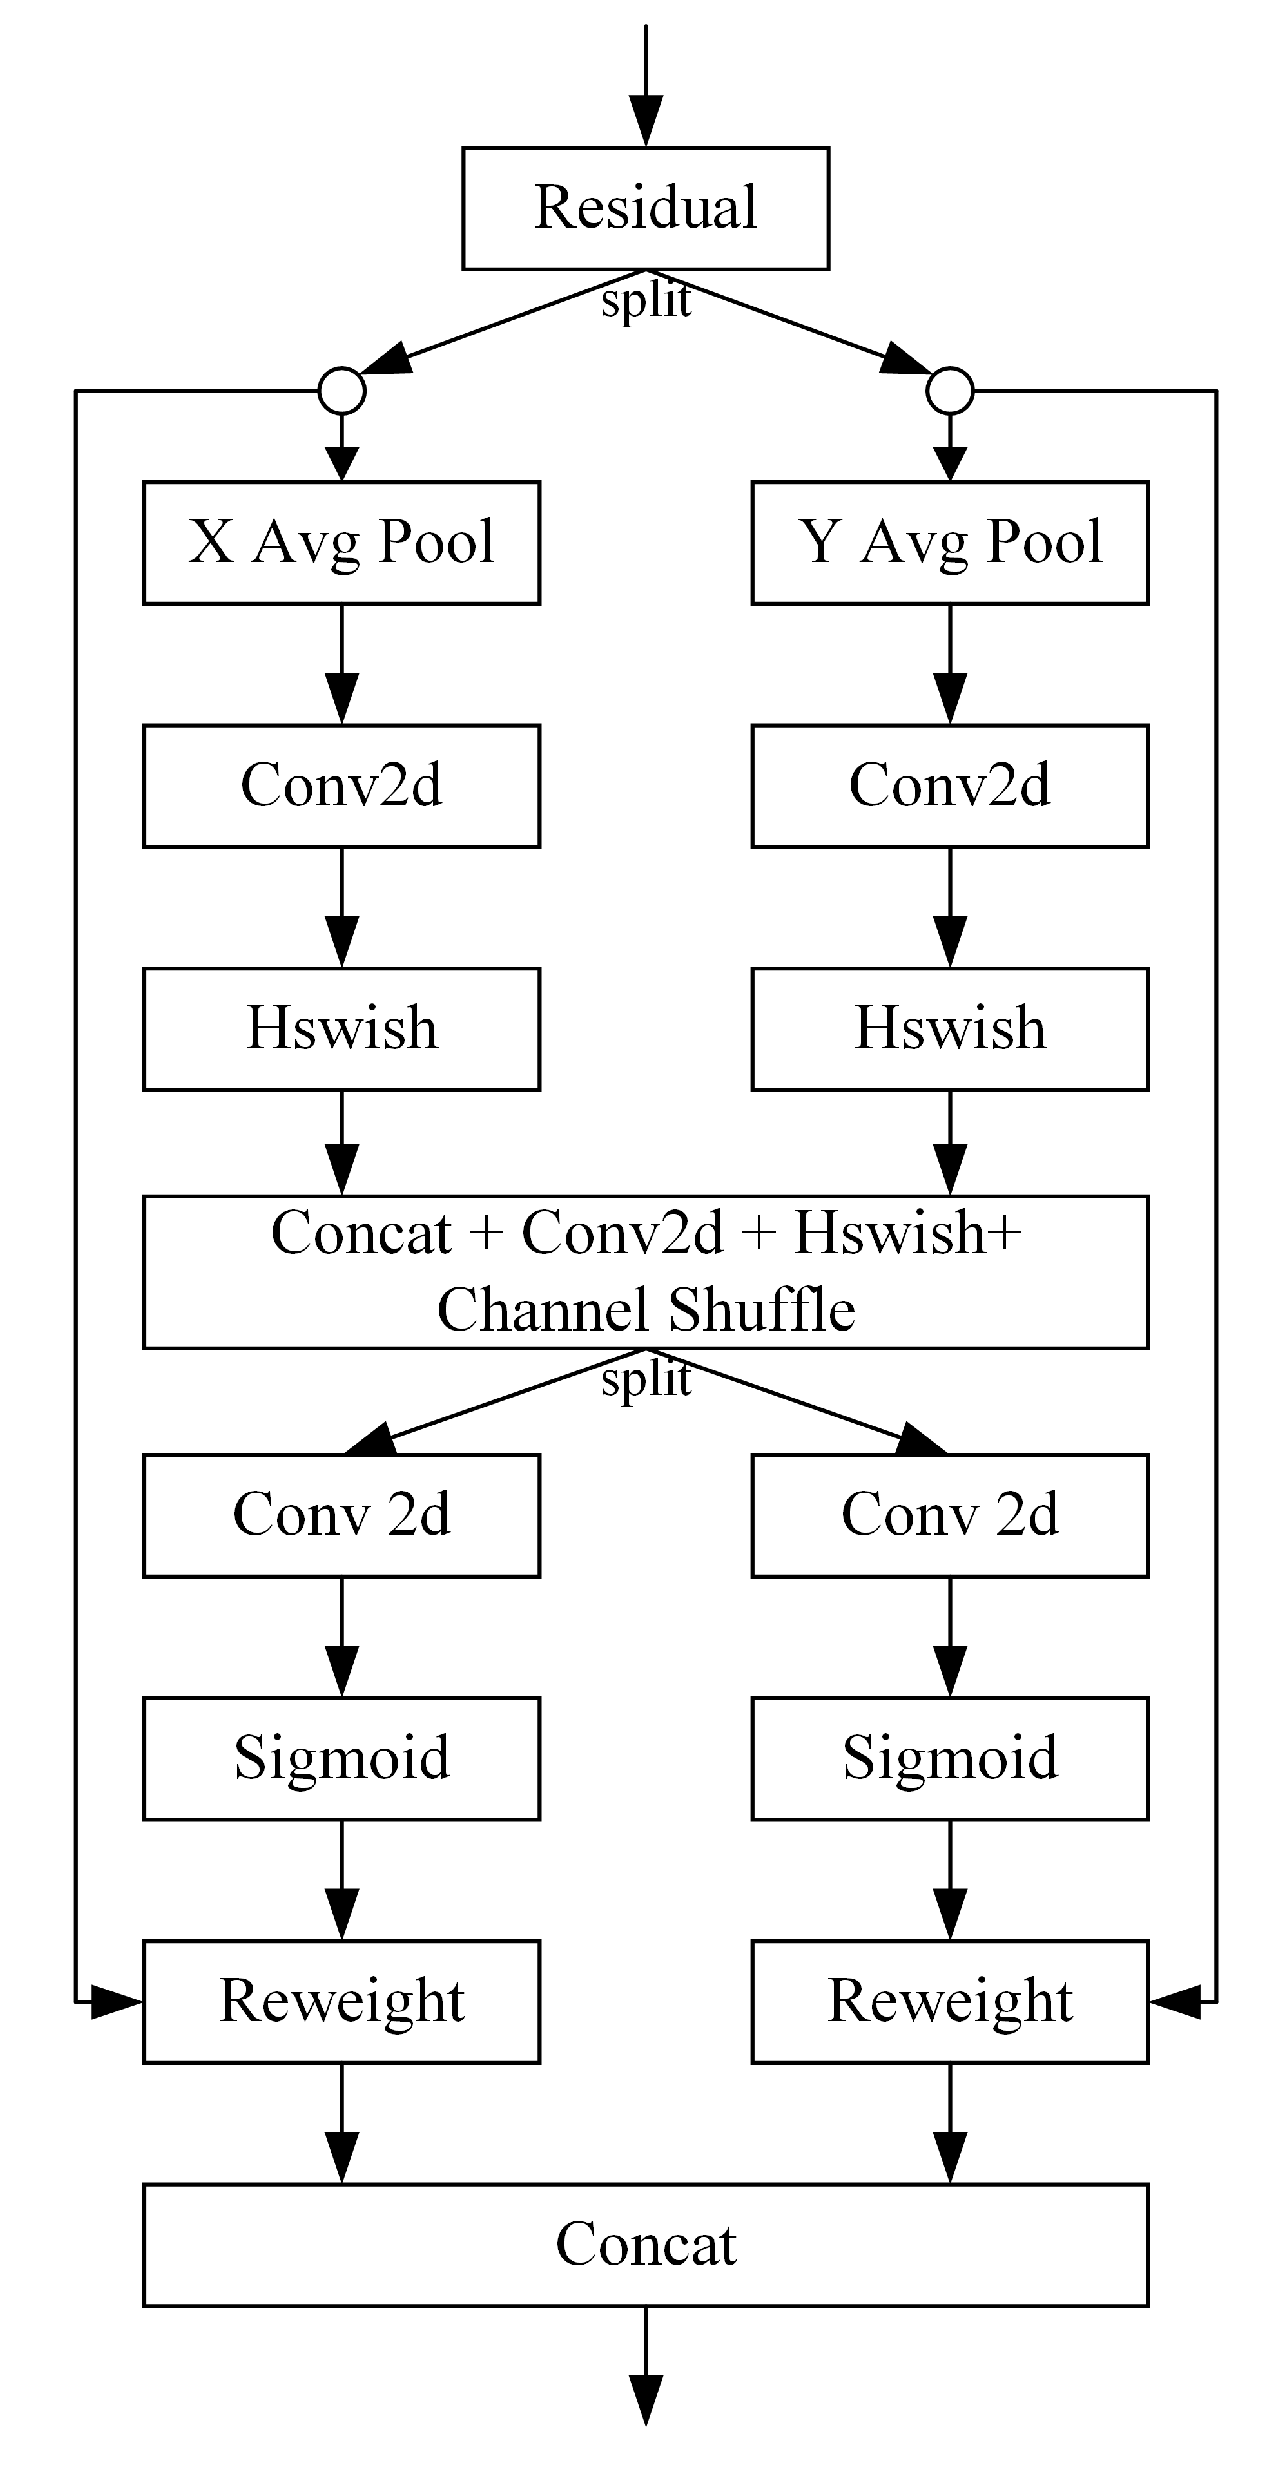
(1) A new attention module, the cross sidelobe attention (CSAT) module, is constructed. This module enhances the model’s attention to the cross sidelobe region and models the long-range dependence of the channel and spatial information, improving the method’s effectiveness for SAR ship detection.
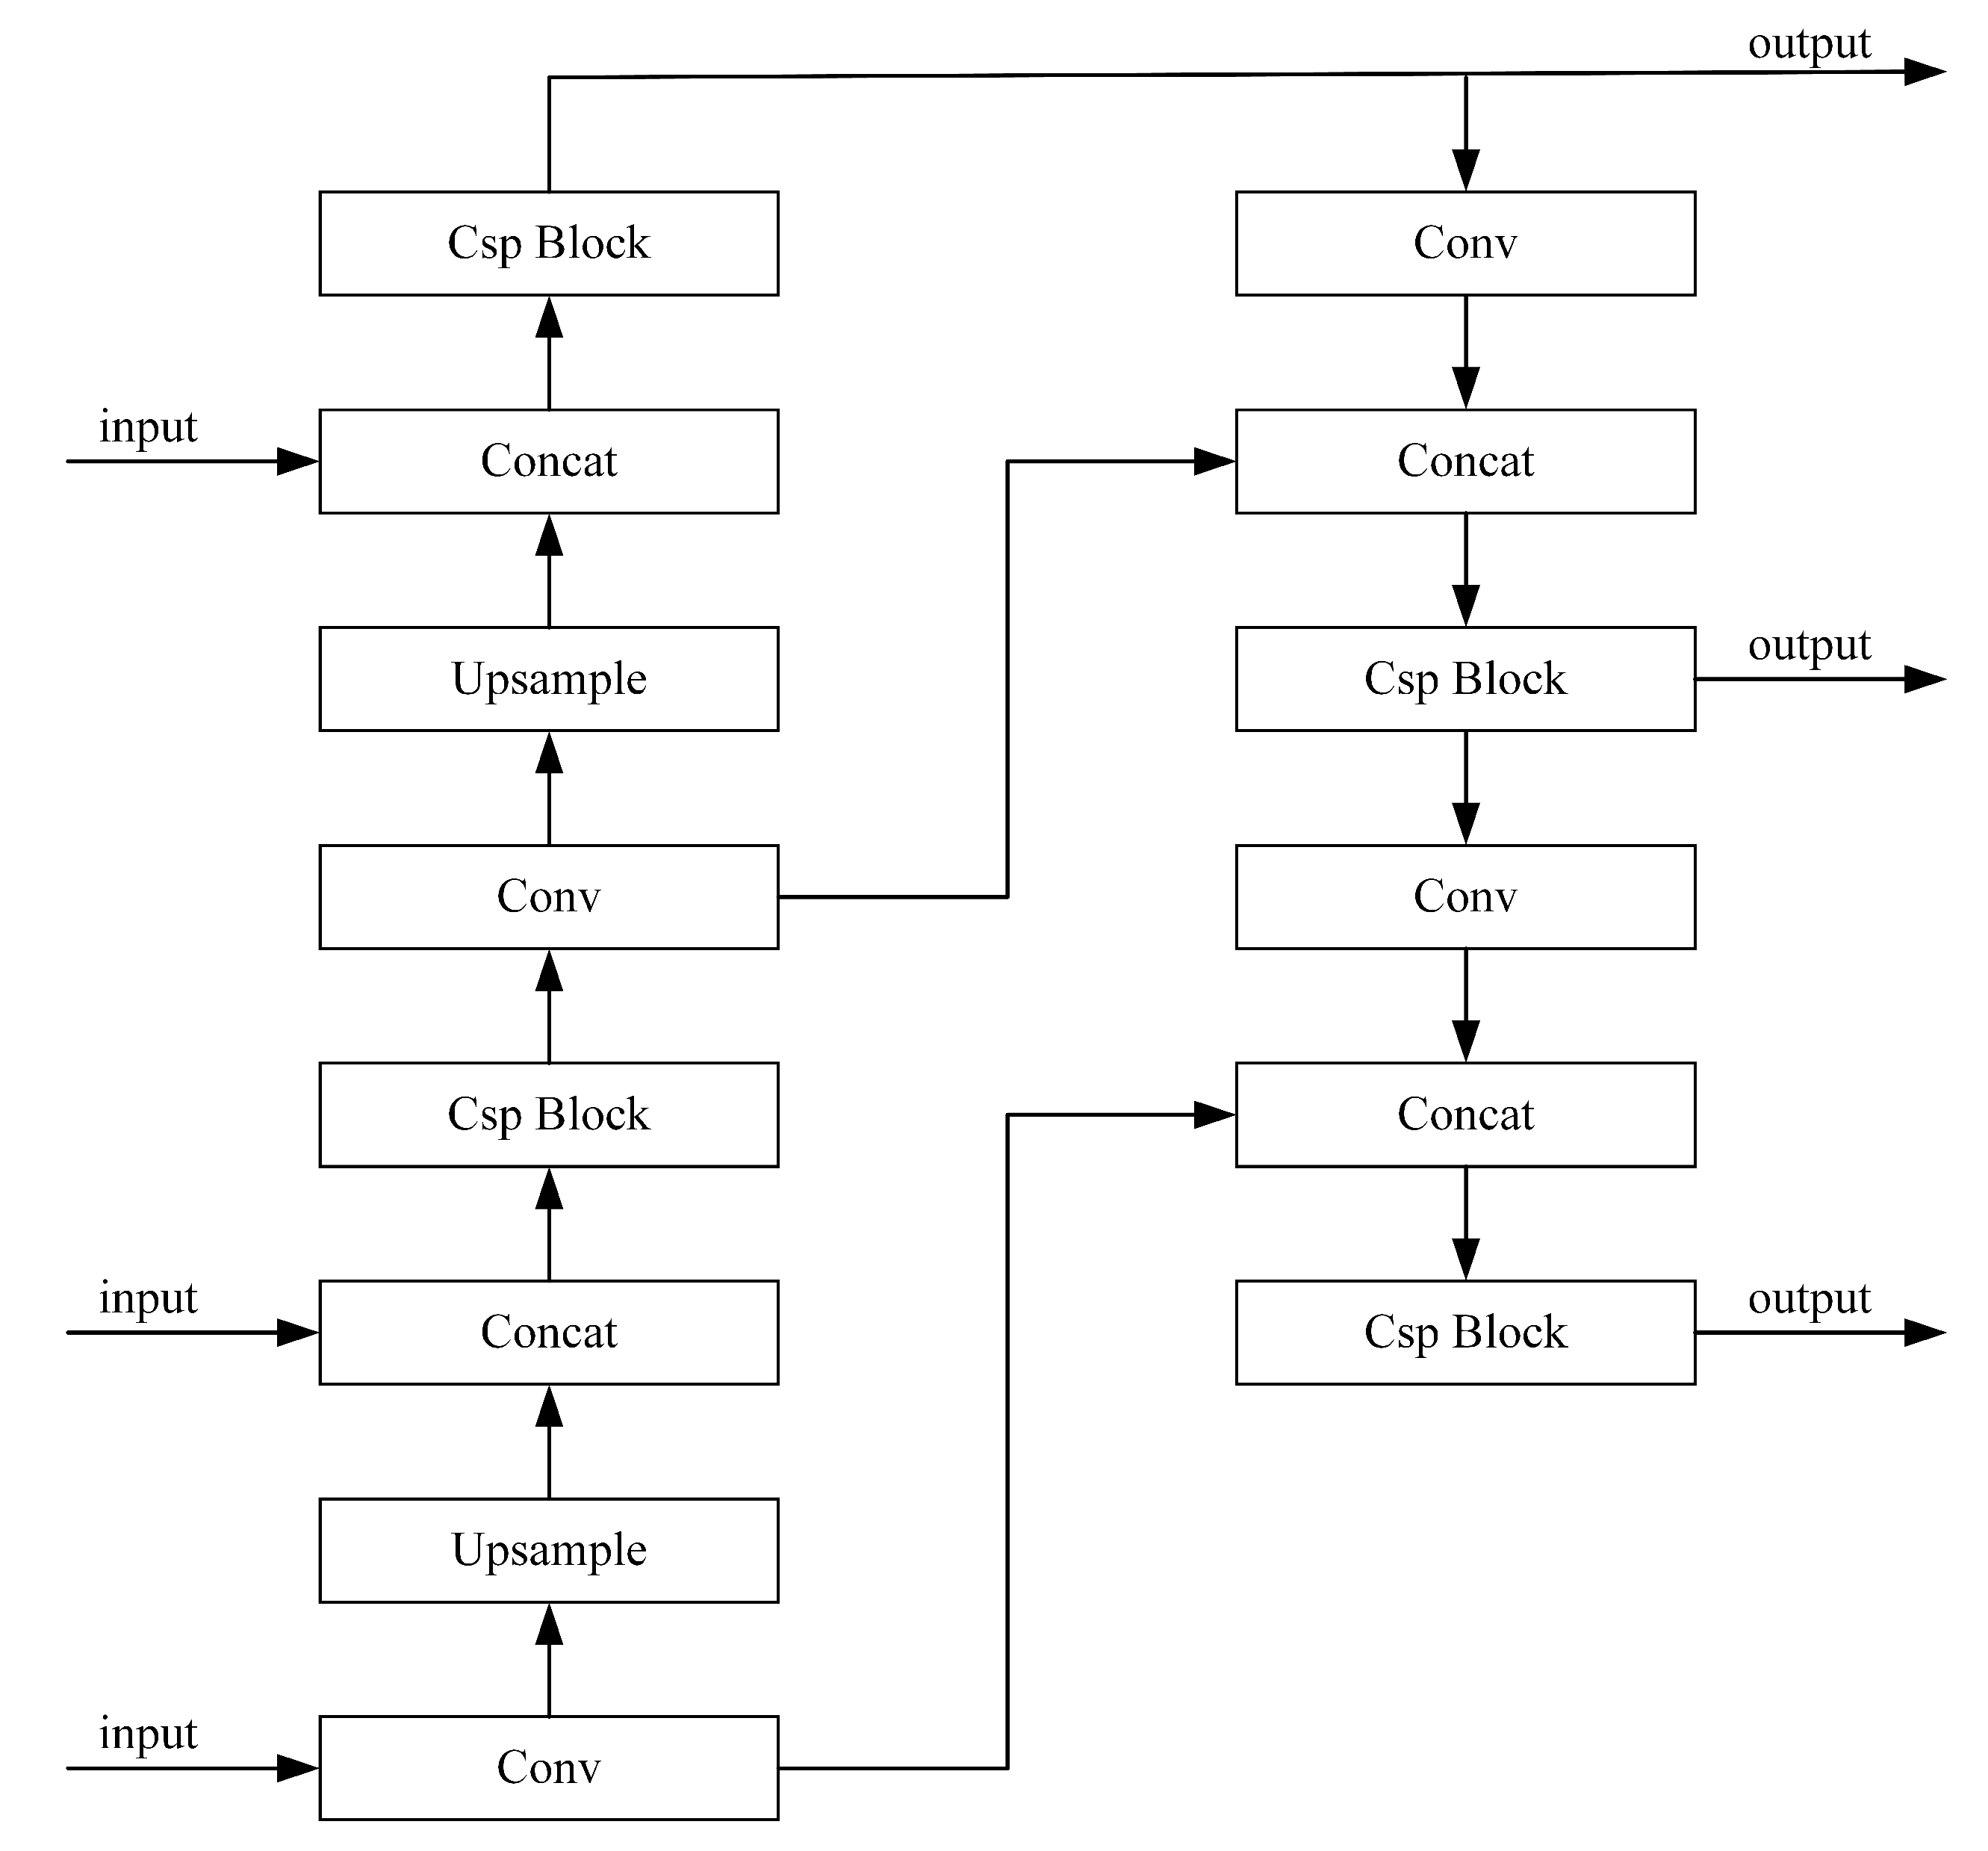
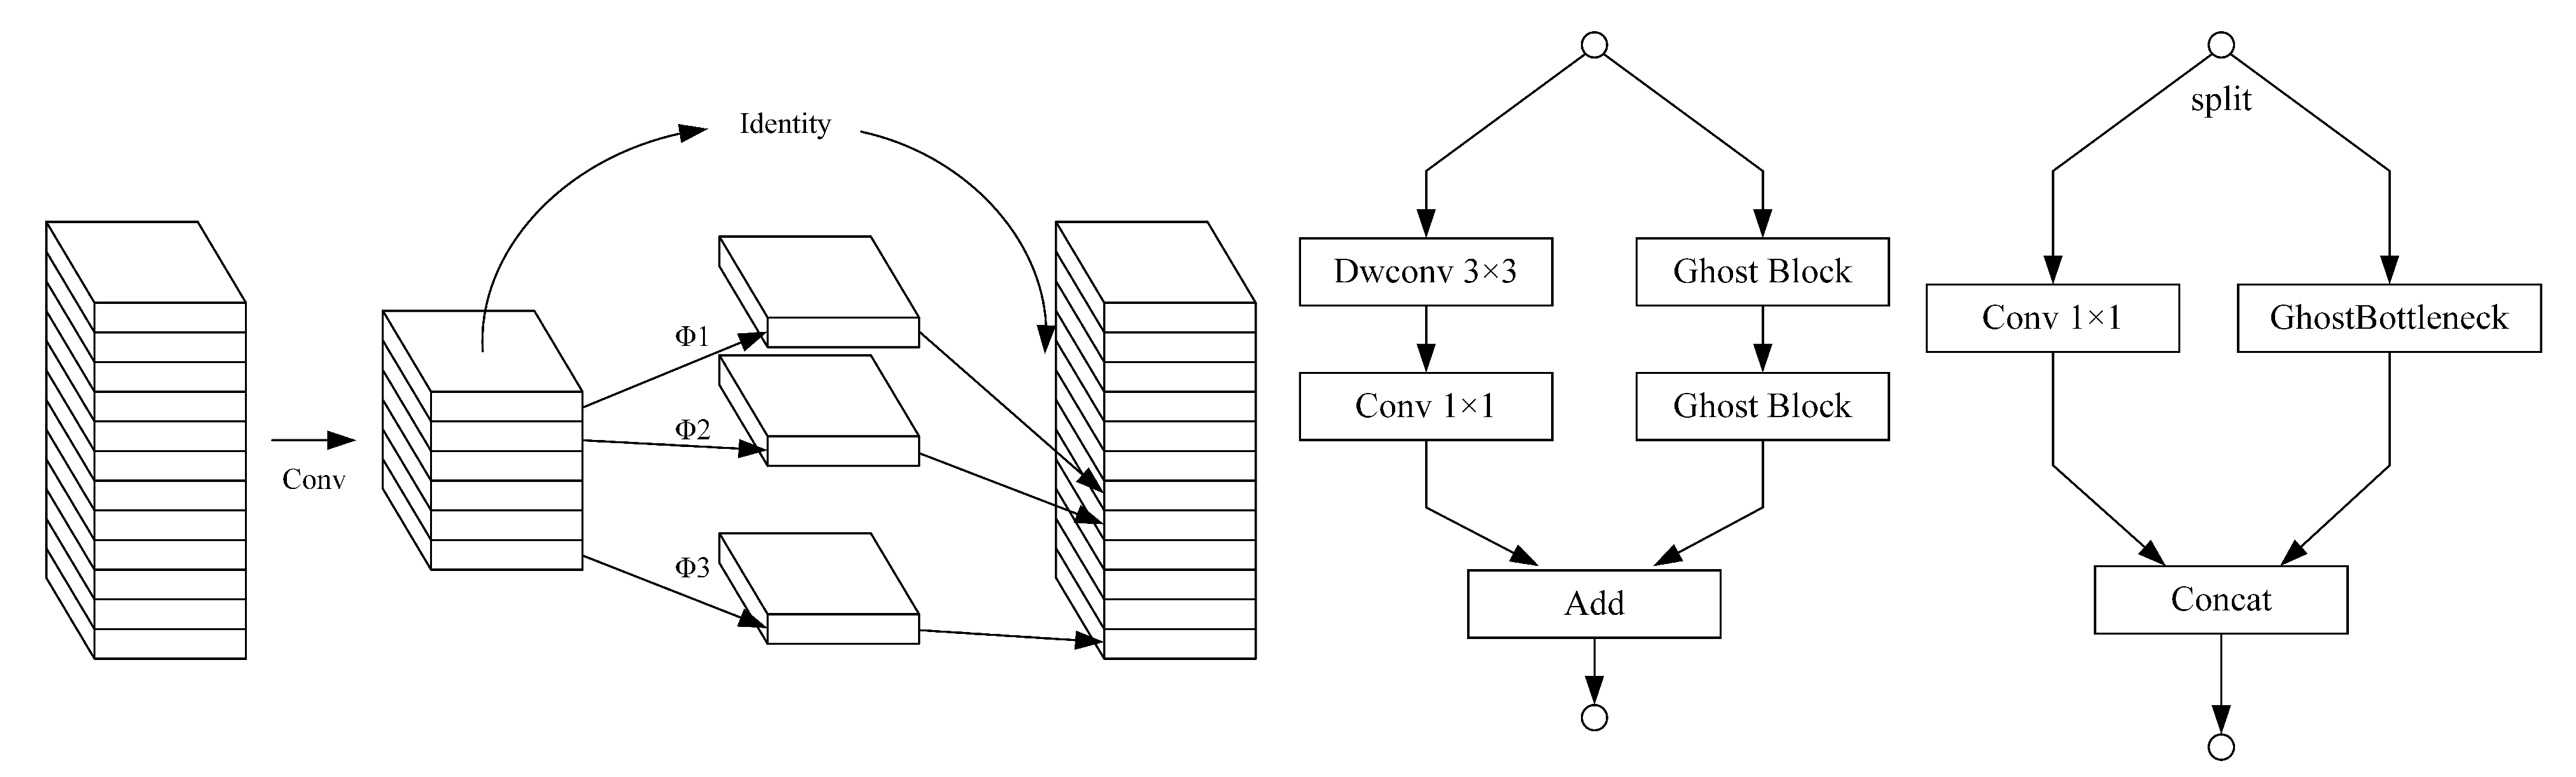
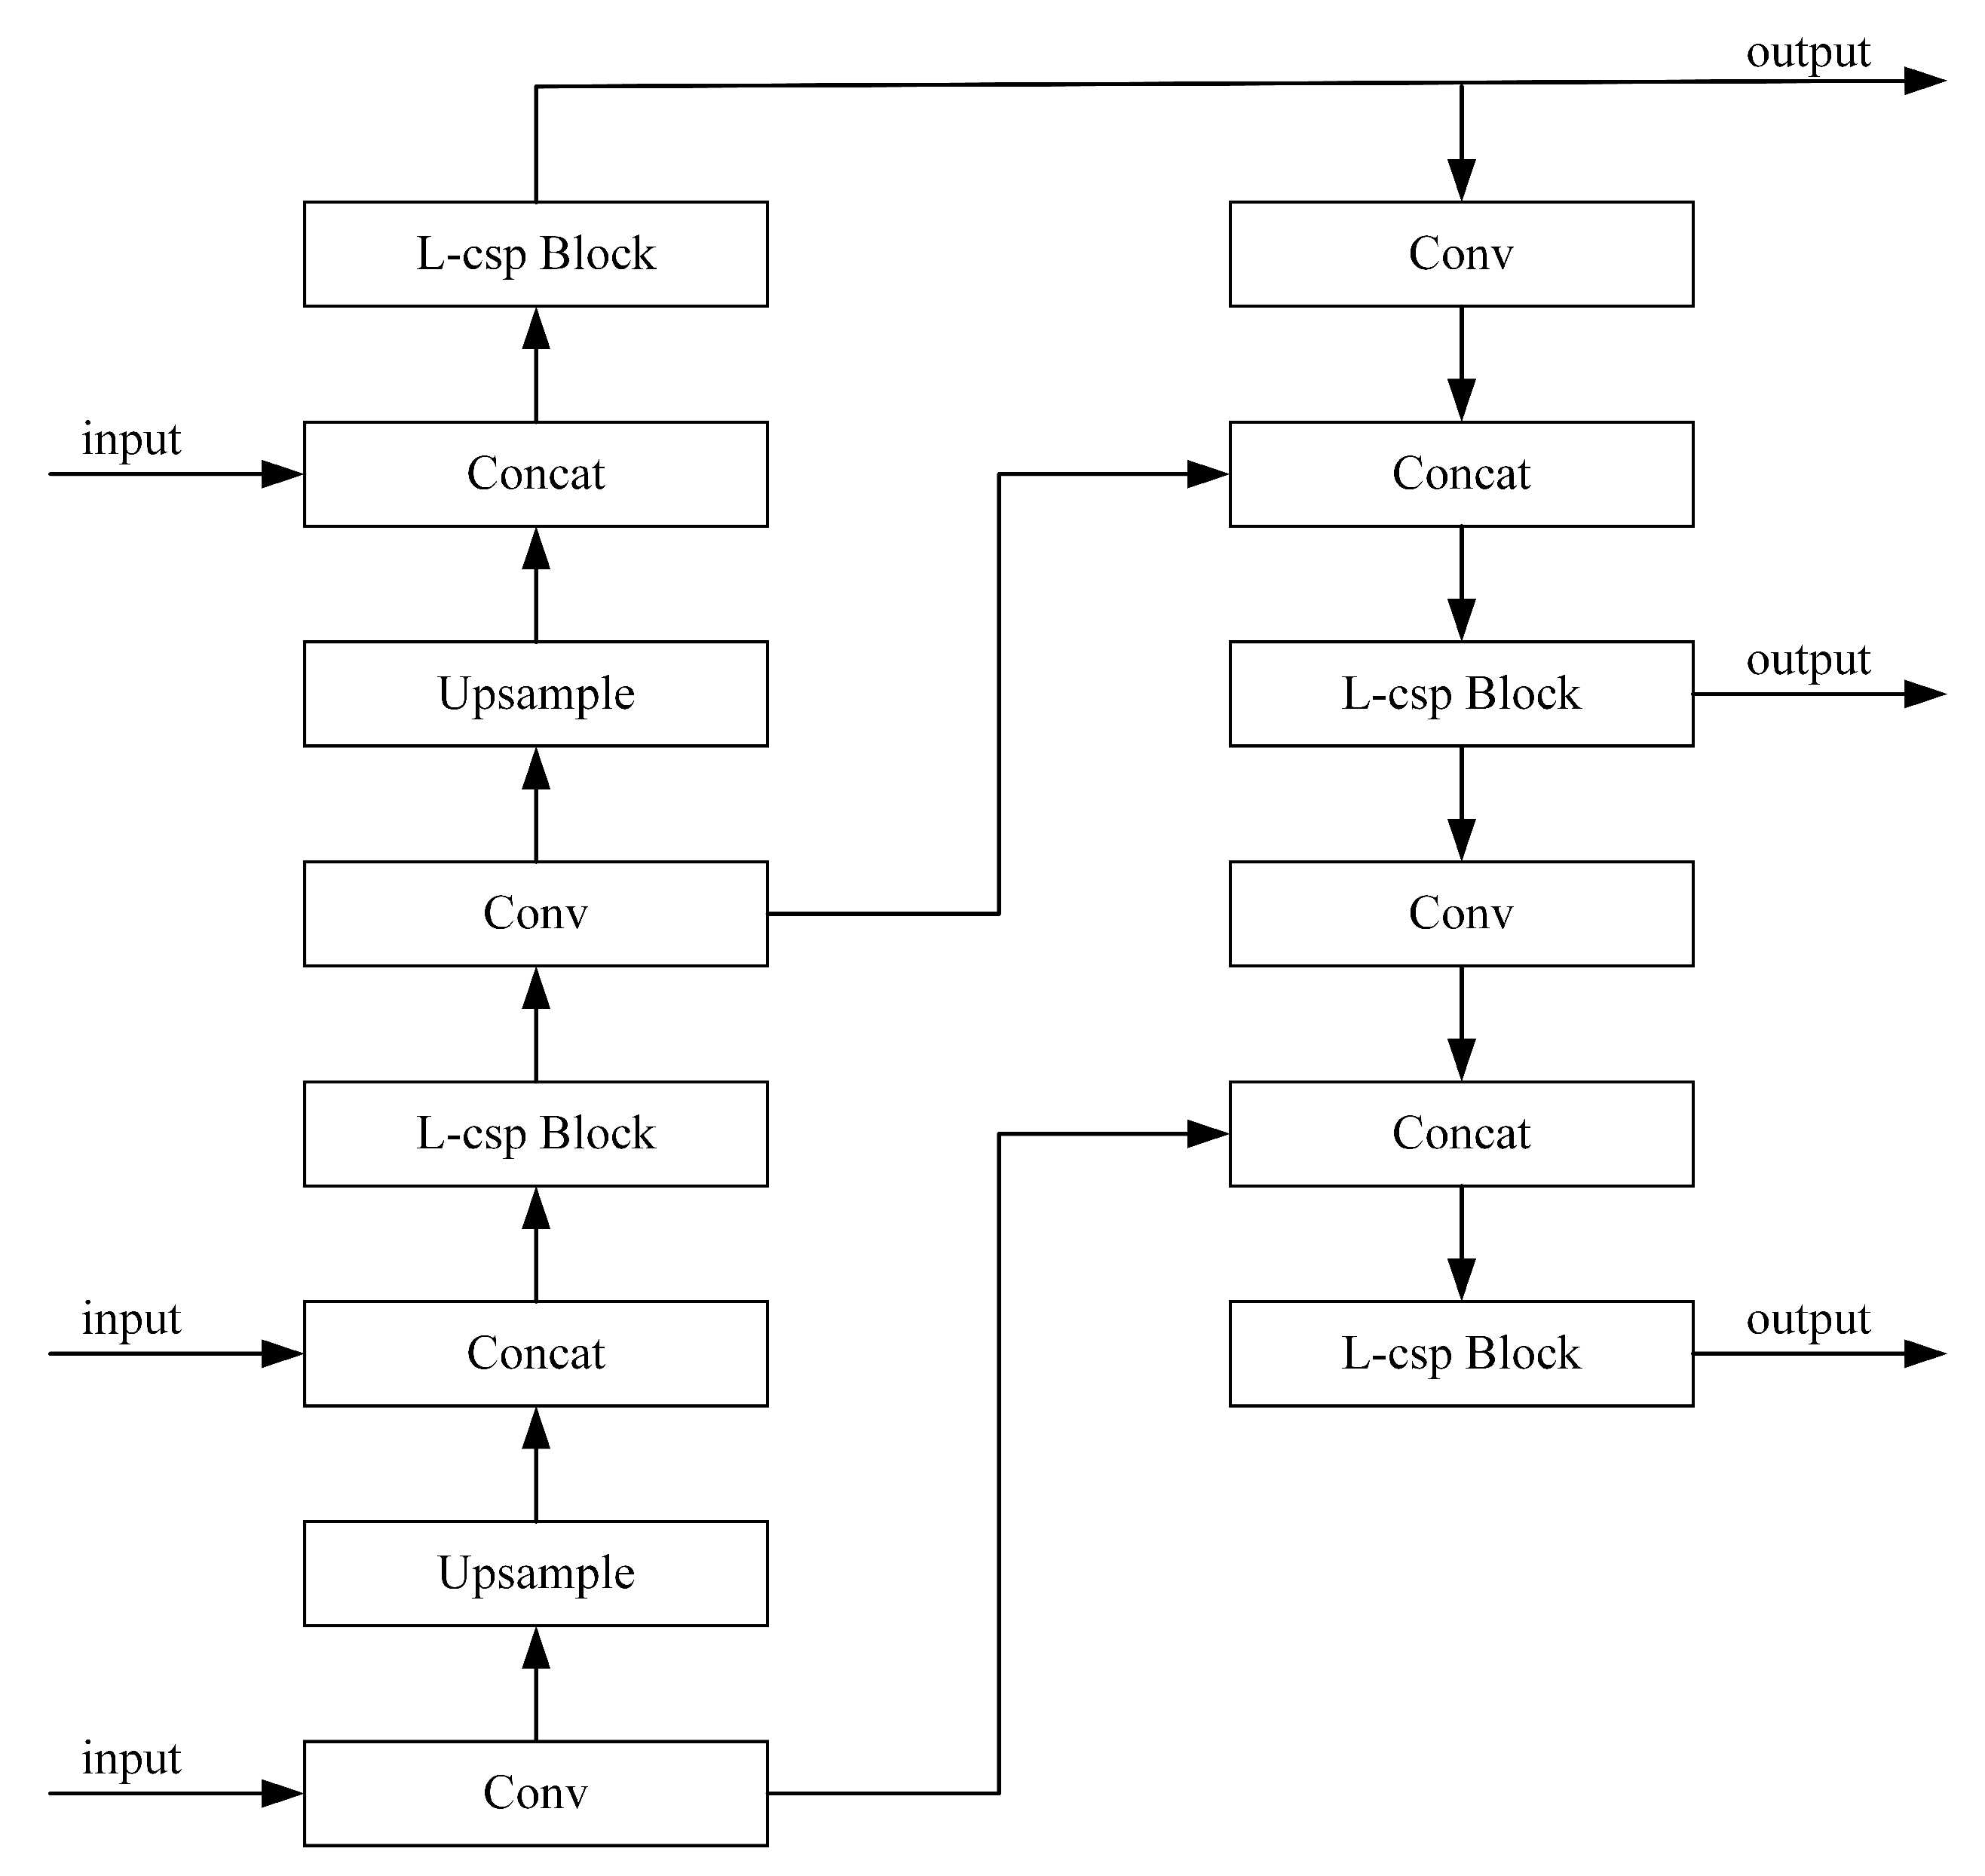
(2) A new fusion network module, the lightweight path aggregation feature pyramid network (L-PAFPN) module, is constructed. This module uses the L-CSP module based on the ghost block design to replace the CSP module in YOLOX PAFPN. By reducing the network’s redundancy, the computational load is reduced, the number of parameters of the method is reduced and the method’s performance for SAR ship detection is improved.
(3) A new feature extraction structure, the Focus module, is introduced. Based on the baseline network, this paper introduces the Focus module to improve the backbone network. It increases the number of feature channels in the feature extraction process, improves the feature extraction capability of the backbone network and enhances the SAR ship detection effect of the method.
(4) A lightweight SAR ship detector, LssDet, is constructed. Based on the baseline network and the CSAT module, the L-PAFPN module and the Focus module, we proposed LssDet, which achieves competitive performance with low computational complexity and a low number of model parameters. The detector is proposal-free and anchor-free.
The remainder of the paper is organised as follows: In Section 2, we present LssDet’s baseline network and our proposed architecture. In Section 3, we present the experiments’ details and results and analyse the experimental results. In Section 4, we discuss the experimental results and the shortcomings of the experiment. In Section 5, we draw some conclusions and give an outlook on future research. In addition, Table A1 offers all the abbreviations and corresponding full terms involved for the convenience of reading.

2. Method

This paper proposes a lightweight neural network, LssDet, for SAR ship detection tasks. This section details the main ideas of LssDet. In particular, Section 2.1 introduces the baseline network of LssDet, and Section 2.1 introduces specific improvements to LssDet.

2.1. Baseline

This paper proposes a lightweight neural network, LssDet, for SAR ship detection tasks. In this section, we detail the main ideas of LssDet. Section 2.1 presents the baseline network architecture of LssDet. Section 2.2 presents the proposed architecture of LssDet.
LssDet’s backbone network is based on the lightweight network Shufflenet v2 [26]. Low computational computer vision (CV) tasks widely use lightweight networks. Due to the limited computational resource, the lightweight network only uses a limited number of feature channels. Shufflenet v2 enables an efficient and accurate backbone network through extensive feature reuse, which significantly increases the number of feature channels used by the network with limited computational resources. Specifically, Shufflenet v2 uses a depthwise separable convolution (DWconv) [27] and hopping structure to design the block unit. At the same time, the channel shuffle operation shuffles each group of channels evenly, enabling information communication between different channel groups, significantly increasing the number of network feature channels and improving the network’s performance at a fraction of the cost of a full-sized network. The details of Shufflenet v2 are shown in Figure 1. The left subfigure shows the structure of Shufflenet v2, the middle subfigure shows the basic unit of Shufflenet v2 and the right subfigure shows the spatial down sampling unit (2×) of Shufflenet v2.
LssDet’s feature fusion network is based on YOLOX PAFPN [28]. In CV tasks, the backbone network has a hierarchical structure, outputting features at different levels. The feature fusion network achieves complementary strengths by optimally combining features at different levels. Specifically, the backbone network extracts features from shallow to deep layers. Shallow features have high resolution and contain more locational and detailed information but less semantic information; deeper features have richer semantic information but lower resolution and less perception of details. The feature pyramid network (FPN) [29] enhances the feature representation capability of the network by introducing top-down paths that fuse features from adjacent levels based on bottom-up feature extraction from the backbone network. Based on the FPN, the path aggregation feature pyramid network (PAFPN) [30] introduces bottom-up paths to enhance the information transfer between features at different levels, further improving the network’s feature extraction capability. Based on the PAFPN, YOLOX PAFPN refers to a cross stage partial network (CSPNet) [31] that has a CSP Block as a cross-stage information fusion module to improve performance and decrease the computational cost. The structure of YOLOX PAFPN is shown in Figure 2.
LssDet’s prediction network is based on the YOLOX Decopuled Head [28]. Most existing detection models use a coupled head network for their prediction networks [32,33,34], which achieves classification and regression tasks with less computational cost by sharing network parameters. However, the coupled head network can lead to performance losses due to the inconsistent focus of the classification and regression tasks [35,36]. Therefore, YOLOX achieves the classification and regression tasks through different network branches, thereby reducing the adverse effects of parameter sharing and improving network performance. Specifically, YOLOX first reduces the channel’s number of input data by 1 × 1 convolution. Then, it splits data into two parallel branches, each containing two 3 × 3 convolutions. The classification branch calculates the classification loss, and the regression branch calculates the regression loss and IoU loss. The structure of the prediction network is shown in Figure 3 [28]. The top subfigure shows the structure of the coupled head network, and the bottom subfigure shows the structure of YOLOX.

2.2. Proposed Architecture

LssDet has improved the baseline network primarily through the CSAT module, the L-PAFPN module and the Focus module. This section describes the details of these modules.

2.2.1. CSAT

Ships generally consist of cockpits, sides, decks, storage compartments, railings and other structures. The backscattering of radar incident waves varies significantly among the different structures. When the backscattering is surface scattering on decks and in storage compartments, the scattering intensity is weak. In contrast, in the two-sided angular regions formed by areas such as decks, sides and cockpits, the backscatter is angular reflection, and the scattering intensity is intense.
According to the SAR imaging principle, the echo signal of the focused target is a two-dimensional S i n c function, expressed as a gradually decaying signal in azimuthal and distance directions. Equation (1) shows the S i n c function.
S i n c ( t ) = s i n ( π t ) / π t , t 0 1 , t = 0
When the backscattering caused by the ship’s structure is extreme, or the image is poorly focused, although the echo sidelobe signal is much weaker than the primary sidelobe signal, it will still be more substantial than the surface signal or other weakly scattering parts of the echo signal. Thus, there can be an apparent cross sidelobe effect by coherent superposition. In SAR imaging, it appears as two straight lines crossing vertically in the azimuthal and distance directions. Due to the imaging mechanism of the cross sidelobe, they generally occur in areas of the ocean where there are angular reflections, such as ships, harbours and drilling platforms, and rarely on land or elsewhere. Figure 4 shows examples of cross sidelobes in the LS-SSDD-v1.0 [37].
In SAR ship detection tasks, the appearance of a cross sidelobe is closely related to the ship’s position. In particular, the cross sidelobe is more evident for some poorly imagable ships. The imaging area of the cross sidelobe will be significantly larger than the imaging area of the ship. Therefore, increasing the attention to the cross sidelobe region to improve SAR ship detection performance is meaningful.
The attention mechanism is a resource allocation mechanism that highlights the impact of necessary information by adaptively assigning attention weights to the input information and is widely used in neural networks [38]. In this paper, we use the attention mechanism to assign attention weights to the cross sidelobe region, which improves the detection performance of SAR ships. However, most attention mechanism methods are computationally intensive, which makes them difficult to apply to lightweight neural networks. At present, squeeze-and-excitation (SE) attention [39] is still the most widely used attention mechanism in lightweight neural networks. However, in the feature space, SE attention only considers the channel information but ignores the spatial information. To consider the spatial information in the feature space, the bottleneck attention module (BAM) [40] and the convolutional block attention module (CBAM) [41] combine the channel and spatial information in the feature space by sequentially computing channel and spatial attention. However, this approach can only model regional dependencies and cannot model long-range dependencies. However, long-range dependencies are essential for computer vision tasks [42]. For this reason, we designed the CSAT module to model the long-range dependence of the channel and spatial information.
In order to make better use of the cross sidelobe region features and model the long-range dependence of the channel and spatial information, we designed the CSAT module. The CSAT module focuses the weight of the input data on the square region where the cross sidelobe is located by decomposing the conventional attention mechanism into two parallel one-dimensional feature encoding processes along the horizontal and vertical directions. In addition, through the parallel one-dimensional encoding process, the CSAT module can effectively integrate feature spatial coordinates for long-range modelling dependence on the channel and spatial information. The structure of the CSAT module is shown in Figure 5.
Specifically, for the given input X R c × h × w , where c is the channel number (input data channel), and h and w are the height and width of the input data. Firstly, we split X into x and y along the channels, x R c / 2 × h × w , y R c / 2 × h × w . Then, we encode x and y along the horizontal and vertical directions using two spatially scoped pool kernels ( H , 1 ) and ( 1 , W ) . Therefore, the output data at height h of the c channel can be formulated as:
z c h ( i ) = 1 W 0 i < W x c ( h , i )
Similarly, the output at the width w of the c-th channel can be formulated as:
z c w ( j ) = 1 H 0 j < H y c ( j , w )
The above transform produces aggregated features for x and y along the horizontal and vertical directions, producing a pair of direction-aware feature maps.
Next, the feature mappings z h and z w are sent to the 1 × 1 convolutional transform functions F h 1 and F w 1 .
f h 1 = δ ( F h 1 ( z h ) )
f w 1 = δ ( F w 1 ( z w ) )
where δ represents the nonlinear activation function Hswish; f h 1 R ( C / 2 · r ) × H and f w 1 R ( C / 2 · r ) × W are intermediate feature mappings that encode spatial information in the vertical and horizontal directions. Next, we concatenate f h 1 and f w 1 along the channels and send them to the 1 × 1 convolutional transform function F 2 .
f 2 = δ ( F 2 ( [ f h 1 , f w 1 ] ) )
where [ · , · ] denotes the concatenating operation along the channel, f 2 R C / r × [ ( H + W ) / 2 ] is the intermediate feature mapping encoding spatial information in the vertical and horizontal directions, r is the scaling ratio used to control the number of channels. Next, channel shuffling is performed, splitting f 2 into f h 3 and f w 3 along the channel, where f h 3 R ( C / 2 · r ) × H and f w 3 R ( C / 2 · r ) × W . Then, f h 3 and f w 3 are sent to the 1 × 1 convolutional transform functions F h 3 and F w 3 .
g h = σ ( F h 3 ( f h 3 ) )
g w = σ ( F w 3 ( f w 3 ) )
where σ represents the nonlinear activation sigmoid function, g h R C / 2 × H , g w R C / 2 × W . Finally, the output of the CSAT module can be expressed as:
y c ( i , j ) = [ x c / 2 ( i , j ) × g c h ( i ) , y c / 2 ( i , j ) × g c w ( j ) ]
The CSAT module improves the SAR ship detection performance of LssDet by enhancing the model’s focus on the cross sidelobe region and modelling the long-range dependence of the channel and spatial information. Figure 6 shows the position of the CSAT module inserted in the Shufflenet v2 block unit. The left part shows the position of the CSAT module inserted into the basic unit of Shufflenet v2, and the right part shows the position of the CSAT module inserted into the spatial down sampling unit (2×) of Shufflenet v2.

2.2.2. L-PAFPN

How to better utilise the features extracted from images by the backbone network is a fundamental problem in CV tasks. By introducing top-down paths to fuse features from adjacent layers output by the backbone network, the FPN [29] enhances the semantic information in shallow features to adapt to targets at different scales in object detection tasks. Based on the FPN, the PAFPN [30] introduces bottom-up paths, fusing shallow resolution information into deeper features in a bottom-up manner, thereby enhancing the network’s ability to exploit features. Further, YOLOX PAFPN introduces the CSP block [31] as the information fusion module to improve the detection performance of the network.
YOLOX PAFPN performs cross-layer information fusion via bottom-up and top-down paths, significantly improving detection performance. However, YOLOX PAFPN uses the CSP block as the cross-layer information fusion module, which has complex computational and redundant information, making it computationally burdensome for applications in lightweight neural networks.
For this reason, inspired by the GhostNet [43], we propose L-PAFPN, which uses the L-CSP block based on the ghost block design instead of the CSP block in YOLOX PAFPN. Compared to the CSP block, the L-CSP block requires less computational effort. Figure 7 shows the organisation of the L-PAFPN module’s components. The left part shows the structure of the ghost block, the middle part shows the structure of the ghost bottleneck and the right part shows the structure of the L-PAFPN module. Figure 8 shows the structure of the L-PAFPN module.
We first introduce the ghost block, part of the L-PAFPN. For the given input X R c × h × w , where c is the channel number of the input data, and h and w are the height and width of the input data. The regular convolutional layer operation for generating n feature maps can be expressed as:
f 1 = δ ( F 1 ( X ) )
where F 1 represents the convolutional transform function, and f 1 R n × h × w represents the intermediate feature mapping.
However, due to the characteristics of the convolutional transform function, f 1 usually contains a large amount of redundancy, which places a burden on the network computation. Therefore, we can split n. Specifically, a part of the feature mapping is generated using the convolutional transform function, and a low-computational-cost linear operation generates another portion of feature mapping. The convolution operation used to generate the m feature mapping can be expressed as:
f 2 = δ ( F 2 ( X ) )
where F 2 represents the 1 × 1 convolutional transform function, f 2 R m × h × w , m n .
To obtain the required number of feature maps, n, we apply a further operation on f 2 to generate s features, which can be expressed as:
f 3 = δ ( F 3 ( f 2 ) )
where F 3 represents the 3 × 3 depthwise separable convolutional transform function, f 3 R s × h × w , s = n m .
At this point, concatenate f 2 and f 3 along the channel and get the ghost block output f 4 .
f 4 = [ f 2 , f 3 ]
We next introduce the ghost bottleneck, which is also one of the components of the L-PAFPN. It consists of a series of operations carried out by the ghost block.
Specifically, for the given input Y R c × h × w , we first send Y into the ghost block transform function G h o s t b l o c k , and get the output g 1 , and then send g 1 into the ghost block transform function G h o s t b l o c k to get the output g 2 , which can be formulated as:
g 1 = G h o s t b l o c k ( Y )
g 2 = G h o s t b l o c k ( g 1 )
At the same time, we send the input data Y into the 3 × 3 depthwise separable convolutional transform function G 3 and get the output g 3 , and then send g 3 into the 1 × 1 convolution transform function G 4 and get the output g 4 , which can be formulated as:
g 3 = σ ( G 3 ( Y ) )
g 4 = σ ( G 4 ( g 3 ) )
Finally, the output of the ghost bottleneck is f = g 2 + g 4 , where + represents the adding operation.
We finally introduce the L-CSP module, which consists of the ghost bottleneck. Specifically, for the input data Z, Z R c × h × w .
The input Z is first to split into z 1 and z 2 along the channel dimensions, z 1 R ( c / 2 ) × h × w and z 2 R ( c / 2 ) × h × w . z 1 is sent to the 1 × 1 convolutional transform function Z 1 , and z 2 is sent to the ghost bottleneck transform function G h o s t b o t t l e n e c k .
z 3 = δ ( Z 1 ( z 1 ) )
z 4 = G h o s t b o t t l e n e c k ( z 2 )
where z 3 and z 4 represent the intermediate feature mapping, z 3 R ( n / 2 ) × h × w and z 4 R ( n / 2 ) × h × w . We concatenate z 3 and z 4 along the channel and send the result to the 1 × 1 convolution Z 2 . Finally, the output of the L-CSP block can be expressed as:
f = δ ( Z 2 [ z 3 , z 4 ] )
where f R n × h × w . Finally, the L-CSP module is applied to YOLOX PAFPN, replacing the original CSP module to obtain our proposed L-PAFPN module.

2.2.3. Focus

In lightweight neural networks, due to their limited computational resources, only a limited number of feature channels can be used, which limits the network’s performance. To reduce the impact of the limited number of feature channels on the network performance, we use the Focus [28,34] module for feature extraction instead of the first convolutional layer in the backbone network.
The Focus module splits the input image into four equal parts and sends them into the backbone network. Through these operations, the Focus module increases the number of feature channels, reduces the information loss during feature extraction and improves network performance.
Specifically, for the given input X R c × h × w , the Focus module is split X into f 1 , f 2 , f 3 and f 4 by inter-pixel fetching.
f 1 R c × ( h / 2 ) × ( w / 2 ) , f 2 R c × ( h / 2 ) × ( w / 2 ) , f 3 R c × ( h / 2 ) × ( w / 2 ) , f 4 R c × ( h / 2 ) × ( w / 2 ) .
Next, f 1 , f 2 , f 3 and f 4 are concatenated along the channel dimension and sent to the 3 × 3 convolutional transform function F 1 .
f = δ ( F 1 ( [ f 1 , f 2 , f 3 , f 4 ] ) )
where f is the output of the Focus module, f R n × h × w , n = 4 c .

3. Experiments

This section validates our proposed SAR ship detection method’s performance. Firstly, we introduce the hardware and software environment for the experiments, the dataset used for experiments, the details of the experiments and the experimental evaluation metrics. Next, we introduce the experiments’ results on the SAR Ship Detection Dataset (SSDD) [44] and the Large-Scale SAR Ship Detection Dataset v1.0 (LS-SSDD-v1.0) [37] and compare them with the latest detection methods’ results. Finally, we introduce the ablation experiments’ results to verify the validity of each module we proposed.

3.1. Experimental Environment

All experiments used the same environment to run. The environment’s configuration details are shown in Table 1.

3.2. Dataset

In the experiments, we used two SAR datasets to evaluate our proposed method, the SSDD and the LS-SSDD-v1.0. The SSDD includes 1160 SAR images with 500 × 500 pixels, with various resolutions, from 1 to 15 m. The LS-SSDD-v1.0 includes 15 large-scale images with 24,000 × 16,000 pixels, and the 15 large-scale images were directly cut into 9000 sub-images with 800 × 800 pixels, with various resolutions from 5 m to 20 m. Table 2 and Table 3 show the details of the SSDD and the LS-SSDD-v1.0.
To eliminate the impact of a different dataset division on the experimental results, we used the same dataset division as the dataset publisher. Specifically, the SSDD’s training subset contains 928 images, and the test subset contains 232 images. The LS-SSDD-v1.0’s training subset contains 6000 images, and the test subset contains 3000 images.

3.3. Experimental Setup

All experiments used stochastic gradient descent (SGD) with the learning rate lr = 0.01, momentum m = 0.937 and weight decay = 0.0005 as the optimisation algorithm. Furthermore, the batch size was 16; and the input size was 608 × 608 in the SSDD and 800 × 800 in the LS-SSDD-v1.0. All experiments were constructed based on the MMdetection [45], and the unmentioned parameters were the default parameters of MMdetection.

3.4. Evaluation Criteria

All experiments used A P @ [ 0.5 : 0.95 ] , A P @ 0.5 , A P @ 0.75 , A P s , A P m and A P l index in the COCO evaluation [46], floating-point operations per second (FLOPs) and paraments (Params) to measure the detection performance of the proposed method. A P @ [ 0.5 : 0.95 ] , A P @ 0.5 , A P @ 0.75 , A P s , A P m and A P l measure the detection accuracy of the method; F l o p s measures the computational complexity of the method; and P a r a m s measures the parameter size of the method.
A P = 0 1 P R d R
A P @ [ 0.5 : 0.95 ] = x = 0.5 : 0.05 0.95 A P @ x 10
A P s : a r e a < 322 p i x e l s
A P m : 322 p i x e l s < a r e a < 962 p i x e l s
A P l : 962 p i x e l s < a r e a
where,
P = T P T P + F P
R = T P T P + F N
TP, FP, TN, and FN are shown in Table 4.

3.5. Compared with the Latest Detectors in SAR Ship Detection

According to the experimental setup and evaluation criteria, we conducted experiments on the SSDD and LS-SSDD. Furthermore, we compared the SAR ship detection performance of LssDet with that of the latest methods, such as ATSS [47], AutoAssign [48], FCOS [49], YOLO V3 [32], YOLOX-s [28] and YOLOX-tiny [28]. The experiment results on the SSDD are shown in Table 5, and the experimental results on the LS-SSDD-v1.0 are shown in Table 6.
The experimental results on the SSDD and the LS-SSDD-v1.0 demonstrate the superiority of the method proposed in this paper. From a quantitative perspective, the A P @ [ 0.5 : 0.95 ] of LssDet was the optimal algorithm on the SSDD. Specifically, LssDet had an A P @ [ 0.5 : 0.95 ] of 68.1%, which is 3.6%, 4.4%, 5.7%, 6.9%, 0.8% and 5.2% higher than those of ATSS, AutoAssign, FCOS, YOLO V3, YOLOX-s and YOLOX-tiny, respectively. On the LS-SSDD-v1.0, the A P @ [ 0.5 : 0.95 ] of LssDet was optimal. Specifically, LssDet had an A P @ [ 0.5 : 0.95 ] of 27.8%, which was 3.5%, 7.7%, 4.3%, 5.6%, 0.1% and 1.0% higher than those of ATSS, AutoAssign, FCOS, YOLO V3, YOLOX-s and YOLOX-tiny, respectively. Both F l o p s and P a r a m s of LssDet were optimal. The F l o p s of LssDet were 3.57%, 3.63%, 3.65%, 43.72%, 37.23% and 64.88% for ATSS, AutoAssign, FCOS, YOLO V3, YOLOX-s and YOLOX-tiny, respectively. The P a r a m s of LssDet were 7.06%, 6.26%, 7.07%, 61.31%, 38.01% and 67.37% for ATSS, AutoAssign, FCOS, YOLO V3, YOLOX-s and YOLOX-tiny, respectively.
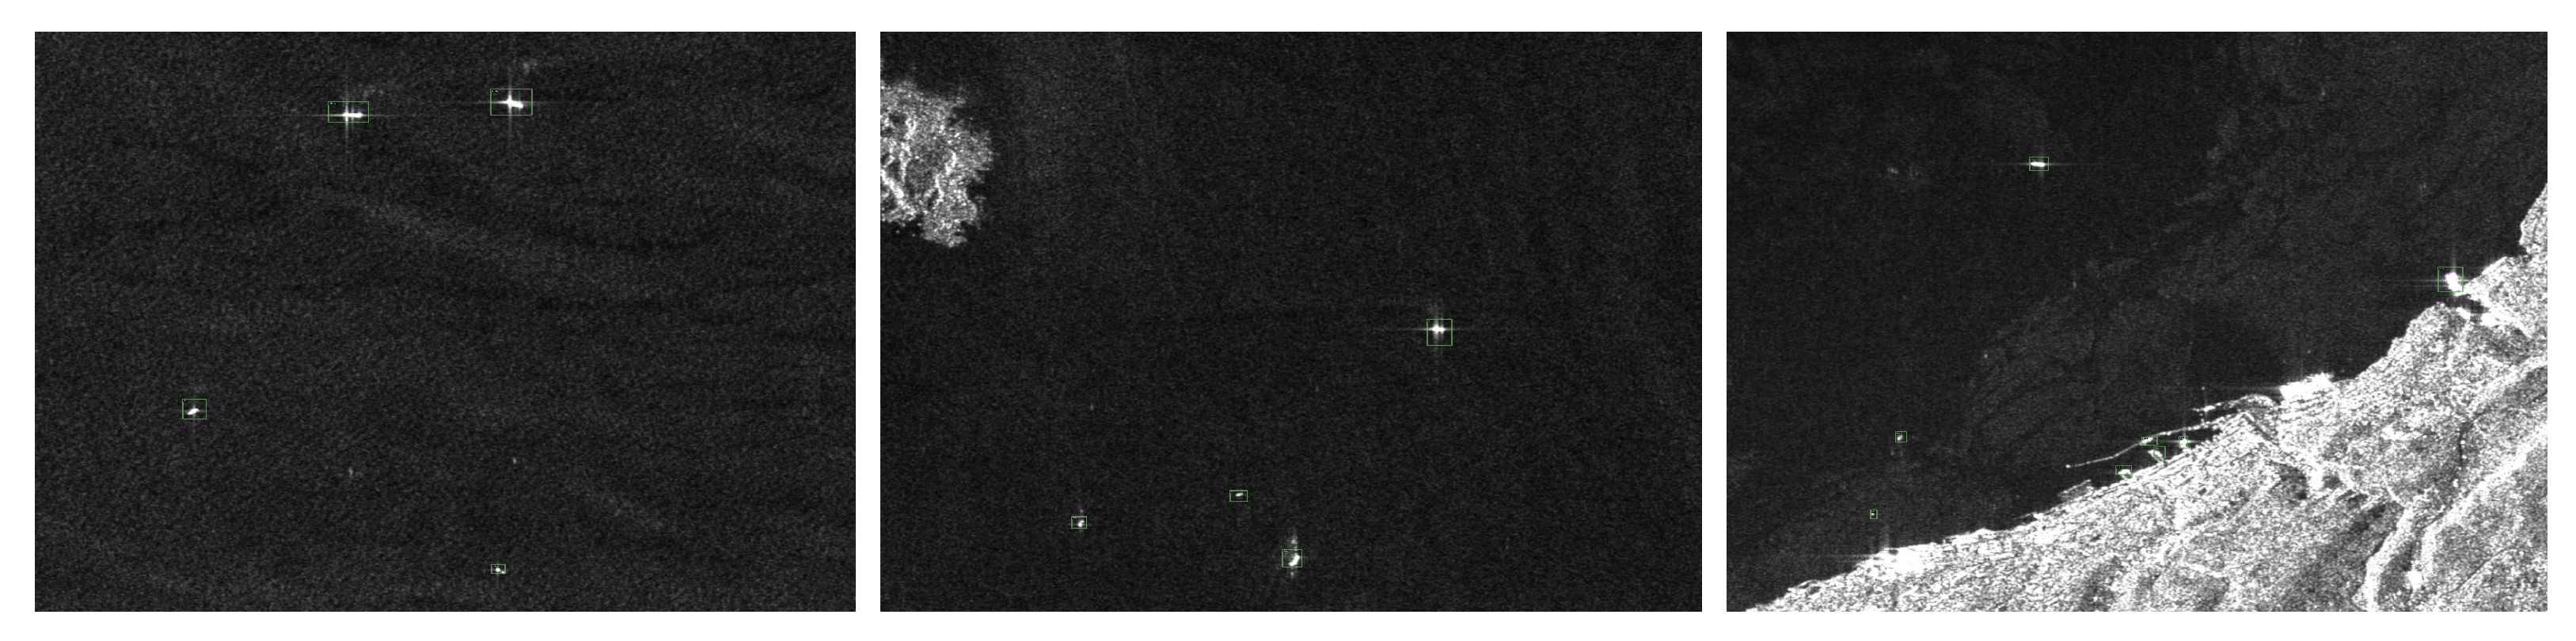
To visualise the detection performance of LssDet, Figure 9 shows the detection results of LssDet on the SSDD and the LS-SSDD-v1.0. The first and second columns show the label visualisation results and LssDet’s detection results on the SSDD. The third and fourth columns show the label visualisation results and LssDet’s detection results on the LS-SSDD-v1.0.

3.6. Ablation Experiments

To validate the effectiveness of LssDet, we designed two sets of ablation experiments on the SSDD and the LS-SSDD, each containing six sub-experiments.
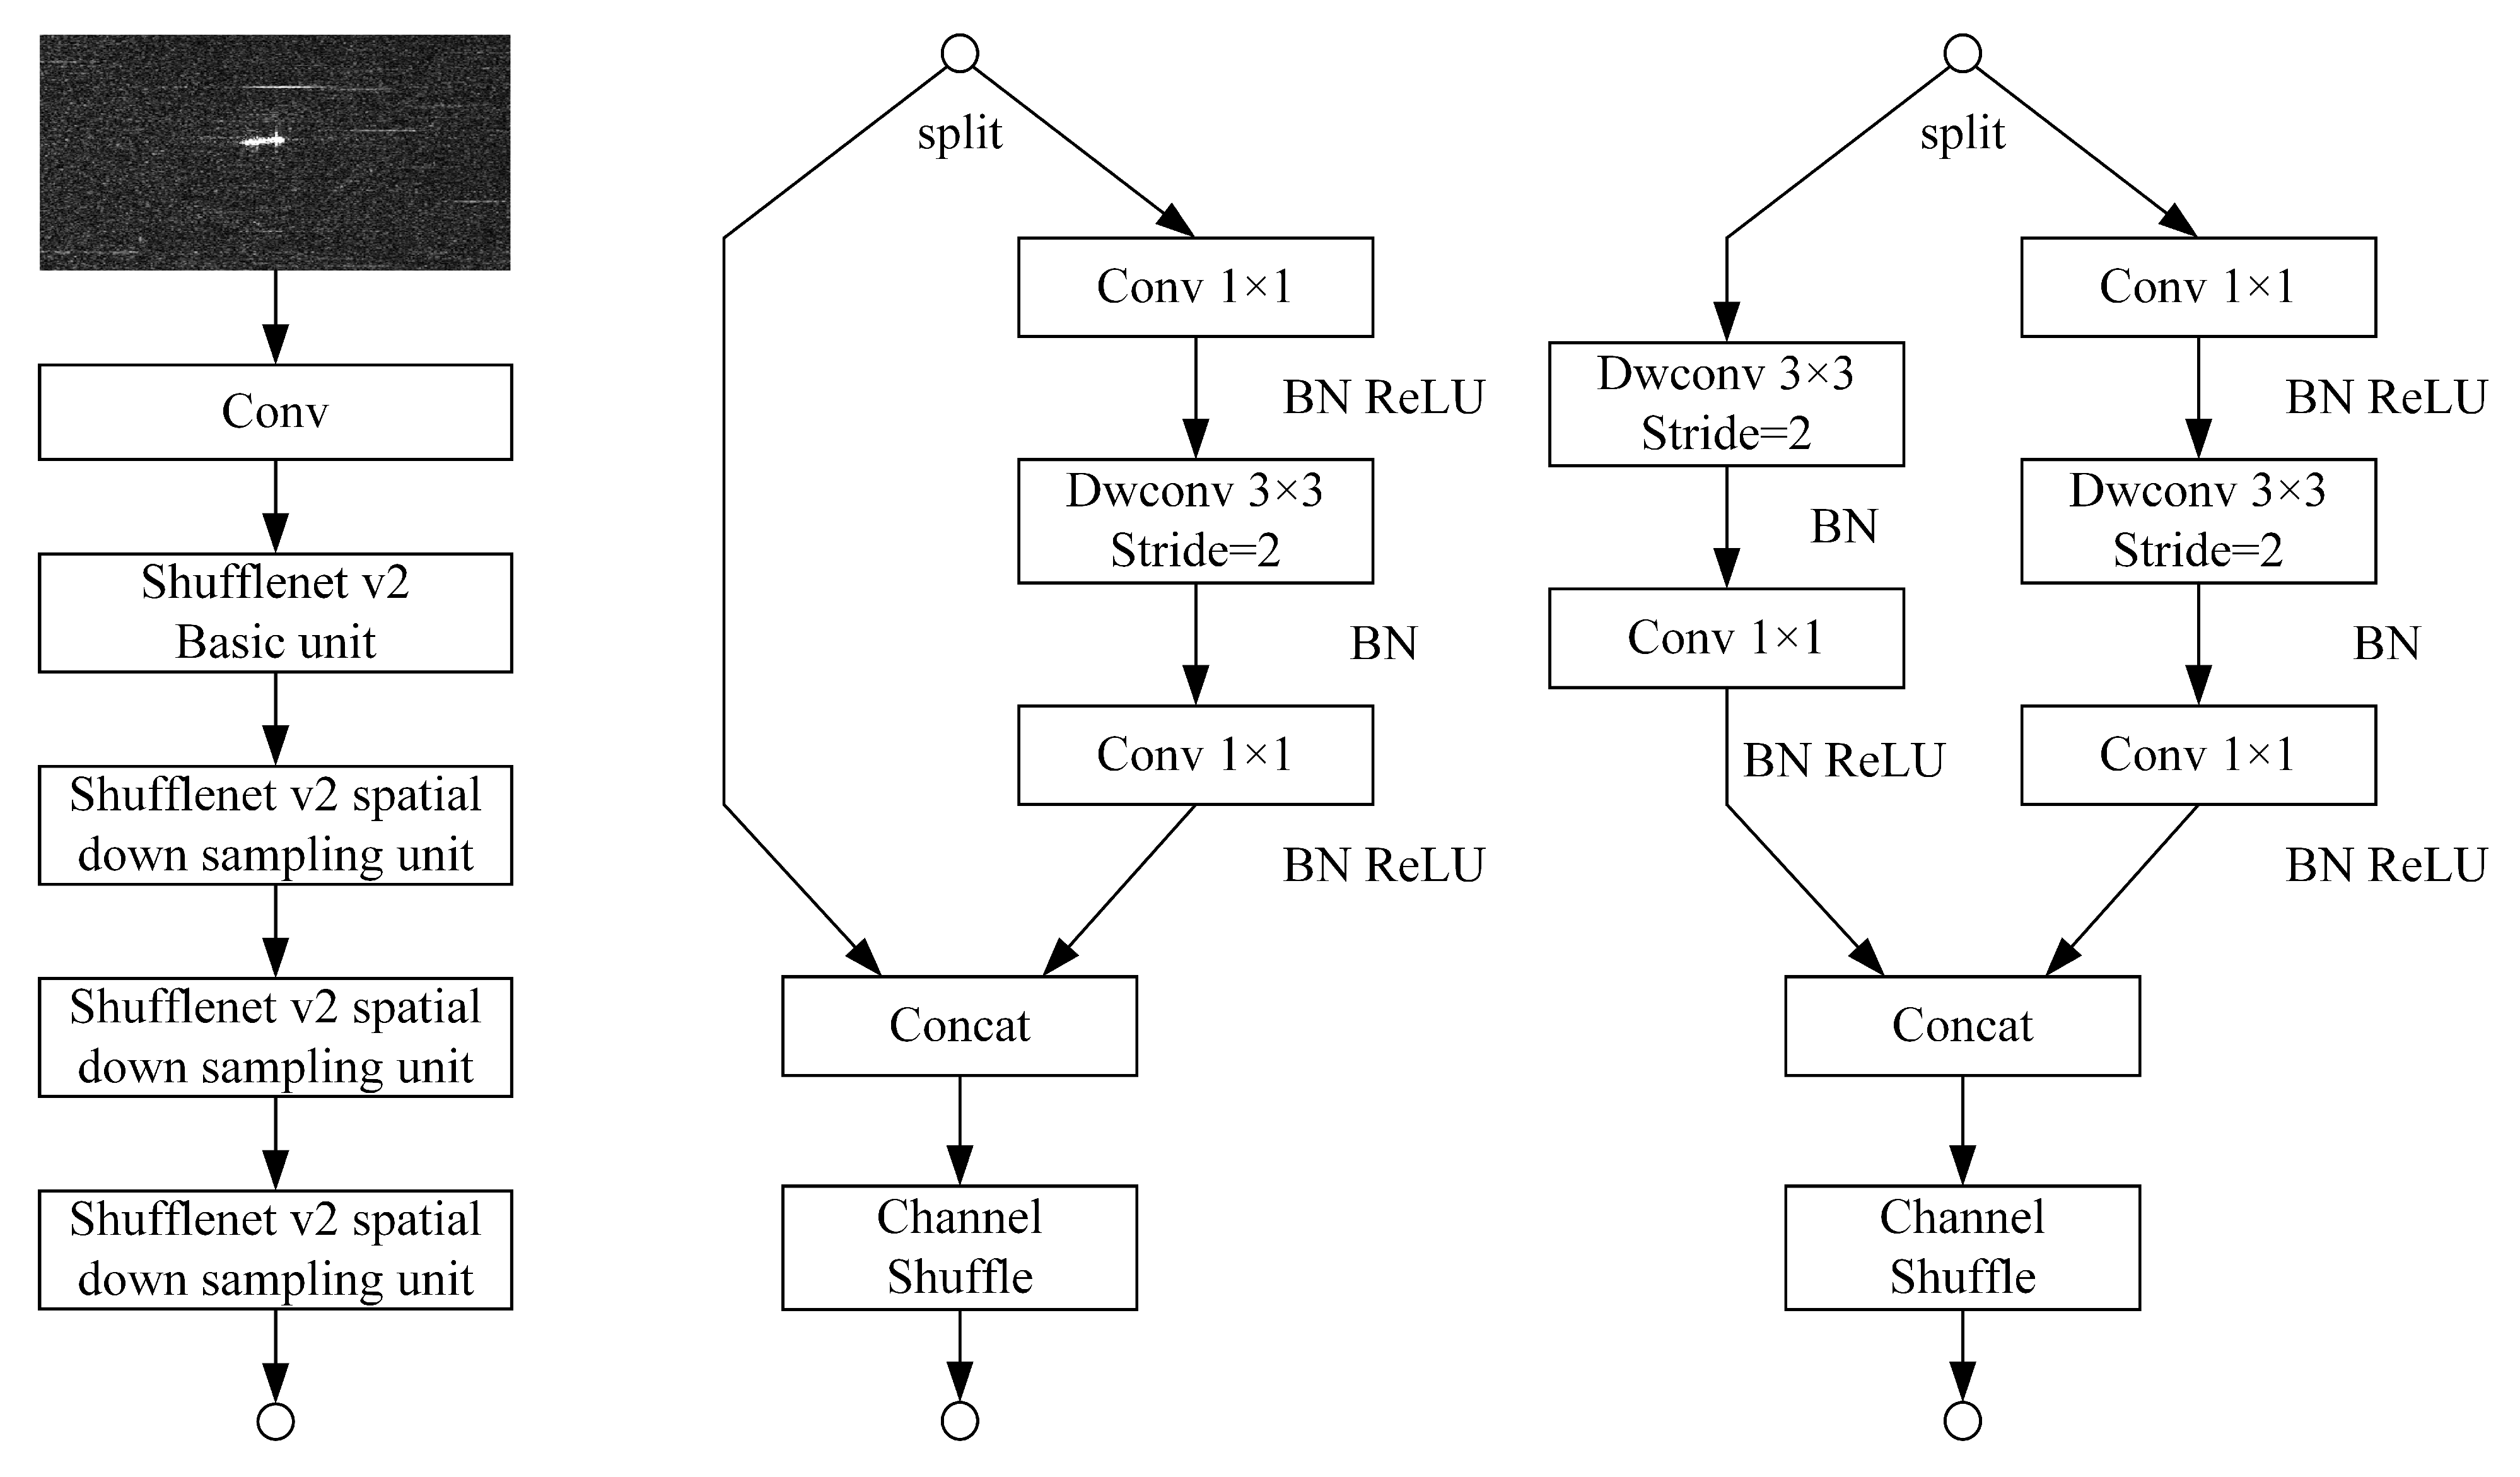
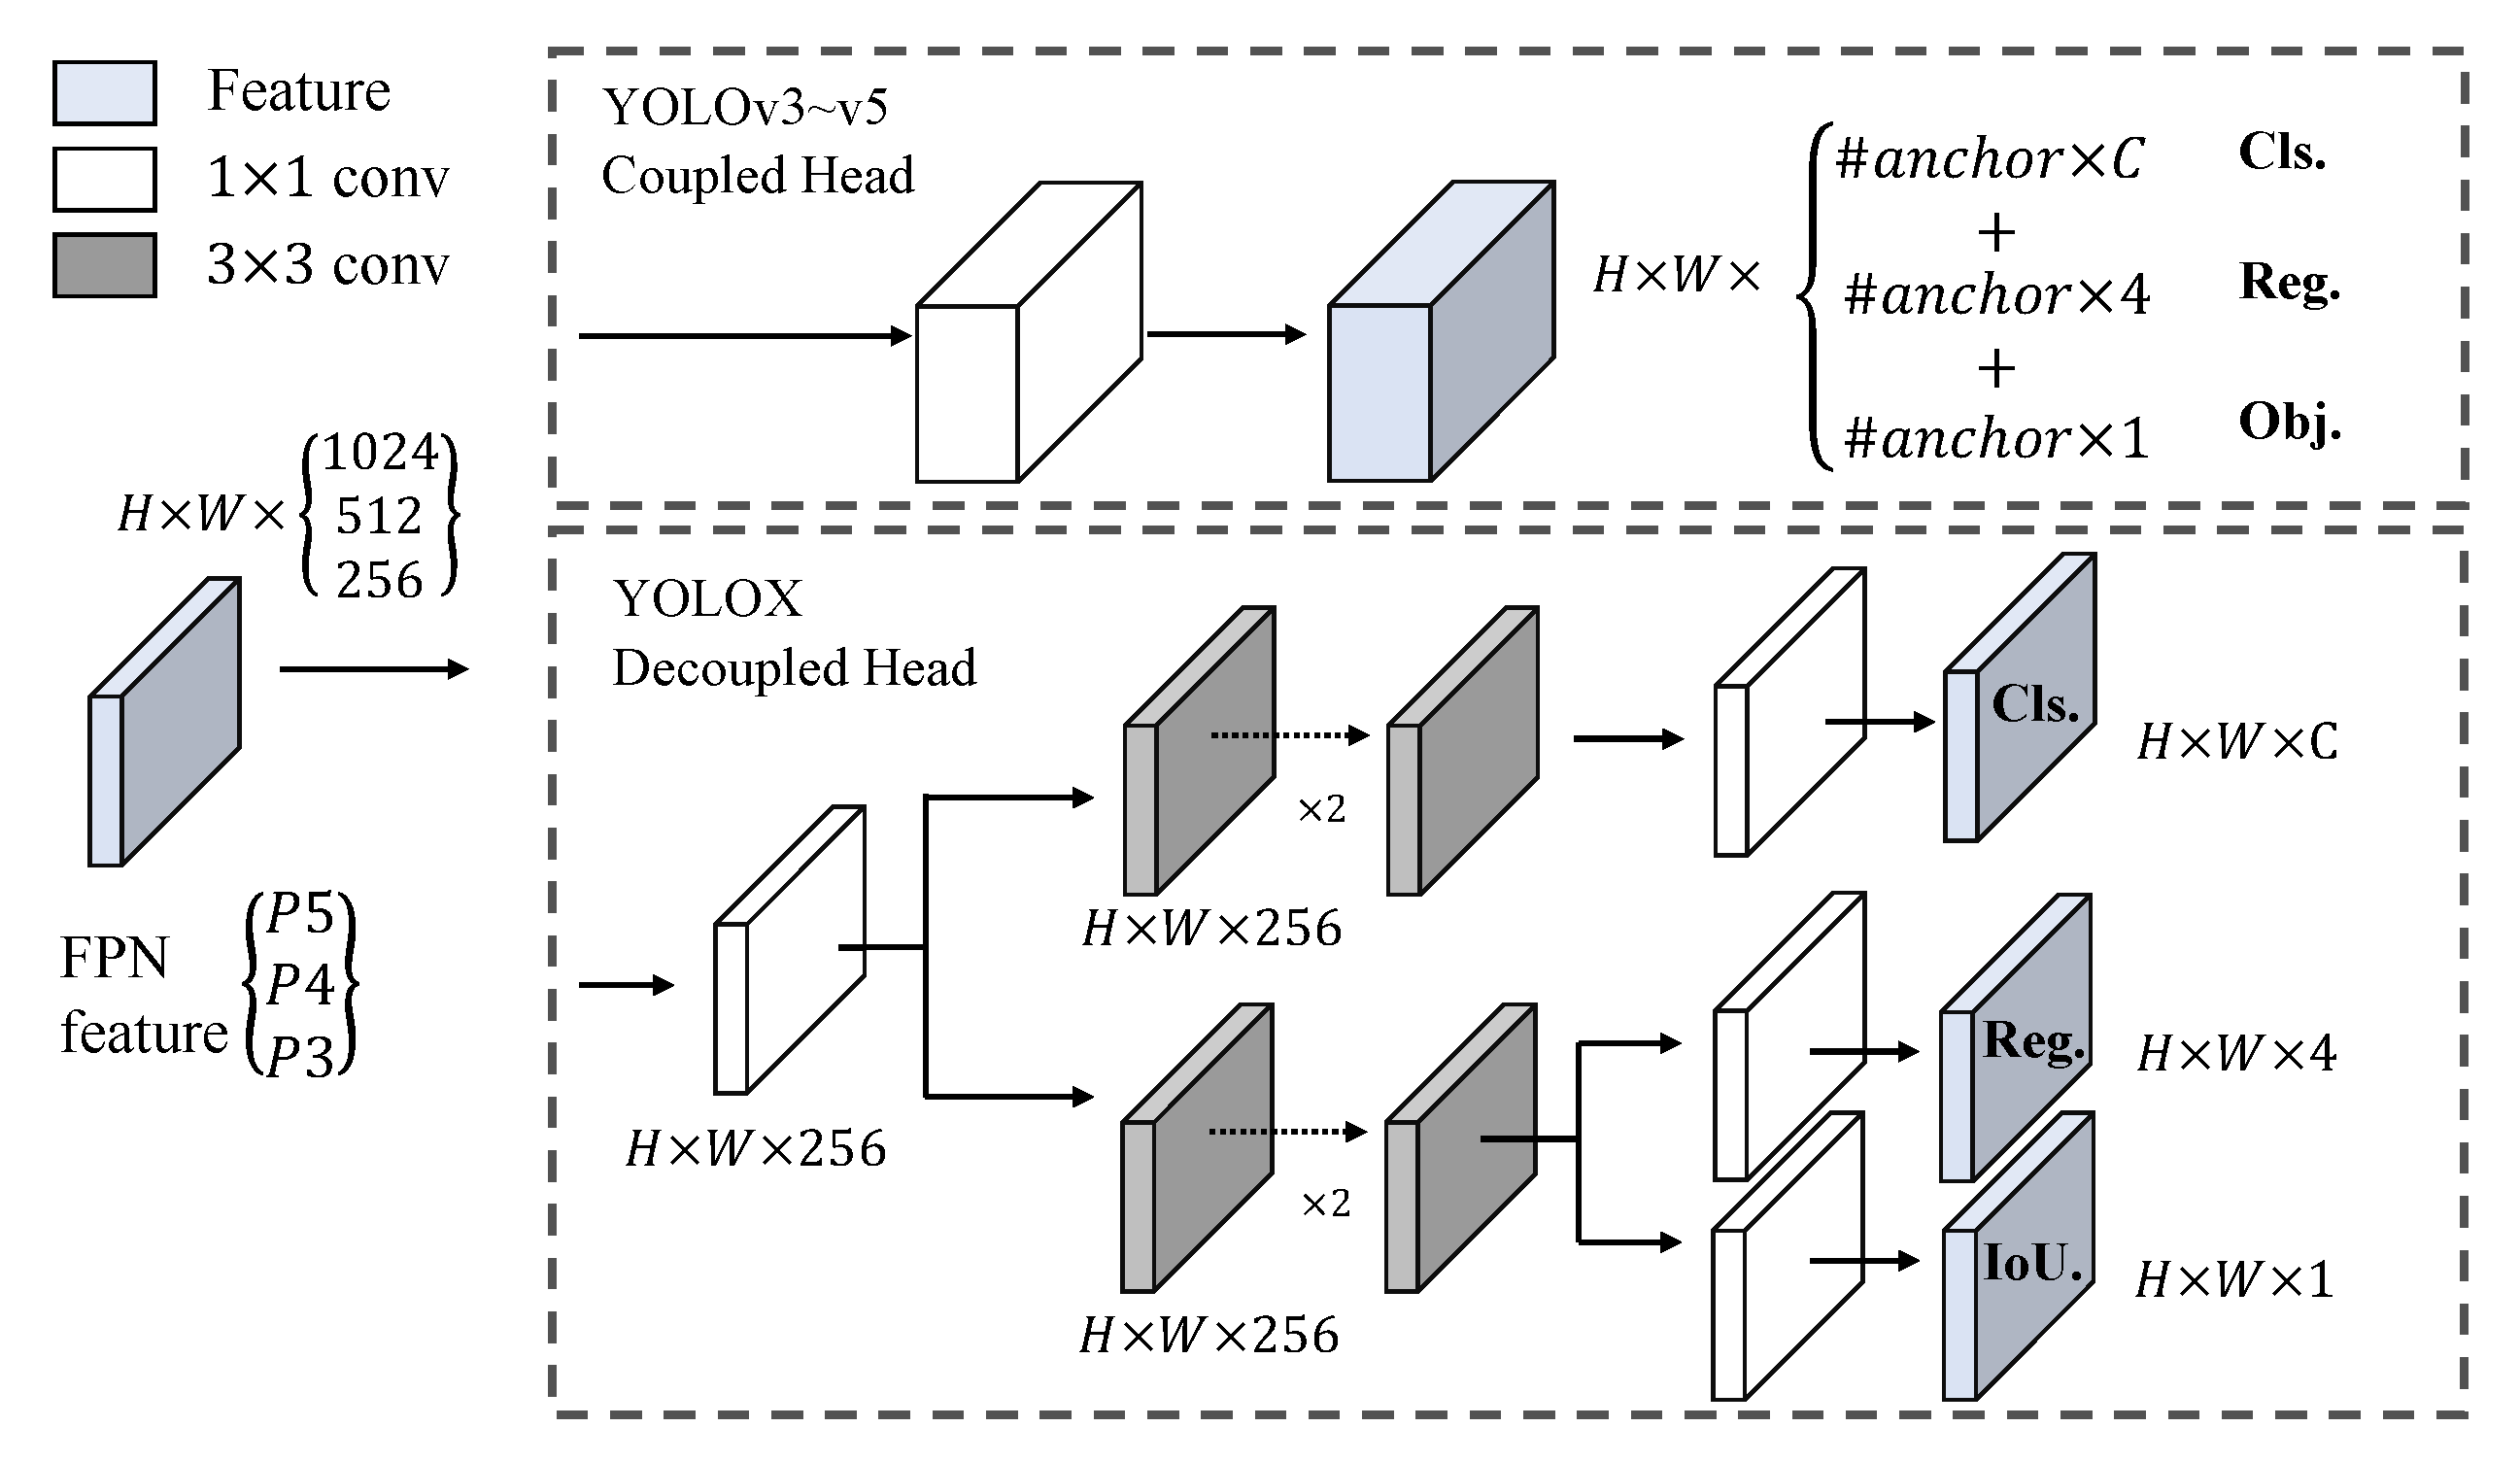
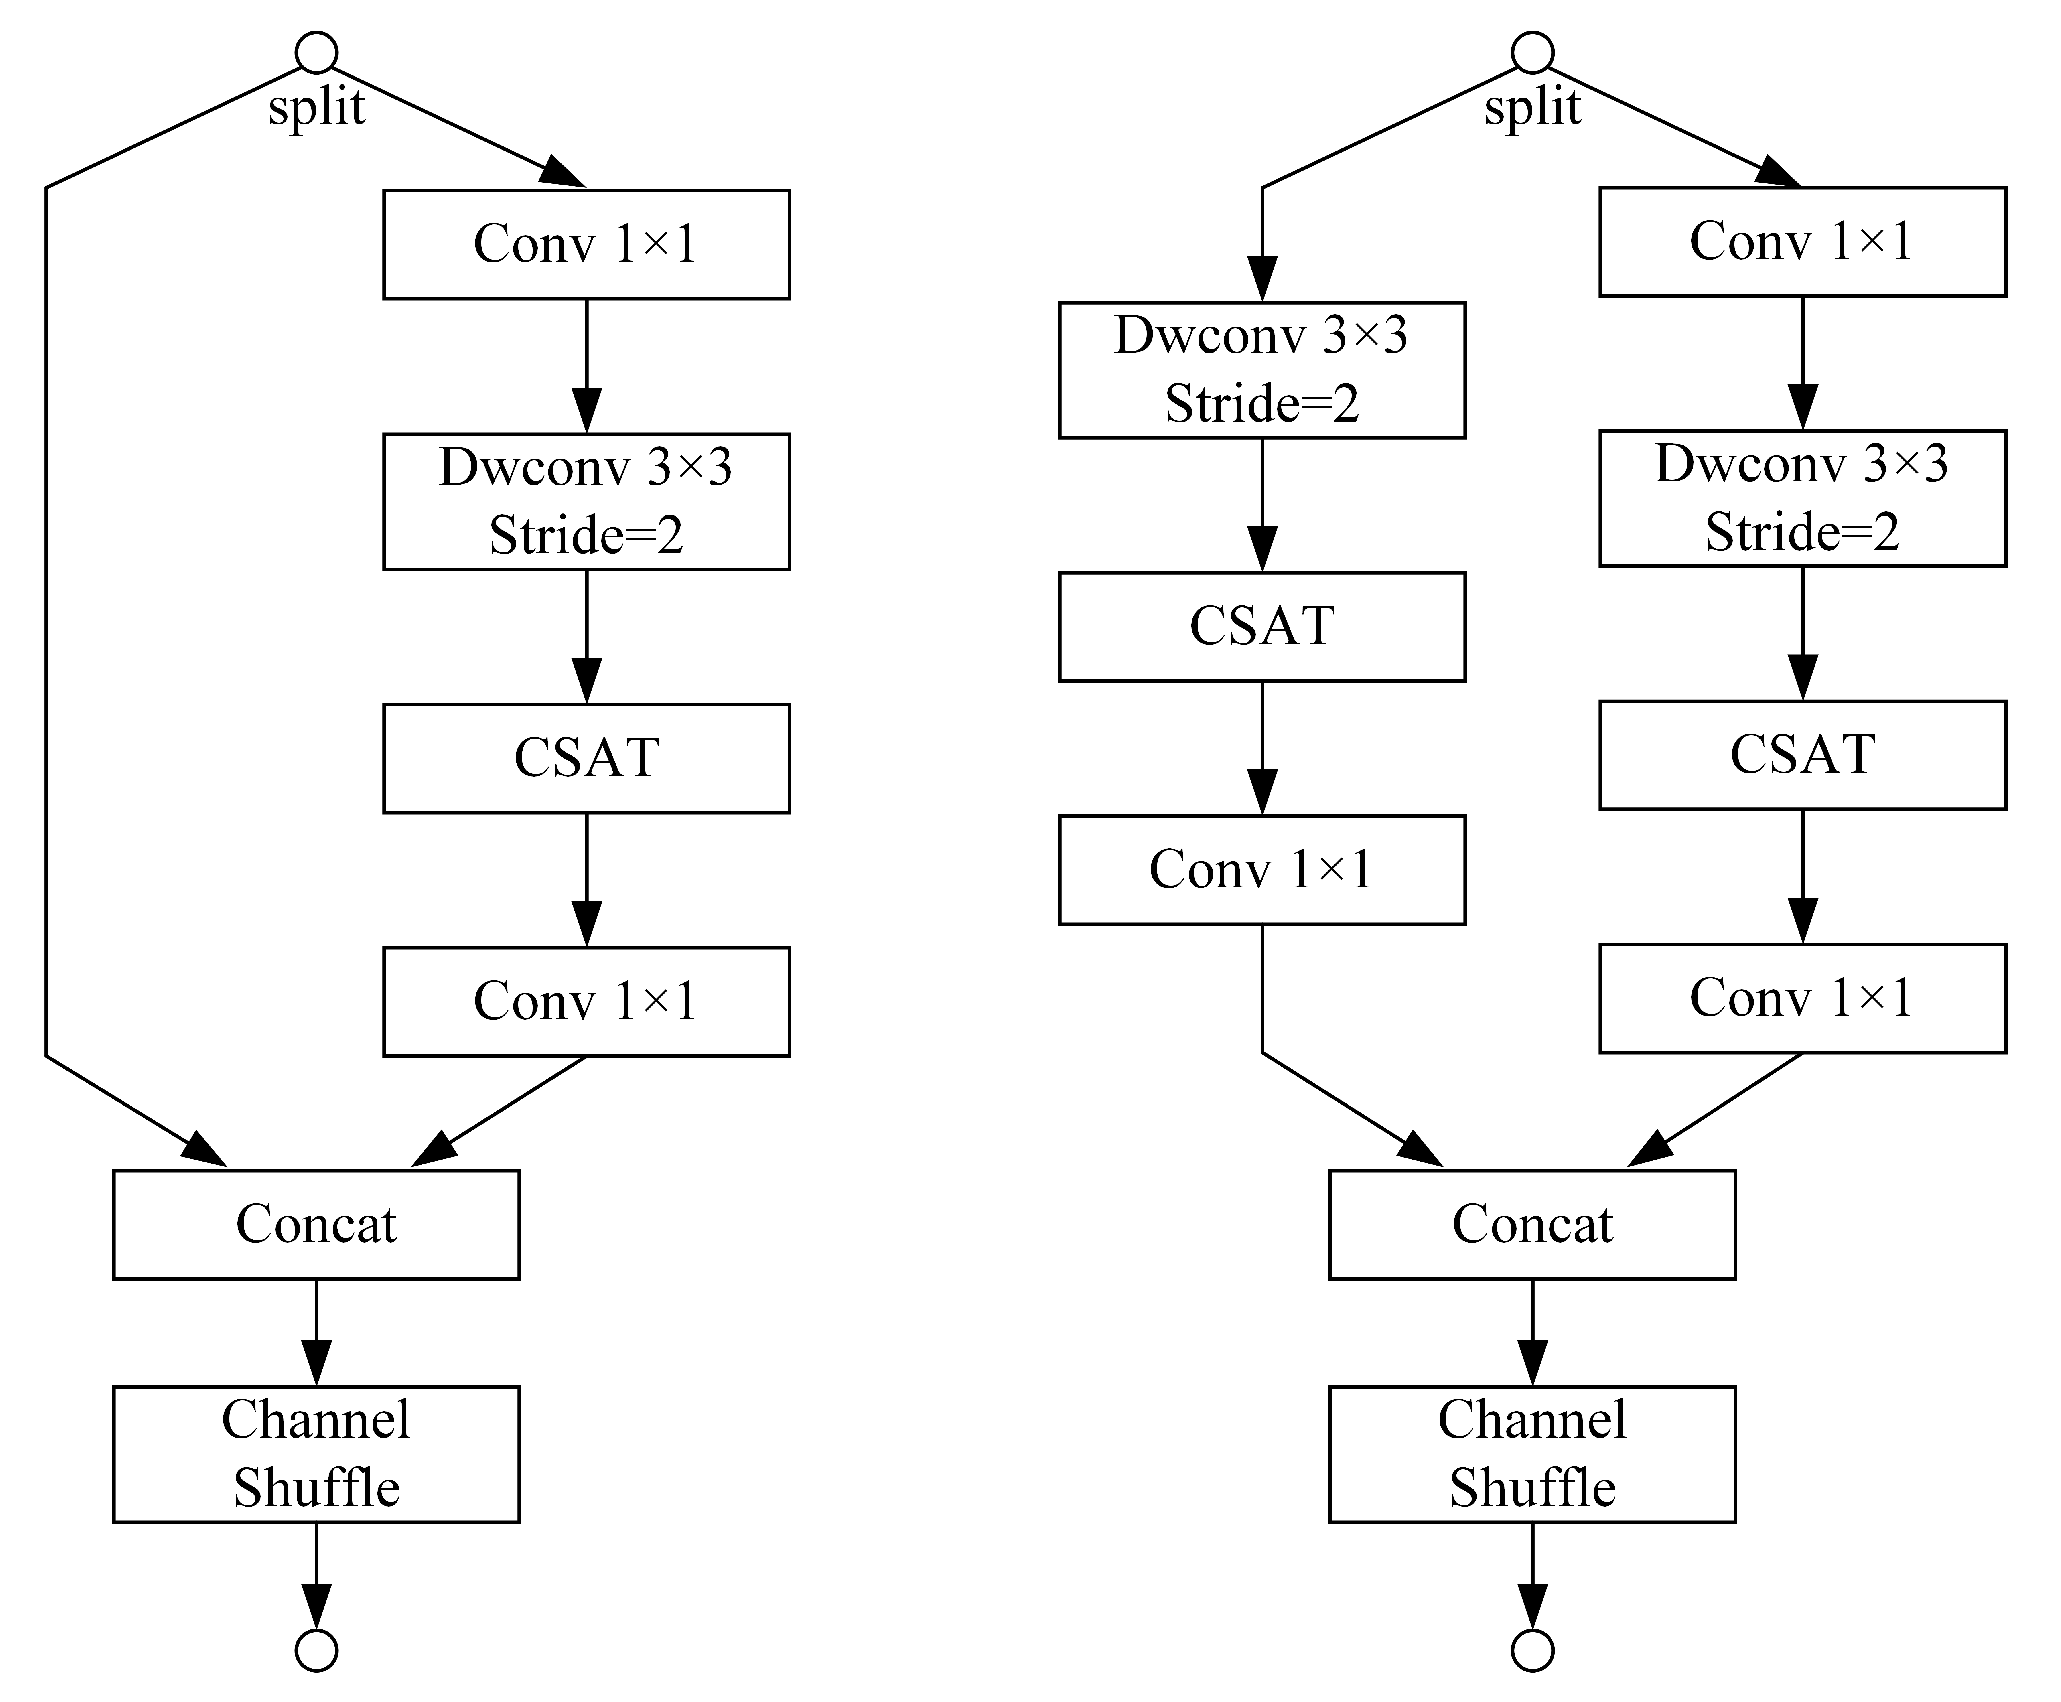
The first experiment used Shufflenet v2, YOLOX PAFPN and YOLOX Decopuled Head as the baseline networks for comparison in subsequent experiments. The second experiment used the CSAT module inserted into the Shufflenet v2 bottleneck structure primarily to verify the effectiveness of the proposed CSAT module. The third experiment used the L-PAFPN module to replace the YOLOX PAFPN module, mainly to verify the performance of the proposed lightweight feature fusion network. In the fourth experiment, we used the Focus module to replace the first layer of convolution in Shufflenet v2, mainly to verify the effect of feature extraction on the network’s performance. The fifth experiment was a superimposition of the second and third experiments, primarily to verify the effectiveness of the CSAT and L-PAFPN module superimpositions. The sixth experiment was a superposition of the second, third and fourth experiments, mainly to verify the effectiveness of the CSAT, L-PAFPN and Focus module superpositions. The six experiments were carried out step by step to validate our proposed method’s effectiveness and superiority. The datasets and parameter settings were kept constant in all experiments.
The results of the two sets of ablation experiments are shown in Table 7 and Table 8. Table 7 shows the results of the ablation experiments on the SSDD, and Table 8 shows the results of the ablation experiments on the LS-SSDD-v1.0. In Experiment 2, the CSAT module was used to assign attention weights and simulate the long-range dependence of channel and spatial information on the cross sidelobe region of the SAR ship, thereby obtaining a 1.7% A P @ [ 0.5 : 0.95 ] boost on the SSDD and a A P @ [ 0.5 : 0.95 ] boost of 0.5% on the LS-SSDD-v1.0. In Experiment 3, L-PAFPN was used to reduce the computational load and parametric counts of YOLOX PAFPN, thereby obtaining a 1.8% A P @ [ 0.5 : 0.95 ] boost on the SSDD and a A P @ [ 0.5 : 0.95 ] boost on the LS-SSDD-v1.0 by 0.3%. Meanwhile, F L O P s were reduced by 13.9% and P a r a m s was reduced by 24.9%. In Experiment 4, the Focus module was used to improve the backbone network’s feature extraction, thereby obtaining a 1.4% A P @ [ 0.5 : 0.95 ] improvement on the SSDD and a A P @ [ 0.5 : 0.95 ] improvement of 0.4% on the LS-SSDD-v1.0. In Experiment 5, the introduction of both the CSAT module and the L-PAFPN module resulted in a 2.6% A P @ [ 0.5 : 0.95 ] boost on the SSDD and a A P @ [ 0.5 : 0.95 ] boost of 0.8% on the LS-SSDD-v1.0. In Experiment 6, the CSAT module, the L-PAFPN module and the Focus module were introduced simultaneously, resulting in an A P @ [ 0.5 : 0.95 ] boost of 3.6% on the SSDD and a 1.5% A P @ [ 0.5 : 0.95 ] boost on the LS-SSDD-v1.0. Compared to the baseline, F L O P s were reduced by 7.1% and P a r a m s were reduced by 23.2%. The quantitative analysis of the performance evaluation metrics confirmed the superiority of our proposed SAR ship detection method and the effectiveness of the individual modules.

4. Discussion

Experimental results on the SSDD and the LS-SSDD-v1.0 demonstrated the superiority of the method proposed in this paper. Based on Shufflenet v2, YOLOX PAFPN and YOLOX Decopuled Head, we proposed the CSAT module and the L-PAFPN module and introduced the Focus module. The CSAT module improves the SAR ship detection performance by assigning attention weights to SAR ship cross sidelobe regions and models the long-range dependence of the channel and spatial information. The L-PAFPN module improves the SAR ship detection performance by lightening the YOLOX PAFPN module. The Focus module improves the SAR ship detection performance by enhancing the feature extraction capability of the backbone network. We demonstrated the effectiveness of each module through ablation experiments. The SSDD’s imaging results were better with fewer cross sidelobe phenomena. However, the LS-SSDD-v1.0 imaging results were poor with more cross sidelobe phenomena. Therefore, on the SSDD, the CSAT module improved performance mainly by modelling the long-range dependence of channel and spatial information. On the LS-SSDD-v1.0, the CSAT module obtained performance gains by assigning attention weights and modelling the long-range dependence of channel and spatial information. Thus, the L-PAFPN module most significantly improved performance on the SSDD, and the CSAT module most significantly improved performance on the LS-SSDD-v1.0.
However, the CSAT module is based on Shufflenet v2, and the effectiveness of applying it to other backbone networks needs further study. LssDet achieved excellent performance gains on both A P @ [ 0.5 : 0.95 ] and A P @ 0.75 , but the performance gain on A P @ 0.5 was not as good as the former. The research in this paper was mainly concerned with backbone and feature fusion networks, and other parts of the detection method, such as prediction networks, were not further investigated. As the existing datasets only include factors such as ships, ports and land, we did not find other objects with cross sidelobes identified as ships on the existing dataset. Misidentification may occur if future datasets include more samples with cross sidelobe phenomena.

5. Conclusions

In this paper, we proposed a lightweight, anchor-free detector, LssDet, for SAR ship detection tasks. We used Shufflenet v2, YOLOX PAFPN and YOLOX Decopuled Head as the baseline models. Moreover, we proposed the CSAT module and the L-PAFPN module, and introduced the Focus module, to improve the detection performance. Among them, the CSAT module was responsible for cross sidelobe region feature enhancement and modelling the long-range dependence of channel and spatial information. The L-PAFPN module is responsible for lightly modifying the feature fusion network. The Focus module is responsible for enhancing the feature extraction capability. Experimental results on the SSDD showed that LssDet achieves an A P @ [ 0.5 : 0.95 ] of 68.1%, a F L O P s of 2.60 G and a P a r a m s of 2.25 M. Experimental results on the LS-SSDD-v1.0 showed that LssDet achieved an A P @ [ 0.5 : 0.95 ] of 27.8%, a F L O P s of 4.49 G and P a r a m s of 2.25 M. LssDet had superior detection performance from both quantitative and qualitative perspectives. Comparison with other recent detection methods showed that LssDet achieved optimal detection results with minimal computational effort and minimal parameters. Further, the results of ablation experiments demonstrated the effectiveness of each module of LssDet.
In the future, we will further investigate the effectiveness of CSAT on different backbone networks, find methods for improving the performance gains of LssDet on A P @ [ 0.5 ] and investigate improvements to other structures in the detection method to achieve better detection results in SAR ship detection tasks.

Author Contributions

Conceptualization, Z.C.; Data curation, G.Y.; Funding acquisition, Z.C.; Investigation, G.Y.; Methodology, G.Y.; Project administration, G.Y.; Resources, Z.C.; Software, G.Y.; Supervision, G.Y.; Validation, G.Y.; Visualization, G.Y.; Writing-original draft, G.Y.; Writing-review editing, Z.C., Y.W., Y.C. and S.S. All authors have read and agreed to the published version of the manuscript.

Funding

This research received no external funding.

Data Availability Statement

Not applicable.

Acknowledgments

We gratefully appreciate the editor and anonymous reviewers for their efforts and constructive comments, which have greatly improved the technical quality and presentation of this study.

Conflicts of Interest

The authors declare no conflict of interest.

Appendix A

For the reader’s convenience, in Table A1 we list all of the abbreviations and corresponding full terms involved in this paper. The abbreviations are arranged in alphabetical order.
Table A1. The abbreviations and corresponding full terms.
AbbreviationFull Name
APAverage precision
Avg PoolAdaptive average pooling
BAMBottleneck attention module
CBAMConvolutional block attention module
CNNConvolutional neural network
BNBatch normalisation
CenterNetKeypoint triplets for object detection
CFARConstant false alarm rate
ConvConvolution
CSATCross sidelobe attention
CSPCross stage partial
CVComputer vision
DWconvDepthwise separable convolution
DLDeep learning
FLOPsFloating-point operations per second
FNFalse negatives
FCOSFully convolutional one-stage object detection
FPFalse positives
FPNFeature pyramid network
LssDetLightweight SAR ship detector
L-PAFPNLightweight path aggregation feature pyramid network
LS-SSDD-v1.0Large-scale SAR ship detection dataset-v1.0
PPrecision
PAFPNPath aggregation feature pyramid network
ParamsParaments
RRecall
R-CNNRegion-based convolutional neural networks
SARSynthetic aperture radar
SESqueeze-and-excitation networks
SGDStochastic gradient descent
TNTrue negatives
TPTrue positives
YOLOYou only look once

References

  1. Yates, G.; Horne, A.; Blake, A.; Middleton, R. Bistatic SAR image formation. IEE Proc.-Radar Sonar Navig. 2006, 153, 208–213. [Google Scholar] [CrossRef] [Green Version]
  2. Xu, J.; Peng, Y.N.; Xia, X.G.; Farina, A. Focus-before-detection radar signal processing: Part I—Challenges and methods. IEEE Aerosp. Electron. Syst. Mag. 2017, 32, 48–59. [Google Scholar] [CrossRef]
  3. Wei, X.; Zheng, W.; Xi, C.; Shang, S. Shoreline extraction in SAR image based on advanced geometric active contour model. Remote Sens. 2021, 13, 642. [Google Scholar] [CrossRef]
  4. Kang, M.; Ji, K.; Leng, X.; Lin, Z. Contextual region-based convolutional neural network with multilayer fusion for SAR ship detection. Remote Sens. 2017, 9, 860. [Google Scholar] [CrossRef] [Green Version]
  5. Tsai, Y.L.S.; Dietz, A.; Oppelt, N.; Kuenzer, C. Remote sensing of snow cover using spaceborne SAR: A review. Remote Sens. 2019, 11, 1456. [Google Scholar] [CrossRef] [Green Version]
  6. Teruiya, R.; Paradella, W.; Dos Santos, A.; Dall’Agnol, R.; Veneziani, P. Integrating airborne SAR, Landsat TM and airborne geophysics data for improving geological mapping in the Amazon region: The Cigano Granite, Carajás Province, Brazil. Int. J. Remote Sens. 2008, 29, 3957–3974. [Google Scholar] [CrossRef]
  7. Cerutti-Maori, D.; Klare, J.; Brenner, A.R.; Ender, J.H. Wide-area traffic monitoring with the SAR/GMTI system PAMIR. IEEE Trans. Geosci. Remote Sens. 2008, 46, 3019–3030. [Google Scholar] [CrossRef]
  8. Zhang, T.; Zhang, X.; Shi, J.; Wei, S. Depthwise separable convolution neural network for high-speed SAR ship detection. Remote Sens. 2019, 11, 2483. [Google Scholar] [CrossRef] [Green Version]
  9. Zhang, T.; Zhang, X.; Ke, X. Quad-FPN: A novel quad feature pyramid network for SAR ship detection. Remote Sens. 2021, 13, 2771. [Google Scholar] [CrossRef]
  10. Gong, M.; Yang, H.; Zhang, P. Feature learning and change feature classification based on deep learning for ternary change detection in SAR images. ISPRS J. Photogramm. Remote Sens. 2017, 129, 212–225. [Google Scholar] [CrossRef]
  11. Novak, L.M.; Burl, M.C.; Irving, W. Optimal polarimetric processing for enhanced target detection. IEEE Trans. Aerosp. Electron. Syst. 1993, 29, 234–244. [Google Scholar] [CrossRef]
  12. Gao, G. A parzen-window-kernel-based CFAR algorithm for ship detection in SAR images. IEEE Geosci. Remote Sens. Lett. 2010, 8, 557–561. [Google Scholar] [CrossRef]
  13. Sugimoto, M.; Ouchi, K.; Nakamura, Y. On the novel use of model-based decomposition in SAR polarimetry for target detection on the sea. Remote Sens. Lett. 2013, 4, 843–852. [Google Scholar] [CrossRef]
  14. Lang, H.; Zhang, J.; Zhang, T.; Zhao, D.; Meng, J. Hierarchical ship detection and recognition with high-resolution polarimetric synthetic aperture radar imagery. J. Appl. Remote Sens. 2014, 8, 083623. [Google Scholar] [CrossRef]
  15. Leng, X.; Ji, K.; Yang, K.; Zou, H. A bilateral CFAR algorithm for ship detection in SAR images. IEEE Geosci. Remote Sens. Lett. 2015, 12, 1536–1540. [Google Scholar] [CrossRef]
  16. Dai, H.; Du, L.; Wang, Y.; Wang, Z. A modified CFAR algorithm based on object proposals for ship target detection in SAR images. IEEE Geosci. Remote Sens. Lett. 2016, 13, 1925–1929. [Google Scholar] [CrossRef]
  17. Kang, M.; Leng, X.; Lin, Z.; Ji, K. A modified faster R-CNN based on CFAR algorithm for SAR ship detection. In Proceedings of the 2017 IEEE International Workshop on Remote Sensing with Intelligent Processing (RSIP), Shanghai, China, 18–21 May 2017; pp. 1–4. [Google Scholar]
  18. Chang, Y.L.; Anagaw, A.; Chang, L.; Wang, Y.C.; Hsiao, C.Y.; Lee, W.H. Ship detection based on YOLOv2 for SAR imagery. Remote Sens. 2019, 11, 786. [Google Scholar] [CrossRef] [Green Version]
  19. Gao, S.; Liu, J.; Miao, Y.; He, Z. A High-Effective Implementation of Ship Detector for SAR Images. IEEE Geosci. Remote Sens. Lett. 2021, 19, 1–5. [Google Scholar] [CrossRef]
  20. Zhu, M.; Hu, G.; Zhou, H.; Wang, S.; Feng, Z.; Yue, S. A Ship Detection Method via Redesigned FCOS in Large-Scale SAR Images. Remote Sens. 2022, 14, 1153. [Google Scholar] [CrossRef]
  21. Tang, G.; Zhuge, Y.; Claramunt, C.; Men, S. N-Yolo: A SAR ship detection using noise-classifying and complete-target extraction. Remote Sens. 2021, 13, 871. [Google Scholar] [CrossRef]
  22. Cui, Z.; Wang, X.; Liu, N.; Cao, Z.; Yang, J. Ship detection in large-scale SAR images via spatial shuffle-group enhance attention. IEEE Trans. Geosci. Remote Sens. 2020, 59, 379–391. [Google Scholar] [CrossRef]
  23. Yu, J.; Zhou, G.; Zhou, S.; Qin, M. A fast and lightweight detection network for multi-scale SAR ship detection under complex backgrounds. Remote Sens. 2021, 14, 31. [Google Scholar] [CrossRef]
  24. Zhou, K.; Zhang, M.; Wang, H.; Tan, J. Ship Detection in SAR Images Based on Multi-Scale Feature Extraction and Adaptive Feature Fusion. Remote Sens. 2022, 14, 755. [Google Scholar] [CrossRef]
  25. Liu, S.; Kong, W.; Chen, X.; Xu, M.; Yasir, M.; Zhao, L.; Li, J. Multi-scale ship detection algorithm based on a lightweight neural network for spaceborne SAR images. Remote Sens. 2022, 14, 1149. [Google Scholar] [CrossRef]
  26. Ma, N.; Zhang, X.; Zheng, H.T.; Sun, J. Shufflenet v2: Practical guidelines for efficient cnn architecture design. In Proceedings of the European Conference on Computer Vision (ECCV), Munich, Germany, 8–14 September 2018; pp. 116–131. [Google Scholar]
  27. Chollet, F. Xception: Deep learning with depthwise separable convolutions. In Proceedings of the IEEE Conference on Computer Vision and Pattern Recognition, Honolulu, HI, USA, 21–26 July 2017; pp. 1251–1258. [Google Scholar]
  28. Ge, Z.; Liu, S.; Wang, F.; Li, Z.; Sun, J. Yolox: Exceeding yolo series in 2021. arXiv 2021, arXiv:2107.08430. [Google Scholar]
  29. Lin, T.Y.; Dollár, P.; Girshick, R.; He, K.; Hariharan, B.; Belongie, S. Feature pyramid networks for object detection. In Proceedings of the IEEE Conference on Computer Vision and Pattern Recognition, Honolulu, HI, USA, 21–26 July 2017; pp. 2117–2125. [Google Scholar]
  30. Liu, S.; Qi, L.; Qin, H.; Shi, J.; Jia, J. Path aggregation network for instance segmentation. In Proceedings of the IEEE Conference on Computer Vision and Pattern Recognition, Salt Lake City, UT, USA, 18–23 June 2018; pp. 8759–8768. [Google Scholar]
  31. Wang, C.Y.; Liao, H.Y.M.; Wu, Y.H.; Chen, P.Y.; Hsieh, J.W.; Yeh, I.H. CSPNet: A new backbone that can enhance learning capability of CNN. In Proceedings of the IEEE/CVF Conference on Computer Vision and Pattern Recognition Workshops, Seattle, WA, USA, 14–19 June 2020; pp. 390–391. [Google Scholar]
  32. Redmon, J.; Farhadi, A. Yolov3: An incremental improvement. arXiv 2018, arXiv:1804.02767. [Google Scholar]
  33. Bochkovskiy, A.; Wang, C.Y.; Liao, H.Y.M. Yolov4: Optimal speed and accuracy of object detection. arXiv 2020, arXiv:2004.10934. [Google Scholar]
  34. Ultralytics. Yolov5. 2021. Available online: https://github.com/ultralytics/yolov5 (accessed on 11 April 2021).
  35. Song, G.; Liu, Y.; Wang, X. Revisiting the sibling head in object detector. In Proceedings of the IEEE/CVF Conference on Computer Vision and Pattern Recognition, Seattle, WA, USA, 14–19 June 2020; pp. 11563–11572. [Google Scholar]
  36. Wu, Y.; Chen, Y.; Yuan, L.; Liu, Z.; Wang, L.; Li, H.; Fu, Y. Rethinking classification and localization for object detection. In Proceedings of the IEEE/CVF Conference on Computer Vision and Pattern Recognition, Seattle, WA, USA, 14–19 June 2020; pp. 10186–10195. [Google Scholar]
  37. Zhang, T.; Zhang, X.; Ke, X.; Zhan, X.; Shi, J.; Wei, S.; Pan, D.; Li, J.; Su, H.; Zhou, Y.; et al. LS-SSDD-v1. 0: A deep learning dataset dedicated to small ship detection from large-scale Sentinel-1 SAR images. Remote Sens. 2020, 12, 2997. [Google Scholar]
  38. Xu, K.; Ba, J.; Kiros, R.; Cho, K.; Courville, A.; Salakhudinov, R.; Zemel, R.; Bengio, Y. Show, attend and tell: Neural image caption generation with visual attention. In Proceedings of the 32nd International Conference on Machine Learning (PMLR), Lille, France, 7–9 July 2015; pp. 2048–2057. [Google Scholar]
  39. Hu, J.; Shen, L.; Sun, G. Squeeze-and-excitation networks. In Proceedings of the IEEE Conference on Computer Vision and Pattern Recognition, Salt Lake City, UT, USA, 18–23 June 2018; pp. 7132–7141. [Google Scholar]
  40. Park, J.; Woo, S.; Lee, J.Y.; Kweon, I.S. Bam: Bottleneck attention module. arXiv 2018, arXiv:1807.06514. [Google Scholar]
  41. Woo, S.; Park, J.; Lee, J.Y.; Kweon, I.S. Cbam: Convolutional block attention module. In Proceedings of the European Conference on Computer Vision (ECCV), Munich, Germany, 8–14 September 2018; pp. 3–19. [Google Scholar]
  42. Hou, Q.; Zhang, L.; Cheng, M.M.; Feng, J. Strip pooling: Rethinking spatial pooling for scene parsing. In Proceedings of the IEEE/CVF Conference on Computer Vision and Pattern Recognition, Seattle, WA, USA, 14–19 June 2020; pp. 4003–4012. [Google Scholar]
  43. Han, K.; Wang, Y.; Tian, Q.; Guo, J.; Xu, C.; Xu, C. Ghostnet: More features from cheap operations. In Proceedings of the IEEE/CVF Conference on Computer Vision and Pattern Recognition, Seattle, WA, USA, 14–19 June 2020; pp. 1580–1589. [Google Scholar]
  44. Zhang, T.; Zhang, X.; Li, J.; Xu, X.; Wang, B.; Zhan, X.; Xu, Y.; Ke, X.; Zeng, T.; Su, H.; et al. Sar ship detection dataset (ssdd): Official release and comprehensive data analysis. Remote Sens. 2021, 13, 3690. [Google Scholar] [CrossRef]
  45. Chen, K.; Wang, J.; Pang, J.; Cao, Y.; Xiong, Y.; Li, X.; Sun, S.; Feng, W.; Liu, Z.; Xu, J.; et al. MMDetection: Open mmlab detection toolbox and benchmark. arXiv 2019, arXiv:1906.07155. [Google Scholar]
  46. Lin, T.Y.; Maire, M.; Belongie, S.; Hays, J.; Perona, P.; Ramanan, D.; Dollár, P.; Zitnick, C.L. Microsoft coco: Common objects in context. In Proceedings of the European Conference on Computer Vision, Zurich, Switzerland, 6–12 September 2014; Springer: Cham, Switzerland, 2014; pp. 740–755. [Google Scholar]
  47. Zhang, S.; Chi, C.; Yao, Y.; Lei, Z.; Li, S.Z. Bridging the gap between anchor-based and anchor-free detection via adaptive training sample selection. In Proceedings of the IEEE/CVF Conference on Computer Vision and Pattern Recognition, Seattle, WA, USA, 14–19 June 2020; pp. 9759–9768. [Google Scholar]
  48. Zhu, B.; Wang, J.; Jiang, Z.; Zong, F.; Liu, S.; Li, Z.; Sun, J. Autoassign: Differentiable label assignment for dense object detection. arXiv 2020, arXiv:2007.03496. [Google Scholar]
  49. Tian, Z.; Shen, C.; Chen, H.; He, T. Fcos: Fully convolutional one-stage object detection. In Proceedings of the IEEE/CVF International Conference on Computer Vision, Seoul, Korea, 27 October–2 November 2019; pp. 9627–9636. [Google Scholar]
Figure 1. The structure of Shufflenet v2.
Remotesensing 14 05148 g001
Figure 2. The structure of YOLOX PAFPN.
Remotesensing 14 05148 g002
Figure 3. The structure of YOLOX Decopuled Head.
Remotesensing 14 05148 g003
Figure 4. Visualisation of cross sidelobes in the LS-SSDD-v1.0.
Remotesensing 14 05148 g004
Figure 5. The structure of the CSAT module.
Remotesensing 14 05148 g005
Figure 6. The structure of the CSAT insertion mode.
Remotesensing 14 05148 g006
Figure 7. The structure of the L-PAFPN components.
Remotesensing 14 05148 g007
Figure 8. The structure of the L-PAFPN module.
Remotesensing 14 05148 g008
Figure 9. Visualisation of LssDet detection results on the SSDD and the LS-SSDD-v1.0.
Remotesensing 14 05148 g009
Table 1. Experimental environment.
ConfigurationParameter
CPUIntel(R) Xeon(R) Gold 6140 CPU @ 2.30 GHz
GPUTesla P100-PCIE-16GB GPU
Operating systemUbuntu 18.04
Development toolsPyTorch 1.8, python3.7, CUDA11.1, CuDNN 8.0.5
Table 2. Details of the SSDD.
ParameterResult
SatelliteRadarSat-2, TerraSAR-X, Sentinel-1
Sensor mode
LocationYantai, Visakhapatnam
Resolution (m)1–15
PolarizationHH, HV, VV, VH
Image size (pixel)500 × 500
Cover width (km) 10
Image number1160
Table 3. Details of the LS-SSDD-v1.0.
ParameterResult
SatelliteSentinel-1
Sensor modeIW
LocationTokyo, Adriatic Sea, etc.
Resolution (m)5-20
PolarizationVV, VH
Image size (pixel)24,000×16,000
Cover width (km) 250
Image number15
Table 4. Confusion matrix.
Actual PositiveActual Negative
Predicted PositiveTPFP
Predicted NegativeFNTN
Table 5. Comparison of the performances of different methods on the SSDD.
MethodBackboneAP@[0.5:0.95]AP@0.5AP@0.75ApsApmAplFLOPsParams
ATSSResNet5064.594.076.665.065.835.372.7431.89
AutoAssignResNet5063.793.677.364.463.244.771.4535.97
FCOSResNet5062.493.673.362.465.252.871.0331.84
YOLO V3MobileNet v261.294.174.063.155.734.25.933.67
YOLOX-sCSP Darknet5367.396.481.768.565.033.36.975.92
YOLOX-tinyCSP Darknet5362.993.676.665.455.24.84.003.34
OurModelOurNet68.196.782.169.765.338.02.602.25
Table 6. Comparison of the performances of different methods on the LS-SSDD-v1.0.
MethodBackboneAP@[0.5:0.95]AP@0.5AP@0.75ApsApmFLOPsParams
ATSSResNet5024.366.58.923.335.2125.9531.89
AutoAssignResNet5020.160.15.919.031.6123.735.97
FCOSResNet5023.566.07.822.435.0122.9831.84
YOLO V3MobileNet v222.264.57.621.233.410.273.67
YOLOX-sCSP Darknet5327.776.210.526.538.412.065.92
YOLOX-tinyCSP Darknet5326.874.39.425.836.96.923.34
Our ModelOur Net27.874.811.226.937.74.492.25
Table 7. Ablation experiment on the SSDD.
CSATL-PAFPNFocusAP@[0.5:0.95]AP@0.5AP@0.75FlopsParams
FFF64.594.978.12.802.93
TFF66.296.681.32.802.98
FTF66.396.081.72.412.20
FFT65.996.081.72.982.94
TTF67.196.182.42.422.25
TTT68.196.782.12.602.25
Table 8. Ablation experiment on the LS-SSDD-v1.0.
CSATL-PAFPNFocusAP@[0.5:0.95]AP@0.5AP@0.75FlopsParams
FFF26.372.89.64.852.93
TFF26.873.89.34.852.98
FTF26.673.910.34.182.20
FFT26.773.410.05.162.94
TTF27.174.310.44.182.25
TTT27.874.811.24.492.25
Publisher’s Note: MDPI stays neutral with regard to jurisdictional claims in published maps and institutional affiliations.

