Article

Drought Resistance of Vegetation and Its Change Characteristics before and after the Implementation of the Grain for Green Program on the Loess Plateau, China

1
MOE Key Laboratory of Western China’s Environmental Systems, College of Earth and Environmental Sciences, Lanzhou University, Lanzhou 730000, China
2
International Science & Technology Cooperation Base for Geohazards Monitoring, Warning & Prevention, Lanzhou 730000, China
3
Shandong Provincial Key Laboratory of Water and Soil Conservation and Environmental Protection, College of Resources and Environment, Linyi University, Linyi 276000, China
*
Author to whom correspondence should be addressed.
Remote Sens. 2022, 14(20), 5142; https://doi.org/10.3390/rs14205142
Submission received: 8 September 2022 / Revised: 8 October 2022 / Accepted: 12 October 2022 / Published: 14 October 2022
(This article belongs to the Section Remote Sensing in Agriculture and Vegetation)

Abstract

:
Drought affects the growth and productivity of vegetation, and the analysis of drought resistance of vegetation can help ecological and environmental protection and sustainable development in drought-prone areas. The Loess Plateau (LP) is a drought-prone area in China with an extremely fragile ecological environment. This study analyzed the drought resistance of vegetation across different climate regions and vegetation biotypes, explored the characteristics of changes in vegetation drought resistance before and after the implementation of the Grain for Green Program (GGP), and evaluated the relative contribution of climatic factors and human activities to the change in drought resistance of vegetation. The following conclusions are obtained. (1) The drought resistance of vegetation on the LP basically showed a spatial pattern of increasing from northwest to southeast with the degree of aridity. The vegetation in the semi-humid and arid regions showed the strongest and weakest drought resistance, respectively. (2) The drought resistance of vegetation on the LP mainly showed an increasing trend since the GGP was implemented, but there were differences in different climatic zones. In semi-humid regions, the drought resistance of vegetation mainly showed a weakening trend, while in arid and semi-arid regions, it mainly showed an increasing trend. There were differences between vegetation biotypes as well; the drought resistance of forest and grassland showed a different trend in different climatic zones, while that of crops in all climatic zones showed an increasing trend. In the area with cropland returned, the drought resistance tended to increase where crops turned to forests, but the area where crops turned to grassland showed a weakening trend. (3) The positive contribution of climate change and human activities leads to the enhancement of drought resistance of vegetation in most areas of the LP, and the weakening of drought resistance of vegetation in semi-humid regions is dominated by the negative contribution of climate change. The negative contribution of human activities is the main reason for the decrease in drought resistance of vegetation in the area of returning cropland to grassland. This study can provide a reference for ecological protection and high-quality development of the LP.

Graphical Abstract

1. Introduction

Vegetation is an important part of ecosystems and serves as a “link” between natural elements such as soil, atmosphere, and water. It provides an important ecosystem of goods and basic services to human society and the biosphere [1]. Drought can cause water deficit, water stress on vegetation growth, and induce changes in the physiological and ecological characteristics and structural functions of vegetation, while prolonged and sustained drought can lead to vegetation death and even ecosystem degradation and ecological crisis [2,3,4]. It has been shown that with the warming climate, the frequency and intensity of droughts in most regions of the world are significantly increasing, the area of the land affected by extreme drought is expanding, and drought is expected to become more severe and widespread in the 21st century [5,6]. How vegetation adapts to increasing drought has become a focal issue in global change research [7,8].
The LP is a drought-prone area in China [9]. During the past five decades, the frequency, severity, and duration of droughts on the LP have increased significantly due to global warming [10]. Most areas of the LP showed a drying tendency, and the area affected by drought increased by 4% every 10 years from 1961 to 2008 [11]. The drought tendency on the LP will increase significantly from 2015 to 2100, and aridification will be enhanced in the future [12]. The LP is also one of the regions with the most serious soil erosion in the world, with a soil erosion area of 4.5 × 10⁵ km2, which is the main source of sediment in the Yellow River, a river with the highest sediment content in the world [13]. Vegetation plays an important role in reducing soil and water loss on the LP because of its functions of intercepting rainfall, reducing raindrop splash, slowing down surface runoff, increasing soil infiltration, soil conservation, and soil consolidation. It is very important to study the relationship between vegetation growth and drought on the LP. Many scholars have explored the effects of drought on the net primary productivity [14], water use efficiency [15], and coverage rate of the vegetation on the LP [16], but few studies on the drought resistance of vegetation, a key ecosystem stability indicator, were reported.
Drought resistance of vegetation refers to the ability of vegetation to resist drought disturbance and maintain its original state, and drought resistance of vegetation is one of the key indicators to quantify the response of terrestrial ecosystems to climate anomalies [17,18]. Many studies on the quantification of vegetation drought resistance have focused on small-scale field ecological experiments, but they are laborious and destructive in nature, not to mention that they cannot be applied to large-scale studies. In addition, the vegetation response to climate change is complex, and studies at the local scale can easily ignore the differences in response to climate change in climatic environments, vegetation cover types, and other factors, which is not conducive to understanding the macroscopic patterns of vegetation affected by climate change [19]. The cyclical availability of remote sensing products directly related to vegetation conditions makes it highly valuable for ecosystem monitoring [20]. Keersmaecker et al. proposed the AutoRegression (ARx) model method based on remote sensing technology to analyze the drought resistance of vegetation [18] which can be applied on a large scale. Many studies have been conducted using this model, among which, Ivits indicated that Mediterranean ecosystems showed the least resistance to drought in Europe [17], Keersmaecker et al. found that semi-natural grasslands were more resistant to drought than agricultural grasslands in the Netherlands [21]. You et al. found more pronounced differences in the resistance to drought among different climatic conditions and different types of vegetation in the Heihe Basin [22]. However, the existing studies focus more on the analysis of vegetation drought resistance and ignore the changes in vegetation drought resistance.
In order to strengthen soil and water conservation and ecological and environmental protection, the Grain for Green Program (GGP) was started on the LP in 2000 [23], which led to significant changes in the land use structure of the LP. A large amount of cultivated land was transformed into forest land (grassland) [13]. The LP region is a sensitive area to climate change. It is on the edge of the South Asian summer monsoon and East Asian summer monsoon regions, forming an east–west moisture gradient and north–south heat gradient, with generally low precipitation and large inter-annual variability [24]. Many scholars have found that there are significant changes in the climate characteristics of the LP before and after the implementation of the GGP [9,25,26,27]. It has been shown that the pattern of vegetation response to drought is closely related to climate and land cover [28,29], and with changes in climate and land cover, the pattern of vegetation response to drought may change in response to disturbances, as well as the drought resistance of vegetation [30]. However, we still do not know how the drought resistance of vegetation changes on the LP under climate change and the influence of the GGP.
Therefore, the specific objectives of this study are as follows: (1) assess drought resistance of vegetation in each climatic region (semi-humid region, semi-arid region, arid region) and each biotype (forest, grassland, crop) on the LP; (2) assess the characteristics of changes in drought resistance of vegetation before and after the GGP; (3) evaluate the relative contribution of climate factor and human activities to change in vegetation resistance.

2. Study Area and Data

2.1. Study Area

The LP is located in the north of Central China, west of the Wushao Mountains, east of the Taihang Mountains, south of the Qinling Mountains, north of the Yinshan Mountains, and spans between 100°52′E~114°33′E, 33.41°N~41°16′N, with a total area of about 6.3 × 10⁵ km2, altitude of 200–5216 m (Figure 1a). It covers Shanxi Province, Shaanxi Province, and Ningxia Hui Autonomous Region, and parts of Qinghai Province, Gansu Province, Inner Mongolia Autonomous Region, and Henan Province. The LP contains three climatic zones, which are semi-humid, semi-arid, and arid regions (Figure 1b). The special natural geographical location and climatic conditions have formed the typical vegetation communities in the region (Figure 1c). According to the vegetation map of the People’s Republic of China (1:1,000,000), the area of each vegetation biotype was calculated, among which the forest area was the least, accounting for only 15.01%, mainly distributed in the semi-humid regions of the LP, the central-eastern and western parts of the semi-arid regions, and a few areas in the arid regions. Grassland was the most widely distributed vegetation biotype on the LP, with an area of 41.33%. Crops were distributed in every climatic zone of the LP, with an area of 31.32% of the study area (Figure 1c).

2.2. Data

2.2.1. Land Cover Data

The land cover data in this study were obtained from the National Land Use/Cover Dataset of the Resource and Environment Science Data Center of the Chinese Academy of Sciences (http://www.resdc.cn, accessed on 1 June 2022), and the comprehensive accuracy of the data reached 91.2% [33]. The spatial resolution of this land use /cover data is 1 km, including 6 primary classes (arable land, forest land, grassland, water, construction land, and unused land). Forest, grassland, and cropland are the main land cover types, whose area accounts for 87.66% of the whole LP, and there are significant differences in their functional traits. We selected data from 1985, 2000, 2005, 2010, and 2015 and extracted forest, grassland, and cropland from them as the vegetation biotypes data. We also used the map algebra method to analyze the conversion between land use/cover types to obtain the areas of unchanged land cover and areas where the land cover was converted from crops to forests (grasslands) [34].

2.2.2. NDVI Data

The vegetation NDVI data were obtained using 3rd generation NOAA/AVHRR remote sensing data provided by NASA’s Global Observation Simulation (https://www.nasa.gov/nex, accessed on 6 September 2022) and Mapping Research Group with a spatial resolution of approximately 8 km and a temporal resolution of 15 d, spanning the period 1982–2015. This dataset eliminates the effects of solar altitude angle, sensor sensitivity changes with time, enhances the accuracy of the data by combining the cross-radiation calibration method, and has been widely used in the study of vegetation dynamics in large regions [35,36]. Since the effect of precipitation shortage on vegetation varies widely across phenological periods [37], only the resistance of vegetation to drought during the vegetation-growing season was considered in this study. According to relevant studies [38,39], April–October of each year is defined as the growing season of the LP. NDVI time series consists of three components: seasonal component values, anomalous values, and noise [40]. To obtain the NDVI anomaly series required by the ARx model, we first used the maximum synthesis method to take the semimonthly NDVI time series, resample them into monthly NDVI datasets, and further define the areas with mean NDVI values greater than 0.1 for the annual growing season as vegetation areas, removing noise such as cloud interference [34]. We also subtracted the seasonal component values from the monthly NDVI, where the seasonal component values are the NDVI averages of the corresponding month during 1982–2015 [18,21].

2.2.3. Climate Data

The meteorological data in this study were obtained from the National Meteorological Science Data Center (http://data.cma.cn/, accessed on 1 June 2022) using monthly values of temperature and precipitation grids with a horizontal resolution of 0.5° × 0.5° on the ground in China, which was interpolated using monitoring data from 2472 stations across China based on the Thin Plate Spline method, and the time series was from January 1982 to December 2015. The quality of meteorological grid data was checked by cross-validation and error analysis, and the root mean square error of the monthly value of temperature and precipitation grid data relative to the station observations were 0.36 °C and 0.59 mm, respectively, and the quality of the grid data was in good condition [41]. Similar to NDVI, we subtracted the seasonal component values from the month-by-month temperatures to obtain the series of temperature anomalies required by the ARx model [21]. In addition, this data was resampled to 8 km in order to be consistent with the resolution of NDVI Data.

2.2.4. SPEI Drought Indicator

This study adopted SPEI (Standardized Precipitation Evapotranspiration Index) as an indicator for drought, which was constructed by Vicente-Serrano by introducing potential evapotranspiration to SPI (Standardized Precipitation Index) [42]. SPEI performs very well in detecting, monitoring, and exploring the consequences of global warming on drought conditions, especially in semi-arid and arid regions [3,42]. Arid and semi-arid regions account for 74.51% of the LP; thus, we chose SPEI as the indicator for drought on the LP. Many studies have been conducted using SPEI for LP droughts [12,43,44,45] and have been well-validated. The potential evapotranspiration required to calculate the SPEI is calculated using the Thornthwaite algorithm, which only requires monthly mean temperature data since spatial patterns of the relative humidity, solar radiation, and wind speed were unreliable [46,47]. Meanwhile, it has been shown that the SPEI on a 3-month time scale correlates best with vegetation dynamics changes [3]. Therefore, in this study, the SPEI at a 3-month time scale was calculated as a moisture anomaly indicator.

3. Methods

3.1. The AutoRegression Model

The vegetation response to drought was modeled by considering the NDVI anomaly as a linear combination of the drought index (SPEI), the temperature anomaly, and the NDVI anomaly history:
Y t = α   ×   S P E I t + β   ×   T t   + ø   ×   Y t 1 + ε t
where Yt is the standardized NDVI anomaly at time t, SPEIt is the standardized SPEI index at time t, Tt is the standardized temperature anomaly, and ε t is the residual term at time t; α, β and ø are the model’s coefficients. Standardization of the time series was performed in order to assure comparability between the model coefficients. The AutoRegression model is known by the acronym ARx. The ARx model can be applied to the LP because the data used in the model (NDVI, temperature, SPEI) can be obtained by the remote sensing method, and the remote sensing data from satellites can cover a large area such as the LP.
The coefficient of the standardized SPEI time series, α , is an indicator of the vegetation anomaly related to instantaneous drought and thus represents a drought-resistance metric. Where α is large, anomalies are strongly determined by drought, i.e., lower resistance to drought; where α is small, vegetation has more resistance to drought. Similarly, the coefficient of the standardized temperature anomaly time series, β, represents temperature sensitivity. Finally, ø gives an indication of the dependence of the anomalies on the previous response values.
As the GGP was implemented in 2000, part of the cultivated land on the LP was converted to forest or grassland. In this study, we firstly excluded the cells with land-use/cover changes and fitted NDVI, SPEI, and temperature data of the cells without land-use/cover changes from 1982 to 2015 with multiple linear regression to obtain the DRC (Drought Resistance Coefficient) of each climate zone and biotype, and compared and analyzed the differences of drought resistance of vegetation in different climate zones and different biotypes of the LP. Secondly, we divided the study period into two, 1982–1999 and 2000–2015, and fitted NDVI, SPEI, and temperature data of these two periods by multiple linear regression to obtain the DRC of vegetation before and after the GGP, and looked for the difference between the two periods to analyze the changes in the drought resistance of vegetation on the LP. As the GGP was gradually implemented from 2000 to 2015, we further analyzed drought resistance of vegetation in the three periods of 2000–2005, 2005–2010, and 2010–2015 in order to explore the impact of the GGP policy in different periods on the drought resistance of vegetation.

3.2. Residual Analysis

The residual analysis method was used to detect the influence and the relative contribution of climatic factors and human activities to the change in the drought resistance of vegetation.
First of all, based on the temperature and precipitation data and the parameters of the regression model, the predicted value of actual NDVI was calculated (NDVIclim) [48,49], which was only affected by climate factors. The predicted value of vegetation drought resistance (DRCclim) was obtained by substituting NDVIclim into the ARx model, which was used to express the influence of climatic factors on vegetation drought resistance. The corresponding equations are as follows:
N D V I c l i m   = a   ×   P + b   ×   T
where a and b are the regression coefficients, P and T refer to monthly precipitation and monthly average temperature in the growing season, respectively.
N D V I c l i m , t = D R C c l i m   ×   S P E I t + β   ×   T t + ø   ×   N D V I c l i m , t 1 + ε t
where N D V I c l i m , t is the standardized N D V I c l i m , t at time t, SPEIt is the standardized SPEI index at time t, Tt is the standardized temperature anomaly at time t, and ε t is the residual term at time t.
Secondly, the difference between the real value of vegetation drought resistance ( D R C a c t ) and D R C c l i m , namely the vegetation drought resistance residual ( D R C h u m ), was calculated to represent the influence of human activities on vegetation drought resistance.
D R C h u m   = D R C a c t     D R C c l i m
where D R C a c t can be estimated by actual NDVI, and it is affected by both human and climatic factors.
Finally, the drought resistance of vegetation before ( D R C a , b e f ) and after ( D R C a , a f t ) the implementation of the GGP was calculated, respectively. The actual change in the drought resistance of vegetation was calculated as follows:
Δ D R C a c t = D R C a c t , a f t     D R C a , b e f
Δ D R C a c t is composed of two parts, including Δ D R C c l i m affected by climate factors and Δ D R C h u m affected by human factors. Their formulas are:
Δ D R C c l i m   = D R C c l i m , a f t     D R C c , b e f
Δ D R C h u m = D R C h u m , a f t     D R C h u m , b e f
The contributions of climate factors and human activities to DRC changes were quantified by Equations (4)–(7).

3.3. Statistical Analysis

In this study, the F test was used to test the overall significance of the multiple linear regression model and the linear relationship of the ARx model. If the statistics F > F α with the significance level α = 0.05, then the multiple linear regression model and the linear relationship of the ARx model were considered to have a good fitness [50]. Furthermore, the Kruskal–Wallis test was employed to test the difference in the drought resistance of vegetation before and after the GGP in each climatic region of the LP, where the significant level α was 0.05 [51]. All statistical analyses were performed using Matlab (version R2021a) software.

4. Results

4.1. Drought Resistance of Vegetation

We analyzed the drought resistance of vegetation in areas with constant land cover types on the LP during 1982–2015. It was found that the drought resistance of vegetation on the LP was closely related to the aridity of the climate (Figure 2). Spatially, the drought resistance of vegetation on the LP basically showed a spatial pattern of increasing from northwest to southeast and varied with the arid degree, but there was a high spatial heterogeneity. Among them, the DRC of vegetation in southern Shaanxi Province and southern Shanxi Province, which are located in the semi-humid regions, were significantly smaller than those of other regions, i.e., the vegetation in these two regions was relatively more resistant to drought. Vegetation in Qinghai Province, which is located in a semi-arid region, also showed strong drought resistance. The areas with the weakest drought resistance of vegetation were mainly concentrated in the arid regions. However, the vegetation in the northern Inner Mongolia Autonomous Region and northern Ningxia Hui Autonomous Region, which are located in arid regions, showed strong drought resistance.
Drought resistance in different climatic zones and different biotypes of the LP differed significantly (Figure 3). The DRC of vegetation was the smallest (median, 0.163) in the semi-humid regions, the largest (median, 0.245) in the arid regions, and between them in the semi-arid regions (Figure 3a). It showed that the vegetation had the strongest drought resistance in the semi-humid regions, the weakest in the arid regions, and between them in the semi-arid regions. Figure 3b shows the DRC of different biotypes. It can be seen that the drought resistance of different biotypes also differed significantly. The forest had the smallest DRC (median, 0.128), the grassland had the largest (median, 0.218), and the crops were between forest and grassland (median, 0.208), i.e., the drought resistance of forest is the strongest, followed by cropland and grassland. In addition, the DRC of rain-fed agriculture (median, 0.186) was greater than that of irrigated agriculture (median, 0.171), i.e., the drought resistance of rain-fed agriculture is weaker than that of irrigated agriculture.
The DRC of conspecific biotypes under different climatic conditions on the LP varied greatly and was characterized by a certain gradient variation (Figure 4). Forests and grasslands under more humid conditions had a smaller DRC than those under arid conditions, i.e., forests and grasslands under more humid conditions showed greater resistance to drought (Figure 4a,b). Crops presented the opposite characteristic; crops under more humid conditions had a larger DRC than those under arid conditions, i.e., the more humid the conditions, the weaker the drought resistance of the crops (Figure 4c).

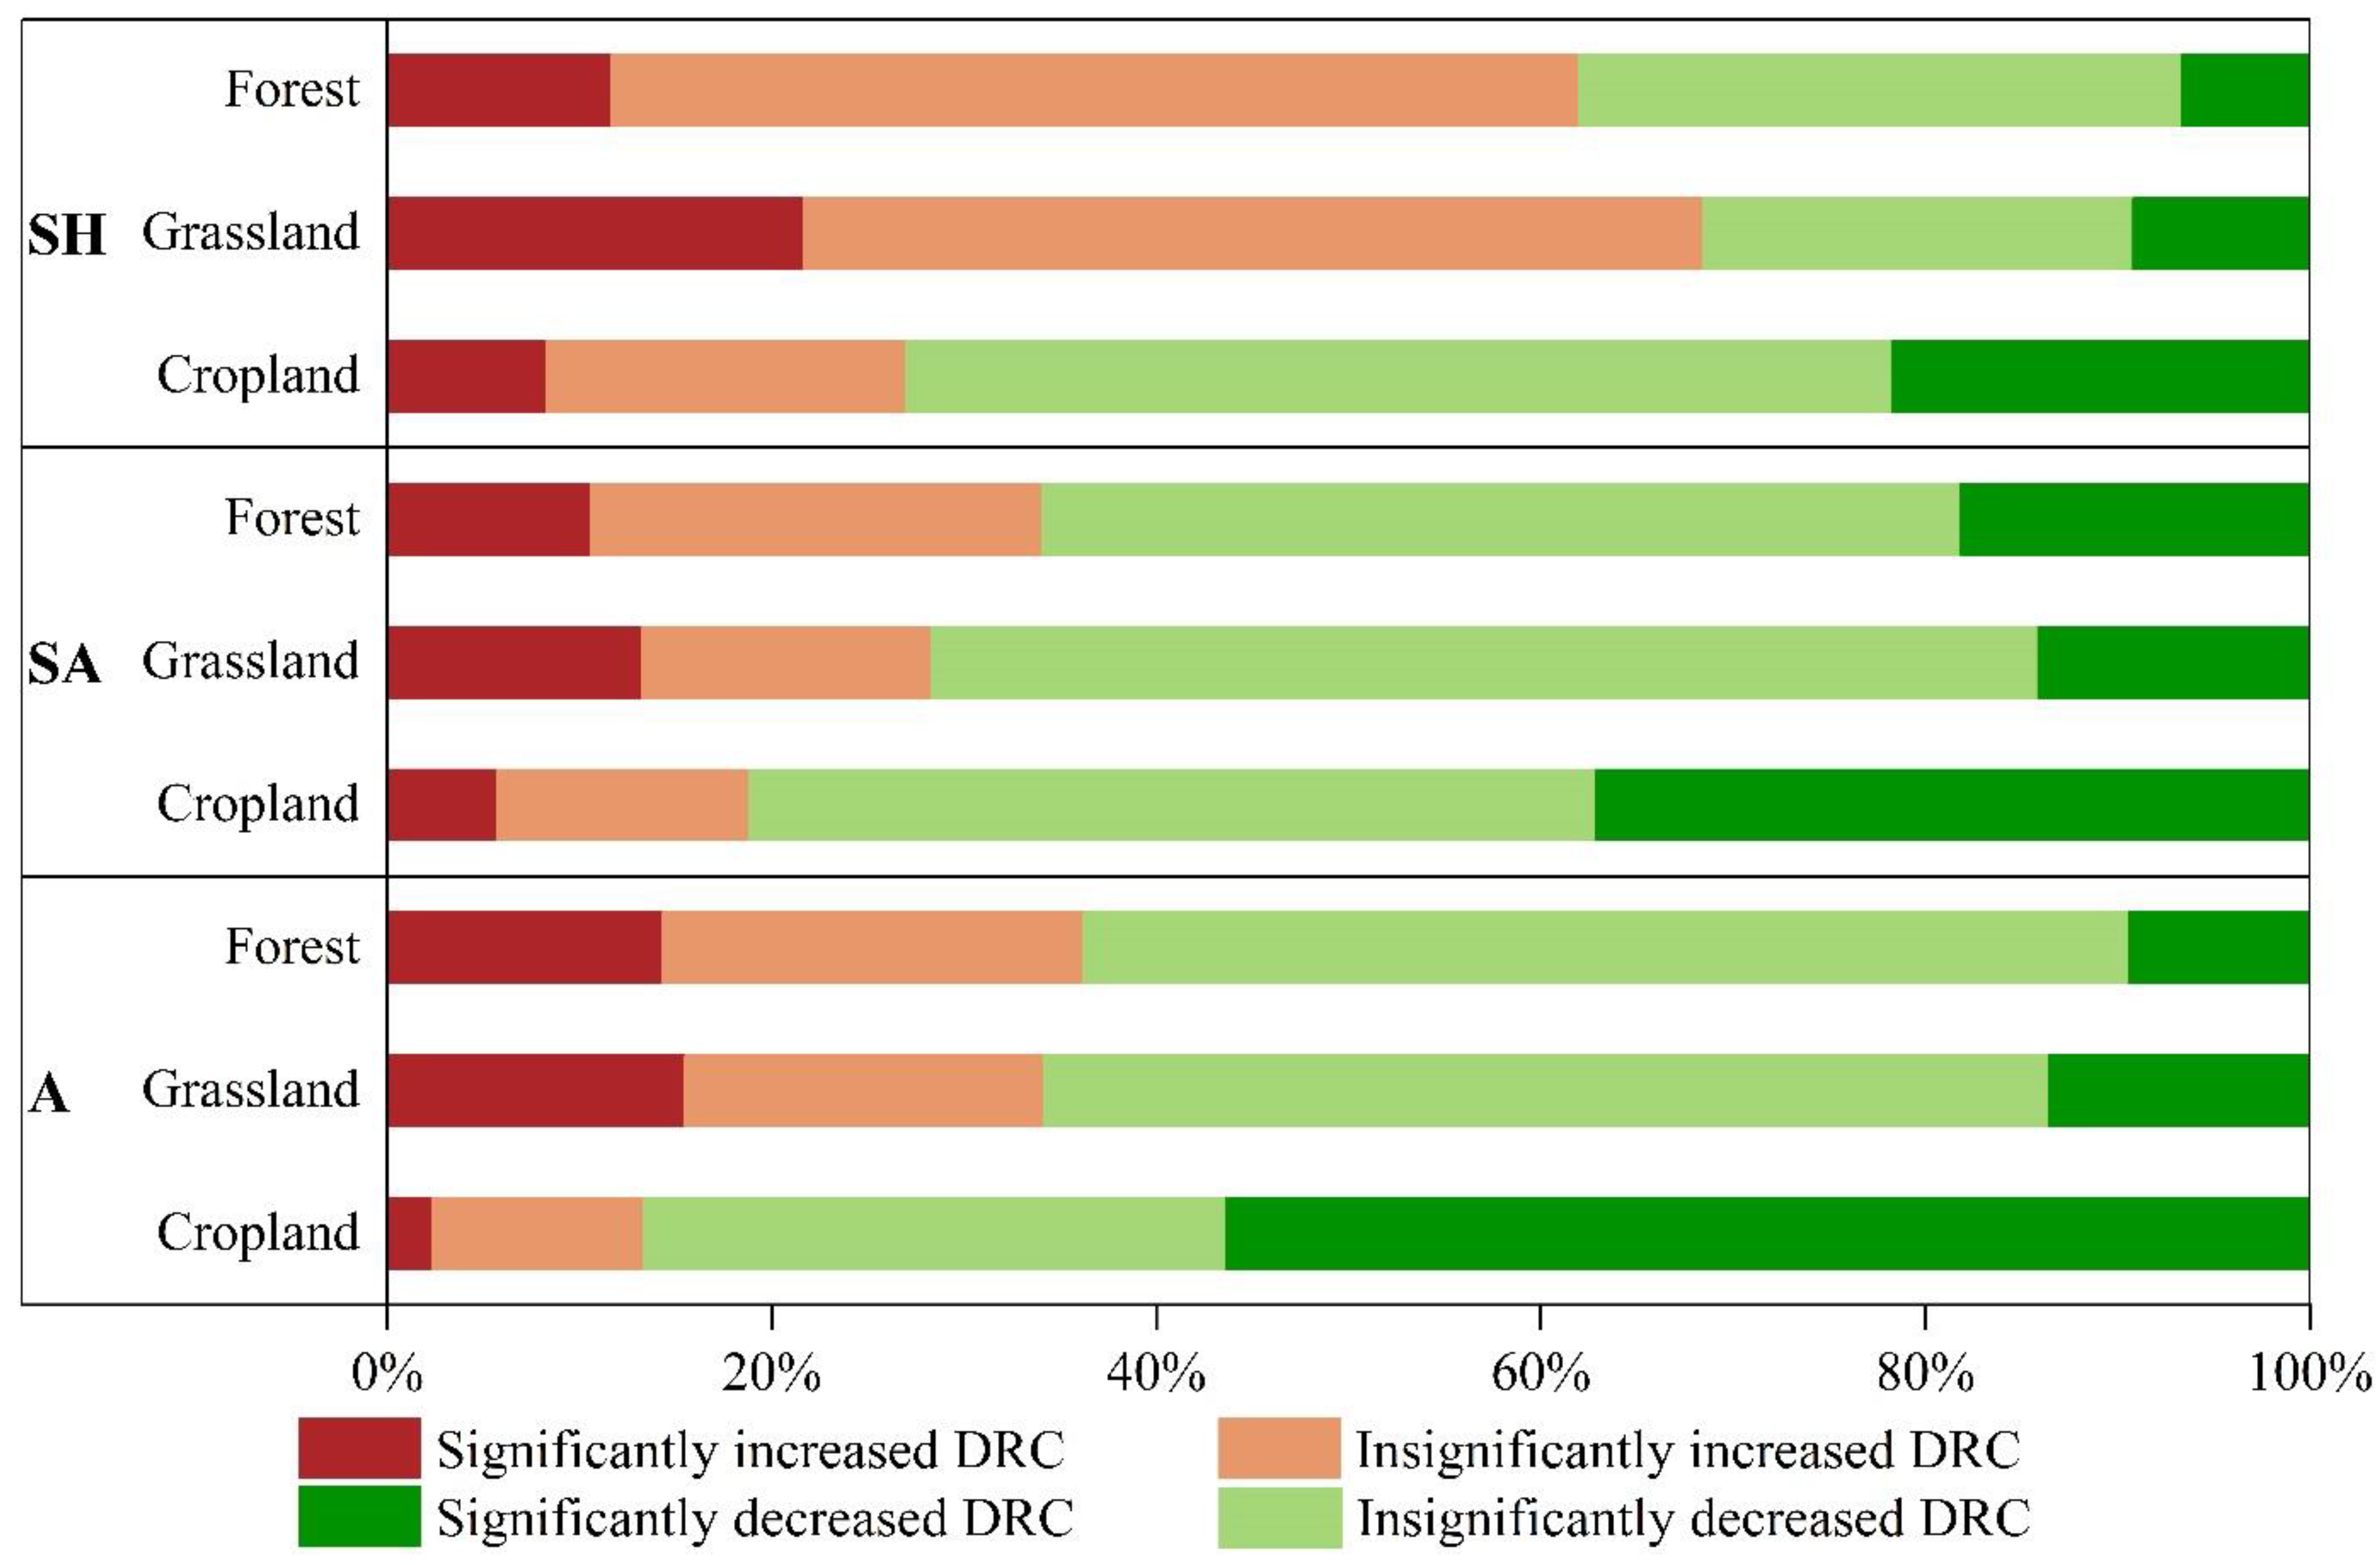
4.2. Changes in the Drought Resistance of Vegetation before and after the Implementation of the GGP

The drought resistance of vegetation before and after the GGP in each climatic region of the LP was tested by the Kruskal–Wallis test. There were significant differences in the drought resistance of vegetation before and after the GGP in semi-humid (p-value = 0.032), semi-arid (p-value = 0.019) and arid regions (p-value = 0.026). We calculated the DRC of vegetation of 1982–1999 and 2000–2015, respectively, and evaluated the difference between the two to analyze the changing characteristics of the drought resistance of vegetation before and after the GGP, and calculated the mean ( x ¯ ) and standard deviation (s) of the DRC change values (DRCC), and divided the DRCC into four categories with mean, mean plus one standard deviation and mean minus one standard deviation as cut points. The four categories include a significant increase in DRC ( D R C C > x ¯ + s ), a non-significant increase in DRC ( x ¯ D R C C x ¯ + s ), a significant decrease in DRC ( D R C C < x ¯ s ), and a non-significant decrease in DRC ( x ¯ s D R C C x ¯ ). The results are shown in Figure 5. On the whole LP, the DRC of 35.53% of vegetation increased, with a significant increase of 10.92%, and the DRC of 65.47% of vegetation decreased, with a significant decrease of 21.28%. In the semi-humid regions, it showed the characteristic of increasing in 58.85% of vegetation and decreasing in 42.15% of vegetation. In contrast, the DRC of vegetation in semi-arid regions (77.09%) and arid regions (64.81%) decreased, with the most significant decrease in semi-arid regions, showing a significant decrease of up to 28.16% of the cells. It showed that the drought resistance of the vegetation of the whole LP was mainly changed by increasing after 2000, but it showed heterogeneity in different climatic zones. Among them, the drought resistance of vegetation in the semi-humid regions was mainly characterized by weakening, while in the arid and semi-arid regions, it was mainly characterized by increasing.
As the conversion of some cropland to forest land (grassland) led by the GGP started in 2000, it may have led to differences in the DRC change characteristics in areas with constant land cover and areas with changed land cover. To this end, we analyzed the change characteristics of vegetation drought resistance in areas with constant land cover on the LP and in areas where the land cover was converted from crops to forests (grasslands), respectively.
Figure 6 shows a stacked plot of DRC change of vegetation in the constant land cover area of LP. It shows that the DRC of 61.98% forests and 68.44% grasslands in the semi-humid regions (SH) increased, while only 26.94% crops increased, indicating that forests and grasslands in areas with constant land cover in the semi-humid regions are characterized by a decrease in drought resistance. The DRC of 65.96% forests, 71.70% grasslands, and 81.18% crops in the semi-arid regions (SA) decreased. The DRC of 63.78% forests, 65.83% grasslands, and 86.70% crops in the arid regions (A) decreased. It indicated that the drought resistance of forests and grasslands in the arid and semi-arid regions with constant land cover was mainly characterized by increasing. Unlike the forests and grasslands, in each climate zone, the drought resistance of crops was characterized by increasing, among which the increase in arid regions was the most significant, with the percentage of cells showing a significant increase, reaching 56.42%.
Figure 7 shows the area and DRC of land cover conversion from crops to forests (grasslands) on the LP every five years from 2000 to 2015. It shows that the area of cropland converted to forest showed a downward trend, while the area of cropland converted to grassland showed an upward trend from 2000 to 2015. From 2000 to 2005, the LP was dominated by returning cropland to forest, and the area of cropland converted into forest (16.49 × 10³ km2) was much larger than that of cropland into grassland (7.23 × 10³ km2) (Figure 7a). The DRC of vegetation showed a downtrend in areas where the land cover was converted from crops to forests from 2000 to 2015 (Figure 7b), i.e., the drought resistance of vegetation was increasing. The DRC of vegetation was mainly characterized by an increase where the land cover was converted from crops to grasslands (Figure 7c), i.e., the drought resistance of vegetation was weakening.

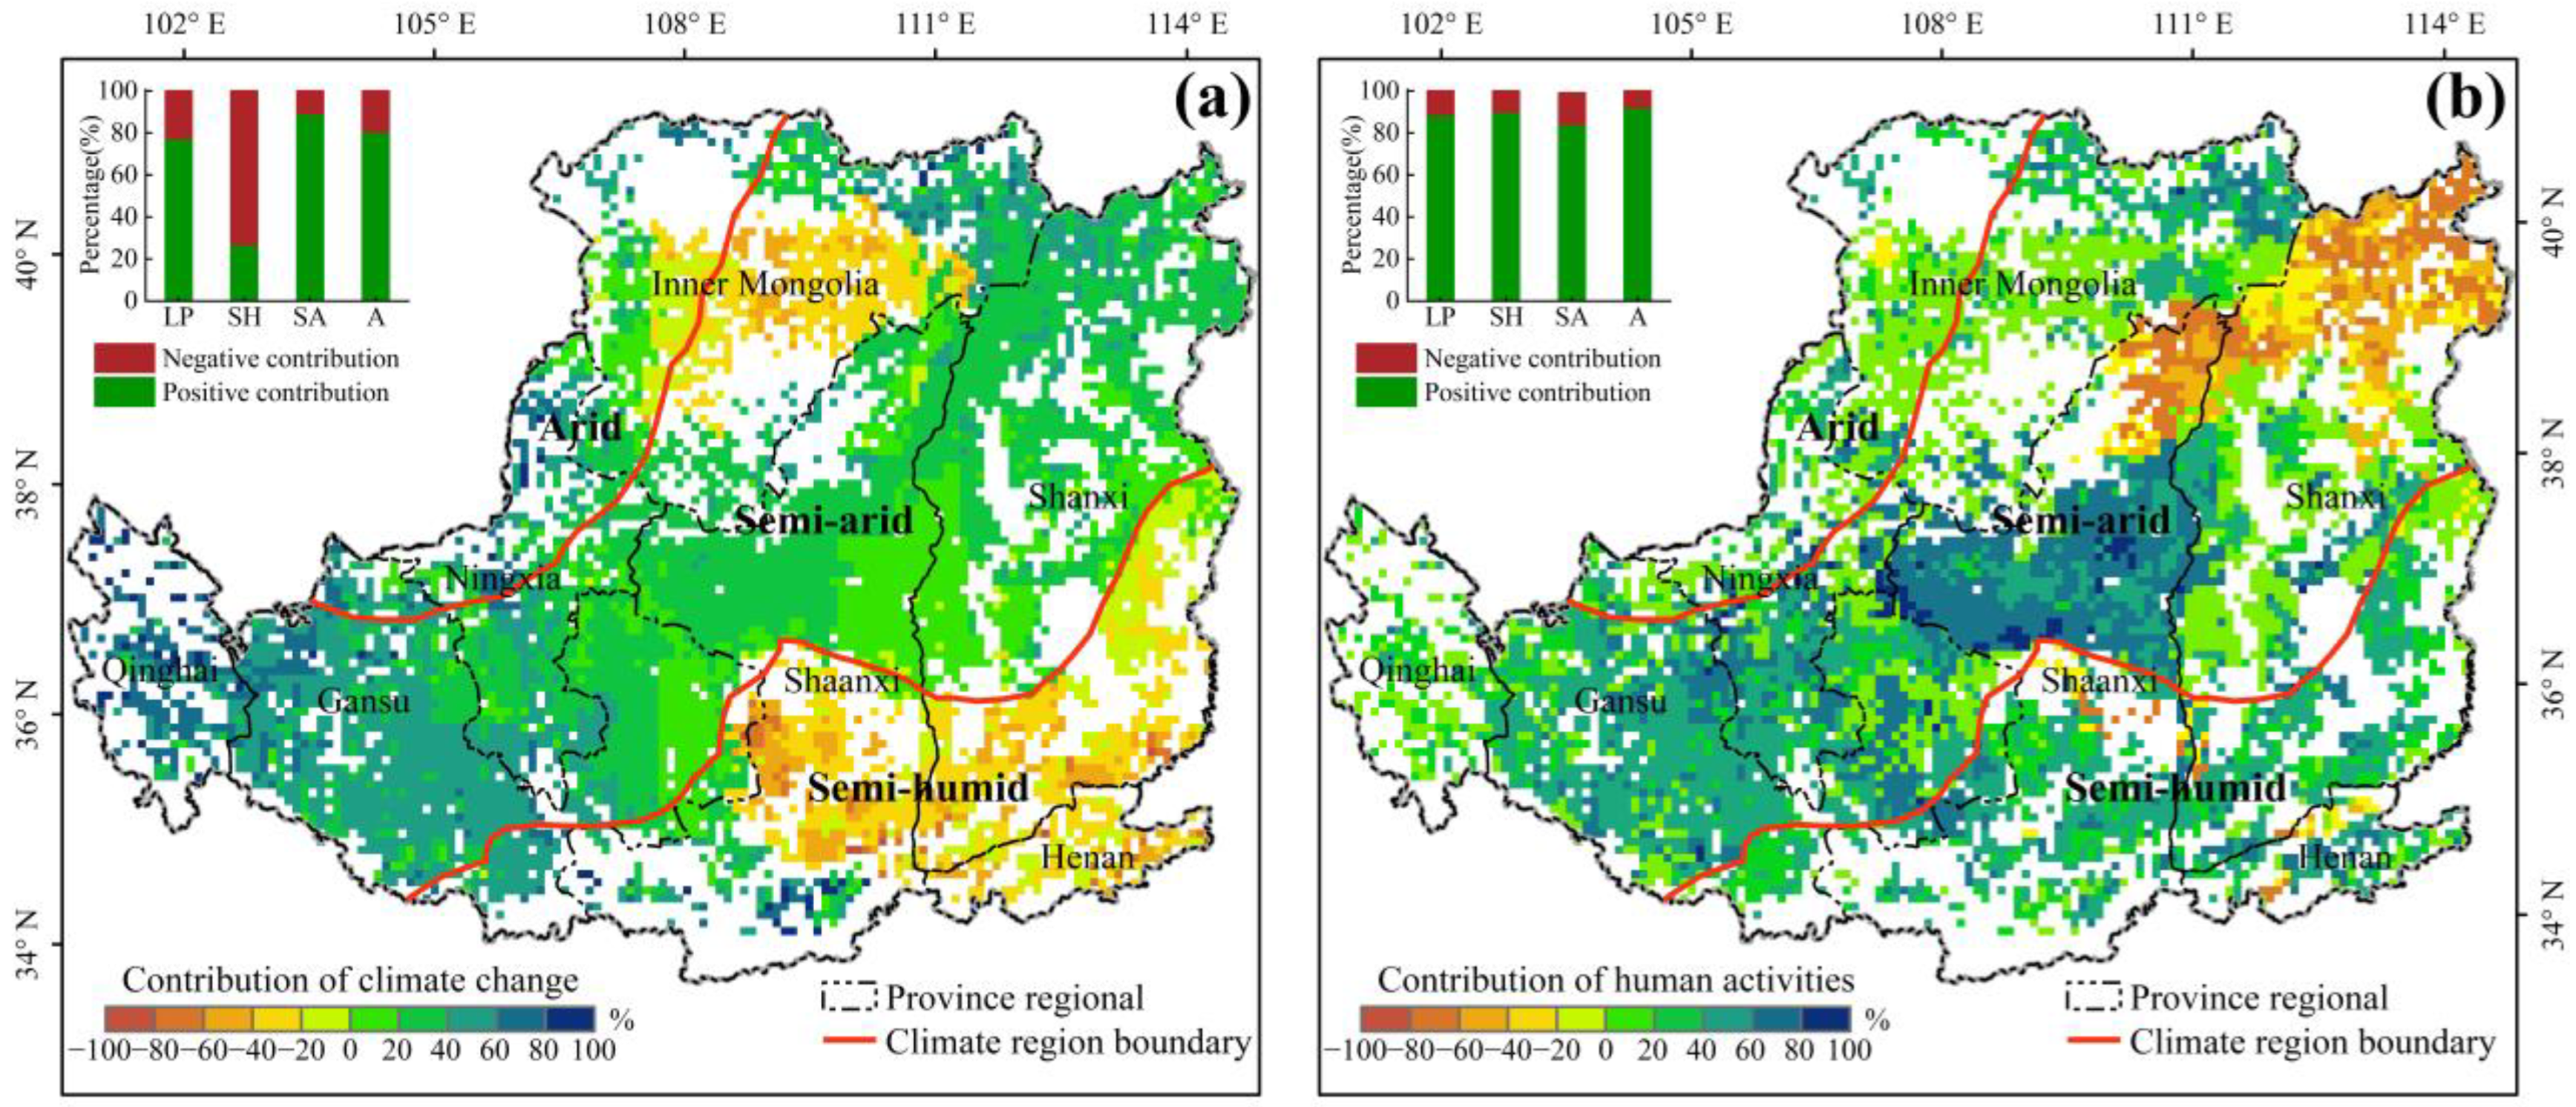
4.3. Contribution of Climate and Human Factors to Change of Vegetation Resistance

Figure 8a shows that the positive contribution rate of climate change to the change in the drought resistance of vegetation on the LP accounts for about 77.34%. Among them, the area with a positive contribution rate of more than 80% accounts for about 5.36%, which is mainly concentrated in the Qinghai Plateau. The area with a negative contribution rate of climate change to drought resistance of vegetation on the LP accounts for about 22.66%, which is mainly concentrated in central Inner Mongolia, south-central Shaanxi, southern Shanxi, and most of Henan. In the climatic regions, the main contribution of climate change to the drought resistance of vegetation in semi-humid regions is negative (−73.06%). Climate change made a positive contribution to the drought resistance of vegetation in semi-arid and arid regions, which were 89.80% and 80.48%, respectively.
The contribution rate of human activities to the change in the drought resistance of vegetation on the LP is quite different from that of climate change, but it is still mainly a positive contribution (Figure 8b). The positive contribution rate of human activities to the change in the drought resistance of vegetation on the LP accounts for about 88.67%, and the area with a positive contribution rate of more than 80% accounts for about 8.15%, mainly concentrated in central Shaanxi. The negative contribution rate of human activities to the change in the drought resistance of vegetation on the LP accounts for about 11.33%, which is mainly distributed in northern Shaanxi and northern Shanxi. Human activities make a positive contribution to the change in the drought resistance of vegetation in each climatic region, and the contribution rate of human activities to the change in the drought resistance of vegetation in arid regions is the largest (92.10%).

5. Discussion

5.1. Drought Resistance of Vegetation on the LP

The results indicated that the drought resistance of vegetation on the LP basically showed a spatial gradient pattern increasing from northwest to southeast with the degree of aridity, and the vegetation in the semi-humid, semi-arid and arid regions having the strongest, moderate, and weakest drought resistance, respectively (Figure 2 and Figure 3a). The reason is that the semi-humid regions of LP are relatively rich in precipitation and soil moisture [52], which can effectively offset the effect of drought on vegetation growth. At the same time, forests with relatively high drought resistance are mainly distributed in the semi-humid regions, leading to the low sensitivity of vegetation to drought in this region, while other climatic factors, such as temperature, may be the key controlling factor for vegetation growth in the semi-humid regions [53]. In arid regions, the natural vegetation is dominated by desert steppe [54], and studies have shown that desert steppe is the vegetation type with the weakest resistance to drought [47]. Meanwhile, natural vegetation in arid regions usually experiences a water deficit during the growing season [55]. When the water supply is lower than usual, vegetation in arid regions responds rapidly due to physiological, structural, and functional strategies to reduce damage caused by water shortage by reducing water loss, respiration cost, photosynthesis, and growth rate [3,43]. Therefore, vegetation in arid regions is more sensitive to drought-induced water changes, and they have weaker drought resistance. Our findings on the drought resistance of vegetation varying in a gradient with the degree of aridity agree with those reported by Zhao et al., who studied the time scale of vegetation productivity response to drought on the LP, which also showed that vegetation productivity in arid, semi-arid, and semi-humid regions had the shortest, medium, and longest response time to drought [43].
However, there is also spatial heterogeneity in the spatial gradient pattern of drought resistance of vegetation on the LP (Figure 2). Among them, vegetation in the northern Inner Mongolia Autonomous Region and northern Ningxia Hui Autonomous Region (Figure 2), which are located in the arid regions, showed strong drought resistance, which may be attributed to the large amount of irrigated agriculture distributed in these regions (Figure 1c). We also found that vegetation in the western part of the semi-arid regions is more resistant to drought (Figure 2) because the western part of the semi-arid regions is Qinghai Province (Figure 1b), where the evaporation is low, and vegetation is dominated by alpine meadows, where glaciers and permafrost melt can replenish the water demand of vegetation during droughts [47].
Drought resistance of the same biotypes in different climatic zones of the LP is also characterized by gradient variations. The moister the area, the stronger the drought resistance of forests and grasslands. Because moist forests have a high embolism resistance, and even during droughts, moist forests keep stomata open for a longer period of time, ensuring gas exchange and maintaining a high photosynthetic rate [56], whereas dry forests have low embolism resistance, they need to show a rapid response to water deficit during a drought so that they can avoid drought stress [3,56]. Grasses in different moisture environments have different life cycles, and different life cycles and growth environments result in different types of grasses with different drought resistances [47]. On the LP, most herbaceous perennials are distributed in wet areas, while annual herbs are mostly distributed in dry areas. It has been shown that herbaceous perennials respond more slowly and have greater drought resistance than annual herbs during drought [57]. However, the drought resistance of crops showed an opposite gradient, i.e., the wetter the area, the weaker the drought resistance of crops. This may be due to differences in agricultural practices in different climatic contexts. As a traditional agricultural growing area with a long history, there are two types of agricultural cultivation on the LP, rain-fed agriculture and irrigated agriculture, due to the differences in crop cultivation types, seasonal precipitation dependence, and hydrological conditions [58]. Rain-fed agriculture is the mainstay in semi-humid regions [58], and natural rainfall is the main source of soil moisture for it. Rain-fed agriculture relies on natural climate conditions and has less impact on the natural water cycle than irrigated agriculture, while irrigated agriculture is the mainstay in the arid and semi-arid regions, especially in the arid regions. The soil moisture absorbed by crops comes from both artificial irrigation and natural rainfall, and irrigation seriously changes the natural water cycle [59]. Therefore rain-fed crop growth is more susceptible to suppression by water stress than irrigated agriculture [60], and rain-fed agriculture is more vulnerable to drought than irrigated agriculture [61]. Different agricultural cultivation practices result in a diametrically opposed gradient of drought resistance between crops and natural vegetation (forests and grasslands) on the LP.

5.2. Changes in the Drought Resistance of Vegetation

This study found that the drought resistance of vegetation on the LP as a whole was mainly characterized by enhancement, mainly because climate change and human activities have made positive contributions to the change in the drought resistance of vegetation on the LP. In terms of climate change, the LP as a whole and the arid and semi-arid regions of the LP were likely getting wetter, and the drought was weakening during the period since the GGP was implemented [4,9,25]. Climate wetting and drought weakening are not only conducive to the improvement of photosynthesis and vegetation productivity but also accelerate the absorption and transport of soil nutrients, which is conducive to the increase in drought resistance of vegetation [62,63]. In terms of human activities, we found an increasing trend of drought resistance of crops in each climate zone, which may be more attributed to the positive contribution of human activities such as the GGP. The GGP is not only an ecological project but also a livelihood project, which promotes the construction of agricultural infrastructure, the wide application of modern agricultural technology, coping with the traditional agricultural problems of weak infrastructure, insufficient moisture, weak disaster resistance, and mitigation capacity and other complex “agricultural diseases” [64,65,66], and effectively improved the drought resistance of crops. The LP has traditionally been known for its thick loess accumulation and severe soil erosion. In order to reduce erosion, large-scale terraced fields and silting dams were built on the LP [13]. Since 2000, in order to cooperate with and promote the implementation of the GGP, a lot of terraced fields and silting dams have been constructed on the LP, and the area of terraced fields and the number of silting dams have been increasing year by year. By 2015, 4 million hm2 of terraced fields had been built, accounting for about 60% of the total arable land, and 5.84 × 10⁴ silting dams had been built [67]. The construction of terraced fields and silting dams can not only effectively reduce soil erosion but also store the slope sediment containing a large amount of organic matter such as livestock manure and leaf-litter, accelerating the soil ripening process and the ability of water and fertilizer conservation, and improving the agricultural drought resistance and disaster mitigation on the LP [68]. At the same time, driven by the GGP, modern agricultural science and technology have been widely used on the LP. Since 2000, rainwater’s efficient and intensive utilization techniques, such as ridge-furrow film mulching, have been developed in agricultural practice and have been popularized in a large area. The cultivation area of ridge-furrow film mulching has reached 1.3 × 10⁶ hm2 [69]. Ridge-furrow film mulching transforms the cropland into a micro-terrain alternating between furrow and ridge, the surface of the furrow and ridge is completely covered with plastic film, and the crops are sowed in the furrow [70]. Ridge-furrow film mulching cultivation can improve crop water use efficiency, collect precipitation and quickly infiltrate the soil, reduce soil water evaporation, preserve natural precipitation, alleviate water stress caused by drought, and as a result, indirectly enhance the drought resistance of crops [71].
Climate change and human activities can also lead to a decline in the drought resistance of vegetation in parts of the LP (Figure 5 and Figure 6). It was obvious that climate change had a certain negative impact on drought resistance change in semi-humid regions (Figure 8a), which might be related to most parts of the semi-humid regions turning warmer and drier, and the drought intensifying during 2000–2015 since the GGP was implemented [25]. The decrease in precipitation, increase in temperature, and aggravation of drought usually leads to a decrease in soil fertility and the inhibition of vegetation activities such as photosynthetic rate and absorptive function, which contributes to the decrease in the drought resistance of vegetation [72]. In addition, the negative impact of human activities on the drought resistance of vegetation was more obvious in northern Shanxi and northern Shaanxi (Figure 8b). As a result of the GGP, large tracts of arable land in these areas have been converted into artificial forests [73]. However, increased afforestation areas increase transpiration and result in water shortages and deterioration of soil ecosystems at a local scale [74,75]. The malpractice of returning cropland to forests in a large area and excessive human intervention might be the main reasons for the weakening of the drought resistance of vegetation in these areas.
This study found that the drought resistance of vegetation was the weakest during 2000 to 2005 when the land cover was converted from crops to forests (Figure 7b). The period from 2000 to 2005 was the initial stage of the GGP, which mainly involved returning cropland to forest, planting artificial tree forests in arid and semi-arid regions, and planting high-density, high-biomass forest and grass species in semi-humid regions [76]. As a result, a large area of cultivated land on the LP was converted into artificial forests (Figure 7a). However, the initial vegetation construction pattern of the LP violates the ecological distribution pattern of vegetation to a certain extent, and most of these young artificial forests become “little old trees”, and the drought resistance and survival rate were very low. From 2000 to 2005, the overall survival rate of trees in afforestation projects was only 24% [77]. In 2006, following the laws of nature, the Chinese government restructured measures for the GGP. The area of returning cropland to forest was reduced; instead, the cropland was converted to forest only in areas suitable for forest growth, and artificial management of forests was strengthened, which resulted in increasing drought resistance [78]. However, the drought resistance of vegetation in the area where cropland was converted to grassland showed a weakening trend, which may be due to the excessive grazing prohibition. Some studies showed that livestock trampling and feces conversion into organic fertilizer were lifted by using block fences, and the decomposition rate of vegetation litterfall and soil fertility was reduced [79,80]. At the same time, some studies showed that excessive exclusion using fences could affect the natural regeneration and biodiversity of grassland, easily lead to the occurrence of shrub and fire, and reduce the resistance of grassland [81,82].

5.3. Limitations

Although there are important discoveries revealed by this study, there are also limitations. Firstly, this study simply divided the research period into two, namely the periods before and after the GGP; however, the GGP measures were not constant. Actually, the Chinese government kept adjusting the unreasonable measures and offsetting the negative ecological effects of the GGP [23,83]. At the same time, under the background of global warming, the climate of the LP may change greatly in the future [84]. Secondly, although the residual analysis method has been widely used to separate the effects of human activities on vegetation growth, it still has some shortcomings. For example, when establishing a multiple regression equation between climate factors and NDVI, there is no final conclusion on how to reasonably select climate factors (such as air temperature, precipitation, and solar radiation) [85]; when referring to human activities, specific aspects of human activities such as vegetation construction, agricultural technological progress, and urban expansion were not considered [86].

6. Conclusions

In this study, we evaluated the drought resistance of vegetation on the LP based on remote sensing technology, analyzed its change characteristics before and after the GGP, and explored the relative contribution of climate factors and human activities in order to understand the mechanism of vegetation resistance on drought. Our study showed that the drought resistance of vegetation on the LP was controlled by climatic conditions and vegetation biotypes, and the vegetation in the arid regions had the weakest drought resistance. The conservation of vegetation is very important for the reduction of dust storms and control of land degradation on the LP and its adjacent regions, so we suggest establishing a drought early warning system covering vegetation in arid areas to avoid disasters. We also found that the drought resistance of vegetation on the LP was characterized by an increase, but there were differences in different climatic zones. Among them, the drought resistance of vegetation in the semi-humid regions was characterized by weakening, and the drought resistance of vegetation in the arid and semi-arid areas was characterized by an increase. The drought resistance of vegetation mainly tended to increase after the crops converted to forests, but the areas where the land cover was converted from crops to grasslands were characterized by a weakening change in the drought resistance of most vegetation. Climate change and human activities make a positive contribution to the change in the drought resistance of vegetation in most areas of the LP. The decrease in the drought resistance of vegetation in semi-humid areas is dominated by the negative contribution of climate change. The malpractice of returning cropland to forests in a large area and excessive human intervention may be the main reasons for the weakening of the drought resistance of vegetation in the areas of returning cropland to forest and grassland. To improve the drought resistance of vegetation in the area of returning cropland to forest and grassland on the LP, we suggest coordinating vegetation restoration and GGP measures, reducing the interference of unreasonable intensive human activities, and limiting grazing activities through pasture rotation. How the drought resistance of vegetation will change in the future on the LP as well as within its different climatic zones is the next goal of our research.

Author Contributions

Conceptualization, D.W. and D.Y.; methodology, D.W. and K.L.; software, D.W. and Y.Z.; validation, D.Y. and K.L.; formal analysis, D.W., D.Y. and Y.Z.; resources, Y.Z. and F.H.; data curation, F.H. and Q.B.; writing—original draft preparation, D.W.; writing—review and editing, D.W. and Y.Z.; visualization, D.W., Y.Z. and Q.B.; supervision, D.Y.; project administration, D.Y. and K.L.; funding acquisition, D.W. and D.Y. All authors have read and agreed to the published version of the manuscript.

Funding

This research was funded by the National Natural Science Foundation of China (Grant No. 42077230), the Second Tibetan Plateau Scientific Expedition and Research Program (Grant No. 2021QZKK0204), and Longdong University Doctoral Scientific Research Fund (Grant No. XYBY202019).

Data Availability Statement

The land cover type product can be obtained from the National Land Use/Cover Dataset of the Resource and Environment Science Data Center of the Chinese Academy of Sciences (http://www.resdc.cn/, accessed on 1 June 2022). NDVI data were obtained from NASA’s Global Observation Simulation (https://www.nasa.gov/nex, accessed on 6 September 2022). The meteorological data were obtained from the National Meteorological Science Data Center (http://data.cma.cn/, accessed on 1 June 2022).

Conflicts of Interest

The authors declare no conflict of interest.

References

  1. James, J.; Sheley, R.; Erickson, T.; Rollins, K.; Taylor, M.; Dixon, K. A systems approach to restoring degraded drylands. J. Appl. Ecol. 2013, 50, 730–739. [Google Scholar] [CrossRef]
  2. Ciais, P.; Reichstein, M.; Viovy, N.; Granier, A.; Ogée, J.; Allard, V.; Aubinet, M.; Buchmann, N.; Bernhofer, C.; Carrara, A. Europe-Wide reduction in primary productivity caused by the heat and drought in 2003. Nature 2005, 437, 529–533. [Google Scholar] [CrossRef] [PubMed]
  3. Vicente-Serrano, S.; Gouveia, C.; Camarero, J.; Beguería, S.; Trigo, R.; López-Moreno, J.; Azorín-Molina, C.; Pasho, E.; Lorenzo-Lacruz, J.; Revuelto, J. Response of vegetation to drought time-scales across global land biomes. Proc. Natl. Acad. Sci. USA 2013, 110, 52–57. [Google Scholar] [CrossRef] [PubMed] [Green Version]
  4. Zhao, X.; Xia, H.; Liu, B.; Jiao, W. Spatiotemporal Comparison of Drought in Shaanxi–Gansu–Ningxia from 2003 to 2020 Using Various Drought Indices in Google Earth Engine. Remote Sens. 2022, 14, 1570. [Google Scholar] [CrossRef]
  5. Vicente-Serrano, S.; Cabello, D.; Tomás-Burguera, M.; Martín-Hernández, N.; Beguería, S.; Azorin-Molina, C.; Kenawy, A. Drought Variability and Land Degradation in Semiarid Regions: Assessment Using Remote Sensing Data and Drought Indices (1982–2011). Remote Sens. 2015, 7, 4391–4423. [Google Scholar] [CrossRef] [Green Version]
  6. Zhao, T.; Dai, A. CMIP6 Model-Projected Hydroclimatic and Drought Changes and Their Causes in the Twenty-First Century. J. Clim. 2022, 35, 897–921. [Google Scholar]
  7. Piao, S.; Zhang, X.; Chen, A.; Liu, Q.; Lian, X.; Wang, X.; Peng, S.; Wu, X. The impacts of climate extremes on the terrestrial carbon cycle: A review. Sci. China Earth Sci. 2019, 62, 1551–1563. [Google Scholar] [CrossRef]
  8. Vicente-Serrano, S.; Quiring, S.; Pena-Gallardo, M.; Yuan, S.; Dominguez-Castro, F. A review of environmental droughts: Increased risk under global warming? Earth-Sci. Rev. 2020, 201, 102953. [Google Scholar] [CrossRef]
  9. Zhao, Q.; Chen, Q.; Jiao, M.; Wu, P.; Gao, X.; Ma, M.; Hong, Y. The temporal-spatial characteristics of drought in the Loess Plateau using the remote-Sensed TRMM precipitation data from 1998 to 2014. Remote Sens. 2018, 10, 838. [Google Scholar] [CrossRef] [Green Version]
  10. Wu, J.; Miao, C.; Tang, X.; Duan, Q.; He, X. A nonparametric standardized runoff index for characterizing hydrological drought on the Loess Plateau, China. Glob. Planet. Chang. 2018, 161, 53–65. [Google Scholar] [CrossRef]
  11. Yao, Y.; Wang, R.; Yang, J.; Yue, P.; Lu, D.; Xiao, G.; Wang, Y.; Liu, L. Changes in terrestrial surface dry and wet conditions on the Loess Plateau (China) during the last half century. J. Arid. Land 2013, 5, 15–24. [Google Scholar] [CrossRef]
  12. Wang, L.; Shu, Z.; Wang, G.; Sun, Z.; Yan, H.; Bao, Z. Analysis of Future Meteorological Drought Changes in the Yellow River Basin under Climate Change. Water 2022, 14, 1896. [Google Scholar] [CrossRef]
  13. Fu, B.; Liu, Y.; Lü, Y.; He, C.; Zeng, Y.; Wu, B. Assessing the soil erosion control service of ecosystems change in the Loess Plateau of China. Ecol. Complex. 2011, 8, 284–293. [Google Scholar] [CrossRef]
  14. Naeem, S.; Zhang, Y.; Tian, J.; Qamer, F.; Latif, A.; Paul, P. Quantifying the impacts of anthropogenic activities and climate variations on vegetation productivity changes in China from 1985 to 2015. Remote Sens. 2020, 12, 1113. [Google Scholar] [CrossRef] [Green Version]
  15. Zhang, T.; Peng, J.; Liang, W.; Yang, Y.; Liu, Y. Spatial–temporal patterns of water use efficiency and climate controls in China’s Loess Plateau during 2000–2010. Sci. Total Environ. 2016, 565, 105–122. [Google Scholar] [CrossRef]
  16. Nie, T.; Dong, G.; Jiang, X.; Lei, Y. Spatio-temporal changes and driving forces of vegetation coverage on the loess plateau of Northern Shaanxi. Remote Sens. 2021, 13, 613. [Google Scholar] [CrossRef]
  17. Ivits, E.; Horion, S.; Erhard, M.; Fensholt, R. Assessing European ecosystem stability to drought in the vegetation growing season. Glob. Ecol. Biogeogr. 2016, 25, 1131–1143. [Google Scholar] [CrossRef]
  18. De Keersmaecker, W.; Lhermitte, S.; Tits, L.; Honnay, O.; Somers, B.; Coppin, P. A model quantifying global vegetation resistance and resilience to short-Term climate anomalies and their relationship with vegetation cover. Glob. Ecol. Biogeogr. 2015, 24, 539–548. [Google Scholar] [CrossRef]
  19. Pang, H.; Zhang, A.; Yin, S.; Zhang, J.; Dong, G.; He, N.; Qin, W.; Wei, D. Estimating Carbon, Nitrogen and Phosphorus Contents of West–East Grassland Transect in Inner Mongolia Based on Sentinel-2 and Meteorological Data. Remote Sens. 2022, 14, 242. [Google Scholar] [CrossRef]
  20. Zeng, F.; Collatz, G.; Pinzon, J.; Ivanoff, A. Evaluating and quantifying the climate-driven interannual variability in Global Inventory Modeling and Mapping Studies (GIMMS) Normalized Difference Vegetation Index (NDVI3g) at global scales. Remote Sens. 2013, 5, 3918–3950. [Google Scholar] [CrossRef] [Green Version]
  21. De Keersmaecker, W.; Van Rooijen, N.; Lhermitte, S.; Tits, L.; Schaminée, J.; Coppin, P.; Honnay, O.; Somers, B. Species-Rich semi-Natural grasslands have a higher resistance but a lower resilience than intensively managed agricultural grasslands in response to climate anomalies. J. Appl. Ecol. 2016, 53, 430–439. [Google Scholar] [CrossRef]
  22. You, N.; Meng, J.; Zhu, L. Sensitivity and resilience of ecosystems to climate variability in the semi-arid to hyper-arid areas of Northern China: A case study in the Heihe River Basin. Ecol. Res. 2018, 33, 161–174. [Google Scholar] [CrossRef]
  23. Feng, X.; Fu, B.; Piao, S.; Wang, S.; Ciais, P.; Zeng, Z.; Lü, Y.; Zeng, Y.; Li, Y.; Jiang, X. Revegetation in China’s Loess Plateau is approaching sustainable water resource limits. Nat. Clim. Chang. 2016, 6, 1019–1022. [Google Scholar] [CrossRef]
  24. Ji, Q.; Liang, W.; Fu, B.; Zhang, W.; Yan, J.; Lü, Y.; Yue, C.; Jin, Z.; Lan, Z.; Li, S. Mapping land use/cover dynamics of the Yellow River Basin from 1986 to 2018 supported by Google Earth Engine. Remote Sens. 2021, 13, 1299. [Google Scholar] [CrossRef]
  25. Li, G.; Sun, S.; Han, J.; Yan, J.; Liu, W.; Wei, Y.; Lu, N.; Sun, Y. Impacts of Chinese Grain for Green program and climate change on vegetation in the Loess Plateau during 1982–2015. Sci. Total Environ. 2019, 660, 177–187. [Google Scholar] [CrossRef] [PubMed]
  26. Wu, X.; Wei, Y.; Fu, B.; Wang, S.; Zhao, Y.; Moran, E. Evolution and effects of the social-ecological system over a millennium in China’s Loess Plateau. Sci. Adv. 2020, 6, eabc0276. [Google Scholar] [CrossRef] [PubMed]
  27. Wang, Q.; Fan, X.; Qin, Z.; Wang, M. Change trends of temperature and precipitation in the Loess Plateau Region of China, 1961–2010. Glob. Planet. Chang. 2012, 92, 138–147. [Google Scholar] [CrossRef]
  28. Fu, Z.; Ciais, P.; Bastos, A.; Stoy, P.; Yang, H.; Green, J.; Wang, B.; Yu, K.; Huang, Y.; Knohl, A. Sensitivity of gross primary productivity to climatic drivers during the summer drought of 2018 in Europe. Philos. Trans. R. Soc. Lond. B Biol. Sci. 2020, 375, 1810. [Google Scholar] [CrossRef]
  29. Flach, M.; Brenning, A.; Gans, F.; Reichstein, M.; Sippel, S.; Mahecha, M. Vegetation modulates the impact of climate extremes on gross primary production. Biogeosciences 2021, 18, 39–53. [Google Scholar] [CrossRef]
  30. Van Ruijven, J.; Berendse, F. Diversity enhances community recovery, but not resistance, after drought. J. Ecol. 2010, 98, 81–86. [Google Scholar] [CrossRef]
  31. Zheng, J.; Bian, J.; Ge, Q.; Hao, Z.; Yin, Y.; Liao, Y. The climate regionalization in China for 1981–2010. Chin. Sci. Bull. 2013, 58, 3088–3099. [Google Scholar]
  32. Zhang, X.; Sun, S.; Yong, S.; Hou, X. Vegetation Map of the People’s Republic of China (1:1,000,000); Geological Publishing House: Beijing, China, 2007. [Google Scholar]
  33. Xue, Y.; Zhang, B.; He, C.; Shao, R. Detecting vegetation variations and main drivers over the Agropastoral Ecotone of northern China through the ensemble empirical mode decomposition method. Remote Sens. 2019, 11, 1860. [Google Scholar] [CrossRef]
  34. Liu, J.; Kuang, W.; Zhang, Z.; Xu, X.; Qin, Y.; Ning, J.; Zhou, W.; Zhang, S.; Li, R.; Yan, C. Spatiotemporal characteristics, patterns, and causes of land-use changes in China since the late 1980s. J. Geogr. Sci. 2014, 24, 195–210. [Google Scholar] [CrossRef]
  35. Kern, A.; Marjanović, H.; Barcza, Z. Evaluation of the Quality of NDVI3g Dataset against Collection 6 MODIS NDVI in Central Europe between 2000 and 2013. Remote Sens. 2016, 8, 955. [Google Scholar] [CrossRef] [Green Version]
  36. Duan, C.; Li, J.; Chen, Y.; Ding, Z.; Ma, M.; Xie, J.; Yao, L.; Tang, X. Spatiotemporal Dynamics of Terrestrial Vegetation and Its Driver Analysis over Southwest China from 1982 to 2015. Remote Sens. 2022, 14, 2497. [Google Scholar] [CrossRef]
  37. Ji, L.; Peters, A. Assessing vegetation response to drought in the northern Great Plains using vegetation and drought indices. Remote Sens. Environ. 2003, 87, 85–98. [Google Scholar] [CrossRef]
  38. Peng, S.; Piao, S.; Ciais, P.; Myneni, R.; Chen, A.; Chevallier, F.; Dolman, A.; Janssens, I.; Penuelas, J.; Zhang, G. Asymmetric effects of daytime and night-time warming on Northern Hemisphere vegetation. Nature 2013, 501, 88–92. [Google Scholar] [CrossRef]
  39. Wu, X.; Liu, H.; Li, X.; Liang, E.; Beck, P.; Huang, Y. Seasonal divergence in the interannual responses of Northern Hemisphere vegetation activity to variations in diurnal climate. Sci. Rep. 2016, 6, 19000. [Google Scholar] [CrossRef] [Green Version]
  40. Anyamba, A.; Small, J.; Tucker, C.; Pak, E. Thirty-two years of Sahelian zone growing season non-stationary NDVI3g patterns and trends. Remote Sens. 2014, 6, 3101–3122. [Google Scholar] [CrossRef] [Green Version]
  41. Qu, W.; Jin, Z.; Zhang, Q.; Gao, Y.; Zhang, P.; Chen, P. Estimation of Evapotranspiration in the Yellow River Basin from 2002 to 2020 Based on GRACE and GRACE Follow-On Observations. Remote Sens. 2022, 14, 730. [Google Scholar] [CrossRef]
  42. Vicente-Serrano, S.; Beguería, S.; López-Moreno, J. A multiscalar drought index sensitive to global warming: The standardized precipitation evapotranspiration index. J. Clim. 2010, 23, 1696–1718. [Google Scholar] [CrossRef] [Green Version]
  43. Zhao, A.; Zhang, A.; Cao, S.; Liu, X.; Liu, J.; Cheng, D. Responses of vegetation productivity to multi-scale drought in Loess Plateau, China. Catena 2018, 163, 165–171. [Google Scholar] [CrossRef]
  44. Liu, Z.; Wang, Y.; Shao, M.; Jia, X.; Li, X. Spatiotemporal analysis of multiscalar drought characteristics across the Loess Plateau of China. J. Hydrol. 2016, 534, 281–299. [Google Scholar] [CrossRef]
  45. Zhang, B.; He, C.; Burnham, M.; Zhang, L. Evaluating the coupling effects of climate aridity and vegetation restoration on soil erosion over the Loess Plateau in China. Sci. Total Environ. 2016, 539, 436–449. [Google Scholar] [CrossRef] [PubMed]
  46. Thornthwaite, C. An approach toward a rational classification of climate. Geogr. Rev. 1948, 38, 55–94. [Google Scholar] [CrossRef]
  47. Xu, H.; Wang, X.; Zhao, C.; Yang, X. Diverse responses of vegetation growth to meteorological drought across climate zones and land biomes in northern China from 1981 to 2014. Agric. For. Meteorol. 2018, 262, 1–13. [Google Scholar] [CrossRef]
  48. Evans, J.; Geerken, R. Discrimination between climate and human-induced dryland degradation. J. Arid. Environ. 2004, 57, 535–554. [Google Scholar] [CrossRef]
  49. Wang, J.; Wang, K.; Zhang, M.; Zhang, C. Impacts of climate change and human activities on vegetation cover in hilly southern China. Ecol. Eng. 2015, 81, 451–461. [Google Scholar] [CrossRef]
  50. Fan, J.; Huang, L. Goodness-Of-fit tests for parametric regression models. J. Am. Stat. Assoc. 2001, 96, 640–652. [Google Scholar] [CrossRef]
  51. Ostertagova, E.; Ostertag, O.; Kováč, J. Methodology and application of the Kruskal-Wallis test. Appl. Mech. Mater. 2014, 611, 115–120. [Google Scholar] [CrossRef]
  52. Sun, S.; Du, W.; Song, Z.; Zhang, D.; Wu, X.; Chen, B.; Wu, Y. Response of Gross Primary Productivity to Drought Time-Scales Across China. J. Geophys. Res. Biogeosci. 2021, 126, e2020JG005953. [Google Scholar] [CrossRef]
  53. Hua, T.; Wang, X.; Zhang, C.; Lang, L.; Li, H. Responses of vegetation activity to drought in northern China. Land Degrad. Dev. 2017, 28, 1913–1921. [Google Scholar] [CrossRef]
  54. Yang, Y.; Wang, B.; Wang, G.; Li, Z. Ecological regionalization and overview of the Loess Plateau. Acta Ecol. Sin. 2019, 39, 7389–7397. [Google Scholar]
  55. Xie, B.; Jia, X.; Qin, Z.; Shen, J.; Chang, Q. Vegetation dynamics and climate change on the Loess Plateau, China: 1982–2011. Reg. Environ. Chang. 2016, 16, 1583–1594. [Google Scholar] [CrossRef]
  56. McDowell, N.; Pockman, W.; Allen, C.; Breshears, D.; Cobb, N.; Kolb, T.; Plaut, J.; Sperry, J.; West, A.; Williams, D. Mechanisms of plant survival and mortality during drought: Why do some plants survive while others succumb to drought? New Phytol. 2008, 178, 719–739. [Google Scholar] [CrossRef] [PubMed]
  57. Copeland, S.; Harrison, S.; Latimer, A.; Damschen, E.; Eskelinen, A.; Fernandez-Going, B.; Spasojevic, M.; Anacker, B.; Thorne, J. Ecological effects of extreme drought on Californian herbaceous plant communities. Ecol. Monogr. 2016, 86, 295–311. [Google Scholar] [CrossRef] [Green Version]
  58. Yuan, W.; Liu, D.; Dong, W.; Liu, S.; Zhou, G.; Yu, G.; Zhao, T.; Feng, J.; Ma, Z.; Chen, J. Multiyear precipitation reduction strongly decreases carbon uptake over northern China. J. Geophys. Res. Biogeosci. 2014, 119, 881–896. [Google Scholar] [CrossRef]
  59. He, Y.; Chen, F.; Jia, H.; Wang, L.; Bondur, V. Different drought legacies of rain-fed and irrigated croplands in a typical Russian agricultural region. Remote Sens. 2020, 12, 1700. [Google Scholar] [CrossRef]
  60. Dang, Y.; Qin, L.; Huang, L.; Wang, J.; Li, B.; He, H. Water footprint of rain-fed maize in different growth stages and associated climatic driving forces in Northeast China. Agric. Water Manag. 2022, 263, 107463. [Google Scholar] [CrossRef]
  61. Murthy, C.; Yadav, M.; Mohammed Ahamed, J.; Laxman, B.; Prawasi, R.; Sesha Sai, M.; Hooda, R. A study on agricultural drought vulnerability at disaggregated level in a highly irrigated and intensely cropped state of India. Environ. Monit. Assess. 2015, 187, 140. [Google Scholar] [CrossRef]
  62. Williams, C.; Reichstein, M.; Buchmann, N.; Baldocchi, D.; Beer, C.; Schwalm, C.; Wohlfahrt, G.; Hasler, N.; Bernhofer, C.; Foken, T.; et al. Climate and vegetation controls on the surface water balance: Synthesis of evapotranspiration measured across a global network of flux towers. Water Resour. Res. 2012, 48, 1–13. [Google Scholar] [CrossRef] [Green Version]
  63. Clifford, M.; Royer, P.; Cobb, N.; Breshears, D.; Ford, P. Precipitation thresholds and drought-induced tree die-off: Insights from patterns of Pinus edulis mortality along an environmental stress gradient. New Phytol. 2013, 200, 413–421. [Google Scholar] [CrossRef] [PubMed]
  64. Deng, X.; Shan, L.; Zhang, H.; Turner, N. Improving agricultural water use efficiency in arid and semiarid areas of China. Agric. Manag. Water 2006, 80, 23–40. [Google Scholar] [CrossRef]
  65. Fan, M.; Shen, J.; Yuan, L.; Jiang, R.; Chen, X.; Davies, W.; Zhang, F. Improving crop productivity and resource use efficiency to ensure food security and environmental quality in China. J. Exp. Bot. 2012, 63, 13–24. [Google Scholar] [CrossRef] [PubMed]
  66. Liu, Y.; Feng, W.; Li, Y. Modern agricultural geographical engineering and agricultural high-quality development: Case study of loess hilly and gully region. Acta Geogr. Sin. 2020, 75, 2029–2046. [Google Scholar]
  67. Gao, Z.; Fu, Y.; Li, Y.; Liu, J.; Chen, N.; Zhang, X. Trends of streamflow, sediment load and their dynamic relation for the catchments in the middle reaches of the Yellow River over the past five decades. Hydrol. Earth Syst. Sci. 2012, 16, 3219–3231. [Google Scholar] [CrossRef] [Green Version]
  68. Wei, W.; Chen, D.; Wang, L.; Daryanto, S.; Chen, L.; Yu, Y.; Lu, Y.; Sun, G.; Feng, T. Global synthesis of the classifications, distributions, benefits and issues of terracing. Earth-Sci. Rev. 2016, 159, 388–403. [Google Scholar] [CrossRef] [Green Version]
  69. Li, F. Ecologicalization and high-quality development of dryland farming in the Loess Plateau of NW China. Sci. Technol. Rev. 2020, 38, 52–59. [Google Scholar]
  70. Zhao, H.; Wang, R.; Ma, B.; Xiong, Y.; Qiang, S.; Wang, C.; Liu, C.; Li, F. Ridge-furrow with full plastic film mulching improves water use efficiency and tuber yields of potato in a semiarid rainfed ecosystem. Field Crop. Res. 2014, 161, 137–148. [Google Scholar] [CrossRef]
  71. Li, C.; Wang, C.; Wen, X.; Qin, X.; Liu, Y.; Han, J.; Li, Y.; Liao, Y.; Wu, W. Ridge–Furrow with plastic film mulching practice improves maize productivity and resource use efficiency under the wheat–maize double–cropping system in dry semi–humid areas. Field Crop. Res. 2017, 203, 201–211. [Google Scholar] [CrossRef]
  72. Gourdji, S.; Sibley, A.; Lobell, D. Global crop exposure to critical high temperatures in the reproductive period: Historical trends and future projections. Environ. Res. Lett. 2013, 8, 024041. [Google Scholar] [CrossRef]
  73. Ding, Y.; Wang, F.; Mu, Q.; Sun, Y.; Cai, H.; Zhou, Z.; Xu, J.; Shi, H. Estimating land use/land cover change impacts on vegetation response to drought under ‘Grain for Green’ in the Loess Plateau. Land Degrad. Dev. 2021, 32, 5083–5098. [Google Scholar] [CrossRef]
  74. Jia, Y.; Li, T.; Shao, M.; Hao, J.; Wang, Y.; Jia, X.; Zeng, C.; Fu, X.; Liu, B.; Gan, M. Disentangling the formation and evolvement mechanism of plants-induced dried soil layers on China’s Loess Plateau. Agric. For. Meteorol. 2019, 269, 57–70. [Google Scholar] [CrossRef]
  75. Ford, C.; Hubbard, R.; Vose, J. Quantifying structural and physiological controls on variation in canopy transpiration among planted pine and hardwood species in the southern Appalachians. Ecohydrology 2011, 4, 183–195. [Google Scholar] [CrossRef]
  76. Shao, M.; Jia, X.; Wang, Y.; Zhu, Y. A review of studies on dried soil layers in the Loess Plateau. Adv. Earth Sci. 2016, 31, 14–22. [Google Scholar]
  77. Wang, G.; Innes, J.; Lei, J.; Dai, S.; Wu, S. China’s Forestry Reforms. Science 2007, 318, 1556–1557. [Google Scholar] [CrossRef]
  78. Park, K.; Zhang, Y.; Chun, K.; Wan, Q.; Wn, B.; Lim, Y.; Youn, H. A Study of the Development of Returning Land for Farming to Forestry Policy and its Compensation System Change of China. J. For. Environ. Sci. 2011, 27, 101–111. [Google Scholar]
  79. Schönbach, P.; Wan, H.; Gierus, M.; Bai, Y.; Müller, K.; Lin, L.; Susenbeth, A.; Taube, F. Grassland responses to grazing: Effects of grazing intensity and management system in an Inner Mongolian steppe ecosystem. Plant Soil 2011, 340, 103–115. [Google Scholar] [CrossRef]
  80. Hickman, K.; Hartnett, D. Effects of grazing intensity on growth, reproduction, and abundance of three palatable forbs in Kansas tallgrass prairie. Plant Ecol. 2002, 159, 23–33. [Google Scholar] [CrossRef]
  81. Wang, C.; Tang, Y. A global meta-Analyses of the response of multi-taxa diversity to grazing intensity in grasslands. Environ. Res. Lett. 2019, 14, 114003. [Google Scholar] [CrossRef] [Green Version]
  82. McSherry, M.; Ritchie, M. Effects of grazing on grassland soil carbon: A global review. Glob. Chang. Biol. 2013, 19, 1347–1357. [Google Scholar] [CrossRef] [PubMed]
  83. Bryan, B.; Gao, L.; Ye, Y.; Sun, X.; Connor, J.; Crossman, N.; Stafford-Smith, M.; Wu, J.; He, C.; Yu, D. China’s response to a national land-system sustainability emergency. Nature 2018, 559, 193–204. [Google Scholar] [CrossRef] [PubMed]
  84. Shao, R.; Zhang, B.; Su, T.; Long, B.; Cheng, L.; Xue, Y.; Yang, W. Estimating the Increase in Regional Evaporative Water Consumption as a Result of Vegetation Restoration Over the Loess Plateau, China. J. Geophys. Res. Atmos. 2019, 124, 11783–11802. [Google Scholar] [CrossRef]
  85. Wessels, K.; Prince, S.; Malherbe, J.; Small, J.; Frost, P.; VanZyl, D. Can human-induced land degradation be distinguished from the effects of rainfall variability? A case study in South Africa. J. Arid Environ. 2007, 68, 271–297. [Google Scholar] [CrossRef]
  86. Liu, X.; Zhu, X.; Pan, Y.; Li, S.; Ma, Y.; Nie, J. Vegetation dynamics in Qinling-Daba Mountains in relation to climate factors between 2000 and 2014. J. Geogr. Sci. 2016, 26, 45–58. [Google Scholar] [CrossRef]
Figure 1. The spatial distribution of topography (a), climate zones (b), vegetation biotypes (c), and land use/land cover change (d) over the LP. The climate zoning is extracted from Zheng et al. [31]. The type of vegetation comes from the vegetation map of the People’s Republic of China (1:1,000,000) [32].
Remotesensing 14 05142 g001aRemotesensing 14 05142 g001bRemotesensing 14 05142 g001c
Figure 2. Spatial distributions of DRC (Drought Resistance Coefficient) of vegetation during 1982–2015 over the LP. Where values are larger, vegetation has lower resistance to drought; where values are smaller, vegetation has larger resistance to drought.
Remotesensing 14 05142 g002
Figure 3. DRC (Drought Resistance Coefficient) of vegetation in different climate zones (a) and vegetation biotypes (b). Boxplot elements: box = values of 25th and 75th percentiles; horizontal line = median; whiskers = ±1 Standard Deviation (SD).
Remotesensing 14 05142 g003
Figure 4. Mean DRC (Drought Resistance Coefficient) of forest (a), grassland (b), and cropland (c) across climate zones. Error bar is 1 SD.
Remotesensing 14 05142 g004
Figure 5. The percentage of area with different DRC (Drought Resistance Coefficient) change characteristic (Insignificantly/Significantly increased/decreased) on the whole LP and three climate zones (semi-humid, semi-arid, arid).
Remotesensing 14 05142 g005
Figure 6. Percentage change of DRC (Drought Resistance Coefficient) across climate zones and vegetation biotypes. Semi-humid regions (SH), Semi-arid regions (SA), and Arid regions (A).
Remotesensing 14 05142 g006
Figure 7. Change of the area (a) and DRC (Drought Resistance Coefficient) on the land cover from crops to forest (b) and grassland (c).
Remotesensing 14 05142 g007
Figure 8. Spatial distributions of contributions of climate change (a) and human activities (b) to change in the drought resistance of vegetation on the LP. Top-left insets show contributions across climate zones.
Remotesensing 14 05142 g008
Publisher’s Note: MDPI stays neutral with regard to jurisdictional claims in published maps and institutional affiliations.

