Article

Retrieval of Farmland Surface Soil Moisture Based on Feature Optimization and Machine Learning

1
College of Computer and Information Engineering, Henan University, Kaifeng 475004, China
2
Henan Engineering Research Center of Intelligent Technology and Application, Henan University, Kaifeng 475004, China
3
Henan Key Laboratory of Big Data Analysis and Processing, Henan University, Kaifeng 475004, China
*
Author to whom correspondence should be addressed.
Remote Sens. 2022, 14(20), 5102; https://doi.org/10.3390/rs14205102
Submission received: 8 August 2022 / Revised: 3 October 2022 / Accepted: 9 October 2022 / Published: 12 October 2022
(This article belongs to the Special Issue SAR-Based Signal Processing and Target Recognition)

Abstract

:
Soil moisture is an important parameter affecting environmental processes such as hydrology, ecology, and climate. Synthetic aperture radar (SAR) microwave remote sensing is an important means of farmland surface soil moisture (SSM) measurement. The inversion of farmland SSM by microwave remote sensing is greatly affected by vegetation cover. To address this problem, a multisource remote sensing inversion method of farmland SSM based on feature optimization and machine learning is proposed in this paper. Six typical machine learning algorithms suitable for small sample training, including random forest, radial basis function neural network, generalized regression neural network, support vector regression, genetic algorithm–back propagation neural network, and extreme learning machine, were selected in this paper. The features extracted from Sentinel-1/2 and Radarsat-2 remote sensing data were analyzed by Pearson correlation, and those with high correlation coefficients were selected to form the optimal feature subset as the input for the subsequent machine learning models. Then, the SSM collaborative inversion models under different machine learning algorithms were constructed, and comparative experiments were set up to select the optimal prediction model. The models’ accuracy under different feature parameters were studied, and the difference in the performance between the dual-polarization SAR data and the quad-polarization SAR data in SSM inversion was explored. The experimental results showed that among the six models, the random forest model had a higher inversion accuracy, with a coefficient of determination of 0.6395 and a root mean square error of 0.0264 cm3/cm3. Meanwhile, the inversion accuracy could be greatly improved after feature optimization, and the inversion accuracy of the quad-polarization SAR data combined with optical remote sensing data, was better than that of the dual-polarization SAR data combined with optical remote sensing data.

Graphical Abstract

1. Introduction

Although surface soil moisture (SSM) cannot be directly extracted and utilized, it is closely related to human life and can impact plant growth, the meteorological environment, and even the ecosystem cycle [1]. On a global scale, SSM is closely related to the global climate. It influences the entire terrestrial water cycle, and it is a key parameter in scientific research in many fields such as meteorology, hydrology, and agriculture [2,3]. On a regional scale, SSM affects the growth of crops, and knowledge of the spatial and temporal distributions and dynamics of SSM can guide agricultural production. Therefore, achieving large-scale, higher spatial resolution and more accurate SSM inversion can be of great help to crop production, hydrological research, and drought monitoring [4,5].
Traditional methods of monitoring SSM, for example, using SSM meters or ground observation stations, are mainly based on point measurements. The number of sampling points is limited, and it is difficult to accurately and efficiently monitor the SSM information for a large area. The advantage of using an SSM meter is that the result is accurate, but it requires a large amount of labor and time, which is time consuming and laborious [6,7]. The establishment of ground observation stations can monitor SSM in real time without manpower, but the cost of large-scale monitoring is high [8,9]. Remote sensing technology is becoming an important tool for monitoring spatial and temporal SSM information, with the advantage of large-scale, efficient, and dynamic monitoring in real-time [10]. In recent years, as many synthetic aperture radar (SAR) sensor satellites have been updated and put into use, an increasing number of experts and scholars have started to use SAR data for SSM inversion in practical applications [11,12]. The Sentinel-1/2 satellites, the data from which are free to download and have extremely wide coverage areas, provide data support for SSM inversion studies [13,14,15,16]. The Radarsat-2 satellite is one of the most mature commercial satellites available, with quad-polarization and multimode imaging capabilities to meet more individual data requirements [17]. The surface information reflected by microwave signals varies with different polarization modes, frequencies, and angles. Thus, multi-polarization SAR data can reflect surface information more comprehensively and be more fully applied in SSM inversion. The backscattering coefficient of SAR is not only related to its polarization mode, incidence angle and SSM, but is also directly affected by vegetation and surface roughness. SSM retrieval needs to effectively suppress the impact of vegetation coverage and surface roughness [18,19]. In areas with high vegetation cover, eliminating the effects caused by vegetation is a top priority. A large amount of vegetation information can be extracted from remote sensing data. Liujun Zhu et al. [18] used remote sensing data and surface observation station data to retrieve SSM based on the improved change detection method, partially eliminating the impact of vegetation and roughness changes in the experiment. However, these methods require a large number of sample data from ground observation stations. For those areas without ground observation stations, it is difficult to obtain a large number of samples. From the perspective of a small sample data drive, it is still difficult to conduct high-precision SSM inversion studies in vegetation-covered areas and needs to be explored in depth. Therefore, the SSM retrieval method suitable for small samples from the perspective of the machine learning model and feature optimization was studied in this paper.
Due to the nonlinear relationship between surface parameters, the vegetation index, and the radar backscattering coefficient, the need to improve inversion accuracy often leads to numerous parameters and complex structures in SSM inversion models. The machine learning method has a strong nonlinear fitting ability and can learn independently. It can help solve nonlinear problems in the process of SSM inversion, and it has been used widely to retrieve SSM. Rains et al. [20] used the support vector regression (SVR) method and the water cloud model to retrieve SSM and obtained a higher accuracy. Abbes et al. [21] used SMAP and MODIS data and an LSTM neural network to retrieve SSM, and the inversion results were consistent with the actual situation. Tsagkatakis et al. [22] used SMAP radiometer data and Sentinel-1 SAR data to construct a convolutional neural network (CNN) for SSM inversion and achieved a high degree of accuracy. Greifeneder et al. [23] used a gradient boosted regression trees (GBRT) algorithm, remote sensing data, and measured data to inverse SSM in the study area, and the R2 of the experimental results could reach 0.81. El Hajj et al. [24] proposed an artificial neural network (ANN) method based on remote sensing data and measured data to retrieve SSM, and achieved a high degree of accuracy. Although these machine learning methods perform well in a practical application, most of them require a large number of sample data to ensure sufficient training. For the research based on a small data size, there are still many problems to address. For instance, there are many parameters in the process of soil moisture inversion, and the relationship between surface parameters, vegetation index and radar backscatter coefficient is complex. It is of great importance to find out the optimal machine learning model and further optimize the model parameters in the case of small samples.
In order to address the problem that the inversion of farmland SSM is greatly affected by vegetation cover, based on feature optimization and machine learning methods, a multisource remote sensing inversion method of farmland SSM is proposed in this paper. The feature parameters, including vegetation index, surface roughness, backscatter coefficient and its combination mode, polarization characteristic parameters, etc., were extracted from Sentinel-1, Radarsat-2, and Sentinel-2 remote sensing data, providing a more comprehensive reference for soil moisture inversion research. The feature parameters were then optimized using the Pearson correlation analysis method. Six typical machine learning models suitable for small sample training, including random forest (RF), radial basis function neural network (RBF), generalized regression neural network (GRNN), support vector regression (SVR), genetic algorithm-back propagation neural network (GA-BP), and extreme learning machine (ELM), were constructed and compared to select the optimal prediction model for the study area in this paper. The difference between the performance of the dual-polarization SAR data and the quad-polarization SAR data in SSM inversion was explored simultaneously.

2. Materials and Methods

2.1. Materials

2.1.1. Study Area and In Situ SSM

The study area was located in Xiangfu District, Kaifeng city, Henan Province, China, with an area of approximately 500 km2, as shown in Figure 1a. It was located in the North China Plain, which is cold and dry in the winter and hot and rainy in the summer, with a sufficient annual precipitation and a long frost-free period, suitable for crop growth. The crops mainly include winter wheat, corn, and peanut, with winter wheat being the main crop during the experiment. The experiment was conducted at the standing, jointing, and filling stages of winter wheat. During these three phenological periods, the winter wheat plants were more abundant; the vegetation cover was higher; the ground vegetation cover did not change much; field activities, such as plowing and sowing, which affect surface roughness, did not occur. Therefore, the modeling and analysis in this paper were uniformly carried out for these three similar phenological periods.
There are two main sources of in situ SSM data used in SSM remote sensing inversion studies. One is from ground-based observation stations or automatic observation networks, which are easy to obtain data from, and these data are usually collected more frequently and in larger quantities. The other is from the traditional manual measurement method, which relies on manual ground sampling and measurement on the date of satellite transit; it is often difficult to obtain data with this method, and these data are usually collected a limited number of times and in small quantities. Since there were no ground-based observation sites or automatic observation networks in the study area, manual measurements were used to obtain ground-based data and to carry out SSM inversion studies based on small sample sizes of measured data.
A total of 20 sampling points, as shown in Figure 1b,c, were set-up in the study area. The SSM values and latitude and longitude coordinates of all of the sampling points were collected in the field at the time of the Sentinel-1 and Radarsat-2 satellite transits, and a total of 60 sets of valid measured data for each satellite were collected for subsequent experiments. A TDR350 soil moisture meter with a probe length of 3.8 cm was used to measure the volumetric soil moisture content of the surface layer of the farmland. The SSM value of five points were measured using the cross-measurement method at each sampling point, and the measurement points were distributed in a “+” shape, as shown in Figure 2. Their average value was recorded as the in situ SSM value of each sampling point. The sampling points were located using an outdoor handheld UG905 locator, with a positioning accuracy of 1 to 3 m, and the WGS84 coordinate system was used to record the coordinates of the sampling points.

2.1.2. Remote Sensing Data and Preprocessing
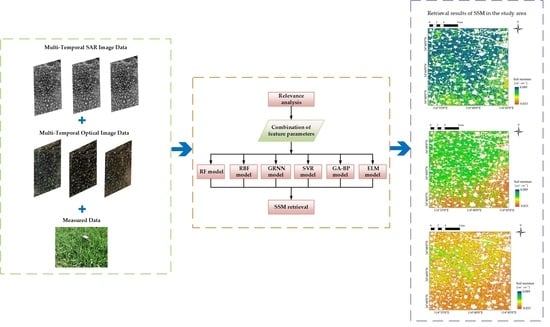
The details and acquisition dates of the Sentinel-1 and Radarsat-2 SAR image data and Sentinel-2 optical image data used in this paper are shown in Table 1. The data used were all in the same phenological periods with the same vegetation growth conditions, allowing for uniform modeling and inversion.
The Sentinel-2 optical data selected for the experiments were 3 quasi-synchronous L2A level products of similar dates with Sentinel-1 and Radarsat-2 transits, as the L2A level data were products that were preprocessed with atmospheric corrections, etc. [25].
The acquired SAR images were preprocessed using the Sentinel Application Platform (SNAP) software to perform preprocessing operations such as radiometric calibration, multi-viewing, Refined Lee filtering, and terrain correction. The multi-viewing operation is a very important step in SAR image preprocessing. Multi view images improve the radiation resolution and reduce the spatial resolution. Refined Lee filtering operation can suppress speckle noise of the SAR image. In order to better compare the geometric and radiometric characteristics of the SAR images, it is necessary to use terrain correction to convert SAR data from an oblique range or ground distance projection to a geographic coordinate projection. After preprocessing, ArcGIS software was used to extract the backscatter coefficients using the latitude and longitude coordinates of the sampling points [26].

2.2. Methods

To eliminate the influence of vegetation cover on the accuracy of the SSM inversion results and to select the optimal model for inversion, six typical machine learning models, including RF, RBF, GRNN, SVR, GA-BP, and ELM, were selected for comparison experiments. The difference in the SSM inversion accuracy between the dual-polarization and quad-polarization SAR data was also explored. The technology roadmap for the experiments in this paper is shown in Figure 3, with the main steps as follows.
  • Step 1. Feature parameter extraction
The Sentinel-1 data were subjected to H/A/α polarization decomposition and combined with Sentinel-2 optical data to calculate the relevant vegetation indices. A total of 22 parameters were extracted from this combination. The Radarsat-2 data were subjected to H/A/α polarization decomposition and Freeman-Durden three-component decomposition and combined with the Sentinel-2 optical data. A total of 37 parameters were extracted from this combination, and the details are shown in Section 2.2.1.
  • Step 2. Feature optimization
The Pearson correlation analysis method was carried out using the extracted feature parameters. According to the correlation between the feature parameters and the SSM values measured, the optimal features subset was selected. The details are shown in Section 2.2.2.
  • Step 3. Construction of the machine learning model
The RF, RBF, GRNN, SVR, GA-BP, and ELM models were constructed and used, and each model was tuned to ensure the training and inversion accuracy of the model. The details are shown in Section 2.2.3.
  • Step 4. SSM prediction and precision evaluation
For each machine learning model, two sets of multisource remote sensing data, Sentinel-1 dual-polarization data combined with Sentinel-2 optical data and Radarsat-2 quad-polarization data combined with Sentinel-2 optical data, were used for comparison. The in situ measured SSM values from 60 sampling points were randomly divided into two groups: one with 50 samples used for training, and the other with 10 samples used for validation and accuracy evaluation. The details are shown in Section 2.2.4.

2.2.1. Polarization Feature Parameter Extraction

SAR detects feature characteristics by transmitting microwave beams to and receiving echo signals from objects. Radar system parameters, such as wavelength, angle of incidence and polarization mode, and feature parameters, such as the dielectric constant and physical structure of the target object, have a direct impact on radar information. Similarly, many vegetation indices can be extracted from optical remote sensing data to describe the surface vegetation information [27].
  • Polarization feature parameter extraction from the Sentinel-1 dual-polarization data
The Sentinel-1 single look complex (SLC) dual-polarization data used in this paper have the advantage of wide coverage, high spatial and temporal resolutions, and are publicly available free of charge. The polarization characteristics are mainly the backscatter coefficients and the polarization decomposition characteristics.
Active microwave remote sensing for SSM inversion is mainly based on the information reflected by the backscatter coefficients. Based on the latitude and longitude of each sampling point, the incident angle (θ), VV polarization backscatter coefficient ( σ V V 0 ), and VH polarization backscatter coefficient ( σ V H 0 ) were extracted from the preprocessed Sentinel-1 SAR data as the feature parameters for subsequent experiments. Since cos(θ) and sin(θ) are also related to SSM [10], and the σ V H 0 / σ V V 0 backscattering coefficient is only related to the surface roughness for a certain radar incidence angle [28], cos(θ), sin(θ), and σ V H 0 / σ V V 0 were also used as feature parameters. Meanwhile, the combination of different polarization backscattering coefficients in the forms of polarization sum ( σ V V 0 + σ V H 0 ), polarization difference ( σ V V 0 σ V H 0 ) and polarization multiplication ( σ V H 0 × σ V V 0 ) were also added. A total of 9 feature parameters related to the radar backscatter coefficients were extracted from the Sentinel-1 SAR data.
Polarization decomposition allows the more complex scattering process of an object to be broken down into several simple scattering mechanisms. Using polarization decomposition, more feature parameters can be extracted from SAR remote sensing data. The eigenvalue decomposition of the coherence matrix or covariance matrix of the target feature was performed using H/A/α decomposition for Sentinel-1 dual-polarization data, from which the scattering entropy (H), the complementary parameter to the scattering entropy–inverse entropy (A), the mean scattering angle (α), and the eigenvalues (λ1 and λ2) could be extracted. A total of 5 polarization parameters were extracted from the Sentinel-1 SAR data [29].
  • Polarization feature parameter extraction from the Radarsat-2 quad-polarization data
The Radarsat-2 quad-polarization data contained more scattering information than the dual-polarization data. The incident angle (θ) at the corresponding position was extracted from the preprocessed Radarsat-2 SAR data based on the latitude and longitude of each sampling point, and the cos(θ) and sin(θ) were extracted in the same way as the dual-polarization feature parameters. The backscatter coefficients of each polarization and their polarization combinations were then extracted including the VV polarization backscatter coefficients ( σ V V 0 ), VH polarization backscatter coefficients ( σ V H 0 ), HH polarization backscatter coefficients ( σ H H 0 ), HV polarization backscatter coefficients ( σ H V 0 ), cross-polarization sums ( σ H V 0 + σ H H 0 and σ V H 0 + σ V V 0 ), cross-polarization differences ( σ H V 0 σ H H 0 and σ V H 0 σ V V 0 ), cross-polarization ratios ( σ H V 0 / σ H H 0 and σ V H 0 / σ V V 0 ), co-polarization ratio ( σ H H 0 / σ V V 0 ), and polarization multiplication ( σ H V 0 × σ H H 0 , and σ V H 0 × σ V V 0 ). A total of 16 feature parameters related to the radar backscatter coefficients were extracted from the Radarsat-2 SAR data.
The H/A/α decomposition and Freeman–Durden three-component decomposition were used to decompose the quad-polarization data, from which the scattering entropy (H), inverse entropy (A), mean scattering angle (α), and eigenvalues (λ1, λ2 and λ3) could be extracted. The Freeman–Durden three-component decomposition allowed for the extraction of the body scattering (Freeman_Vol), secondary scattering (Freeman_Dbl), and surface scattering (Freeman_Odd), as well as the calculation of the total power (Span). A total of 10 polarization feature parameters were extracted from the Radarsat-2 SAR data [30,31,32].
Unlike the dual-polarization data, the quad-polarization data allowed for the extraction of the radar vegetation index (RVI), which describes vegetation information. Three radar vegetation indices (i.e., Van_RVI, Freeman_RVI, and Kim_RVI) were available and were calculated as shown in Equations (1)–(3) [33,34,35],
Van _ RVI = 4 × λ 3 λ 1 + λ 2 + λ 3
Freeman _ RVI = f v f s + f d + f v
Kim _ RVI = 8 × σ H V 2 × σ H V + σ H H + σ V V
  • Vegetation index and surface roughness
The backscattering coefficient of SAR is not only related to its own polarization mode, incident angle, and SSM, but the vegetation cover and surface roughness also have a direct influence on the surface scattering information. The effects of the vegetation cover and surface roughness need to be suppressed in SSM inversion.
In areas covered by crops, the coverage by the crops makes most of the microwaves unable to penetrate the vegetation to reach the surface. This greatly reduces the closeness between SSM and microwave signals and increases the difficulty of retrieving SSM covered by crops. The main feature parameter that can be extracted from optical remote sensing data is the vegetation index. The vegetation index is a combination of the operation of the ground reflectance in two or more wavelength ranges to enhance a certain characteristic or detail of the vegetation. At present, there are more than 100 vegetation indices proposed in the field of remote sensing [36], but only a few of them have been tested in practice. Limited by the type of sensor and the combination of bands used, different vegetation indices have different band application ranges and application fields.
Based on the multi band data provided by the Multispectral Imager(MSI) carried by Sentinel-2 and the actual vegetation coverage situation in the study area, 7 vegetation indexes [37,38,39,40] commonly used in SSM inversion research were finally selected for this experiment including the normalized difference vegetation index (NDVI), normalized difference water index (NDWI), ratio vegetation index (RVI), moisture stress index (MSI), water band index (WBI), fusion vegetation index (FVI), and enhanced vegetation index (EVI). Their calculation formulas are shown in Equations (4)–(10),
NDVI = ρ 842 ρ 665 ρ 842 + ρ 665
NDWI = ρ 842 ρ 1610 ρ 842 + ρ 1610
RVI = ρ 842 ρ 665
MSI = ρ 1610 ρ 842
WBI = ρ 865 ρ 945
FVI = 2 ρ 842 ρ 665 ρ 1610 2 ρ 842 + ρ 665 + ρ 1610
EVI = 2 . 5 × ρ 842 ρ 665 ρ 842 + 6 × ρ 665 7.5 × ρ 490 + 1
where ρ842, ρ665, ρ1610, ρ865, ρ945, ρ665, and ρ490 represent the band values corresponding to 842, 665, 1610, 865, 945, 665, and 490 nm in the Sentinel-2 data, respectively.
Soil roughness is an important factor affecting the microwave backscatter coefficient. Removing the effect of surface roughness can improve the accuracy of the SSM inversion results. It is meaningful to extract the feature parameters that can characterize the surface roughness.
The extracted surface roughness information varies with the frequency of the waveband, the incident angle and the polarization method, which makes it difficult to simulate the surface roughness. Based on the existing research theory that there is a relationship between the surface roughness and the difference in the cross-polarization backscattering coefficient, a combined roughness model was established from the SAR data [41], as shown in Equations (11)–(13),
Z s = exp ( σ H V 0 σ V V 0 B v ( θ ) A v ( θ ) )
A v = 2.640 8 sin 3 ( θ ) + 5.293 sin 2 ( θ ) 3.838 sin ( θ ) + 2.2042
B v = 4.152 2 sin 3 ( θ ) 13.1 sin 2 ( θ ) + 16.947 2 sin ( θ ) 16.422 8
where Zs is the combined roughness: Av and Bv are the coefficients relating only to the incident angle. The coefficients of the Av and Bv were obtained using nonlinear least squares and linear regression fitting, and they were only applicable to the combined roughness model under C-band SAR data.

2.2.2. Feature Optimization

The training accuracy of machine learning models is closely related to the size and quality of the training data. If the size of the training data is too large, the model will converge too slowly. In severe cases, a data disaster will occur, affecting the model’s autonomous learning, causing misjudgments of the prediction results, and reducing the accuracy of the model. Analyzing the feature parameter set and selecting the feature parameters with the high correlations as the input data for the machine learning model, can improve the prediction accuracy of the model and reduce the consumption.
After preprocessing, the 22 feature parameters extracted from the Sentinel-1 and Sentinel-2 data were labeled as feature parameter set A, as shown in Table 2. The 37 feature parameters extracted from the Radarsat-2 and Sentinel-2 data were labeled as feature parameter set B, as shown in Table 3. The Pearson correlation analysis method was carried out between the extracted feature parameters and the in situ measured SSM values to obtain their correlation coefficients, which were between −1 and 1. The higher the absolute value, the stronger the correlation. The correlation coefficients were ranked from largest to smallest, as shown in Table 2 and Table 3. The top 10 feature parameters in each set with the highest correlation were selected as the optimal feature subset to participate in the subsequent inversion experiments. The optimal feature subset selected from feature parameter set A included the NDWI, α, σ V V 0 , θ, A, FVI, σ V H 0 , NDVI, MSI, and cos(θ). The optimal subset of features selected from the set of feature parameters B included α, NDWI, Van_RVI, σ V H 0 , Freeman_Dbl, λ1, A, λ3, θ, and λ2.

2.2.3. Construction of the Machine Learning Model

Machine learning has a strong nonlinear fitting ability. It is helpful for solving the problem of too many parameters and too complex a structure of SSM inversion models, caused by the nonlinear relationship between the surface parameters, vegetation index, and radar backscatter coefficient. Due to the small number of samples collected in the study area, in order to avoid overfitting, six typical machine learning models suitable for small sample training (including RF, RBF, GRNN, SVR, GA-BP, and ELM models) were selected for the experiment.
  • RF model
A random forest model is basically a bunch of regression equations. Each equation is built for each decision tree branch. DT branches are distinguished from each other by the most significant differences in features. RF is an integration algorithm based on the decision tree. Each decision tree is a classifier, and randomness is introduced into the training process of the decision tree to randomly select samples and features. For each input sample, n trees will have n classification results. RF integrates all classification voting results and specifies the one with the most votes as the final output. This process embodies randomness and integration. The RF model has the advantages of improving prediction accuracy, reducing overfitting, and being insensitive to missing data and multicollinearity [42].
In the experiment, the number of leaves was adjusted to 5, 10, 20, 50, and 100, and the optimum number of leaves was obtained by comparing the mean square error (MSE) of different leaves. The results showed that the optimum number of leaves was 10.
  • RBF model
The radial basis function neural network model can approach any nonlinear function and deal with laws that are difficult to analyze in the system. It has a good ability for generalization and a fast learning convergence speed. The RBF model was composed of an input layer, a hidden layer, and an output layer. The role of the input layer was to input the training data into the network, and its nodes were composed of the input samples. The hidden layer used the activation function to perform nonlinear transformation on the input data. The common activation function of the RBF hidden layer was the Gaussian radial basis function, and the output layer used the linear optimization strategy, which was a linear combination of the first two [43].
  • GRNN model
The generalized regression neural network is a type of RBF. It has a strong nonlinear mapping ability and learning speed, and its advantages are greater than the RBF. Research shows that a GRNN has certain advantages for small sample prediction, and it can also manage unstable data. The GRNN is different from the RBF in structure, and is composed of an input layer, a mode layer, a summation layer, and an output layer [44].
  • SVR model
Support vector regression is the application of a support vector machine (SVM) in regression analysis. SVM determines a hyperplane by maximizing the interval, so that most of the sample points are located outside the two decision boundaries. Different from SVM, SVR also considers maximizing the interval, but considers the points within the decision boundary to make as many sample points as possible within the interval [45]. Its advantages are that it supports multidimensional space, different kernel functions are used for different decision functions, and small sample datasets can also be trained.
  • GA-BP model
Neural network approaches are total black boxes of rules based on multilayer combinations of forecasting factors. Back propagation (BP) neural networks have been widely used in many fields, but easily fall into local minima and depend on the design structure. Sometimes it cannot find the global optimal value. Although a genetic algorithm (GA) does not have a self-learning ability, it has the ability of global optimization. Therefore, using a GA to optimize a BP neural network can improve the shortcomings of the neural network. It not only gives play to the nonlinear mapping ability of the neural network and the global optimization ability of a GA, but also accelerates the learning speed of the neural network and comprehensively improves the accuracy and fitting ability of the whole prediction model [46]. During the construction of the GA-BP neural network, the Kolmogorov theorem [41] can be used to determine the number of hidden layer nodes, as shown in Equation (14),
s = 0.43 m n + 0.12 n 2 + 2.54 m + 0.77 n + 0.35 + 0.51
where s, m, and n are the numbers of hidden layers, input layers, and output layers, respectively.
  • ELM model
An extreme learning machine is a kind of machine learning model based on a feedforward neural network. The characteristic of this algorithm is that it can randomly generate weights and thresholds. Unlike a BP neural network, it does not need to continuously reverse adjust, and it only needs to set the number of hidden layer nodes to obtain the optimal solution, which greatly improves the training speed. The commonly used activation functions of its hidden layer are the radial basis function, gaussian function, trigonometric function, and sigmoid function. It has the advantages of a fast learning rate and a good generalization performance [47].

2.2.4. SSM Prediction and Precision Evaluation

To better eliminate the influence of the vegetation cover on the accuracy of the SSM inversion results, six typical machine learning models were selected in this paper for comparative experiments, from which the optimal prediction model suitable for the study area was chosen. In this experiment, two sets of comparative experiments were set up based on feature parameter extraction. All feature parameters and the optimal feature subset were used as the input data for each model, to compare and analyze the impact of the feature parameter selection on the accuracy of the SSM reversion results.

3. Results

In this paper, four precision evaluation indexes were used to evaluate the experimental results, and the spatial distribution of SSM was obtained.

3.1. Accuracy of the Experimental Results

To verify the effectiveness of the proposed method, a verification experiment of SSM inversion was carried out on winter wheat farmland in the study area. Using the in situ measured SSM data, a comparative experiment was implemented to explore the application performance of different data sources, different machine learning models, and different input parameters in SSM inversion. Their influences on the experimental results were qualitatively and quantitatively analyzed, and several meaningful conclusions were obtained.
In this experiment, four precision evaluation indexes, which were bias, root mean square error (RMSE), unbiased root mean square error (ubRMSE), and coefficient of determination (R2), were used to evaluate the inversion accuracy. To reduce the randomness of the experimental results, the average values obtained after multiple repeated experiments were recorded as the experimental results, as shown in Table 4.

3.2. Spatial Distribution of SSM

According to the above conclusions, based on the Radarsat-2 SAR data and the Sentinel-2 optical data, the distribution and frequency distribution maps of SSM in the study area were obtained by using the optimal feature subset and the selected optimal prediction model—the RF model. The results are shown in Figure 4, Figure 5 and Figure 6. To highlight the farmland areas in the SSM distribution map, non-farmland areas such as buildings, roads, and rivers, were prescreened and filled with white pixels. The average SSM inversion values in the three phases of the study area were 0.0772, 0.0537 and 0.0213 cm3/cm3, respectively, and the average in situ measured SSM values at the sampling points were 0.0908, 0.0639, and 0.0165 cm3/cm3, respectively. The inversion results of SSM were consistent with the in situ measured values.

4. Discussion

4.1. Accuracy Evaluation of the Experimental Results

From the perspective of the data source, the experimental results of the Radarsat-2 quad-polarization SAR data combined with the Sentinel-2 optical remote sensing data, were more accurate than the Sentinel-1 dual-polarization SAR data combined with the Sentinel-2 optical remote sensing data, and they had a better performance in the six models and four indicators. However, the Sentinel-1 dual-polarization data could also achieve a certain accuracy. In the absence of quad-polarization data, dual-polarization data combined with optical remote sensing data could also be used for SSM inversion to obtain an acceptable accuracy.
From the perspective of the model, it was found that the comprehensive performance of the RF model was the best. Among the four indexes, only its R2 of the Radarsat-2 combined with the Sentinel-2 data was slightly lower than that of the GRNN model. Among the six models, the RBF model had the worst accuracy among the experimental results. While the GA-BP, SVR, and ELM models also had better inversion accuracy, they were not as good as the RF and GRNN models. Combining the four evaluation indexes, the RF model was selected as the optimal prediction model for the subsequent experiments.
From the perspective of the input data, the experimental results were more accurate when the optimal feature subset was used as the input data. It can be concluded that after removing the redundant feature parameters, the inversion accuracy could be improved and the SSM inversion value was closer to the in situ measured value, which illustrates the effectiveness and superiority of the proposed method.

4.2. Spatial Distribution Analysis of SSM

The frequency distribution of the measured and retrieved SSM values in the study area are shown in Figure 4b, Figure 5b and Figure 6b, respectively. The frequency distribution of the retrieved values on 15 March 2020 was mainly in the ranges of 0.04~0.06 and 0.048~0.1 cm3/cm3. The frequency distribution of the retrieved values on 8 April 2020 was mainly in the range of 0.04~0.08 cm3/cm3. The frequency distribution of the retrieved values on 26 May 2020 was mainly in the range of 0~0.04 cm3/cm3. They were relatively consistent with the frequency distribution of in situ measured values at the sampling points on the same days, which shows that the proposed method had strong applicability in the study area. The difference comparison between the measured values and the inversion values at the sampling points is shown in Figure 4c, Figure 5c and Figure 6c. At 20 sampling points, the inversion values and the measured values had a relatively consistent change trend. The results show that the inversion values can display whether the sampling points are dry, as well as the reliability of the soil moisture distribution.

5. Conclusions

A collaborative SSM inversion method based on machine learning and feature optimization was proposed by combining Sentinel-1 and Radarsat-2 microwave remote sensing data with Sentinel-2 optical remote sensing data. Six typical machine learning models were compared, and the differences in the performance between the dual-polarization SAR data and the quad-polarization SAR data in SSM inversion were explored. The experimental results showed that the quad-polarization SAR data performed better in SSM inversion, and the optimization of the feature parameters could greatly improve the accuracy of SSM inversion. Among the six typical machine learning models, RF, RBF, GRNN, SVR, GA-BP, and ELM, which are suitable for small sample training, the RF model had a higher accuracy with an R² of 0.6395 and an RMSE of 0.0264 cm3/cm3. The retrieved SSM values from the study area using the proposed method were consistent with the in situ measured SSM values, demonstrating the application potential of the proposed SSM inversion method. The proposed method provides a reference for SSM inversion in the surface layer of agricultural fields from multisource remote sensing data, and will be further discussed in terms of its applicability to other farmland surface types in the future.

Author Contributions

Methodology, J.Z., C.Z., L.M., Z.G. and N.L.; formal analysis, L.M., Z.G. and N.L.; investigation, J.Z. and C.Z.; resources, L.M., Z.G. and N.L.; data curation, C.Z. and N.L.; validation, J.Z., C.Z. and N.L.; writing—original draft, J.Z. and C.Z.; writing—review and editing, J.Z., C.Z., L.M., Z.G. and N.L.; visualization, C.Z.; supervision, L.M. and Z.G.; funding acquisition, N.L. All authors have read and agreed to the published version of the manuscript.

Funding

This work was supported in part by the National Natural Science Foundation of China under grants 61871175 and 42101386, in part by the College Key Research Project of Henan Province under grants 22A520021 and 21A520004, in part by the Plan of Science and Technology of Henan Province under grants 212102210093 and 222102110439, in part by the Plan of Science and Technology of Kaifeng City under grant 2102005, and in part by the Foundation of Key Laboratory of Land Satellite Remote Sensing Application, Ministry of Natural Resources of the People’s Republic of China under grant KLSMNR-202204.

Institutional Review Board Statement

Not applicable.

Informed Consent Statement

Not applicable.

Data Availability Statement

Not applicable.

Acknowledgments

The authors would like to thank the anonymous reviewers for their valuable and detailed comments, that are crucial in improving the quality of this paper. The authors would also like to thank all the teachers and students of the “SAR information processing” team for their help in this paper.

Conflicts of Interest

The authors declare no conflict of interest.

References

  1. Chen, S.L.; Liu, Y.B.; Wen, Z.M. Review on soil moisture retrieval by satellite remote sensing. Prog. Geosci. 2012, 27, 1192–1203. [Google Scholar]
  2. Wang, H.Q.; Magagi, R.; Goita, K. Potential of a two-component polarimetric decomposition at C-band for soil moisture retrieval over agricultural fields. Remote Sens. Environ. 2018, 217, 38–51. [Google Scholar] [CrossRef]
  3. Anagnostopoulos, V.; Petropoulos, G.P.; Ireland, G.; Carlson, T.N. A modernized version of a 1D soil vegetation atmosphere transfer model for improving its future use in land surface interactions studies. Environ. Model. Softw. 2017, 90, 147–156. [Google Scholar] [CrossRef] [Green Version]
  4. Zhang, X.; Yuan, X.; Liu, H.; Gao, H.; Wang, X. Soil Moisture Estimation for Winter-Wheat Waterlogging Monitoring by Assimilating Remote Sensing Inversion Data into the Distributed Hydrology Soil Vegetation Model. Remote Sens. 2022, 14, 792. [Google Scholar] [CrossRef]
  5. Chen, S.; Yan, Q.; Jin, S.; Huang, W.; Chen, T.; Jia, Y.; Liu, S.; Cao, Q. Soil Moisture Retrieval from the CyGNSS Data Based on a Bilinear Regression. Remote Sens. 2022, 14, 1961. [Google Scholar] [CrossRef]
  6. Wang, S.N.; Li, R.P.; Wu, Y.J.; Zhao, S.X.; Wang, X.Q. Soil moisture inversion based on environmental variables and machine learning. J. Agric. Mach. 2022, 53, 332–341. [Google Scholar]
  7. Ma, H.Z.; Liu, S.M.; Peng, A.H.; Sun, L.; Sun, G.Y. Active and passive cooperative algorithm at L-Band for bare soil moisture inversion. Trans. Chin. Soc. Agric. Eng. 2016, 32, 133–138. [Google Scholar]
  8. Wang, S.G.; Ma, C.F.; Zhao, Z.B.; Wei, L. Estimation of Soil Moisture of Agriculture Field in the Middle Reaches of the Heihe River Basin based on Sentinel-1 and Landsat 8 Imagery. Remote Sens. Technol. Appl. 2020, 35, 13–22. [Google Scholar]
  9. Wang, Y.T. Remote Sensing Retrieval of Soil Moisture in Ordos Blown-Sand Region Based on SVR. Master’s Thesis, Chang’an University, Xi’an, China, 2019. [Google Scholar]
  10. Lin, L.B. Soil Moisture Retrieval under Vegetation Cover Using Multi-Source Remote Sensing Data. Master’s Thesis, Nanjing University of Information Science and Technology, Nanjing, China, 2018. [Google Scholar]
  11. Zhang, W.F.; Chen, E.X.; Li, Z.Y.; Yang, H.; Zhao, L. Review of applications of radar remote sensing in agriculture. J. Radars 2020, 9, 444–461. [Google Scholar]
  12. Xu, J.X.; Li, X.; Zhu, Y.C.; Fang, S.B.; Wu, D.; Wu, Y.J. Progress of the Methods of Remote Sensing Monitoring the Soil Moisture. Adv. Meteorol. Sci. Technol. 2019, 9, 17–23. [Google Scholar]
  13. Gong, R. Overview of “Sentinel” satellite family. Space Int. 2014, 7, 23–28. [Google Scholar]
  14. Attema, E.; Davidson, M.; Floury, N.; Levrini, G.; Snoeij, P. Sentinel-1 ESA’s New European Radar Observatory. In Proceedings of the 7th European Conference on Synthetic Aperture Radar, Friedrichshafen, Germany, 2–5 June 2008; pp. 1–4. [Google Scholar]
  15. Yang, K.; Yang, J.B.; Jiang, B.R. Sentinel-1 Satellite Overview. Urban Geotech. Investig. Surv. 2015, 2, 24–27. [Google Scholar]
  16. Yang, B.; Li, D.; Gao, G.S.; Chen, C.; Wang, L. Processing analysis of Sentinel-2A data and application to arid valleys extraction. Remote Sens. Land Resour. 2018, 30, 128–135. [Google Scholar]
  17. Huang, S.; Ding, J.L.; Zhang, J.Y.; Chen, W.Q. Backscattering Coefficient Research Based on Microwave Remote Sensing of Radarsat-2 Satellite. Acta Opt. Sin. 2017, 37, 317–327. [Google Scholar]
  18. Zhu, L.; Si, R.; Shen, X.; Walker, J.P. An advanced change detection method for time-series soil moisture retrieval from Sentinel-1. Remote Sens. Environ. 2022, 279, 113137. [Google Scholar] [CrossRef]
  19. Sun, J.X.; Zhang, D.Y.; Hou, Y.C. Multi-source Remote Sensing Data Cooperates to Retrieve Forest Surface Soil Moisture. Remote Sens. Technol. Appl. 2021, 36, 564–570. [Google Scholar]
  20. Rains, D.; Lievens, H.; Lannoy, G.J.M.D.; Mccabe, M.F.; Miralles, D.G. Sentinel-1 Backscatter Assimilation Using Support Vector Regression or the Water Cloud Model at European Soil Moisture Sites. IEEE Geosci. Remote Sens. Lett. 2022, 19, 1–5. [Google Scholar] [CrossRef]
  21. Abbes, A.B.; Magagi, R.; Goita, K. Soil Moisture Estimation from Smap Observations Using Long Short- Term Memory (LSTM). In Proceedings of the 2019 IEEE International Geoscience and Remote Sensing Symposium, Yokohama, Japan, 28 July–2 August 2019; pp. 1590–1593. [Google Scholar]
  22. Tsagkatakis, G.; Moghaddam, M.; Tsakalides, P. Multi-Temporal convolutional neural networks for satellite-derived soil moisture observation enhancement. In Proceedings of the 2020 IEEE International Geoscience and Remote Sensing Symposium, Waikoloa, HI, USA, 26 September–2 October 2020; pp. 4602–4605. [Google Scholar]
  23. Greifeneder, F.; Notarnicola, C.; Wagner, W. AMachine Learning-Based Approach for Surface Soil Moisture Estimations with Google Earth Engine. Remote Sens. 2021, 13, 2099. [Google Scholar] [CrossRef]
  24. El Hajj, M.; Baghdadi, N.; Zribi, M.; Bazzi, H. Synergic Use of Sentinel-1 and Sentinel-2 Images for Operational Soil Moisture Mapping at High Spatial Resolution over Agricultural Areas. Remote Sens. 2017, 9, 1292. [Google Scholar] [CrossRef] [Green Version]
  25. Pan, Y.Y.; Li, C.C.; Ma, X.X.; Wang, B.S.; Fang, X. Atmospheric Correction Method of Sentinel-2A Satellite and Result Analysis. Remote Sens. Inf. 2018, 33, 41–48. [Google Scholar]
  26. Christiansen, M.P.; Teimouri, N.; Laursen, M.S.; Mikkelsen, B.F.; Jorgensen, R.N. Preprocessed Sentinel-1 data via a web service focused on agricultural field monitoring. IEEE Access 2019, 7, 65139–65149. [Google Scholar] [CrossRef]
  27. Wang, C.; Zhang, H.; Chen, X. Quad Polarization Synthetic Aperture Radar Image Processing; Science Press: Beijing, China, 2008. [Google Scholar]
  28. Guan, Y.T.; Li, J.P. Soil moisture inversion based on genetic optimization neural network and multi-source remote sensing data. J. Water Resour. Water Eng. 2019, 30, 255–259. [Google Scholar]
  29. Cloude, S.R.; Pottier, E. A review of target decomposition theorems in radar polarimetry. IEEE Trans. Geosci. Remote Sens. 1996, 34, 498–518. [Google Scholar] [CrossRef]
  30. Li, Z.; Liao, J.J. Inversion Model and Method of Surface Parameters of Synthetic Aperture Radar; Science Press: Beijing, China, 2011. [Google Scholar]
  31. Freeman, A.; Durden, S.L. A three-component scattering model for polarimetric SAR data. IEEE Trans. Geosci. Remote Sens. 1998, 36, 963–973. [Google Scholar] [CrossRef] [Green Version]
  32. Wang, P.; Zhou, Z.F.; Liao, J. Study on Soil Moisture Retrieval of Tobacco Field in Karst Plateau Mountainous Area Based on Freeman Decomposition. Geogr. Geo-Inf. Sci. 2016, 32, 72–76. [Google Scholar]
  33. Gherboudj, I.; Magagi, R.; Berg, A.A.; Toth, B. Characterization of the Spatial Variability of In-Situ Soil Moisture Measurements for Upscaling at the Spatial Resolution of RADARSAT-2. IEEE J. Sel. Top. Appl. Earth Obs. Remote Sens. 2017, 10, 1813–1823. [Google Scholar] [CrossRef]
  34. Mei, X.; Nie, W.; Liu, J.Y. Difference Analysis of Multiply Radar Vegetation Indices Base on Radarsat-2 Full-polarization Data. Chin. J. Agric. Resour. Reg. Plan. 2019, 3, 21–28. [Google Scholar]
  35. Van, Z.J.J.; Zebker, H.A.; Elachi, C. Imaging radar polarization signatures: Theory and observation. Ratio Sci. 1987, 22, 529–543. [Google Scholar]
  36. Fu, Y.Z. Study on Vegetation Index of Remote Sensing and Its Applications. Master’s Thesis, Fuzhou University, Fuzhou, China, 2010. [Google Scholar]
  37. Zhao, X.; Wang, J.D.; Liu, S.H. Modified monitoring method of vegetation water content based on coupled radiative transfer model. J. Infrared Millim. Wave 2010, 29, 185–189. [Google Scholar] [CrossRef]
  38. Wang, D.C.; Wang, J.H.; Jin, N.; Wang, Q.; Li, C.J.; Huang, J.F.; Wang, Y.; Huang, F. ANN-based wheat biomass estimation using canopy hyperspectral vegetation indices. Trans. Chin. Soc. Agric. Eng. 2008, 24 (Suppl. 2), 196–201. [Google Scholar]
  39. Zhao, J.H.; Zhang, B.; Li, N.; Guo, Z.W. Cooperative Inversion of Winter Wheat Covered Surface Soil Moisture Based on Sentinel-1/2 Remote Sensing Data. J. Electron. Inf. 2021, 43, 692–699. [Google Scholar]
  40. Wang, Z.X.; Liu, C.; Huete, A. From AVHRR-NDVI to MODIS-EVI: Advances in Vegetation Index Research. Acta Ecol. Sin. 2003, 5, 979–987. [Google Scholar]
  41. Tong, L.; Chen, Y.; Jia, M.Q. Mechanism of Radar Remote Sensing; Science Press: Beijing, China, 2014. [Google Scholar]
  42. Fang, K.N.; Wu, J.B.; Zhu, J.P.; Xie, B.C. A Review of Technologies on Random Forests. J. Stat. Inf. 2011, 26, 32–38. [Google Scholar]
  43. Chu, Q.L.; Ping, Z.D.; Yu, M.J. Prediction model of octane loss based on RBF neural network. Internet Things Technol. 2010, 135, 230–267. [Google Scholar]
  44. Guo, J.; Liu, J.; Ning, J.F.; Han, W. Construction and validation of farmland surface soil moisture retrieval model based on sentinel multi-source data. Trans. Chin. Soc. Agric. Eng. 2019, 35, 71–78. [Google Scholar]
  45. Brereton, R.G.; Lloyd, G.R. Support Vector Machines for classification and regression. Analyst 2010, 135, 230–267. [Google Scholar] [CrossRef]
  46. Ma, Y.J.; Yun, W.X. Research progress of genetic algorithm. Appl. Res. Comput. 2012, 29, 1201–1206, 1210. [Google Scholar]
  47. Li, X.L.; Zhao, H.L.; Zhao, H.L.; Wang, R.; Hao, Z. Soil Water content inversion based on extreme learning machine model. Sci. Surv. Mapp. 2021, 46, 91–97. [Google Scholar]
Figure 1. Location and Sentinel-1/2 images of the study area and sampling points: (a) location of the study area; (b) Sentinel-1 image of the study area and sampling points; (c) Sentinel-2 image of the study area and sampling points.
Remotesensing 14 05102 g001
Figure 2. Measurement distribution of a single sampling point.
Remotesensing 14 05102 g002
Figure 3. Technology roadmap.
Remotesensing 14 05102 g003
Figure 4. Retrieval results of SSM in the study area on 15 March 2020: (a) distribution map of retrieved SSM; (b) frequency distribution of retrieved and in situ measured SSM; (c) comparison of the differences between the measured values and the inversion values at the sampling points.
Remotesensing 14 05102 g004
Figure 5. Retrieval results of SSM in the study area on 8 April 2020: (a) distribution map of retrieved SSM; (b) frequency distribution of retrieved and in situ measured SSM; (c) comparison of the differences between the measured values and the inversion values at sampling points.
Remotesensing 14 05102 g005
Figure 6. Retrieval results of SSM in the study area on 26 May 2020: (a) distribution map of retrieved SSM; (b) frequency distribution of retrieved and in situ measured SSM; (c) comparison of the differences between the measured values and the inversion values at sampling points.
Remotesensing 14 05102 g006
Table 1. Remote sensing data information.
Data SourceAcquisition DatePhenological PeriodProduct TypePolarization Mode
Sentinel-1
(SAR Image Data)
22 March 2020Standing StageIW SLCDual-Polarization
4 April 2020Jointing Stage
21 May 2020Filling Stage
Radarsat-2
(SAR Image Data)
15 March 2020Standing StageStandard Quad-PolarizationQuad-Polarization
8 April 2020Jointing Stage
26 May 2020Filling Stage
Sentinel-2
(Optical Image Data)
23 March 2020Standing StageL2A
12 April 2020Jointing Stage
22 May 2020Filling Stage
Table 2. Feature parameters extracted from the Sentinel-1 and Sentinel-2 data and their correlation coefficients with the in situ measured SSM values.
No.ParameterCCNo.ParameterCC
1NDWI0.5834 **12 σ V H 0 / σ V V 0 −0.236
2 α
(Scattering Angle)
0.4143 *13λ1−0.219
3 σ V V 0 0.3992 *14H
(Scattering Entropy)
0.1424
4θ−0.3971 *15Zs−0.1401
5A (Anisotropy)−0.3723 *16EVI0.1331
6FVI−0.3321 *17 σ V H 0 × σ V V 0 −0.0751
7 σ V H 0 −0.3281 *18λ2 (Eigenvalue)−0.0685
8NDVI−0.3134 *19RVI0.0642
9MSI−0.298720 σ V H 0 - σ V V 0 −0.0604
10cos(θ)0.270021 σ V H 0 + σ V V 0 0.0511
11sin(θ)−0.269922WBI−0.0501
* Indicates a significant correlation at the 0.05 level; ** indicates a significant correlation at the 0.01 level.
Table 3. Feature parameters extracted from the Radarsat-2 and Sentinel-2 data and their correlation coefficients with the in situ measured SSM values.
No.ParameterCCNo.ParameterCC
1 α
(Scattering Angle)
0.4961 **20Zs−0.1231
2NDWI0.4102 *21sin(θ)−0.1197
3Van_RVI−0.3843 *22 σ V H 0 / σ V V 0 0.1076
4 σ V H 0 0.3821 *23cos(θ)−0.1031
5Freeman_Dbl−0.3694 *24 σ H H 0 × σ H V 0 −0.0767
6λ1 (Eigenvalue)−0.3691 *25 σ H V 0 + σ H H 0 0.0720
7A (Anisotropy)0.3639 *26Kim_RVI−0.0643
8λ3 (Eigenvalue)−0.3513 *27 σ H H 0 0.0638
9θ−0.3387 *28RVI0.0576
10λ2 (Eigenvalue)−0.3141 *29 σ V H 0 + σ V V 0 0.0553
11MSI−0.3140 *30 σ V H 0 × σ V V 0 −0.0537
12 σ H H 0 / σ V V 0 0.298631WBI−0.0486
13FVI0.254832Freeman_RVI−0.0324
14NDVI0.173633 σ H V 0 / σ H H 0 −0.0230
15 σ H V 0 −0.256534 σ H V 0 σ H H 0 0.0112
16H
(Scattering Entropy)
−0.153435 σ V V 0 0.0070
17 σ V H 0 σ V V 0 0.148336Freeman_Vol0.0012
18Freeman_Odd0.144237span0.0011
19EVI0.1253
* Indicates a significant correlation at the 0.05 level; ** indicates a significant correlation at the 0.01 level.
Table 4. Comparison of the accuracy of the inversion results.
No.MethodParameterBiasRMSEubRMSE
Sentinel-1 + Sentinel-2RF220.01380.03710.03650.5912
100.00860.03110.03060.6282
RBF220.02110.04630.04510.5007
100.01710.03580.03460.5697
GRNN220.01830.04220.04180.5525
100.01340.03500.03380.6087
SVR220.01650.04160.04080.5414
100.01460.03670.03530.5931
GA-BP220.01180.03910.03760.5893
100.00860.03370.03290.6167
ELM220.02030.03870.03720.5516
100.01730.03270.03040.6012
Radarsat-2 + Sentinel-2RF370.01320.03320.02940.5954
100.00910.02710.02640.6395
RBF370.01990.04030.03940.4976
100.01670.05460.04900.6113
GRNN370.01390.03710.03690.5675
100.01130.03990.03730.6536
SVR370.01550.04330.04240.5674
100.01260.03760.03610.6076
GA-BP370.01470.03410.03260.6039
100.01140.03240.02890.6343
ELM370.01970.03890.03660.5709
100.01480.03170.03080.6186
Publisher’s Note: MDPI stays neutral with regard to jurisdictional claims in published maps and institutional affiliations.

