Article

Variations of Urban NO2 Pollution during the COVID-19 Outbreak and Post-Epidemic Era in China: A Synthesis of Remote Sensing and In Situ Measurements

1
Key Laboratory of Environmental Optics & Technology, Anhui Institute of Optics and Fine Mechanics, Hefei Institutes of Physical Science, Chinese Academy of Sciences, Hefei 230031, China
2
Department of Precision Machinery and Precision Instrumentation, University of Science and Technology of China, Hefei 230026, China
3
School of Earth and Space Sciences, University of Science and Technology of China, Hefei 230026, China
4
School of Environmental Science and Optoelectronic Technology, University of Science and Technology of China, Hefei 230026, China
5
Anhui Province Key Laboratory of Polar Environment and Global Change, University of Science and Technology of China, Hefei 230026, China
6
Center for Excellence in Regional Atmospheric Environment, Institute of Urban Environment, Chinese Academy of Sciences, Xiamen 361021, China
7
Key Laboratory of Precision Scientific Instrumentation of Anhui Higher Education Institutes, University of Science and Technology of China, Hefei 230026, China
*
Author to whom correspondence should be addressed.
Remote Sens. 2022, 14(2), 419; https://doi.org/10.3390/rs14020419
Submission received: 26 November 2021 / Revised: 5 January 2022 / Accepted: 13 January 2022 / Published: 17 January 2022
(This article belongs to the Special Issue Optical and Laser Remote Sensing of Atmospheric Composition)

Abstract

:
Since the COVID-19 outbreak in 2020, China’s air pollution has been significantly affected by control measures on industrial production and human activities. In this study, we analyzed the temporal variations of NO2 concentrations during the COVID-19 lockdown and post-epidemic era in 11 Chinese megacities by using satellite and ground-based remote sensing as well as in situ measurements. The average satellite tropospheric vertical column density (TVCD) of NO2 by TROPOMI decreased by 39.2–71.93% during the 15 days after Chinese New Year when the lockdown was at its most rigorous compared to that of 2019, while the in situ NO2 concentration measured by China National Environmental Monitoring Centre (CNEMC) decreased by 42.53–69.81% for these cities. Such differences between both measurements were further investigated by using ground-based multi-axis differential optical absorption spectroscopy (MAX-DOAS) remote sensing of NO2 vertical profiles. For instance, in Beijing, MAX-DOAS NO2 showed a decrease of 14.19% (versus 18.63% by in situ) at the ground surface, and 36.24% (versus 36.25% by satellite) for the total tropospheric column. Thus, vertical discrepancies of atmospheric NO2 can largely explain the differences between satellite and in situ NO2 variations. In the post-epidemic era of 2021, satellite NO2 TVCD and in situ NO2 concentrations decreased by 10.42–64.96% and 1.05–34.99% compared to 2019, respectively, possibly related to the reduction of the transportation industry. This study reveals the changes of China’s urban NO2 pollution in the post-epidemic era and indicates that COVID-19 had a profound impact on human social activities and industrial production.

1. Introduction

Atmospheric nitrogen dioxide (NO2) is an important atmospheric pollutant. NO2 has a significant impact on human health [1,2]. In addition, NO2 plays an important role in the formation of ozone and secondary aerosols. Fossil fuel combustion is an important source of tropospheric NO2 concentration [3], which is therefore generally higher near cities. China is one of the most polluted countries in the world in terms of air pollution [4]. With the implementation of new emission regulations in 2011, the NO2 concentrations in China have rapidly decreased as seen from the long-term satellite and ground-based measurements [5,6,7,8].
Due to the COVID-19 outbreak in China in late 2019, China adopted strict lockdown measures on human and industrial activities. The restricted policies showed significant effects on air pollution. Various previous studies using satellite remote sensing, ground-based observations, and model simulations demonstrated reductions of atmospheric pollutants in China in early 2020 [9,10,11,12,13,14,15,16]. Compared to the 2019 Chinese New Year holiday, NO2 TVCD from TROPOspheric Monitoring Instrument (TROPOMI) decreased by 22–67% during the 2020 Chinese New Year in East China [17]. The downward trend is mainly due to the reduction in NOx emissions caused by the lockdown, by a total reduction of 36% in China from traffic sources [18,19,20], electricity and industrial sector [18]. Many previous studies have isolated the impact of COVID-19 lockdown on NO2 trends by chemical transport model simulations or statistics models [19,21]. However, there are systematic differences of NO2 variation between satellite and in situ measurements, e.g., 57% by in situ in He et al., 2021 [22] and 32% for satellite in Field et al., 2021 [23] during the lockdown period in 2020 compared to the overall mean of 2015–2019 in China. Additionally the current studies do not explain such difference well [24], possibly due to the lack of measurements of NO2 vertical profile.
With the advancement of medical aid and epidemic prevention measures, industrial production and social activities in China largely returned to normal in May 2020 and China entered the post-epidemic era [25]. There are limited studies that address the NO2 concentrations in the post-epidemic era. The changes of atmospheric NO2 concentration in the post-epidemic era compared with the pre-epidemic era and the influencing factors of such changes remain to be explored.
In this study, we used multi-platform NO2 observations from satellite remote sensing, in situ measurements, and ground-based multi-axis differential optical absorption spectroscopy (MAX-DOAS) measurements. The consistencies and differences in the temporal trends of tropospheric and near-surface NO2 concentrations were investigated in the epidemic and post-epidemic eras in China. The improved TROPOMI NO2 TVCD product by the University of Science and Technology of China (USTC) in this study showed a lower bias in the Chinese region, allowing for more accurate trend analysis [26]. MAX-DOAS observation builds a bridge between satellite and ground observation, verifies satellite data, and reveals the differences between satellite and in situ NO2 variations. A quantitative discussion on the NO2 trends for 11 megacities of China during 2019-2021 was performed. The variations in the NO2 concentrations in China in the post-epidemic era are compared with those in the pre-epidemic era, and the recovery in the industrial production or transportation sectors is analyzed to discuss the causes of the changes in the NO2 concentrations in the post-epidemic era.
The article is organized as follows. The data and methods used in this study are presented in Section 2. The main results are reported in Section 3. The conclusions are summarized in Section 4.

2. Materials and Methods

2.1. Study Area

The study area is mainly located in the eastern part of China. To better investigate the time series of urban NO2 concentration changes and the geographical differences, 11 typical cities in the region were selected for the numerical analysis. Their distribution is shown in Figure 1 and Table S1. The combination of different cities allows for the analysis of a typical region. Beijing, Tianjin, and Jinan represent the North China Plain; Shanghai, Nanjing, Hefei, and Hangzhou represent the Yangtze River Delta region; and Chengdu and Chongqing represent the Sichuan Basin. In addition, Wuhan, the city in which the epidemic was first detected [27], and Xi’an, a city representing the northwestern region, were included. These cities cover the different topographical regions of China and are representative of urban areas with high emissions of anthropogenic pollutants [28]. In addition, large cities have a larger number of ground monitoring stations and their average urban air pollutant values are easier to interpret.

2.2. Satellite Remote Sensing Data

In this study, atmospheric remote sensing data from the TROPOMI were used, which were recorded by the European Space Agency’s Sentinel-5P satellite (Sentinel-5 Precursor) launched in October 2017. The TROPOMI is the world’s most technologically advanced atmospheric monitoring spectrometer and has the highest spatial resolution. With an imaging bandwidth of 2600 km, it scans the globe daily at 13:30 local time with an imaging resolution of 7 × 3.5 km2 (increasing to 5.5 × 3.5 km2 after 6 August 2019) [29]. It is primarily used to observe trace gas components in the atmosphere around the globe, which are closely related to human activities, such as NO2, O3, SO2, HCHO, CH4, and CO, and to enhance observations of aerosols and clouds [30]. In this work, we adapted satellite NO2 retrieval algorithms of the GaoFen-5/EMI sensor (Zhang et al., 2020) to TROPOMI, referred to as “USTC (University of Science and Technology of China) TROPOMI NO2” hereafter [26,31]. The USTC product has a fit uncertainty of approximately 10% or less, with a systematic bias of up to 50% compared to ground-based MAX-DOAS remote sensing [31]. The TROPOMI Level 2 NO2 TVCD data obtained from the inversion calculations provides a qa_value for each pixel to indicate its observational quality [32]. For more details see Supplement Text S1. A filtering criterion (qa_value > 0.5) was used in this study to mitigate the effects of erroneous data in partial scenarios such as cloud cover or snow and ice cover [33,34]. In this study, the USTC level 2 NO2 data were re-gridded using the P-spline method to obtain level 3 raster data with a resolution of 0.01° × 0.01° [26]. The final result is called the USTC TROPOMI NO2 TVCD product. To validate the performance of this product, official TROPOMI Level 2 OFFL NO2 tropospheric column concentration data (archived at https://s5phub.copernicus.eu/dhus/#/home (accessed on: 31 May 2021)) were used in this study and processed into a Level 3 product.

2.3. Ground-Based Monitoring Data

The in situ monitoring data used in this study were obtained from the China Environmental Observation Network operated by the China National Environmental Monitoring Centre, which is archived at http://www.cnemc.cn/en/ (accessed on: 31 May 2021), data monitoring network constructed in 2013 as part of the Clean Air Action Plan [35]. The website provides hourly values, hourly moving averages, and 24 h averages of ground-level of PM2.5, PM10, NO2, SO2, O3, and CO concentrations for cities and stations in China. Specific technical specifications and reliability parameters can be found in [7,36]. Urban NO2 daily average data from December 2018 to May 2021 was used in this study. The data was calculated by averaging hourly NO2 data from all stations within each city.

2.4. MAX-DOAS Data

The MAX-DOAS NO2 data used in the study were obtained from the Chinese Land-based Hyperspectral Stereo Remote Sensing Network established by the University of Science and Technology of China [37]. The network consists of 34 standard stations covering different regions in China, mainly concentrated in northern and eastern China. The network enables the continuous three-dimensional detection of atmospheric constituents over China and thus compensates for the fact that ground-based monitoring only yields ground-level pollutant concentrations. In this study, MAX-DOAS NO2 measurements with a temporal resolution of 15 min and a vertical resolution of 100 m were used. The retrieval accuracy of NO2 slant column densities is 7 × 10¹⁴ molecules/cm2 [37,38]. Data from the Chinese Academy of Meteorological Sciences (CAMS) site (116.32°E, 39.94°N) located in Beijing were mainly selected to analyze the correlation between satellite remote sensing observations and ground-based monitoring data.

2.5. Methods

In this study, spatial and temporal analyses of atmospheric NO2 concentrations in Chinese cities were conducted at different time scales using different data products. At the spatial scale, the mean urban NO2 TVCD values obtained from satellite remote sensing observations were averaged over all gridded data within that urban area. The size of the urban area used in this study was selected to be 1° × 1° to focus on the analysis of pollution in the urban area. The ground stations were also concentrated within this area. To better understand the spatial and temporal distribution of NO2 in China, the seasonal averages of the atmospheric NO2 concentrations were analyzed in this study, covering spring (March, April, and May), summer (June, July, and August), autumn (September, October, and November), and winter (December, January, and February). The effects of the COVID-19 lockdown and Chinese New Year are also discussed. At the temporal scale, the period was divided into five equal intervals, P1 (15 days before the Chinese New Year), P2 (15 days during the Chinese New Year), P3 (0–15 days after the Chinese New Year), P4 (15–30 days after the Chinese New Year), and P5 (30–45 days after the Chinese New Year) using the Chinese New Year and Chinese New Year holiday as criteria. The correspondence of these five periods in terms of the specific dates is shown in Figure S1.
To compare the differences in the NO2 concentrations between different periods in the same region, the percentage change in NO2 concentrations was calculated for each city during the five phases of the study. Pre-epidemic NO2 concentrations in each city were used as baseline concentrations to discuss the relative percentage change in NO2 concentrations during the COVID-19 lockdown and the post-epidemic era. In addition, the correlation between the satellite remote sensing NO2 TVCD and ground-based observation of NO2 concentration was determined in this study using linear regression fitting. The correlation coefficient R and root-mean-square error (RMSE) of the fit were calculated.

3. Results and Discussion

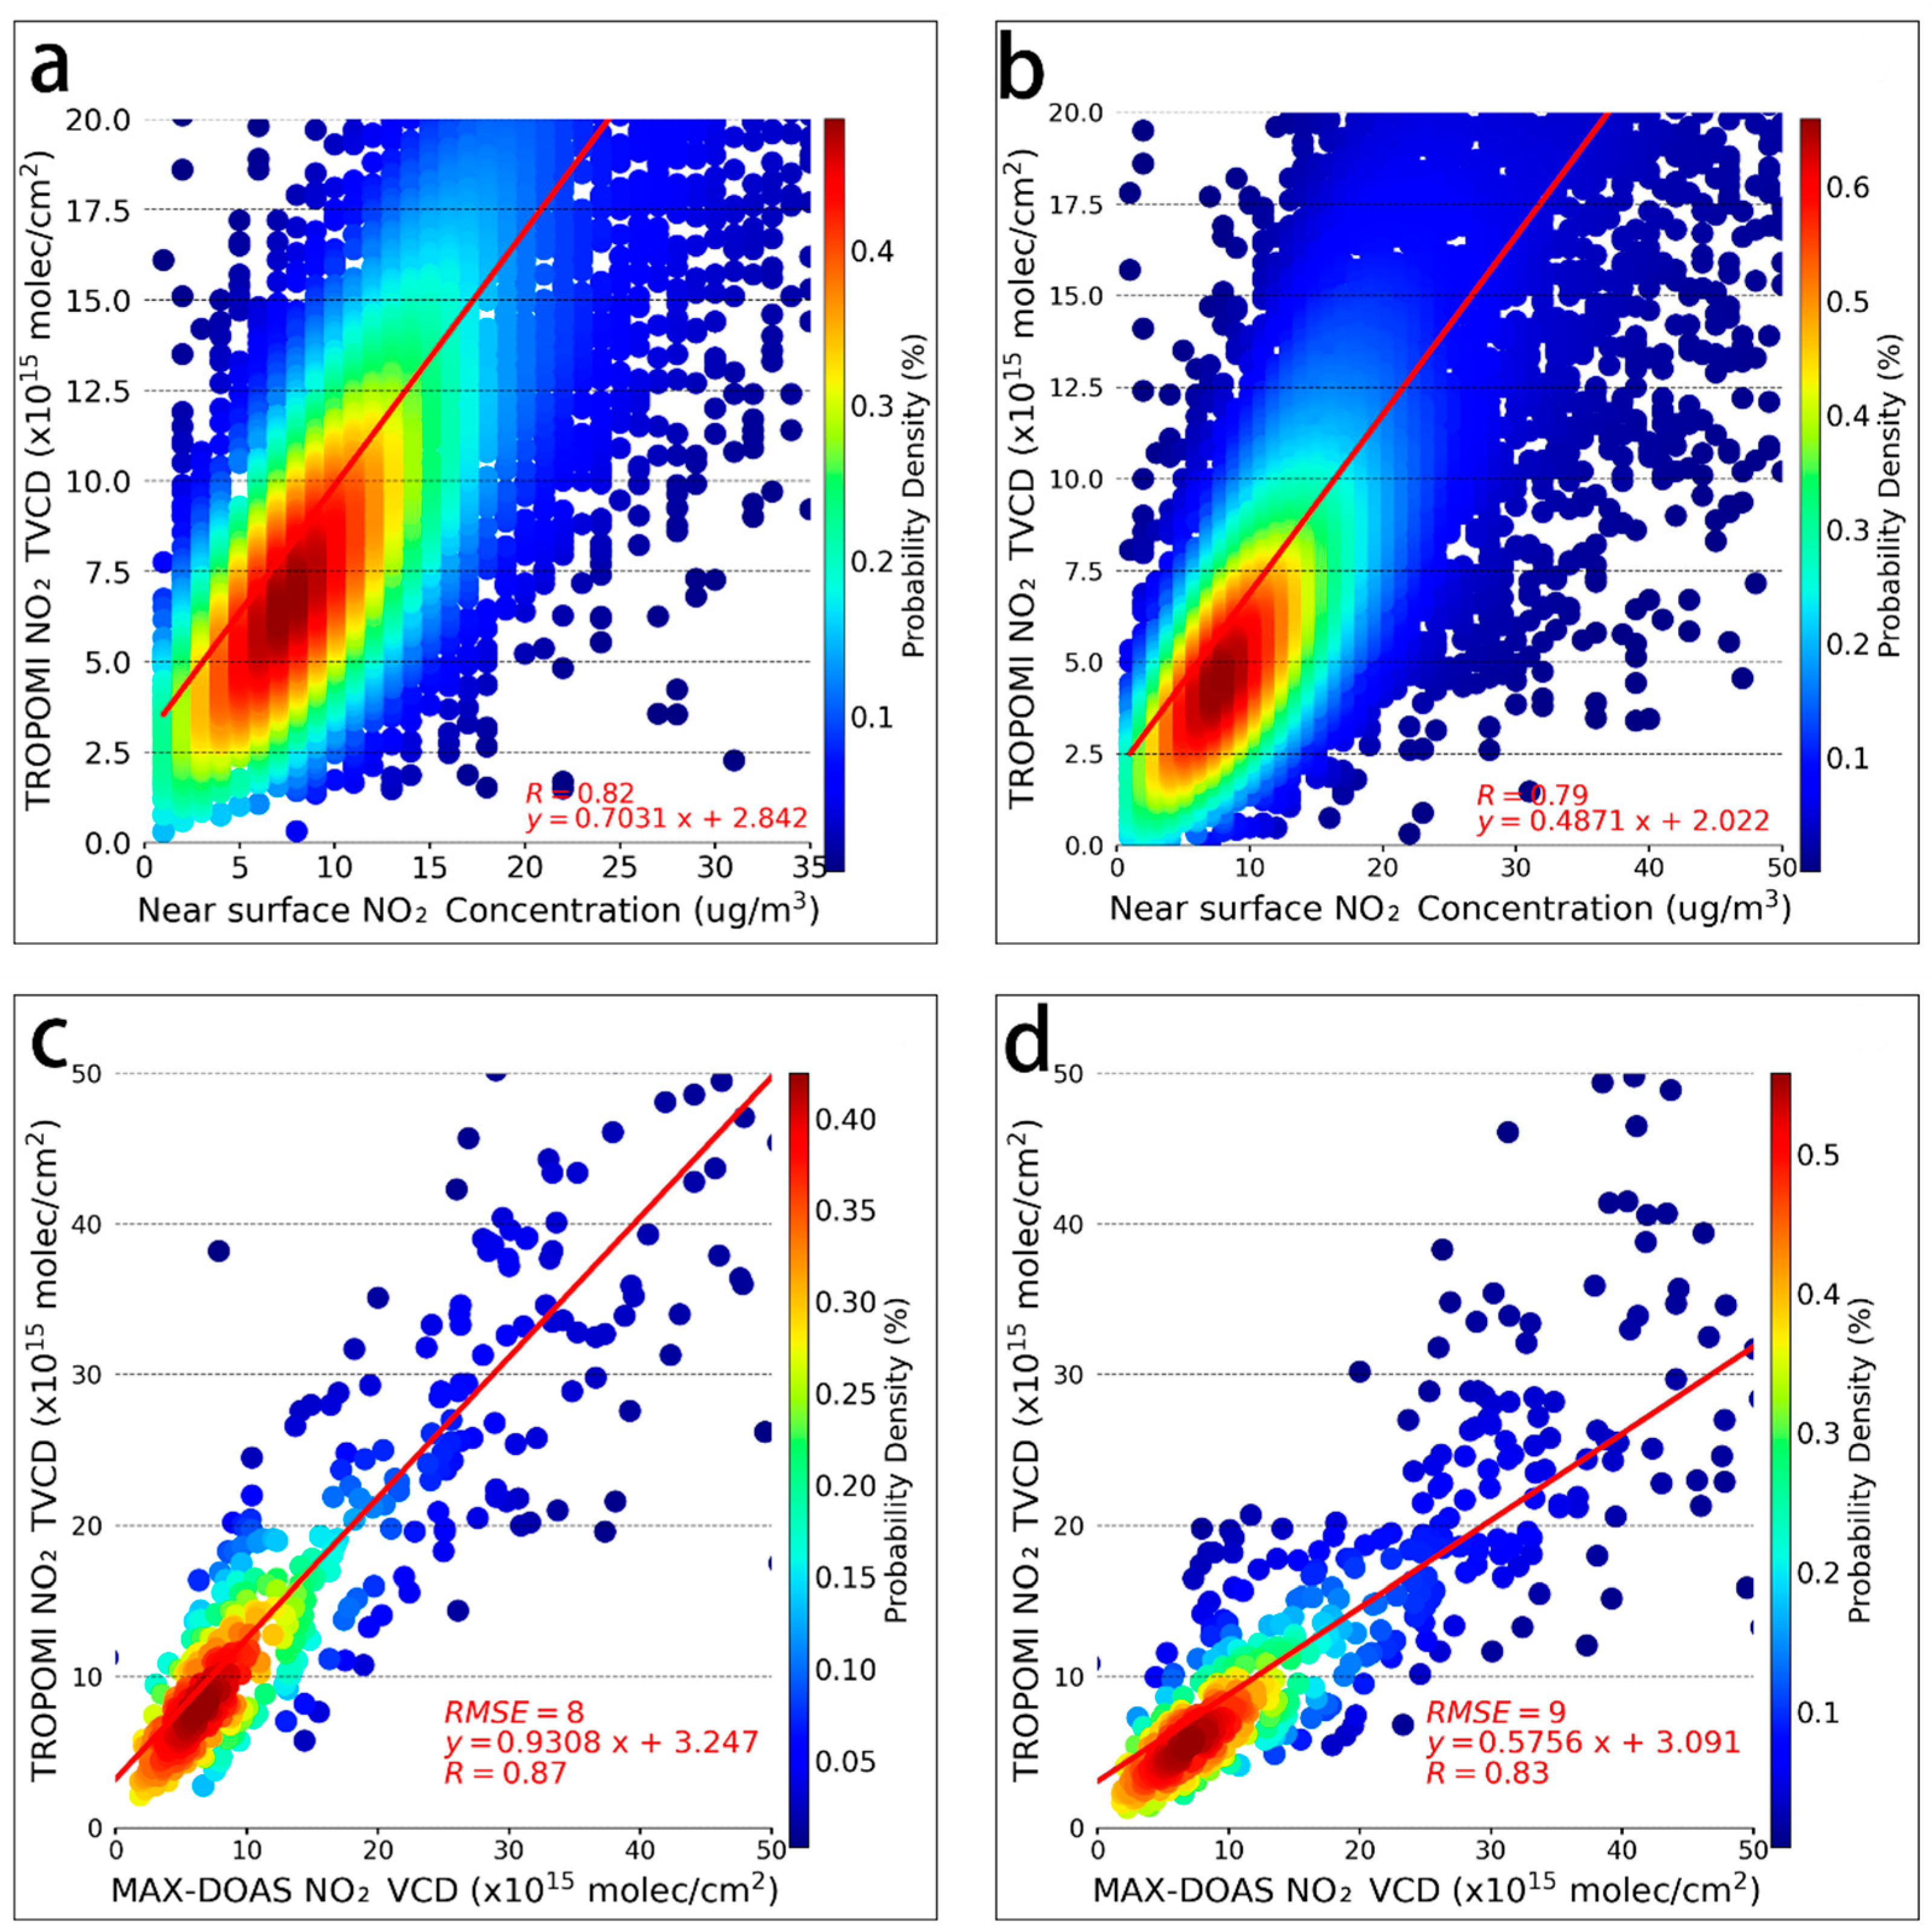
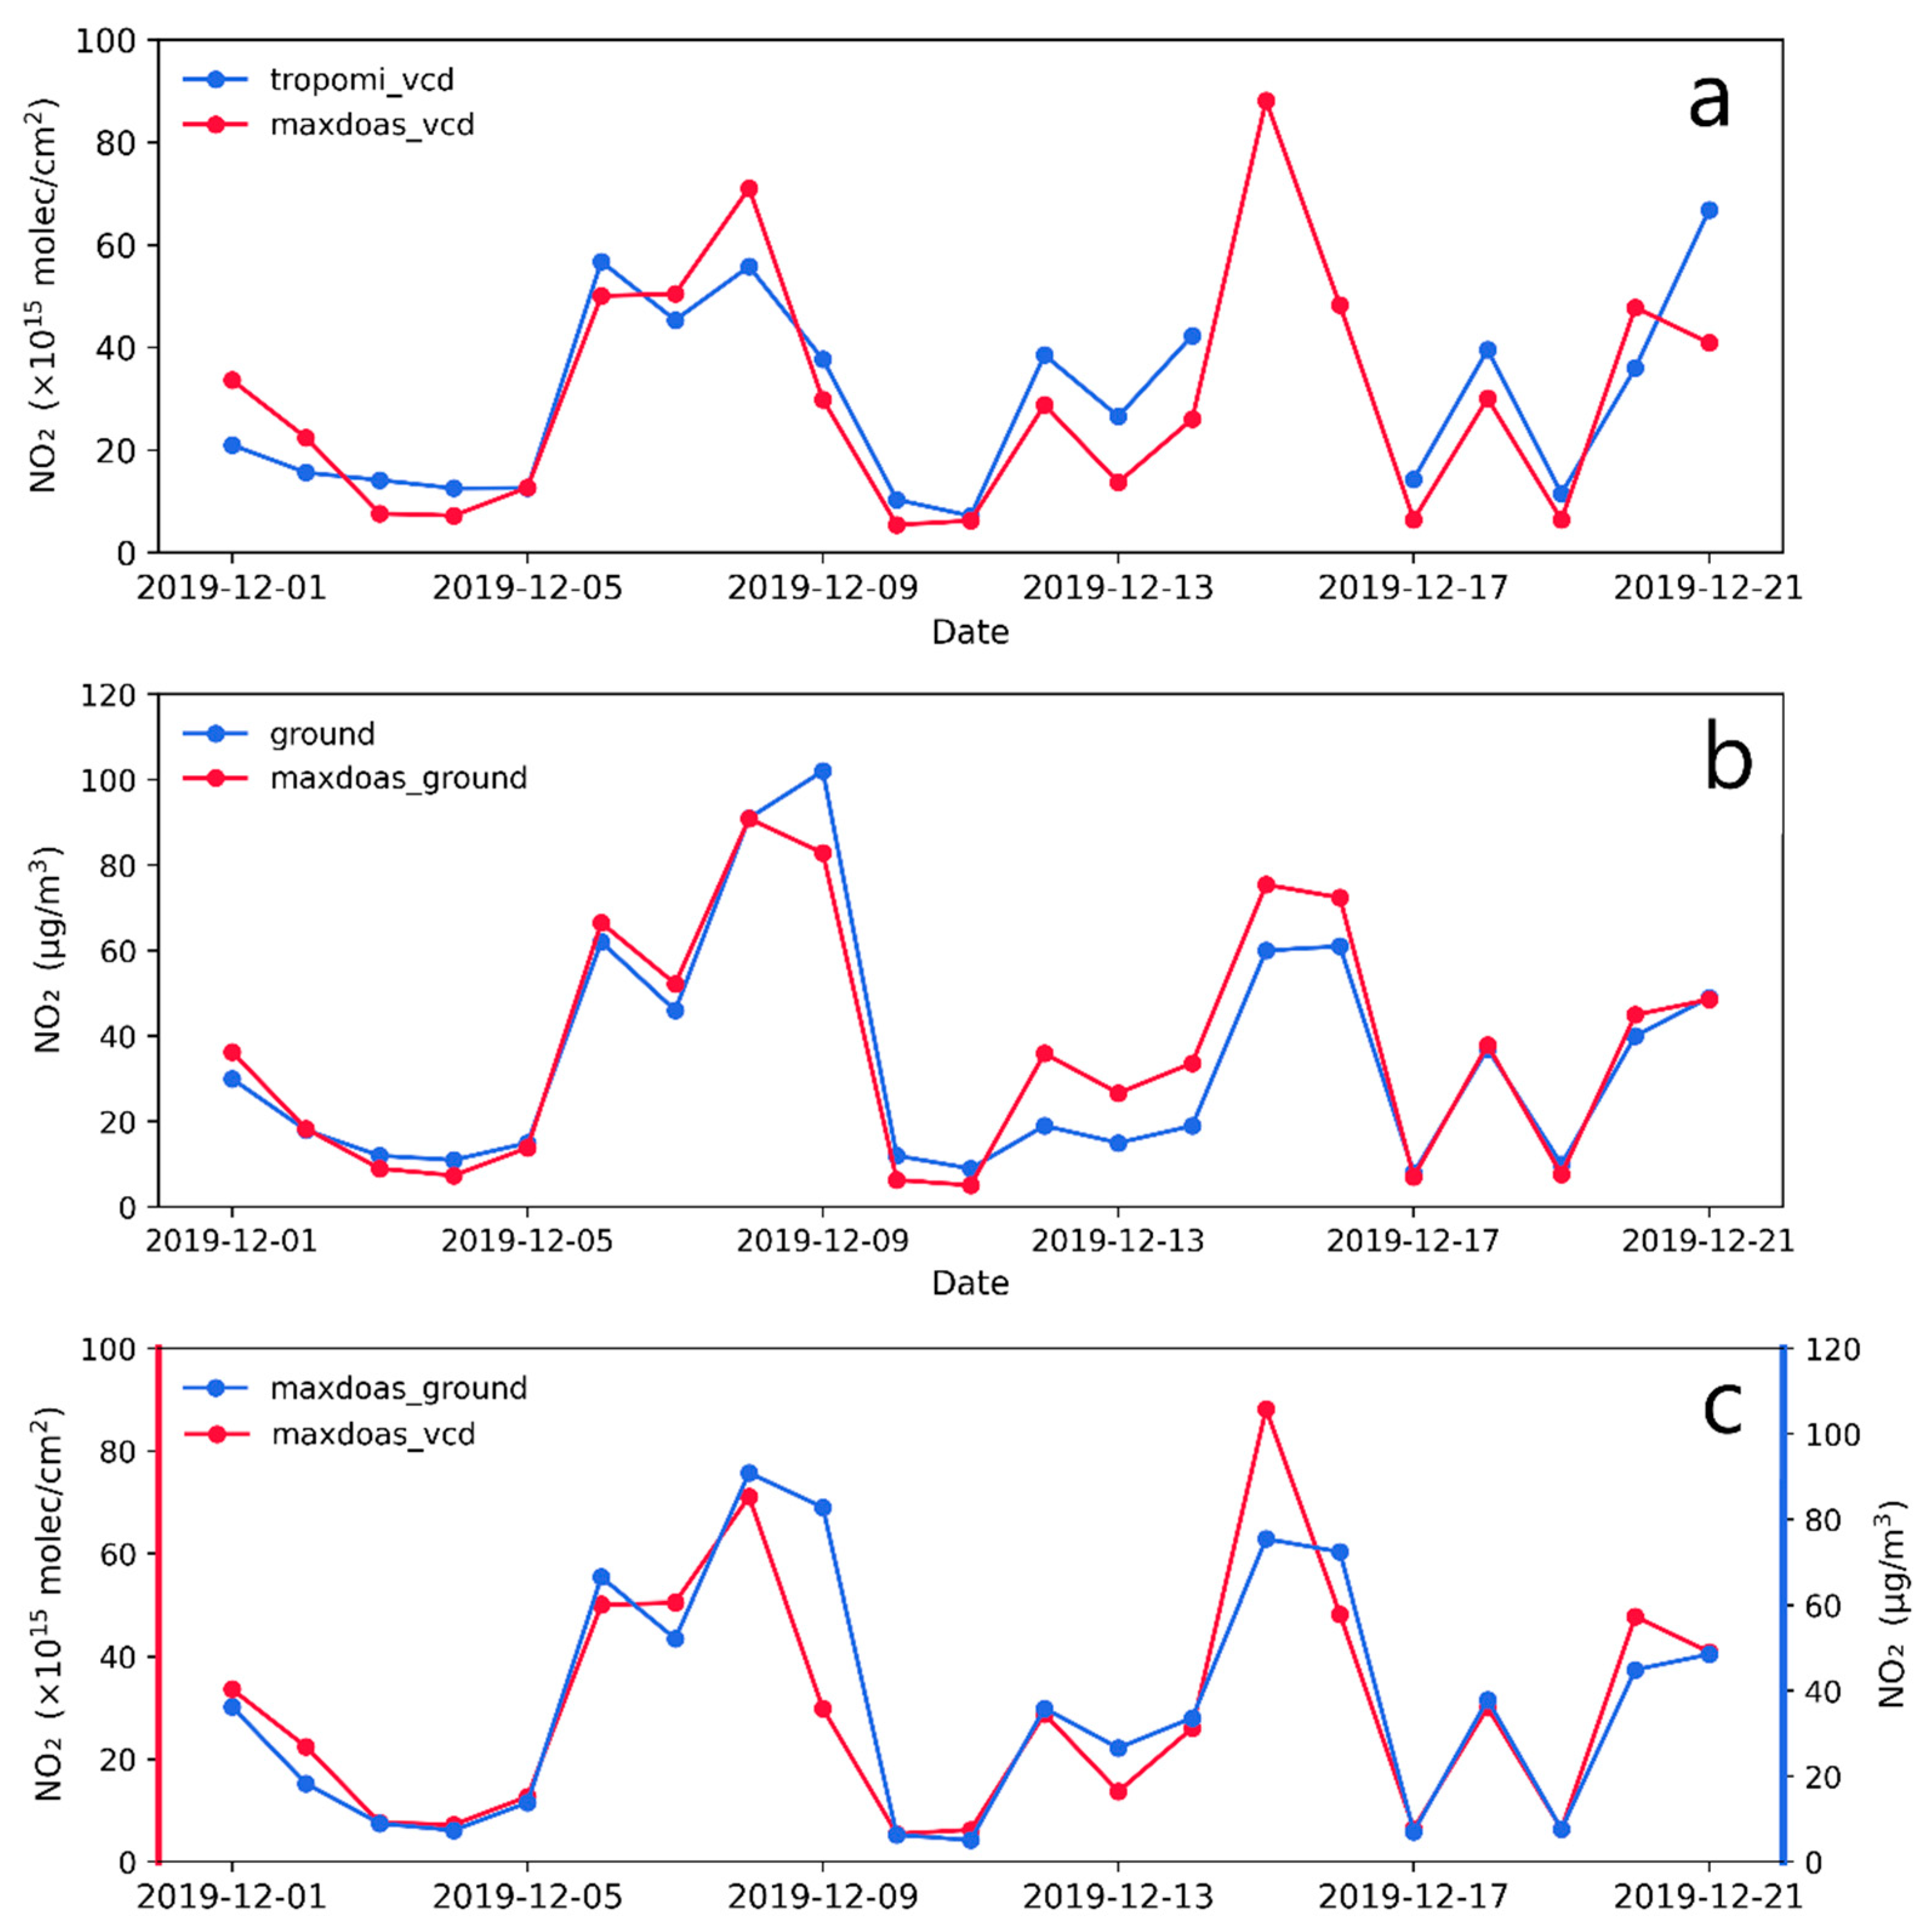
3.1. Satellite and Ground Correlation Analysis

It has been demonstrated that the NO2 TVCD obtained from satellite remote sensing observations and NO2 concentrations derived from ground-based stations are consistent, which may be due to their similar sources [39]. To quantify the link between tropospheric and terrestrial NO2 contents and assess the performance of the USTC NO2 TVCD product, the correlations between them were calculated at the station scale for the period December 2018 to May 2021. When calculating the correlation between the two sites, the average value of all pixels within the 0.05 radius of the longitude and latitude of each site was used as NO2 TVCD. Because the transit time of TROPOMI is 13:30 local time, the NO2 TVCD of the TROPOMI was calculated and compared with the NO2 concentration obtained at 14:00 local time at the ground level. The final results are shown in Figure 2a,b. Taking Beijing as an example, the TROPOMI NO2 TVCD and ground-level NO2 concentrations show a good correlation. The USTC NO2 TVCD product shows a slightly stronger correlation with ground-level NO2 concentrations at the site scale than the official NO2 TVCD product (R = 0.79), with a correlation coefficient of R = 0.82. The higher performance of ground-based validation for the USTC products may be explained by the algorithm improvements of the NO2 retrieval configurations especially the update of high-resolution a priori NO2 profiles in the local domain [26,32].
In addition, the differences in the correlation between NO2 TVCD and ground-level NO2 concentrations between different cities were explored based on the USTC NO2 TVCD product. The strongest correlation between the NO2 TVCD and ground-level NO2 concentrations in an urban context was observed in Beijing, with a correlation coefficient of R = 0.82. The lowest correlation was obtained for Chengdu, with a correlation coefficient of R = 0.65. Such difference can be related to the systematic differences of NO2 vertical inhomogeneities and horizontal representativeness in different cities, which were possibly caused by meteorological and geological characteristics [40]; for example, cloudy weather, which is common in the Sichuan Basin, leads to a weaker correlation.
As industrial and traffic emission sources are mainly near the ground level, the urban atmospheric NO2 has an overall exponential distribution in the vertical direction, as evidenced by the MAX-DOAS vertical profile data [37,41]. Therefore, the correlation between the TROPOMI NO2 TVCD and NO2 concentrations at ground level stations is strong. However, the NO2 TVCD and ground NO2 content do not match well. Apart from differences in the time scale and spatial resolution, this mismatch may be related to the vertical distribution of atmospheric NO2.
In this study, MAX-DOAS data from the CAMS site ~3 km away from the ground monitoring site 1006A in Beijing were selected for comparison. The MAX-DOAS data were averaged over all data from 13:00–14:00 local time. The TROPOMI NO2 TVCD product was first validated using the MAX-DOAS data. The results show that the USTC NO2 TVCD product has a better agreement with the MAX-DOAS product than the official NO2 TVCD product, with a higher correlation coefficient and slope, as shown in Figure 2c,d.
Figure 3a shows the time series of TROPOMI NO2 TVCD and MAX-DOAS NO2 tropospheric vertical column density (VCD) from 1 to 21 December 2019, which indicates a good agreement. The site-monitored NO2 concentrations in Figure 3b are in good agreement with the MAX-DOAS contour bottom data of NO2 concentrations. Figure 3c shows the comparison between the MAX-DOAS VCD and the concentration at the bottom of the profile. On certain days, differences between the two can be observed. Several areas of China, such as Beijing, may be affected by high-altitude transport, which can lead to the concentration of NO2 in the upper atmosphere. This pollution cannot be captured by ground-based stations, resulting in the difference between the two observations [42]. In a few days on which the two observed trends differ, the vertical profile of MAX-DOAS in Figure S2 shows NO2 transport at high altitudes. From 13:00 to 14:00 local time during the satellite transit, high NO2 concentrations are concentrated in the atmospheric altitude layer between 400 and 700 m above the ground level, whereas the near-ground level NO2 concentrations are relatively low. This NO2 pollution situation can be captured by the NO2 TVCD obtained from satellite remote sensing monitoring, but it cannot be observed by ground-based monitoring stations.

3.2. Historical Spatial and Temporal Distribution of Atmospheric NO2 Concentrations in China

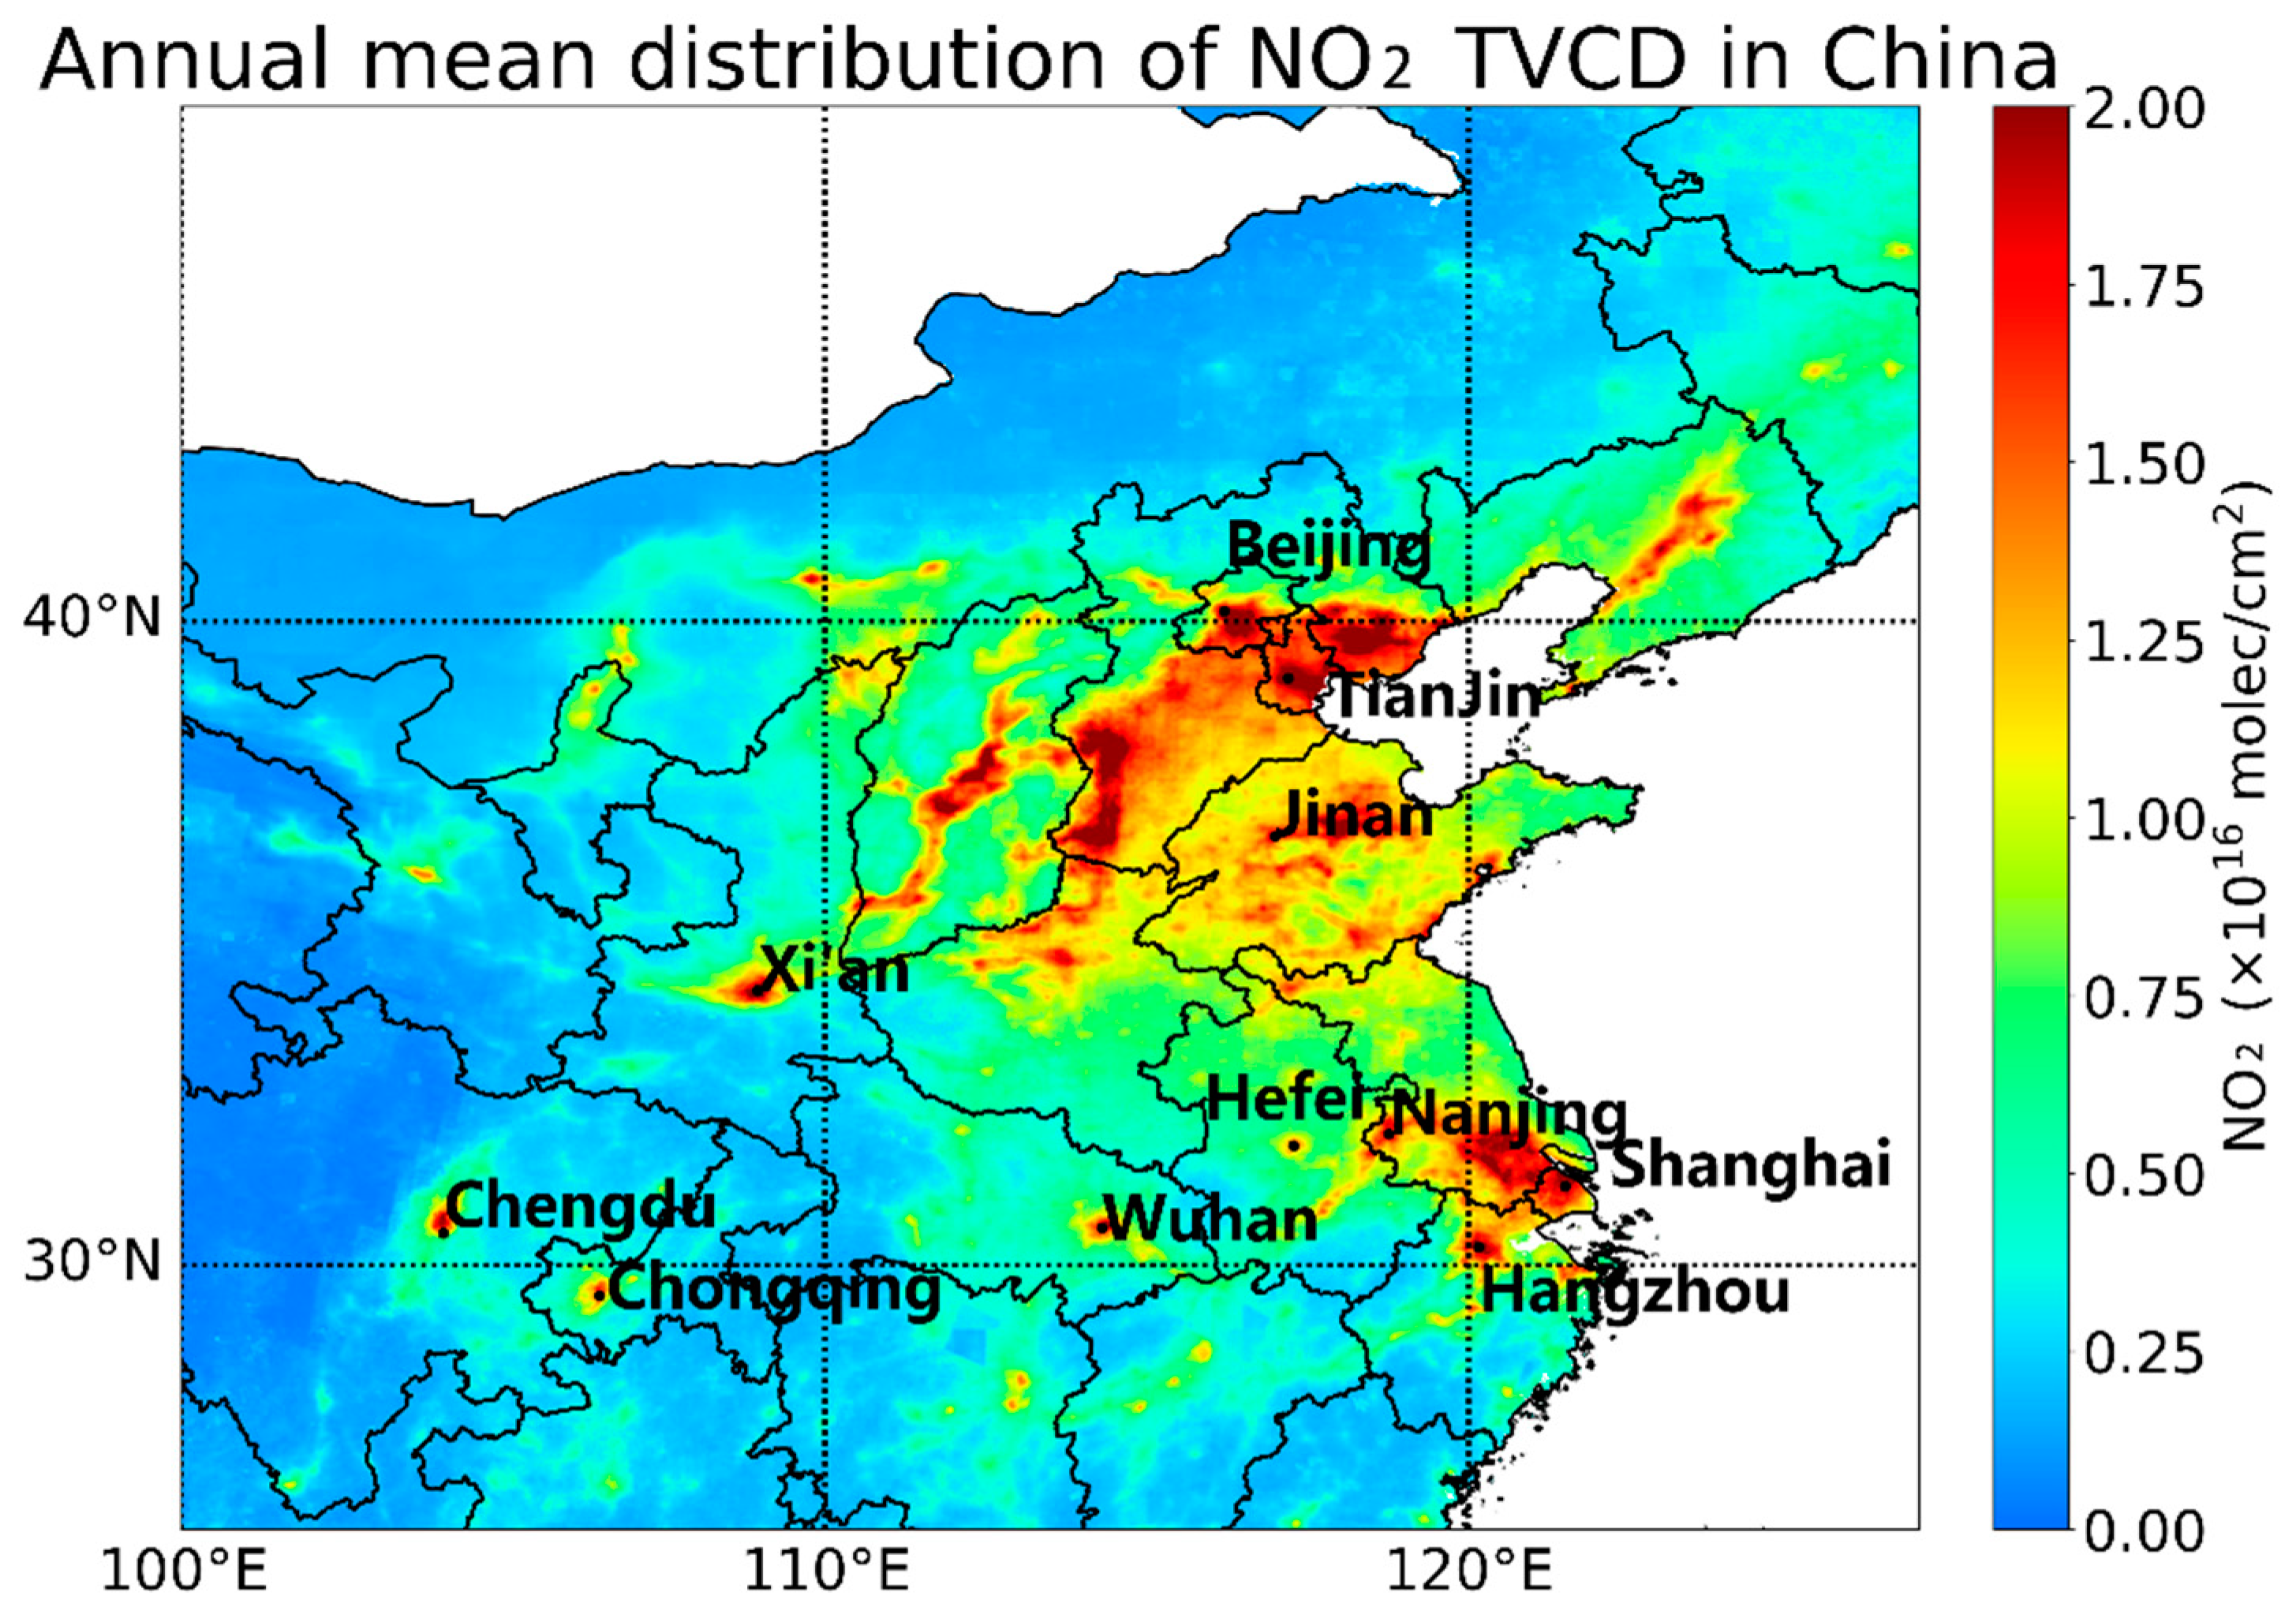
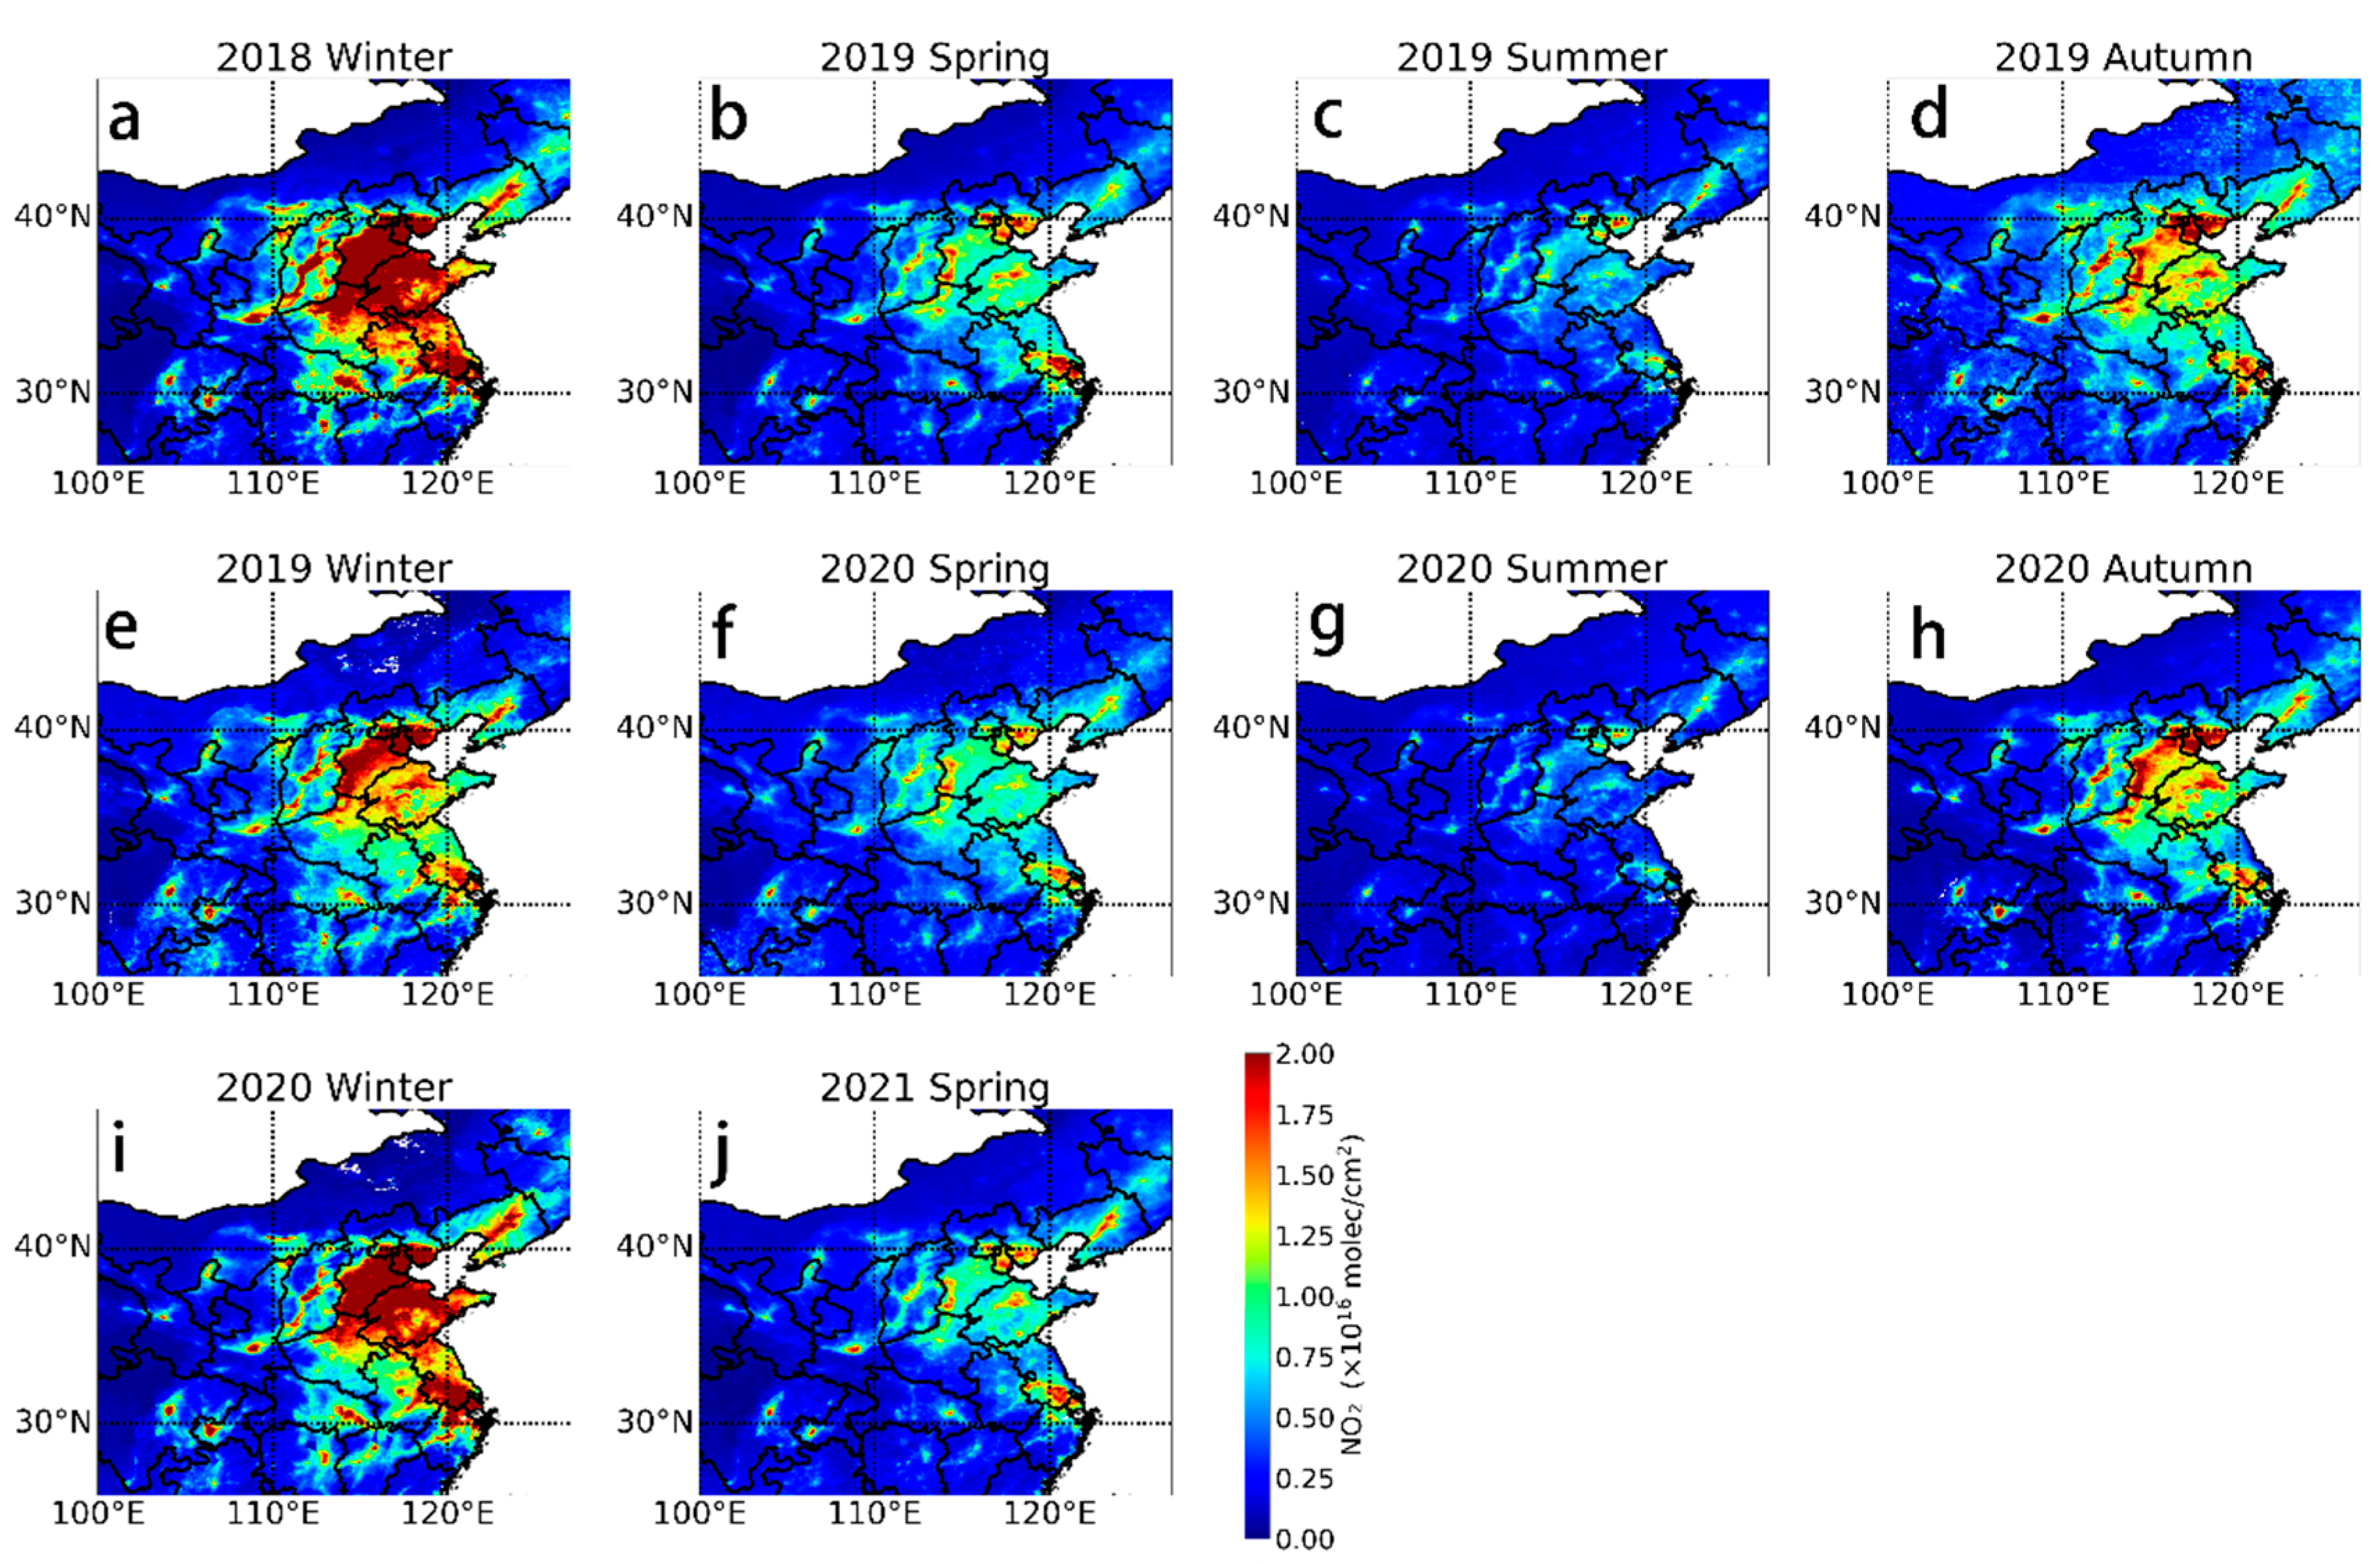
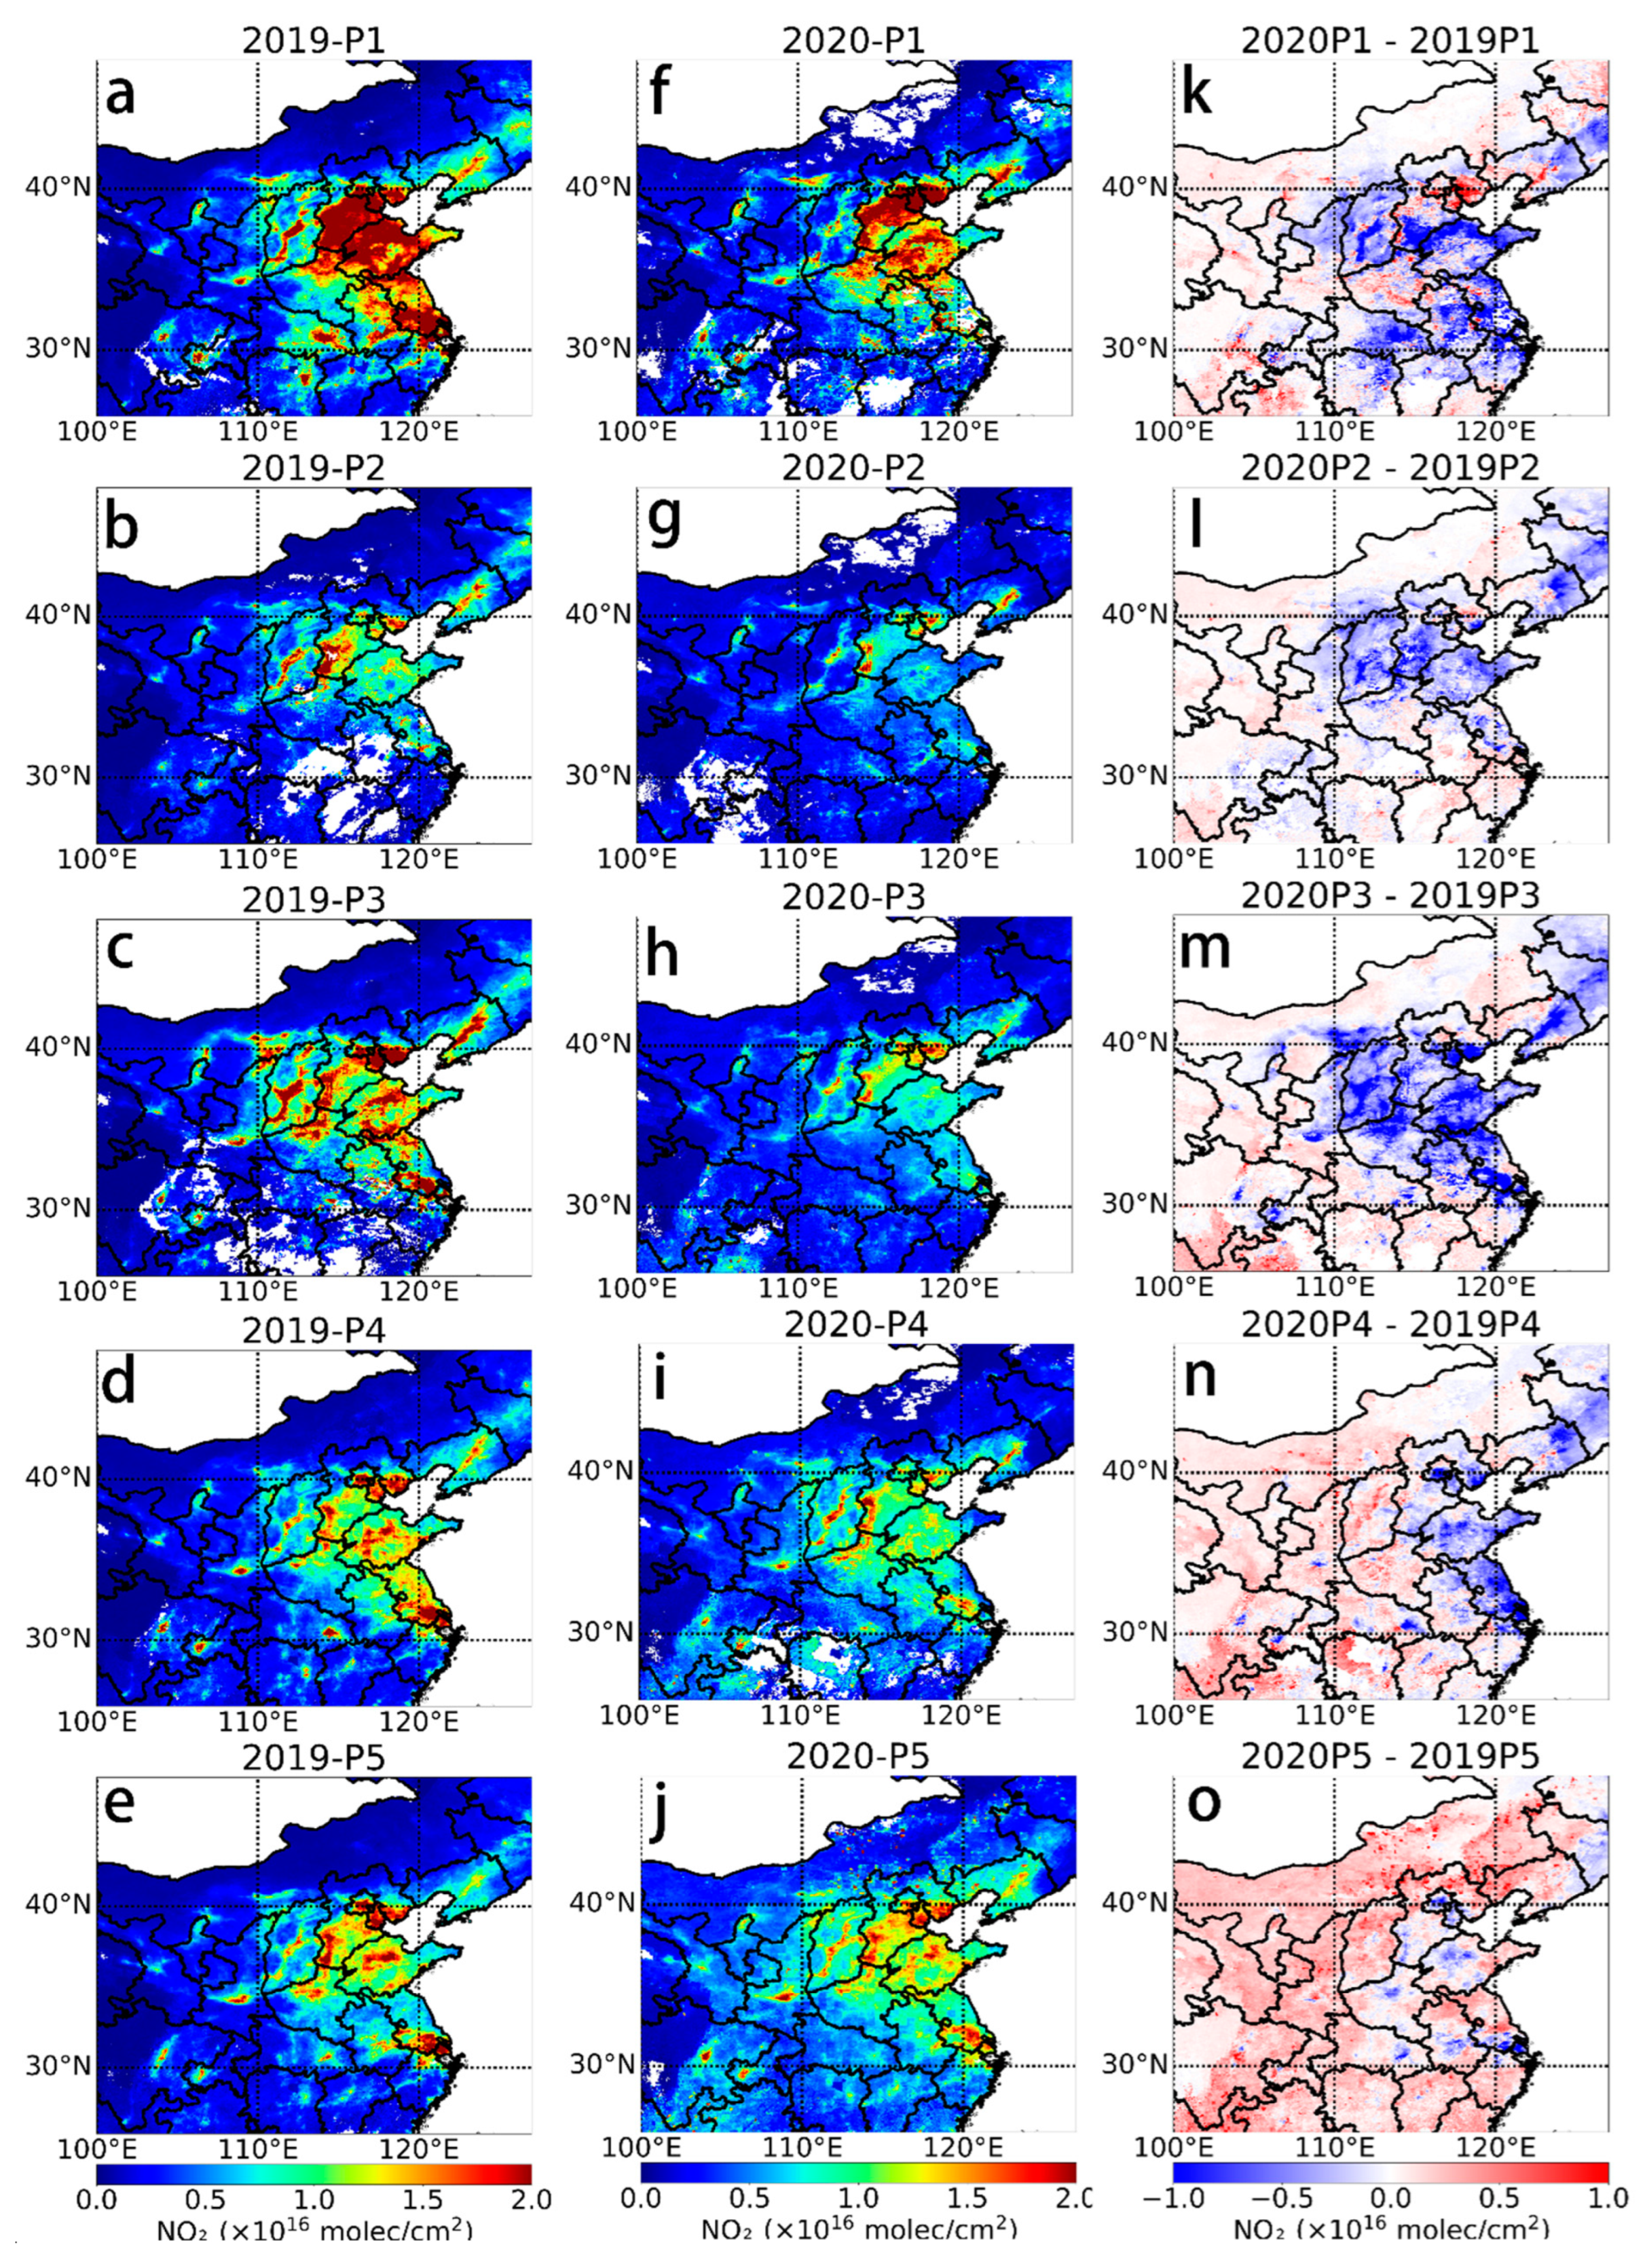
3.2.1. Spatial and Temporal Analysis of the NO2 TVCD Based on Satellite Remote Sensing

We analyzed the spatial and temporal distribution of the atmospheric NO2 for typical Chinese megacities during 2019–2021. Satellite remote sensing has the advantages of wide-area coverage and high data consistency on the spatial scale [43]. It is an important method for assessing the regional distribution of atmospheric pollutants and their change patterns. The analysis of NO2 in eastern China using the TROPOMI NO2 TVCD product can be used to accurately assess the trend of the NO2 TVCD in China since December 2018. The TROPOMI NO2 TVCD data used in this study are level 3 raster data with a spatial resolution of 0.01° × 0.01° (after re-gridding points) and have low instrumental noise and thus can reveal NO2 distribution information at local and regional scales.
Figure 4 shows the seasonal average distribution of NO2 TVCD in eastern China from December 2018 to May 2021. Spatially, the highest NO2 concentrations can be observed in the North China Plain and Yangtze River Delta region as well as in the Sichuan Basin and in cities such as Wuhan and Xi’an, which is due to the population and industrial distribution in China. The seasonal distribution of the NO2 TVCD shows a clear seasonal cycle, with the highest and lowest NO2 concentrations in winter and summer, respectively. This is associated with the increased anthropogenic emissions in urban areas of China during the winter due to industrial emissions and heating, in addition to winter weather that is unfavorable for NO2 dispersion. The lower winter temperatures and the lower intensity of shortwave radiation result in a lower intensity of NO2 photochemical reactions. Affected by the lockdown policy of COVID-19, the average NO2 TVCD in the three typical cities in the North China Plain in winter 2019 and spring 2020 was 1.70 × 10¹⁶ and 9.57 × 10¹⁵ molecules/cm2, respectively, a decrease of 16.48% and 17.85% compared with that the year before. The average NO2 TVCD of the four typical cities in the Yangtze River Delta during these two seasons was 1.16 × 10¹⁶ and 9.19 × 10¹⁵ molecules/cm2, respectively, representing an annual decrease of 24.39% and 12.15%, respectively.
The time series of monthly mean values of NO2 TVCD from December 2018 to May 2021 for selected cities in China is shown in Figure S3. It was significant that an abrupt reduction happened between Jan–Feb for each year in Figure S3, possibly related to the NOx emission reductions around the Chinese New Year. It also can be seen that the NO2 TVCD in each city significantly decreases from February 2020 onwards, which is due to the COVID-19 lockdown. The changes in the NO2 concentrations at higher temporal resolution for each major city before and after the COVID-19 lockdown will be discussed in detail below.

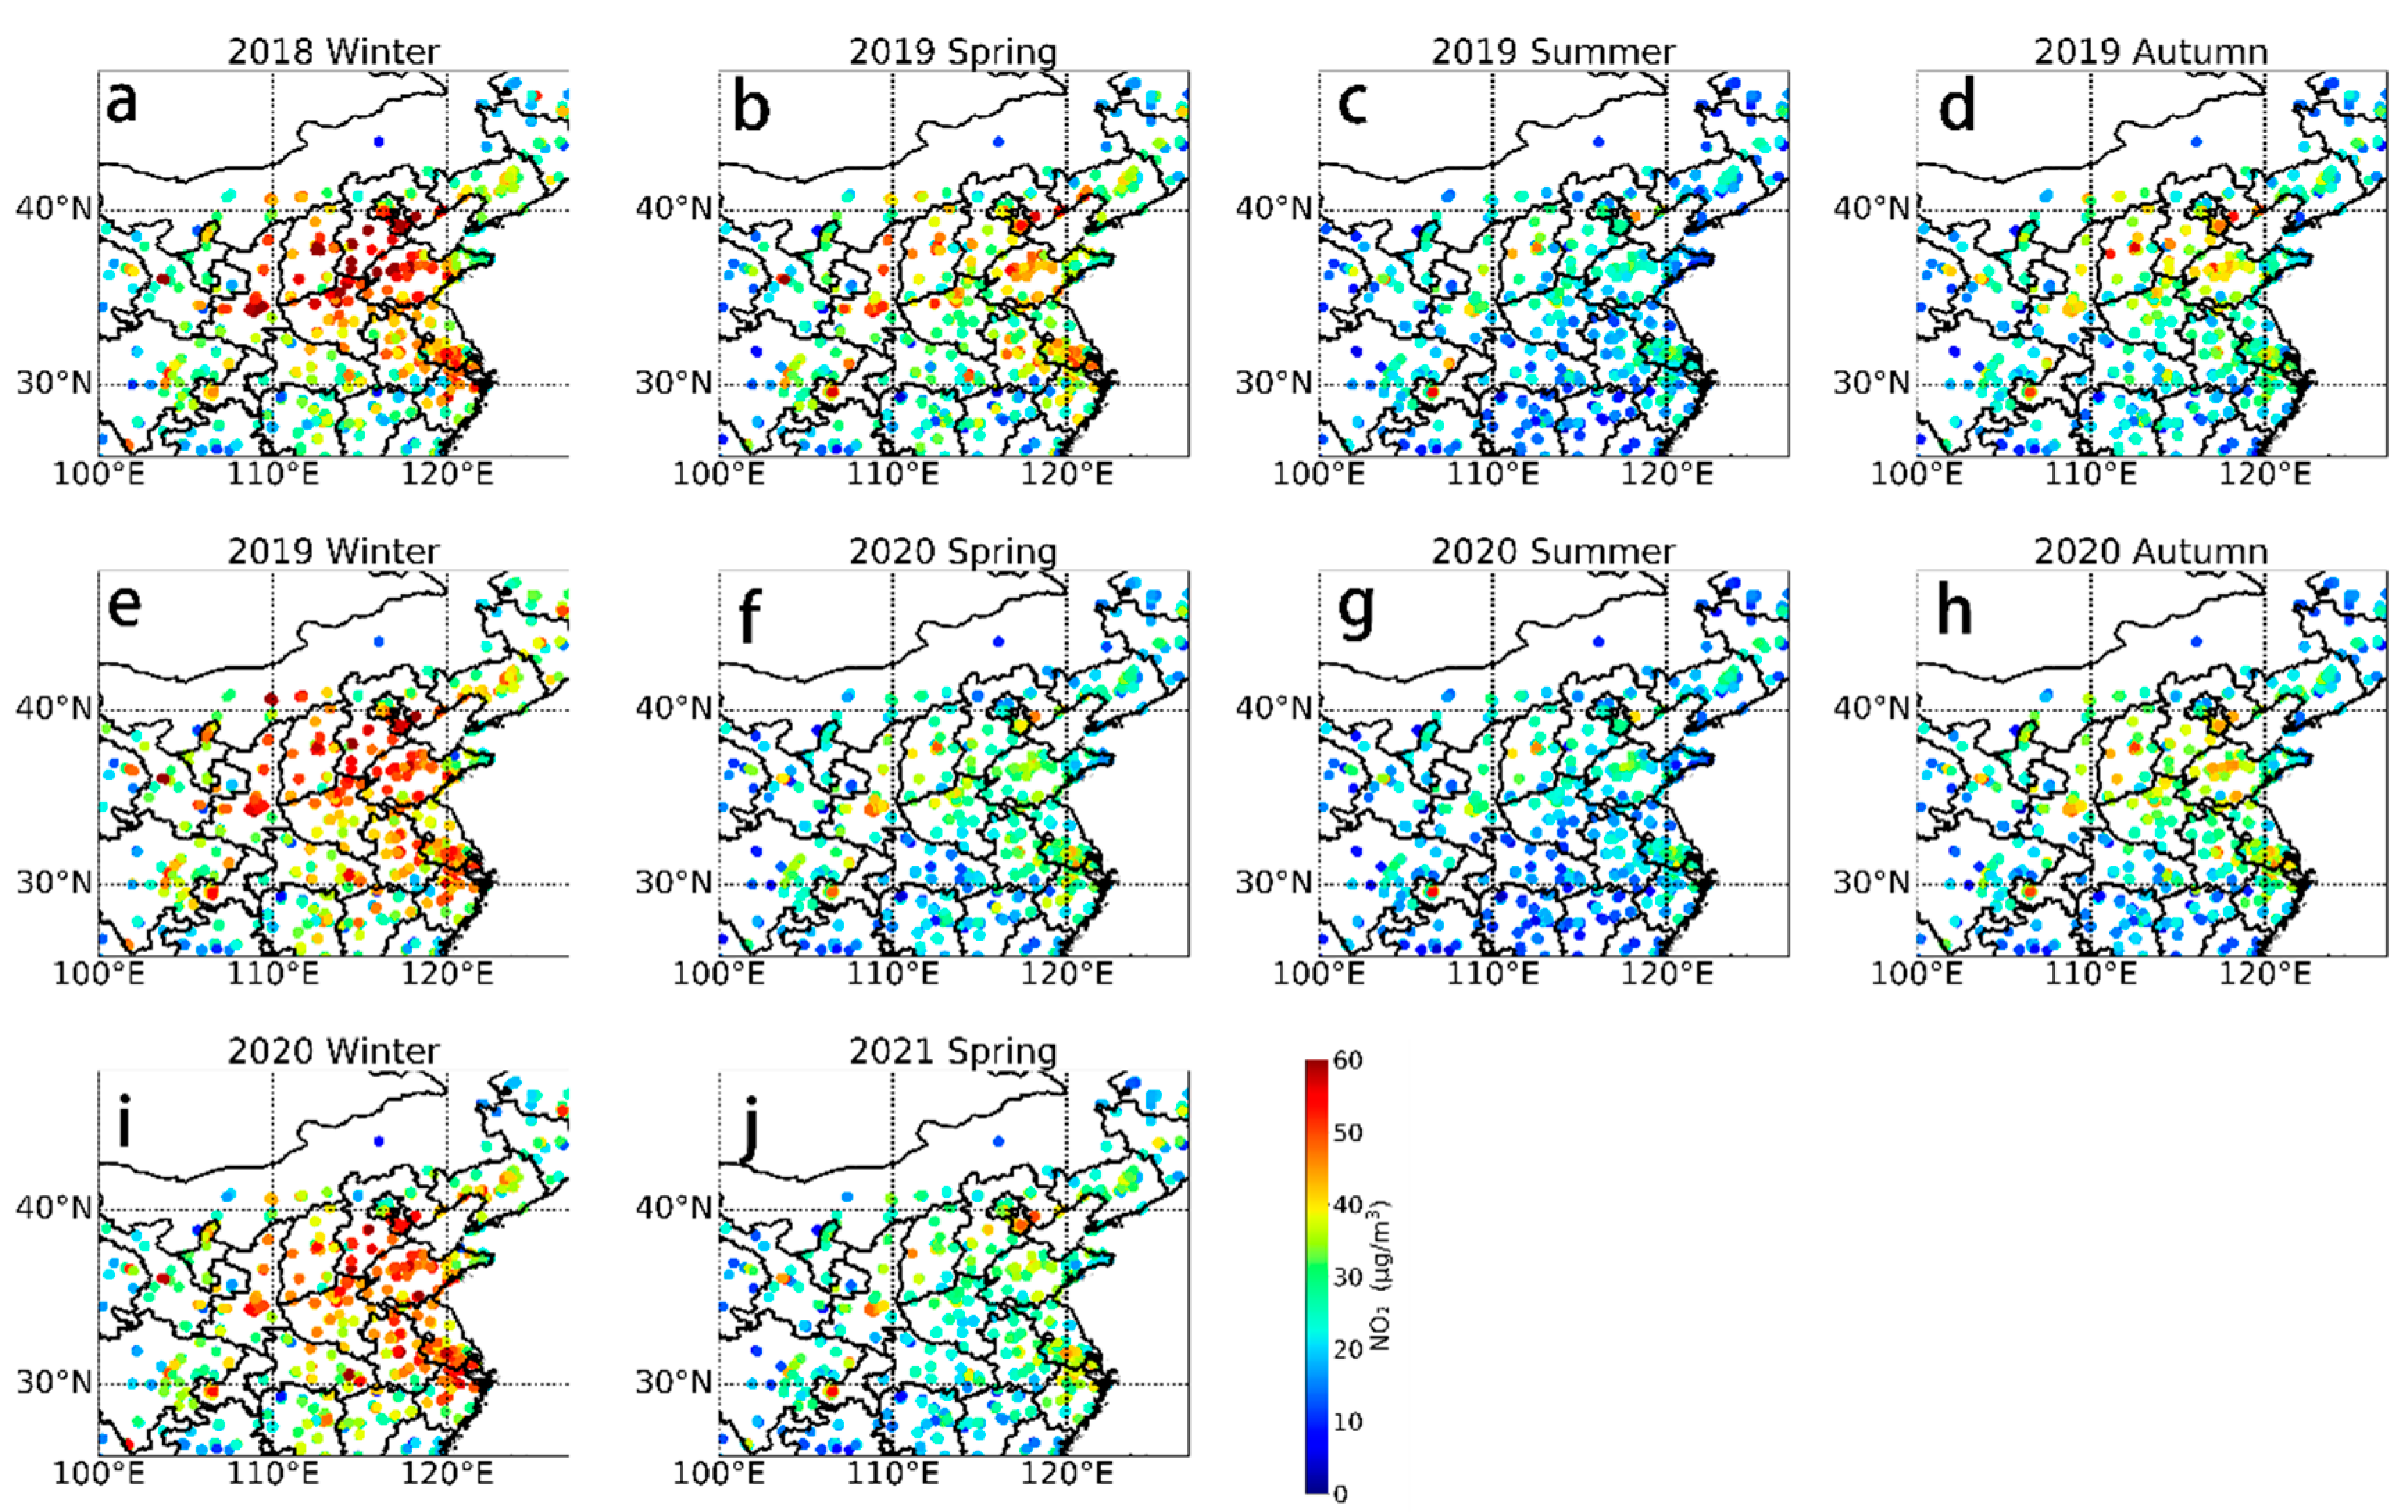
3.2.2. Spatiotemporal Distribution of Near-Surface NO2 Concentrations

Near-surface NO2 concentrations can be obtained from ground-based station observations [44]. Compared with the NO2 TVCD from satellite remote sensing, near-surface NO2 concentrations better reflect the intensity of anthropogenic emission sources such as traffic emissions [45]. In addition, although ground station observations reflect limited spatial information, they have a higher temporal resolution (raw temporal resolution of 1 h) such that their daily averages can reflect changes in the ground-level NO2 concentrations over time, allowing for a better representation of long-term trends. Figure 5 shows the seasonal average distribution of NO2 at ground stations in eastern China from December 2018 to May 2021, which is consistent with the results of the satellite observations. The ground-level NO2 concentrations are the highest and lowest in winter and summer, respectively.

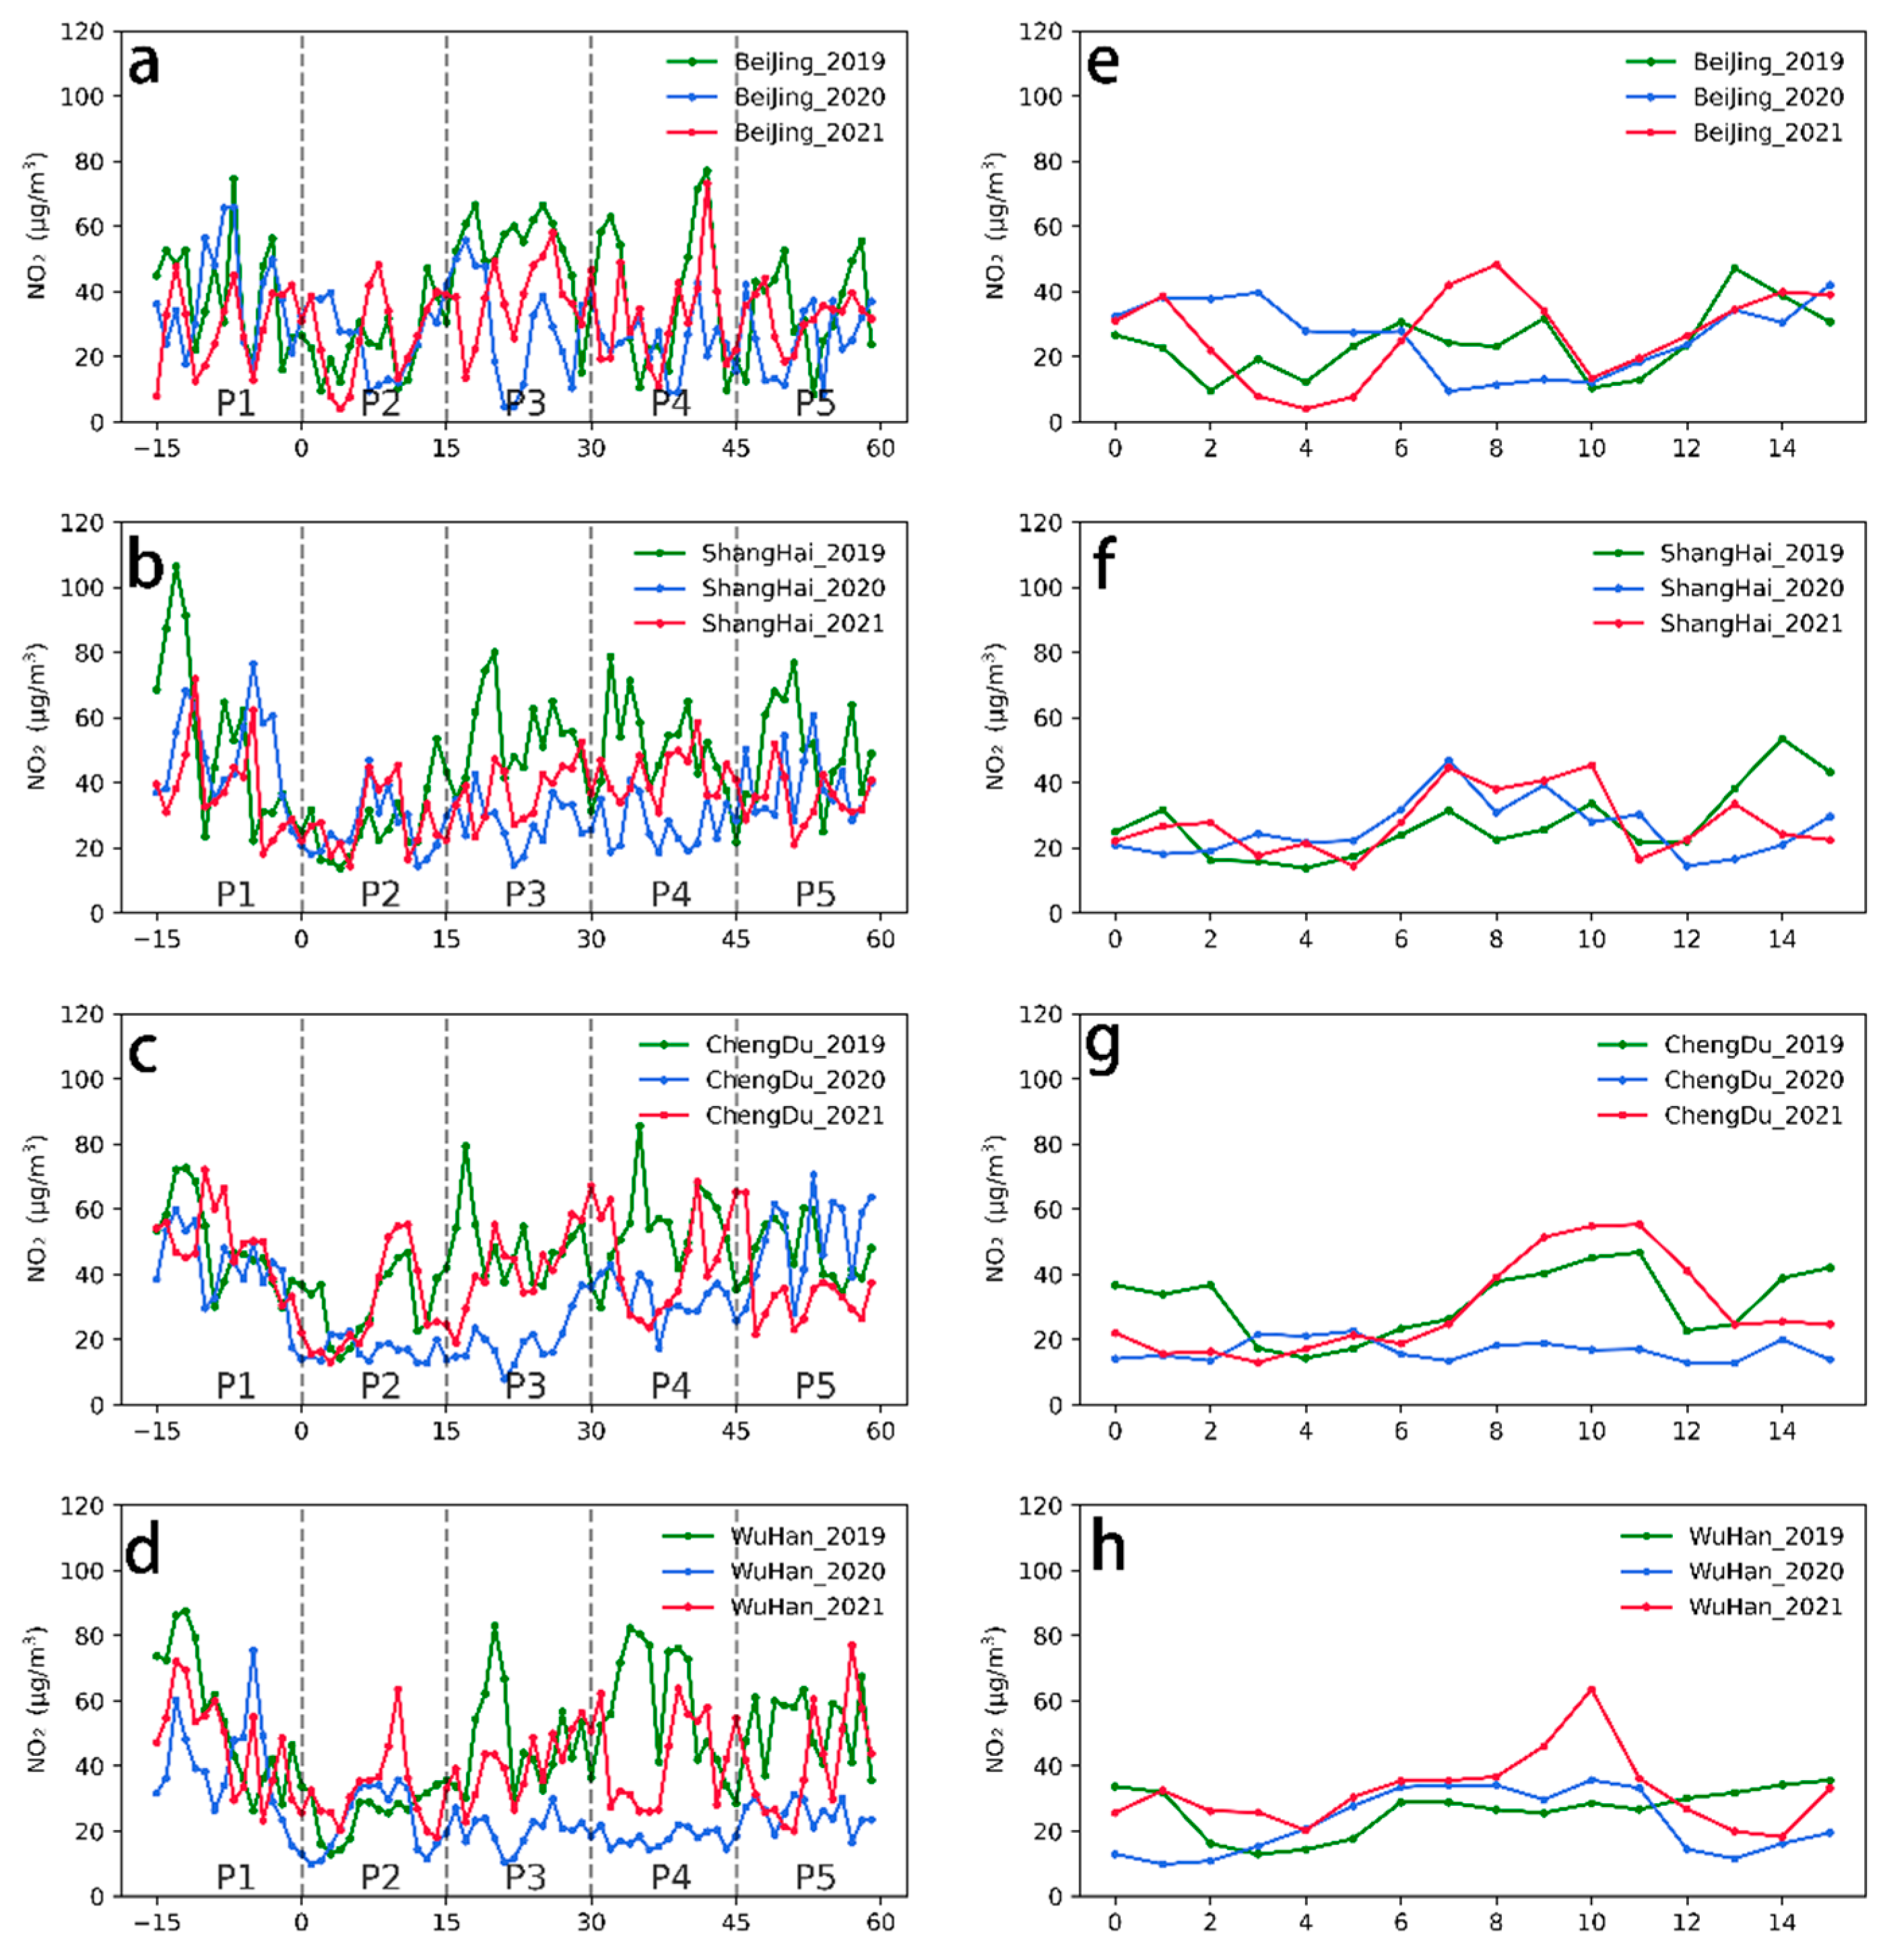
3.3. NO2 Changes during the COVID-19 Lockdown

Based on the results in Section 3.2, the NO2 decline in 2020 due to the COVID-19 lockdown is evident in both the time series and spatial distribution maps. To better discuss the changes in the NO2 concentration in the Chinese atmosphere before and after the COVID-19 lockdown and to isolate and quantify the contributions of the Chinese New Year holiday and COVID-19 lockdown, the regional NO2 distribution and NO2 concentrations in key cities in China are discussed considering a more detailed time scale.
To investigate the impact of COVID-19 lockdown on the variations of NO2 concentration level, we analyzed satellite NO2 observations by the TROPOMI instrument (launched in Oct 2017) between 2019 and 2021. The meteorological influence on NO2 changes during the study phase of this study for COVID-19 was very limited [46,47], which we discuss in Section 3.5. Therefore, the effects of meteorological factors were not considered in the analysis and discussion of the changes in the NO2 concentration in this study.
Figure 6 shows the spatial distribution and relative differences of NO2 TVCD in the five phases in the Chinese region for 2019 and 2020. The spatial distribution of NO2 is consistent with the typical winter distribution reported in Section 3.2.1, with the North China Plain and Yangtze River Delta being the most polluted regions, which is related to their extensive industrial distribution, dense population, transportation networks, and relatively flat topography. The tropospheric NO2 distribution of the P2 phase in 2019 (Figure 6b) shows a brief drop in the NO2 concentrations due to the New Year’s shutdown, followed by a gradual rebound. However, the distribution differs during the Chinese New Year in 2020 because of the continued shutdown of a large number of factories due to the COVID-19 lockdown measures and the significant reduction in the traffic flow. Figure 6k–o shows the reduction in the mean NO2 TVCD values for each phase in 2020 relative to 2019, with NO2 already showing a decreasing trend in most areas during the P1 phase. However, the NO2 TVCD increases by more than 2 × 10¹⁵ molecules/cm2 in parts of the North China Plain. The NO2 TVCD significantly declines during the P2 to P4 phases and slowly increases again during the P5 phase.
In this study, the annual changes in the NO2 TVCD and ground-level concentrations were quantified and calculated for each city and different phases, as shown in Tables S2 and S3. The results show that Wuhan, the city in which SARS-CoV-2 was first discovered, experienced the most significant decrease in the NO2 concentrations in the early phases, with a 48.12% decrease in the NO2 TVCD and a 27.39% decrease in the ground-level NO2 concentrations in the P1 phase. In the P3 phase, with the largest decrease in NO2, the cities experienced a 23.09–62.92% decrease in the NO2 TVCD and a 42.53–69.81% decrease in the ground-level NO2 concentrations. In the P5 phase, the decrease in the NO2 concentration in each city gradually disappeared. The city in which this phenomenon was the most notable is Chengdu; the NO2 TVCD increased by 50.06% and the ground-level NO2 concentrations increased by 5.97% during this phase. However, the NO2 TVCD and ground-level NO2 concentration in Wuhan still declined by 26.77% and 51.18% during P5.
To explore the decline in the NO2 concentration due to the COVID-19 lockdown measures in more detail, Figure S4 shows the time series of the daily averages of the NO2 TVCD and ground-level concentrations on a daily scale for representative cities in each region. Because the TROPOMI NO2 TVCD product reflects the pollutant distribution at 13:30 local time, its time series shows higher fluctuations relative to the ground-level NO2 daily average. In 2019, the peak NO2 concentrations in the P3 phase in all cities were approximately 5–7 times higher than the low values in the P2 phase. The rebound in NO2 concentrations was a response to the phenomenon of people starting to return to work late in the Chinese New Year holidays, but this phenomenon showed a marked difference in 2020. In 2020, NO2 concentrations in most cities remained low for a long time during and after the P3 phase, until they started to rise again during the P5 phase.
Although there are missing satellite NO2 TVCD data in a few days due to cloud effects, the four typical cities in Figure S4 show similar trends in NO2 TVCD and ground-level NO2 concentrations. Based on the data in Tables S2 and S3, the decreasing trends in NO2 TVCD and ground-level NO2 concentrations are generally consistent in most cities but do not exactly match in terms of the proportion of change. This difference may be related to changes in the vertical distribution of atmospheric NO2, as indicated in Section 3.1, with high-altitude transport of NO2 as one potential cause.
With MAX-DOAS vertical observations, it is possible to observe and verify the difference between satellite and in situ NO2 variations. For instance, in Beijing, MAX-DOAS NO2 showed a decrease of 19% (versus 14% by in situ) at the ground surface, and 36% (versus 36% by satellite) for the total tropospheric column during the P3–P5 phase, which is most affected by the COVID-19 lockdown effect. Atmospheric NO2 concentrations in Beijing are influenced by high-altitude transport phenomena over the long term, with some studies showing that city boundary transport contributes approximately 40% of the NOX concentration in Beijing [46,48], which may have a significant impact on the vertical distribution of atmospheric NO2 in Beijing.

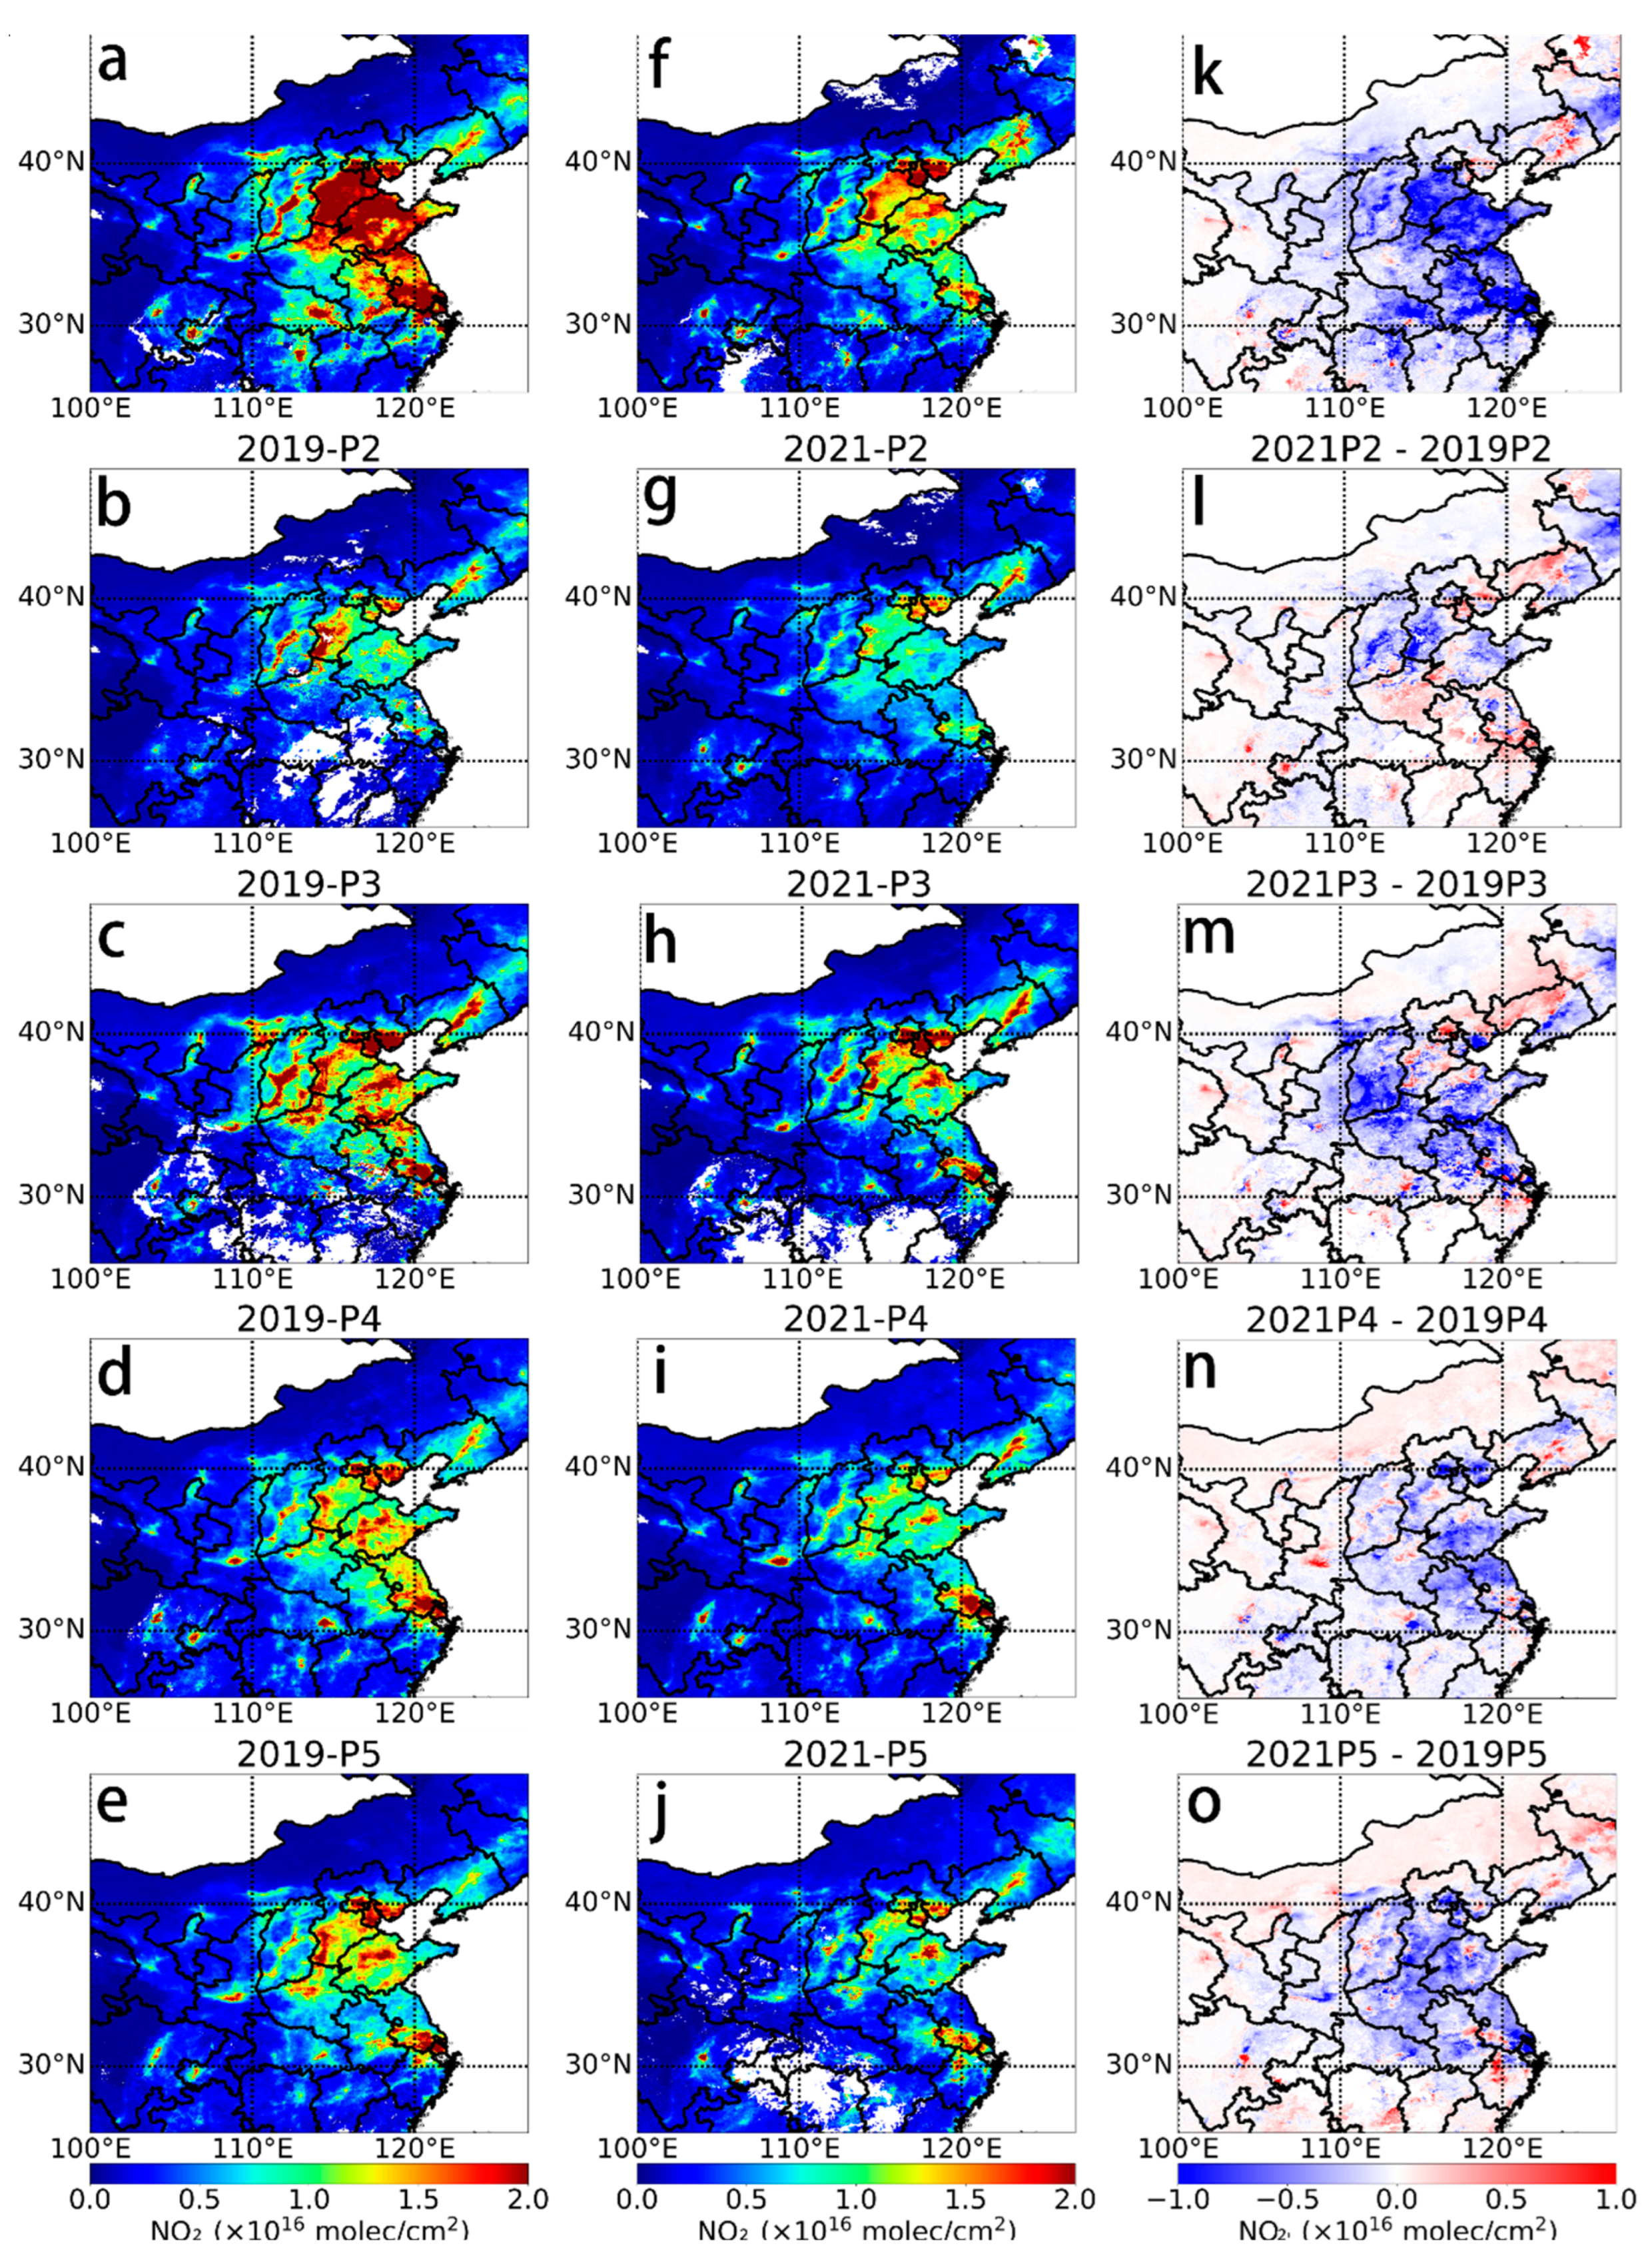
3.4. NO2 Trends in the Post-COVID-19 Era

To assess and discuss the NO2 pollution in China in the post-epidemic era and the recovery of industrial production, the TROPOMI NO2 TVCD and ground-level NO2 concentrations during the Spring Festival in 2021 were analyzed in this study. Consistent with the previous section, the Chinese New Year period in 2021 is divided into five phases. Additionally, in this section, the 2019 NO2 concentrations were used as baseline concentrations.
Figure 7 shows the spatial distribution and relative differences of the NO2 TVCDs of the five phases in China for 2019 and 2021. The years 2019 and 2021 show a consistent pattern during the Chinese New Year due to the holiday. Compared with 2019, the NO2 concentration decreases in the Yangtze River Delta region and parts of the North China Plain during all phases in 2021, but regions such as the Sichuan Basin, Xi’an, and Wuhan, experience an increase in the NO2 concentrations during several phases. As shown in Figure 7k–o, the NO2 TVCD decreases by more than 5 × 10¹⁵ molecules/cm2 in several cities during phases P1 and P3 and insignificantly during phase P2.
Tables S4 and S5 show the changes in the NO2 TVCD and ground-level NO2 concentrations in key cities in China in 2021 relative to 2019 for each phase, respectively. In the P1 phase, the NO2 concentration in all cities, except for Chengdu, shows a significant decrease compared with 2019. The NO2 TVCD decreases by 10.42–64.96% and the ground NO2 concentration decreases by 1.05–34.99%, which may be partly due to lower passenger flow and lower traffic emissions due to COVID-19. The data suggests that the spring traffic in 2021 will be on average ~60% lower than the year before COVID-19. The NO2 concentrations of most cities showed a decreasing trend during phases P3–P5, which reflects the overall decreasing trend in atmospheric NO2 in China around the Chinese New Year in 2021. However, during the P2 phase, NO2 TVCD increased by 0.88–53.57% in all cities except Beijing, which was not well matched by changes in ground-level NO2, which may be influenced by several factors such as population movement policies, urban boundary transmission, and meteorology in different regions. However, it is still possible to conclude that some changes in the pattern of atmospheric NO2 emissions occurred during the Chinese New Year (P2 phase) in 2021.
To better understand the changes in the NO2 concentrations around the Chinese New Year in 2021, the time series of the daily average ground-level NO2 concentrations in four typical cities for each phase from 2019 to 2021 were plotted, as shown in Figure 8a–d. The ground-level NO2 concentrations in 2021 are generally lower than those in 2019 in all cities but are more exceptional in the P2 phase. Figure 8e–h shows the rapid increase in the ground-level NO2 concentrations in the cities in the late P2 phase. The magnitude of this increase exceeds that of the same period in 2019 before the outbreak. Taking Beijing as an example, Figure 8e shows that the ground-level NO2 concentrations in Beijing first rapidly decreased in 2021, with NO2 concentrations on February 16 being only 13% of those on the day of the Chinese New Year. The NO2 concentrations then rapidly increased, with NO2 concentrations on February 20 being 12 times higher than those on February 16. Although the synoptic meteorology was generally stable for different periods from 2019 to 2021, this phenomenon may be influenced by day-to-day variation in meteorological and chemical conditions. In addition, this extreme trend may be related to the effect of COVID-19 on people’s social lives, with people taking a longer break from work during the Chinese New Year holiday (seven days before the P2 phase) based on a call to reduce unnecessary travel. Because of the reduced travel, people could resume social work and industrial production more quickly at the end of the holiday (the eighth day of the P2 phase), which led to the return to normal NO2 concentrations. In short, the effect of the Chinese New Year was more pronounced in the post-epidemic era but of a shorter duration.
Industrial emissions and transport are closely related to atmospheric NO2 pollution levels [49], indicating the reasons for the decline in the NO2 concentrations in Chinese cities in the post-epidemic era. Figures S5 and S6 show the above-scale industrial production index and the road passenger traffic time series in the provinces they belong to for selected Chinese cities from January 2019 to May 2021, respectively, which can be used to characterize the development of the industry and transportation in China [50]. The industrial production index is based on 2018 and was calculated from the cumulative annual increase in the above-scale industry. Both significantly decreased during the COVID-19 lockdown. The city with the largest decline in the above-scale industry was Wuhan, where COVID-19 was first detected, which decreased by 39.70% from January to March 2020 and started to rebound in April, whereas the rest of the cities started to rebound in March. In terms of transport, the road passenger traffic was down by more than 85% relative to its peak in all provinces, with some provinces experiencing a drop of more than 95%.
The industrial production index has largely rebounded to pre-COVID-19 levels since 2021, but the transport sector remains below pre-COVID-19 levels. As of May 2021, Beijing is the city (province) with the highest proportion of road passenger traffic recovery, equivalent to ~69.15% in May 2019, whereas the Shaanxi Province, including Xi’an, only had a recovery of 16.19% in May 2019. The decline in the transport sector due to COVID-19 could be the reason for the generally lower NO2 concentrations in 2021 compared with 2019 after the Chinese New Year. In addition, the continued implementation of the Clean Air Plan and differences in meteorological conditions could also be potential factors contributing to the lower NO2 concentrations in 2021.

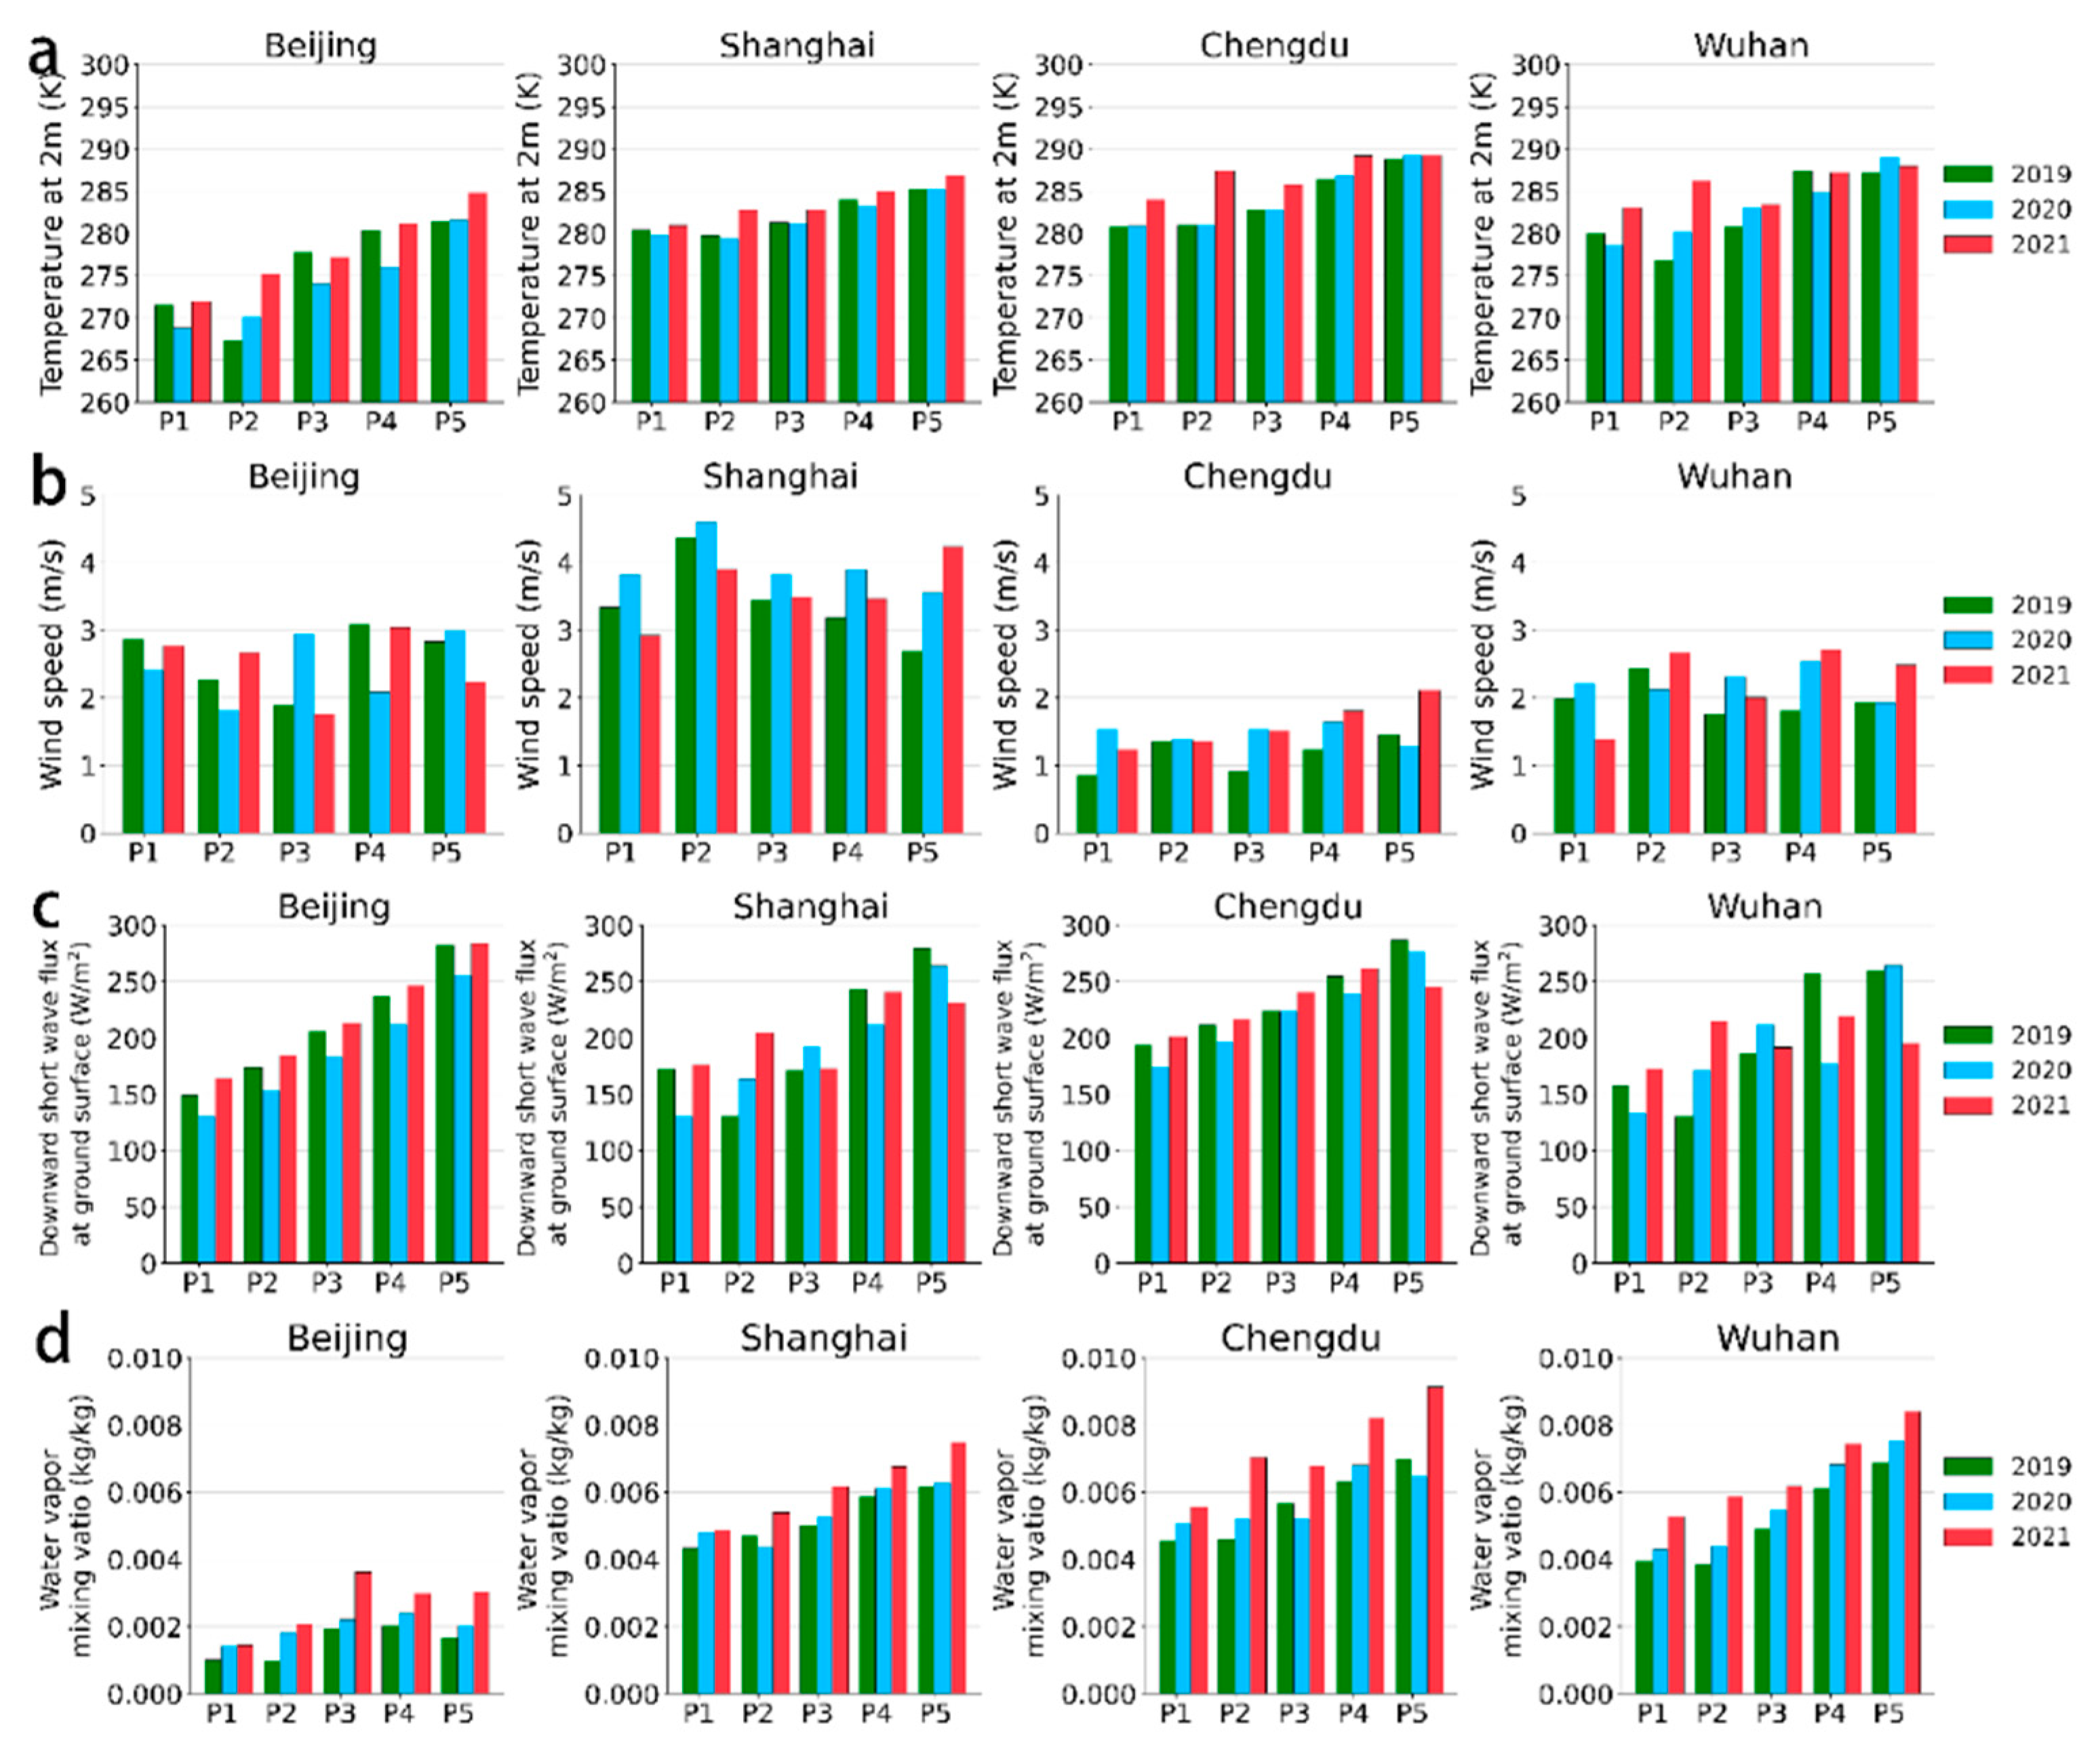
3.5. Meteorological Changes during the Study Phase

Meteorological factors are an important influence on changes in atmospheric pollutant concentrations. In Figure 9, we compared the average of several meteorological variables in different periods of 2019–2021 for Beijing, Shanghai, Wuhan, and Chengdu. The meteorological variables including temperature at 2 m, wind speed, downward short wave flux at the ground surface, and water vapor mixing were taken from the Weather Research and Forecasting model simulations based on the meteorological reanalysis datasets by National Centers for Environmental Prediction [51,52,53].
These results showed that the synoptic meteorology was generally stable for different periods from 2019 to 2021. Several studies [9,47,54,55,56] have concluded that there was a small contribution of meteorological variations to the decline in NO2 concentrations in China during the COVID-19 lockdown. For example, Diamond et al., 2020 used a linear regression model to attribute NO2 variations from driving factors such as emissions change and meteorological variations, and found that meteorology led to a ~10% decrease in NO2, versus ~50% by emission factors during February 2020 [21]. Zhang et al., 2021 [19] used a multiple linear regression model and found that the anthropogenic emission changes in early 2020 led to a 49.3 ± 23.5% reduction of atmospheric NO2, while the changes in meteorological conditions led to an 8.1 ± 14.2% increase compared to 2017.

4. Conclusions

In general, satellite remote sensing, ground-based MAX-DOAS, and in situ observations measure atmospheric NO2 by different spatial scales and resolutions. Taking Beijing as an example, the USTC NO2 TVCD product shows a slightly stronger correlation with ground-level NO2 concentrations at the site scale than the official NO2 TVCD product (R = 0.79), with a correlation coefficient of R = 0.82. In addition, the USTC NO2 TVCD product has a better agreement with the MAX-DOAS product than the official NO2 TVCD product, with a higher correlation coefficient and slope. Although the correlation between satellite remote sensing and ground-based station monitoring is high, several differences remain, which may be related to the vertical distribution of atmospheric NO2. In this study, with the help of MAX-DOAS vertical profile data, high NO2 transport was observed on several days, which coincides with the dates of trend differences between satellite remote sensing monitoring and ground station observations.
A significant reduction in atmospheric NO2 concentrations occurred in most areas of China during the Chinese New Year in 2020 due to COVID-19 lockdown. The average satellite TVCD of NO2 by TROPOMI decreased by 39.2–71.93% during the 15 days after Chinese New Year when the lockdown was at its tightest compared to that of 2019, while in situ NO2 concentration decreased by 42.53–69.81% for these cities. With MAX-DOAS vertical observations, it is possible to observe and verify the difference between satellite and in situ NO2 variations. For instance, in Beijing, MAX-DOAS NO2 showed a decrease of 19% (versus 14% by in situ) at the ground surface, and 36% (versus 36% by satellite) for the total tropospheric column during the P3–P5 phase, which is most affected by the COVID-19 lockdown effect.
Social activity in China began to recover in the second half of 2020, with industrial production largely recovering, but the transport industry has not yet recovered to pre-COVID-19 levels. The road traffic in May 2021 in the provinces including the studied cities recovered by ~16.19–69.15% of the same period in 2019, which may have contributed to lower NO2 concentrations around the Chinese New Year in 2021 than in 2019 in most cities. In addition, a rapid increase in the NO2 concentrations across cities was observed in this study at the end of the 2021 Spring Festival holiday, which differs from the previous phenomenon. Although the synoptic meteorology was generally stable for different time periods from 2019 to 2021, this phenomenon may be influenced by day-to-day variation in meteorological and chemical conditions. Another possible explanation is that people’s social activities, such as traveling during the Spring Festival holiday, decreased in the post-COVID-19 era and were resumed to a greater extent after the holiday. COVID-19 may have had a profound effect on social life. Our research will benefit the understanding of measurements uncertainty and bias of NO2 trends since the COVID-19 epidemic, and the related research on the driving effectors. Further investigation on the impact of meteorology and long-term emission trends can be completed by the sensitivity tests by using the chemical model.

Supplementary Materials

The following supporting information can be downloaded at: https://www.mdpi.com/article/10.3390/rs14020419/s1, Text S1. Satellite NO2 retrieval algorithms. Text S2. Industrial and transport data sources. Figure S1: The five time phases 2019–2021 divided by Chinese New Year are P1 (15 days before Chinese New Year), P2 (15 days during Chinese New Year), P3 (0–15 days after Chinese New Year), P4 (15–30 days after Chinese New Year), and P5 (30–45 days after Chinese New Year). Figure S2. MAX-DOAS NO2 vertical profile. (a) CAMS site, 15 December 2019; (b) CAMS site, 20 December 2019. Figure S3. Time series of the monthly mean NO2 TVCD from December 2018 to May 2021 for selected cities in China. Figure S4. Change in the daily average NO2 concentration in selected Chinese cities in 2020 compared with 2019, (a–d) 2019, (e–h) 2020. Figure S5: Time series of the above-scale industrial production index in several Chinese cities. Figure S6: Time series of the road passenger traffic in selected provinces in China. Table S1: Geographical location and number of sites in selected cities in China selected for this study. Table S2: Satellite NO2 TVCD for selected cities in China Percentage decrease by time period in 2020 compared to 2019. Table S3: In situ observation of NO2 concentration for selected cities in China. Percentage decrease by time period in 2020 compared to 2019. Table S4: Satellite NO2 TVCD for selected cities in China. Percentage decrease by time period in 2021 compared to 2019. Table S5: In situ observation of NO2 concentration for selected cities in China. Percentage decrease by time period in 2021 compared to 2019.

Author Contributions

Conceptualization, C.Z. (Chengxin Zhang) and C.L.; methodology, C.Z. (Chunhui Zhao); software, C.Z. (Chunhui Zhao) and H.W.; formal analysis, C.Z. (Chunhui Zhao); investigation, H.L.; data curation, C.Z. (Chengxin Zhang) and J.L.; writing—original draft preparation, C.Z. (Chunhui Zhao); writing—review and editing, C.Z. (Chunhui Zhao); visualization, S.W.; project administration, C.L.; funding acquisition, C.Z. (Chengxin Zhang) and C.L. All authors have read and agreed to the published version of the manuscript.

Funding

This research was supported by the National Key Research and Development Program of China (2018YFC0213104 and 2017YFC0210002), the National Natural Science Foundation of China (41977184, 41941011, and 51778596), the Strategic Priority Research Program of the Chinese Academy of Sciences (XDA23020301), the Major Projects of High Resolution Earth Observation Systems of National Science and Technology (05-Y30B01-9001-19/20-3), the Youth Innovation Promotion Association of CAS (2021443), the Young Talent Project of the Center for Excellence in Regional Atmospheric Environment, CAS (CERAE202004), the China Postdoctoral Science Foundation (2020TQ0320 and 2021M693068), Anhui Provincial Natural Science Foundation (2108085QD178) and the Fundamental Research Funds for the Central Universities.

Institutional Review Board Statement

Not applicable.

Informed Consent Statement

Not applicable.

Data Availability Statement

The data presented in this study are available on request from the corresponding author.

Acknowledgments

We thank the Copernicus Open Access Hub and the European Space Agency for making the Sentinel-5P Level 1 and Level 2 products available online (https://scihub.copernicus.eu/, last access: 31 May 2021). We acknowledge all developers for contributing to the development of the WRF-Chem model. We thank NCEP for providing the final reanalysis dataset.

Conflicts of Interest

The authors declare no conflict of interest.

References

  1. Khreis, H.; de Hoogh, K.; Nieuwenhuijsen, M.J. Full-chain health impact assessment of traffic-related air pollution and childhood asthma. Environ. Int. 2018, 114, 365–375. [Google Scholar] [CrossRef]
  2. Olmo, N.R.S.; Saldiva, P.H.D.; Braga, A.L.F.; Lin, C.A.; Santos, U.D.; Pereira, L.A.A. A review of low-level air pollution and adverse effects on human health: Implications for epidemiological studies and public policy. Clinics 2011, 66, 681–690. [Google Scholar] [CrossRef] [Green Version]
  3. Putta, S.N. Atmospheric-Pollution, Its History, Origins and Prevention, 4th ed.; Meetham, A.R., Bottom, D.W., Cayton, S., Hendersonsellers, A., Chambers, D., Eds.; Pergamon Press: Oxford, UK, 1984; Volume 106, p. 3066. [Google Scholar]
  4. Kong, L.; Tang, X.; Zhu, J.; Wang, Z.F.; Fu, J.S.; Wang, X.M.; Itahashi, S.; Yamaji, K.; Nagashima, T.; Lee, H.J.; et al. Evaluation and uncertainty investigation of the NO2, CO and NH3 modeling over China under the framework of MICS-Asia III. Atmos. Chem. Phys. 2020, 20, 181–202. [Google Scholar] [CrossRef] [Green Version]
  5. Zheng, B.; Tong, D.; Li, M.; Liu, F.; Hong, C.P.; Geng, G.N.; Li, H.Y.; Li, X.; Peng, L.Q.; Qi, J.; et al. Trends in China’s anthropogenic emissions since 2010 as the consequence of clean air actions. Atmos. Chem. Phys. 2018, 18, 14095–14111. [Google Scholar] [CrossRef] [Green Version]
  6. Ronald, J.V.; Mijling, B.; Ding, J.; Koukouli, M.E.; Liu, F.; Li, Q.; Mao, H.Q.; Theys, N. Cleaning up the air: Effectiveness of air quality policy for SO2 and NOx emissions in China. Atmos. Chem. Phys. 2017, 17, 1775–1789. [Google Scholar]
  7. Zhai, S.X.; Jacob, D.J.; Wang, X.; Shen, L.; Li, K.; Zhang, Y.Z.; Gui, K.; Zhao, T.L.; Liao, H. Fine particulate matter (PM2.5) trends in China, 2013–2018: Separating contributions from anthropogenic emissions and meteorology. Atmos. Chem. Phys. 2019, 19, 11031–11041. [Google Scholar] [CrossRef] [Green Version]
  8. Liu, H.R.; Liu, C.; Xie, Z.Q.; Li, Y.; Huang, X.; Wang, S.S.; Xu, J.; Xie, P.H. A paradox for air pollution controlling in China revealed by “APEC Blue” and “Parade Blue”. Sci. Rep. 2016, 6, 34408. [Google Scholar] [CrossRef] [PubMed] [Green Version]
  9. Liu, F.; Page, A.; Strode, S.A.; Yoshida, Y.; Choi, S.; Zheng, B.; Lamsal, L.N.; Li, C.; Krotkov, N.A.; Eskes, H.; et al. Abrupt decline in tropospheric nitrogen dioxide over China after the outbreak of COVID-19. Sci. Adv. 2020, 6, eabc2992. [Google Scholar] [CrossRef]
  10. Zhou, M.Q.; Jiang, J.Y.; Langerock, B.; Dils, B.; Sha, M.K.; de Maziere, M. Change of CO Concentration Due to the COVID-19 Lockdown in China Observed by Surface and Satellite Observations. Remote Sens. 2021, 13, 1129. [Google Scholar] [CrossRef]
  11. Fan, C.; Li, Z.; Li, Y.; Dong, J.; van der, A.R.; de Leeuw, G. Variability of NO2; concentrations over China and effect on air quality derived from satellite and ground-based observations. Atmos. Chem. Phys. 2021, 21, 7723–7748. [Google Scholar] [CrossRef]
  12. Wang, Q.; Su, M. A preliminary assessment of the impact of COVID-19 on environment—A case study of China. Sci. Total Environ. 2020, 728, 138915. [Google Scholar] [CrossRef] [PubMed]
  13. Ghahremanloo, M.; Lops, Y.; Choi, Y.; Mousavinezhad, S. Impact of the COVID-19 outbreak on air pollution levels in East Asia. Sci. Total Environ. 2021, 754, 142226. [Google Scholar] [CrossRef]
  14. Yin, H.; Liu, C.; Hu, Q.H.; Liu, T.; Wang, S.T.; Gao, M.; Xu, S.Q.; Zhang, C.X.; Su, W.J. Opposite impact of emission reduction during the COVID-19 lockdown period on the surface concentrations of PM2.5 and O3 in Wuhan, China. Environ. Pollut. 2021, 289, 117899. [Google Scholar] [CrossRef]
  15. Xia, C.Z.; Liu, C.; Cai, Z.N.; Duan, X.N.; Hu, Q.H.; Zhao, F.; Liu, H.R.; Ji, X.G.; Zhang, C.X.; Liu, Y. Improved Anthropogenic SO2 Retrieval from High-Spatial-Resolution Satellite and its Application during the COVID-19 Pandemic. Environ. Sci. Technol. 2021, 55, 11538–11548. [Google Scholar] [CrossRef]
  16. Wang, Z.; Uno, I.; Yumimoto, K.; Itahashi, S.; Chen, X.; Yang, W.; Wang, Z. Impacts of COVID-19 lockdown, Spring Festival and meteorology on the NO2 variations in early 2020 over China based on in-situ observations, satellite retrievals and model simulations. Atmos. Environ. 2021, 244, 117972. [Google Scholar] [CrossRef]
  17. Huang, G.; Sun, K. Non-negligible impacts of clean air regulations on the reduction of tropospheric NO2 over East China during the COVID-19 pandemic observed by OMI and TROPOMI. Sci. Total Environ. 2020, 745, 141023. [Google Scholar] [CrossRef]
  18. Feng, S.; Jiang, F.; Wang, H.; Wang, H.; Ju, W.; Shen, Y.; Zheng, Y.; Wu, Z.; Ding, A. NOx Emission Changes Over China During the COVID-19 Epidemic Inferred From Surface NO2 Observations. Geophys. Res. Lett. 2020, 47, e2020GL090080. [Google Scholar] [CrossRef] [PubMed]
  19. Zhang, Y.; Bo, H.; Jiang, Z.; Wang, Y.; Fu, Y.; Cao, B.; Wang, X.; Chen, J.; Li, R. Untangling the contributions of meteorological conditions and human mobility to tropospheric NO2 in Chinese mainland during the COVID-19 pandemic in early 2020. Natl. Sci. Rev. 2021, 8, nwab061. [Google Scholar] [CrossRef]
  20. Wang, Y.J.; Wen, Y.F.; Wang, Y.; Zhang, S.J.; Zhang, K.M.; Zheng, H.T.; Xing, J.; Wu, Y.; Hao, J.M. Four-Month Changes in Air Quality during and after the COVID-19 Lockdown in Six Megacities in China. Environ. Sci. Technol. Lett. 2020, 7, 802–808. [Google Scholar] [CrossRef]
  21. Diamond, M.S.; Wood, R. Limited Regional Aerosol and Cloud Microphysical Changes Despite Unprecedented Decline in Nitrogen Oxide Pollution During the February 2020 COVID-19 Shutdown in China. Geophys. Res. Lett. 2020, 47, e2020GL088913. [Google Scholar] [CrossRef]
  22. He, C.; Hong, S.; Zhang, L.; Mu, H.; Xin, A.X.; Zhou, Y.Q.; Liu, J.K.; Liu, N.J.; Su, Y.M.; Tian, Y.; et al. Global, continental, and national variation in PM2.5, O3, and NO2 concentrations during the early 2020 COVID-19 lockdown. Atmos. Pollut. Res. 2021, 12, 136–145. [Google Scholar] [CrossRef] [PubMed]
  23. Field, R.D.; Hickman, J.E.; Geogdzhayev, I.V.; Tsigaridis, K.; Bauer, S.E. Changes in satellite retrievals of atmospheric composition over eastern China during the 2020 COVID-19 lockdowns. Atmos. Chem. Phys. 2020, 21, 18333–18350. [Google Scholar] [CrossRef]
  24. Biswal, A.; Singh, V.; Singh, S.; Kesarkar, A.P.; Ravindra, K.; Sokhi, R.S.; Chipperfield, M.P.; Dhomse, S.S.; Pope, R.J.; Singh, T.; et al. COVID-19 lockdown-induced changes in NO2 levels across India observed by multi-satellite and surface observations. Atmos. Chem. Phys. 2021, 21, 5235–5251. [Google Scholar] [CrossRef]
  25. Huang, B.; Wang, J.; Cai, J.; Yao, S.; Chan, P.K.S.; Tam, T.H.; Hong, Y.Y.; Ruktanonchai, C.W.; Carioli, A.; Floyd, J.R.; et al. Integrated vaccination and physical distancing interventions to prevent future COVID-19 waves in Chinese cities. Nat. Hum. Behav. 2021, 5, 695–705. [Google Scholar] [CrossRef]
  26. Zhang, C.; Liu, C.; Hu, Q.; Cai, Z.; Su, W.; Xia, C.; Zhu, Y.; Wang, S.; Liu, J. Satellite UV-Vis spectroscopy: Implications for air quality trends and their driving forces in China during 2005–2017. Light Sci. Appl. 2019, 8, 100. [Google Scholar] [CrossRef] [Green Version]
  27. Zhang, R.X.; Zhang, Y.Z.; Lin, H.P.; Feng, X.; Fu, T.M.; Wang, Y.H. NOx Emission Reduction and Recovery during COVID-19 in East China. Atmosphere 2020, 11, 433. [Google Scholar] [CrossRef] [Green Version]
  28. Zheng, Z.H.; Yang, Z.W.; Wu, Z.F.; Marinello, F. Spatial Variation of NO2 and Its Impact Factors in China: An Application of Sentinel-5P Products. Remote Sens. 2019, 11, 1939. [Google Scholar] [CrossRef] [Green Version]
  29. Veefkind, J.P.; Aben, I.; McMullan, K.; Forster, H.; de Vries, J.; Otter, G.; Claas, J.; Eskes, H.J.; de Haan, J.F.; Kleipool, Q.; et al. TROPOMI on the ESA Sentinel-5 Precursor: A GMES mission for global observations of the atmospheric composition for climate, air quality and ozone layer applications. Remote Sens. Environ. 2012, 120, 70–83. [Google Scholar] [CrossRef]
  30. Cugny, B.; Karafolas, N.; Armandillo, E.; van der Valk, N.; Lobb, D.; de Vries, J.; Veefkind, P.; Aben, I.; Wood, T.; Bhatti, I.S.; et al. TROPOMI, the Sentinel 5 precursor instrument for air quality and climate observations: Status of the current design. In Proceedings of the International Conference on Space Optics—ICSO 2012, Ajaccio, France, 9–12 October 2012. [Google Scholar]
  31. Zhang, C.X.; Liu, C.; Chan, K.L.; Hu, Q.H.; Liu, H.R.; Li, B.; Xing, C.Z.; Tan, W.; Zhou, H.J.; Si, F.Q.; et al. First observation of tropospheric nitrogen dioxide from the Environmental Trace Gases Monitoring Instrument onboard the GaoFen-5 satellite. Light-Sci. Appl. 2020, 9, 66. [Google Scholar] [CrossRef] [Green Version]
  32. Su, W.J.; Liu, C.; Hu, Q.H.; Fan, G.Q.; Xie, Z.Q.; Huang, X.; Zhang, T.S.; Chen, Z.Y.; Dong, Y.S.; Ji, X.G.; et al. Characterization of ozone in the lower troposphere during the 2016 G20 conference in Hangzhou. Sci. Rep. 2017, 7, 17368. [Google Scholar] [CrossRef] [Green Version]
  33. Kuhlmann, G.; Hartl, A.; Cheung, H.M.; Lam, Y.F.; Wenig, M.O. A novel gridding algorithm to create regional trace gas maps from satellite observations. Atmos. Meas. Tech. 2014, 7, 451–467. [Google Scholar] [CrossRef] [Green Version]
  34. Su, W.J.; Liu, C.; Chan, K.L.; Hu, Q.H.; Liu, H.R.; Ji, X.G.; Zhu, Y.Z.; Liu, T.; Zhang, C.X.; Chen, Y.J.; et al. An improved TROPOMI tropospheric HCHO retrieval over China. Atmos. Meas. Tech. 2020, 13, 6271–6292. [Google Scholar] [CrossRef]
  35. Food and Agriculture Organization of the United Nations. GB3095-2012, Ambient Air Quality Standards; Food and Agriculture Organization of the United Nations: Rome, Italy, 2012. [Google Scholar]
  36. Silver, B.; Reddington, C.L.; Arnold, S.R.; Spracklen, D.V. Substantial changes in air pollution across China during 2015–2017. Environ. Res. Lett. 2018, 13, 114012. [Google Scholar] [CrossRef]
  37. Liu, C.; Xing, C.; Hu, Q.; Li, Q.; Liu, H.; Hong, Q.; Tan, W.; Ji, X.; Lin, H.; Lu, C.; et al. Ground-based Hyperspectral Stereoscopic Remote Sensing Network: A Promising Strategy to Learn Coordinated Control of O3 and PM2.5 over China. Engineering 2021, 148, 968–979. [Google Scholar] [CrossRef]
  38. Vandaele, A.C.; Hermans, C.; Simon, P.C.; Carleer, M.; Colin, R.; Fally, S.; Merienne, M.F.; Jenouvrier, A.; Coquart, B. Measurements of the NO2 absorption cross-section from 42 000 cm(−1) to 10 000 cm(−1) (238–1000 nm) at 220 K and 294 K. J. Quant. Spectrosc. Radiat. 1998, 59, 171–184. [Google Scholar] [CrossRef] [Green Version]
  39. Wu, S.; Huang, B.; Wang, J.; He, L.; Wang, Z.; Yan, Z.; Lao, X.; Zhang, F.; Liu, R.; Du, Z. Spatiotemporal mapping and assessment of daily ground NO2 concentrations in China using high-resolution TROPOMI retrievals. Environ. Pollut. 2021, 273, 116456. [Google Scholar] [CrossRef] [PubMed]
  40. Verhoelst, T.; Compernolle, S.; Pinardi, G.; Lambert, J.C.; Eskes, H.J.; Eichmann, K.U.; Fjaeraa, A.M.; Granville, J.; Niemeijer, S.; Cede, A.; et al. Ground-based validation of the Copernicus Sentinel-5P TROPOMI NO2 measurements with the NDACC ZSL-DOAS, MAX-DOAS and Pandonia global networks. Atmos. Meas. Tech. 2021, 14, 481–510. [Google Scholar] [CrossRef]
  41. Xing, C.Z.; Liu, C.; Wang, S.S.; Chan, K.L.; Gao, Y.; Huang, X.; Su, W.J.; Zhang, C.X.; Dong, Y.S.; Fan, G.Q.; et al. Observations of the vertical distributions of summertime atmospheric pollutants and the corresponding ozone production in Shanghai, China. Atmos. Chem. Phys. 2017, 17, 14275–14289. [Google Scholar] [CrossRef] [Green Version]
  42. Tan, W.; Liu, C.; Wang, S.S.; Liu, H.R.; Zhu, Y.Z.; Su, W.J.; Hu, Q.H.; Liu, J.G. Long-distance mobile MAX-DOAS observations of NO2 and SO2 over the North China Plain and identification of regional transport and power plant emissions. Atmos. Res. 2020, 245, 105037. [Google Scholar] [CrossRef]
  43. Wang, C.; Wang, T.; Wang, P.; Rakitin, V. Comparison and Validation of TROPOMI and OMI NO2 Observations over China. Atmosphere 2020, 11, 636. [Google Scholar] [CrossRef]
  44. Yin, H.; Sun, Y.W.; Liu, C.; Zhang, L.; Lu, X.; Wang, W.; Shan, C.G.; Hu, Q.H.; Tian, Y.; Zhang, C.X.; et al. FTIR time series of stratospheric NO2 over Hefei, China, and comparisons with OMI and GEOS-Chem model data. Opt. Express 2019, 27, A1225–A1240. [Google Scholar] [CrossRef]
  45. Kendrick, C.M.; Koonce, P.; George, L.A. Diurnal and seasonal variations of NO, NO2 and PM2.5 mass as a function of traffic volumes alongside an urban arterial. Atmos. Environ. 2015, 122, 133–141. [Google Scholar] [CrossRef] [Green Version]
  46. Zhu, Y.Z.; Hu, Q.H.; Gao, M.; Zhao, C.; Zhang, C.X.; Liu, T.; Tian, Y.; Yan, L.; Su, W.J.; Hong, X.H.; et al. Quantifying Contributions of Local Emissions and Regional Transport to NOX in Beijing Using TROPOMI Constrained WRF-Chem Simulation. Remote Sens. 2021, 13, 1798. [Google Scholar] [CrossRef]
  47. Fan, H.; Wang, Y.; Zhao, C.; Yang, Y.; Yang, X.; Sun, Y.; Jiang, S. The Role of Primary Emission and Transboundary Transport in the Air Quality Changes During and After the COVID-19 Lockdown in China. Geophys. Res. Lett. 2021, 48, e2020GL091065. [Google Scholar] [CrossRef] [PubMed]
  48. Tan, Q.; Ge, B.; Xu, X.; Gan, L.; Yang, W.; Chen, X.; Pan, X.; Wang, W.; Li, J.; Wang, Z. Increasing impacts of the relative contributions of regional transport on air pollution in Beijing: Observational evidence. Environ. Pollut. 2021, 292, 118407. [Google Scholar] [CrossRef] [PubMed]
  49. Chen, Z.F.; Hao, X.Y.; Zhang, X.Y.; Chen, F.L. Have traffic restrictions improved air quality? A shock from COVID-19. J. Clean. Prod. 2021, 279, 123622. [Google Scholar] [CrossRef]
  50. Zhang, X.Y.; Zhang, W.T.; Lu, X.H.; Liu, X.J.; Chen, D.M.; Liu, L.; Huang, X.J. Long-term trends in NO2 columns related to economic developments and air quality policies from 1997 to 2016 in China. Sci. Total Environ. 2018, 639, 146–155. [Google Scholar] [CrossRef]
  51. Bei, N.F.; Li, G.H.; Huang, R.J.; Cao, J.J.; Meng, N.; Feng, T.; Liu, S.X.; Zhang, T.; Zhang, Q.; Molina, L.T. Typical synoptic situations and their impacts on the wintertime air pollution in the Guanzhong basin, China. Atmos. Chem. Phys. 2016, 16, 7373–7387. [Google Scholar] [CrossRef] [Green Version]
  52. Du, Q.Y.; Zhao, C.; Zhang, M.S.; Dong, X.; Chen, Y.; Liu, Z.; Hu, Z.Y.; Zhang, Q.; Li, Y.B.; Yuan, R.M.; et al. Modeling diurnal variation of surface PM2.5 concentrations over East China with WRF-Chem: Impacts from boundary-layer mixing and anthropogenic emission. Atmos. Chem. Phys. 2020, 20, 2839–2863. [Google Scholar] [CrossRef] [Green Version]
  53. Yan, D.D.; Liu, T.Y.; Dong, W.J.; Liao, X.H.; Luo, S.Q.; Wu, K.; Zhu, X.; Zheng, Z.Y.; Wen, X.H. Integrating remote sensing data with WRF model for improved 2-m temperature and humidity simulations in China. Dyn. Atmos. Oceans 2020, 89, 101127. [Google Scholar] [CrossRef]
  54. Pei, Z.; Han, G.; Ma, X.; Su, H.; Gong, W. Response of major air pollutants to COVID-19 lockdowns in China. Sci. Total Environ. 2020, 743, 140879. [Google Scholar] [CrossRef] [PubMed]
  55. Le, T.H.; Wang, Y.; Liu, L.; Yang, J.N.; Yung, Y.L.; Li, G.H.; Seinfeld, J.H. Unexpected air pollution with marked emission reductions during the COVID-19 outbreak in China. Science 2020, 369, 702–706. [Google Scholar] [CrossRef] [PubMed]
  56. Wang, X.Y.; Zhang, R.H. How Did Air Pollution Change during the COVID-19 Outbreak in China? Am. Meteorol. Soc. 2020, 101, E1645–E1652. [Google Scholar] [CrossRef]
Figure 1. Annual mean distribution of NO2 TVCD in China.
Remotesensing 14 00419 g001
Figure 2. Correlation between the TROPOMI NO2 TVCD product and other observations. (a) USTC product and ground-level NO2 concentrations (14:00 local time) in Beijing, (b) official product and ground-level NO2 concentrations (14:00 local time) in Beijing. (c) USTC product and MAX-DOAS NO2 VCD at the CAMS site, (d) official product, and MAX-DOAS NO2 VCD at the CAMS site.
Remotesensing 14 00419 g002
Figure 3. NO2 comparison time series in Beijing. (a) TROPOMI TVCD and MAX-DOAS, (b) 1006A and MAX-DOAS, (c) MAX-DOAS comparison.
Remotesensing 14 00419 g003
Figure 4. Seasonal mean distribution of the spatiotemporal NO2 distribution in eastern China. (a) 2018 winter, (b) 2019 spring, (c) 2019 summer, (d) 2019 autumn, (e) 2019 winter, (f) 2020 spring, (g) 2020 summer, (h) 2020 autumn, (i) 2020 winter, (j) 2021 spring.
Remotesensing 14 00419 g004
Figure 5. Seasonal average distribution of the NO2 concentrations at state-controlled sites in selected cities in China. (a) 2018 winter, (b) 2019 spring, (c) 2019 summer, (d) 2019 autumn, (e) 2019 winter, (f) 2020 spring, (g) 2020 summer, (h) 2020 autumn, (i) 2020 winter, (j) 2021 spring.
Remotesensing 14 00419 g005
Figure 6. Comparison of the distribution of the NO2 TVCD for the same period (15-day average) in 2020 and 2019 in the Chinese region. (ae) P1-P5 in 2019, (fj) P1-P5 in 2020, (ko) P1-P5 differences between 2020 and 2019.
Remotesensing 14 00419 g006
Figure 7. Distribution of the NO2 TVCD for the same period (15-day average) in 2021 vs. 2019. (ae) P1-P5 in 2019, (fj) P1-P5 in 2021, (ko) P1-P5 differences between 2021 and 2019.
Remotesensing 14 00419 g007
Figure 8. Time series of the daily mean ground-level NO2 values for 2021 and 2019, (ad) P1–P5, (eh) P2 (Chinese New Year holiday).
Remotesensing 14 00419 g008
Figure 9. Comparison of meteorological factor stage averages for selected cities 2019–2021. (a) Temperature at 2 m, (b) wind speed, (c) downward short wave flux at ground surface, (d) water vapor mixing.
Remotesensing 14 00419 g009
Publisher’s Note: MDPI stays neutral with regard to jurisdictional claims in published maps and institutional affiliations.

