
Investigating Surface Fractures and Materials Behavior of Cultural Heritage Buildings Based on the Attribute Information of Point Clouds Stored in the TLS Dataset

 , , , and
Abstract
:
1. Introduction
1.1. General Background
- The proposed method allows one to detect the fracture distribution on the existing surface dataset. This can be done by computing geometric properties of the point cloud (i.e., XYZ) through normal values, dip angle, and dip direction of the surface plane in the dataset. This can help architects or conservators to further identify potential cracks from the surface dataset.
- The proposed method contributes to the detection of vulnerable surfaces in the existing dataset, especially with regard to the materials behavior of the dataset. This can be done by calculating radiometric properties (i.e., RGB, I) of point clouds through the albedo, reflectance, and transmittance values of the TLS dataset. In so doing, architects or conservators can identify the performance qualities of certain areas in the dataset.
- The integrated analysis between fractures and materials behavior permits us to not only analyze the surface performance of the dataset in relation to microclimatic impacts in the indoor environment but also to calibrate the resulting simulations conducted between fracture analysis and materials point distribution.
1.2. Related Works
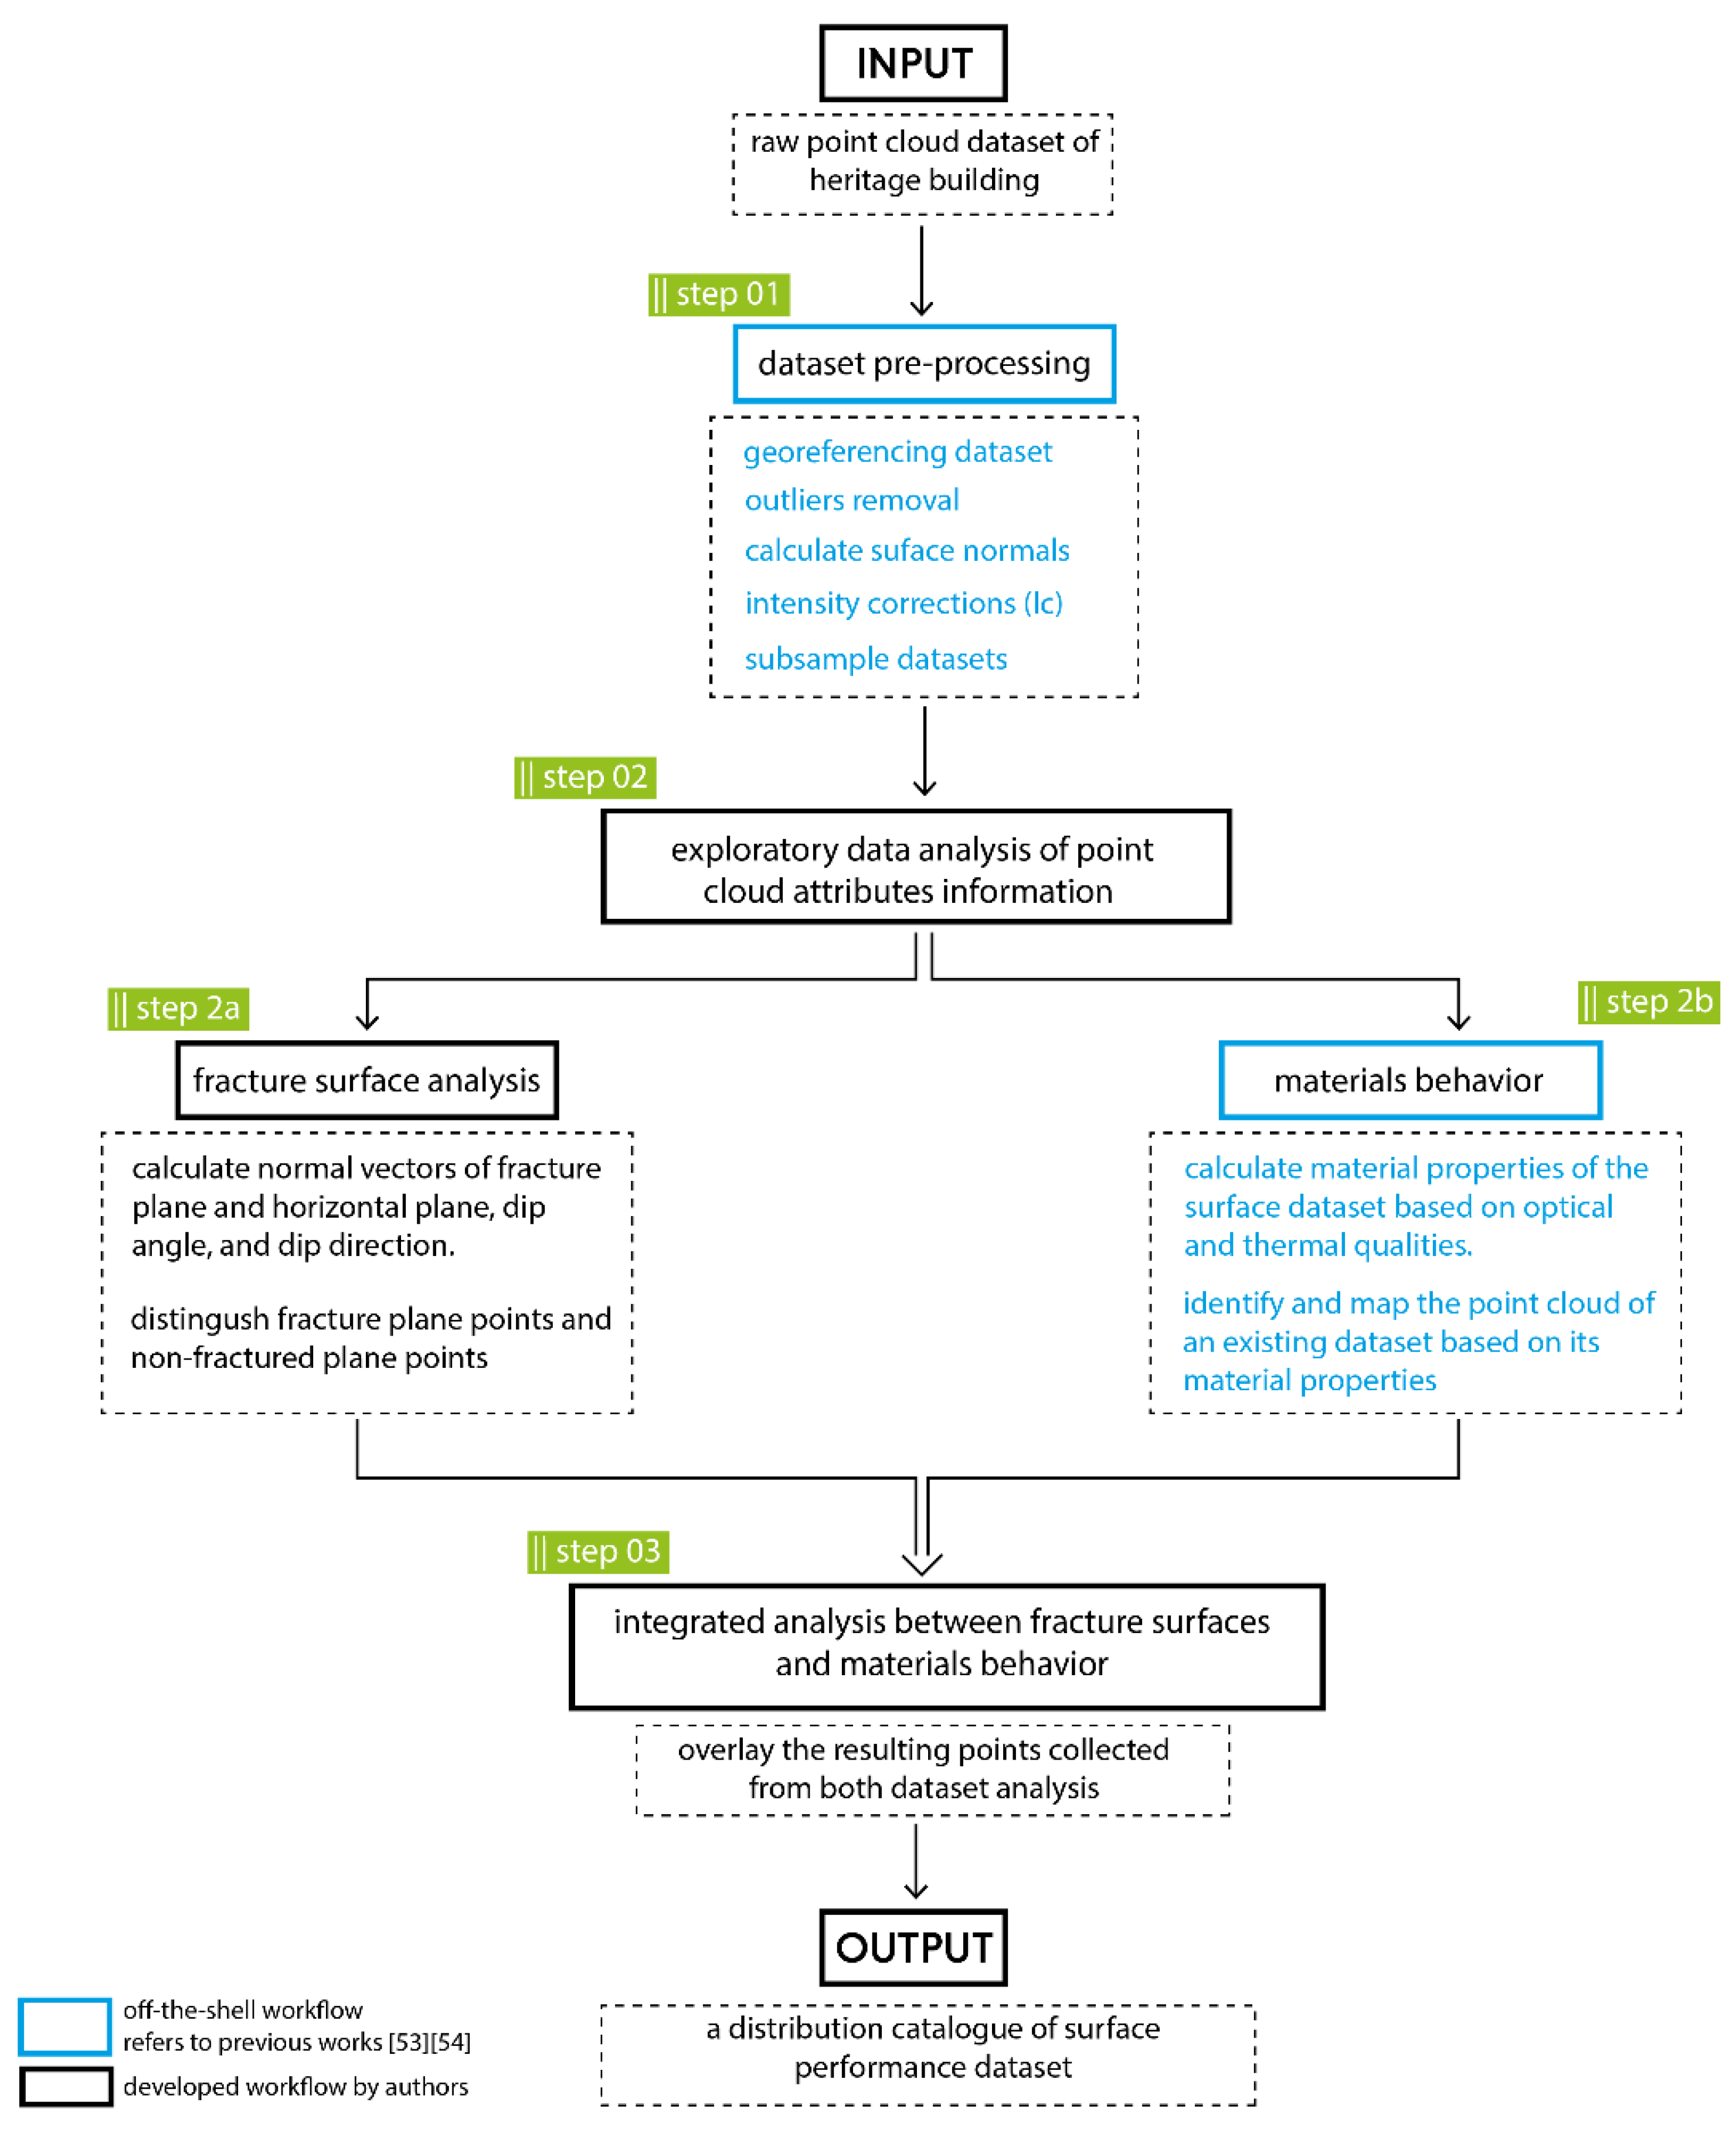
2. Methods
2.1. Step 01—Dataset Pre-Processing
2.2. Step 02—Exploratory Data Analysis of Attribute Point Cloud Information
- Fracture surface analysis
- Materials behavior
2.3. Step 03—Integrated Analysis between Material Properties and Fracture Points
3. Dataset Collection
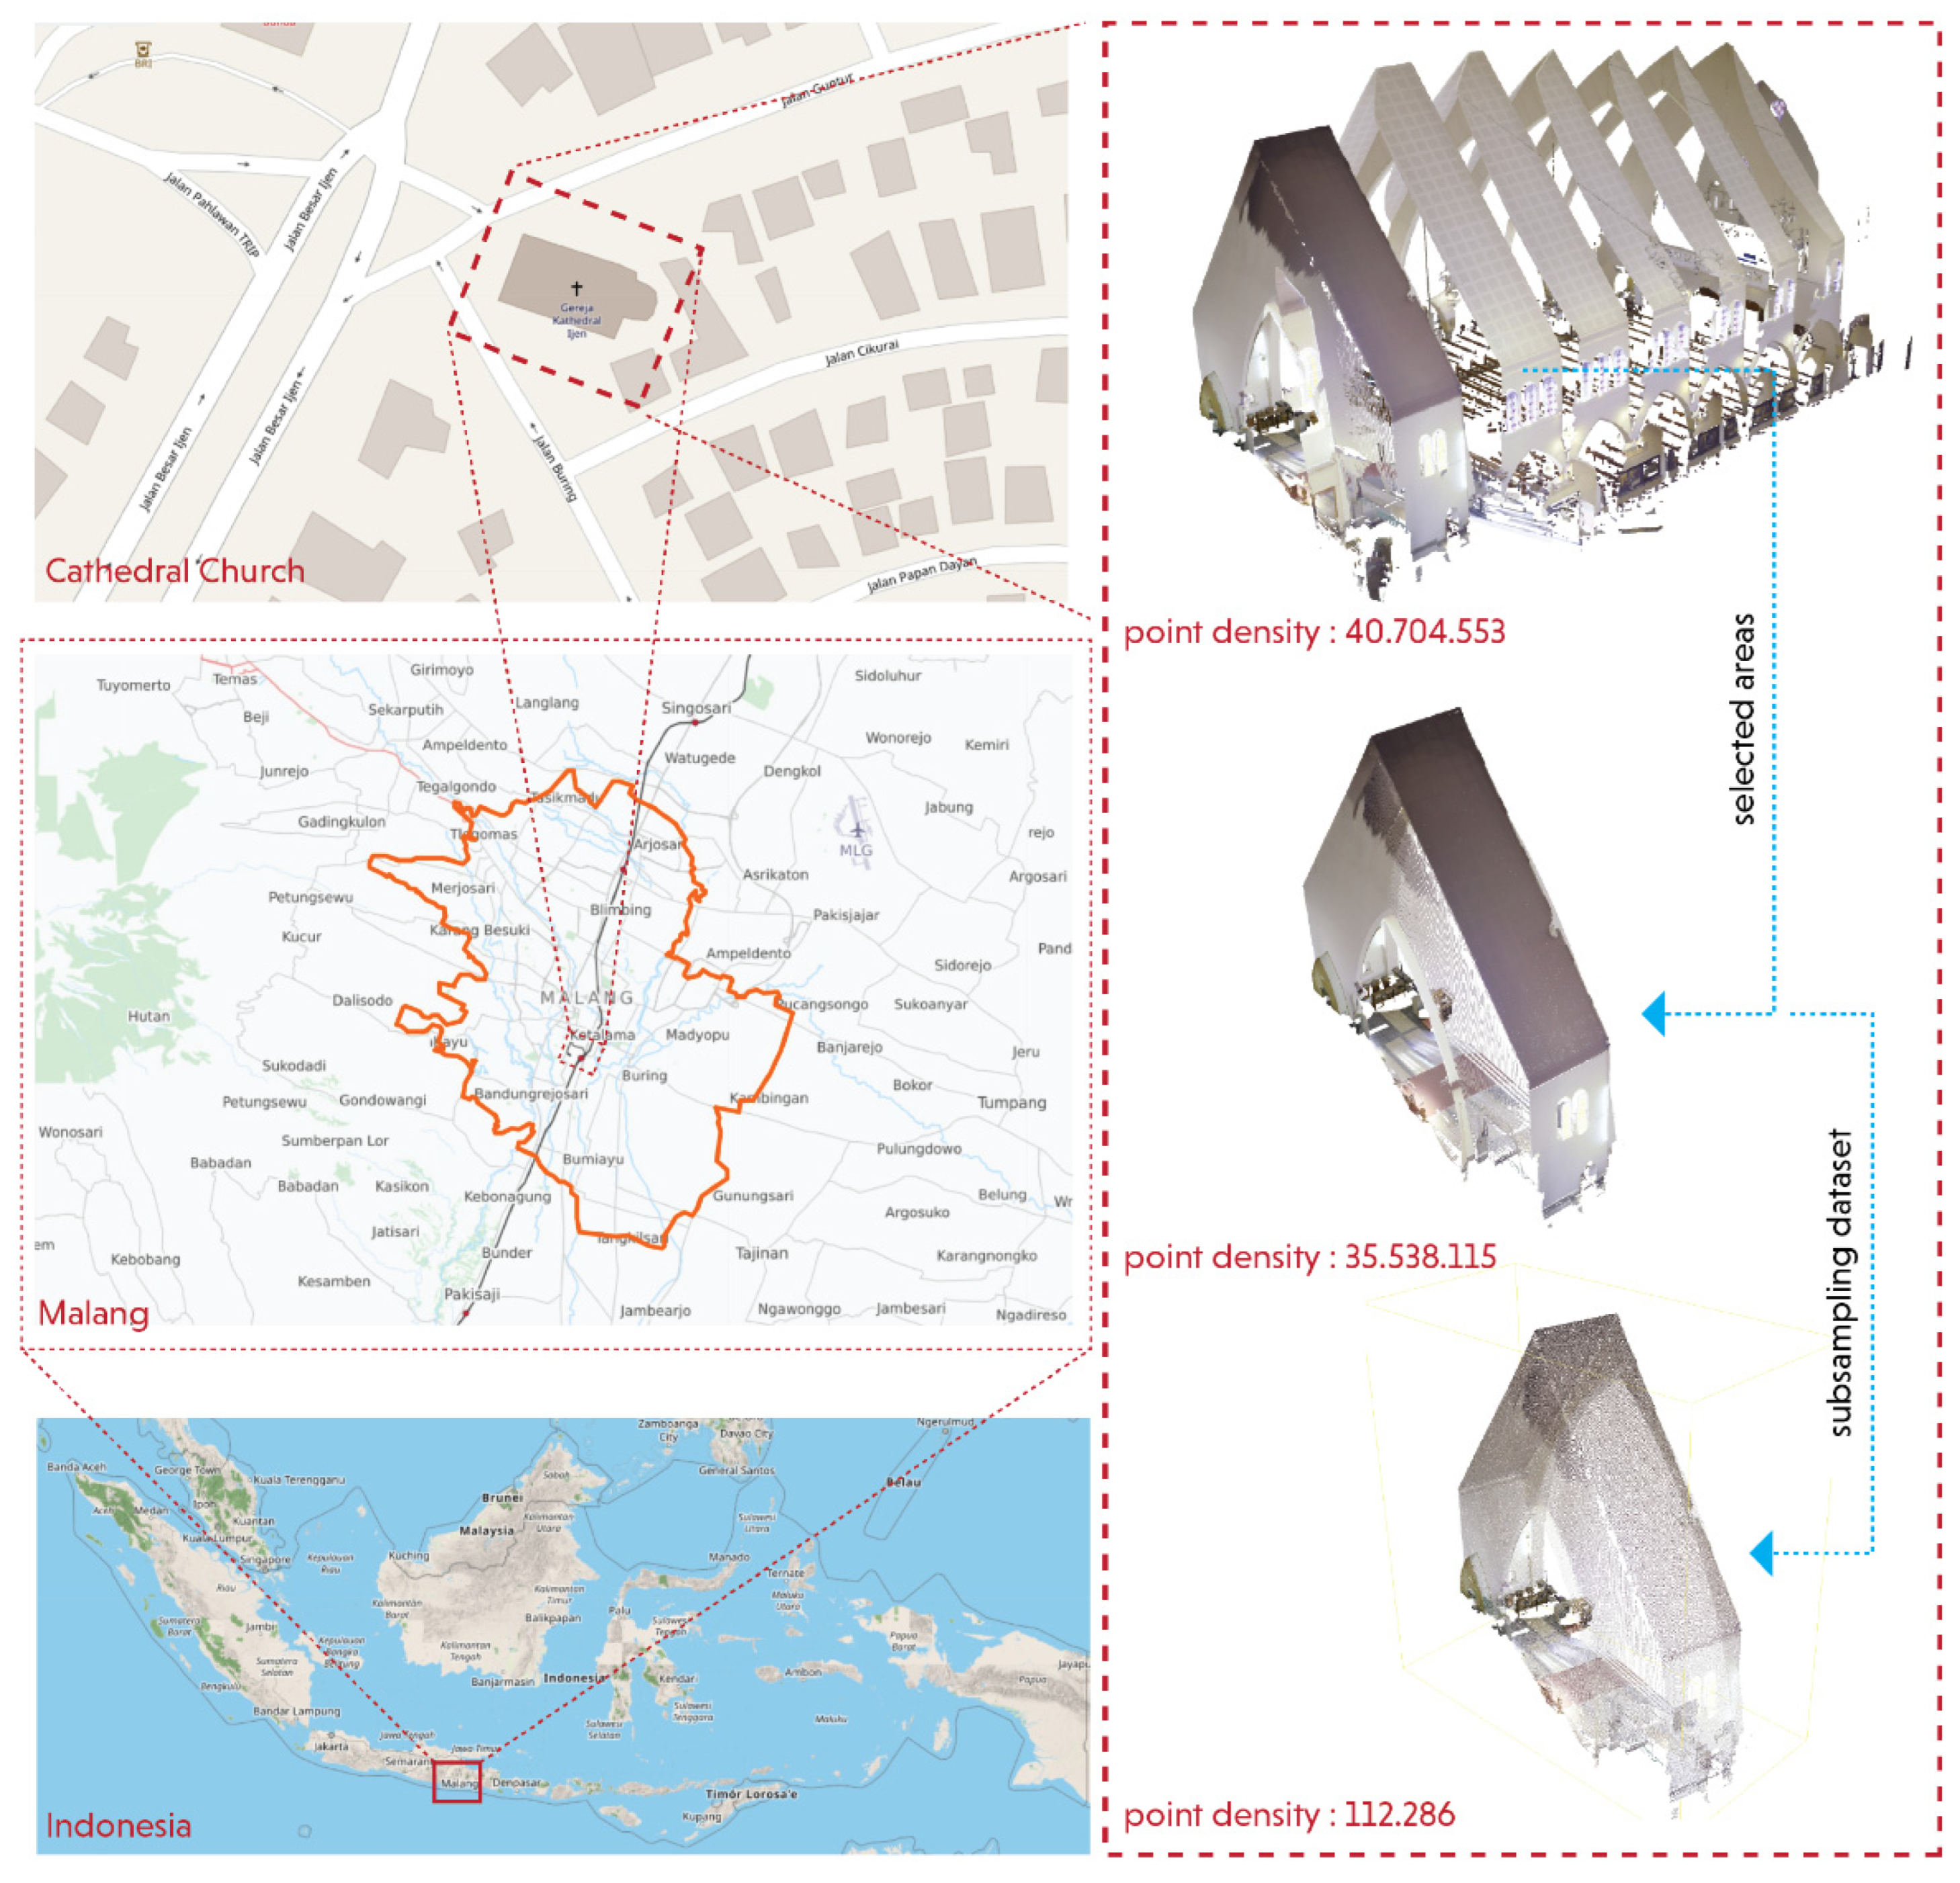
3.1. Selected Heritage Building Dataset
3.2. Selected Heritage Building Dataset
3.3. Selected Materials of the Heritage Building
4. Result and Discussion
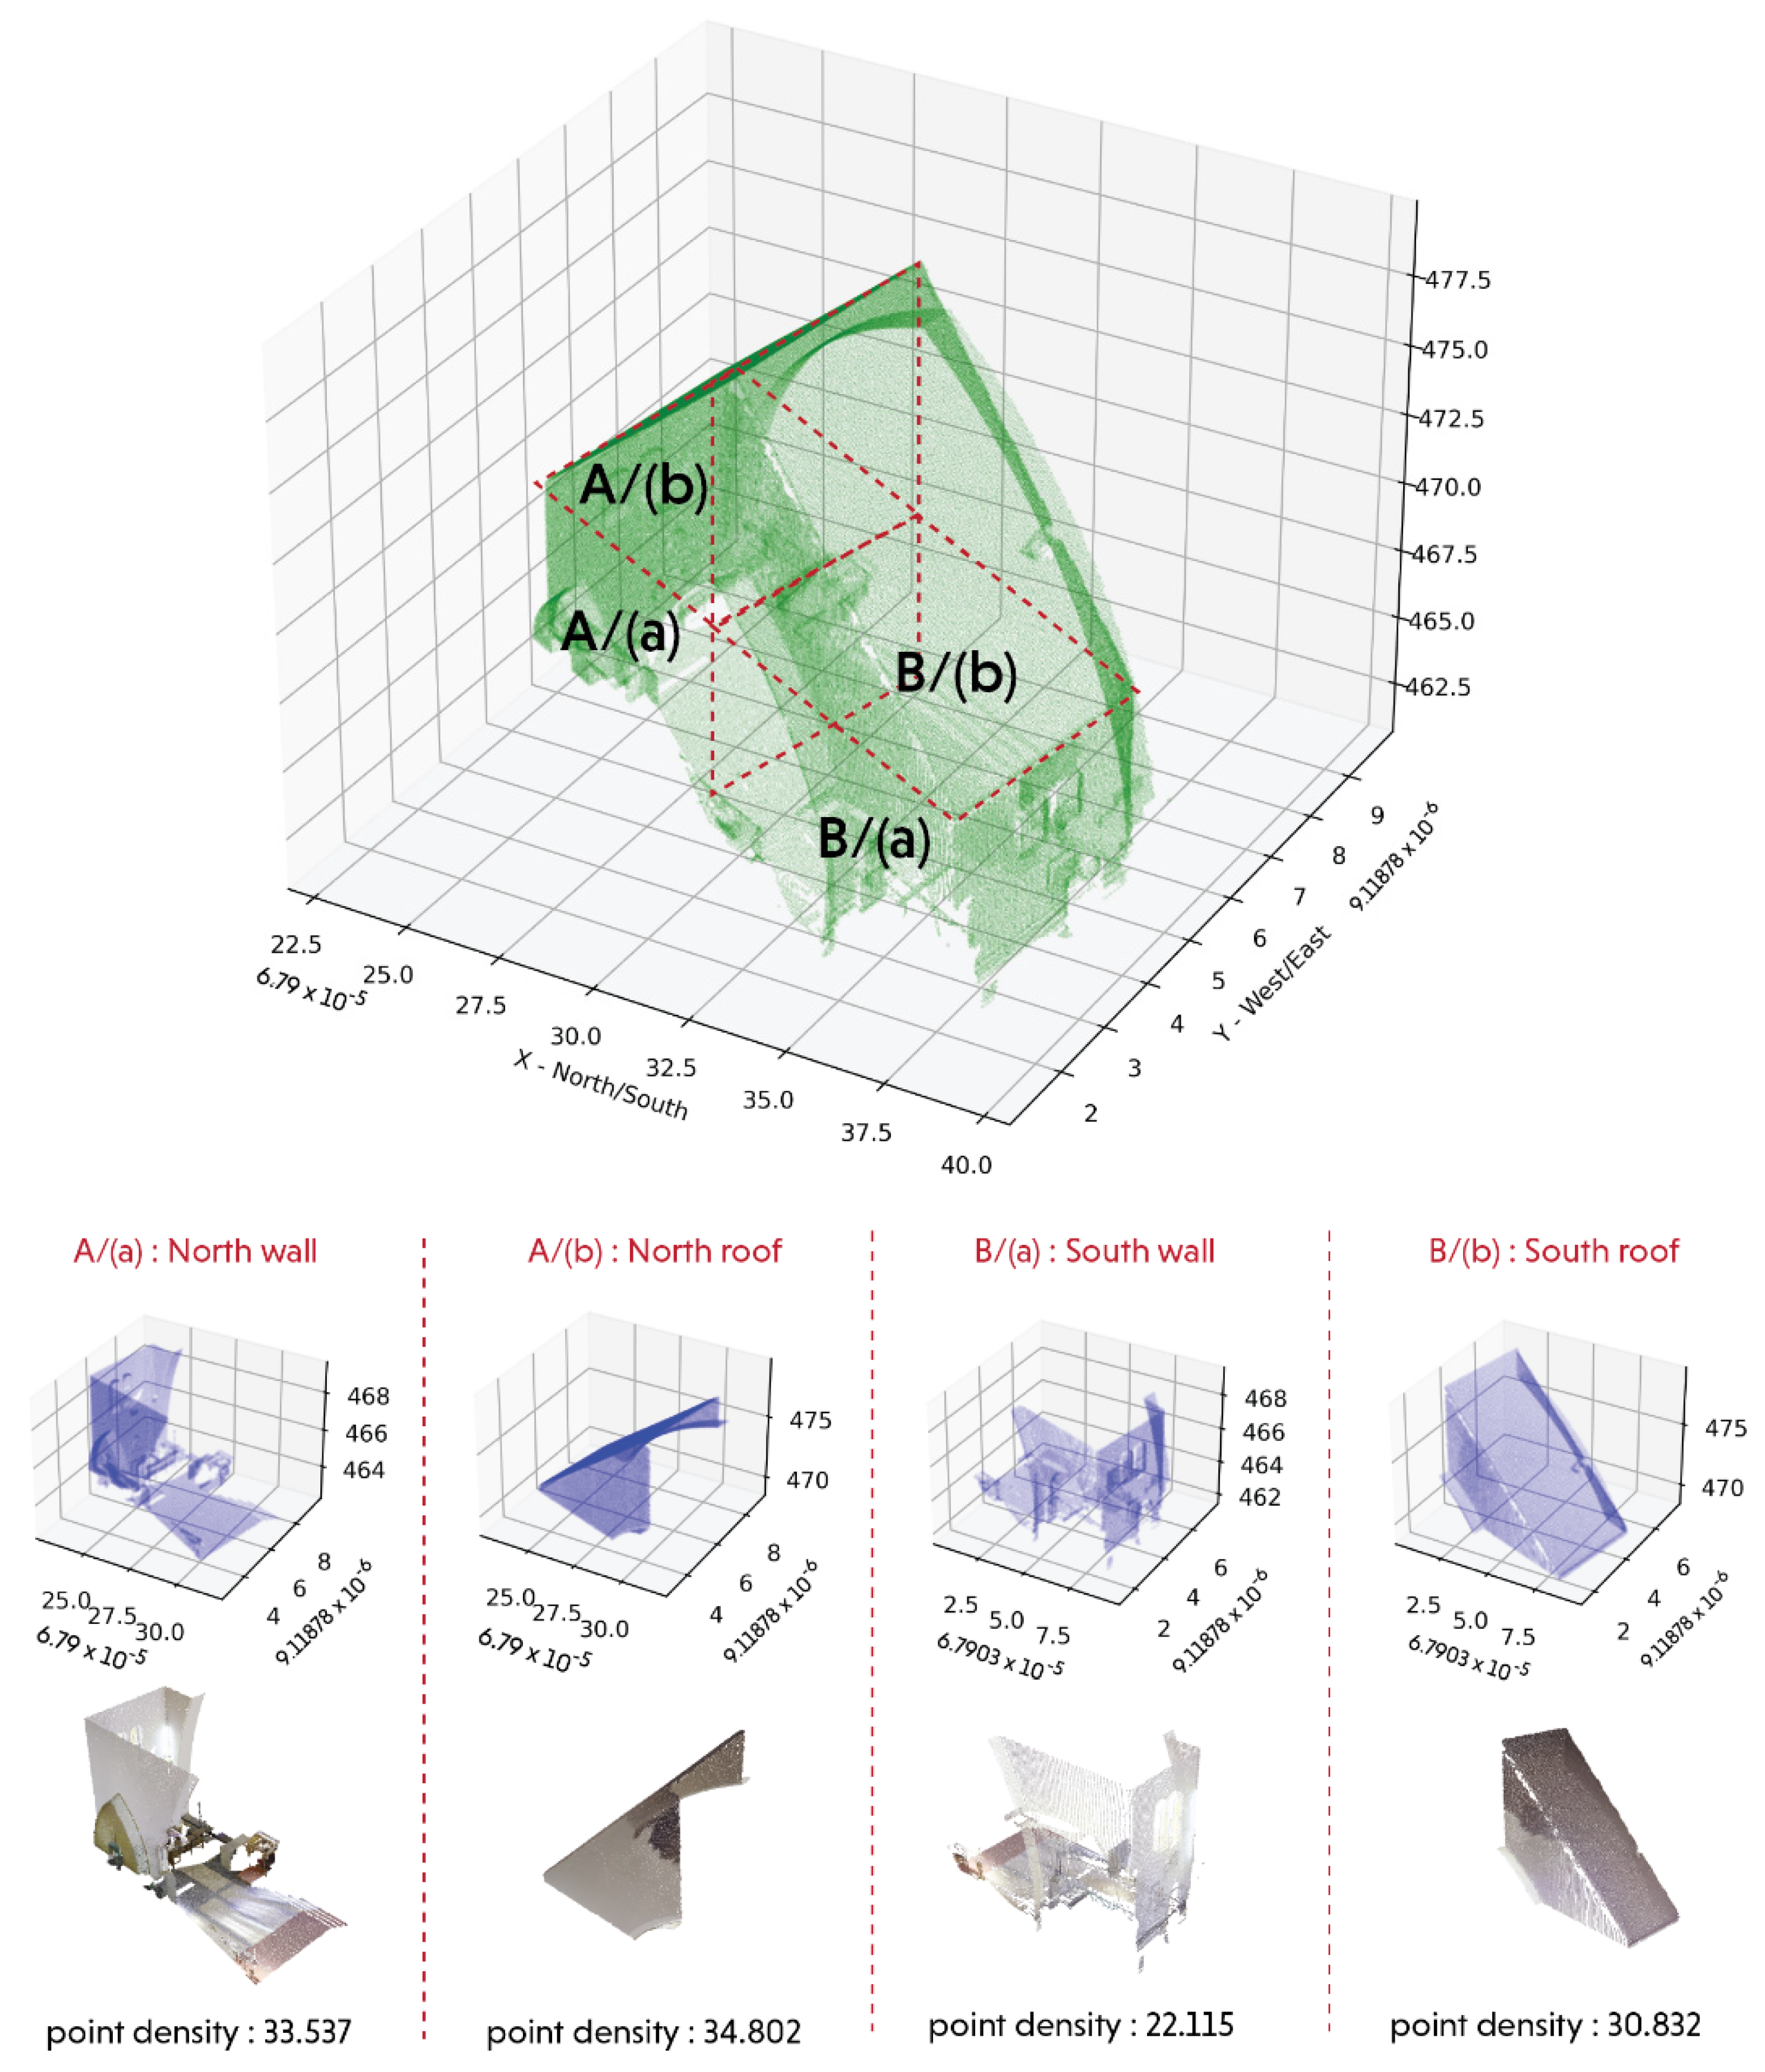
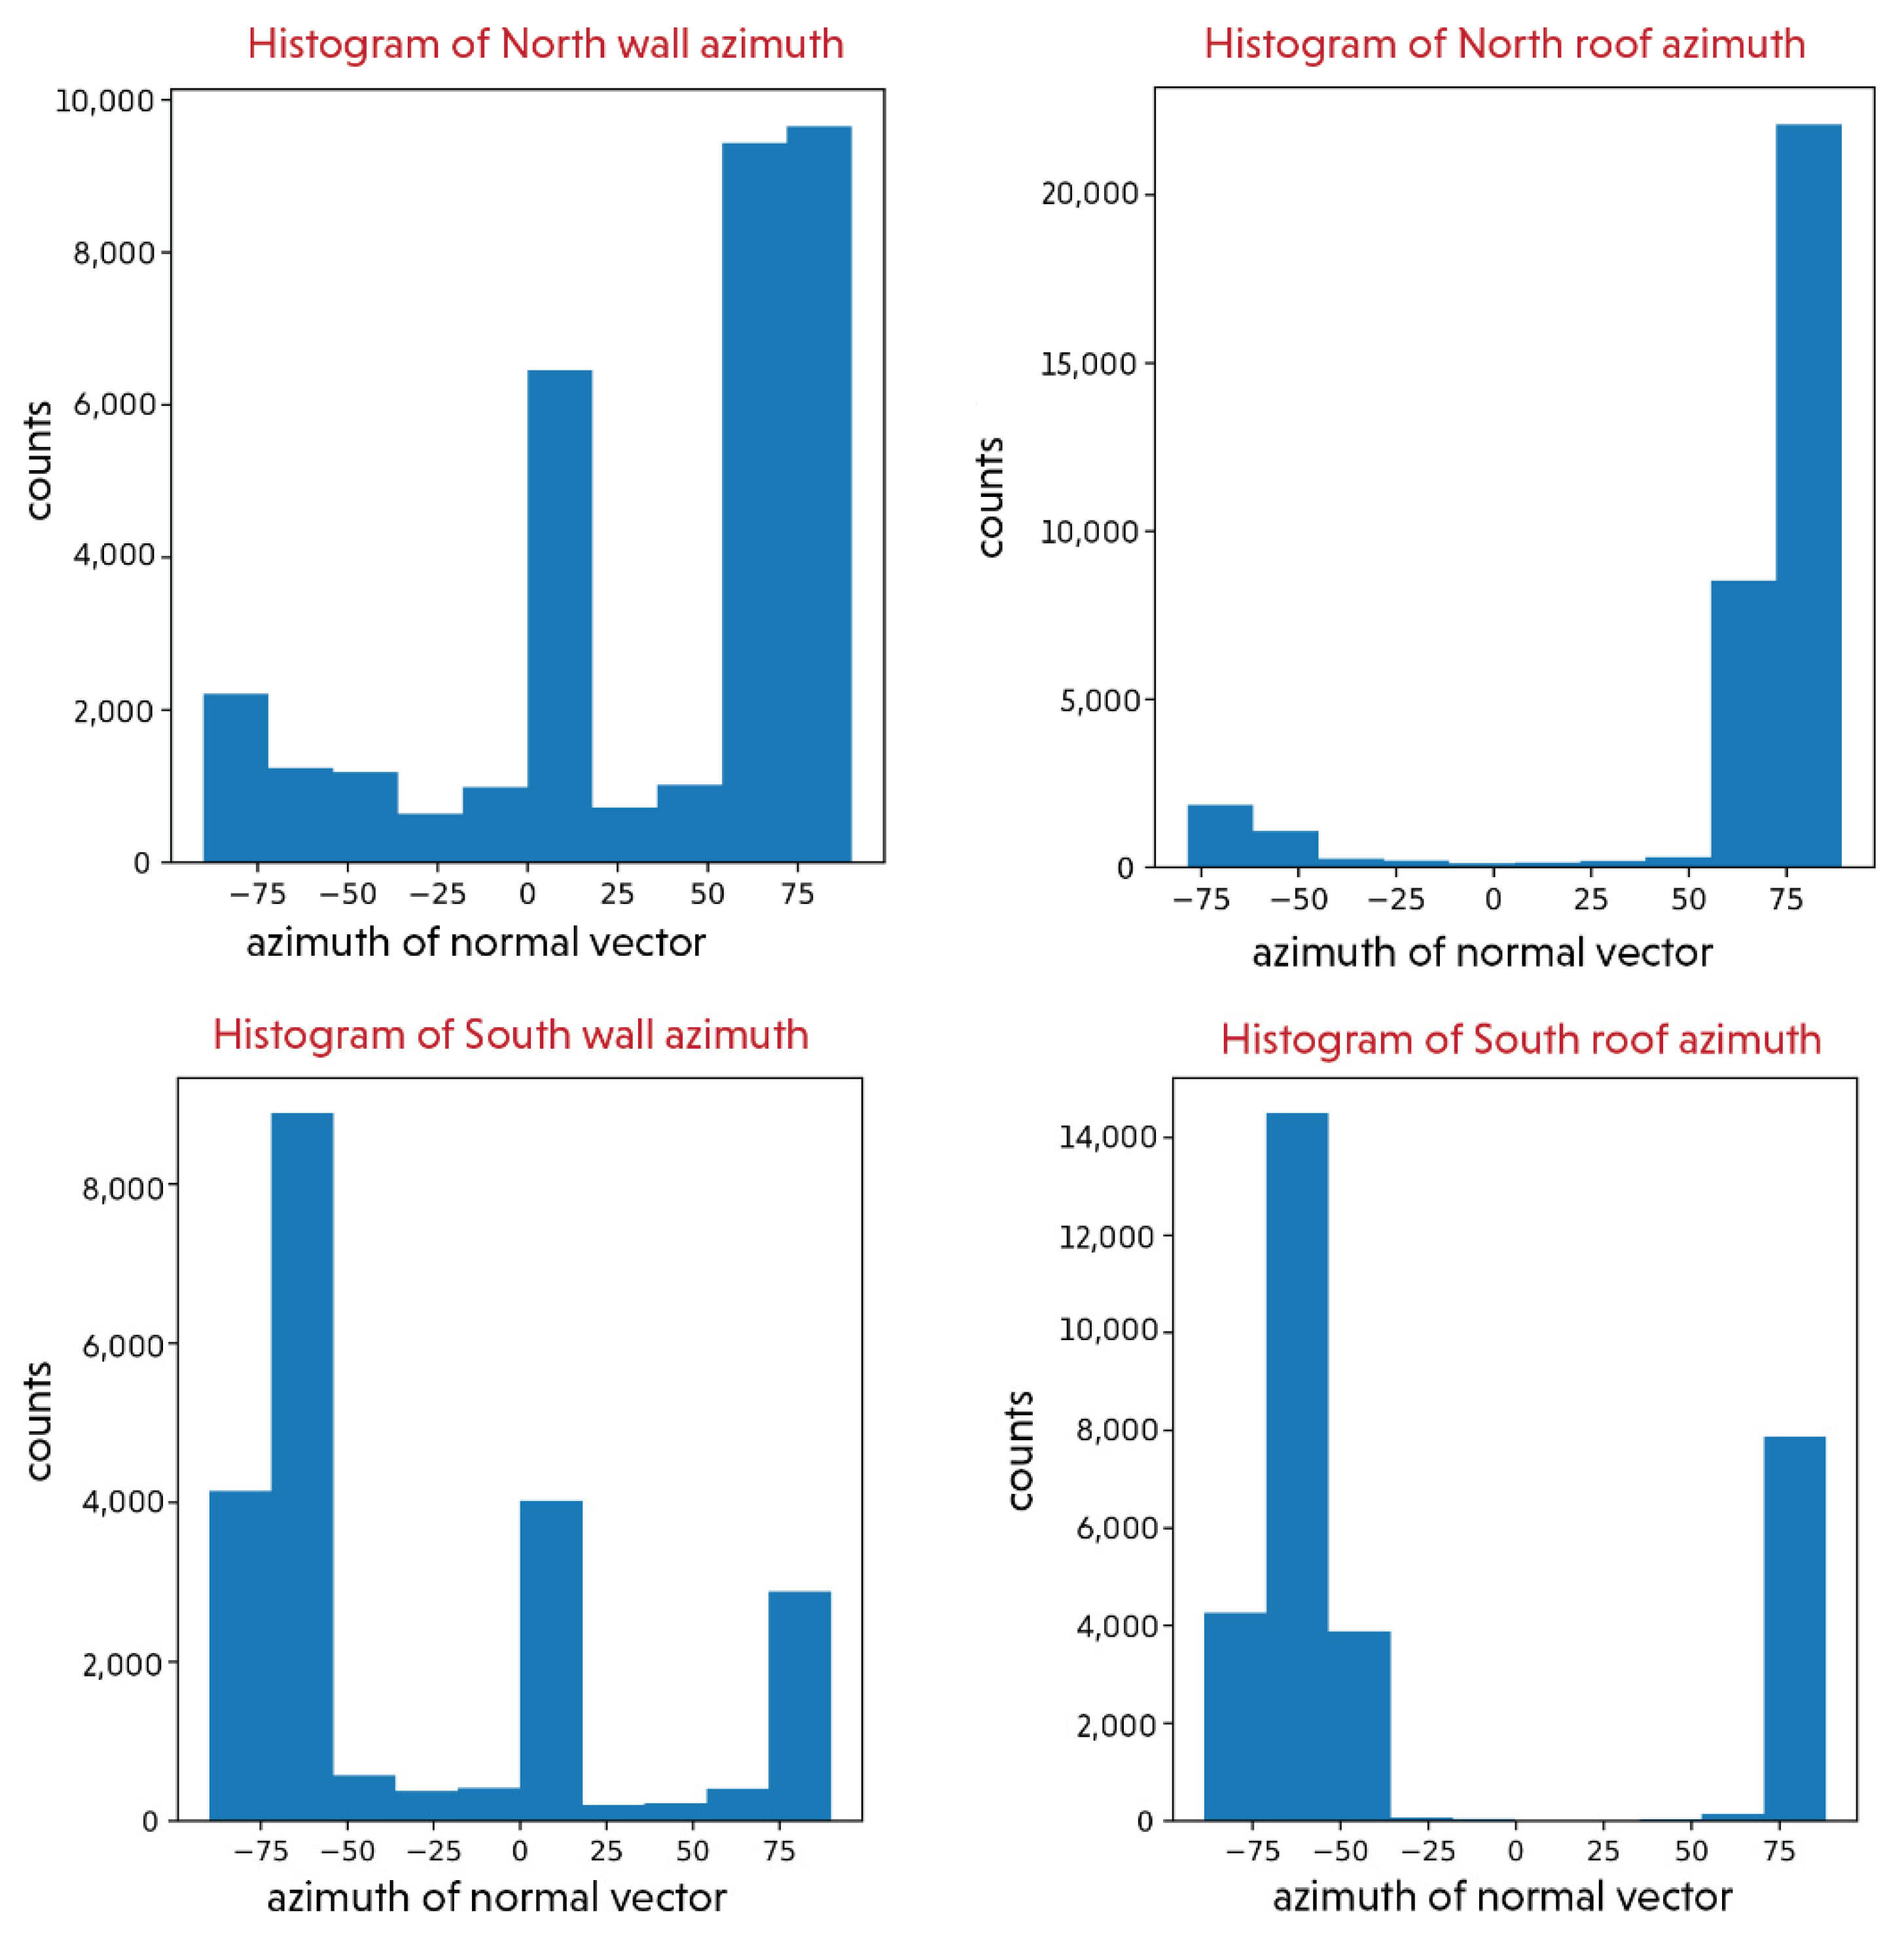
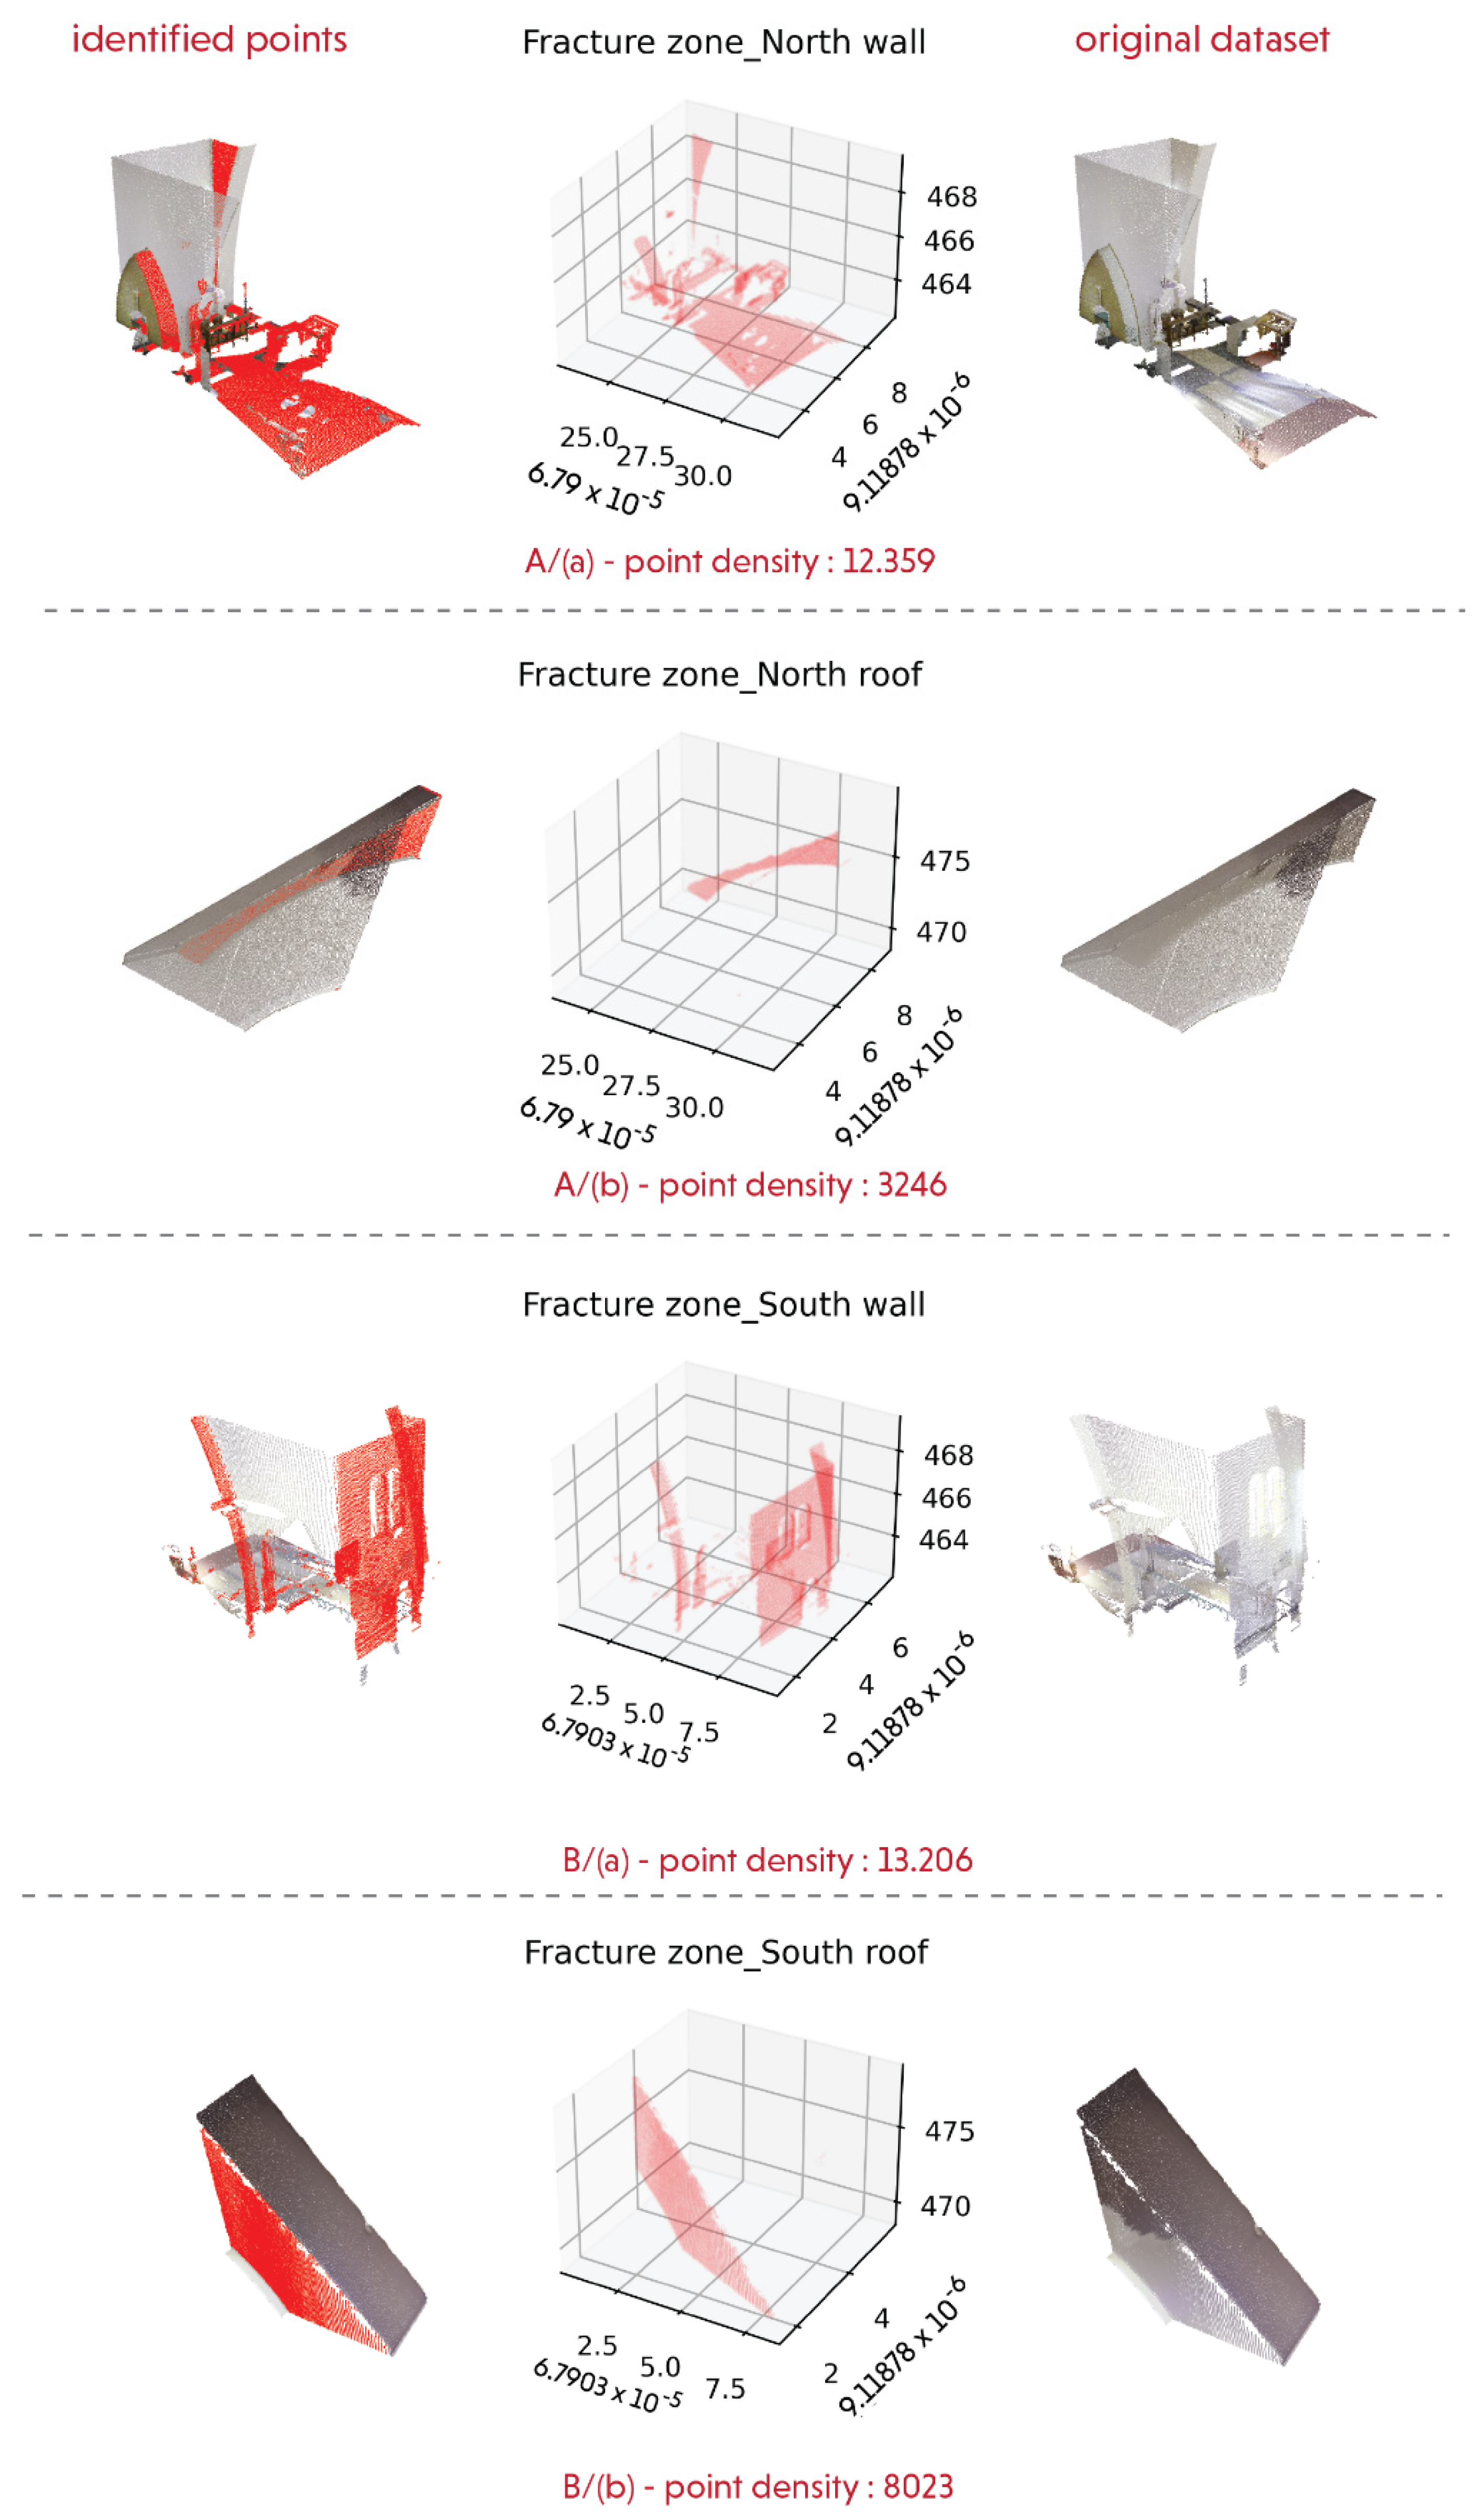
4.1. Fracture Surface Analysis
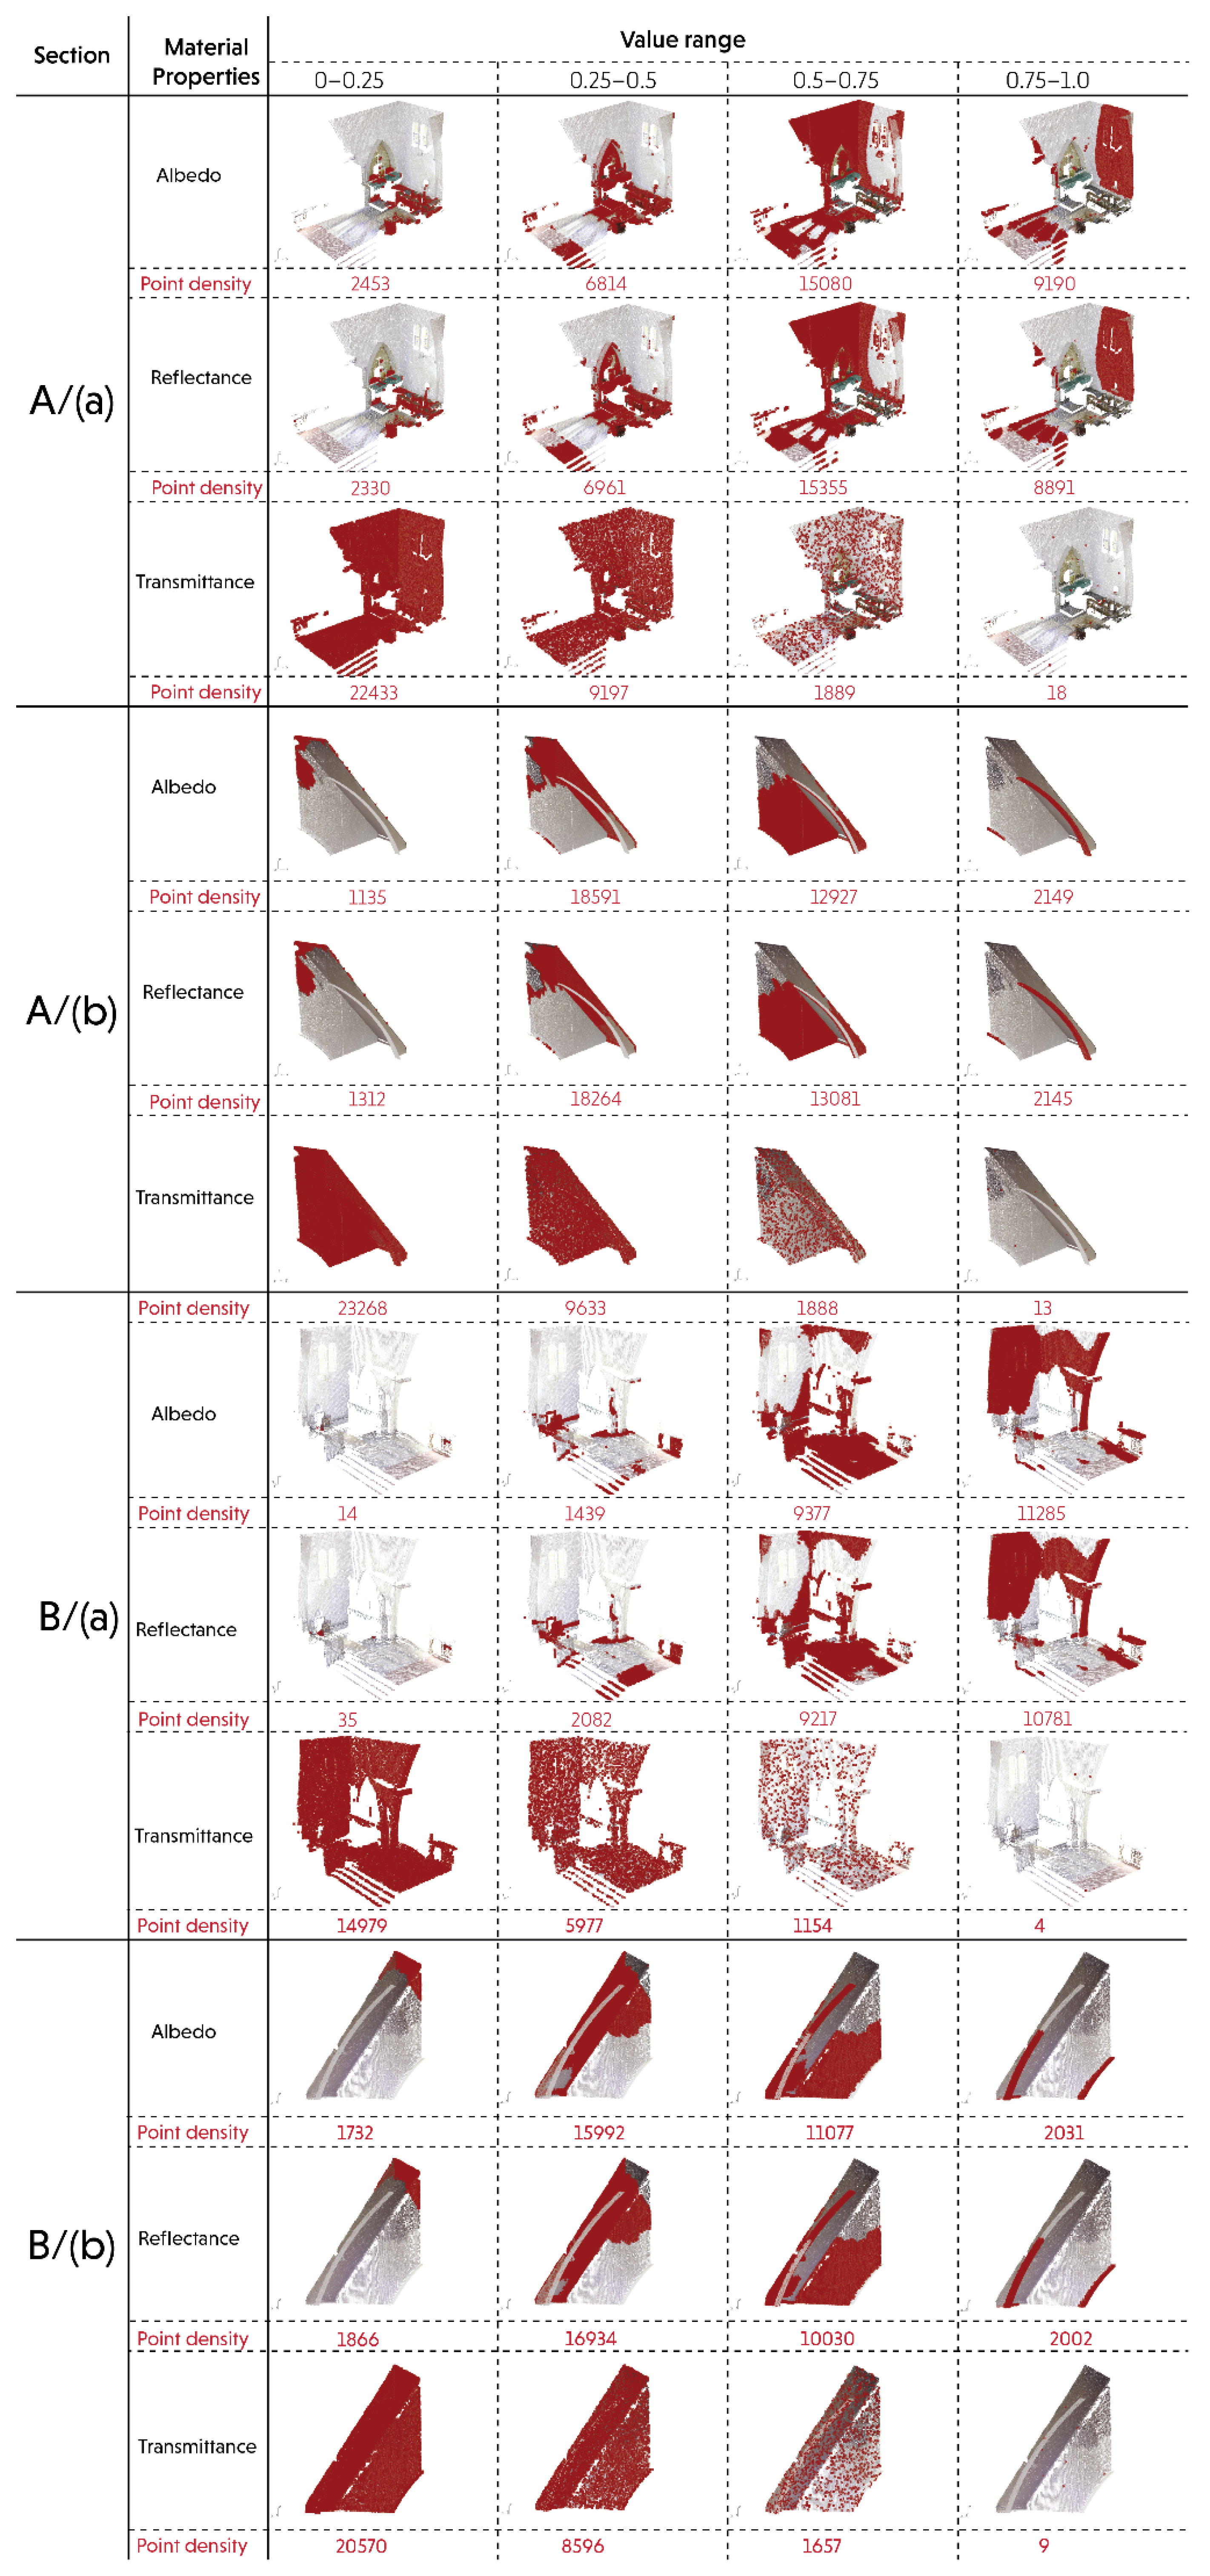
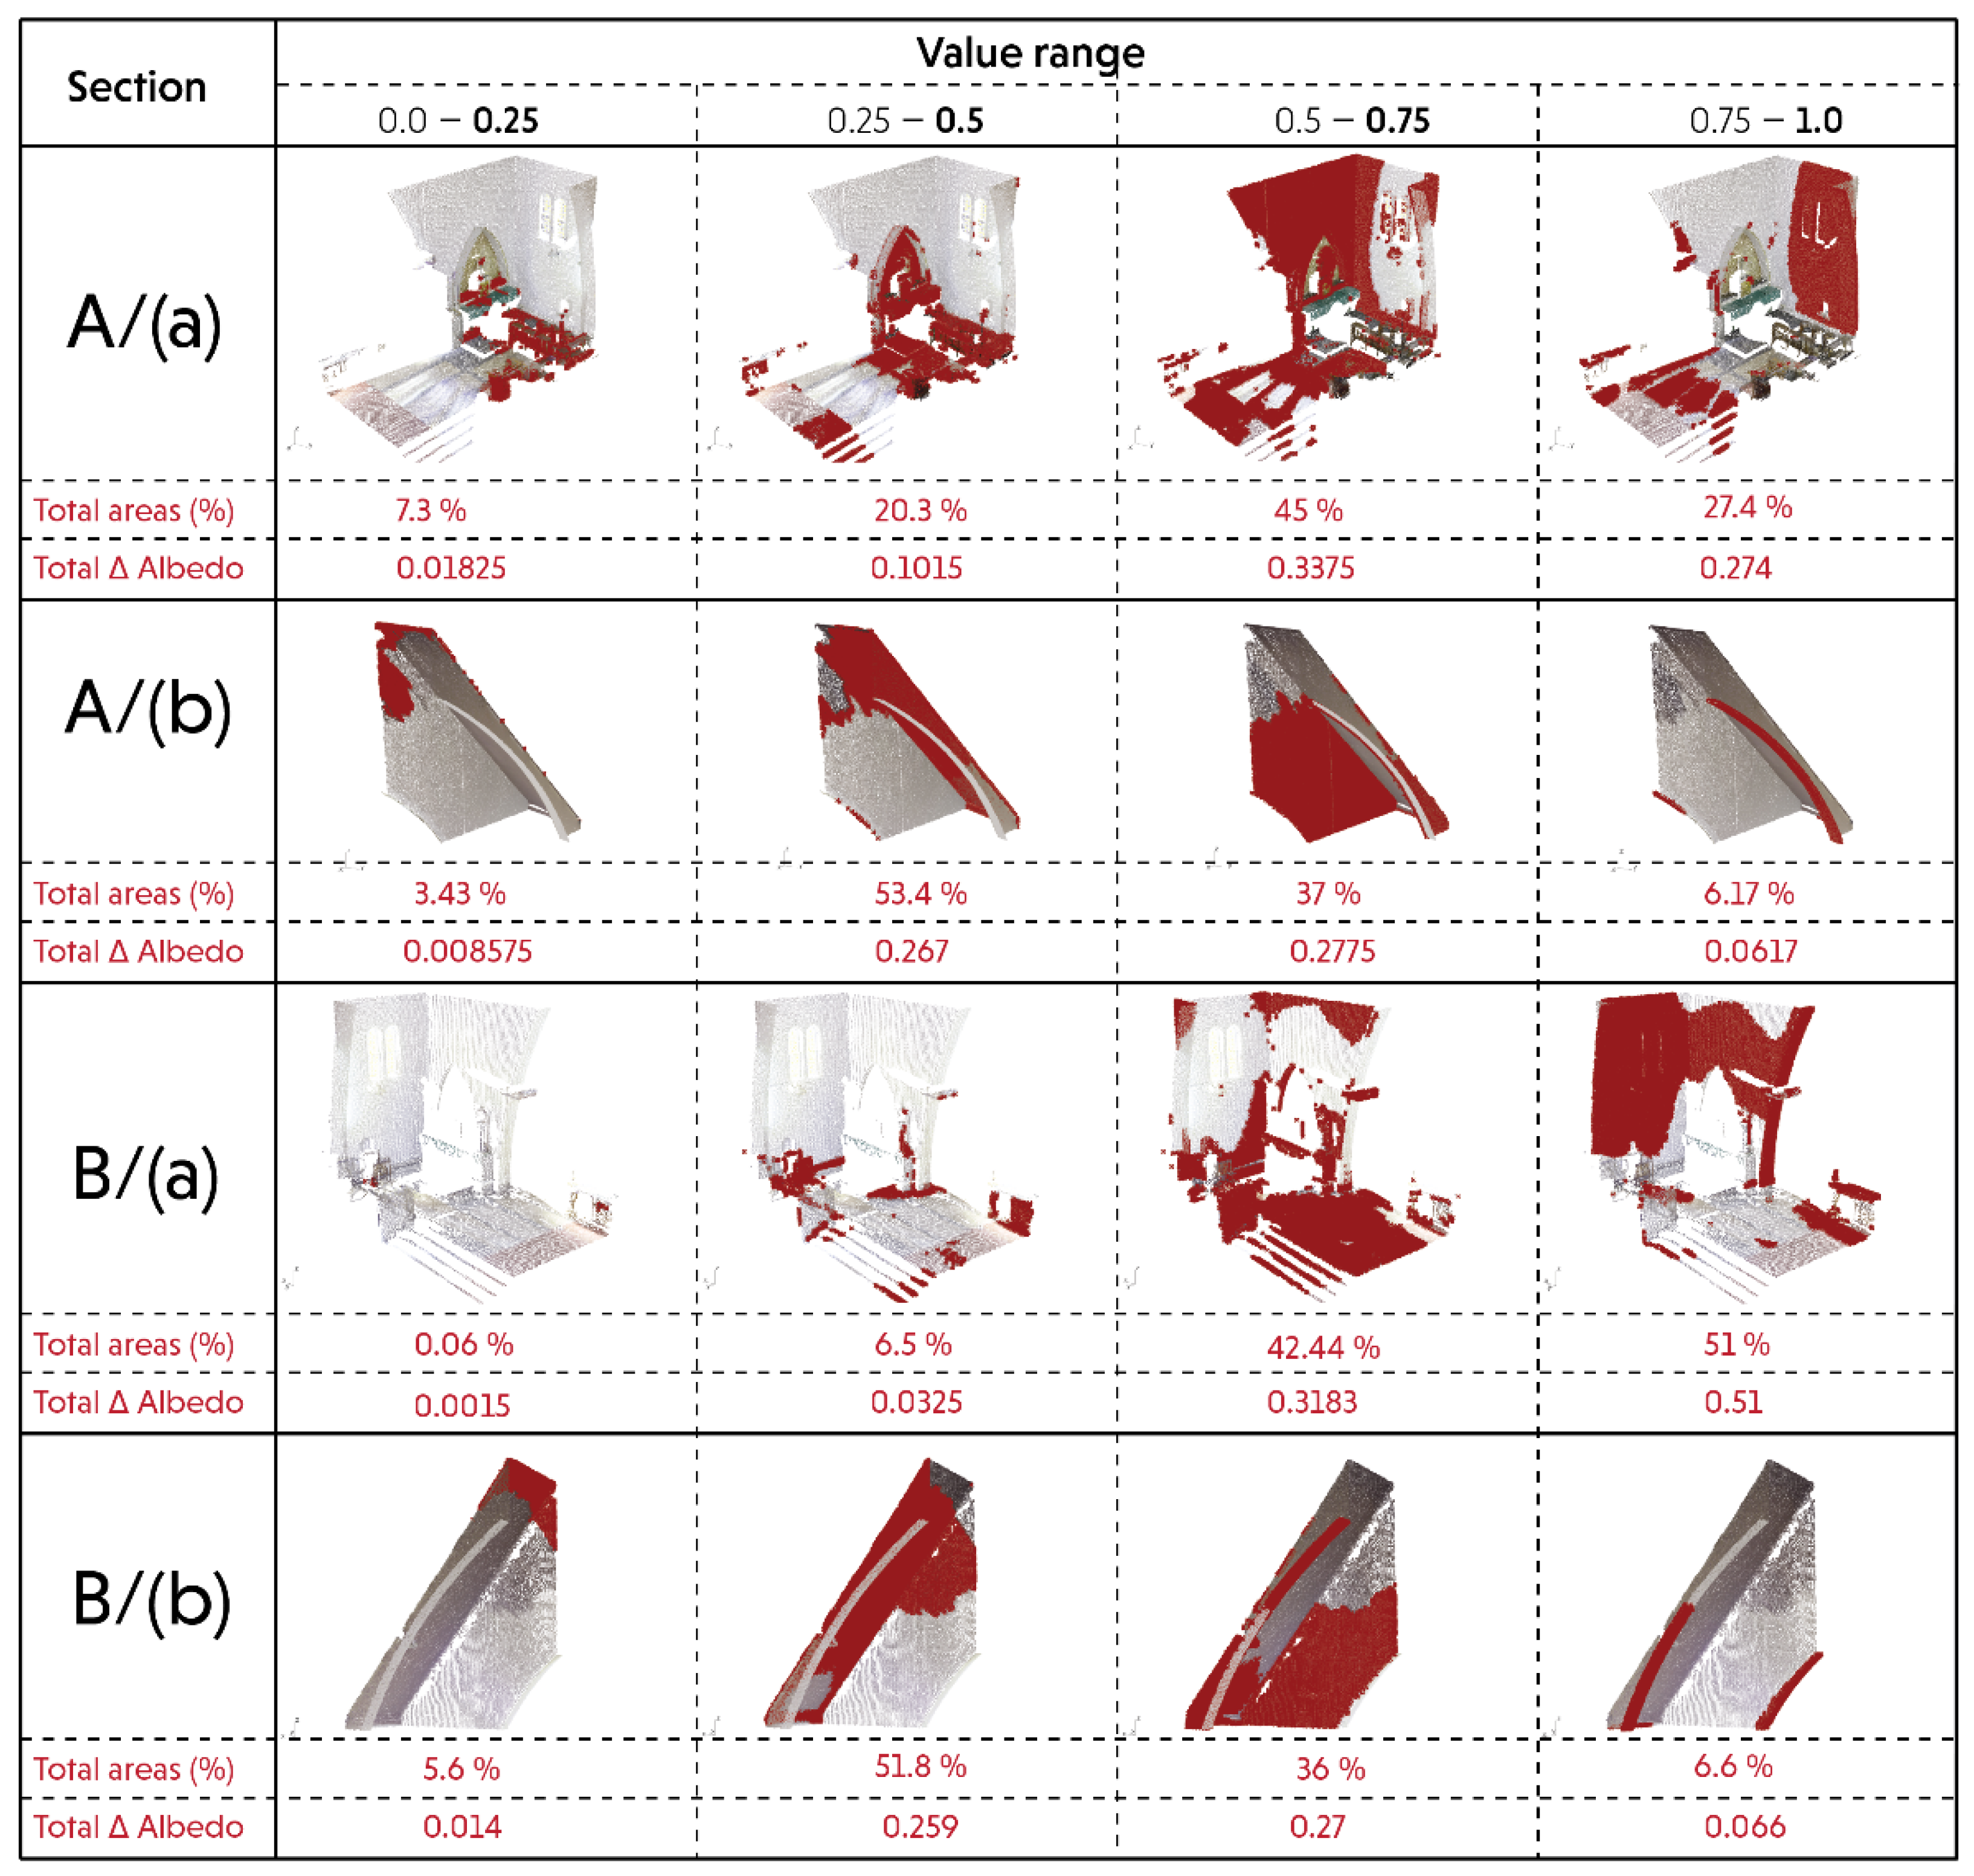
4.2. Materials Behavior
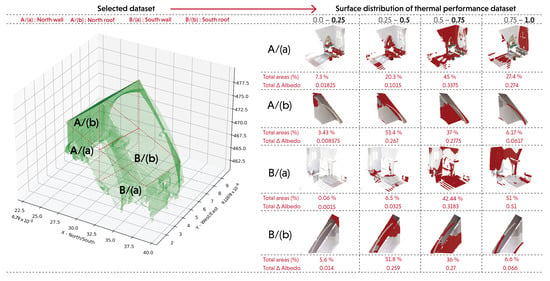
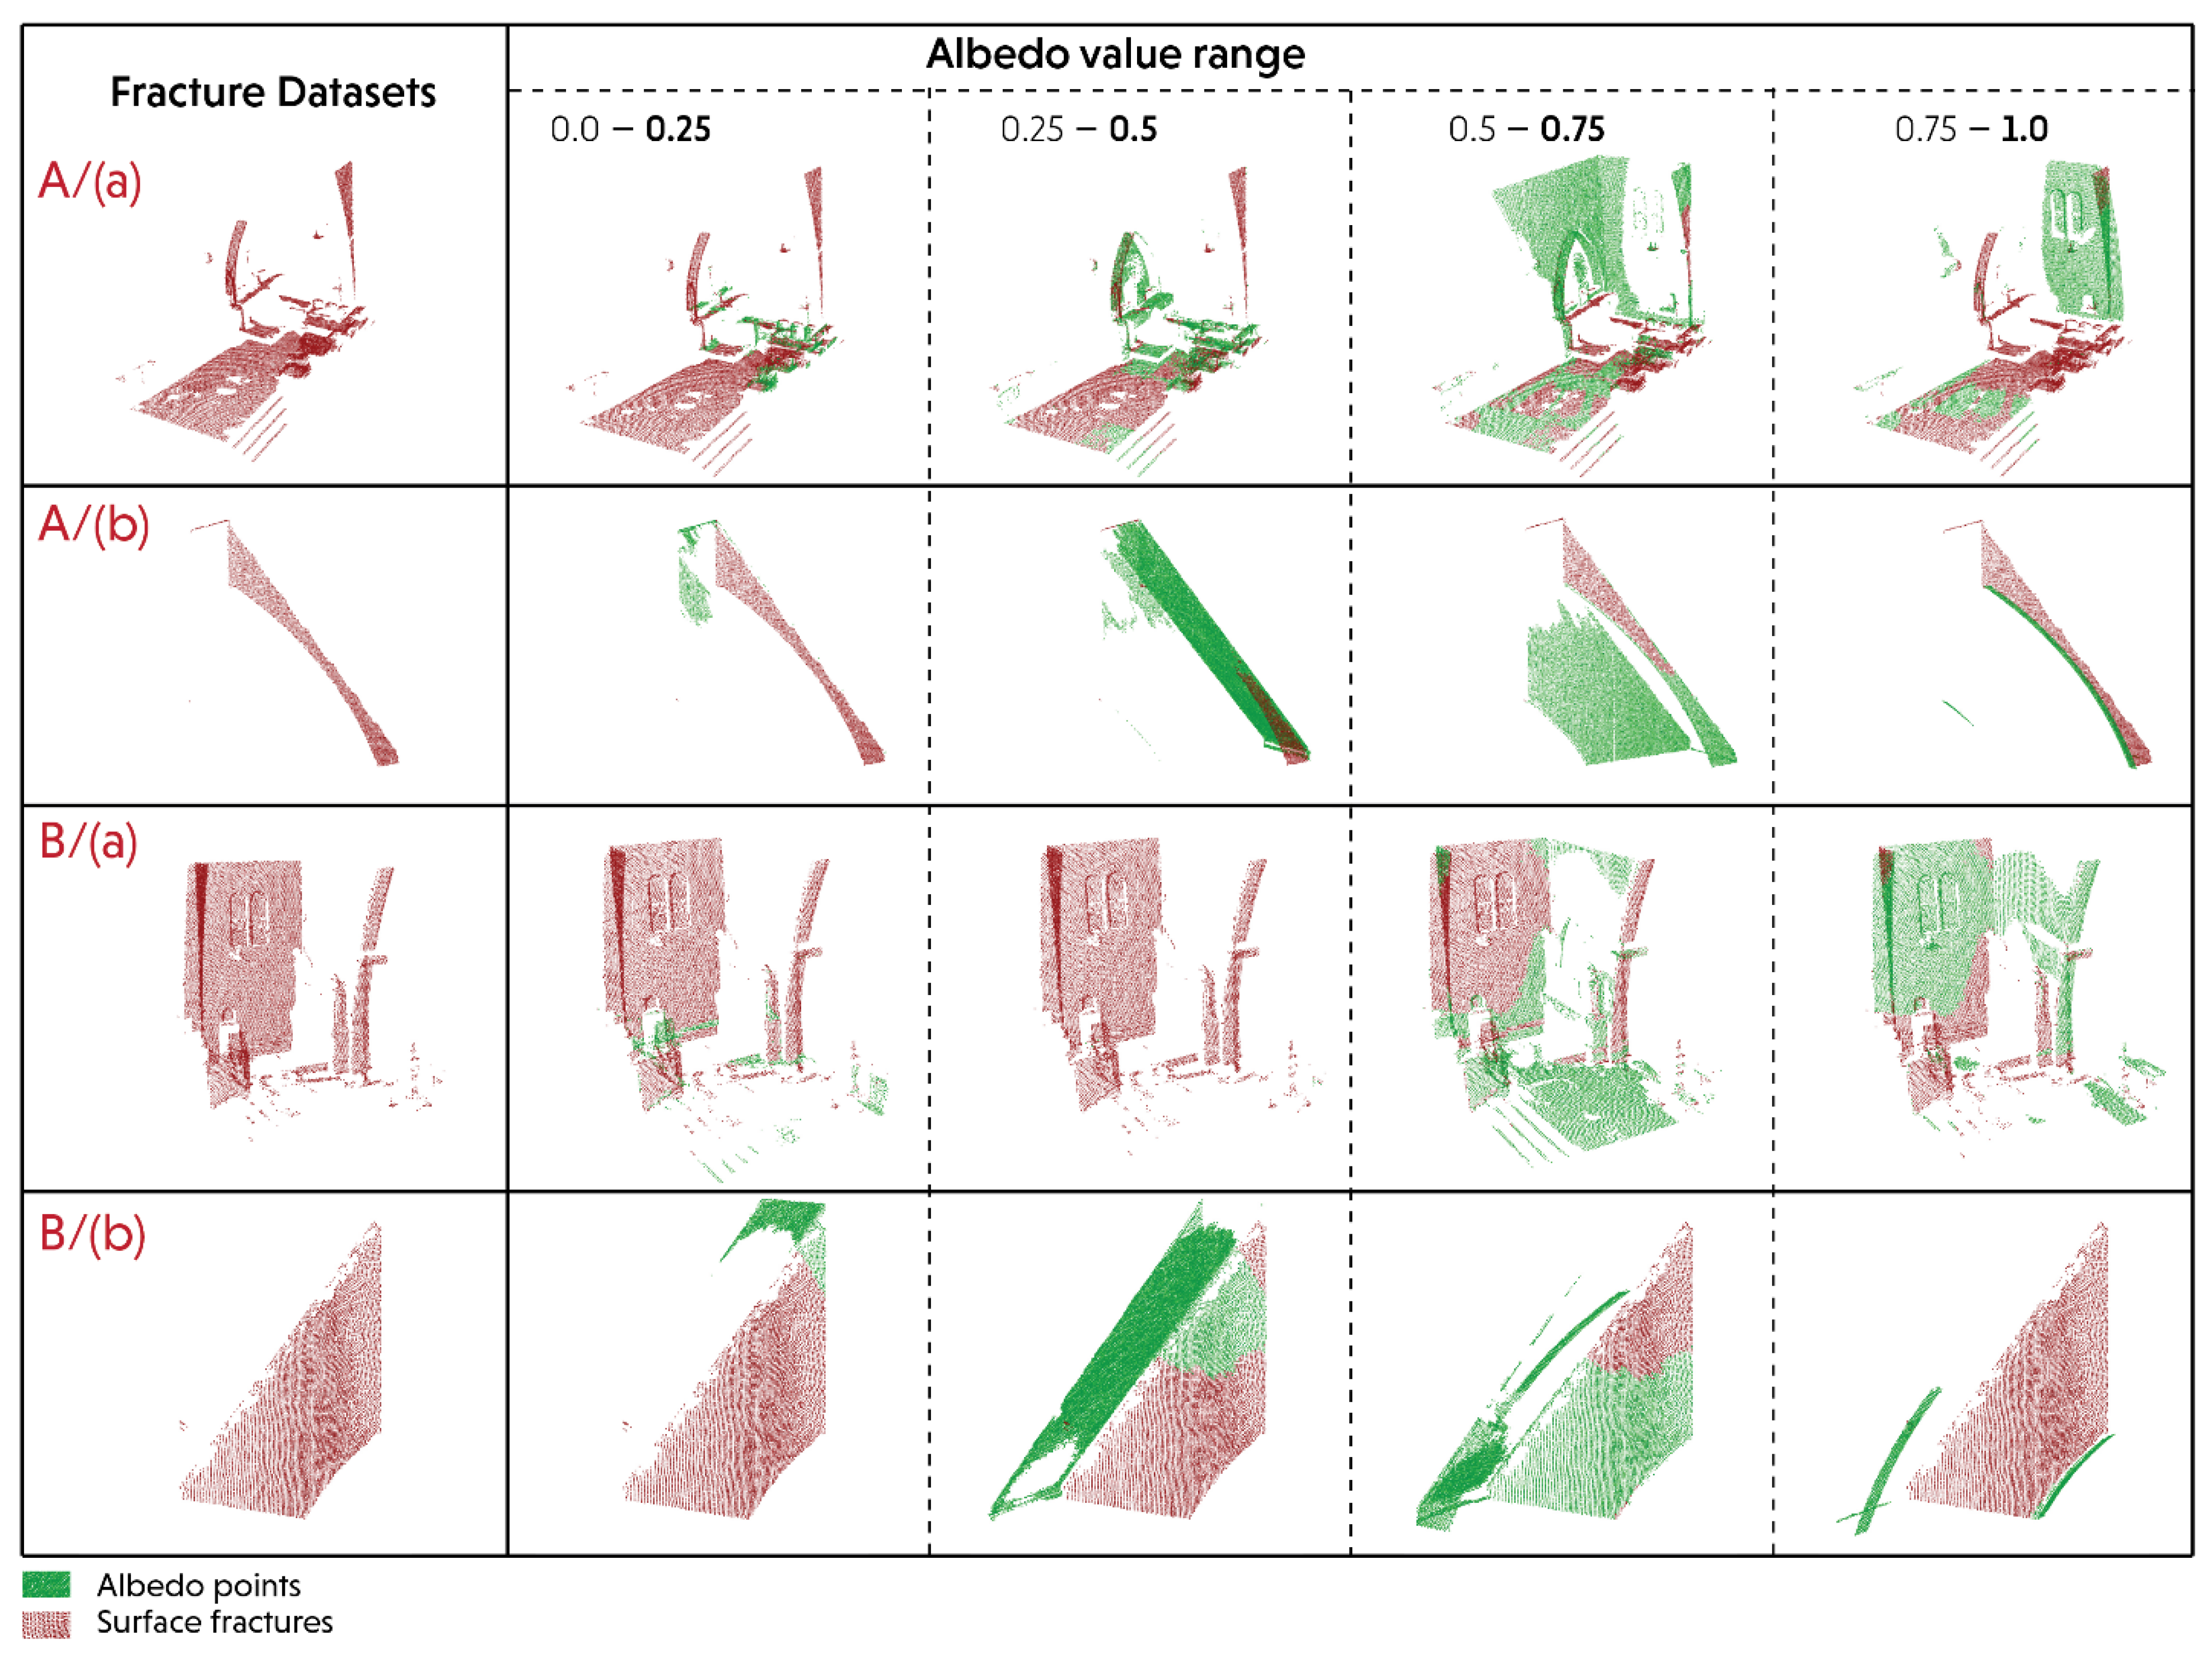
4.3. Comparative Analysis between Fracture Analysis and Material Behaviors of the Dataset
5. Conclusions
- Dataset preprocessing tasks such as georeferencing, outliers removal, intensity corrections, and dataset subsampling play a crucial part in this study, which is not only useful for filtering relevant information from the raw point cloud data, but also for minimizing erroneous results during the dataset measurement. However, there are some aspects to consider, such as the trade-off during the dataset subsampling of whether to have a dense dataset or maintain computational time and costs. In this regard, this study ultimately applies a spatial distance of 5 cm to enable one to perform the integrated workflow between fracture analysis and materials behavior. In addition, this study selects the angle of incidence as the correction parameter for intensity values as it is closely related and relevant to the main scope of the study. In this case, the distance effects are assumed to be maintained by the scanner due to an automatic brightness-reducer at a certain distance.
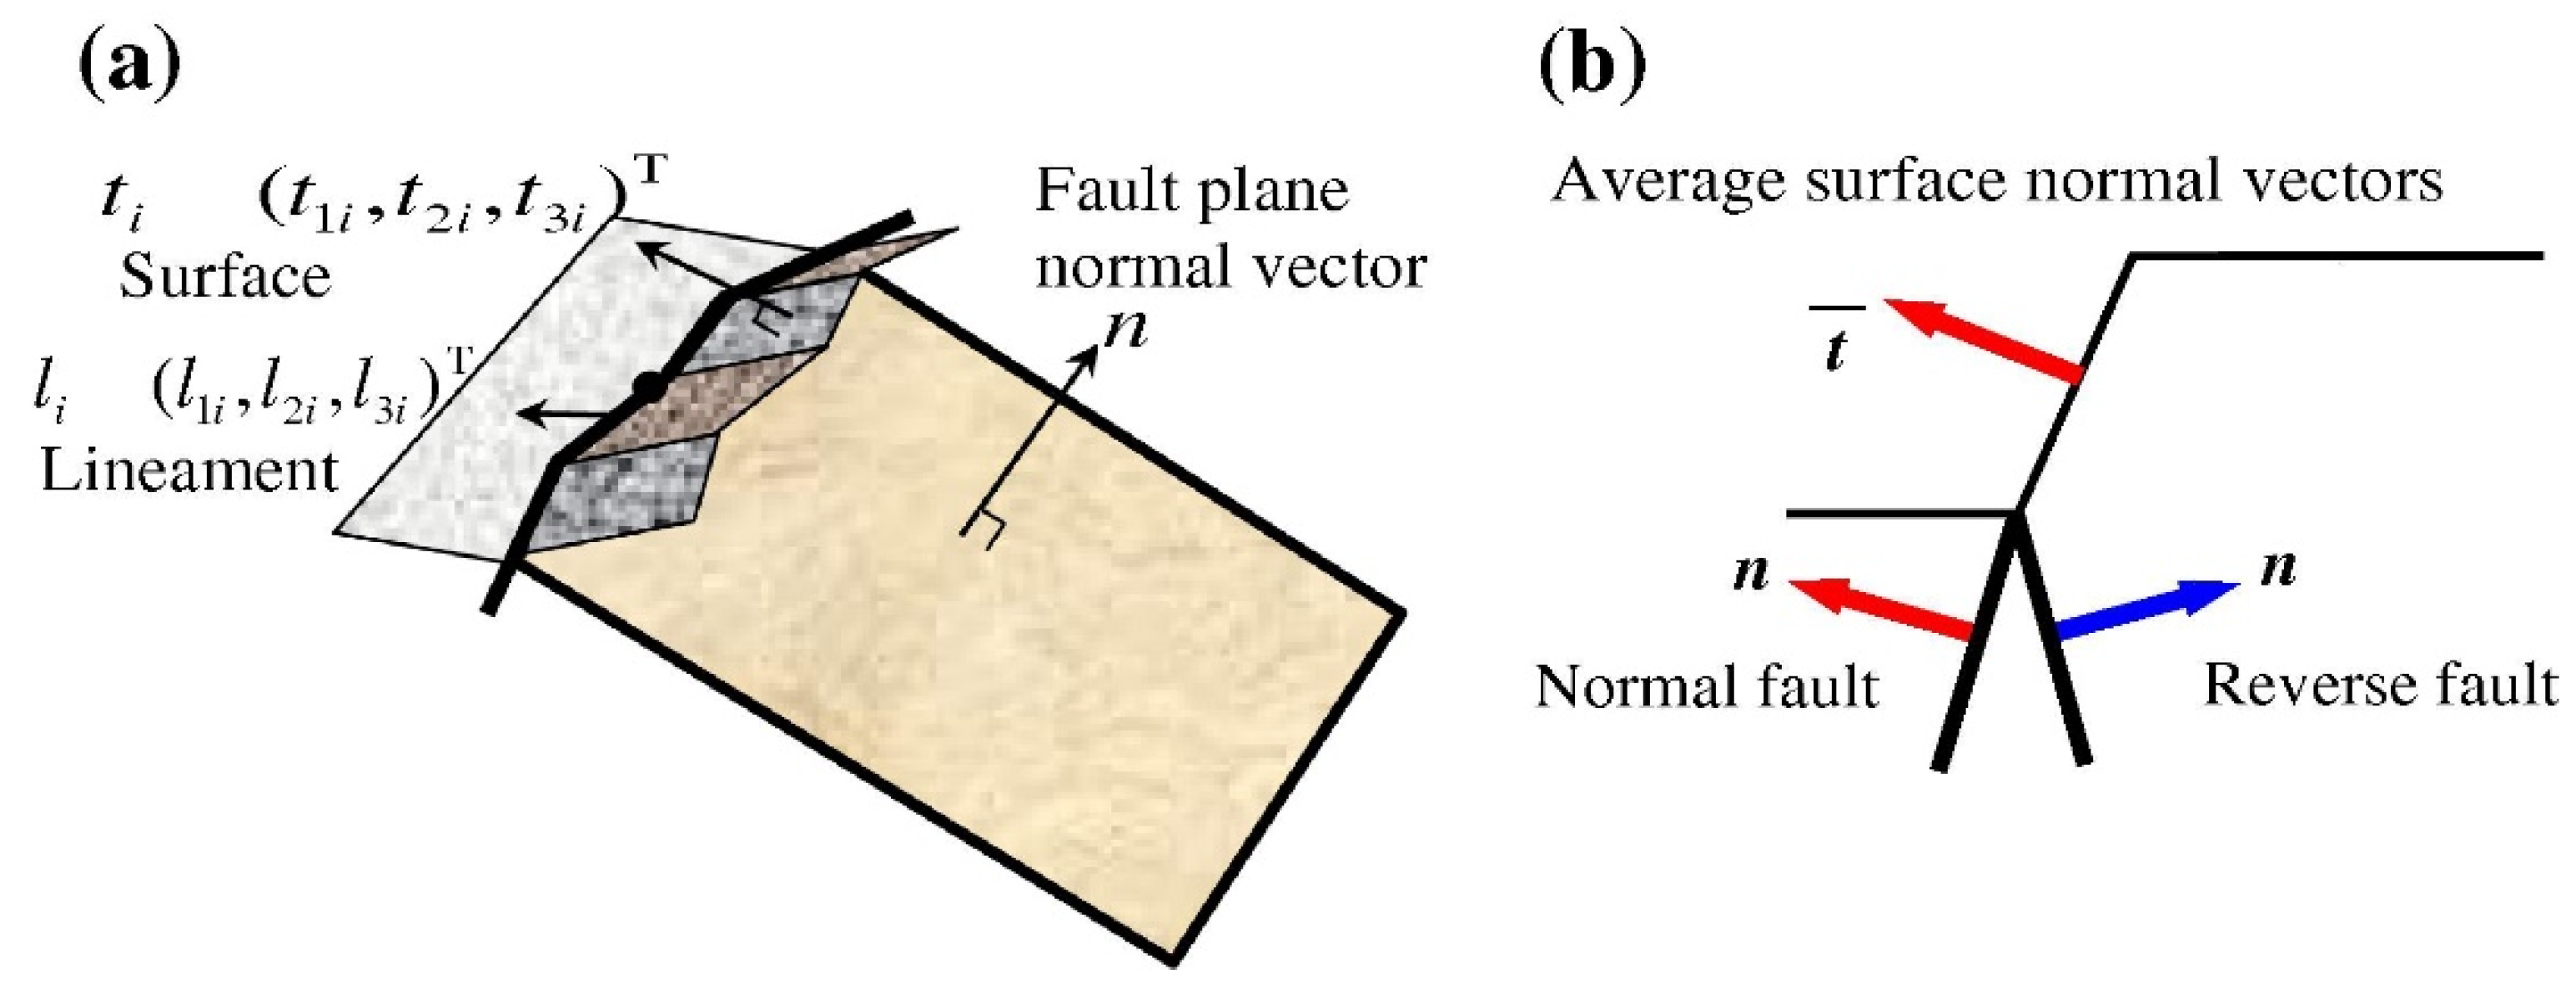
- Computing the dip angle and dip direction of the surface dataset leads us to identify fracture and non-fracture zones in the dataset. In this regard, fracture points can be detected, not only from the geometric planes, but also from the materials behavior of the surface dataset. Nevertheless, additional on-site measurements (i.e., image-based methods) may be required, not only to calibrate and validate the simulation results, but also to identify more environmental parameters that may be relevant to fortify our hypothetical results.
- It is worth noting that the workflow developed in this study only applies to a single scan dataset. This is mainly because the correction parameters (i.e., angle of incidence) require a single reference point for the georeferenced coordinate. Otherwise, each point cloud will contain multiple reference points due to multiple scanner locations after merging the dataset. This will thus create confusion for detecting the true normal value of each point of the original dataset.
- This study detects at least two kinds of fractures, namely conjugate fractures and parallel fractures. These fractures are detected through uneven distribution of azimuth clusters. This uneven distribution occurs due to several factors, such as heterogeneous materials, disjointed geometries, the structural load of the heritage building, and natural forces such as earthquakes.
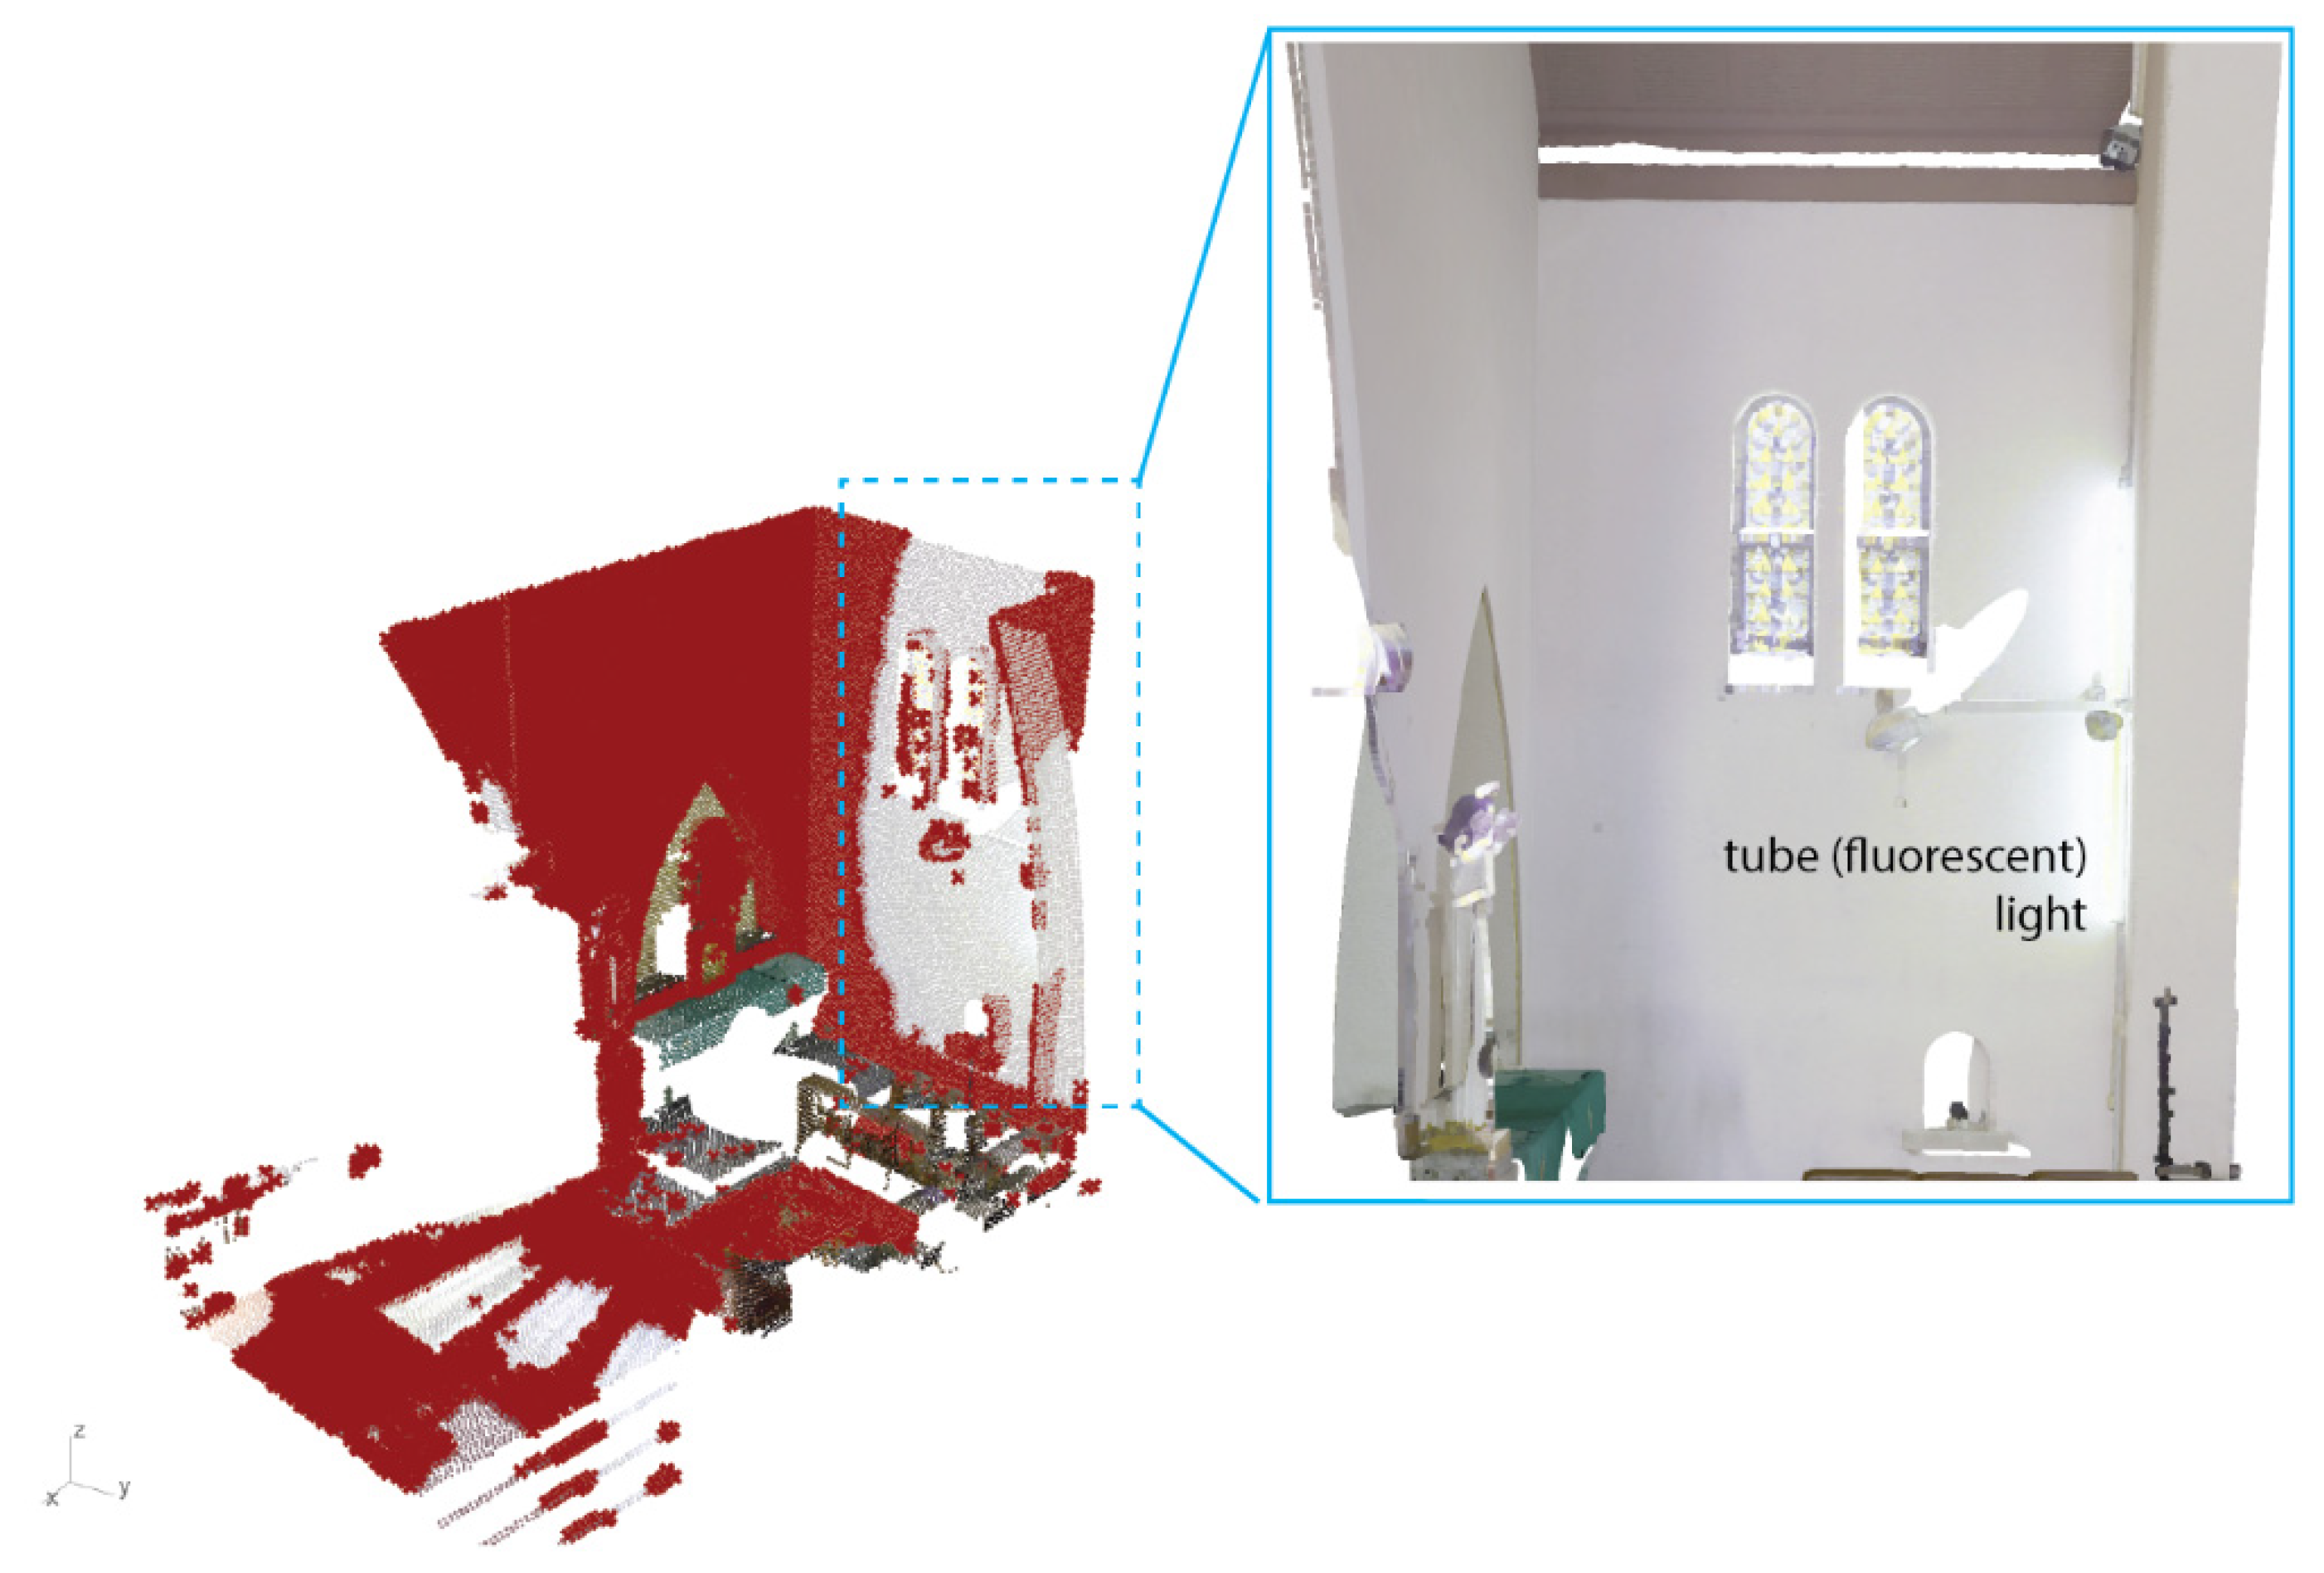
- The areas identified for thermal performances, to some extent, are not always parallel to the fracture zone. This specifically happens on flat areas with homogenous materials and minimal crack propagation because the crack (e.g., holes, porosity) itself can act as an isolator that breaks the heat flux distribution.
- The total (Δ) albedo modification provides essential information regarding the heat absorption of the surface dataset.
- Comparing the albedo and fracture values in the same dataset enables us to identify and confirm the initial surface performance analysis.
Author Contributions
Funding
Institutional Review Board Statement
Informed Consent Statement
Data Availability Statement
Acknowledgments
Conflicts of Interest
Appendix A

References
- Marzouk, M. Using 3D laser scanning to analyize heritage structures: The case study of egyptian palace. J. Civ. Eng. Manag. 2019, 26, 53–65. [Google Scholar] [CrossRef]
- de Wilde, P. Building Performance Analysis; Wiley Blackwell: Oxford, UK, 2018. [Google Scholar]
- Dilsiz, A.; Ismail, S.H. Documentation and assessment of war induced damage on historic buildings in Aleppo. J. Arch. Conserv. 2020, 26, 291–308. [Google Scholar] [CrossRef]
- Binda, L.; Cardani, G.; Saisi, A.; Valluzzi, M.R. Vulnerability analysis of the historical buildings in seismic area by a multilevel approach. Asian J. Civ. Eng. 2006, 7, 343–357. [Google Scholar]
- Fafet, C.; Zajmi, E.M. Qualitative Fire Vulnerability Assessments for Museums and Their Collections: A Case Study from Kosovo. Fire 2021, 4, 11. [Google Scholar] [CrossRef]
- Vijay, P.V.; Gadde, K.T. Evaluation of Old and Historic Buildings Subjected to Fire. J. Arch. Eng. 2021, 27, 05021002. [Google Scholar] [CrossRef]
- Trizio, F.; Torrijo, F.; Mileto, C.; Vegas, F. Flood Risk in a Heritage City: Alzira as a Case Study. Water 2021, 13, 1138. [Google Scholar] [CrossRef]
- Ravankhah, M.; De Wit, R.; Argyriou, A.V.; Chliaoutakis, A.; Revez, M.J.; Birkmann, J.; Žuvela-Aloise, M.; Sarris, A.; Tzigounaki, A.; Giapitsoglou, K. Integrated Assessment of Natural Hazards, Including Climate Change’s Influences, for Cultural Heritage Sites: The Case of the Historic Centre of Rethymno in Greece. Int. J. Disaster Risk Sci. 2019, 10, 343–361. [Google Scholar] [CrossRef] [Green Version]
- Clemente, P. Extending the life-span of cultural heritage structures. J. Civ. Struct. Health Monit. 2018, 8, 171–179. [Google Scholar] [CrossRef] [Green Version]
- Wells, J.C.; Baldwin, E.D. Historic preservation, significance, and age value: A comparative phenomenology of historic Charleston and the nearby new-urbanist community of I’On. J. Environ. Psychol. 2012, 32, 384–400. [Google Scholar] [CrossRef]
- Sesana, E.; Gagnon, A.S.; Ciantelli, C.; Cassar, J.; Hughes, J.J. Climate change impacts on cultural heritage: A literature review. WIREs Clim. Chang. 2021, 12, e710. [Google Scholar] [CrossRef]
- Loli, A.; Bertolin, C. Towards Zero-Emission Refurbishment of Historic Buildings: A Literature Review. Buildings 2018, 8, 22. [Google Scholar] [CrossRef] [Green Version]
- Cardani, G.; Belluco, P. Reducing the Loss of Built Heritage in Seismic Areas. Buildings 2018, 8, 19. [Google Scholar] [CrossRef] [Green Version]
- Priyadarsini, R.; Wog, N. Building Surfaces and their Effect on the Urban Thermal Environment. Archit. Sci. Rev. 2011, 48, 345–356. [Google Scholar] [CrossRef]
- Luan, Y.; Dong, Y.; Ma, Y.; Weng, L. Surface and New Building Deformation Analysis of Deep Well Strip Mining. Adv. Mater. Sci. Eng. 2020, 2020, 8727956. [Google Scholar] [CrossRef]
- Richter, R.; Döllner, J. Concepts and techniques for integration, analysis and visualization of massive 3D point clouds. Comput. Environ. Urban Syst. 2014, 45, 114–124. [Google Scholar] [CrossRef]
- Kobayashi, I.; Fujita, Y.; Sugihara, H.; Yamamoto, K. Attribute analysis of point cloud data with color information. J. Jpn. Soc. Civ. Eng. Ser. F3 (Civ. Eng. Inform.) 2012, 67, 2561. [Google Scholar]
- Zhan, Q.; Liang, Y.; Xiao, Y. Color-Based Segmentation of Point Clouds. In Laser Scanning 2009; IAPRS: Paris, France, 2009; Volume XXXVIII. [Google Scholar]
- Alshawabkeh, Y. Linear feature extraction from point cloud using color information. Herit. Sci. 2020, 8, 28. [Google Scholar] [CrossRef]
- What Is Lidar Intensity Data? ESRI. 2020. Available online: https://desktop.arcgis.com/en/arcmap/latest/manage-data/las-dataset/what-is-intensity-data-.htm (accessed on 12 September 2021).
- Voegtle, T.; Schwab, I.; Landers, T. Influences of Different Materials on the Measurement of a Terrestrial Laser Scanner (TLS). In The International Archives of the Photogrammetry, Remote Sensing and Spatial Information Siences; ISPRS: Beijing, China, 2008; Volume XXXVII. [Google Scholar]
- Mao, J.; Zeng, Q.; Liu, X.; Lai, J. FIltering Licar Points by Fusion of Intensity Measures and Aerial Images. In The International Archives of the Photogrammetry, Remote Sensing and Spatial Informaiton Sciences; ISPRS: Beijing, China, 2008; Volume XXXVII. [Google Scholar]
- Yang, F.; Wen, X.; Wang, X.; Li, X.; Li, Z. A Model Study of Building Seismic Damage Information Extraction and Analysis on Ground-Based LiDAR Data. Adv. Civ. Eng. 2021, 2021, 5542012. [Google Scholar] [CrossRef]
- Kashani, A.G.; Olsen, M.J.; Parrish, C.E.; Wilson, N. A Review of LIDAR Radiometric Processing: From Ad Hoc Intensity Correction to Rigorous Radiometric Calibration. Sensors 2015, 15, 28099–28128. [Google Scholar] [CrossRef] [PubMed] [Green Version]
- Pantelis, V.; Liritzis, I.; Vosinakis, S. 3D Reconstruction of Cultural Heritage Sites as an Educational Approach. The Sanctuary of Delphi. Appl. Sci. 2021, 11, 3635. [Google Scholar]
- Almukhtar, A.; Saeed, Z.; Abanda, H.; Tah, J. Reality Capture of Buildings Using 3D Laser Scanners. CivilEng 2021, 2, 214–235. [Google Scholar] [CrossRef]
- Angelopoulou, E.; Wright, J.R., Jr. Laser Scanner Technology; Technical Report No. MS-CIS-99-16; Department of Computer and Information Science, University of Pennsylvania: Philadelphia, PA, USA, 1999. [Google Scholar]
- Cleveland, C.J.; Morris, C. Handbook of Energy, Volume I: Diagrams, Charts, and Tables; Elsevier Science: Oxford, UK, 2013. [Google Scholar]
- Glass, C.E. Interpreting Aerial Photographs to Identify Natural Hazards; Elsevier: Oxford, UK, 2013. [Google Scholar] [CrossRef]
- Peukert, W.; Segets, D.; Pflug, L.; Leugering, G. Chapter One—Unified Design Strategies for Particulate Products. In Advances in Chemical Engineering; Academic Press: Waltham, MA, USA, 2015; pp. 1–81. [Google Scholar]
- Wang, J.; Hu, W.; Wang, X.; Liang, Y. Experimental Investigation of Crack Initiation and Propagation in the Unreinforced Masonry Specimen Subjected to Vertical Settlement. Adv. Mater. Sci. Eng. 2021, 2021, 6672037. [Google Scholar] [CrossRef]
- Zhang, Q.; Xiong, Z. Crack Detection of Reinforced Concrete Structures Based on BOFDA and FBG Sensors. Shock. Vib. 2018, 2018, 6563537. [Google Scholar] [CrossRef]
- Chakraborty, J.; Katunin, A.; Klikowicz, P.; Salamak, M. Early Crack Detection of Reinforced Concrete Structure Using Embedded Sensors. Sensors 2019, 19, 3879. [Google Scholar] [CrossRef] [PubMed] [Green Version]
- Hallee, M.; Napolitano, R.; Reinhart, W.; Glisic, B. Crack Detection in Images of Masonry Using CNNs. Sensors 2021, 21, 4929. [Google Scholar] [CrossRef] [PubMed]
- Cabaleiro, M.; Lindenbergh, R.; Gard, W.; Arias, P.; van de Kuilen, J.-W. Algorithm for automatic detection and analysis of cracks in timber beams from LiDAR data. Constr. Build. Mater. 2017, 130, 41–53. [Google Scholar] [CrossRef] [Green Version]
- Jiang, H.; Li, Q.; Jiao, Q.; Wang, X.; Wu, L. Extraction of Wall Cracks on Earthquake-Damaged Buildings Based on TLS Point Clouds. IEEE J. Sel. Top. Appl. Earth Obs. Remote Sens. 2018, 11, 3088–3096. [Google Scholar] [CrossRef]
- Laefer, D.F.; Truong-Hong, L.; Carr, H.; Singh, M. Crack detection limits in unit based masonry with terrestrial laser scanning. NDT E Int. 2014, 62, 66–76. [Google Scholar] [CrossRef] [Green Version]
- Armesto-González, J.; Riveiro-Rodríguez, B.; González-Aguilera, D.; Rivas-Brea, M.T. Terrestrial laser scanning intensity data applied to damage detection for historical buildings. J. Archaeol. Sci. 2010, 37, 3037–3047. [Google Scholar] [CrossRef]
- Guldur, B.; Hajjar, J.F. Damage Detection on Structures Using Texture Mapped Laser Point Clouds. In Structure Congress 2014; Structural Engineering Institute of ASCE: Boston, MA, USA, 2014. [Google Scholar] [CrossRef]
- Olsen, M.J.; Kuester, F.; Chang, B.J.; Hutchinson, T.C. Terrestrial Laser Scanning-Based Structural Damage Assessment. J. Comput. Civ. Eng. 2010, 24, 264–272. [Google Scholar] [CrossRef]
- Kim, H.; Lee, S.; Ahn, E.; Shin, M.; Sim, S.-H. Crack identification method for concrete structures considering angle of view using RGB-D camera-based sensor fusion. Struct. Health Monit. 2020, 20, 500–512. [Google Scholar] [CrossRef]
- Sanchez, L.; Bairán, J.M. Crack Detection in Concrete Elements from RGB Pictures using Modified Line Detection Kernels. In Proceedings of the SAI IEEE Intelligent Systems Conference, London, UK, 7–8 September 2017. [Google Scholar]
- Vashpanov, Y.; Son, J.-Y.; Heo, G.; Podousova, T.; Kim, Y.S. Determination of Geometric Parameters of Cracks in Concrete by Image Processing. Adv. Civ. Eng. 2019, 2019, 2398124. [Google Scholar] [CrossRef] [Green Version]
- Barazzetti, L.; Scaioni, M. Crack measurement: Development, testing and applications of an automatic image-based algorithm. ISPRS J. Photogramm. Remote Sens. 2009, 64, 285–296. [Google Scholar] [CrossRef]
- Daniel. Cloud Compare: 3Dpoint Cloud and Mesh Processing Software, Open Source Project, Cloud Compare—2020. Available online: https://www.danielgm.net/cc/ (accessed on 12 September 2021).
- Boulch, A.; Marlet, R. Deep Learning for Robust Normal Estimation in Unstructured Point Clouds. Comput. Graph. Forum 2016, 35, 281–290. [Google Scholar] [CrossRef] [Green Version]
- LAStools, Rapidlasso GmbH, Fast Tools to Catch Reality. Available online: https://rapidlasso.com/lastools/ (accessed on 12 September 2021).
- Python. Available online: https://www.python.org/ (accessed on 12 September 2021).
- The R Foundation. The R Project for Statistical Computing. Available online: http://www.R-project.org/ (accessed on 12 September 2021).
- Cheng, L.; Chen, S.; Liu, X.; Xu, H.; Wu, Y.; Li, M.; Chen, Y. Registration of Laser Scanning Point Clouds: A Review. Sensors 2018, 18, 1641. [Google Scholar] [CrossRef] [Green Version]
- Gao, R.; Park, J.; Hu, X.; Yang, S.; Cho, K. Reflective Noise Filtering of Large-Scale Point Cloud Using Multi-Position LiDAR Sensing Data. Remote Sens. 2021, 13, 3058. [Google Scholar] [CrossRef]
- Zhou, T.; Cheng, X.; Lin, P.; Wu, Z.; Liu, E. A General Point-based Method for Self-Calibration of Terrestrial Laser Scanners Considering Stochastic Information. Remote Sens. 2020, 12, 2923. [Google Scholar] [CrossRef]
- Alkadri, M.F.; Turrin, M.; Sariyildiz, S. A computational workflow to analyse material properties and solar radiation of existing contexts from attribute information of point cloud data. Build. Environ. 2019, 155, 268–282. [Google Scholar] [CrossRef]
- Alkadri, M.F.; De Luca, F.; Turrin, M.; Sariyildiz, S. An integrated approach to subtractive solar envelopes based on attribute information from point cloud data. Renew. Sustain. Energy Rev. 2020, 123, 109742. [Google Scholar] [CrossRef]
- Schultz, R.A. Goeologic Fracture Mechanics; Cambridge University Press: Cambridge, UK, 2019. [Google Scholar]
- Masoud, A.A.; Koike, K. Auto-detection and integration of tectonically significant lineaments from SRTM DEM and remotely-sensed geophysical data. ISPRS J. Photogramm. Remote Sens. 2011, 66, 818–832. [Google Scholar] [CrossRef]
- Kumar, S.; Schmidova, E.; Konopík, P.; Melzer, D.; Bozkurt, F.; Londe, N.V. Fracture Toughness Analysis of Automotive-Grade Dual-Phase Steel Using Essential Work of Fracture (EWF) Method. Metals 2020, 10, 1019. [Google Scholar] [CrossRef]
- Luna, P.; Bernal, C.; Cisilino, A.; Frontini, P.; Cotterell, B.; Mai, Y.-W. The application of the essential work of fracture methodology to the plane strain fracture of ABS 3-point bend specimens. Polymer 2003, 44, 1145–1150. [Google Scholar] [CrossRef]
- Al-Kindi, M.H. Understanding the Relationship between Large-Scale Fold Structures and Small-Scale Fracture Patterns: A Case Study from the Oman Mountains. Geosciences 2020, 10, 490. [Google Scholar] [CrossRef]
- Barton, C.C.; Angelier, J. Direct Inversion Method of Fault Slip Analysis to Determine the Orientation of Principal Stresses and Relative Chronology for Tectonic Events in Southwestern White Mountain Region of New Hampshire, USA. Geosciences 2020, 10, 464. [Google Scholar] [CrossRef]
- Bu, W.; Xu, H. Research on the Effect of Dip Angle on Shear Stress on Normal Fault Plane and Water Inrush in Floor Strata During Mining Activities. Geotech. Geol. Eng. 2020, 38, 4407–4421. [Google Scholar] [CrossRef]
- Dang, T. Application of Photogrammetry for Measuring Dip and Dip Direction and Creating 3D Model for Slope and Face of Underground Works. In Proceedings of the International Conference on Advances in Mining and Tunneling Conference, Hanoi, Vietnam, 19–23 August 2008. [Google Scholar]
- Kemp, A.W.; Råde, L.; Westergren, B. Mathematics Handbook for Science and Engineering; Springer: Berlin/Heidelberg, Germany, 2004. [Google Scholar]
- Priest, S.D. Discontinuity Analysis for Rock Engineering; Chapman & Hall: London, UK, 1993. [Google Scholar]
- Bohac, V. Thermal Properties of Materials and their Characterization by Classic and Transient Methods. In Proceedings of the 11th International Conference on Measurement, Smolenice, Slovakia, 29–31 May 2017. [Google Scholar] [CrossRef]
- Singh, J. Optical Properties of Materials and Their Applications, 2nd ed.; John Wiley & Sons Ltd.: Sussex, UK, 2020. [Google Scholar]
- Henderson-Sellers, A.; Hughes, N. Albedo and its importance in climate theory. Prog. Phys. Geogr. Earth Environ. 1982, 6, 1–44. [Google Scholar] [CrossRef]
- Micheli, D.; Pastore, R.; Vricella, A.; Delfini, A.; Marchetti, M.; Santoni, F. Chapter 9—Electromagnetic Characterization of Materials by Vector Network Analyzer Experimental Setup. In Spectroscopic Methods for Nanomaterials Characterization; Elsevier: Amsterdam, The Netherlands, 2017; pp. 195–236. [Google Scholar]
- Singh, M. Transparency and Translucency. In Computer Vision; Springer: Boston, MA, USA, 2014; pp. 789–829. [Google Scholar]
- Zhang, Y.; Long, E.; Li, Y.; Li, P. Solar radiation reflective coating material on building envelopes: Heat transfer analysis and cooling energy saving. Energy Explor. Exploit. 2017, 35, 748–766. [Google Scholar] [CrossRef] [Green Version]
- Ramírez, A.Z.; Muñoz, C.B. Albedo Effect and Energy Efficiency of Cities. In Sustainable Development-Energy, Engineering and Technologies—Manufacturing and Environment; IntechOpen: Rijeka, Croatia, 2012; pp. 1–18. [Google Scholar]
- Leica Geosystems AG. Leica RTC360 3D Laser Scanner. 2021. Available online: https://leica-geosystems.com/products/laser-scanners/scanners/leica-rtc360 (accessed on 12 September 2021).
- Malang city culture and tourism office. Cultural Heritage Buildings in the City of Malang; Government of Malang City Council Press: Malang, Indonesia, 2018.
- Yudono, A. “Gereja ijen.” Cesium Demo. 2020. Available online: https://s.ub.ac.id/gerejaijen (accessed on 22 October 2021).
- Bretz, S.; Akbari, H.; Rosenfeld, A. Practical issues for using solar-reflective materials to mitigate urban heat islands. Atmos. Environ. 1998, 32, 95–101. [Google Scholar] [CrossRef] [Green Version]
- Moreira, L.C.J.; Dos Santos Teixeira, A.; Galvão, L.S. Laboratory Salinization of Brazilian Alluvial Soils and the Spectral Effects of Gypsum. Remote Sens. 2014, 6, 2647–2663. [Google Scholar] [CrossRef] [Green Version]
- Makaremi, N.; Schiavoni, S.; Pisello, A.L.; Cotana, F. Effects of surface reflectance and lighting design strategies on energy consumption and visual comfort. Indoor Built Environ. 2018, 28, 552–563. [Google Scholar] [CrossRef]
- Bradley, A.V.; Thornes, J.E.; Chapman, L.; Unwin, D.; Roy, M. Modelling spatial and temporal road thermal climatology in rural and urban areas using a GIS. Clim. Res. 2002, 22, 41–55. [Google Scholar] [CrossRef] [Green Version]
- Lin, C.H.; Han, C.Y.; Liu, C.P. A comparison of the albedo of asian building materials in visible and UVB regions. In Proceedings of the International Conference on Electric Technology and Civil Engineering (ICETCE), Lushan, China, 22–24 April 2011. [Google Scholar]
- Spencer, B.F., Jr.; Hoskere, V.; Narazaki, Y. Advances in Computer Vision-Based Civil Infrastructure Inspection and Monitoring. Engineering 2019, 5, 199–222. [Google Scholar] [CrossRef]
- Thiele, S.T.; Grose, L.; Samsu, A.; Micklethwaite, S.; Vollgger, S.A.; Cruden, A.R. Rapid, semi-automatic fracture and contact mapping for point clouds, images and geophysical data. Solid Earth 2017, 8, 1–19. [Google Scholar] [CrossRef] [Green Version]
- Liu, Q.; Wronski, L.; Danzl, P. Processing outcrop point clouds to 3D rock structure using open source software. In IOP Conf. Series: Earth and Environmental Science 883; IOP Publishing: Ambon, Indonesia, 2021. [Google Scholar]
- van Vliet, M.A.; van Mier, J.M. Experimental investigation of concrete fracture under uniaxial compression. Mech. Cohesive-frictional Mater. 1996, 1, 115–127. [Google Scholar] [CrossRef]
- Huang, Y.; Hu, S.; Gu, Z.; Sun, Y. Fracture Behavior and Energy Analysis of 3D Concrete Mesostructure under Uniaxial Compression. Materials 2019, 12, 1929. [Google Scholar] [CrossRef] [PubMed] [Green Version]
- Bettin, A.; Gross, D. Crack propagation in materials with local inhomogeneities under thermal load. In Thermal Effects in Fracture of Multiphase Materials; Springer: Berlin, Germany, 1989; pp. 85–93. [Google Scholar]
- Srikanti, V.; Ratnam, U. Fatigue and fracture behavior of plain concrete (high-cycle fatigue of notched plain concrete). Int. J. Res. 2016, 3, 618–626. [Google Scholar]
- Qiu, P. Experimental research on fracture behavior of concrete after high temperature. Frattura ed Integrita Strutturale 2019, 50, 300–309. [Google Scholar] [CrossRef] [Green Version]
- Hoła, J.; Sadowski, Ł.; Nowacki, A. Analysis of the causes of cracks in marble slabs in a large-surface floor of a representative commercial facility. Eng. Fail. Anal. 2019, 97, 1–9. [Google Scholar] [CrossRef]
- Migliazza, M.; Ferrero, A.M.; Spagnoli, A. Experimental investigation on crack propagation in Carrara marble subjected to cyclic loads. Int. J. Rock Mech. Min. Sci. 2011, 48, 1038–1044. [Google Scholar] [CrossRef]
- Zou, C.; Wong, L.N.Y.; Cheng, Y. The Strength and Crack Behavior of the Rock-like Gypsum under High Strain rate. In Proceedings of the 46th US Rock Mechanics/Geomechanics Symposium, Chicago, IL, USA, 24–27 June 2012. [Google Scholar]
- Gao, Y.; Li, L.; Zhang, Y. Modeling Crack Propagation in Bituminous Binders under a Rotational Shear Fatigue Load using Pseudo J-Integral Paris’ Law. Transp. Res. Rec. J. Transp. Res. Board 2022, 2674, 94–103. [Google Scholar] [CrossRef] [Green Version]
- Kebudayaan, K.P.D. Cultural Statistics 2021; Pusat Data dan Teknologi Informasi Sekretariat Jenderal Kementerian Pendidikan dan Kebudayaan: Banten, Indonesia, 2021. [Google Scholar]


| (…°) | ||
|---|---|---|
| 0 | ||
| 180 | ||
| 180 | ||
| 360 |
| Parameters | Performance Specification Unit | |
|---|---|---|
| Performance | Data acquisition | <2 min for complete full dome scan and spherical HDR image at 6 mm @ 10 m |
| Real time registration | Automatic point cloud alignment based on Visual Inertia System (VIS) | |
| Scanning | Distance measurement | High dynamic time of flight enhanced by Waveform Digitizing Technology (WFD) |
| Laser class | 1, 1550 nm (invisible) | |
| Field of view | 360° (horizontal)/300° (vertical) | |
| Range | Minimum 0.5–130 m | |
| Resolution | Three user selectable settings (3/6/12 mm @ 10 m) | |
| Accuracy | Angular accuracy 18″ | |
| Range accuracy 1.0 mm + 10 ppm | ||
| Range noise | 0.4 mm @10 m, 0.5 mm @20 m | |
| Imaging | Camera | 36 MP 3-camera system captures |
| Speed | 1 min for full spherical HDR image | |
| Environmental | Operating temperature | −5 °C to +40 °C |
| Dust/humidity | Solid particle/liquid ingress protection IP54 | |
| No | Elements | Material Types | Material Properties | ||
|---|---|---|---|---|---|
| Albedo | Reflectance | Transparency | |||
| 1. | Wall | Concrete coated with white paint | 0.9 | 0.72 | Opaque |
| 2. | Floor | Marble tile | 0.6 | 0.45 | Opaque |
| 3. | Ceiling | Gypsum | 0.85 | 0.7 | Opaque |
| 4. | Roof | Bitumen roof | 0.2 | 0.25 | Opaque |
Publisher’s Note: MDPI stays neutral with regard to jurisdictional claims in published maps and institutional affiliations. |
© 2022 by the authors. Licensee MDPI, Basel, Switzerland. This article is an open access article distributed under the terms and conditions of the Creative Commons Attribution (CC BY) license (https://creativecommons.org/licenses/by/4.0/).
Share and Cite
Alkadri, M.F.; Alam, S.; Santosa, H.; Yudono, A.; Beselly, S.M. Investigating Surface Fractures and Materials Behavior of Cultural Heritage Buildings Based on the Attribute Information of Point Clouds Stored in the TLS Dataset. Remote Sens. 2022, 14, 410. https://doi.org/10.3390/rs14020410
Alkadri MF, Alam S, Santosa H, Yudono A, Beselly SM. Investigating Surface Fractures and Materials Behavior of Cultural Heritage Buildings Based on the Attribute Information of Point Clouds Stored in the TLS Dataset. Remote Sensing. 2022; 14(2):410. https://doi.org/10.3390/rs14020410
Chicago/Turabian StyleAlkadri, Miktha Farid, Syaiful Alam, Herry Santosa, Adipandang Yudono, and Sebrian Mirdeklis Beselly. 2022. "Investigating Surface Fractures and Materials Behavior of Cultural Heritage Buildings Based on the Attribute Information of Point Clouds Stored in the TLS Dataset" Remote Sensing 14, no. 2: 410. https://doi.org/10.3390/rs14020410