
A Transmission Tower Tilt State Assessment Approach Based on Dense Point Cloud from UAV-Based LiDAR


Abstract
:1. Introduction
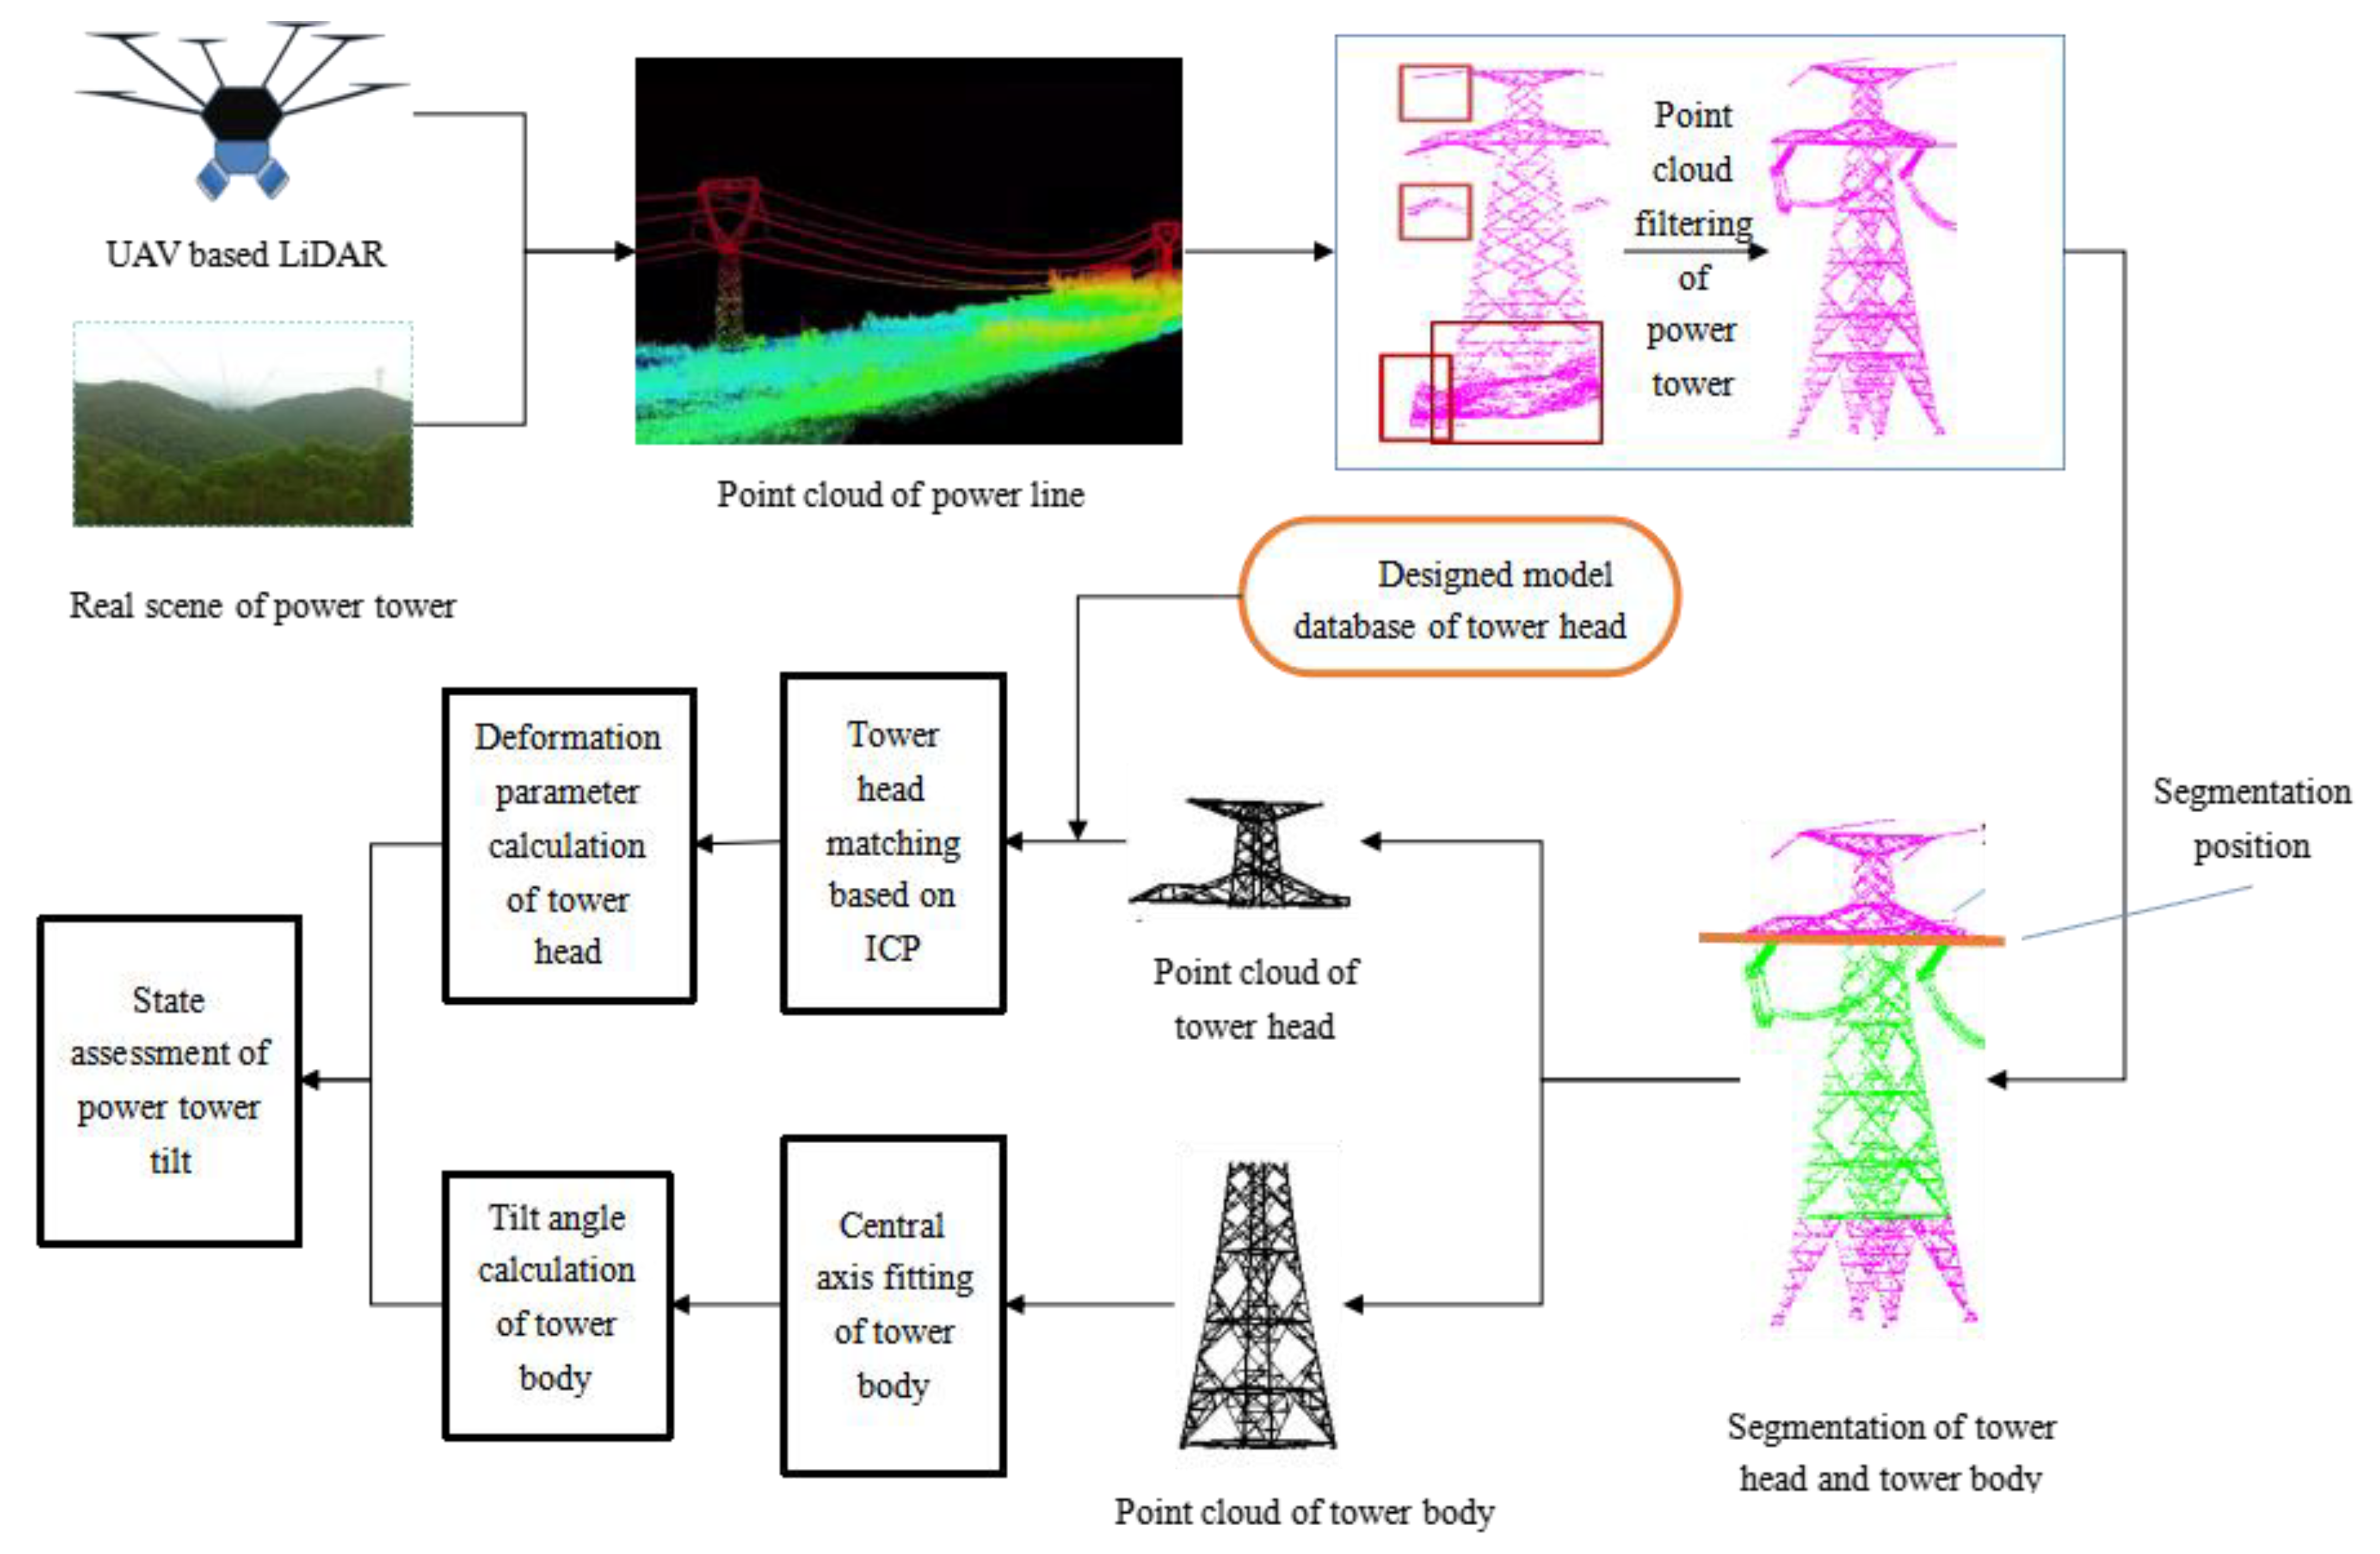
2. Methodology
2.1. Tower Point Cloud Extraction and Filtering
2.1.1. Tower Positioning and Extraction
- (1)
- The 3D laser point cloud of the power corridor was projected to the horizontal XOY coordinate system. The projection plane was further divided into a grid of a specific size, and the grid position of each point cloud was determined based on Equation (1):where are the XY coordinates of point cloud. , are the minimum values of X and Y coordinates of the point cloud. d is the size of grid. m and n are corresponding grid numbers.
- (2)
- Local elevation maximum, minimum, and elevation difference of the projection grid were calculated. Transmission towers were characterized by large elevation differences, so the elevation difference can be used to eliminate the grid area that contained non-transmission tower points such as ground and low vegetation. The elevation difference threshold was set to determine grids with greater elevation difference than .
- (3)
- The point cloud was extracted with the point with the local maximum elevation as the center and the grid size as the radius. The minimum elevation within the extraction area was considered to be the ground elevation and was set as the threshold to remove ground points and extract the tower point clouds.
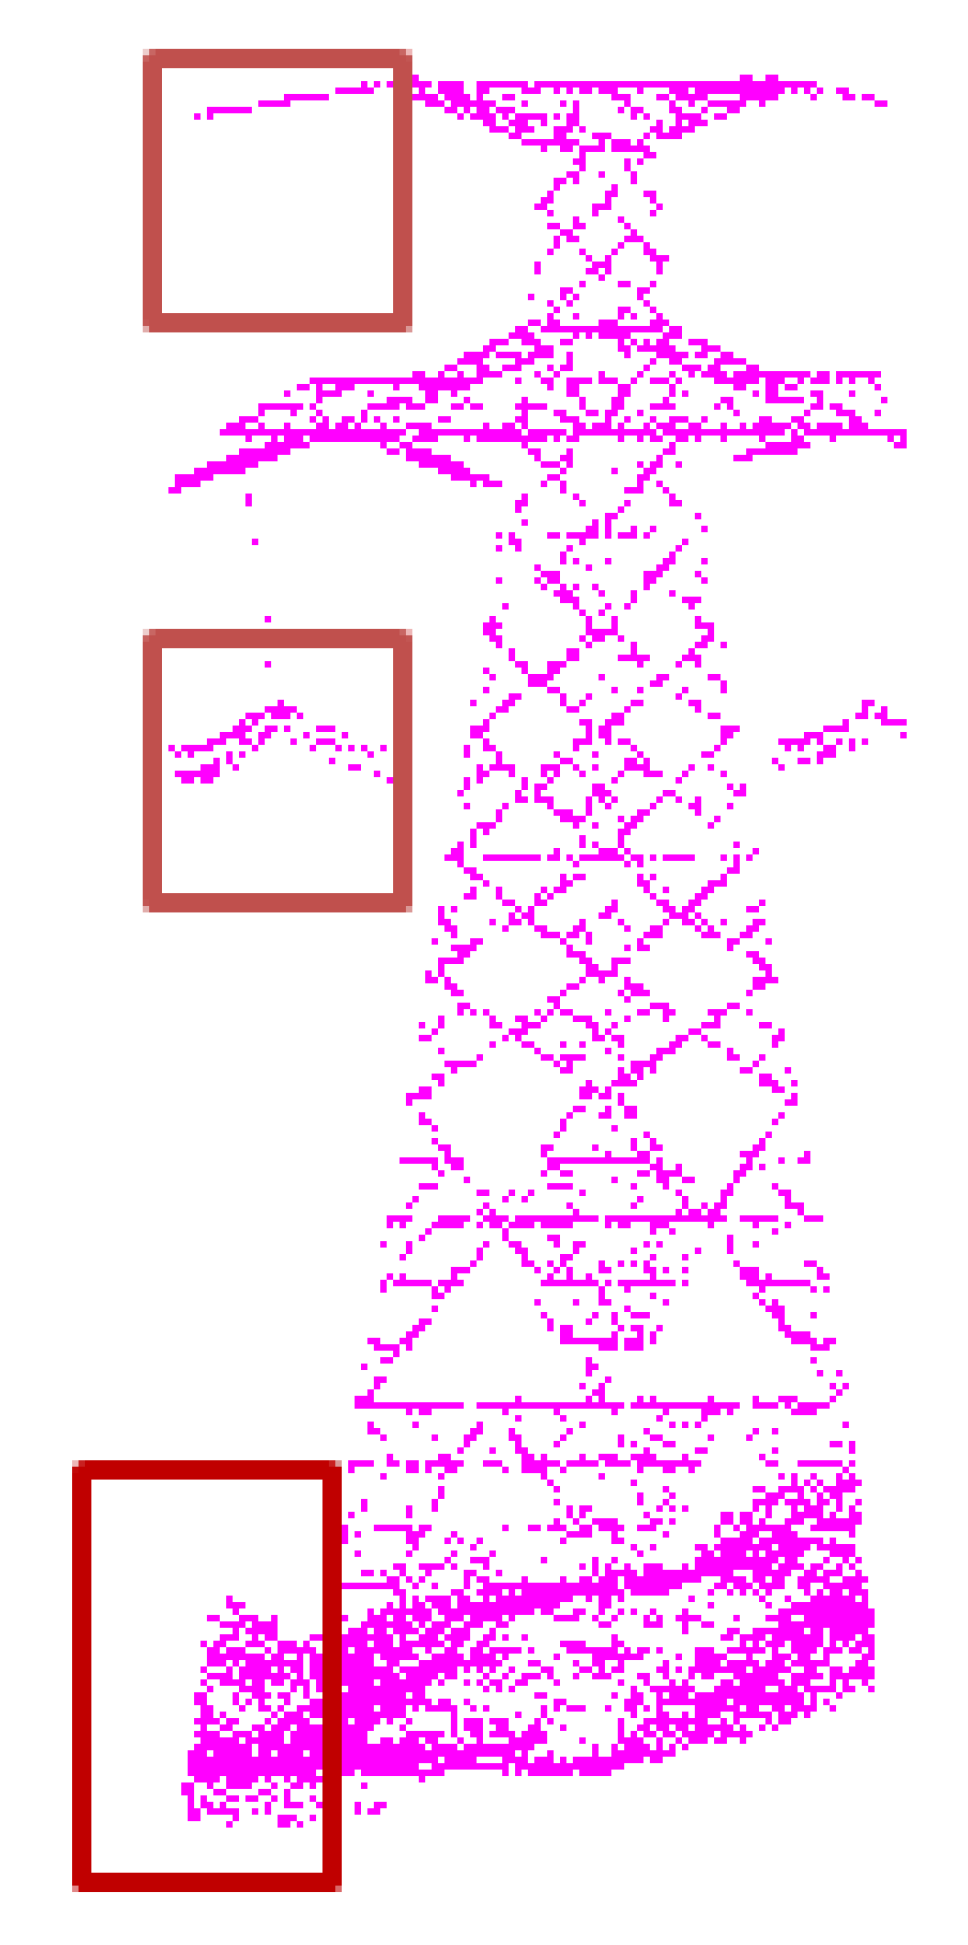
2.1.2. Tower Point Cloud Filtering
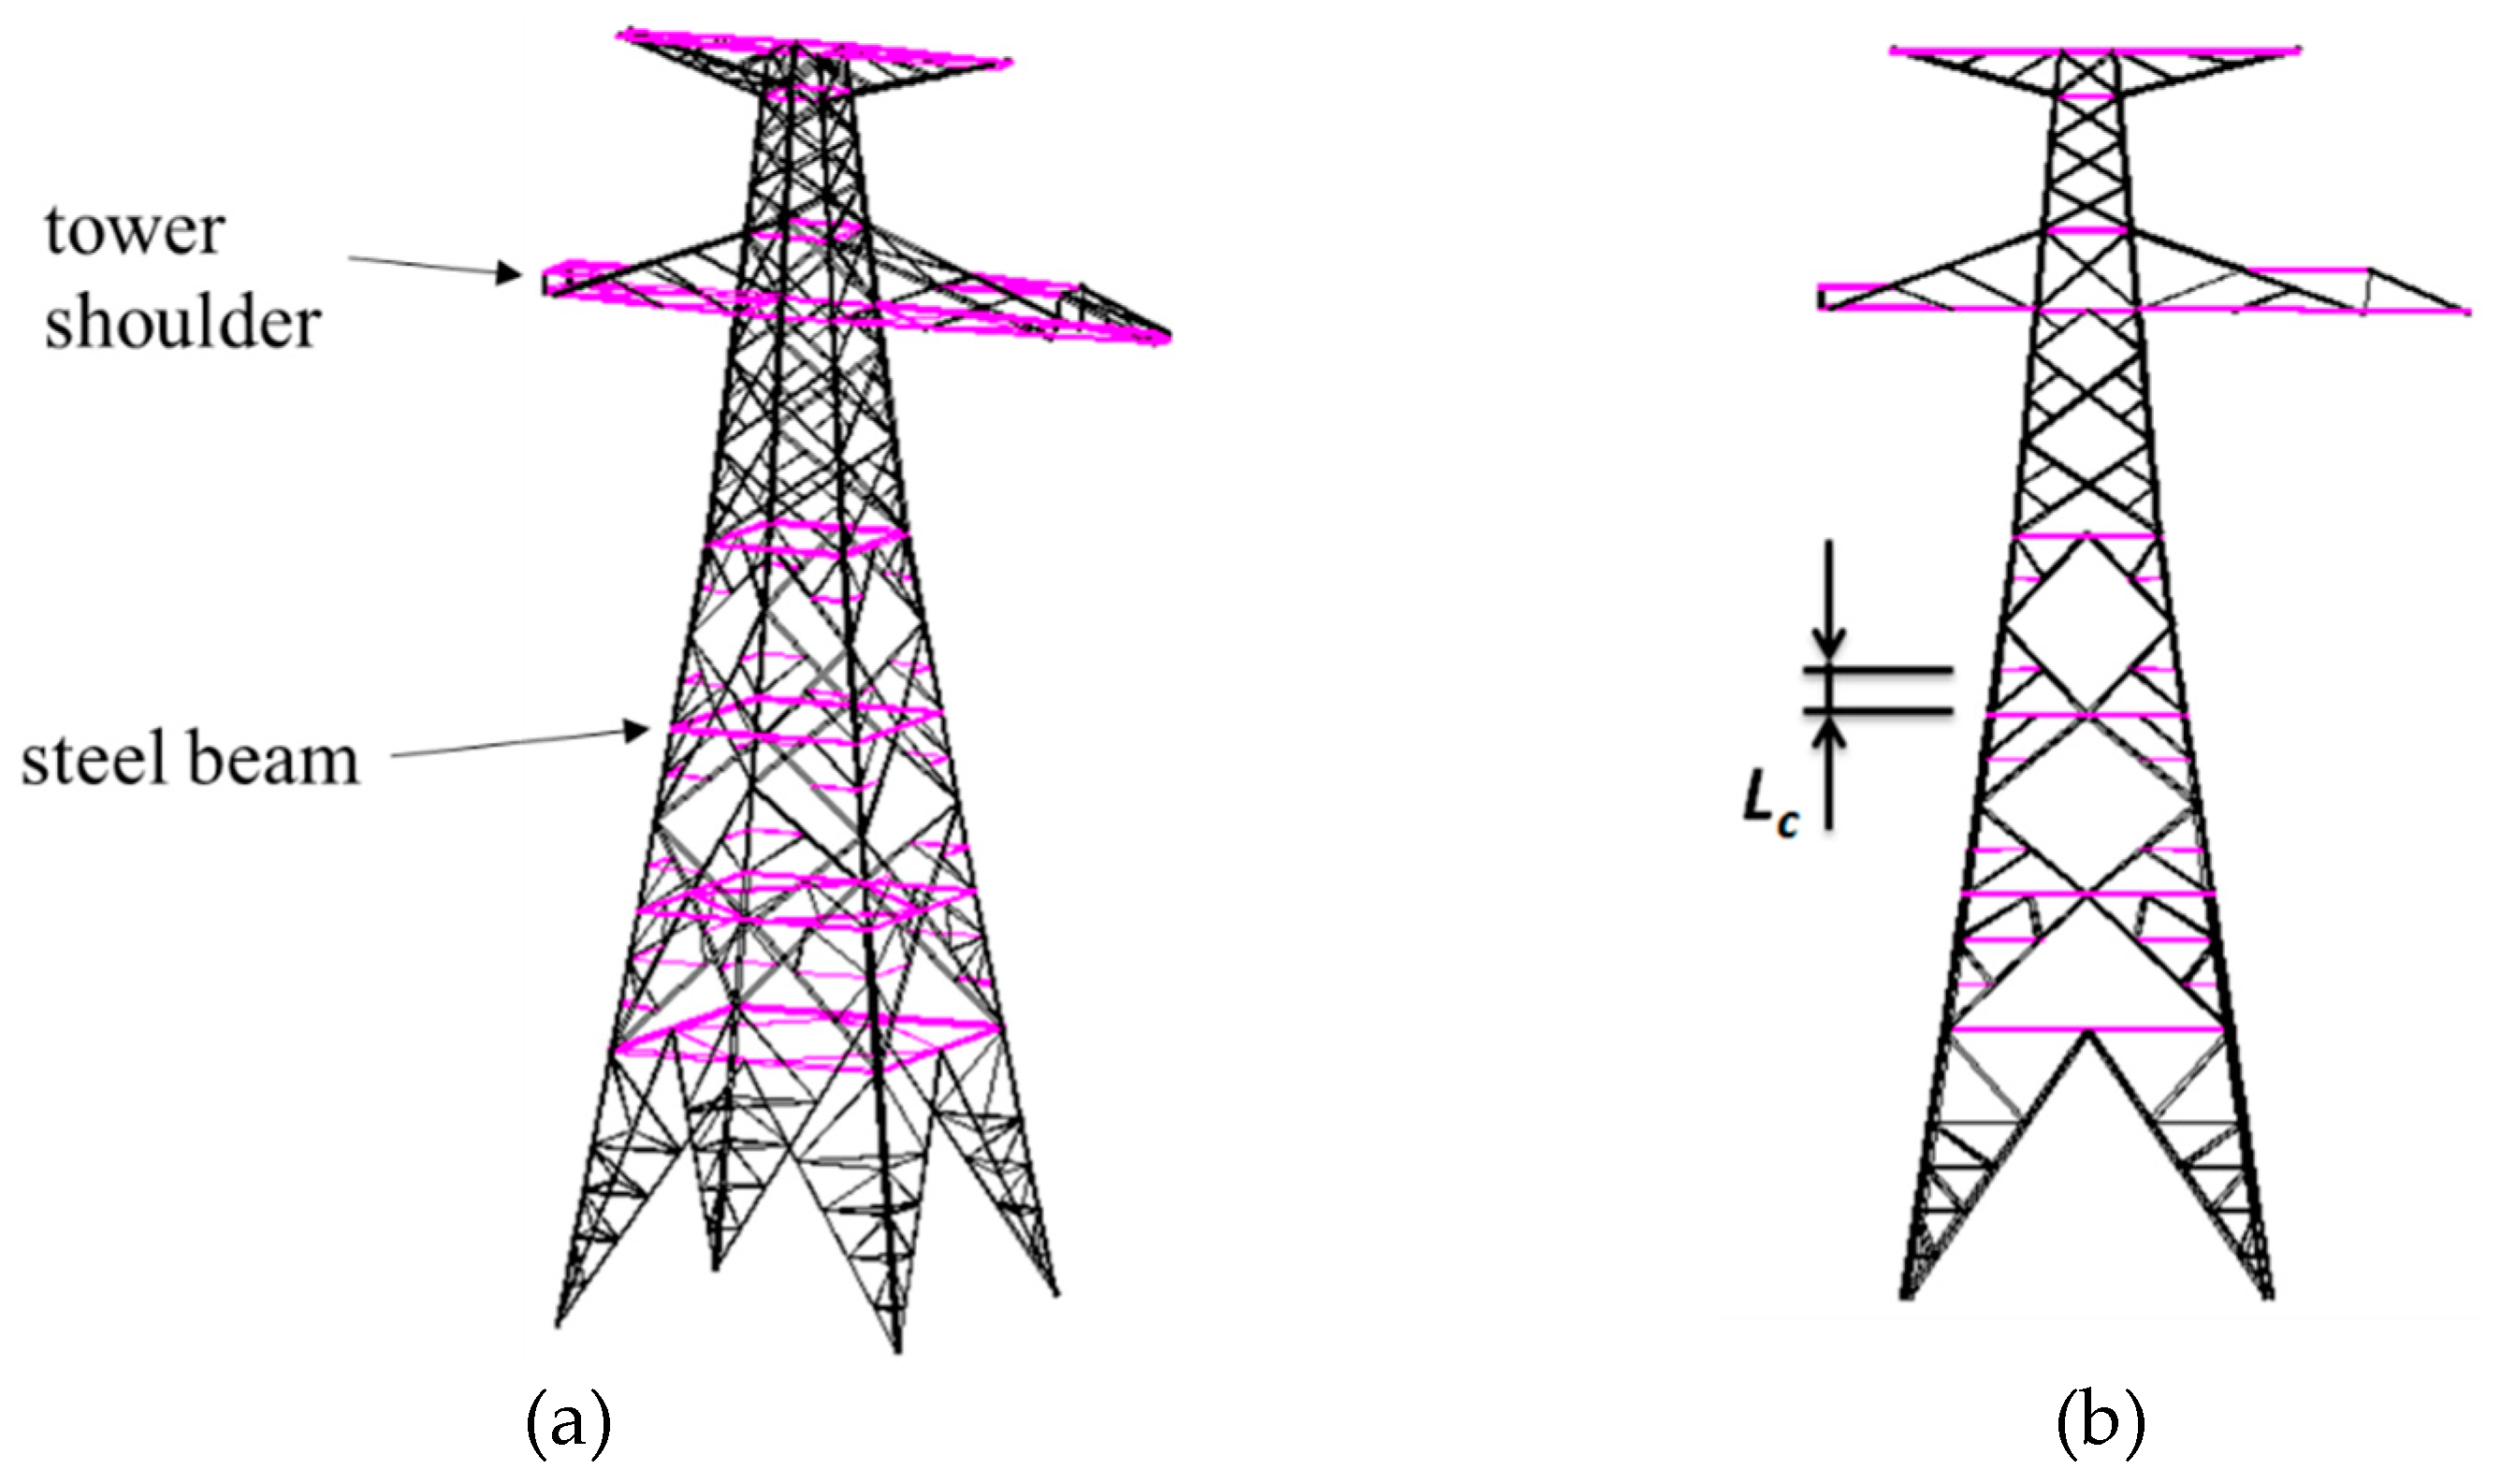
2.2. Tower Feature Extraction
2.2.1. Feature Elevations and Planes Extraction
- (1)
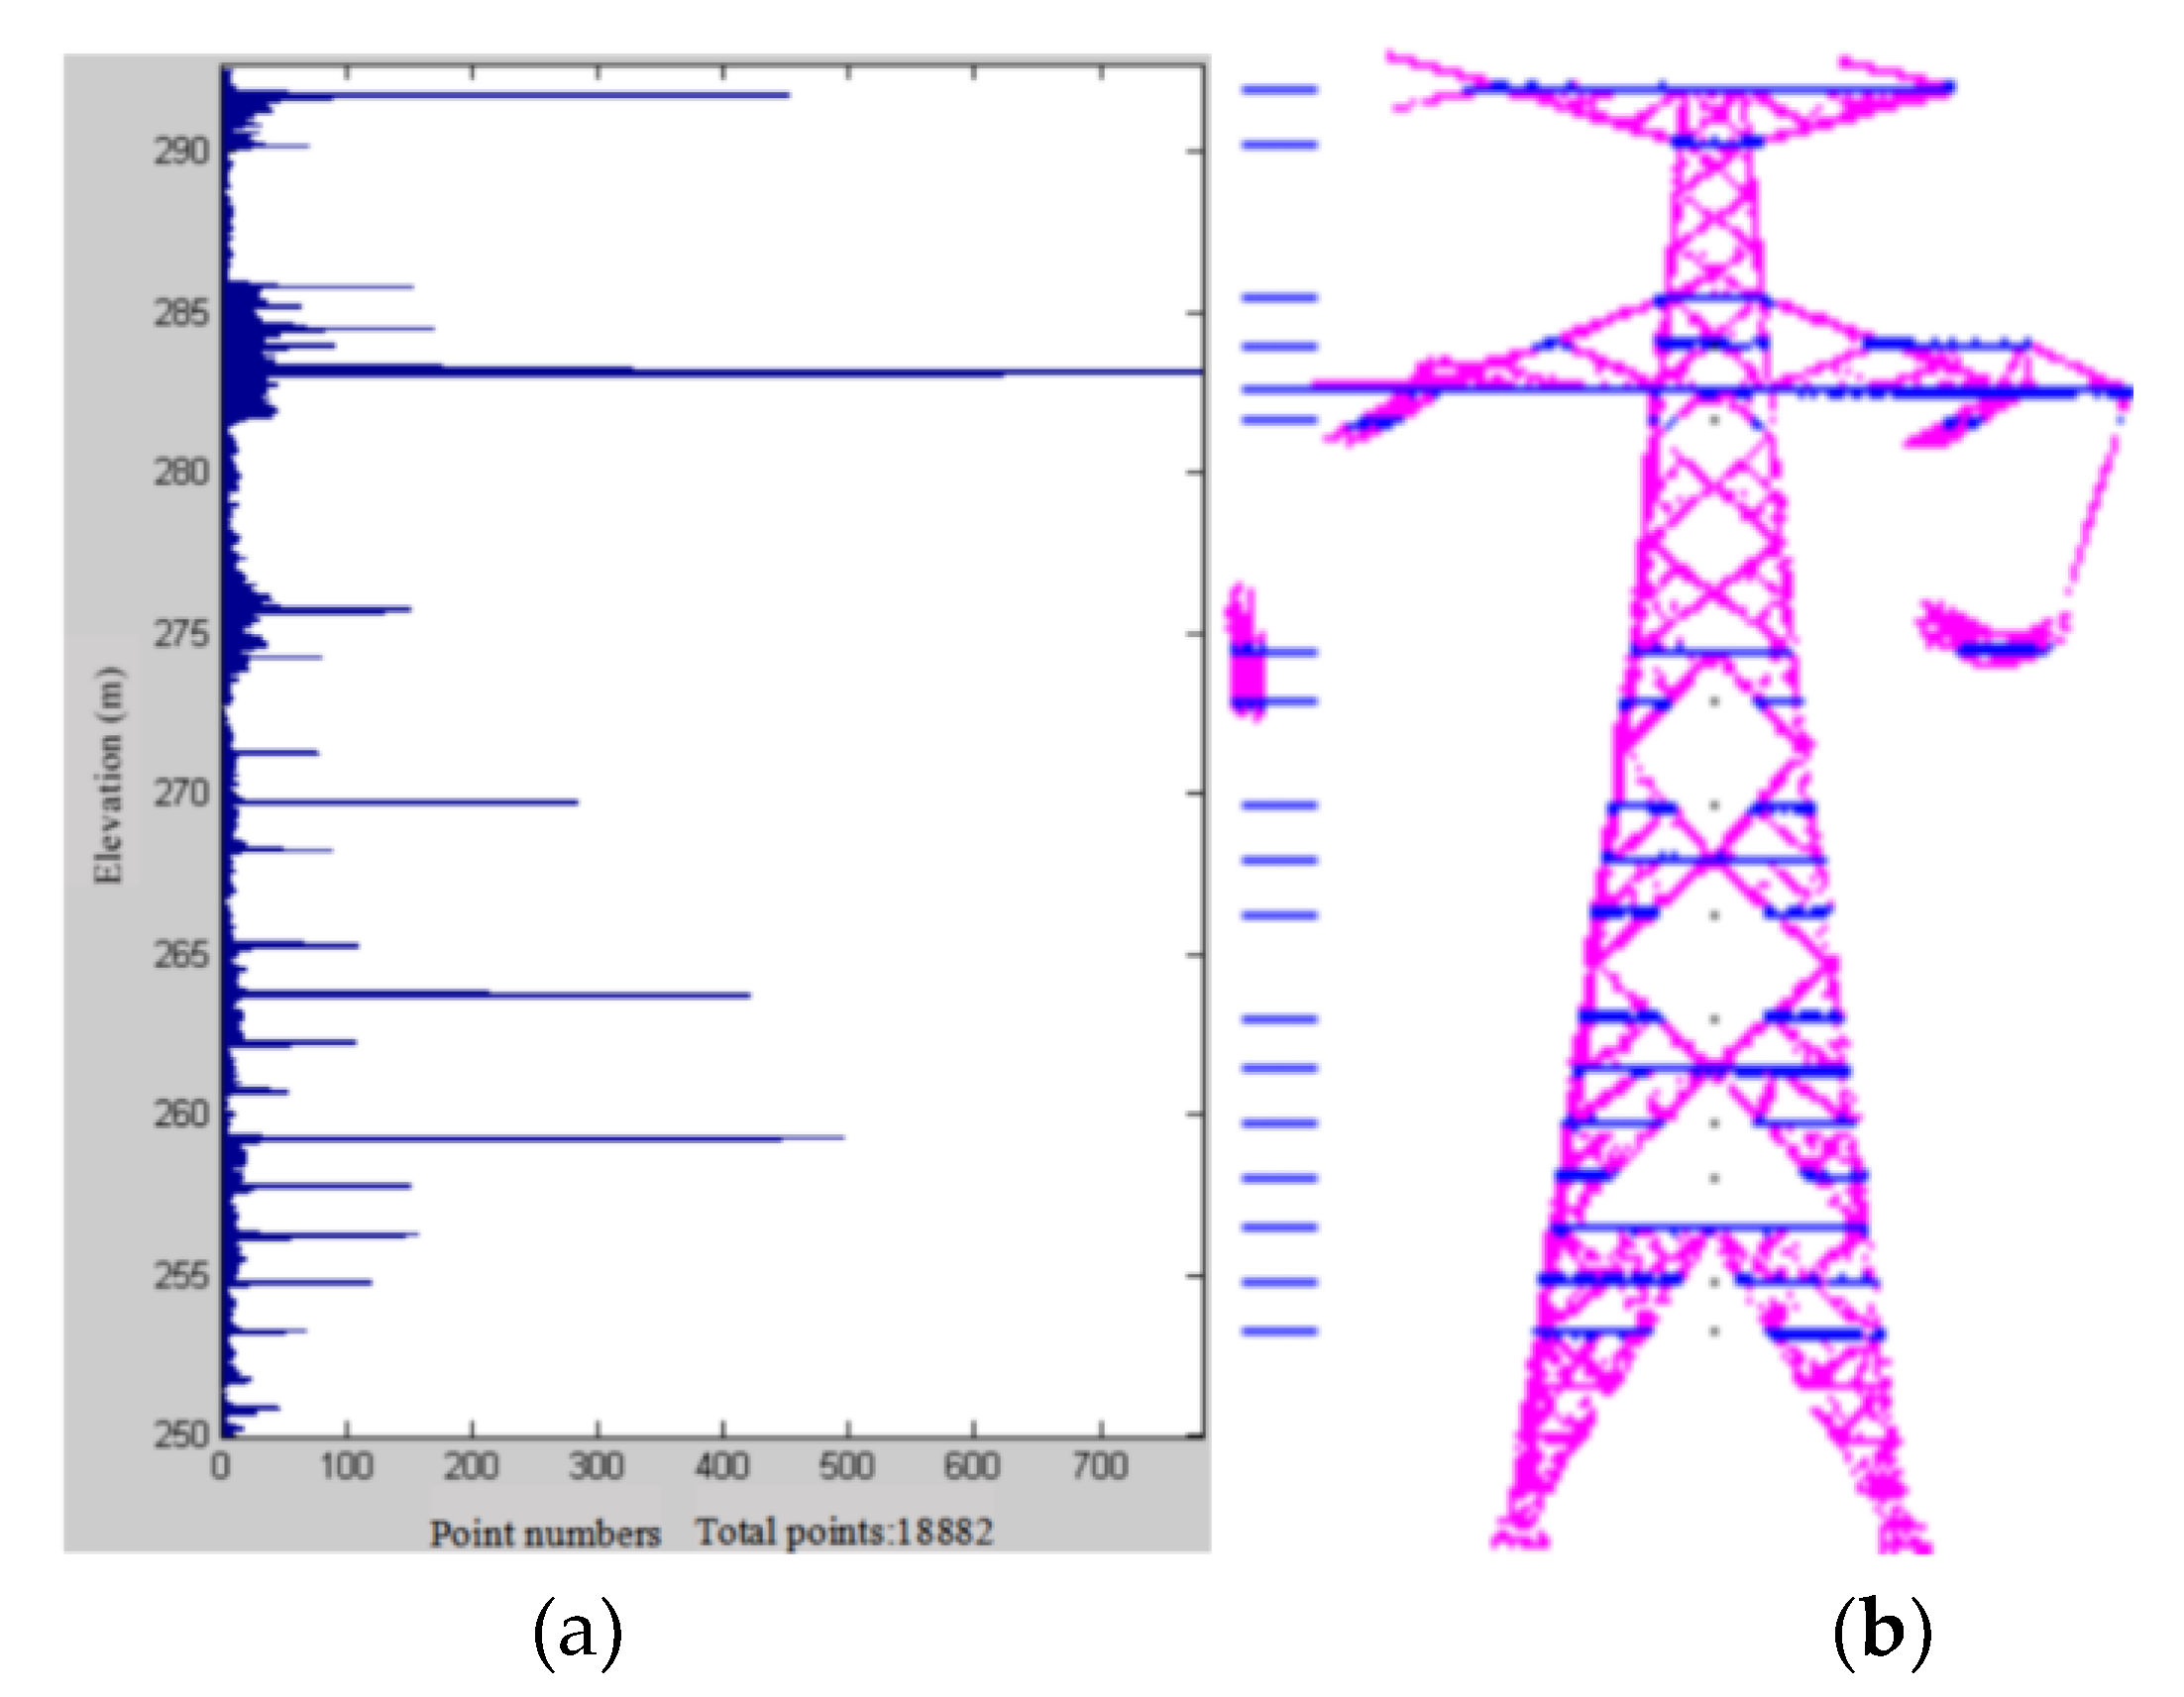
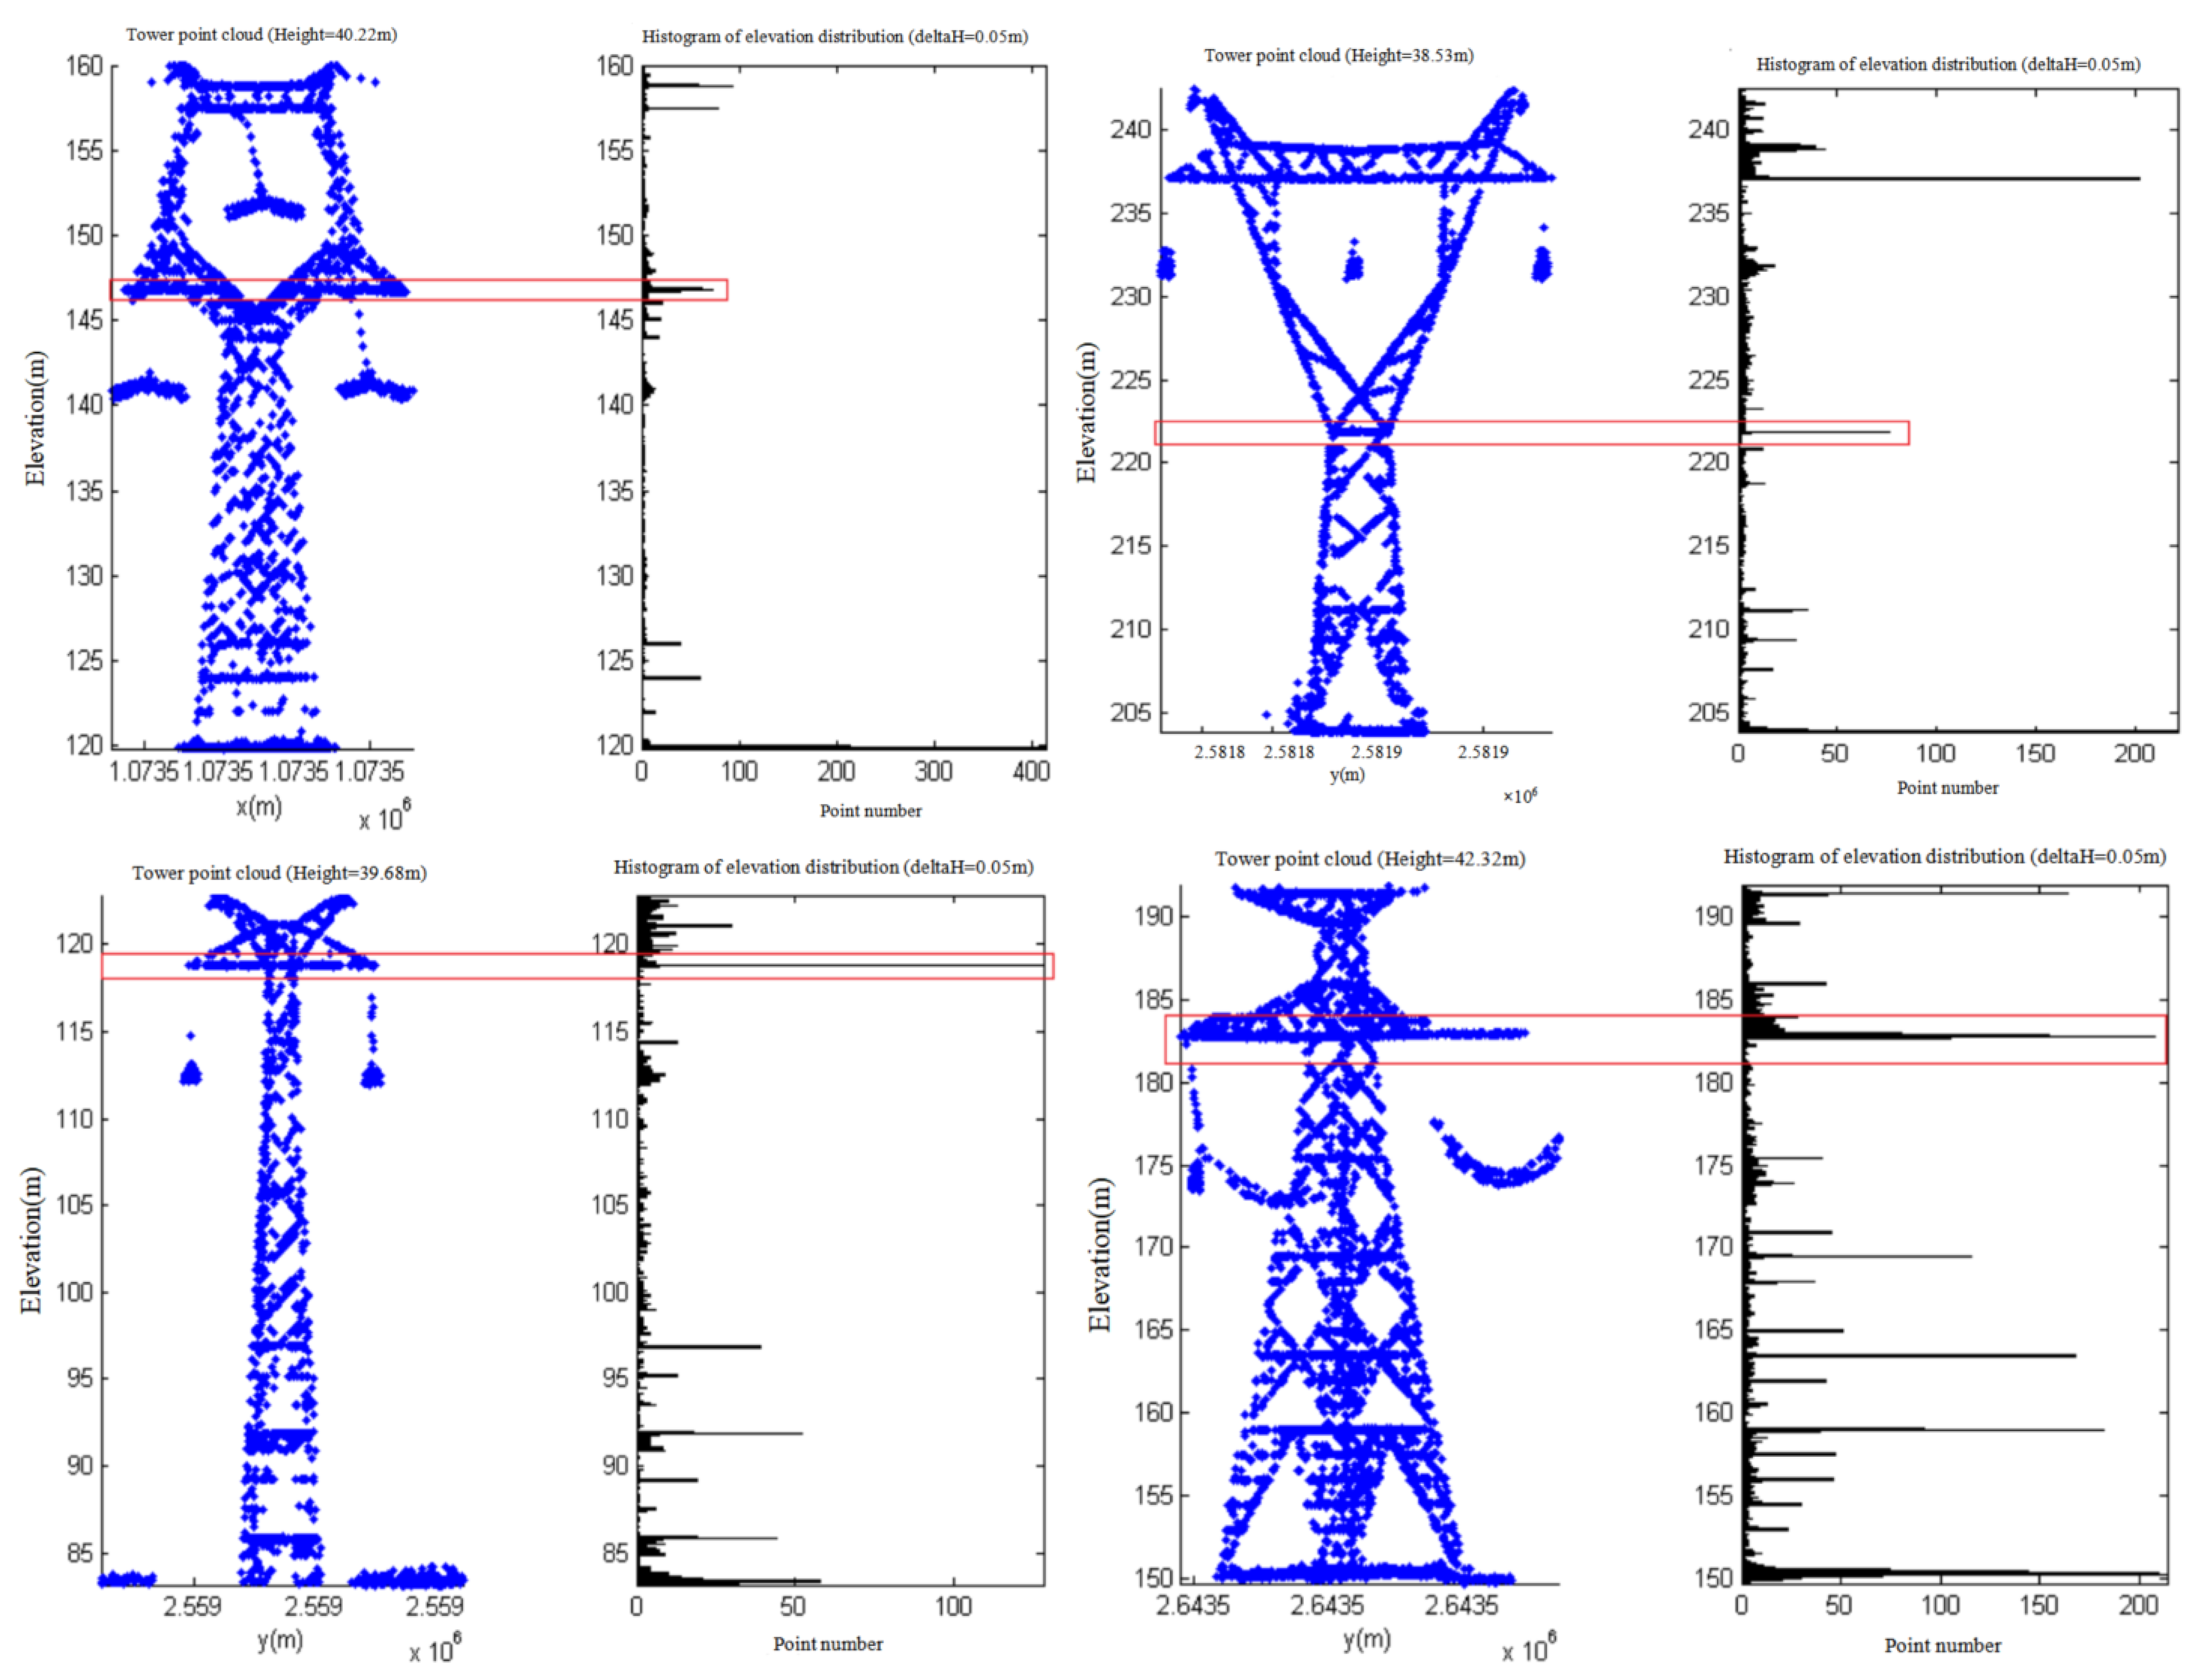
- The elevation interval was set and a horizontal projection was made based on it, i.e., every point within the elevation range of was counted as the point of the same elevation and the histogram of elevation distribution of the point cloud was generated (Figure 5a). Elevation interval was the key parameter of structural feature extraction. If the value was too small, the algorithm was inefficient; if the value was too large, the error increased. Considering the width of the transmission tower transverse structure, this parameter was set as 0.1 m in this paper.
- (2)
- local maximum values were calculated and their corresponding elevation values were regarded as candidate feature elevations. To ensure that no characteristic elevation is omitted in the selection process, the value of should be greater than the actual number of steel beams, which is usually smaller than 20. To reduce the possibility of omission, the value of was set as 50 in this paper.
- (3)
- According to the constraint of the minimum interval of the feature plane, the moving window method was adopted to remove the maximum values that were too close to each other. Specifically, a window of size was used to mark the maximum values in the window from low to high (forward) and from high to low (backward) respectively. The same values in the two results were selected as the feature elevation, as shown in Figure 5b.
2.2.2. Tower Head and Tower Body Point Cloud Segmentation
- (1)
- The mean of number of points in all feature elevation planes was calculated.
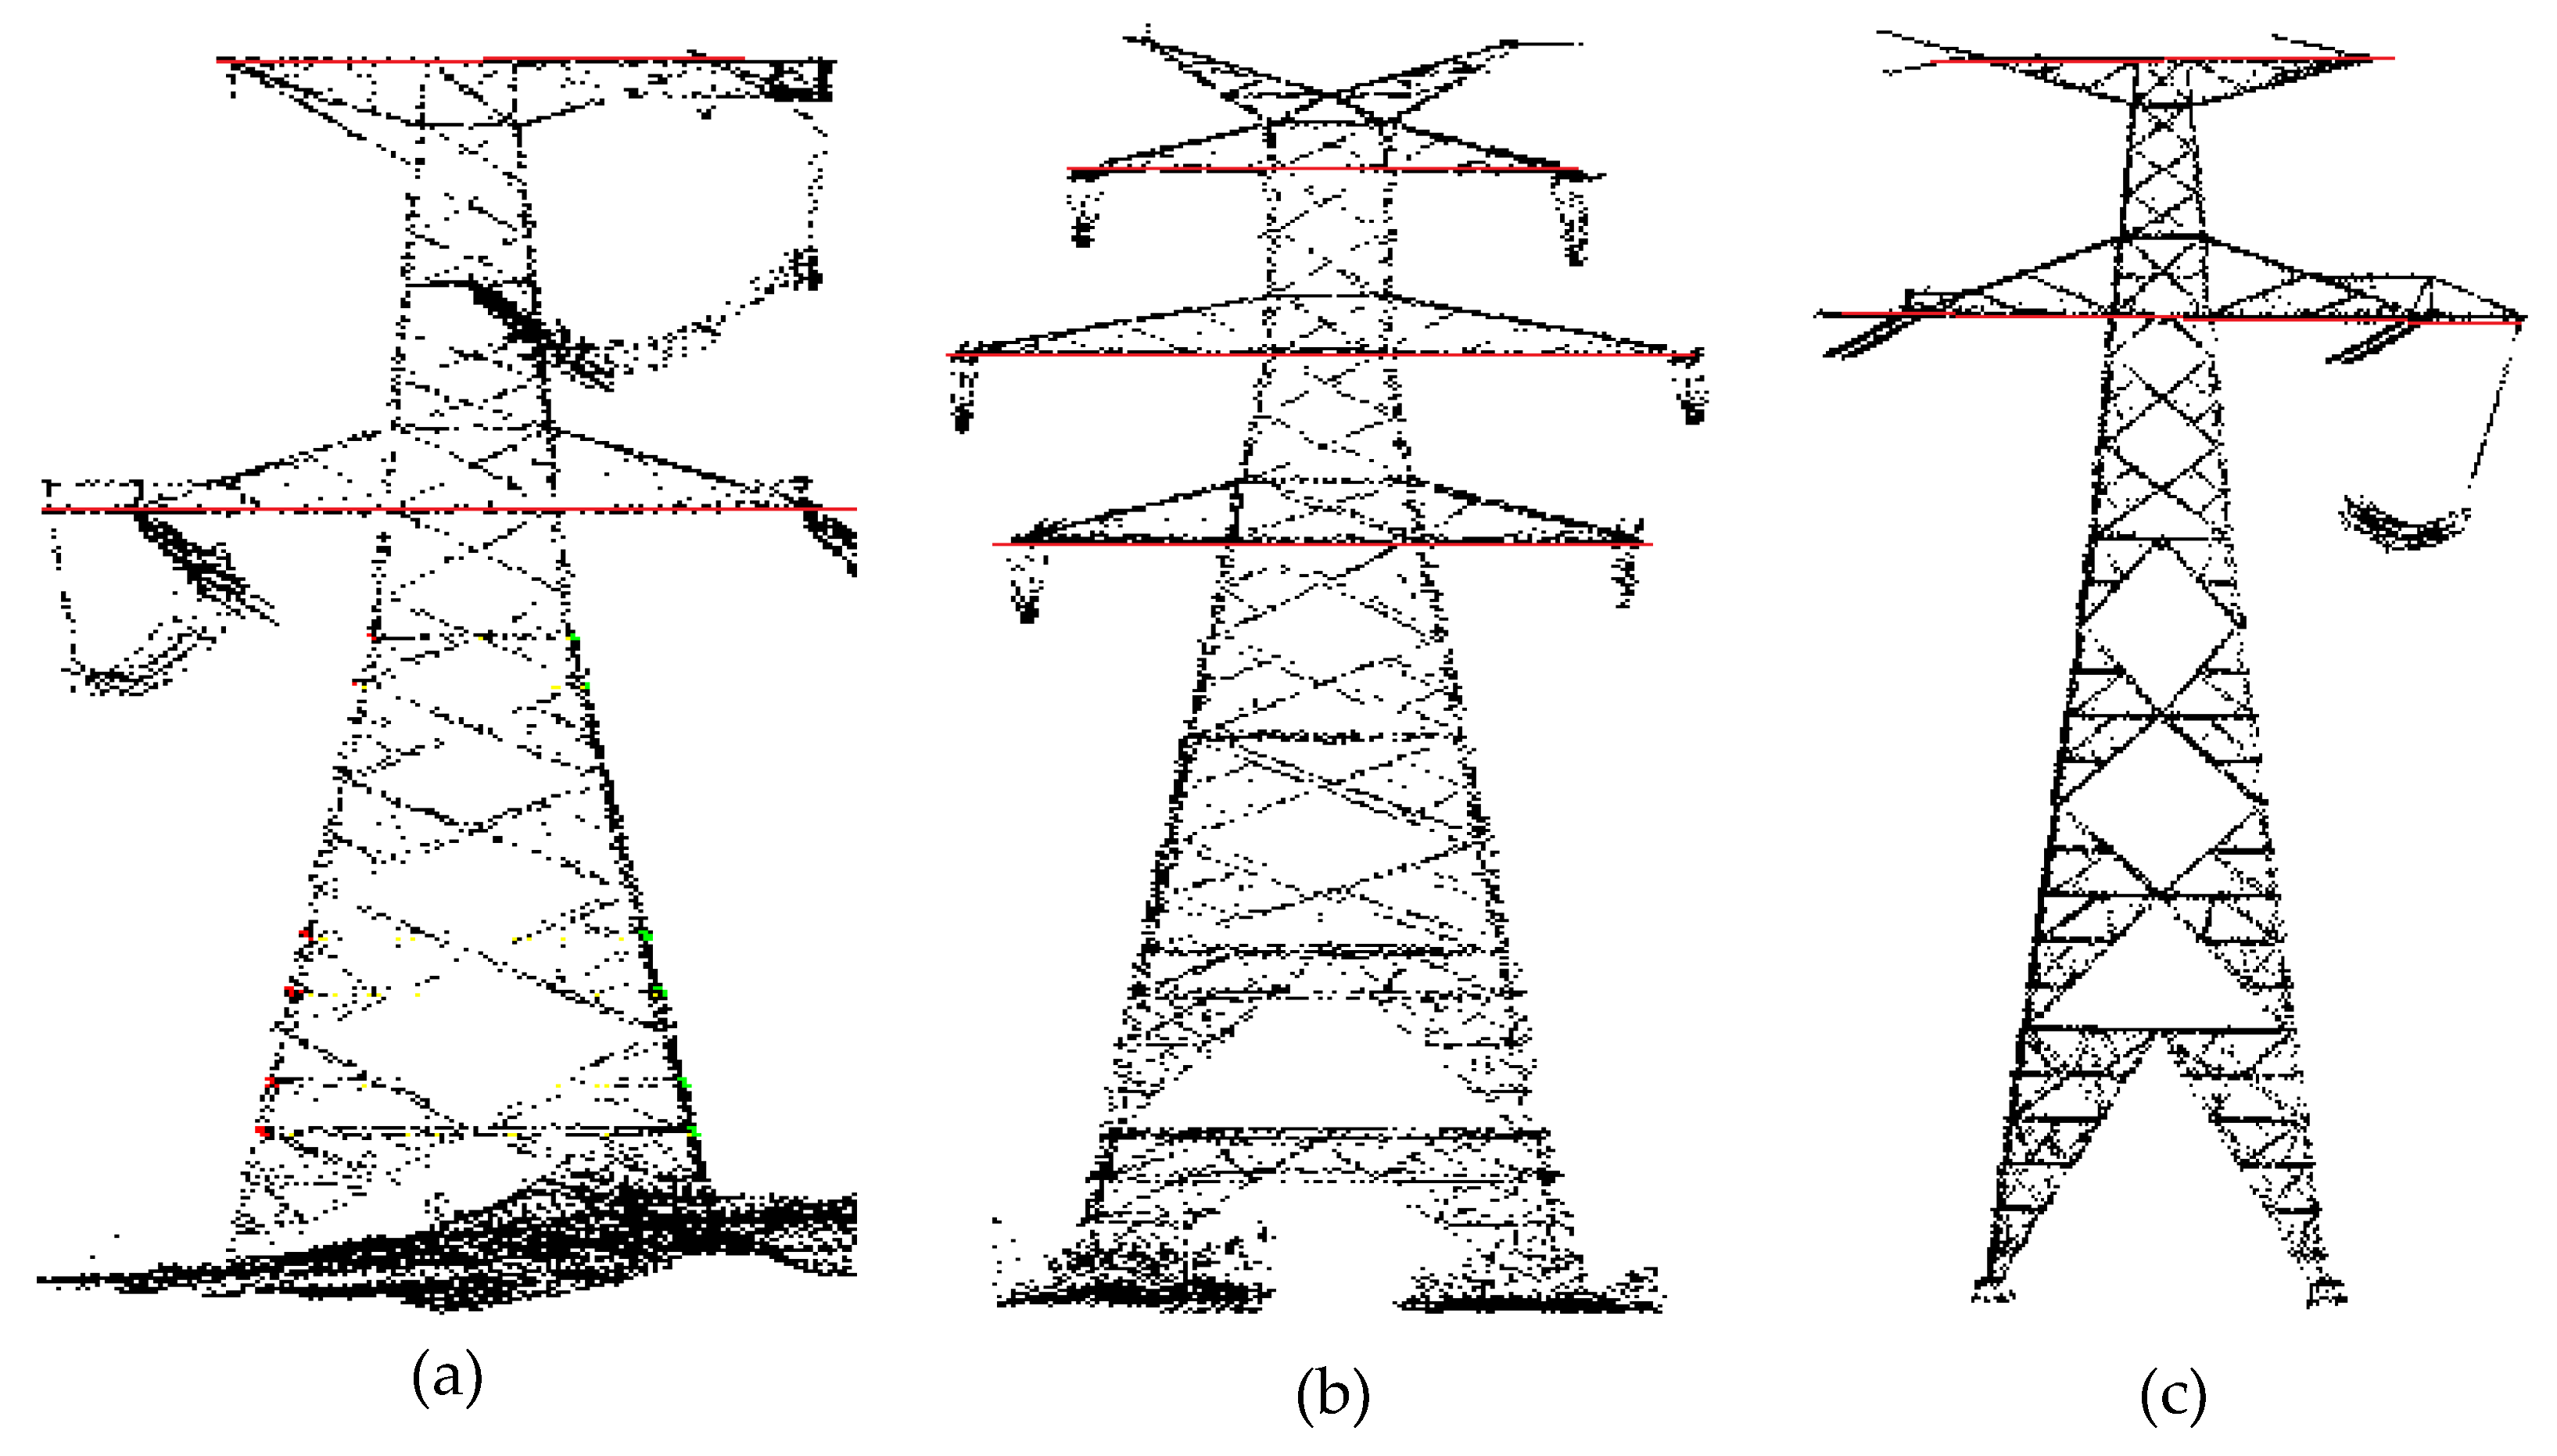
- (2)
- The number of points corresponding to each feature elevation was calculated from the feature elevation upwards. The first feature elevation where the number of points was greater than the mean was the elevation of tower shoulder, based on which the tower head and tower body was segmented, as shown in Figure 7.
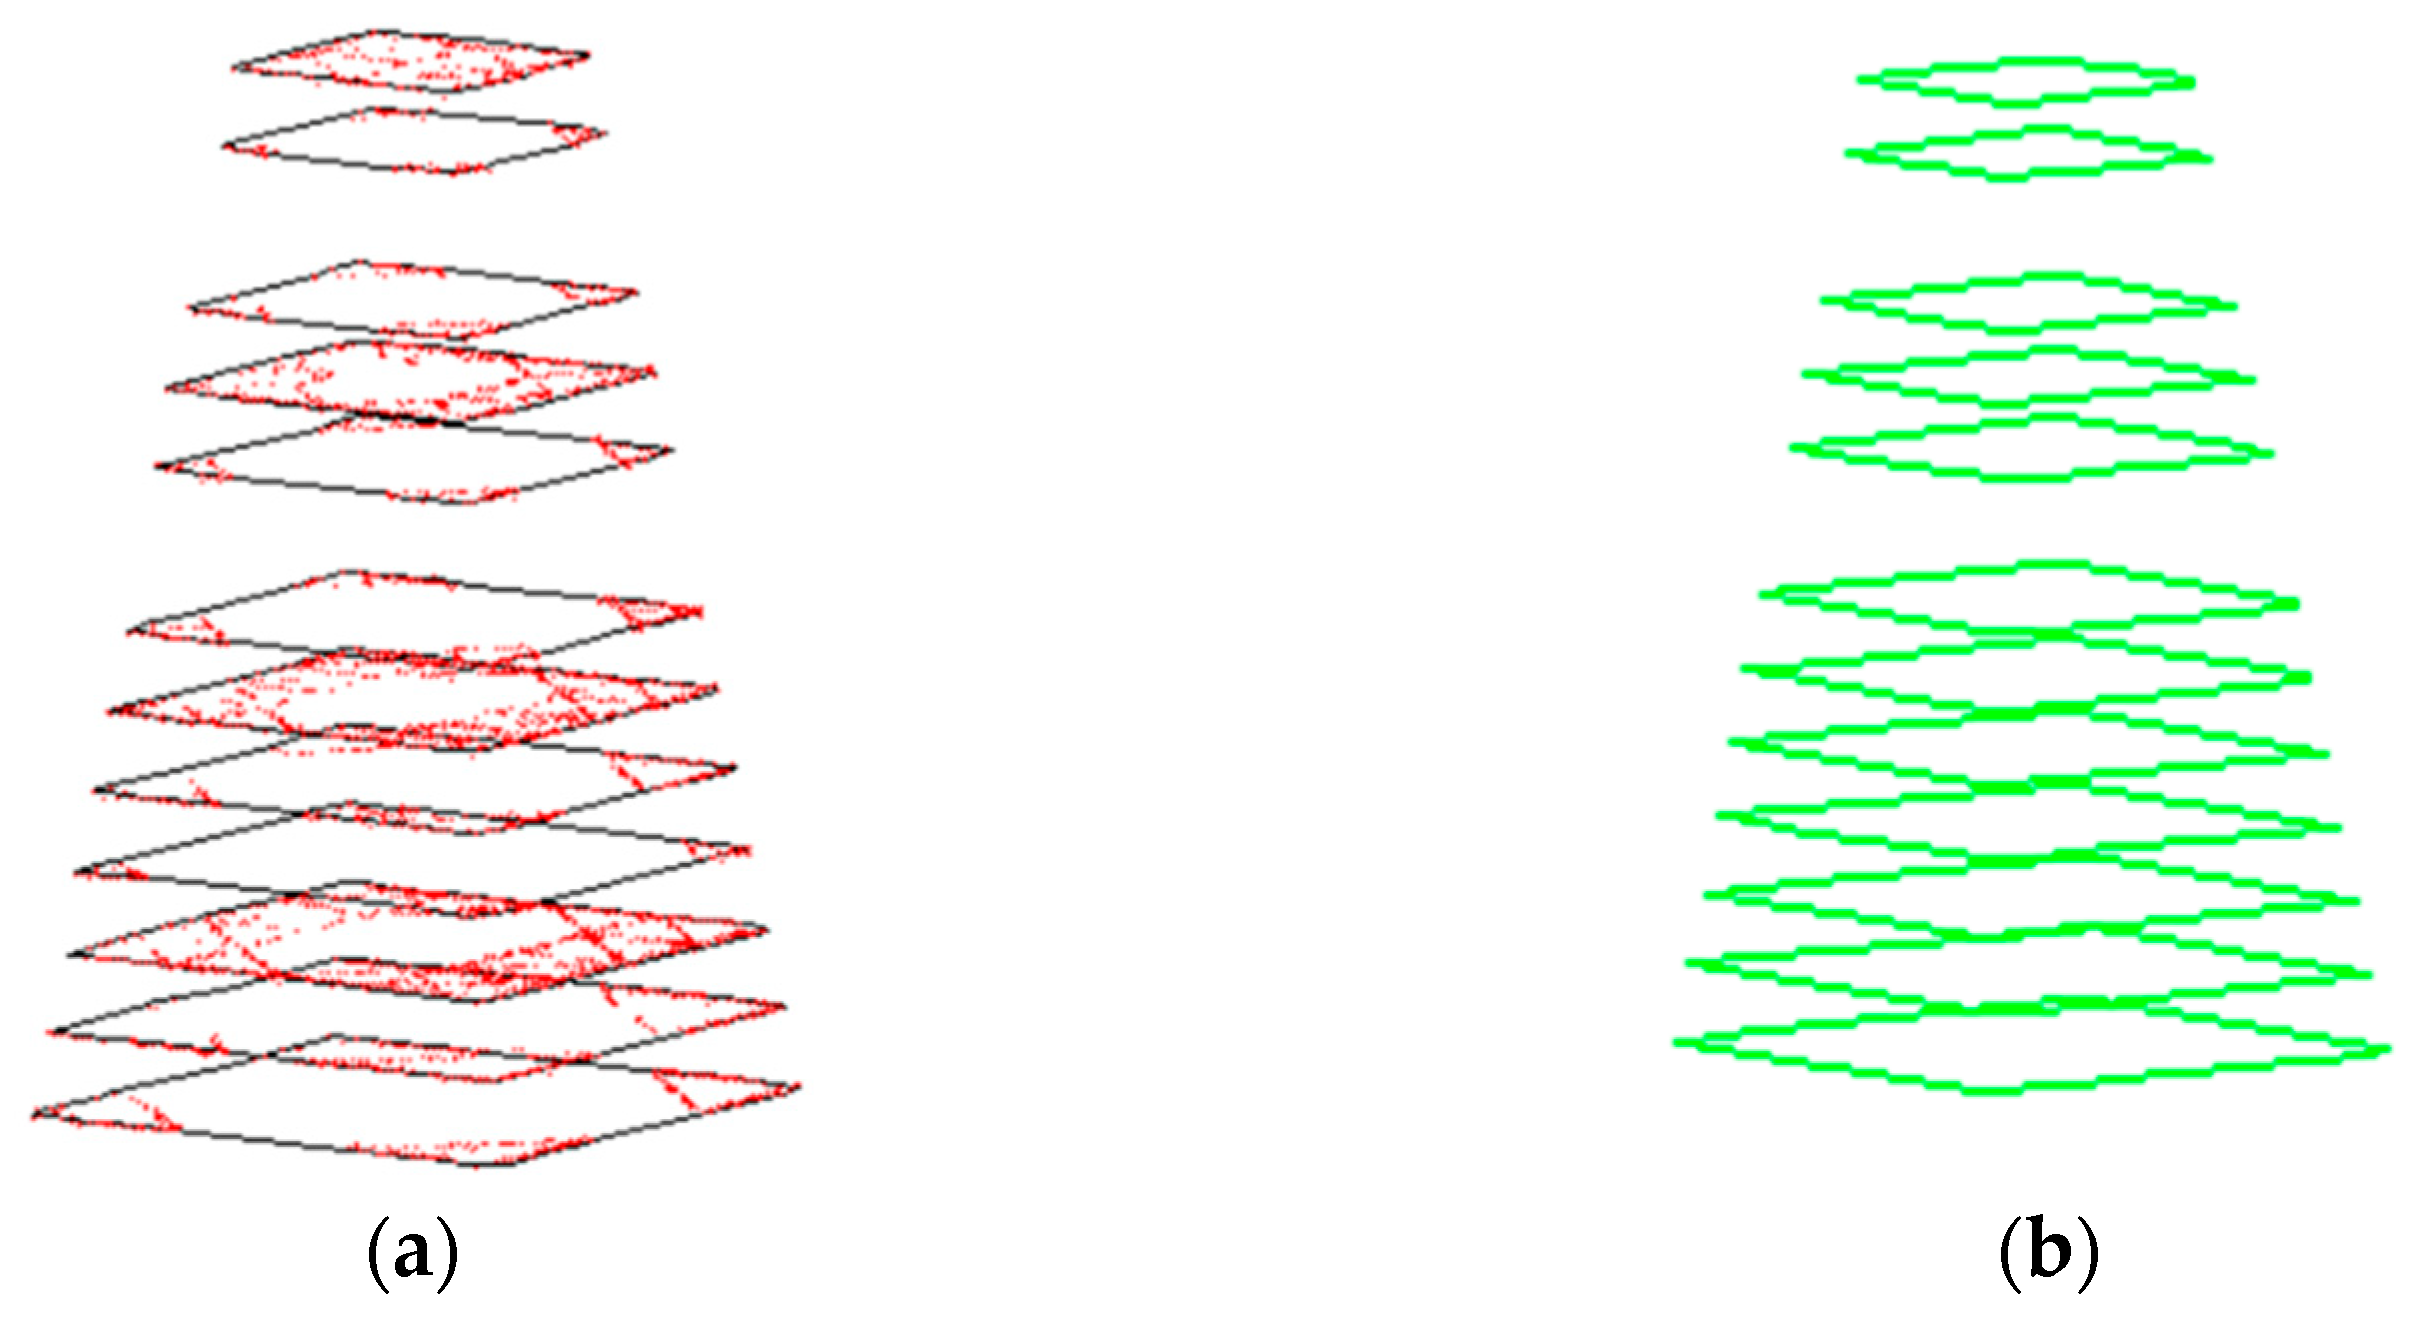
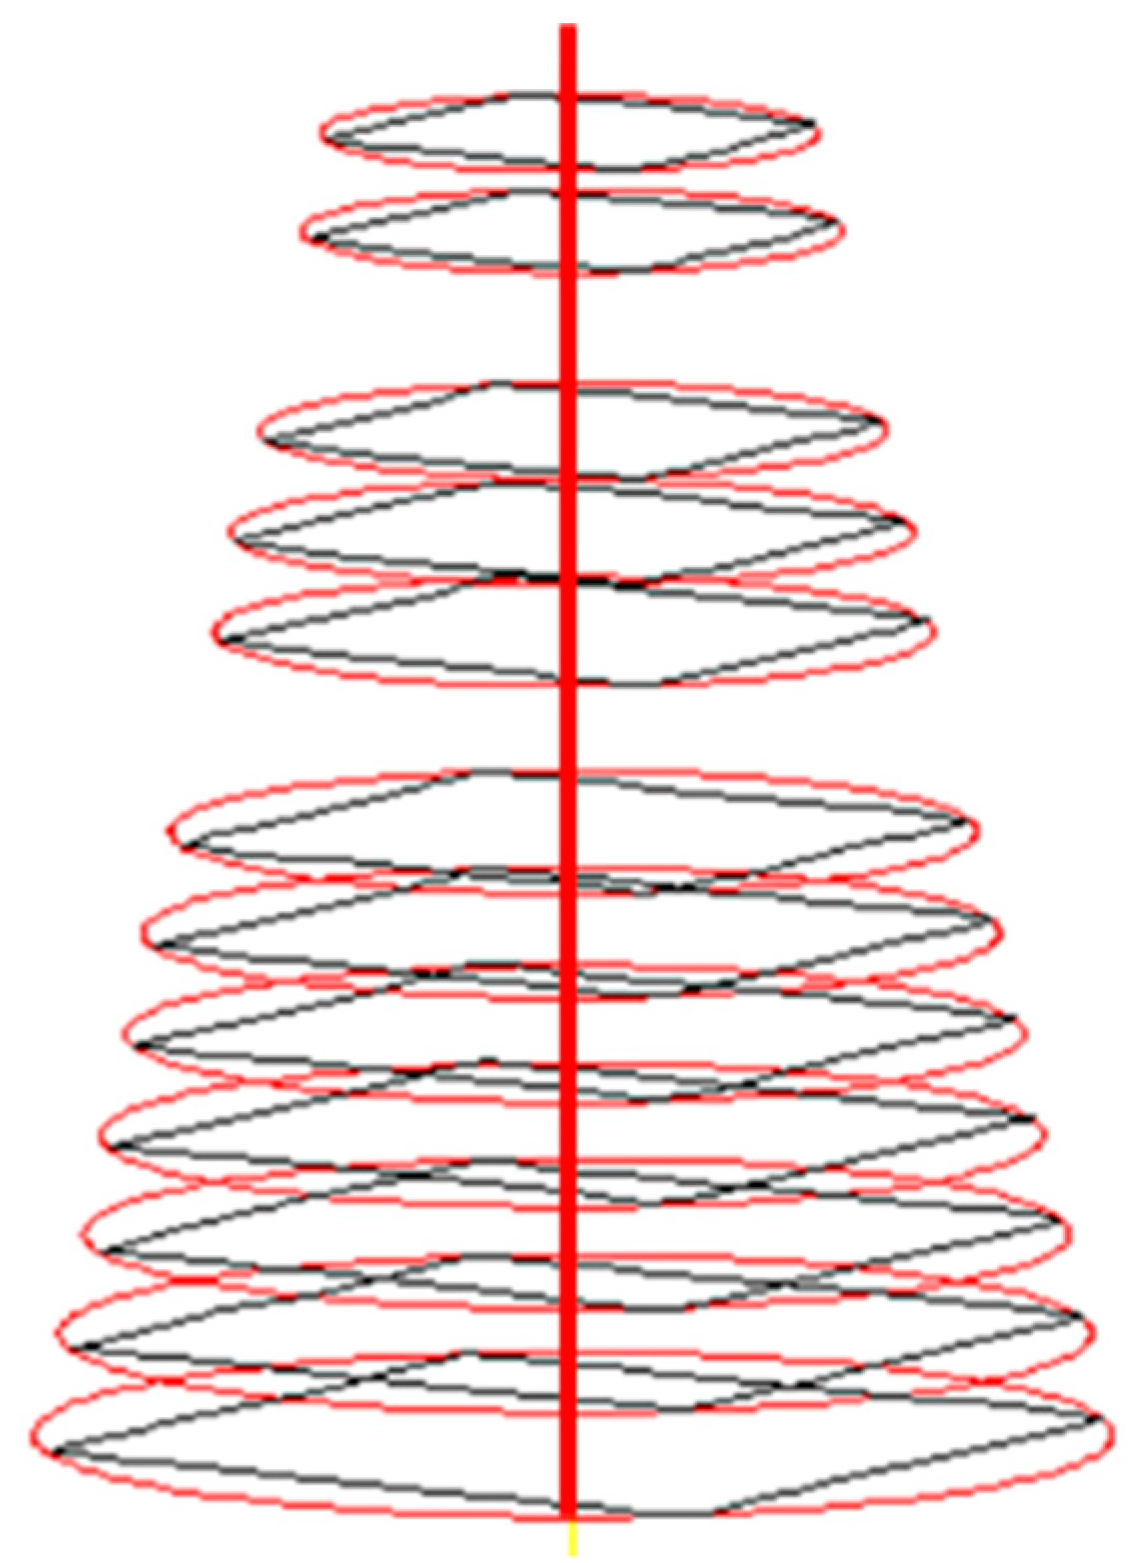
2.2.3. Feature Plane Contours Analysis
2.3. Tower Body Tilt Evaluation
2.3.1. Central Axis Fitting Based on Multi-Layer Feature Planes
- (1)
- The angle threshold was set. When the calculated angle was less than , the tower axis was considered vertical. The maximum iteration number was set.
- (2)
- (3)
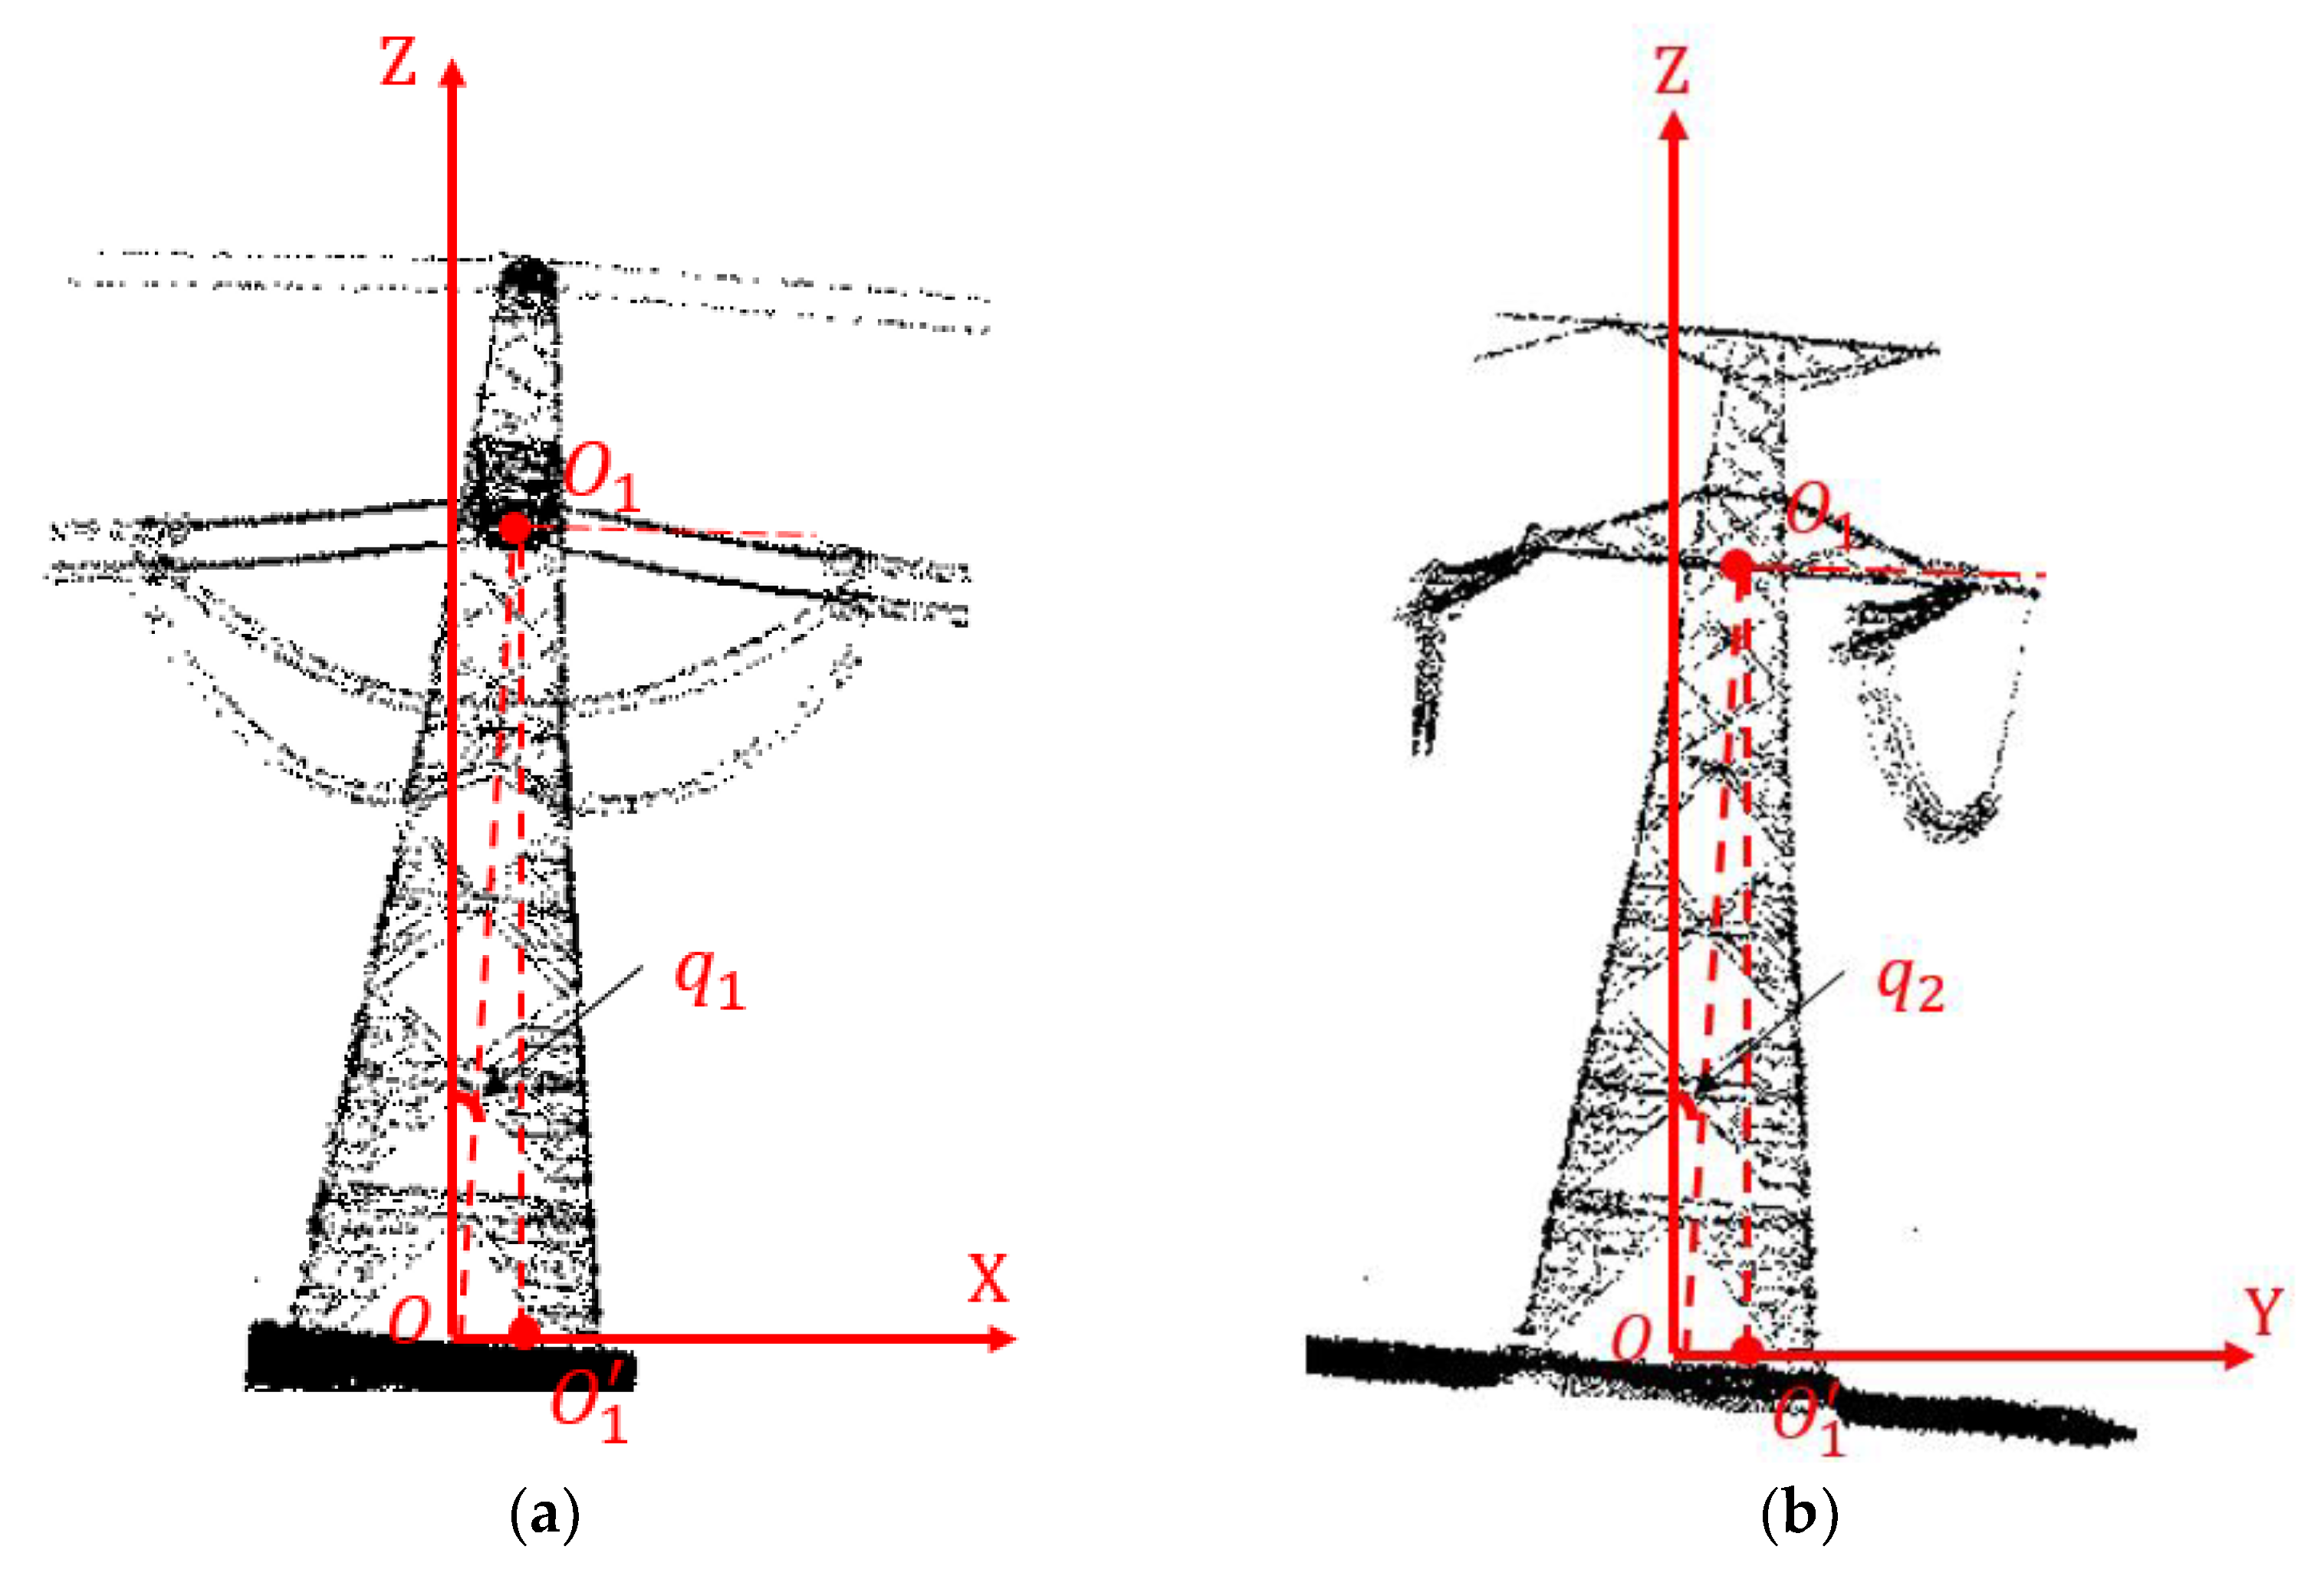
- The central axis was projected onto the YOZ plane and the angle between the central axis and the X-axis was calculated (Figure 10a).
- (4)
- When was greater than , it indicated that the tower rotated around the X-axis. Otherwise, skip Step (5).
- (5)
- The point cloud of transmission tower was rotated in the reverse direction around the X-axis, and the feature plane extraction and contour analysis were repeated to obtain the new central axis of the tower. Steps 2–4 were repeated until the angle was less than or the number of iterations reached .
- (6)
- The central axis was projected to XOZ plane (Figure 10b), and the angle between the central axis and Y axis was calculated.
- (7)
- When was greater than , it indicated that the tower was rotated around the Y-axis. Otherwise, Step (8) was skipped.
- (8)
- The point cloud of transmission tower was rotated in the reverse direction around the Y-axis, and the new central axis of the tower was obtained by repeated feature plane extraction and contour analysis. The central axis was projected to XOZ plane, and the angle between the central axis and the Y-axis was calculated again until the angle was less than or the number of iterations reached .
- (9)
- The sum of in Step (5) was , the angle between the initial central axis and X-axis; the sum of in Step (8) was , the angle between the initial central axis and the Y-axis.
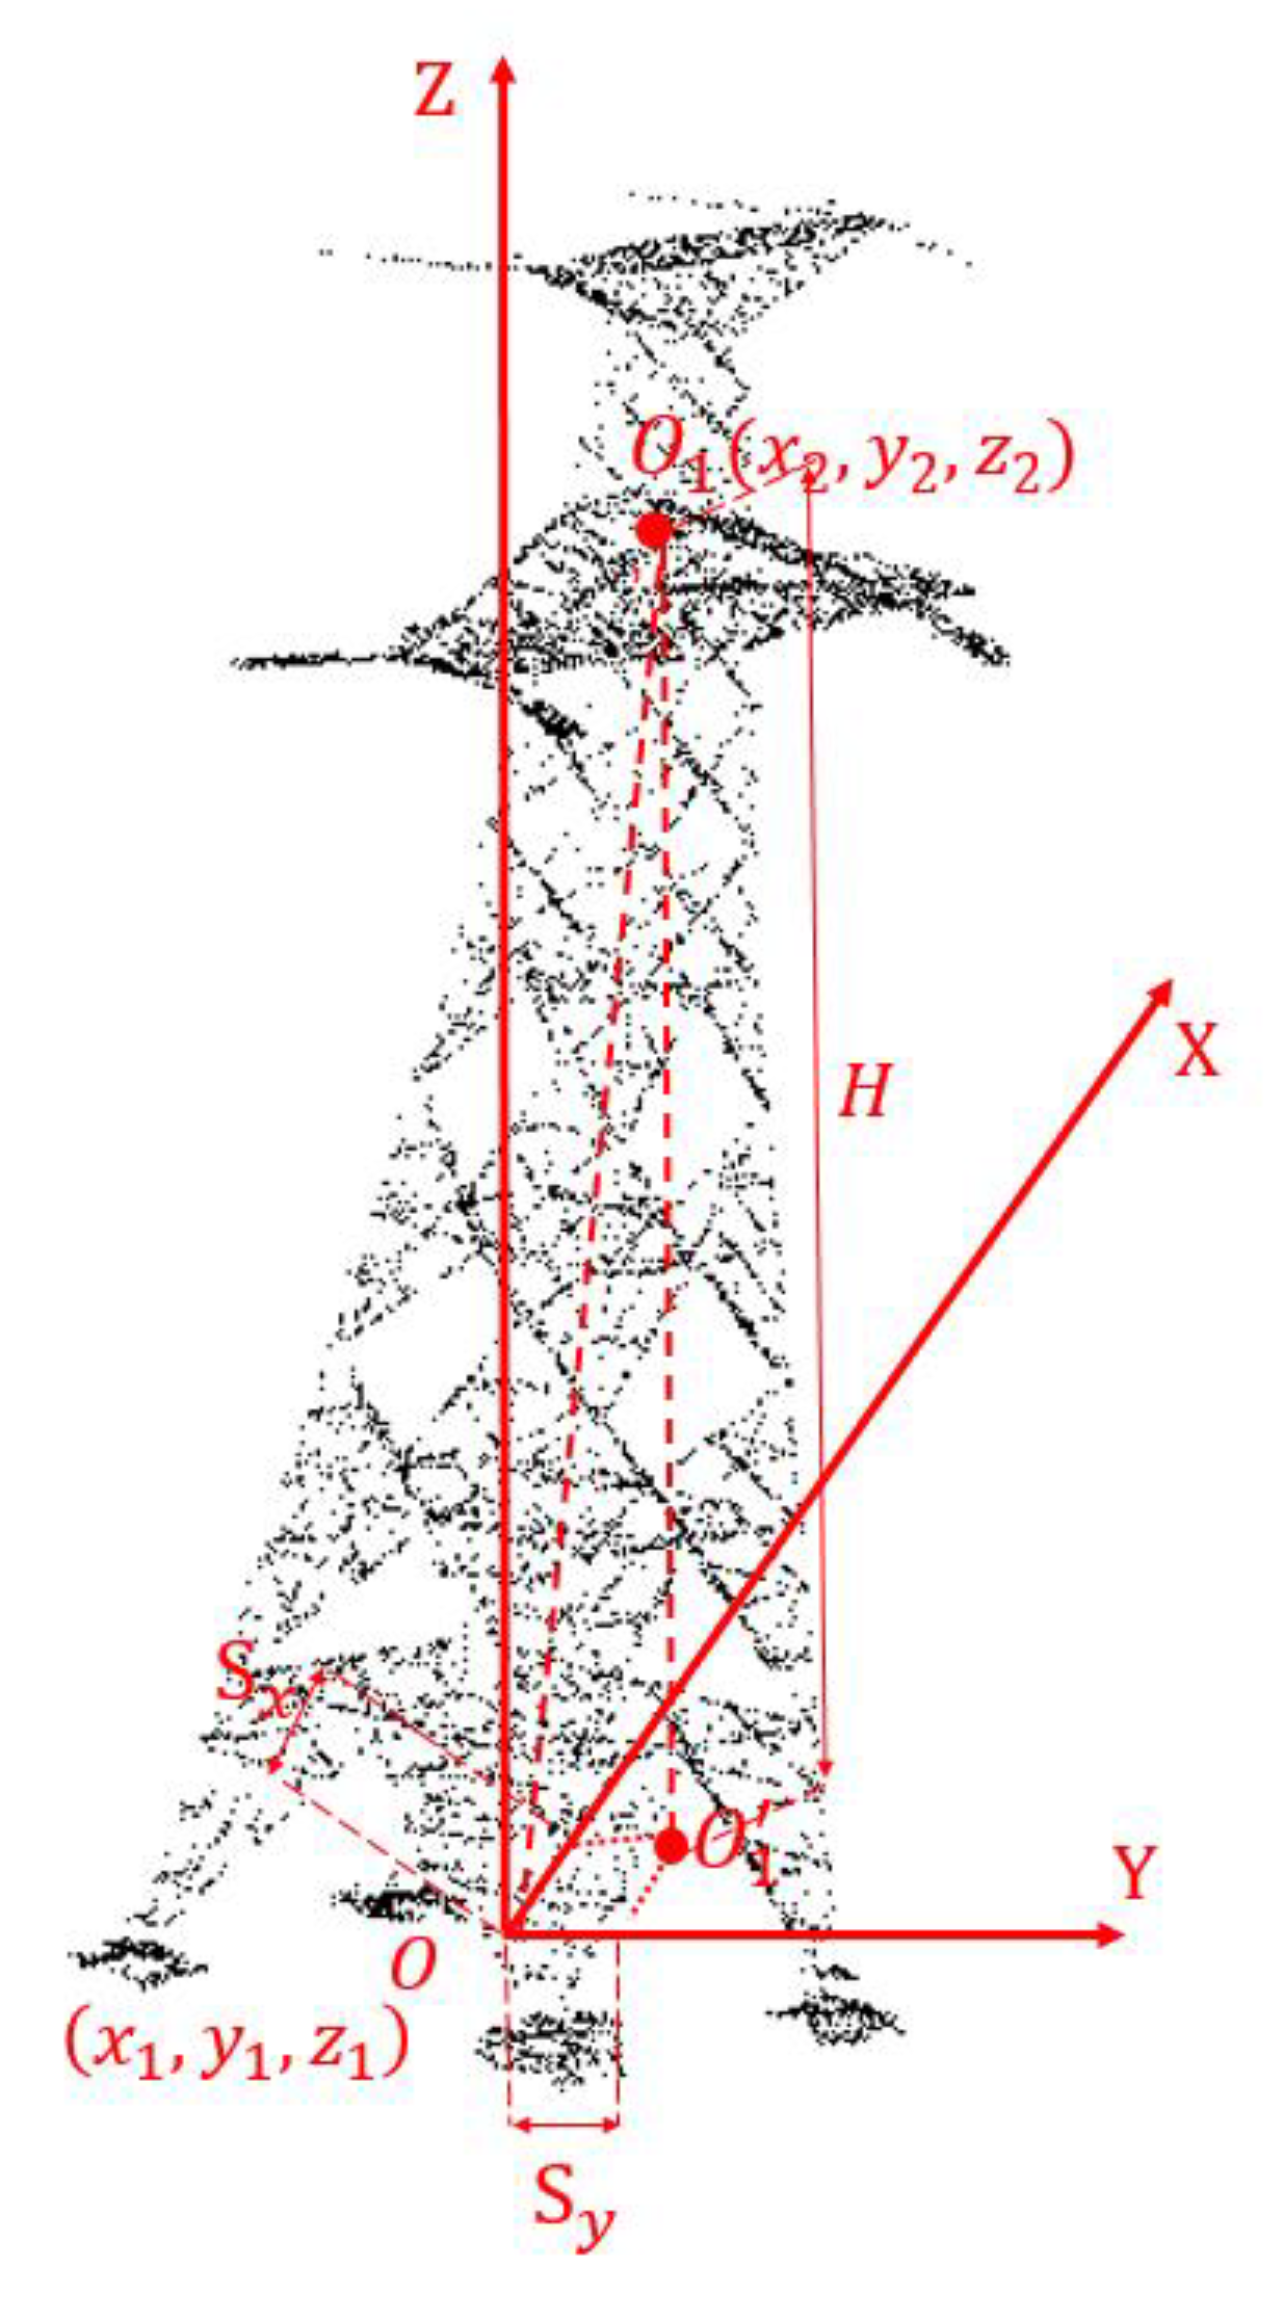
2.3.2. Tilt Angle Calculation Based on the Central Axis of Tower
2.4. Tower Head Tilt Status Evaluation
- (1)
- Calculation of tower head deformation offset
- (2)
- Overall deformation evaluation of tower head
3. Experiments and Results
3.1. Dataset
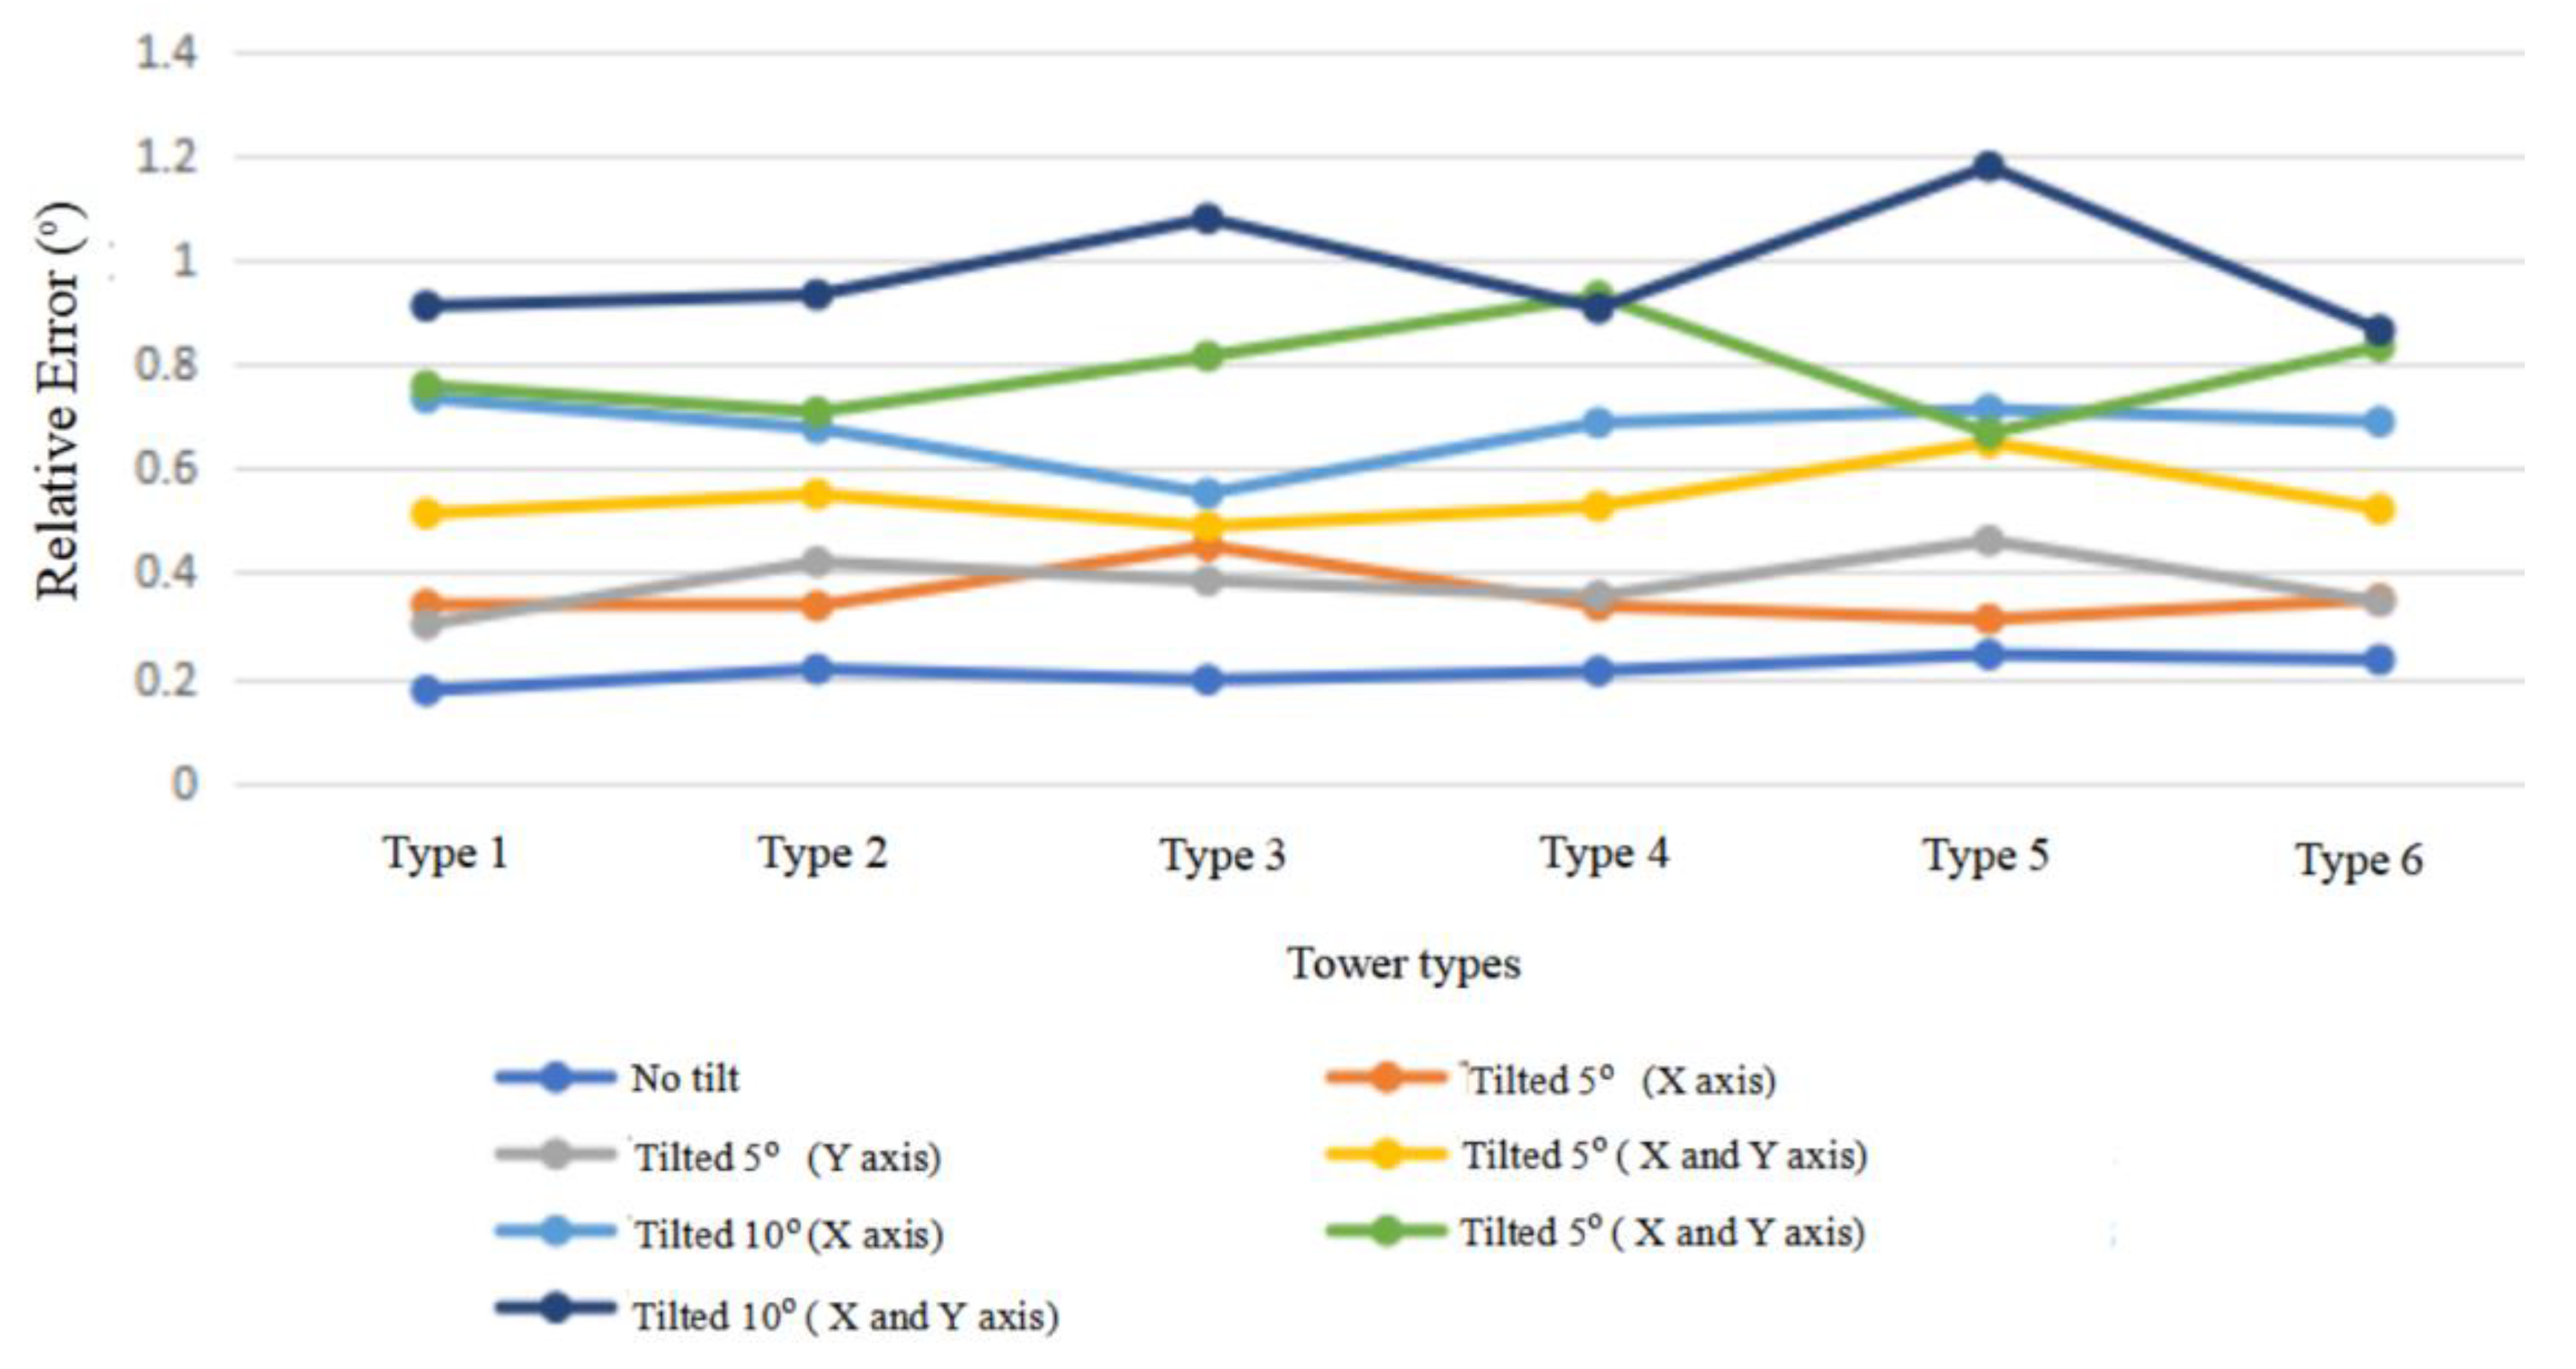
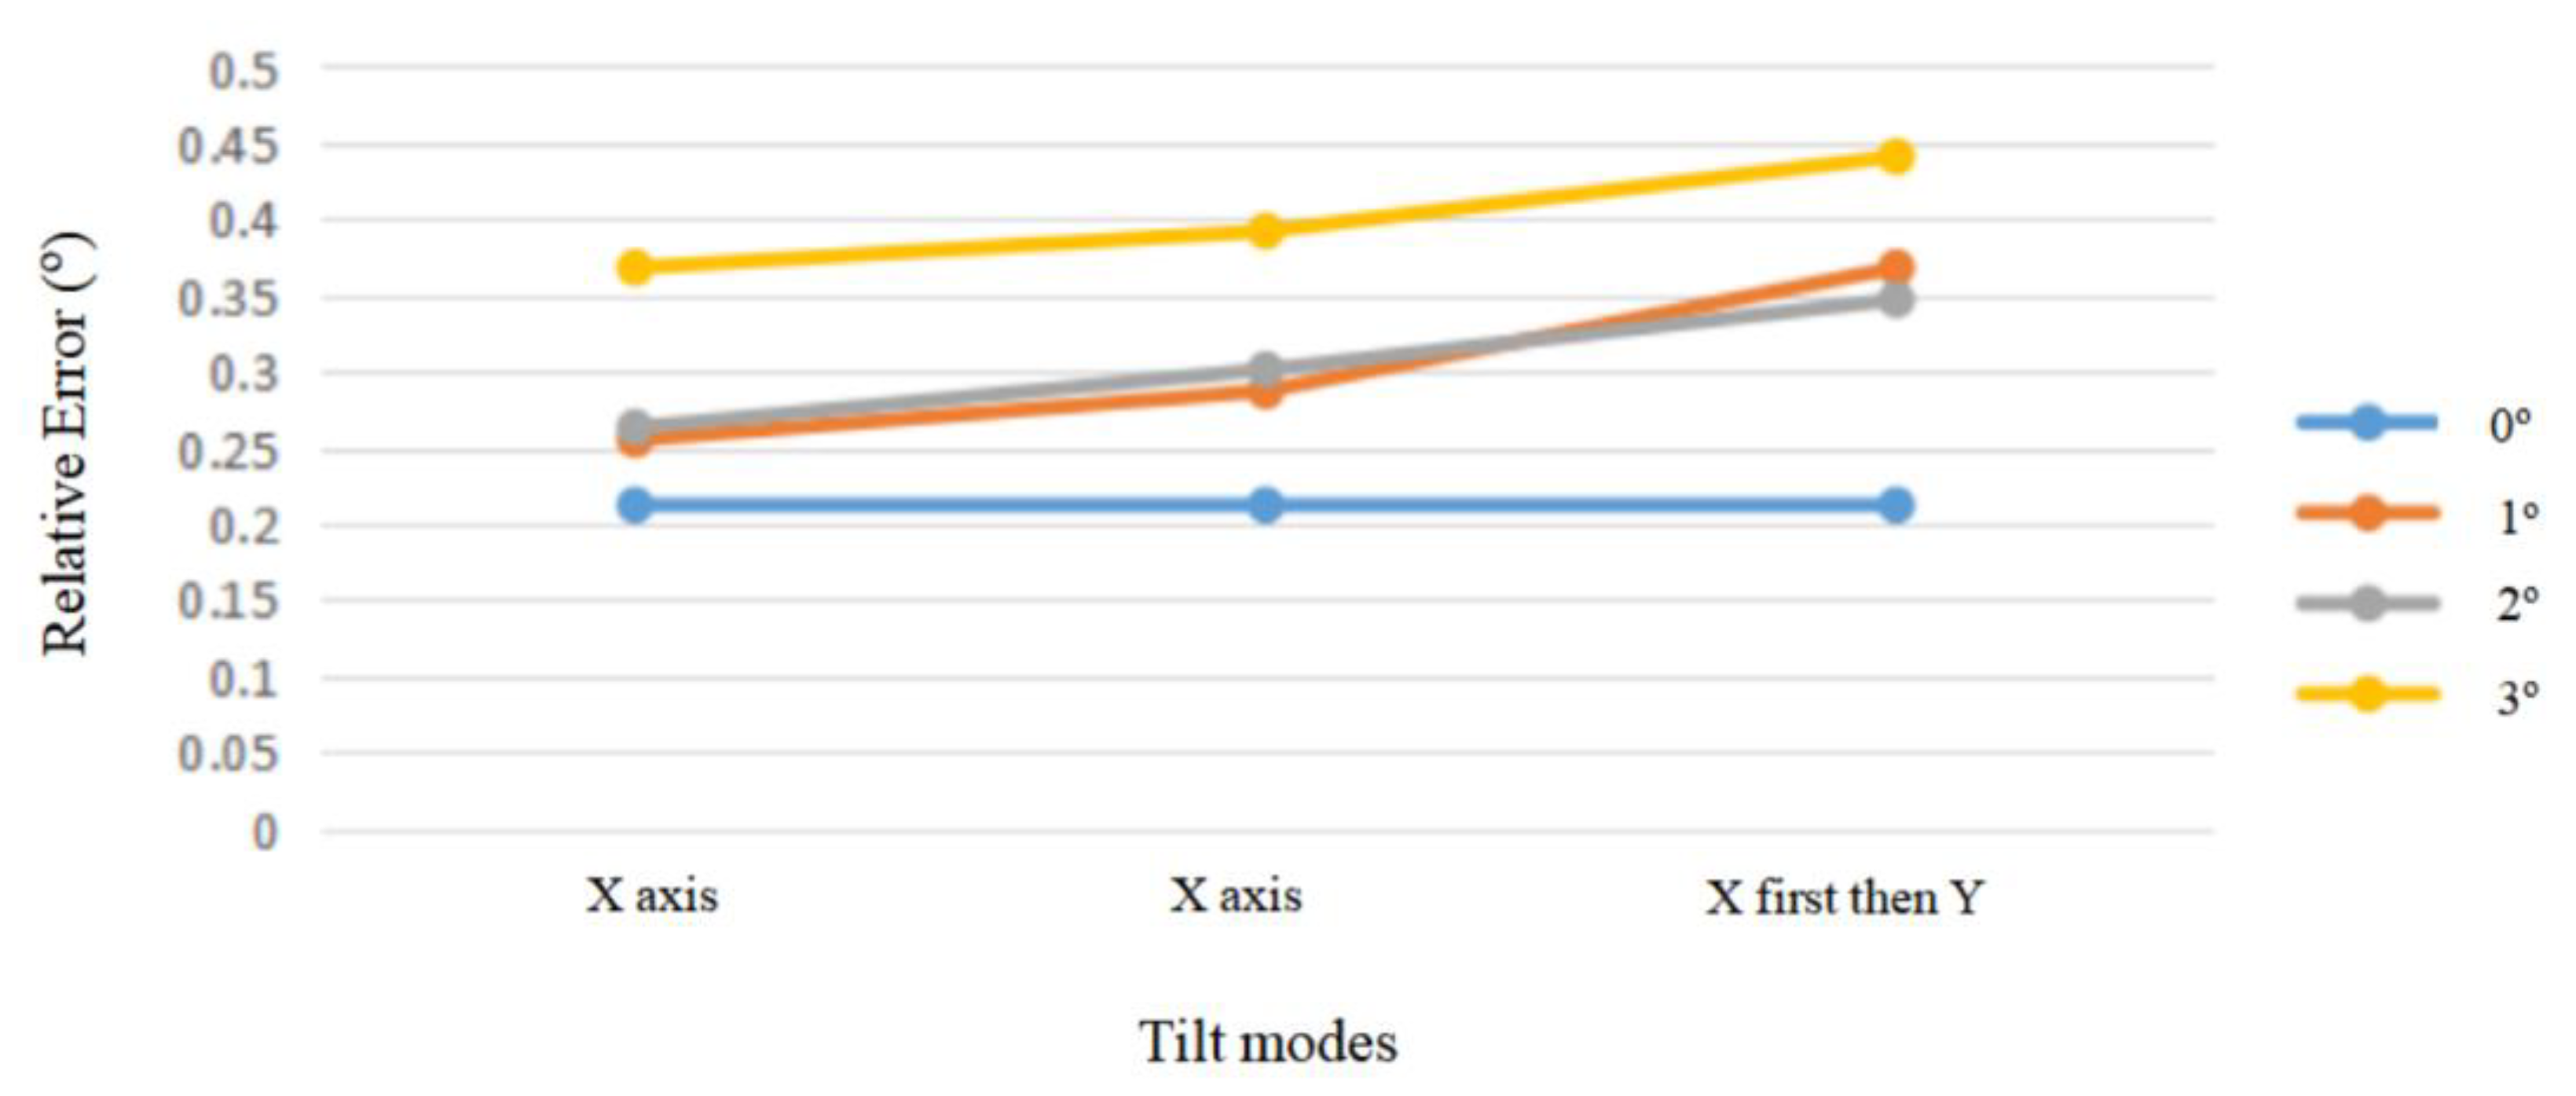
3.2. Analysis of Tower Body Tilt State Evaluation
3.3. Analysis of Tower Head Tilt State Evaluation
4. Discussion
5. Conclusions
Author Contributions
Funding
Institutional Review Board Statement
Informed Consent Statement
Data Availability Statement
Conflicts of Interest
References
- Salmeron, J.; Wood, K.; Baldick, R. Analysis of Electric Grid Security Under Terrorist Threat. IEEE Trans. Power Syst. 2015, 19, 905–912. [Google Scholar] [CrossRef] [Green Version]
- Zhang, D.; He, Q. Security Situation Awareness Method for Smart Grid. Int. Core J. Eng. 2020, 6, 49–55. [Google Scholar]
- Komninos, N.; Philippou, E.; Pitsillides, A. Survey in smart grid and smart home security: Issues, challenges and countermeasures. IEEE Commun. Surv. Tutor. 2014, 16, 1933–1954. [Google Scholar] [CrossRef]
- Li, Z. State Assessment and Maintenance of 220 kV Transmission Lines Based on Big Data Analysis. Master’s Thesis, Shandong University, Jinan, China, 2019. [Google Scholar]
- Zhang, X.; Zhao, Y.; Zhou, L.; Zhao, J.; Dong, W.; Zhang, M.; Lv, X. Transmission Tower Tilt Monitoring System Using Low-Power Wide-Area Network Technology. IEEE Sens. J. 2021, 21, 1100–1107. [Google Scholar] [CrossRef]
- Shi, L.; He, Y.; Li, B.; Cheng, T.; Huang, Y.; Sui, Y. Transmission Tower Tilt Angle on-Line Prognosis by Using Solar-Powered LoRa Sensor Node and Sliding XGBoost Predictor. IEEE Access. 2019, 7, 86168–86176. [Google Scholar] [CrossRef]
- Wang, X.; Song, X. Safety Evaluation Criteria of Power Supply Tower Damage Caused by Mining Subsidence. Shanxi Coal. 2018, 38, 1–6. [Google Scholar]
- Zhou, Q.; Zhang, H.; Ma, B.; Huang, Y. Wind loads on transmission tower bodies under skew winds with both yaw and tilt angles. J. Wind Eng. Ind. Aerodyn. 2019, 187, 48–60. [Google Scholar] [CrossRef]
- Hua, Y. Extraction and Recognition of Aerial Video Insulator Parts. Master’s Thesis, Dalian Maritime University, Dalian, China, 2013. [Google Scholar]
- Chen, L. Information Extraction of Transmission Line Tower Based on High Density Airborne Laser Point Cloud. Master’s Thesis, Liaoning Technical University, Fuxin, China, 2016. [Google Scholar]
- Wang, W.; Wang, B.; Hua, C.; Liu, H. Comparison of Inclination Measurement Methods of Power Tower. Electron. Power Surv. Design. 2018, 8, 10–13, 23. [Google Scholar]
- State Grid Corporation of China. Code for Construction and Acceptance of 1000 kV Overhead Transmission Line; State Grid Corporation of China: Beijing, China, 2007; pp. 1–23. [Google Scholar]
- Huang, X.; Zhong, J.; Zhang, J.; Huang, M.; Tian, J.; Zhu, J. Design of transmission tower tilt on-line monitoring system based on ZigBee technology. Mod. Electron. Technol. 2019, 42, 95–99. [Google Scholar]
- Malhara, S.; Vittal, V. Mechanical State Estimation of Overhead Transmission Lines Using Tilt Sensors. IEEE Trans. Power Syst. 2010, 25, 1282–1290. [Google Scholar] [CrossRef]
- Yang, H.; Liang, S.; Li, C.; Miao, X.; Chang, M. Research of electric power tower tilt angle sensor based on FBG. Transducer Microsyst. Technol. 2013, 32, 21–24. [Google Scholar]
- Yang, F.; Song, L.; Zhou, Z. Application of narrowband communication technology in tilt monitoring of power tower. Rural Elect. 2020, 28, 38–40. [Google Scholar]
- Gungor, V.C.; Sahin, D.; Kocak, T.; Ergut, S.; Buccella, C.; Cecati, C.; Hancke, G.P. A Survey on Smart Grid Potential Applications and Communication Requirements. IEEE Trans. Ind. Inform. 2012, 9, 28–42. [Google Scholar] [CrossRef] [Green Version]
- Manoj, P.; Kumar, Y.B.; Gowtham, M.; Vishwas, D.B.; Ajay, A.V. Internet of Things for smart grid applications. In Advances in Smart Grid Power System; Academic Press: New York, NY, USA, 2021; pp. 159–190. [Google Scholar]
- Gupta, N.; Kaur, N.; Jain, S.K. Chapter 3—Smart grid power system. In Advances in Smart Grid Power System; Academic Press: Cambridge, MA, USA, 2021; pp. 47–71. [Google Scholar]
- Xu, Z.; Wang, Z.; Yang, F. Airborne Lidar Measurement Technology and Engineering Application Practice; Wuhan University Press: Wuhan, China, 2009. [Google Scholar]
- Yi, H.; Kai, L. Chapter 5—Devices and technology for monitoring transmission lines. In Inspection and Monitoring Technologies of Transmission Lines with Remote Sensing; Academic Press: Cambridge, MA, USA, 2017; pp. 281–508. [Google Scholar]
- Guan, H.; Sun, X.; Su, Y.; Hu, T.; Wang, H.; Wang, H.; Peng, C.; Guo, Q. UAV-lidar aids automatic intelligent powerline inspection. Int. J. Electr. Power Energy Syst. 2021, 130, 106987. [Google Scholar] [CrossRef]
- Li, X.; Guo, Y. Application of LiDAR technology in power line inspection. In IOP Conference Series: Materials Science and Engineering; IOP Publishing Ltd.: Bristol, UK, 2018; Volume 382, p. 052025. [Google Scholar]
- Dihkan, M.; Mus, E. Automatic detection of power transmission lines and risky object locations using UAV LiDAR data. Arab. J. Geosci. 2021, 14, 567. [Google Scholar] [CrossRef]
- Azevedo, F.; Dias, A.; Almeida, J.; Oliveira, A.; Ferreira, A.; Santos, T.; Martins, A.; Silva, E. Lidar-based real-time detection and modeling of power lines for unmanned aerial vehicles. Sensors 2019, 19, 1812. [Google Scholar] [CrossRef] [PubMed] [Green Version]
- Teng, G.E.; Zhou, M.; Li, C.R.; Wu, H.H.; Li, W.; Meng, F.R.; Zhou, C.C.; Ma, L. Mini-UAV LiDAR for power line inspection. Int. Arch. Photogramm. Remote Sens. Spat. Inf. Sci. 2017, XLII-2/W7, 297–300. [Google Scholar] [CrossRef] [Green Version]
- Jordan, S.; Moore, J.; Hovet, S.; Box, J.; Perry, J.; Kirsche, K.; Lewis, D.; Tse, Z. State-of-the-art technologies for UAV inspections. IET Radar Sonar Navig. 2018, 12, 151–164. [Google Scholar] [CrossRef]
- Shi, L.; Yang, H.; Xu, L.; Yang, Y.; Wang, D.; Long, X.; Zhao, J. Fast detection method of transmission line defects and faults based on airborne laser LiDAR. In Journal of Physics: Conference Series; IOP Publishing Ltd.: Bristol, UK, 2021; Volume 2005, p. 012240. [Google Scholar]
- Zhang, P.; Li, Z.; Chen, Q. Detection of power transmission tower from SAR image based on the fusion method of CFAR and EF feature. In Proceedings of the 2013 IEEE International Geoscience and Remote Sensing Symposium-IGARSS, Melbourne, Australia, 21–26 July 2013; pp. 4018–4021. [Google Scholar]
- Yan, L.; Wu, W.; Li, T. Power transmission tower monitoring technology based on TerraSAR-X products. In International Symposium on Lidar and Radar Mapping 2011: Technologies and Applications; International Society for Optics and Photonics: Bellingham, WA, USA, 2011; Volume 8286, p. 82861E. [Google Scholar]
- Sampedro, C.; Martinez, C.; Chauhan, A.; Campoy, P. A supervised approach to electric tower detection and classification for power line inspection. In Proceedings of the 2014 International Joint Conference on Neural Networks, Beijing, China, 6–11 July 2014; pp. 1970–1977. [Google Scholar]
- Jenssen, R.; Roverso, D. Automatic autonomous vision-based power line inspection: A review of current status and the potential role of deep learning. Int. J. Electr. Power Energy Syst. 2018, 99, 107–120. [Google Scholar]
- Li, Q.; Chen, Z.; Hu, Q. A Model-driven Approach for 3D Modeling of Pylon from Airborne LiDAR Data. Remote Sens. 2015, 7, 11501–11524. [Google Scholar] [CrossRef] [Green Version]
- Han, W.; Xiao, X. Power tower modeling with airborne LiDAR data. Yangtze River 2012, 43, 22–25. [Google Scholar]
- Zhang, R.; Yang, B.; Xiao, W.; Liang, F.; Liu, Y.; Wang, Z. Automatic Extraction of High-Voltage Power Transmission Objects from UAV Lidar Point Clouds. Remote Sens. 2019, 11, 2600. [Google Scholar] [CrossRef] [Green Version]
- Guo, T.; Shen, P.; Shi, L.; Wang, W.; Li, X.; Liu, W.; Wang, C. Study on Power Tower Extraction and Fast Positioning from Airborne LiDAR Data. Remote Sens. Technol. Appl. 2018, 33, 530–535. [Google Scholar]
- Yin, H.; Sun, X.; Nie, Z. An Automated Extraction Algorithm of Power Lines Based on Airborne Laser Scanning Data. Geogr. Geo-Inf. Sci. 2012, 28, 31–34. [Google Scholar]
- Peng, X.; Song, S.; Qian, J.; Chen, C.; Wang, K.; Yang, Y.; Zheng, X. Research on Automatic Positioning Algorithm of Power Transmission Towers Based on UAV LiDAR. Power Syst. Technol. 2017, 41, 3670–3677. [Google Scholar]
- Tan, G. Application of 3D Laser Scanner in the Deformation Monitoring of Cooling Towers in Power Plant. Electr. Power Surv. Des. 2009, 4, 30–32. [Google Scholar]
- Shen, X.; Du, Y.; Wang, R.; Zhao, K.; Qin, C. Inclination measurement of transmission line tower based on terrestrial 3D lidar. J. Electron. Meas. Instrum. 2017, 31, 516–521. [Google Scholar]
- Zhao, X.; Zhang, Z.; Zhang, Y.; Chen, Y.; Wang, Y. A Detection Method for Transmission Line Tower Deformations Based on Binding Bars. Sci. Technol. Eng. 2018, 18, 257–262. [Google Scholar]
- Wang, Y.; Han, J.; Zhao, Q.; Wang, Y. The method of Power Transmission Tower Inclination Detection Based on UAV lmage. Comput. Simul. 2017, 34, 426–431. [Google Scholar]
- Edelsbrunner, H.; Mücke, E.P. Three-dimensional alpha shapes. ACM Trans. Graph. 1994, 13, 43–72. [Google Scholar] [CrossRef]
- Edelsbrunner, H. Alpha shapes—A survey. Tessellations Sci. 2010, 27, 1–25. [Google Scholar]
- Santos, R.C.D.; Galo, M.; Carrilho, A. Extraction of Building Roof Boundaries from LiDAR Data Using an Adaptive Alpha-Shape Algorithm. IEEE Geosci. Remote Sens. Lett. 2019, 16, 1289–1293. [Google Scholar] [CrossRef]
- Wang, R.; Hu, Y.; Wu, H.; Wang, J. Automatic extraction of building boundaries using aerial LiDAR data. J. Appl. Remote Sens. 2016, 10, 016022. [Google Scholar] [CrossRef]


| The Region with the Highest Proportion | Global Deformation Assessment | |
|---|---|---|
| 0–0.5 | The safety area | Low risk and safe |
| 0–0.5 | Low risk area | Low risk and to be detected |
| 0–0.5 | High risk area | Low risk and need required |
| 0.5–1 | The safety area | High risk and safe |
| 0.5–1 | Low risk area | High risk and to be detected |
| 0.5–1 | High risk area | High risk and need required |
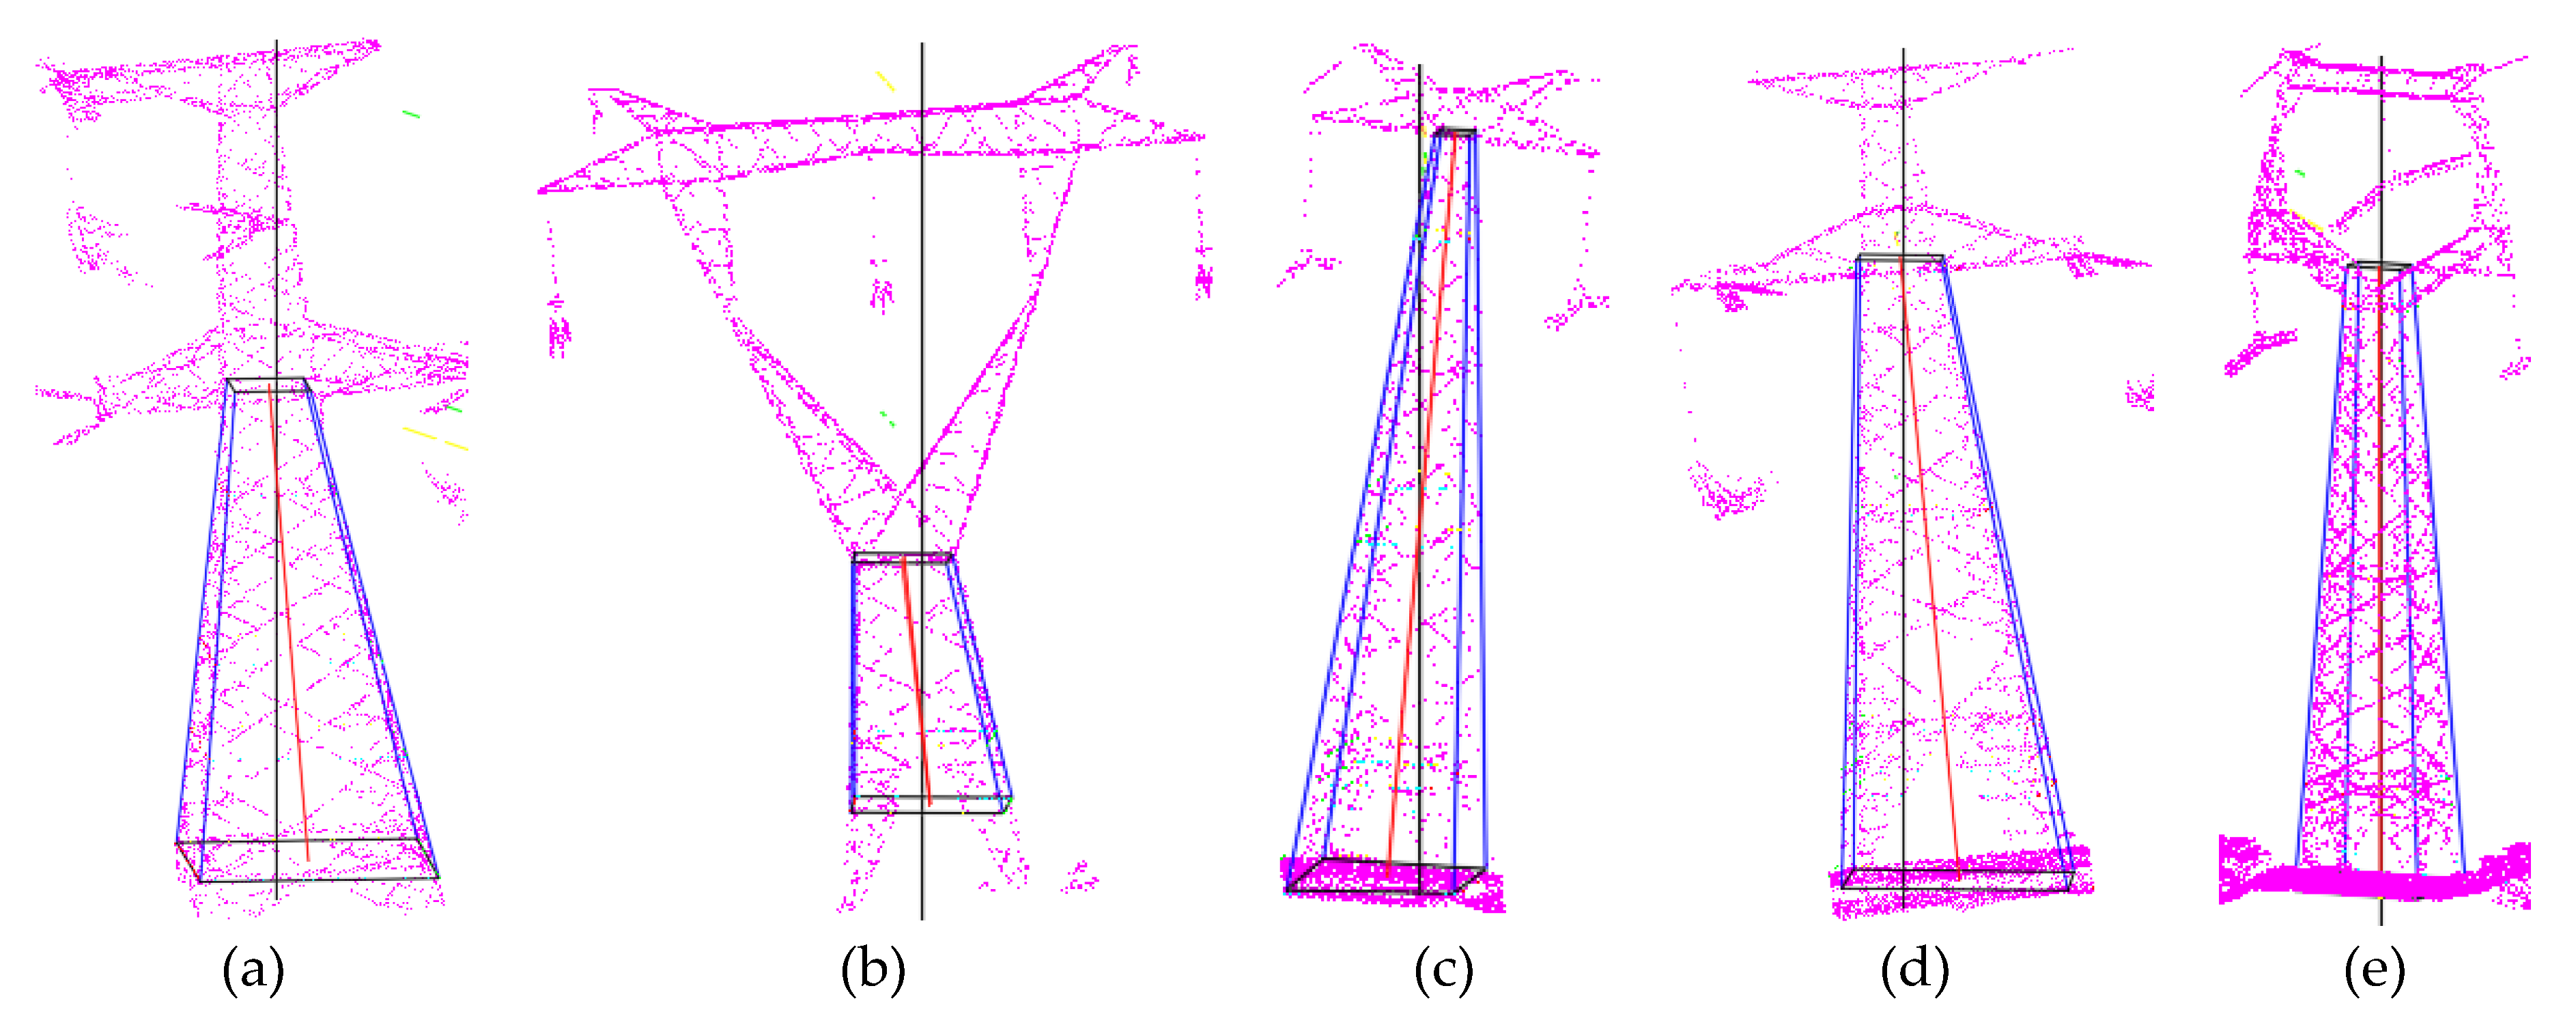
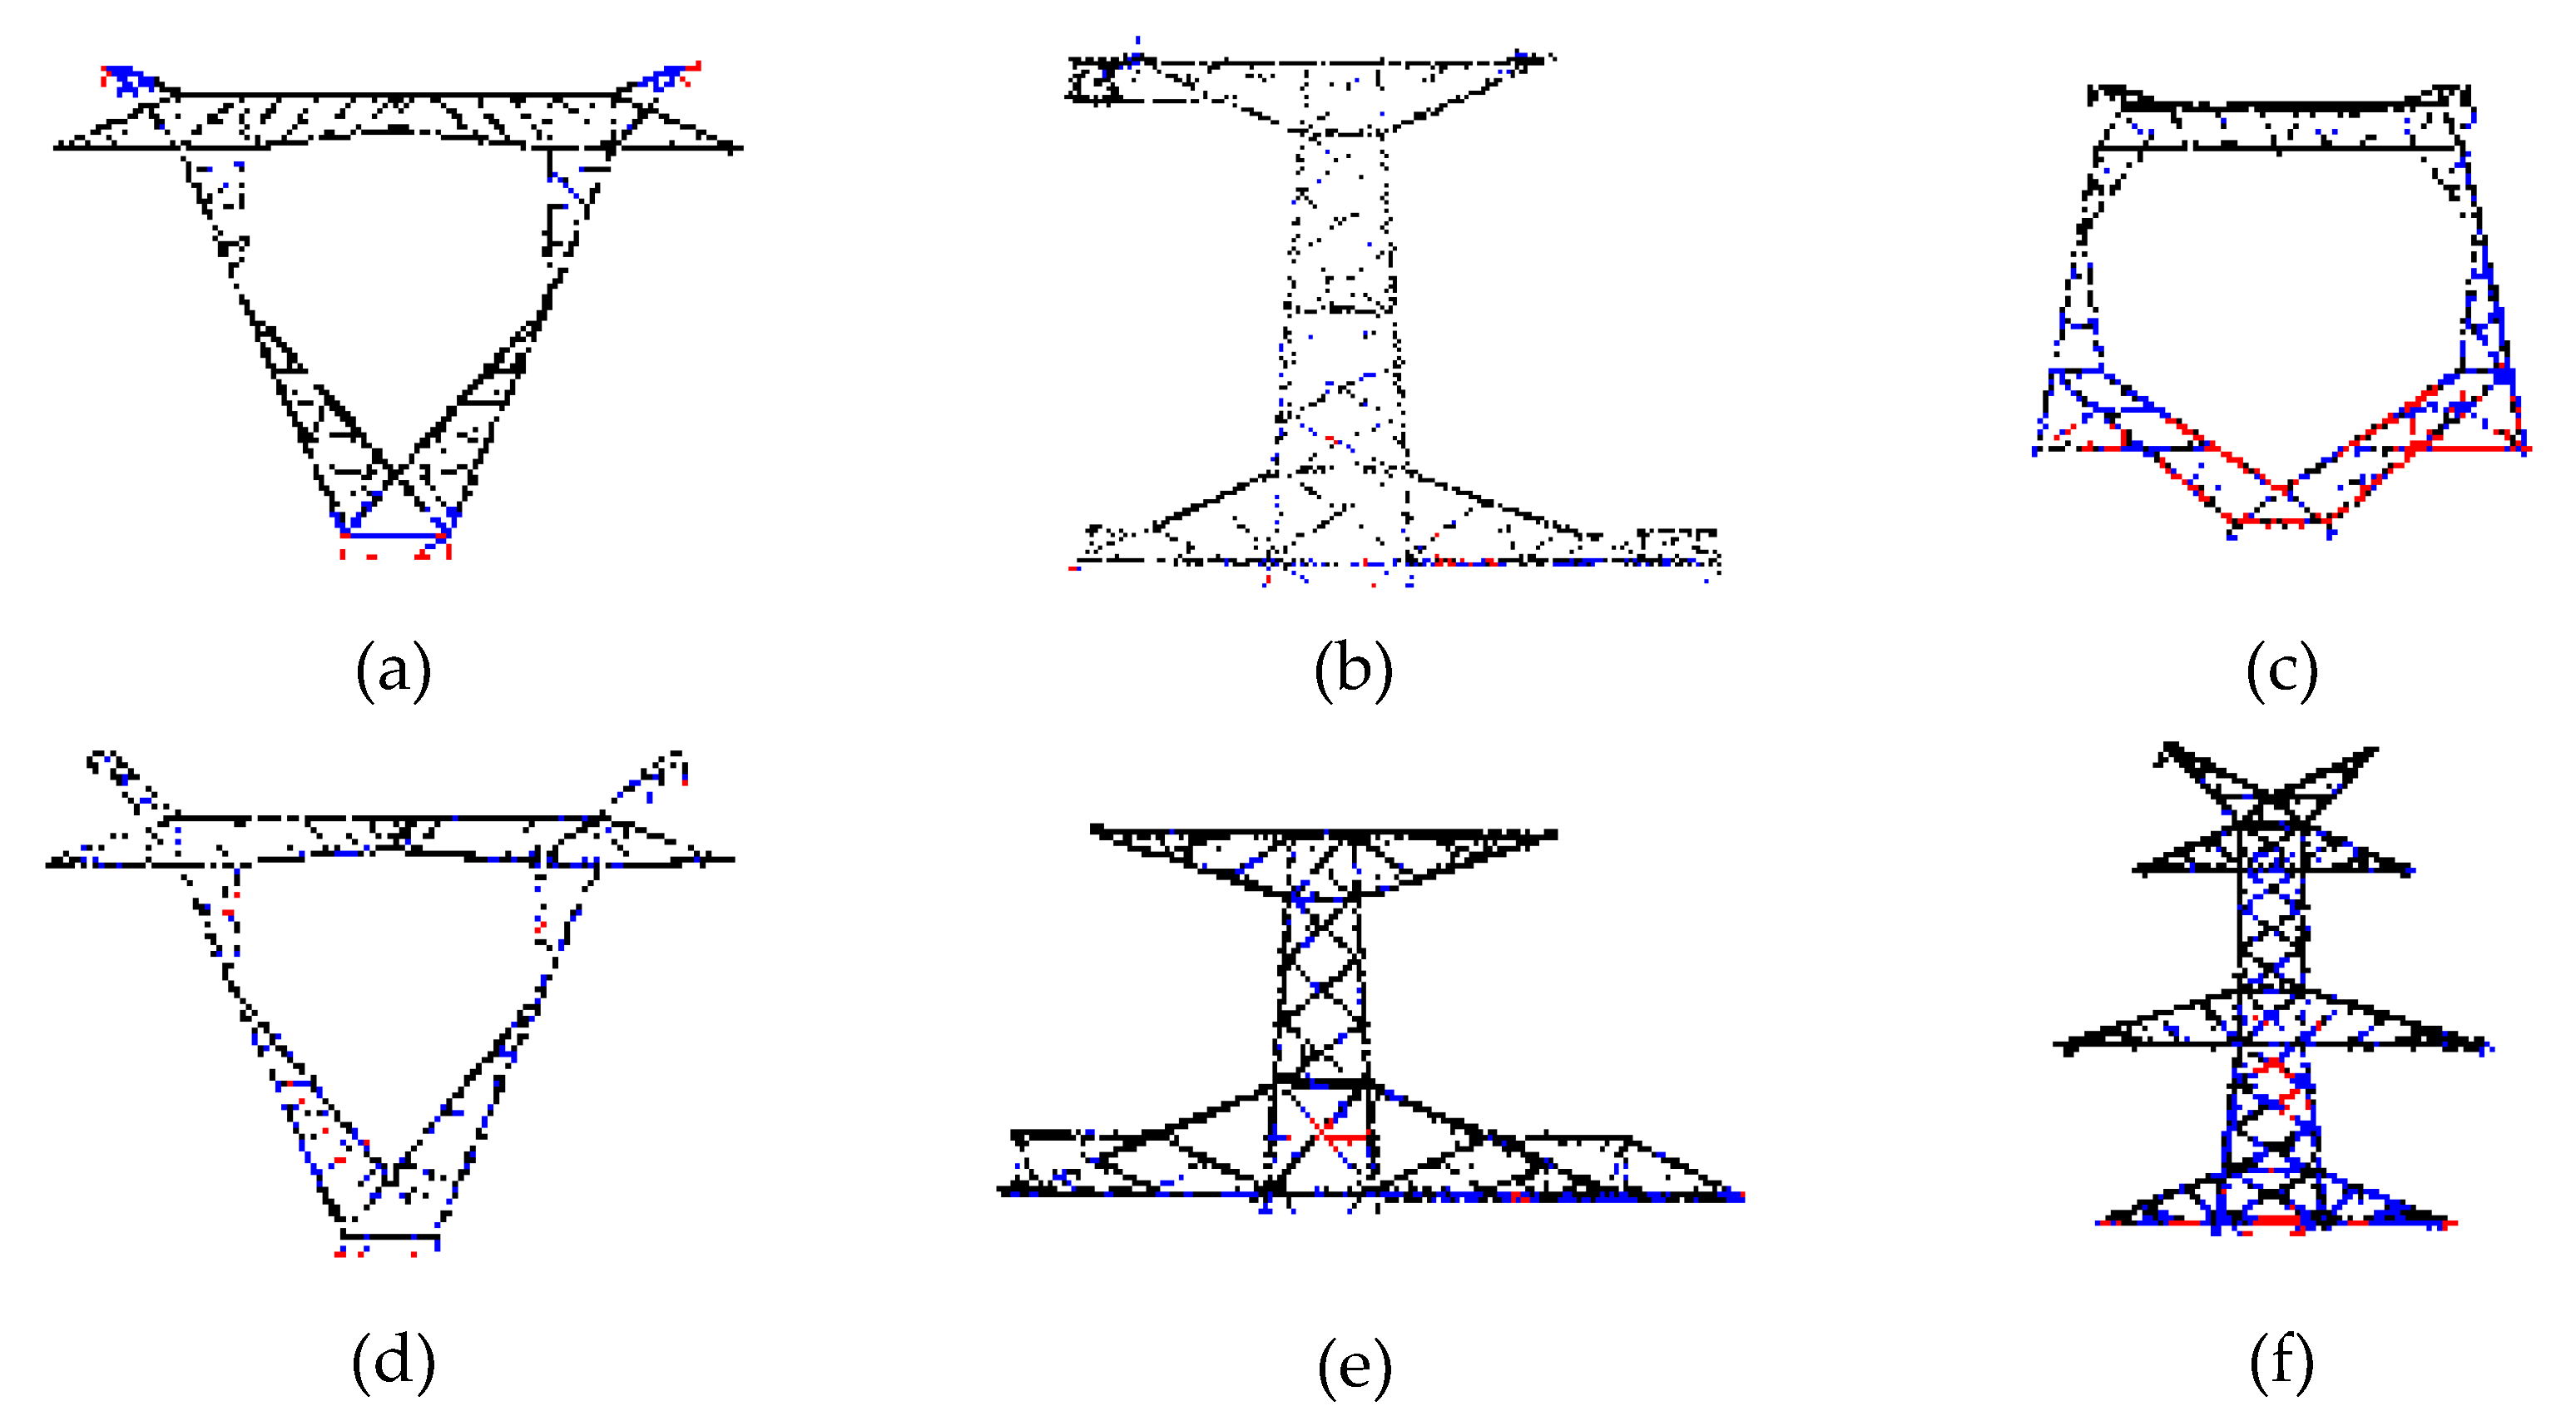
| ID | Number | Point Cloud Front View (Size Inconsistency) |
|---|---|---|
| 1 | 32 |  |
| 2 | 26 |  |
| 3 | 25 |  |
| 4 | 36 |  |
| 5 | 19 |  |
| 6 | 19 |  |
| Angle | X Axis | Y Axis | X First and then Y | X Axis | Y Axis | X First and then Y |
|---|---|---|---|---|---|---|
| Rotation Angle | 5° | 5° | 5° | 10° | 10° | 10° |
| Tilt Angle | 5° | 5° | ° | 10° | 10° |
| Tower Type | No Tilt | X-5° | Y-5° | XY-5° | X-10° | Y-10° | XY-10° | Relative Error |
|---|---|---|---|---|---|---|---|---|
| 1 | 0.159 | 5.577 | 5.209 | 6.838 | 11.119 | 10.938 | 12.964 | 0.630 |
| 1 | 0.135 | 5.77 | 3.821 | 6.684 | 10.441 | 9.634 | 15.83 | 0.710 |
| 1 | 0.258 | 5.27 | 5.116 | 7.393 | 9.929 | 10.349 | 15.995 | 0.463 |
| 2 | 0.282 | 5.882 | 4.91 | 7.324 | 11.036 | 11.056 | 13.748 | 0.570 |
| 2 | 0.321 | 4.854 | 3.78 | 7.569 | 10.109 | 10.377 | 14.446 | 0.425 |
| 2 | 1.193 | 5.282 | 5.253 | 6.769 | 10.888 | 8.507 | 12.931 | 0.803 |
| 3 | 0.04 | 4.298 | 4.847 | 7.241 | 12.543 | 10.919 | 13.627 | 0.720 |
| 3 | 0.915 | 7.051 | 4.922 | 9.981 | 10.535 | 11.356 | 13.586 | 1.200 |
| 3 | 0.229 | 5.202 | 4.77 | 7.399 | 11.079 | 9.116 | 15.265 | 0.582 |
| 4 | 0.235 | 5.498 | 5.228 | 6.348 | 10.054 | 10.453 | 12.706 | 0.518 |
| 4 | 0.181 | 4.793 | 4.852 | 8.125 | 10.55 | 9.326 | 12.784 | 0.596 |
| 4 | 0.219 | 4.695 | 4.309 | 7.277 | 10.16 | 10.372 | 14.444 | 0.322 |
| 5 | 0.065 | 5.172 | 4.11 | 7.515 | 10.879 | 10.457 | 12.959 | 0.584 |
| 5 | 0.183 | 4.963 | 4.496 | 7.918 | 8.675 | 8.798 | 13.653 | 0.655 |
| 5 | 0.272 | 4.832 | 5.591 | 7.432 | 10.587 | 9.856 | 11.814 | 0.636 |
| 6 | 0.136 | 5.535 | 5.007 | 7.975 | 10.712 | 12.154 | 14.786 | 0.728 |
| 6 | 0.283 | 6.342 | 4.234 | 8.229 | 11.111 | 10.367 | 15.406 | 0.899 |
| 6 | 0.081 | 4.629 | 4.539 | 6.842 | 11.307 | 10.382 | 12.319 | 0.665 |
| Relative error | 0.288 | 0.529 | 0.434 | 0.629 | 0.806 | 0.775 | 1.092 | 0.650 |
| Tilt | 0° | 1° | 2° | 3° | Mean |
|---|---|---|---|---|---|
| X axis | 0.212 | 0.255 | 0.263 | 0.368 | 0.275 |
| Y axis | 0.212 | 0.287 | 0.301 | 0.392 | 0.298 |
| X first and then Y | 0.212 | 0.368 | 0.347 | 0.441 | 0.342 |
| Mean | 0.212 | 0.303 | 0.304 | 0.400 | 0.304 |
| Deformation Evaluation | Low Risk SAFE | Low Risk to Be Detected | Low Risk Need Repair | High Risk Safe | High Risk to Be Detected | High Risk Need Repair |
|---|---|---|---|---|---|---|
| Number | 152 | 4 | 0 | 1 | 0 | 0 |
Publisher’s Note: MDPI stays neutral with regard to jurisdictional claims in published maps and institutional affiliations. |
© 2022 by the authors. Licensee MDPI, Basel, Switzerland. This article is an open access article distributed under the terms and conditions of the Creative Commons Attribution (CC BY) license (https://creativecommons.org/licenses/by/4.0/).
Share and Cite
Lu, Z.; Gong, H.; Jin, Q.; Hu, Q.; Wang, S. A Transmission Tower Tilt State Assessment Approach Based on Dense Point Cloud from UAV-Based LiDAR. Remote Sens. 2022, 14, 408. https://doi.org/10.3390/rs14020408
Lu Z, Gong H, Jin Q, Hu Q, Wang S. A Transmission Tower Tilt State Assessment Approach Based on Dense Point Cloud from UAV-Based LiDAR. Remote Sensing. 2022; 14(2):408. https://doi.org/10.3390/rs14020408
Chicago/Turabian StyleLu, Zhumao, Hao Gong, Qiuheng Jin, Qingwu Hu, and Shaohua Wang. 2022. "A Transmission Tower Tilt State Assessment Approach Based on Dense Point Cloud from UAV-Based LiDAR" Remote Sensing 14, no. 2: 408. https://doi.org/10.3390/rs14020408