Article

Comparison of Classical Methods and Mask R-CNN for Automatic Tree Detection and Mapping Using UAV Imagery

1
College of Forestry, Fujian Agriculture and Forestry University, Fuzhou 350002, China
2
University Key Lab for Geomatics Technology and Optimized Resources Utilization in Fujian Province, Fuzhou 350002, China
3
Department of Forestry and Environmental Conservation, Clemson University, Clemson, SC 29634, USA
4
School of Biological Science and Biotechnology, Minnan Normal University, Zhangzhou 363000, China
*
Author to whom correspondence should be addressed.
These authors contributed equally to this work.
Remote Sens. 2022, 14(2), 295; https://doi.org/10.3390/rs14020295
Submission received: 8 December 2021 / Revised: 25 December 2021 / Accepted: 6 January 2022 / Published: 11 January 2022

Abstract

:
Detecting and mapping individual trees accurately and automatically from remote sensing images is of great significance for precision forest management. Many algorithms, including classical methods and deep learning techniques, have been developed and applied for tree crown detection from remote sensing images. However, few studies have evaluated the accuracy of different individual tree detection (ITD) algorithms and their data and processing requirements. This study explored the accuracy of ITD using local maxima (LM) algorithm, marker-controlled watershed segmentation (MCWS), and Mask Region-based Convolutional Neural Networks (Mask R-CNN) in a young plantation forest with different test images. Manually delineated tree crowns from UAV imagery were used for accuracy assessment of the three methods, followed by an evaluation of the data processing and application requirements for three methods to detect individual trees. Overall, Mask R-CNN can best use the information in multi-band input images for detecting individual trees. The results showed that the Mask R-CNN model with the multi-band combination produced higher accuracy than the model with a single-band image, and the RGB band combination achieved the highest accuracy for ITD (F1 score = 94.68%). Moreover, the Mask R-CNN models with multi-band images are capable of providing higher accuracies for ITD than the LM and MCWS algorithms. The LM algorithm and MCWS algorithm also achieved promising accuracies for ITD when the canopy height model (CHM) was used as the test image (F1 score = 87.86% for LM algorithm, F1 score = 85.92% for MCWS algorithm). The LM and MCWS algorithms are easy to use and lower computer computational requirements, but they are unable to identify tree species and are limited by algorithm parameters, which need to be adjusted for each classification. It is highlighted that the application of deep learning with its end-to-end-learning approach is very efficient and capable of deriving the information from multi-layer images, but an additional training set is needed for model training, robust computer resources are required, and a large number of accurate training samples are necessary. This study provides valuable information for forestry practitioners to select an optimal approach for detecting individual trees.

1. Introduction

The management of young forests has long-term impacts on forest establishment [1]. In the context of extensive tree planting programs, which have been implemented in many countries to offset greenhouse gas emissions, it is critical to develop new methodologies that can provide updated and accurate tree information for supporting forest management of young forests [2]. Detecting and mapping individual tree crowns helps to evaluate forest growing status, regeneration, and density. At the same time, the task of tree detection and mapping is labor-intensive, time-consuming, and costly when using traditional field survey methods [3,4,5]. Therefore, accurate and efficient survey techniques are necessary for forest management. Previous studies have reported that different techniques were successfully applied to detect individual trees, including the classical methods and deep learning techniques [6,7]. However, to our knowledge, there are no studies that have evaluated how to select an appropriate algorithm for individual tree detection (ITD). Therefore, it is essential to provide information on the accuracy, data processing, and application requirements for detecting individual trees using different methods. This information can help forest managers select the most suitable method to detect individual trees.
Remote sensing tools and data have been successfully applied in forestry (e.g., classification, tree crown detection, and mapping), which improves the efficiency of stand structure, forest damage, and timber volume evaluation [8]. In particular, Unmanned Aerial Vehicles (UAVs) have been extensively used in forestry over the last few years because of their ability to obtain high temporal resolution imagery from low altitude flights at a relatively low cost with near real-time data processing and analysis possible [2,9]. Tree crowns of young forest can be identified and detected accurately by leveraging UAV image capture techniques [10,11]. Several studies have reported tree mapping and extraction using UAV imagery. For example, UAV imagery can be processed using structure-from-motion techniques to generate point cloud data for three-dimensional reconstruction for detecting tree height [11], extent, and location [2,10,12]. Pearse et al. detected and mapped conifer seedlings of Pinus radiata D. Don (P. radiata) on multiple sites using UAV imagery [2]. UAV-based image point clouds were used to estimate individual conifer seedling height by Castilla et al., achieving a root mean square error of 24 cm with a R2 of 0.63 [13].
In the past decade, classical detection methods, such as local maxima (LM) algorithm [5,14], marker-controlled watershed segmentation (MCWS) [15], template matching [16], region-growing [17], edge detection [18], have been applied to identify individual trees. Among them, LM and MCWS algorithms are the most common detection methods. The LM algorithm is primarily based on treetops that have the brightest pixels in optical UAV imagery and the highest values in the canopy height model (CHM), which can be identified using a moving window to filter the image. The LM algorithm has been successfully applied on Eucalyptus sp. stand [19], ponderosa pine (Pinus ponderosa var. scopulorum Dougl. Ex Laws.) [20], Scots Pine stand [21], and mixed forest with multiple tree species [5,22]. The MCWS technique, an extension of the valley-following algorithm, was developed for detecting individual tree crowns. The foundational basis of MCWS is that the treetops were inverted as the lowest elevations, and tree crowns can be regarded as a water collection area around each treetop. The boundary of each tree crown is formed where the surface of the watershed is flooded [23]. The application of MCWS algorithm to detect tree crowns has been reported by many studies [24,25]. For example, the detection and delineation of individual urban trees was demonstrated by Wallace et al. [15]. Yin and Wang derived mangrove crown boundaries using MCWS [14]. These classical methods mainly rely on a single-band image as the input image. For example, Xu et al. used the green band, the first principal component of eight spectral bands, and the ratio of green band to red band as the input image for ITD, respectively [26], and the CHM was used by Mohan et al. [5].
Deep learning methods have flourished in recent years, which shows an unprecedented ability to address a large spectrum of computer vision problems [27,28]. Convolutional Neural Networks (CNNs) have been regarded as the most widely used deep learning approach, especially for vegetation remote sensing applications [7,29,30]. The latest advance of CNNs is Mask Region-based Convolutional Neural Networks (Mask R-CNN), which is developed to achieve object instantiation in images [31]. Compared to the predecessor-Faster R-CNN, Mask R-CNN has the ability to execute the classification and the segmentation parts independently [31]. It can predict an exact mask within the bounding box. Therefore, Mask R-CNN has the potential to become one of the most widely used algorithms for tree crown detection and delineation in the future. For instance, Mask R-CNN approach was used to detect and segment coconut trees, achieving an overall 91% mean average precision [32]. Combined object-based image analysis, Mask R-CNN was used to segment scattered vegetation in drylands using high-resolution optical images [33]. Relying on Mask R-CNN, Braga et al. reported the promising results for tree crowns delineation in tropical forests from high-resolution satellite images—a total of 59,062 tree crowns delineated (F1 score = 0.86) [34]. In addition, Mask R-CNN is capable of detecting other tree attributes simultaneously. For example, tree crown and height were detected and delineated automatically and simultaneously by Hao et al. in a young forest plantation [35].
The LM algorithm, MCWS, and Mask R-CNN are proven methods for tree detecting and mapping. However, based on existing literature, few studies have reported comparing the performance of these algorithms for tree crown detection. This study evaluated these algorithms in a newly forested plantation and assessed the accuracy, convenience (potential time in data processing) of these algorithms for detecting individual tree crowns. The aim of this research is to compare the accuracies of different algorithms and evaluate the data and processing requirements of different algorithms for detecting individual trees.

2. Materials and Methods

2.1. Study Site

The study site comprised a 4-ha plantation forest located in the Pushang national forest farm, Shunchang County, Fujian Province, China (Figure 1). The plantation forest is situated in a mountain range with an elevation between 174 m and 226 m, and an average slope of 27.8°. The area is mainly covered by several types of Chinese fir, which was planted in 2018, with some replanting in 2019 due to tree mortality. The Chinese fir has a rounded tree crown, a height between 1 m and 4 m, and a north-south crown width between 0.7 m and 2.8 m in the study site. The tree spacing is 2.0 m × 1.5 m, with 5 to 7 columns of Chinese fir in each group. A single row of broad-leaved trees was used to isolate each Chinese fir type.

2.2. Data Collection

2.2.1. Image Acquisition and Preprocessing

A DJI Phantom4-Multispectral (https://www.dji.com/p4-multispectral, accessed on 1 October 2021) was used to obtain site UAV imagery in December 2019. The integrated camera has six imaging sensors (1600 × 1300 pixels), including five multispectral sensors (blue (450 ± 16 nm), green (560 ± 16 nm), red (650 ± 16 nm), red edge (730 ± 16 nm), near infrared band (NIR) (840 ± 26 nm) and one RGB sensor [36]. The flight parameters included a flight altitude of 30 m above ground height with an 85% forward overlap and 80% side-lap. During the flight, the real-time kinematic (RTK) positioning and navigation system on the UAV was linked to the D-RTK 2 Mobile GPS station to derive high-precision UAV waypoint positions. An XY precision of 2 cm and Z precision of 3 cm was achieved. A total of 5616 images were collected for the study site. Next, the DJI Terra software was used for generating the digital surface model (DSM) and ortho-mosaic images. The spatial resolution of generated images (0.76 cm for ortho-mosaics, 1.47 cm for DSM) were resampled to 2.0 cm pixel−1. The DJI Terra software does not generate a separate point cloud, so it is not possible to compute the CHM directly. Therefore, non-forest DSM locations were identified, and the altitude of the corresponding locations was extracted to create the digital terrain model (DTM) using interpolation. A total of 5518 non-forest locations were randomly selected, and the CHM with 2.0 cm of spatial resolution was created by subtracting the DTM from the DSM [37].

2.2.2. Tree Crown Delineation

The aim of the tree crown delineation was to assess the accuracy of different algorithms. A previous study reported that it was possible to accurately delineate tree crowns manually [35]. In this study, tree crowns were manually delineated using visual interpretation using the GIS interface by a person with extensive forestry and remote sensing expertise and double checked by another expert in order to rule out misinterpretation [38]. A total of 1818 Chinese fir were manually delineated from the UAV imagery in the study site and divided into two regions (Figure 1). Region 1 (1019 Chinese fir) was used to train the Mask R-CNN model, region 2 (797 Chinese fir) was used to serve as baseline data for comparison with automated detection algorithms.

2.3. Individual Tree Crown Detection (ITD)

In this study, ITD was derived using the LM algorithm, MCWS algorithm, and Mask R-CNN, respectively. The single band of blue, green, red, red edge, NIR, and CHM was selected as the test image for three algorithms, respectively. Additionally, the different band combinations (RGB band combination and Multi band) and the visible-spectrum RGB imagery from the RGB sensor were also used as the input image for Mask R-CNN model training. Thus, a total of six test images for LM and MCWS algorithms, and nine test images for Mask R-CNN were used to detect individual trees (Table 1).

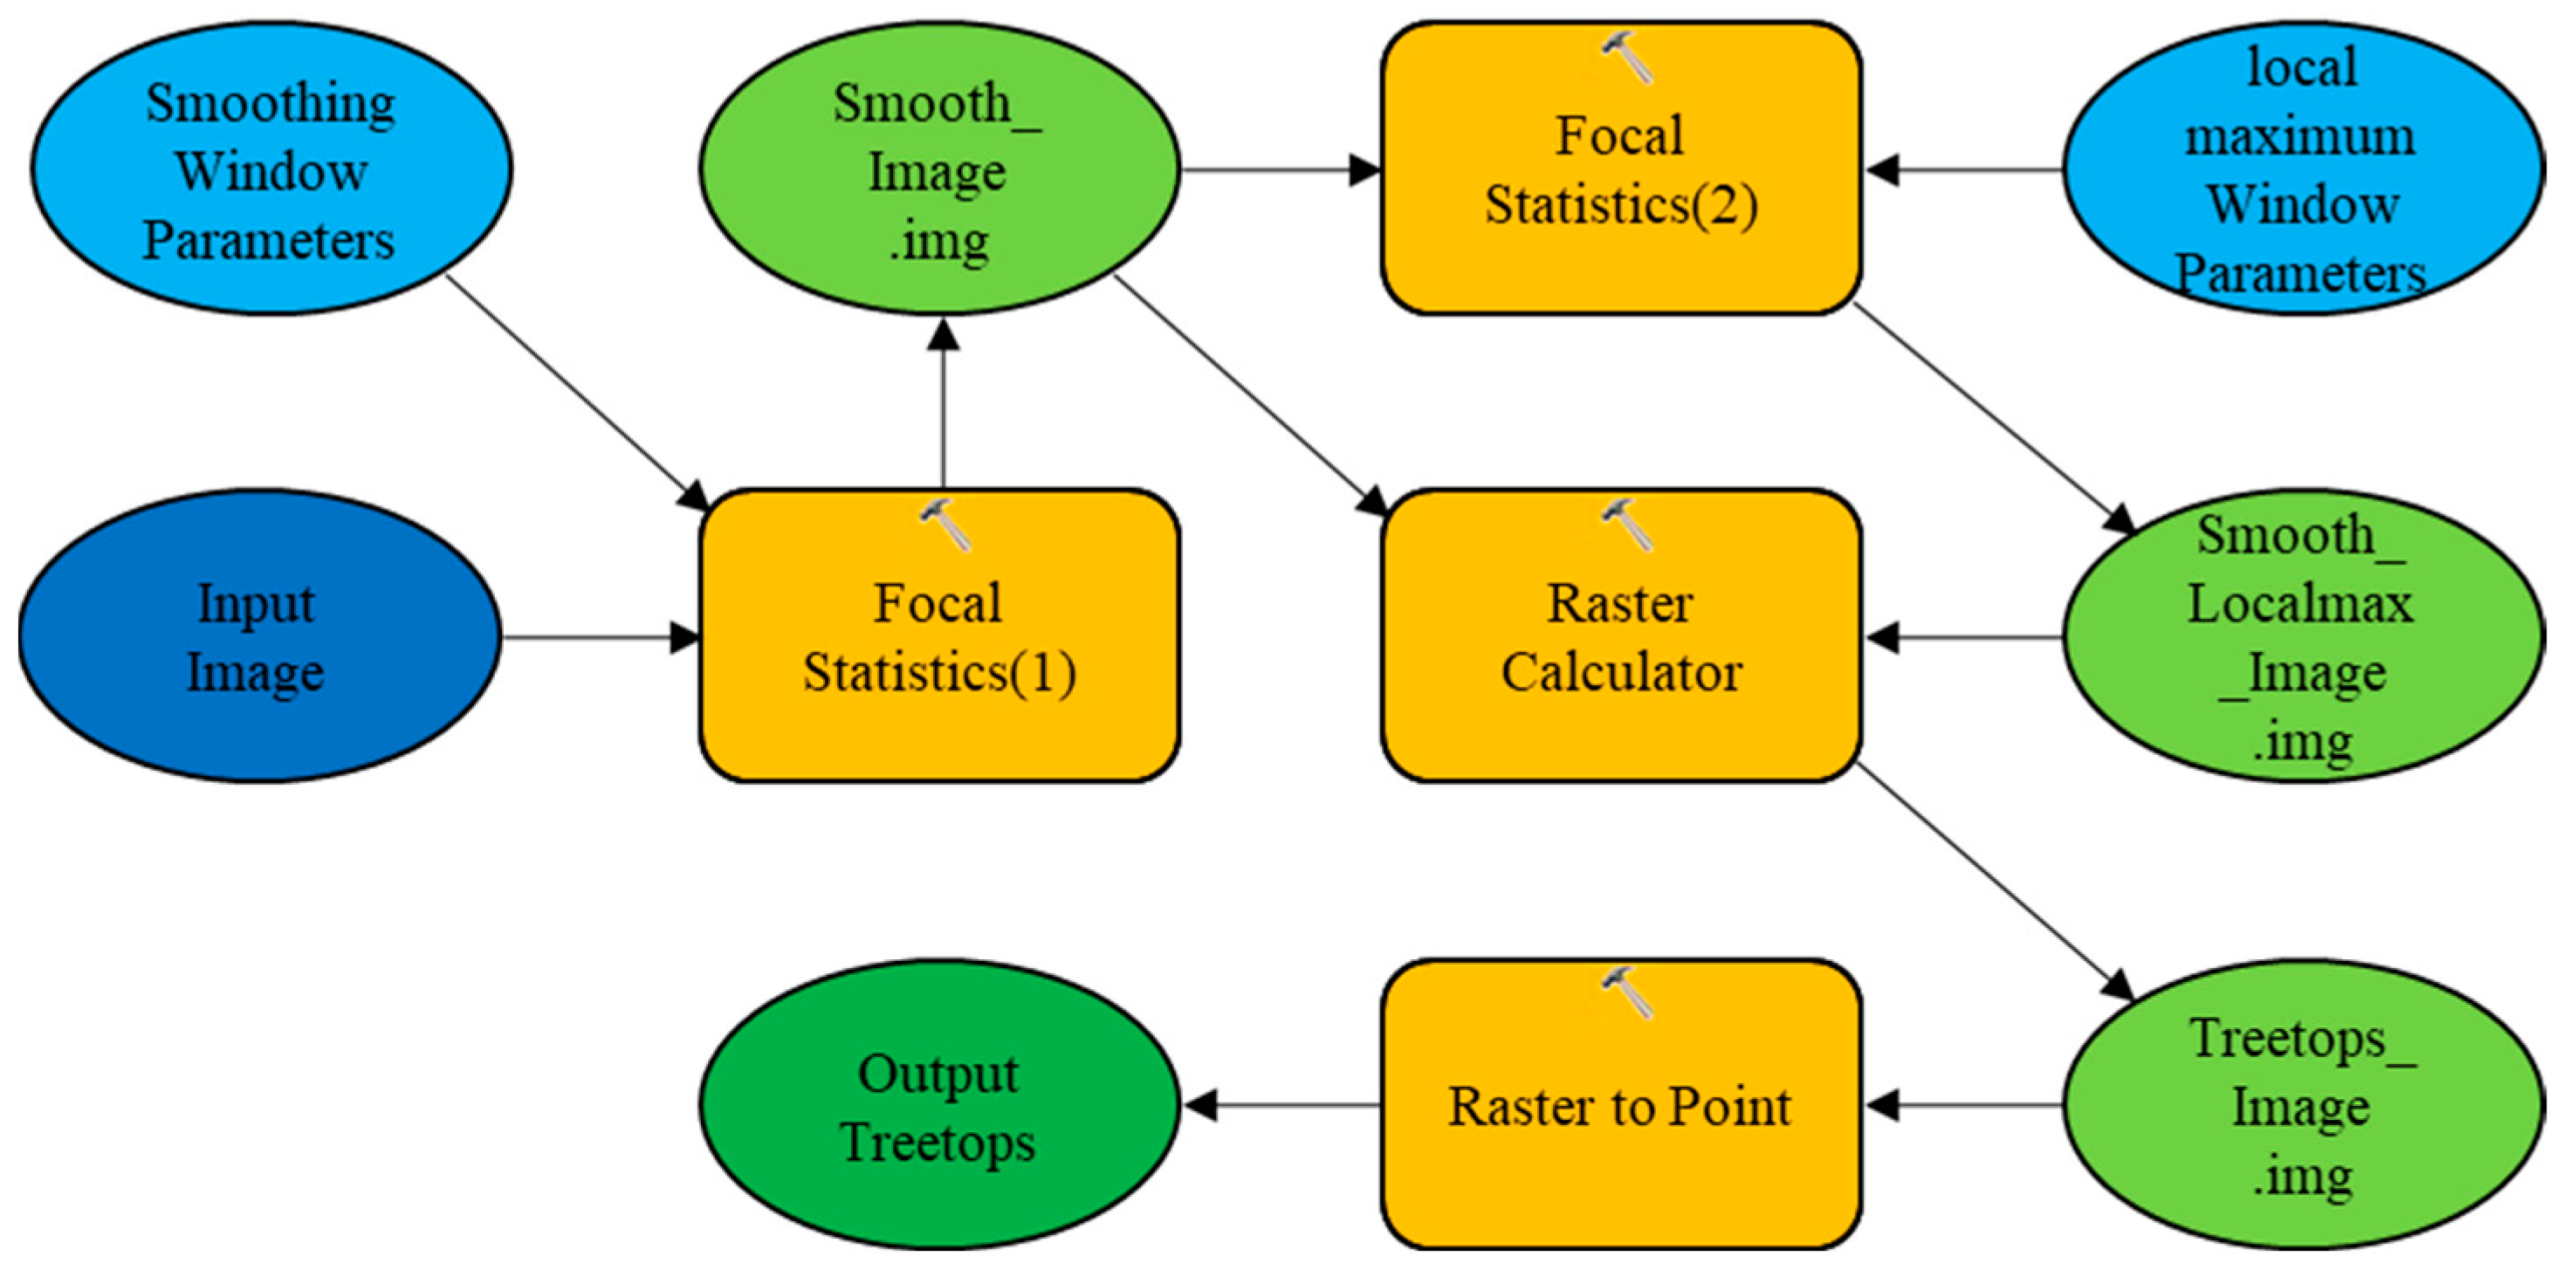
2.3.1. Local Maxima (LM) Algorithm

Figure 2 shows a workflow example for ITD using the LM algorithm. Based on the characteristics of Chinese fir’s crown shape, pixels corresponding to each tree crown have higher height values or spectral reflectance than the surrounding area (a mountainous structure) in the image [5]. Therefore, a circular smoothing window with a radius of 10 cm (5 pixels) was used to first smooth the image. Smoothing can help to reduce the false positive detections since the pixels of some individual crowns are not homogenous in the high spatial resolution imagery [39]. Next, the smoothed image was used to generate the local maximum image using the focal statistics tool with a radius of 50 cm (25 pixels) fixed circular window size. Then, the possible treetops were identified by subtracting the smoothed image from the local maximum image, where they were identified as the 0 values. Finally, possible treetops with height lower than 0.3 m were filtered out in order to remove outliers [37]. All the processing used the same for six test images and was implemented in ArcGIS 10.8 (ESRI, Redlands, CA, USA). Additionally, an automated detecting model for ITD using the LM algorithm was developed with ArcGIS in this study (Appendix A, Figure A1 and Figure A2).

2.3.2. Marker-Controlled Watershed Segmentation (MCWS) Algorithm

The MCWS algorithm, which is based on the concept of flow direction and watershed boundaries, was used to delineate Chinese fir crown extents in this study (Figure 3) [14,23]. First, the image was inverted to make the treetop locations in the image appear as local minima where each tree crown becomes a water basin. Next, a circular smoothing window with a radius of 10 cm (5 pixels) was used to smooth the inverse image, in order to remove outliers. After inversion, the smoothed image was used to generate the flow directions, and the local minimum image was extracted from the smoothed image with a fixed circular window size of 50 cm (25 pixels) [37]. Then, tree crown profiles were delineated based on the edge of the water in each pit using the watershed tool in ArcGIS 10.8, and the results were converted into polygon representation in shapefile format. Finally, the tree crown polygon was generated by intersecting the image of tree crown profiles with >0.3 m from the CHM, in order to remove the ground region [40]. All the processing used the same for six test images and was implemented in ArcGIS 10.8. Additionally, an automated detecting model for ITD by MCWS algorithm was developed based on ArcGIS in this study (Appendix A, Figure A3 and Figure A4).

2.3.3. Training and Application of Mask R-CNN Model

The Mask R-CNN workflow for ITD is presented in Figure 4.
(1)
Input Image Preparation
Mask R-CNN allows different combined input predictors as the input image. In order to test the optimal input image for Chinese fir crown detection, nine input images were used for Mask R-CNN model training (Table 1).
(2)
Training Dataset Preparation and Model Training
Manually delineated tree crowns in region 1 (1019) were used as a training and validation sets and manually delineated tree crowns in region 2 (797) were used as a test set for this study. Next, the training and validation set, and each input image were used to generate the training dataset. Each input image was split into 256 × 256-pixel image tiles with a 50% overlap of the stride shift for processing [41] to match the input constraints for the Mask R-CNN architecture and to ensure all trees could be captured in at least one image tile [2]. In addition, each image was rotated 90°, 180°, and 270° for the data augmentation process because the Mask R-CNN model needs an extensive training set [34]. In summary, nine training datasets were used in this study, and each training dataset contained 3384 image chips and 26,584 features.
Finally, the Mask R-CNN model was trained using each training dataset. The pre-training ResNet-50 architecture framework was used to transfer learning. In order to prevent overfitting when training the model, the training and validation set was split into 90% for model training, and 10% was retained for validation. Moreover, the training would stop during the training phase if the validation loss did not improve for five epochs [42]. Except for the different input images, all the same processing procedures were used for the nine Mask R-CNN models that were implemented in ArcGIS API for Python. A laptop with an AMD Ryzen 9 CPU, 16 GB RAM memory, and a Nvidia GeForce RTX 2060 GPU was used for model training.
(3)
Model Application
A total of nine models were applied to predict ITD in the corresponding input image. The output result of each Mask R-CNN model was a vector file of tree crowns. Each tree crown contains a confidence value between 0–1. This value indicates the likelihood of confidence in the existence of trees. In this study, tree crowns with the confidence score >0.2 were used. For overlapping tree crowns with a confidence score >0.2 [42], the higher value was kept, and the lower one was removed using a non-maximum suppression algorithm [43].

2.4. Accuracy Evaluation

Model performance was assessed using recall, precision, and F1 score (Equations (1)–(3)) [44]. The recall is the value of correctly identified trees divided by all of the trees delineated using the independent visual assessment. The precision is the value of correctly identified trees divided by all predicted trees from the algorithm. The F1 score is the overall accuracy considering recall and precision. The presented MCWS algorithm and Mask R-CNN have the ability to perform tree crown detection and tree crown delineation. Therefore, the intersection over union (IoU) was used to evaluate the accuracy of the tree-crown polygons (Equation (4)). IoU is the ratio of intersection area and union area of manual crown delineation and predicted crown delineation [2,34,42].
Recall ( R }   = TP TP   +   FN × 100 %
Precision ( P ) = TP TP   +   FP × 100 %
F 1   score   = 2 PR P   +   R × 100 %  
where TP represents the correctly identified tree, FN represents the omitted trees, FP represents the false positive detections (e.g., broad-leaved trees or weeds).
IoU   = area ( B actual B predicted ) area ( B actual B predicted ) × 100 %  
where Bactual is the crown polygons from the test set, Bpredicted is predicted crown polygons from the MCWS algorithm or Mask R-CNN model. For both algorithms, IoU was considered correctly delineated when it was higher than 50% [42,45]. Additionally, the confidence score was higher than 0.2 for Mask R-CNN. The intersection operation and the union operation represent the common area, and the combined area of Bactual and Bpredicted, respectively.

3. Results

The results of individual tree detection using the LM algorithm, MCWS algorithm, and Mask R-CNN is presented in Table 2. For the LM algorithm, 797 manual delineated tree crown polygons in region 2 were used as reference, a single point within a tree-crown polygon was regarded as the correctly identified treetop. More than one point within a tree-crown polygon and points outside tree-crown polygons were considered to be a false detection. A tree-crown polygon with no point was regarded as not being detectable (Figure 5). It can be seen that the highest accuracy was achieved when the LM algorithm used the CHM (F1 score = 87.86%), followed by red edge image (F1 score = 86.85%) and NIR image (F1 score = 86.58%). The lowest accuracy for LM algorithm occurred when using a green image (F1 score = 71.95%) or red image (F1 score = 66.67%).
The results using different images as the test image for the MCWS algorithm to detect individual trees is shown in Table 2. It can be seen that the total number of detected trees ranged from 1007 to 1543 using different test images in region 2, while the correctly identified Chinese fir ranged from 351 to 775 with IoU > 50%. In comparison, the detection of ITD using CHM as the test image for Chinese fir achieved the highest accuracy (F1 score = 85.92%), and the example of ITD using CHM in this study is shown in Figure 6. Followed by red edge image (F1 score = 81.35%) and NIR image (F1 score = 79.65%). The lowest accuracy of ITD was achieved using the single red band image (F1 score = 30.00%).
The manual delineated Chinese fir in region 2 was used to evaluate the performance of nine Mask R-CNN models. The results of ITD from the Mask R-CNN models are shown in Table 2. For Mask R-CNN, when comparing the input image by band combination and the single band, the former achieved higher accuracy for ITD. The higher F1 score was achieved when the model used RGB band combination (F1 score = 94.68%), Multi band (F1 score = 94.07%), and visible-spectrum RGB imagery (F1 score = 93.60%) as the input image. Followed by the model with red edge image (F1 score = 90.90%), NIR image (F1 score = 89.16%), and CHM (F1 score = 84.72%). For the single-band image, the model with red edge image produced the highest accuracy for ITD, and the lowest accuracy was achieved by the model with green image (F1 score = 69.79%) and red image (F1 score = 65.55%).

4. Discussion

4.1. Classical Detection Methods

Classical methods gained popularity due to the ease of data processing, especially considering the lower computer processing requirements for data processing. For the LM algorithm, the suitable window size is a critical factor affecting tree crown detection accuracy [46]. In a forest or plantation with a relatively consistent crown size, the LM algorithm with fixed window size can achieve good accuracy for ITD. Fawcett et al. reported high mapping accuracy of 98.2% for palms from CHM using the LM algorithm with a fixed window size of 9 m [47]. In a forest with large differences in tree height and crown size, the detection accuracy of the LM algorithm with fixed window size would likely decrease significantly [48,49]. Previous studies demonstrated that a tree would be divided into multiple trees when the window size is too small [50,51]. When the window size is set too large, the existent trees could miss detection because of the window containing several trees [17]. To address this issue, the LM algorithm with variable window size was developed, and has been used successfully for tree crown detection [52]. The variable window size is typically determined by a relationship between crown radius to height [14,53], the local slope break [17], or an average semivariance range [51]. Xu et al. proposed that a revised LM algorithm was used to find the crown center seeds by searching for local maximal values in the transects along row and column directions of an image and applied this algorithm on four high spatial-resolution images, which achieved overall accuracies between 85% and 91% [26]. For the MCWS algorithm, the accuracy of tree crown delineation depends on the precision of each tree’s location. In this study, the MCWS algorithm provided the tree crown boundary based on using the LM algorithm to detect treetops. Previous research has reported using different approaches for determining the tree location. For instance, Fang et al. proposed to exploit tree inventories as a guide for tree identification using the MCWS approach [54]. Combining a random forest classification and existing tree inventory data, Wallace et al. applied a workflow for detecting and delineating all of the individual trees in the city of Melbourne, Victoria, Australia [15]. However, it is still a challenge for classical methods to detect individual trees in a complex forest due to the cross and variable size of tree crowns [8]. In this study, owing to the study site being a newly forested plantation with few overlapping crowns, sufficient distance between trees, and a relatively consistent age of Chinese fir, it is feasible to use the fixed window size for LM algorithm and MCWS algorithm. The circular window was used in this study because the Chinese fir has a concentrated and distributed radially crown shape. For the parameters, the circular smoothing window size of 10 cm and the fixed circular window size of 50 cm was selected as the appropriate combination for ITD. Hao et al. has reported that details on the impacts of factors for ITD optimization [37].
Comparing the results of ITD by classical methods, it was found that higher accuracy was achieved by LM algorithm than MCWS algorithm when using the same test image. This may be explained because the MCWS algorithm needs to delineate individual trees, which could reduce the detected accuracy. Moreover, the CHM is the optimal image for ITD, which generated a higher accuracy (F1 score = 87.86% for LM algorithm and F1 score = 85.92% for MCWS algorithm) compared to other test images. This may be explained by the CHM is normalized DSM via subtraction of DTM, which removes the influence of ground elevation, and contains the most information of tree crowns. Compared to other single-band images, it has the simple signatures of data.

4.2. Mask R-CNN

It has shown that CNNs can outperform classical methods because they no longer rely on consistent spectral signatures or rule-based algorithms [55]. Compared with classical methods (e.g., LM algorithm and MCWS algorithm), one of the main advantages of CNNs is the capability to extract the information from multi-band images. After the model training, it can produce the corresponding results as long as the remote sensing image was imported into the model. However, the more classical methods find detection of individual trees challenging from a multi-band image, which needs to derive or compress the multi-dimensional data into a single band image. For example, to select the appropriate image band, Xu et al. [26] used the principal component method and the ratio of bands to obtain the single band image for ITD. For the input image, the Mask R-CNN model with the multi-band combined image achieved higher accuracy than the model with the single band. The highest accuracy of the Mask R-CNN model with a single band was 90.09%, and lowest accuracy was 65.55%, which is even lower than the results of ITD using the LM algorithm or MCWS algorithm. This can be explained by the single band, which contains limited information, and which cannot meet the feature requirements of Mask R-CNN. In addition, the model with the red edge image and NIR image was higher than the model with the blue, green, and red image. The result can be explained by the red edge and NIR images containing more vegetation information than the blue, green, and red images.
Another advantage of Mask R-CNN is to distinguish target tree species from images. In this study, for tree crown detection, the optimal Mask R-CNN model using the RGB band combination achieved higher accuracy in Chinese fir detection (F1 score = 94.68%) than the optimal prediction from LM algorithm (F1 score = 87.86%) and MCWS algorithm (F1 score = 85.92%). This difference in accuracy was explained by the detection of broad-leaved trees in the study site using the LM and MCWS algorithms, which were calculated as false detections here. If the detected broad-leaved trees were removed from the results, the F1 score of LM algorithm and MCWS algorithm using a CHM as the input image increased to 95.21% and 93.04%, respectively.
Although the Mask R-CNN model has significant power to identify tree species, it requires manual or semi-automatic delineated training samples for model training [34]. In this study, due to the morphology of Chinese fir and the clear tree crown, it was possible to delineate tree crowns manually for model training. However, for complex forests, it is a challenge to delineate tree crowns by hand, even using high spatial resolution images. In addition, the Mask R-CNN requires a large volume and highly accurate training samples, which is the main difficulty to utilize the model [34]. To address this limitation, the data augmentation process and pre-trained ResNet-50 architecture framework was used in this study. In many scenarios, it is not feasible to fully design and train a new ConvNet for CNNs [56], because it is time-consuming to label data and has high computational demands for the processing of model training. It has been shown that model weights can be fine-tuned to adapt the detected object during the transfer learning, which can greatly reduce the need of training samples [57]. For instance, Fromm et al. used a pre-trained Faster R-CNN network to detect conifer seedlings, which did not cause a significant loss of accuracy even with the training dataset reduced to a couple of hundred seedlings [10]. Once the model training was completed, its application on other images was accurate. Kattenborn et al. reported that although it took 2.5 h to train the model, the application on the detection of cover fractions of plant species and communities is very efficient and took only seconds for each tile [58].

4.3. The Limitation and Application of These Algorithms

All the algorithms used for detecting tree crown exhibited advantages and disadvantages in terms of data processing, requirements, and accuracy. Based on the developed detecting models, it was found that the LM algorithm took approximately 9.5 s to complete the detection of individual trees in region 1, and the MCWS algorithm needed 32.9 s, while it took about 2 min for Mask R-CNN to detect individual trees in region 1. The biggest weakness of these algorithms is that they have difficulty detecting individual tree crowns in highly overlapping forests [16,59,60]. And the main limitation of LM and MCWS algorithms is the inability to identify tree species. In the case of monoculture forests, classical methods can achieve good accuracy for ITD because there is no interference caused by differences from multiple tree species [47,61]. For mixed forest, it is suggested to manually delineate the region of target tree species and then use the classical methods for individual tree detection to solve the limitation from this tree species identification problem. For example, Aeberli et al. achieved banana tree detection by delineating the study area for banana trees from a commercial banana farm and surrounding area that hosted forestry, residential farming land uses [39]. For mixed forests with multiple tree species, deep learning methods become a better option than classical methods because of the capability of tree species identification. However, although the Mask R-CNN exhibited advantages in terms of tree species identification and multi-layer input image application, it is still in the initial stage of application in forestry. Moreover, there is no model for identifying different tree species that can be applied or used universally. Therefore, model training is a necessary step for the application of the Mask R-CNN technique. Currently, the complexity of model training is still the main limitation for applying this method, but with the further development of deep learning techniques, it is expected that common models will be become available. Deep learning exhibits the power to identify individual trees and is an alternative and promising survey technique for forest management.

5. Conclusions

The effectiveness of detecting and mapping individual trees is a critical way to monitor the growth of young forests. This study explored the ability of LM algorithm, MCWS algorithm, and Mask R-CNN for tree detection and map in a newly forested Chinese fir planting using UAV imagery. Manually delineated tree crowns based on the UAV imagery were used for evaluating the accuracy of ITD by LM algorithm, MCWS algorithm, and Mask R-CNN. In total, nine different test images, including a single-band image, band combinations, and derivations of the UAV imagery, were tested for selecting the most appropriate approach and the optimal image for ITD. The Mask R-CNN model with RGB band combination had superior performance when compared with other models in this study, yielded recall = 93.73%, precision = 95.65%, F1 score = 94.68%. Moreover, the accuracy of ITD using the optimal Mask R-CNN was higher than the optimal LM algorithm (F1 score = 87.86%) and MCWS algorithm (F1 score = 85.92%), indicating that Mask R-CNN has higher accuracy potential compared to classical methods for individual tree detection. This study provides valuable information on how to select the optimal approach to detect and delineate tree crowns from UAV imagery.

Author Contributions

Conceptualization, Z.H. and L.L.; methodology, Z.H.; software, Z.H.; validation, K.Y., Z.H.; formal analysis, Z.H.; investigation, Z.H., G.Z. and S.T.; resources, K.Y.; data curation, Z.H.; writing—original draft preparation, Z.H. and L.L.; writing—review and editing, C.J.P. and E.A.M.; visualization, Z.H. and L.L.; supervision, L.L. and J.L.; project administration, J.L.; funding acquisition, K.Y. All authors have read and agreed to the published version of the manuscript.

Funding

This research was funded by the National Natural Science Foundation of China (grant number 31770760), Fujian Provincial Department of Science and Technology (grant number 2020N5003).

Institutional Review Board Statement

Not applicable.

Informed Consent Statement

Not applicable.

Data Availability Statement

The data presented in this study are available on request from the corresponding author.

Acknowledgments

We wish to thank the anonymous reviewers and editors for their detailed comments and suggestions.

Conflicts of Interest

The authors declare no conflict of interest.

Appendix A

Figure A1. The LM algorithm workflow for individual tree detection using ModelBuilder. The input file is shown in dark blue color; the input parameters are shown in light blue color; the ArcGIS tools are shown in yellow color; the intermediate data is shown in light green color; and the output result is shown in dark green color.
Remotesensing 14 00295 g0a1
Figure A2. A visual modeling environment using the LM algorithm for individual tree detection.
Remotesensing 14 00295 g0a2
Figure A3. The MCWS algorithm workflow for individual tree detection using ModelBuilder. The input file is shown in dark blue color; the input parameters are shown in light blue color; the ArcGIS tools are shown in yellow color; the intermediate data is shown in light green color; and the output result is shown in dark green color.
Remotesensing 14 00295 g0a3
Figure A4. A visual modeling environment using the MCWS algorithm for individual tree detection.
Remotesensing 14 00295 g0a4

References

  1. Huuskonen, S.; Hynynen, J. Timing and intensity of precommercial thinning and their effects on the first commercial thinning in Scots pine stands. Silva Fenn. 2006, 40, 645–662. [Google Scholar] [CrossRef] [Green Version]
  2. Pearse, G.D.; Tan, A.Y.; Watt, M.S.; Franz, M.O.; Dash, J.P. Detecting and mapping tree seedlings in UAV imagery using convolutional neural networks and field-verified data. ISPRS J. Photogramm. Remote Sens. 2020, 168, 156–169. [Google Scholar] [CrossRef]
  3. Tang, L.; Shao, G. Drone remote sensing for forestry research and practices. J. For. Res. 2015, 26, 791–797. [Google Scholar] [CrossRef]
  4. Gardner, T.A.; Barlow, J.; Araujo, I.S.; Ávila-Pires, T.C.; Bonaldo, A.B.; Costa, J.E.; Esposito, M.C.; Ferreira, L.V.; Hawes, J.; Hernandez, M.I.M.; et al. The cost-effectiveness of biodiversity surveys in tropical forests. Ecol. Lett. 2008, 11, 139–150. [Google Scholar] [CrossRef]
  5. Mohan, M.; Silva, C.A.; Klauberg, C.; Jat, P.; Catts, G.; Cardil, A.; Hudak, A.T.; Dia, M. Individual Tree Detection from Unmanned Aerial Vehicle (UAV) Derived Canopy Height Model in an Open Canopy Mixed Conifer Forest. Forests 2017, 8, 340. [Google Scholar] [CrossRef] [Green Version]
  6. Guimarães, N.; Pádua, L.; Marques, P.; Silva, N.; Peres, E.; Sousa, J.J. Forestry Remote Sensing from Unmanned Aerial Vehicles: A Review Focusing on the Data, Processing and Potentialities. Remote Sens. 2020, 12, 1046. [Google Scholar] [CrossRef] [Green Version]
  7. Kattenborn, T.; Leitloff, J.; Schiefer, F.; Hinz, S. Review on Convolutional Neural Networks (CNN) in vegetation remote sensing. ISPRS J. Photogramm. 2021, 173, 24–49. [Google Scholar] [CrossRef]
  8. Wagner, F.H.; Ferreira, M.P.; Sanchez, A.; Hirye, M.C.M.; Zortea, M.; Gloor, E.; Phillips, O.L.; de Souza Filho, C.R.; Shimabukuro, Y.E.; Aragão, L.E.O.C. Individual tree crown delineation in a highly diverse tropical forest using very high resolution satellite images. ISPRS J. Photogramm. Remote Sens. 2018, 145, 362–377. [Google Scholar] [CrossRef]
  9. Dash, J.P.; Watt, M.S.; Paul, T.S.H.; Morgenroth, J.; Pearse, G.D. Early Detection of Invasive Exotic Trees Using UAV and Manned Aircraft Multispectral and LiDAR Data. Remote Sens. 2019, 11, 1812. [Google Scholar] [CrossRef] [Green Version]
  10. Fromm, M.; Schubert, M.; Castilla, G.; Linke, J.; McDermid, G. Automated Detection of Conifer Seedlings in Drone Imagery Using Convolutional Neural Networks. Remote Sens. 2019, 11, 2585. [Google Scholar] [CrossRef] [Green Version]
  11. Gülci, S. The determination of some stand parameters using SfM-based spatial 3D point cloud in forestry studies: An analysis of data production in pure coniferous young forest stands. Environ. Monit. Assess. 2019, 191, 495. [Google Scholar] [CrossRef]
  12. Feduck, C.; McDermid, G.J.; Castilla, G. Detection of Coniferous Seedlings in UAV Imagery. Forests 2018, 9, 432. [Google Scholar] [CrossRef] [Green Version]
  13. Castilla, G.; Filiatrault, M.; McDermid, G.J.; Gartrell, M. Estimating Individual Conifer Seedling Height Using Drone-Based Image Point Clouds. Forests 2020, 11, 924. [Google Scholar] [CrossRef]
  14. Yin, D.; Wang, L. Individual mangrove tree measurement using UAV-based LiDAR data: Possibilities and challenges. Remote Sens. Environ. 2019, 223, 34–49. [Google Scholar] [CrossRef]
  15. Wallace, L.; Sun, Q.; Hally, B.; Hillman, S.; Both, A.; Hurley, J.; Saldias, D.S.M. Linking urban tree inventories to remote sensing data for individual tree mapping. Urban For. Urban Green. 2021, 61, 127106. [Google Scholar] [CrossRef]
  16. Larsen, M.; Eriksson, M.; Descombes, X.; Perrin, G.; Brandtberg, T.; Gougeon, F.A. Comparison of six individual tree crown detection algorithms evaluated under varying forest conditions. Int. J. Remote Sens. 2011, 32, 5827–5852. [Google Scholar] [CrossRef]
  17. Pouliot, D.; King, D.; Bell, F.; Pitt, D. Automated tree crown detection and delineation in high-resolution digital camera imagery of coniferous forest regeneration. Remote Sens. Environ. 2002, 82, 322–334. [Google Scholar] [CrossRef]
  18. Özcan, A.H.; Hisar, D.; Sayar, Y.; Ünsalan, C. Tree crown detection and delineation in satellite images using probabilistic voting. Remote Sens. Lett. 2017, 8, 761–770. [Google Scholar] [CrossRef]
  19. Almeida, A.; Gonçalves, F.; Silva, G.; Mendonça, A.; Gonzaga, M.; Silva, J.; Souza, R.; Leite, I.; Neves, K.; Boeno, M.; et al. Individual Tree Detection and Qualitative Inventory of a Eucalyptus sp. Stand Using UAV Photogrammetry Data. Remote Sens. 2021, 13, 3655. [Google Scholar] [CrossRef]
  20. Swayze, N.C.; Tinkham, W.T.; Vogeler, J.C.; Hudak, A.T. Influence of flight parameters on UAS-based monitoring of tree height, diameter, and density. Remote Sens. Environ. 2021, 263, 112540. [Google Scholar] [CrossRef]
  21. Krause, S.; Sanders, T.G.M.; Mund, J.-P.; Greve, K. UAV-Based Photogrammetric Tree Height Measurement for Intensive Forest Monitoring. Remote Sens. 2019, 11, 758. [Google Scholar] [CrossRef] [Green Version]
  22. Khosravipour, A.; Skidmore, A.K.; Wang, T.; Isenburg, M.; Khoshelham, K. Effect of slope on treetop detection using a LiDAR Canopy Height Model. ISPRS J. Photogramm. Remote Sens. 2015, 104, 44–52. [Google Scholar] [CrossRef]
  23. Yun, T.; Jiang, K.; Li, G.; Eichhorn, M.P.; Fan, J.; Liu, F.; Chen, B.; An, F.; Cao, L. Individual tree crown segmentation from airborne LiDAR data using a novel Gaussian filter and energy function minimization-based approach. Remote Sens. Environ. 2021, 256, 112307. [Google Scholar] [CrossRef]
  24. Hu, B.; Li, J.; Jing, L.; Judah, A. Improving the efficiency and accuracy of individual tree crown delineation from high-density LiDAR data. Int. J. Appl. Earth Obs. Geoinf. 2014, 26, 145–155. [Google Scholar] [CrossRef]
  25. Jing, L.; Hu, B.; Li, J.; Noland, T.; Guo, H. Automated tree crown delineation from imagery based on morphological techniques. In IOP Conference Series: Earth and Environmental Science; IOP Publishing: Bristol, UK, 2014; Volume 17, p. 012066. [Google Scholar]
  26. Xu, X.; Zhou, Z.; Tang, Y.; Qu, Y. Individual tree crown detection from high spatial resolution imagery using a revised local maximum filtering. Remote Sens. Environ. 2021, 258, 112397. [Google Scholar] [CrossRef]
  27. Zhang, L.; Zhang, L.; Du, B. Deep learning for remote sensing data: A technical tutorial on the state of the art. IEEE Geosci. Remote Sens. Mag. 2016, 4, 22–40. [Google Scholar] [CrossRef]
  28. Ma, L.; Liu, Y.; Zhang, X.; Ye, Y.; Yin, G.; Johnson, B.A. Deep learning in remote sensing applications: A meta-analysis and review. ISPRS J. Photogramm. 2019, 152, 166–177. [Google Scholar] [CrossRef]
  29. Diez, Y.; Kentsch, S.; Fukuda, M.; Caceres, M.; Moritake, K.; Cabezas, M. Deep Learning in Forestry Using UAV-Acquired RGB Data: A Practical Review. Remote Sens. 2021, 13, 2837. [Google Scholar] [CrossRef]
  30. Brandt, M.; Tucker, C.J.; Kariryaa, A.; Rasmussen, K.; Abel, C.; Small, J.; Chave, J.; Rasmussen, L.V.; Hiernaux, P.; Diouf, A.A.; et al. An unexpectedly large count of trees in the West African Sahara and Sahel. Nature 2020, 587, 78–82. [Google Scholar] [CrossRef] [PubMed]
  31. He, K.; Gkioxari, G.; Dollár, P.; Girshick, R. Mask R-CNN. In Proceedings of the IEEE International Conference on Computer Vision, Venice, Italy, 22–29 October 2017. [Google Scholar]
  32. Iqbal, M.S.; Ali, H.; Tran, S.N.; Iqbal, T. Coconut trees detection and segmentation in aerial imagery using mask region-based convolution neural network. IET Comput. Vis. 2021, 15, 428–439. [Google Scholar] [CrossRef]
  33. Guirado, E.; Blanco-Sacristán, J.; Rodríguez-Caballero, E.; Tabik, S.; Alcaraz-Segura, D.; Martínez-Valderrama, J.; Cabello, J. Mask R-CNN and OBIA fusion improves the segmentation of scattered vegetation in very high-resolution optical sensors. Sensors 2021, 21, 320. [Google Scholar] [CrossRef]
  34. Braga, J.R.; Peripato, V.; Dalagnol, R.; Ferreira, P.M.; Tarabalka, Y.; Aragão, O.C.L.E.; De Campos Velho, H.F.; Shiguemori, E.H.; Wagner, F.H. Tree crown delineation algorithm based on a convolutional neural network. Remote Sens. 2020, 12, 1288. [Google Scholar] [CrossRef] [Green Version]
  35. Hao, Z.; Lin, L.; Post, C.J.; Mikhailova, E.A.; Li, M.; Chen, Y.; Yu, K.; Liu, J. Automated tree-crown and height detection in a young forest plantation using mask region-based convolutional neural network (Mask R-CNN). ISPRS J. Photogramm. 2021, 178, 112–123. [Google Scholar] [CrossRef]
  36. Gallardo-Salazar, J.L.; Pompa-García, M. Detecting individual tree attributes and multispectral indices using un-manned aerial vehicles: Applications in a pine clonal orchard. Remote Sens. 2020, 12, 4144. [Google Scholar] [CrossRef]
  37. Hao, Z.; Lin, L.; Post, C.J.; Jiang, Y.; Li, M.; Wei, N.; Yu, K.; Liu, J. Assessing tree height and density of a young forest using a consumer unmanned aerial vehicle (UAV). New Forest. 2021, 52, 843–862. [Google Scholar] [CrossRef]
  38. Schiefer, F.; Kattenborn, T.; Frick, A.; Frey, J.; Schall, P.; Koch, B.; Schmidtlein, S. Mapping forest tree species in high resolution UAV-based RGB-imagery by means of convolutional neural networks. ISPRS J. Photogramm. Remote Sens. 2020, 170, 205–215. [Google Scholar] [CrossRef]
  39. Aeberli, A.; Johansen, K.; Robson, A.; Lamb, D.W.; Phinn, S. Detection of banana plants using multi-temporal multi-spectral UAV imagery. Remote Sens. 2021, 13, 2123. [Google Scholar] [CrossRef]
  40. Tu, Y.; Johansen, K.; Phinn, S.; Robson, A. Measuring canopy structure and condition using multi-spectral UAS imagery in a horticultural environment. Remote Sens. 2019, 11, 269. [Google Scholar] [CrossRef] [Green Version]
  41. Zhang, D.; Pan, Y.; Zhang, J.; Hu, T.; Zhao, J.; Li, N.; Chen, Q. A generalized approach based on convolutional neural networks for large area cropland mapping at very high resolution. Remote Sens. Environ. 2020, 247, 111912. [Google Scholar] [CrossRef]
  42. Pleșoianu, A.-I.; Stupariu, M.-S.; Șandric, I.; Pătru-Stupariu, I.; Drăguț, L. Individual Tree-Crown Detection and Species Classification in Very High-Resolution Remote Sensing Imagery Using a Deep Learning Ensemble Model. Remote Sens. 2020, 12, 2426. [Google Scholar] [CrossRef]
  43. Wu, G.; Li, Y. Non-maximum suppression for object detection based on the chaotic whale optimization algorithm. J. Vis. Commun. Image Represent. 2021, 74, 102985. [Google Scholar] [CrossRef]
  44. Hyndman, R.; Koehler, A.B. Another look at measures of forecast accuracy. Int. J. Forecast. 2006, 22, 679–688. [Google Scholar] [CrossRef] [Green Version]
  45. Wu, X.; Sahoo, D.; Hoi, S.C.H. Recent advances in deep learning for object detection. Neurocomputing 2020, 396, 39–64. [Google Scholar] [CrossRef] [Green Version]
  46. Mohan, M.; de Mendonça, B.A.F.; Silva, C.A.; Klauberg, C.; Ribeiro, A.S.D.S.; de Araújo, E.J.G.; Monte, M.A.; Cardil, A. Optimizing individual tree detection accuracy and measuring forest uniformity in coconut (Cocos nucifera L.) plantations using airborne laser scanning. Ecol. Model. 2019, 409, 108736. [Google Scholar] [CrossRef]
  47. Fawcett, D.; Azlan, B.; Hill, T.C.; Kho, L.K.; Bennie, J.; Anderson, K. Unmanned aerial vehicle (UAV) derived structure-from-motion photogrammetry point clouds for oil palm (Elaeis guineensis) canopy segmentation and height estimation. Int. J. Remote Sens. 2019, 40, 7538–7560. [Google Scholar] [CrossRef] [Green Version]
  48. Näsi, R.; Honkavaara, E.; Lyytikäinen-Saarenmaa, P.; Blomqvist, M.; Litkey, P.; Hakala, T.; Viljanen, N.; Kantola, T.; Tanhuanpää, T.; Holopainen, M. Using UAV-Based Photogrammetry and Hyperspectral Imaging for Mapping Bark Beetle Damage at Tree-Level. Remote Sens. 2015, 7, 15467–15493. [Google Scholar] [CrossRef] [Green Version]
  49. Hamraz, H.; Contreras, M.A.; Zhang, J. A robust approach for tree segmentation in deciduous forests using small-footprint airborne LiDAR data. Int. J. Appl. Earth Obs. Geoinf. 2016, 52, 532–541. [Google Scholar] [CrossRef] [Green Version]
  50. Wulder, M.; Niemann, K.O.; Goodenough, D.G. Error reduction methods for local maximum filtering of high spatial resolution imagery for locating trees. Can. J. Remote Sens. 2002, 28, 621–628. [Google Scholar] [CrossRef]
  51. Wulder, M.; Niemann, K.; Goodenough, D.G. Local Maximum Filtering for the Extraction of Tree Locations and Basal Area from High Spatial Resolution Imagery. Remote Sens. Environ. 2000, 73, 103–114. [Google Scholar] [CrossRef]
  52. Jaskierniak, D.; Lucieer, A.; Kuczera, G.; Turner, D.; Lane, P.N.J.; Benyon, R.G.; Haydon, S. Individual tree detection and crown delineation from Unmanned Aircraft System (UAS) LiDAR in structurally complex mixed species eucalypt forests. ISPRS J. Photogramm. 2021, 171, 171–187. [Google Scholar] [CrossRef]
  53. Swetnam, T.L.; Falk, D.A. Application of Metabolic Scaling Theory to reduce error in local maxima tree segmentation from aerial LiDAR. For. Ecol. Manag. 2014, 323, 158–167. [Google Scholar] [CrossRef]
  54. Fang, F.; McNeil, B.; Warner, T.; Dahle, G.; Eutsler, E. Street tree health from space? An evaluation using WorldView-3 data and the Washington D.C. Street Tree Spatial Database. Urban For. Urban Green. 2020, 49, 126634. [Google Scholar] [CrossRef]
  55. Kattenborn, T.; Eichel, J.; Fassnacht, F. Convolutional Neural Networks enable efficient, accurate and fine-grained segmentation of plant species and communities from high-resolution UAV imagery. Sci. Rep. 2019, 9, 17656. [Google Scholar] [CrossRef] [PubMed]
  56. Nogueira, K.; Penatti, O.A.; dos Santos, J.A. Towards better exploiting convolutional neural networks for remote sensing scene classification. Pattern Recognit. 2017, 61, 539–556. [Google Scholar] [CrossRef] [Green Version]
  57. Weinstein, B.G.; Marconi, S.; Bohlman, S.A.; Zare, A.; White, E.P. Cross-site learning in deep learning RGB tree crown detection. Ecol. Inform. 2020, 56, 101061. [Google Scholar] [CrossRef]
  58. Kattenborn, T.; Eichel, J.; Wiser, S.; Burrows, L.; Fassnacht, F.E.; Schmidtlein, S. Convolutional Neural Networks accurately predict cover fractions of plant species and communities in Unmanned Aerial Vehicle imagery. Remote Sens. Ecol. Conserv. 2020, 6, 472–486. [Google Scholar] [CrossRef] [Green Version]
  59. Zhen, Z.; Quackenbush, L.J.; Zhang, L. Impact of Tree-Oriented Growth Order in Marker-Controlled Region Growing for Individual Tree Crown Delineation Using Airborne Laser Scanner (ALS) Data. Remote Sens. 2014, 6, 555–579. [Google Scholar] [CrossRef] [Green Version]
  60. Belcore, E.; Wawrzaszek, A.; Wozniak, E.; Grasso, N.; Piras, M. Individual Tree Detection from UAV Imagery Using Hölder Exponent. Remote Sens. 2020, 12, 2407. [Google Scholar] [CrossRef]
  61. Guerra-Hernández, J.; Cosenza, D.N.; Rodriguez, L.C.E.; Silva, M.; Tomé, M.; Díaz-Varela, R.A.; González-Ferreiro, E. Comparison of ALS- and UAV(SfM)-derived high- density point clouds for individual tree detection in Eucalyptus plantations. Int. J. Remote Sens. 2018, 15–16, 5211–5235. [Google Scholar] [CrossRef]
Figure 1. Experimental site: (a) Location of the study site (the red triangle marks the study site in Shunchang County, Fujian Province); (b) Field photo; (c) UAV imagery, showing region 1 and region 2 that highlight regions with field survey data; (d) Example of UAV image in the study area, shown with RGB bands; (e) Example of manually delineated Chinese fir tree crowns (in red), and broad-leaved trees without red polygons.
Remotesensing 14 00295 g001
Figure 2. Overview of the workflow for individual tree crown detection using local maxima (LM) algorithm (using CHM as an example).
Remotesensing 14 00295 g002
Figure 3. Overview of workflow for individual tree crown detection using Marker-controlled watershed segmentation (MCWS) algorithm (using CHM as an example).
Remotesensing 14 00295 g003
Figure 4. Overview of workflow for individual tree crown detection using Mask R-CNN.
Remotesensing 14 00295 g004
Figure 5. Example of individual tree detection using the CHM for LM algorithm. Green dots represent the correctly identified trees; Blue dots represent the falsely detected trees (e.g., broad-leaved trees); Red dots represent the omitted trees.
Remotesensing 14 00295 g005
Figure 6. Examples of individual tree detection using the CHM for MCWS algorithm. Green polygons represent the correctly identified trees; Blue polygons represent the false identified trees (e.g., incomplete tree polygons, overidentified tree polygons, and broad-leaved trees); Red polygons represent omitted trees.
Remotesensing 14 00295 g006
Table 1. The description of different images as the input image.
Number of Test ImagesImageBands DescriptionLM
Algorithm
MCWS
Algorithm
Mask
R-CNN
1BlueBlue+++
2GreenGreen+++
3RedRed+++
4Red edgeRed edge+++
5NIRNear-infrared+++
6CHMCanopy Height Model+++
7RGB band combinationBlue, green, red----+
8Visible-spectrum RGB imageryBlue, green, red----+
9Multi bandBlue, green, red, red edge, near-infrared----+
Note: “+” represents the image was used for testing, “--” represents the image was not used for testing.
Table 2. Images used for tree identification using the LM algorithm, MCWS algorithm, and Mask R-CNN.
MethodsImageTPTotal Identified TreesRecall (%)Precision (%)F1 Score (%)
LM algorithmBlue61579877.1677.0777.12
Green60488275.7868.4871.95
Red51474568.9964.4966.67
Red edge77398396.9978.6486.85
NIR77499197.1178.1086.58
CHM78599098.4979.2987.86
MCWS algorithmBlue528102766.2551.4157.89
Green459105657.5943.4749.54
Red351154344.0422.7530.00
Red edge746103793.6071.9481.35
NIR728103191.3470.6179.65
CHM775100797.2476.9685.92
Mask R-CNNBlue51365864.3777.9670.52
Green54375968.1371.5469.79
Red54987868.8862.5365.55
Red edge73481892.1089.7390.90
NIR68774486.2092.3489.16
CHM74696493.6077.3984.72
RGB band combination74778193.7395.6594.68
Visible-spectrum RGB imagery73176591.7295.5693.60
Multi band76182195.4892.6994.07
Publisher’s Note: MDPI stays neutral with regard to jurisdictional claims in published maps and institutional affiliations.

