
Water Levels in the Major Reservoirs of the Nile River Basin—A Comparison of SENTINEL with Satellite Altimetry Data


Abstract
:
1. Introduction
2. Methods
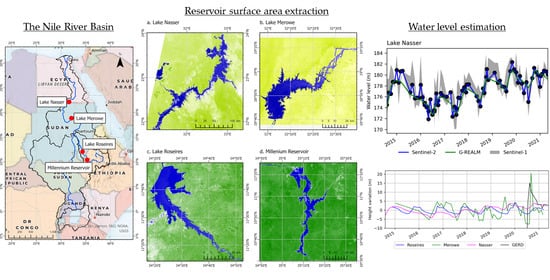
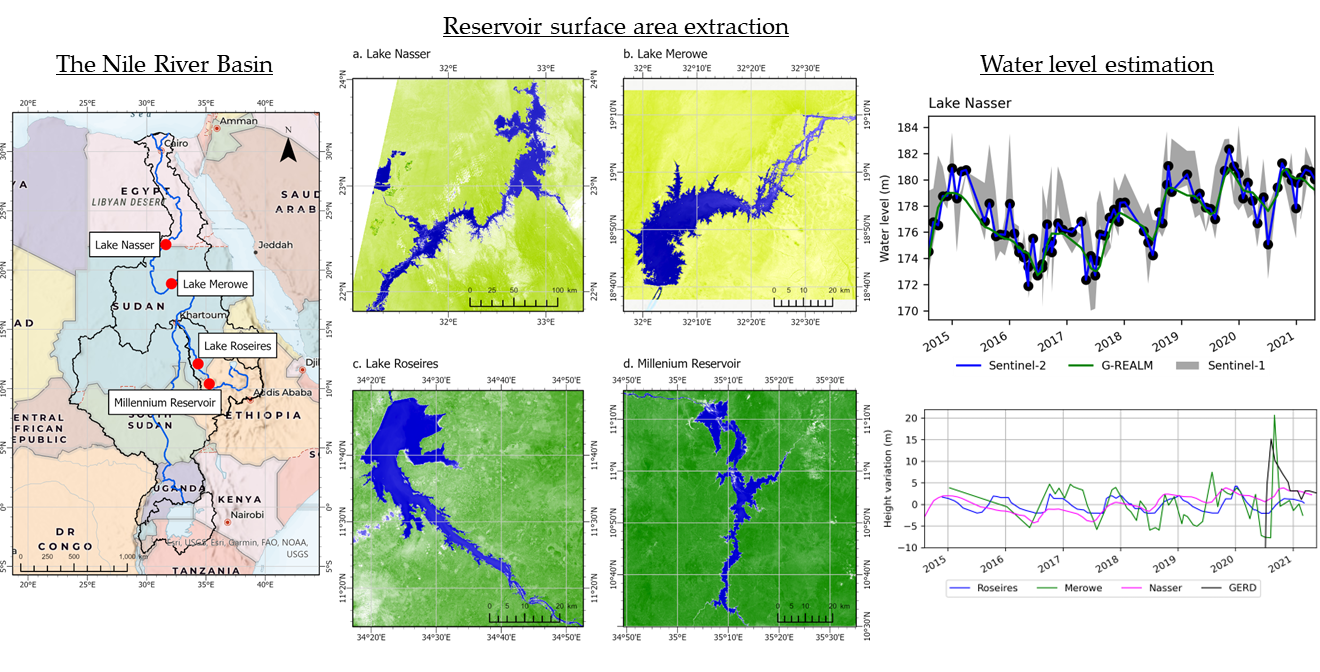
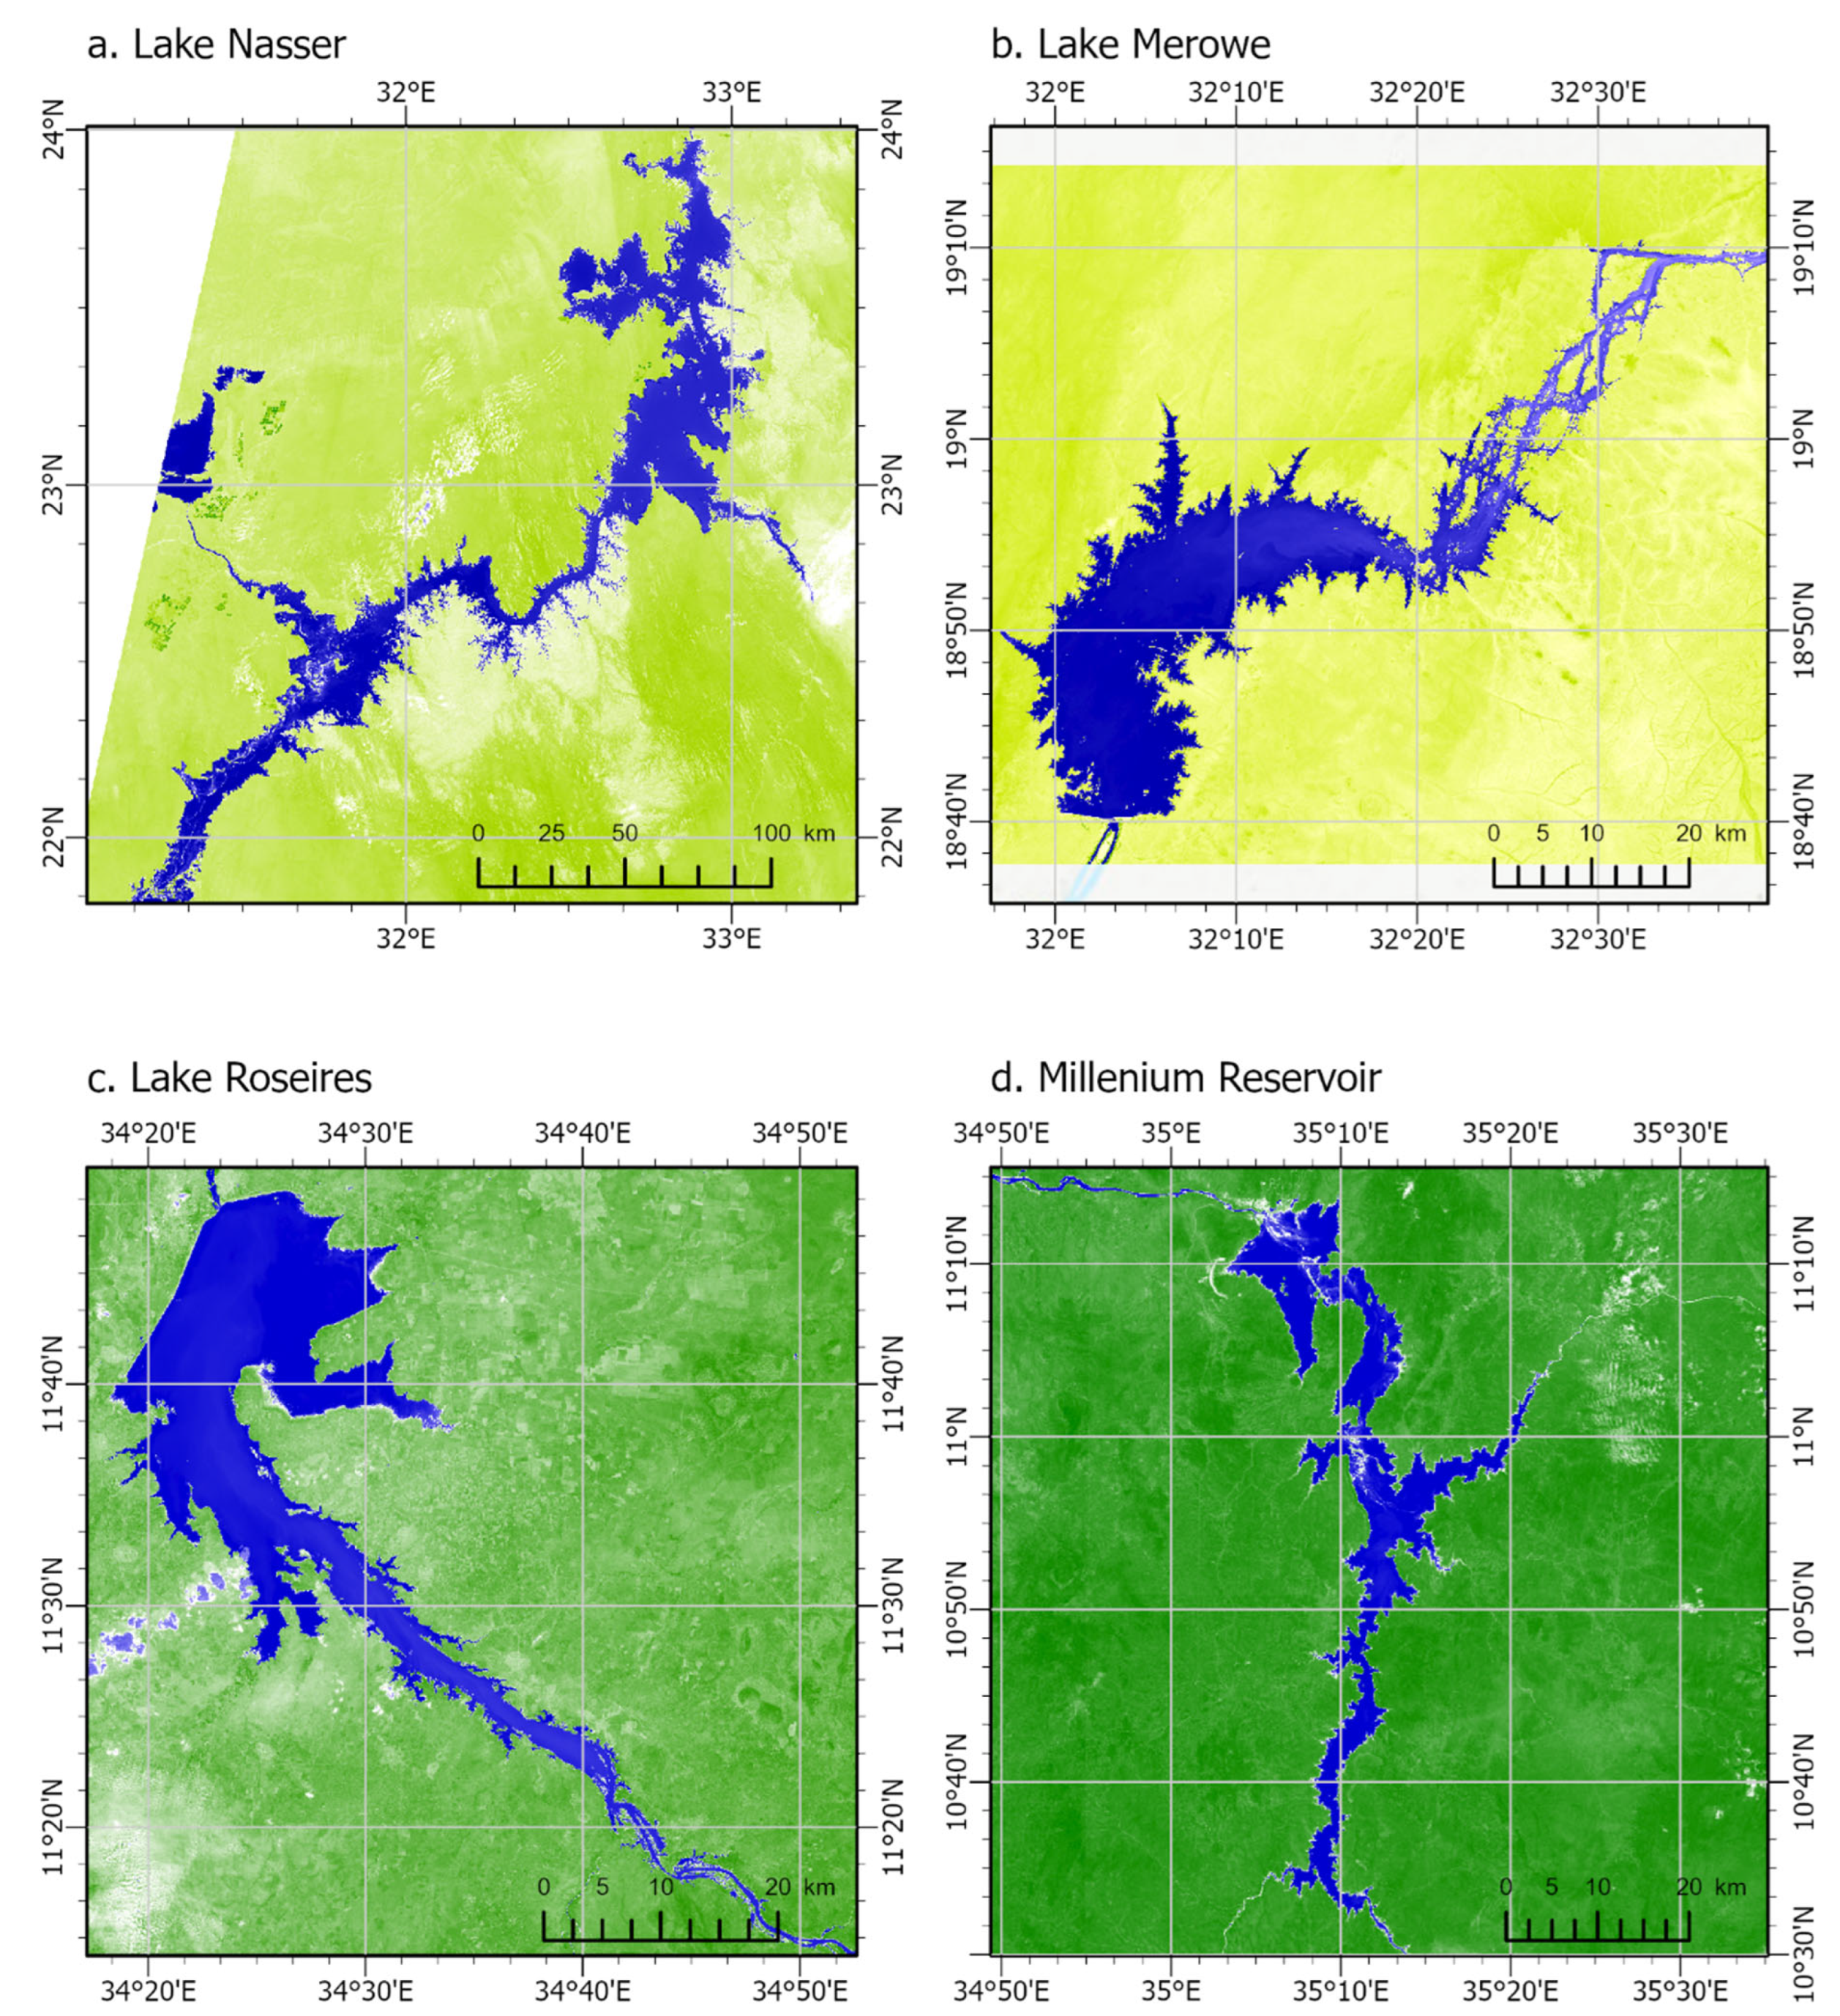
2.1. Study Areas
2.1.1. Lake Nasser
2.1.2. Merowe Reservoir
2.1.3. Roseires Reservoir
2.1.4. Millennium Reservoir
2.2. Data
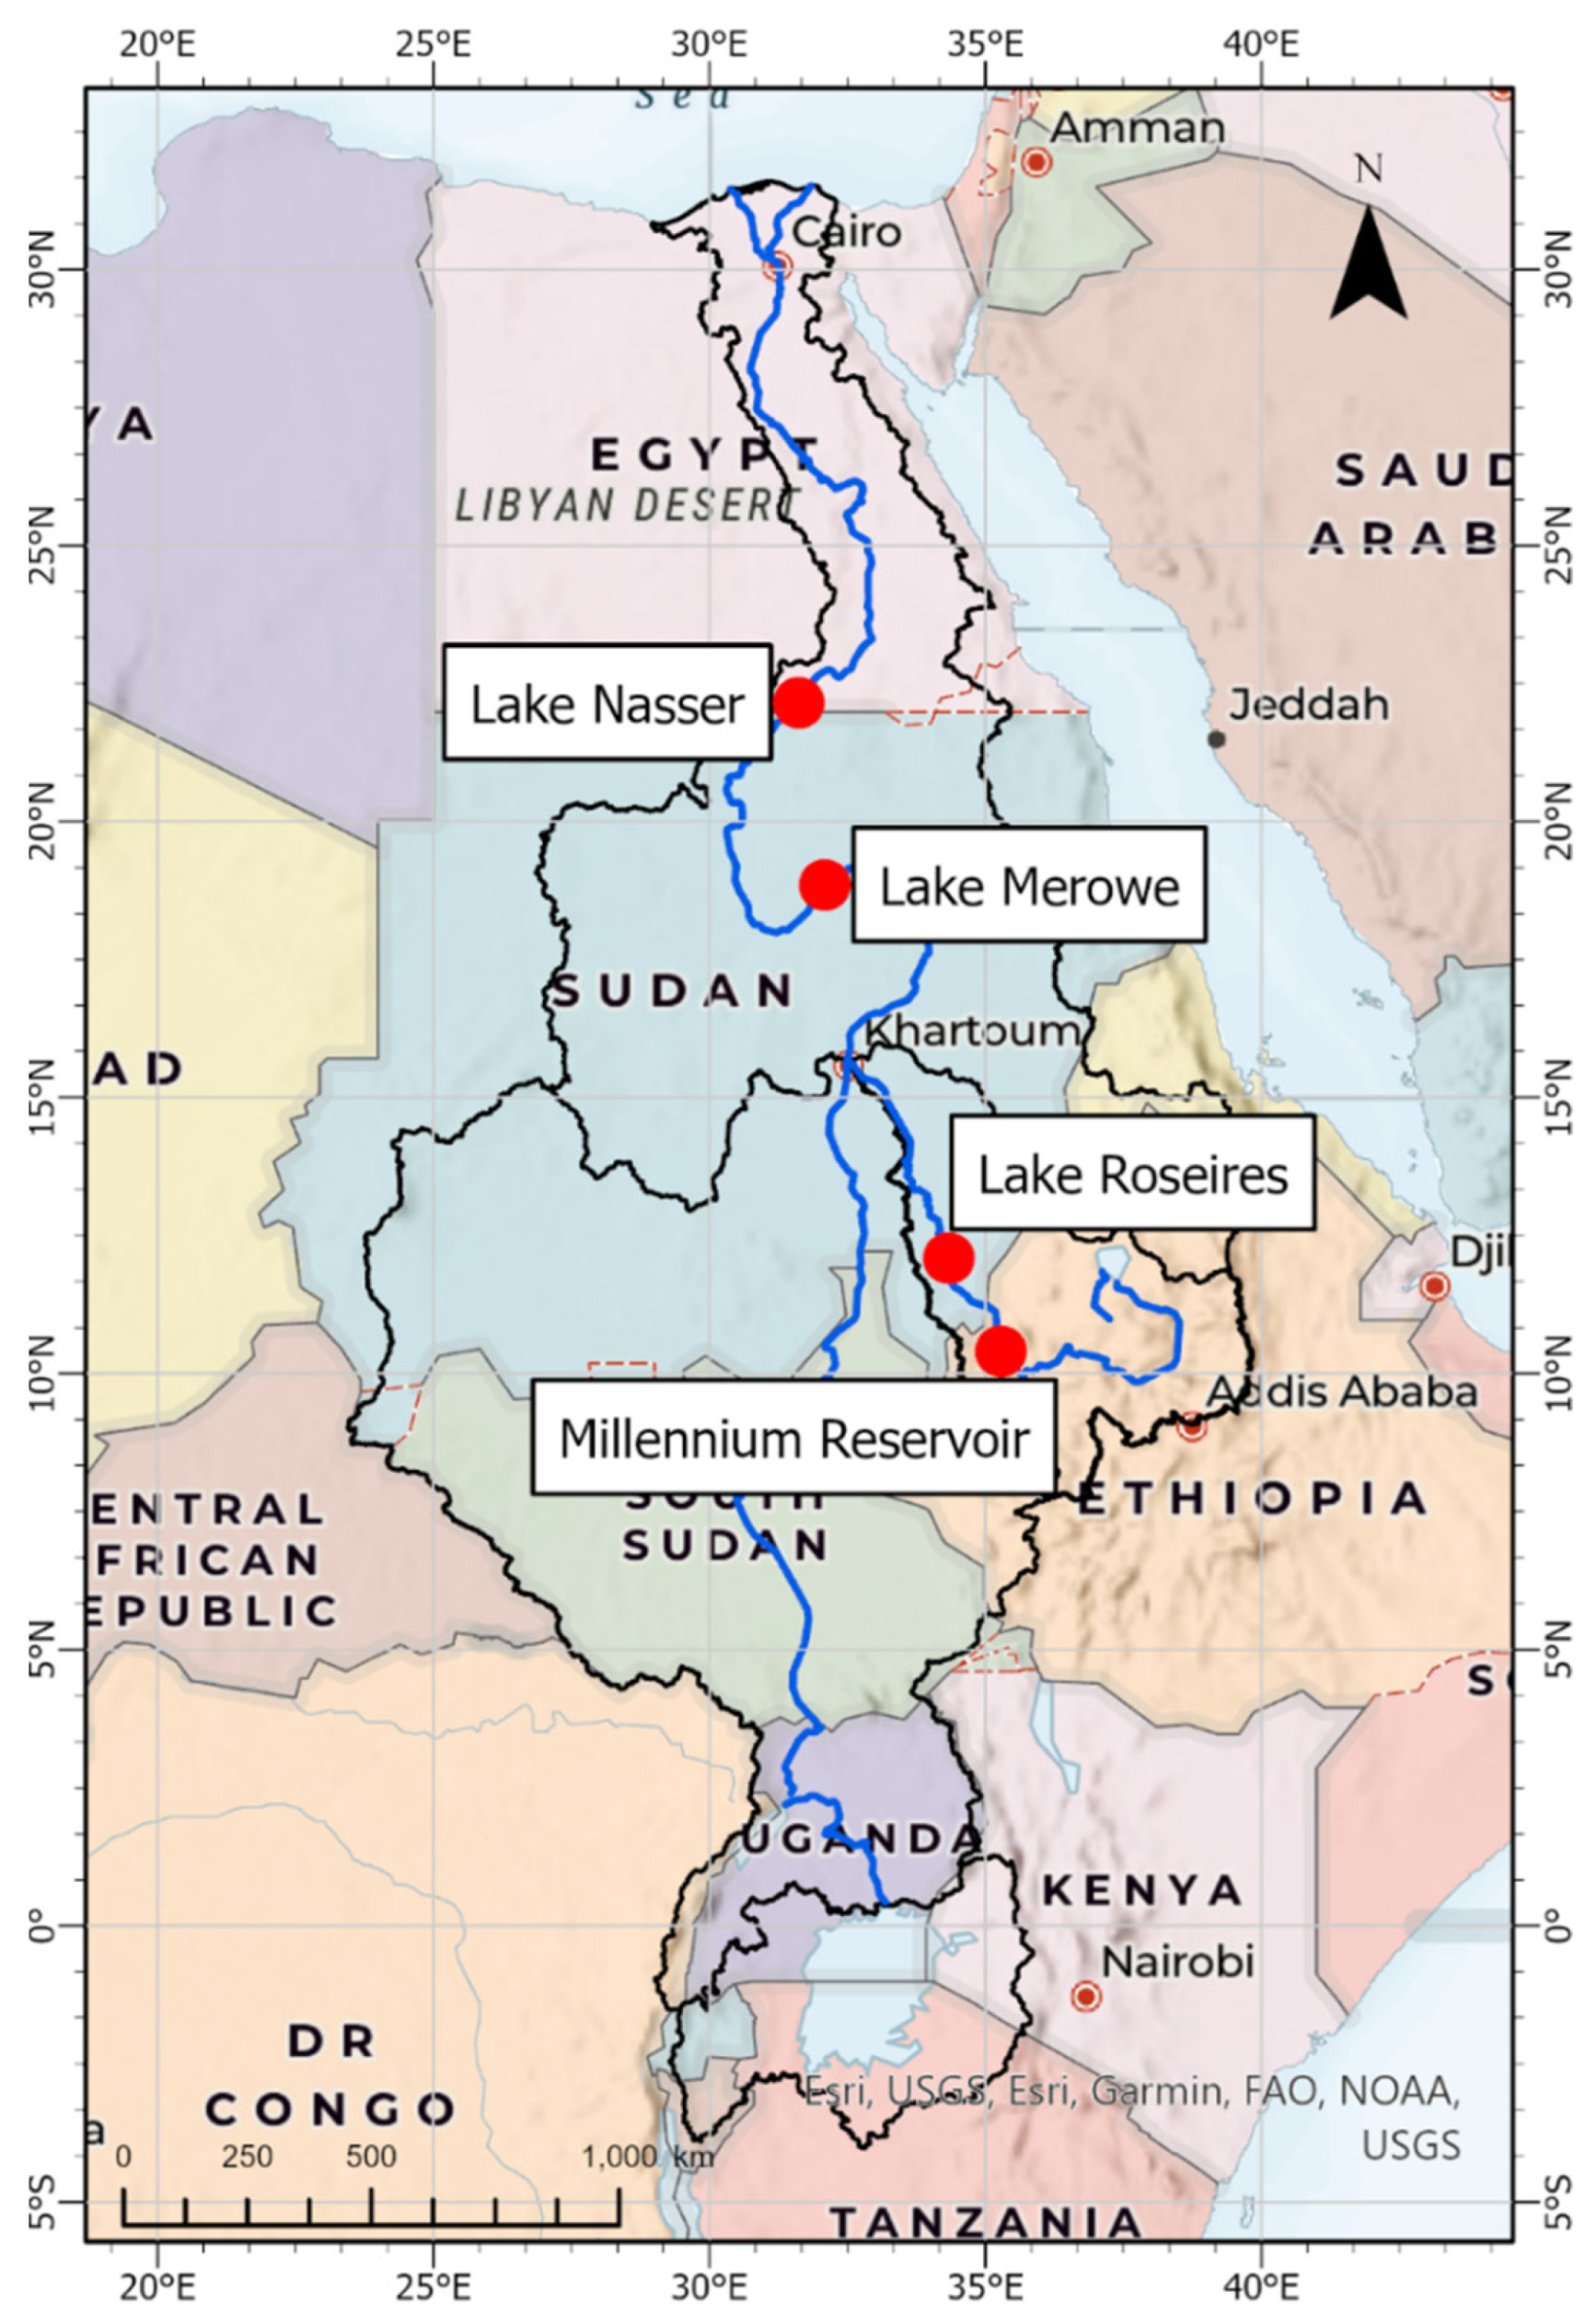
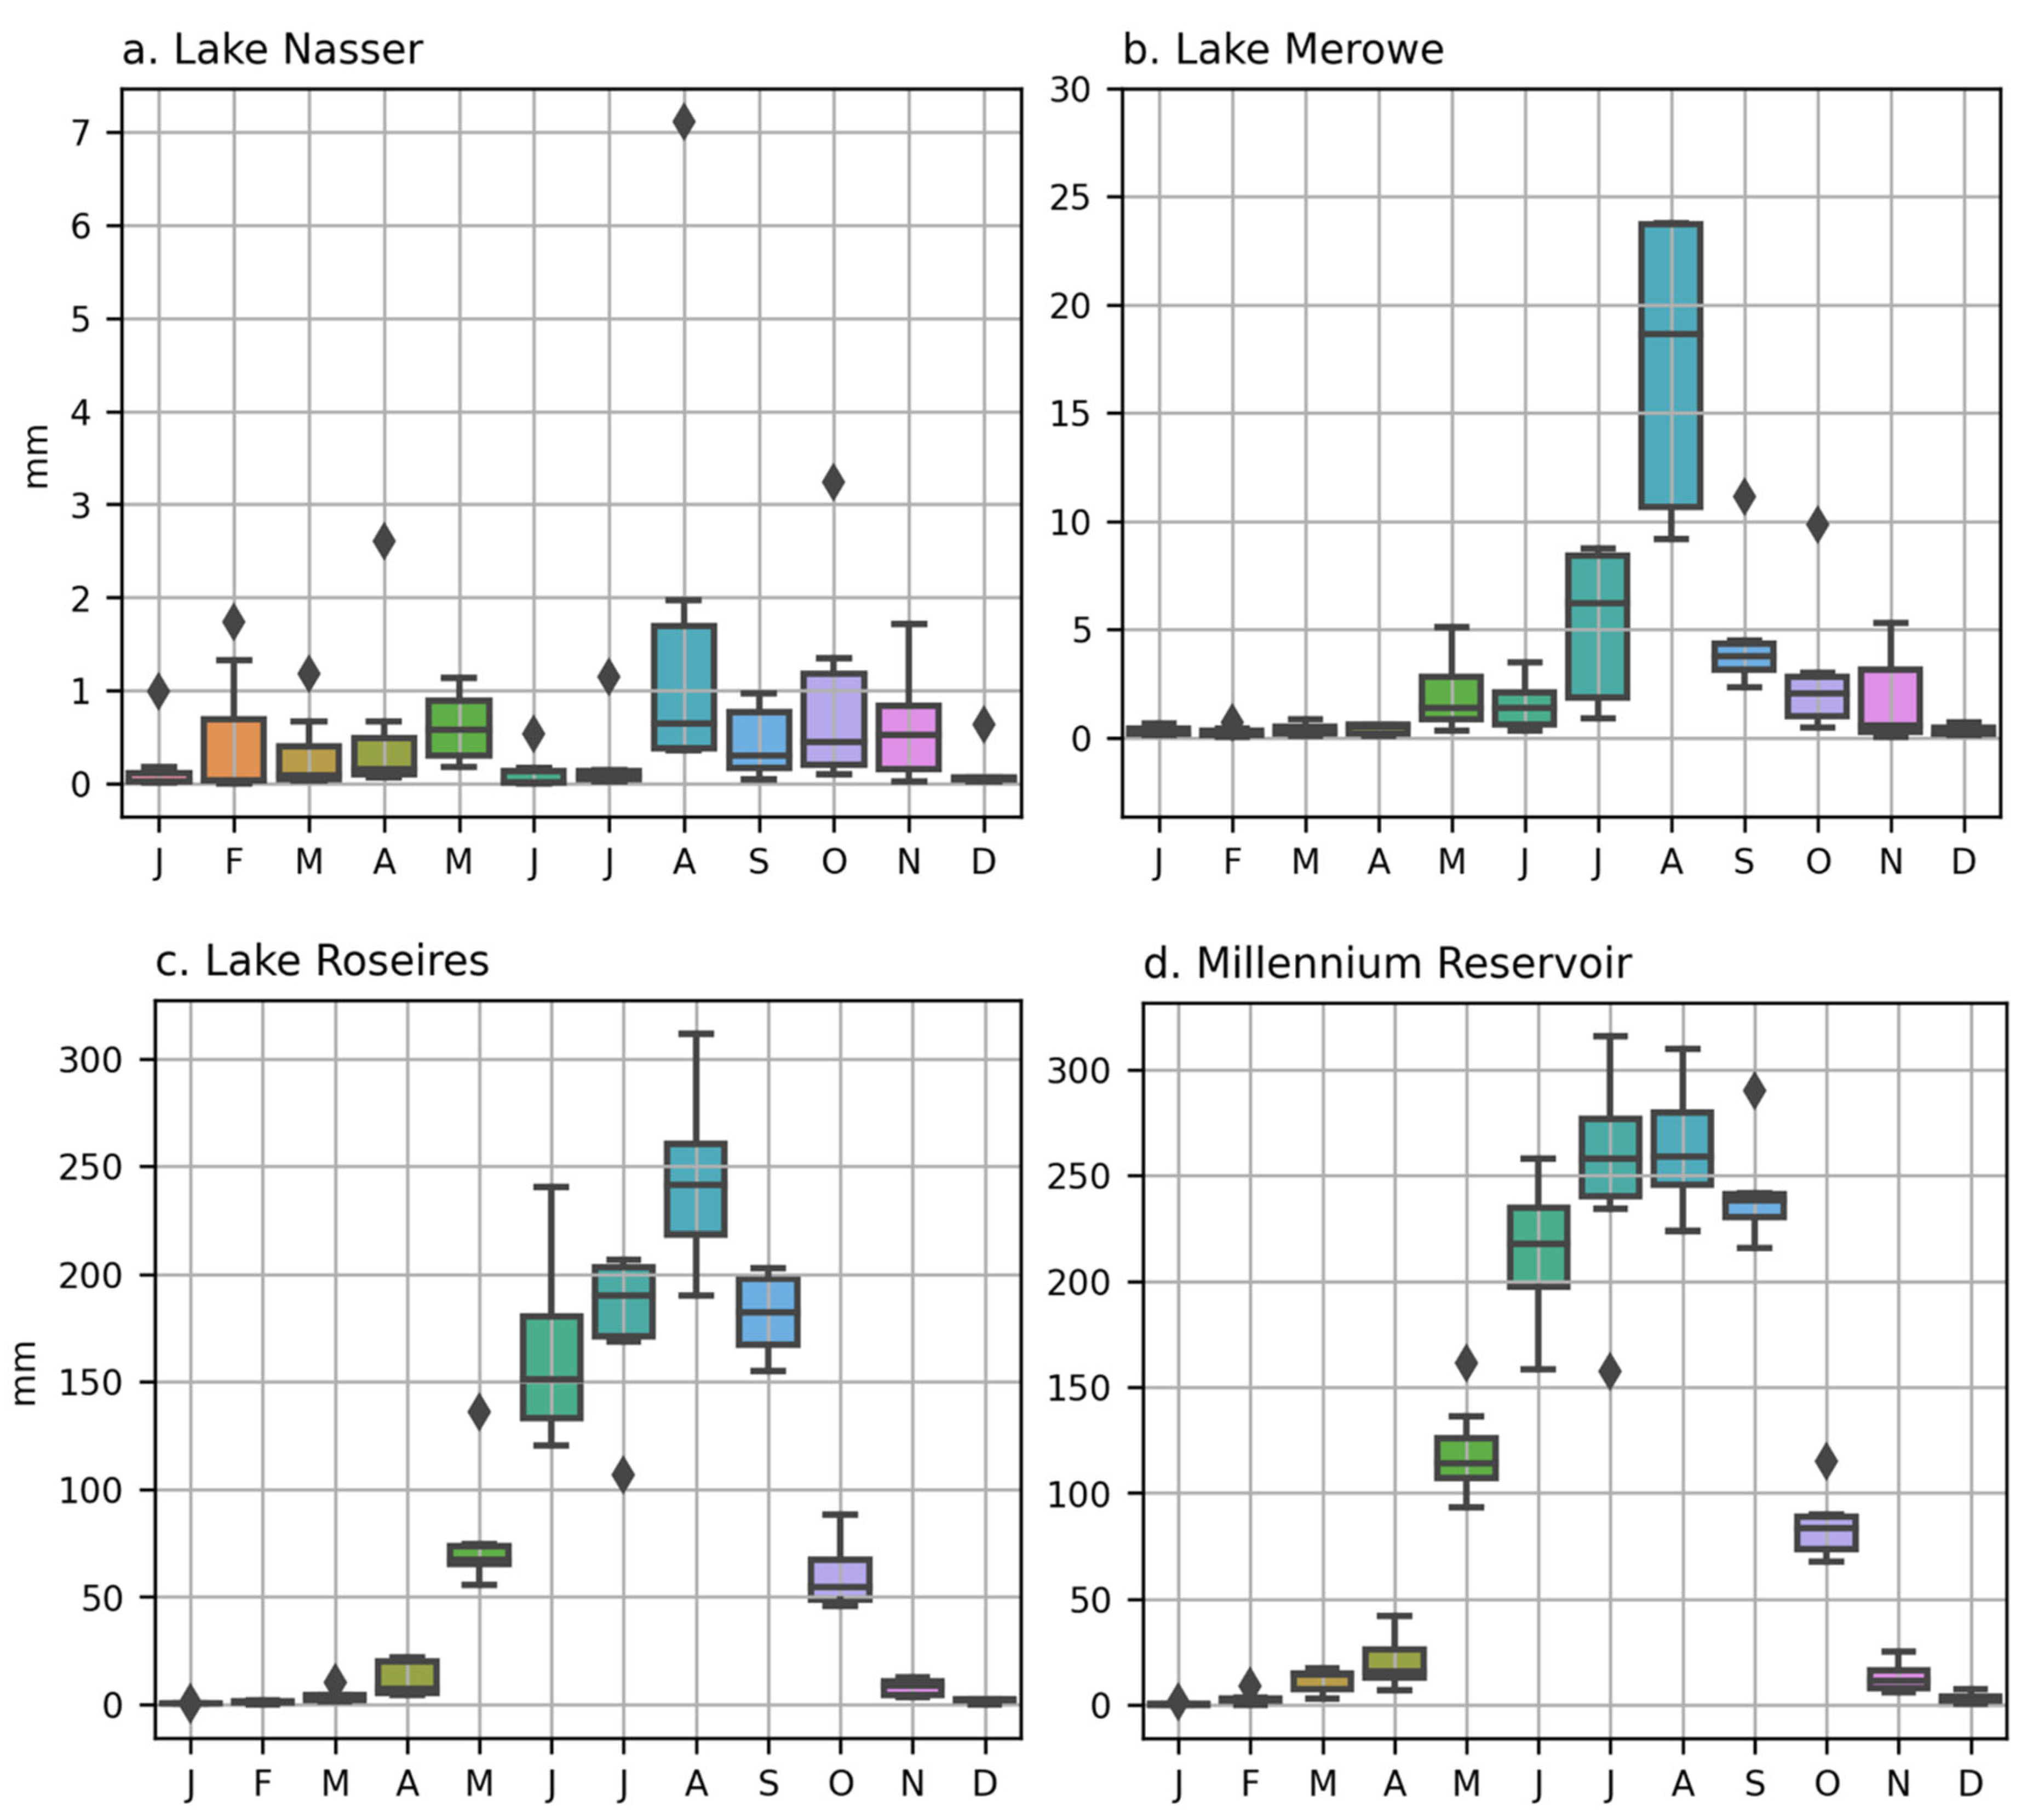
2.2.1. Global Precipitation Mission (GPM)
2.2.2. SENTINEL
2.2.3. SRTM
2.2.4. G-REALM
2.3. Methods
- Delineation of Reservoir Surface Area:
- b.
- SAR image processing:
- c.
- DEM-based water level estimation:
3. Results
3.1. Comparison of Sentinel-Derived Water Level with Altimetry-Based Water Level Estimates
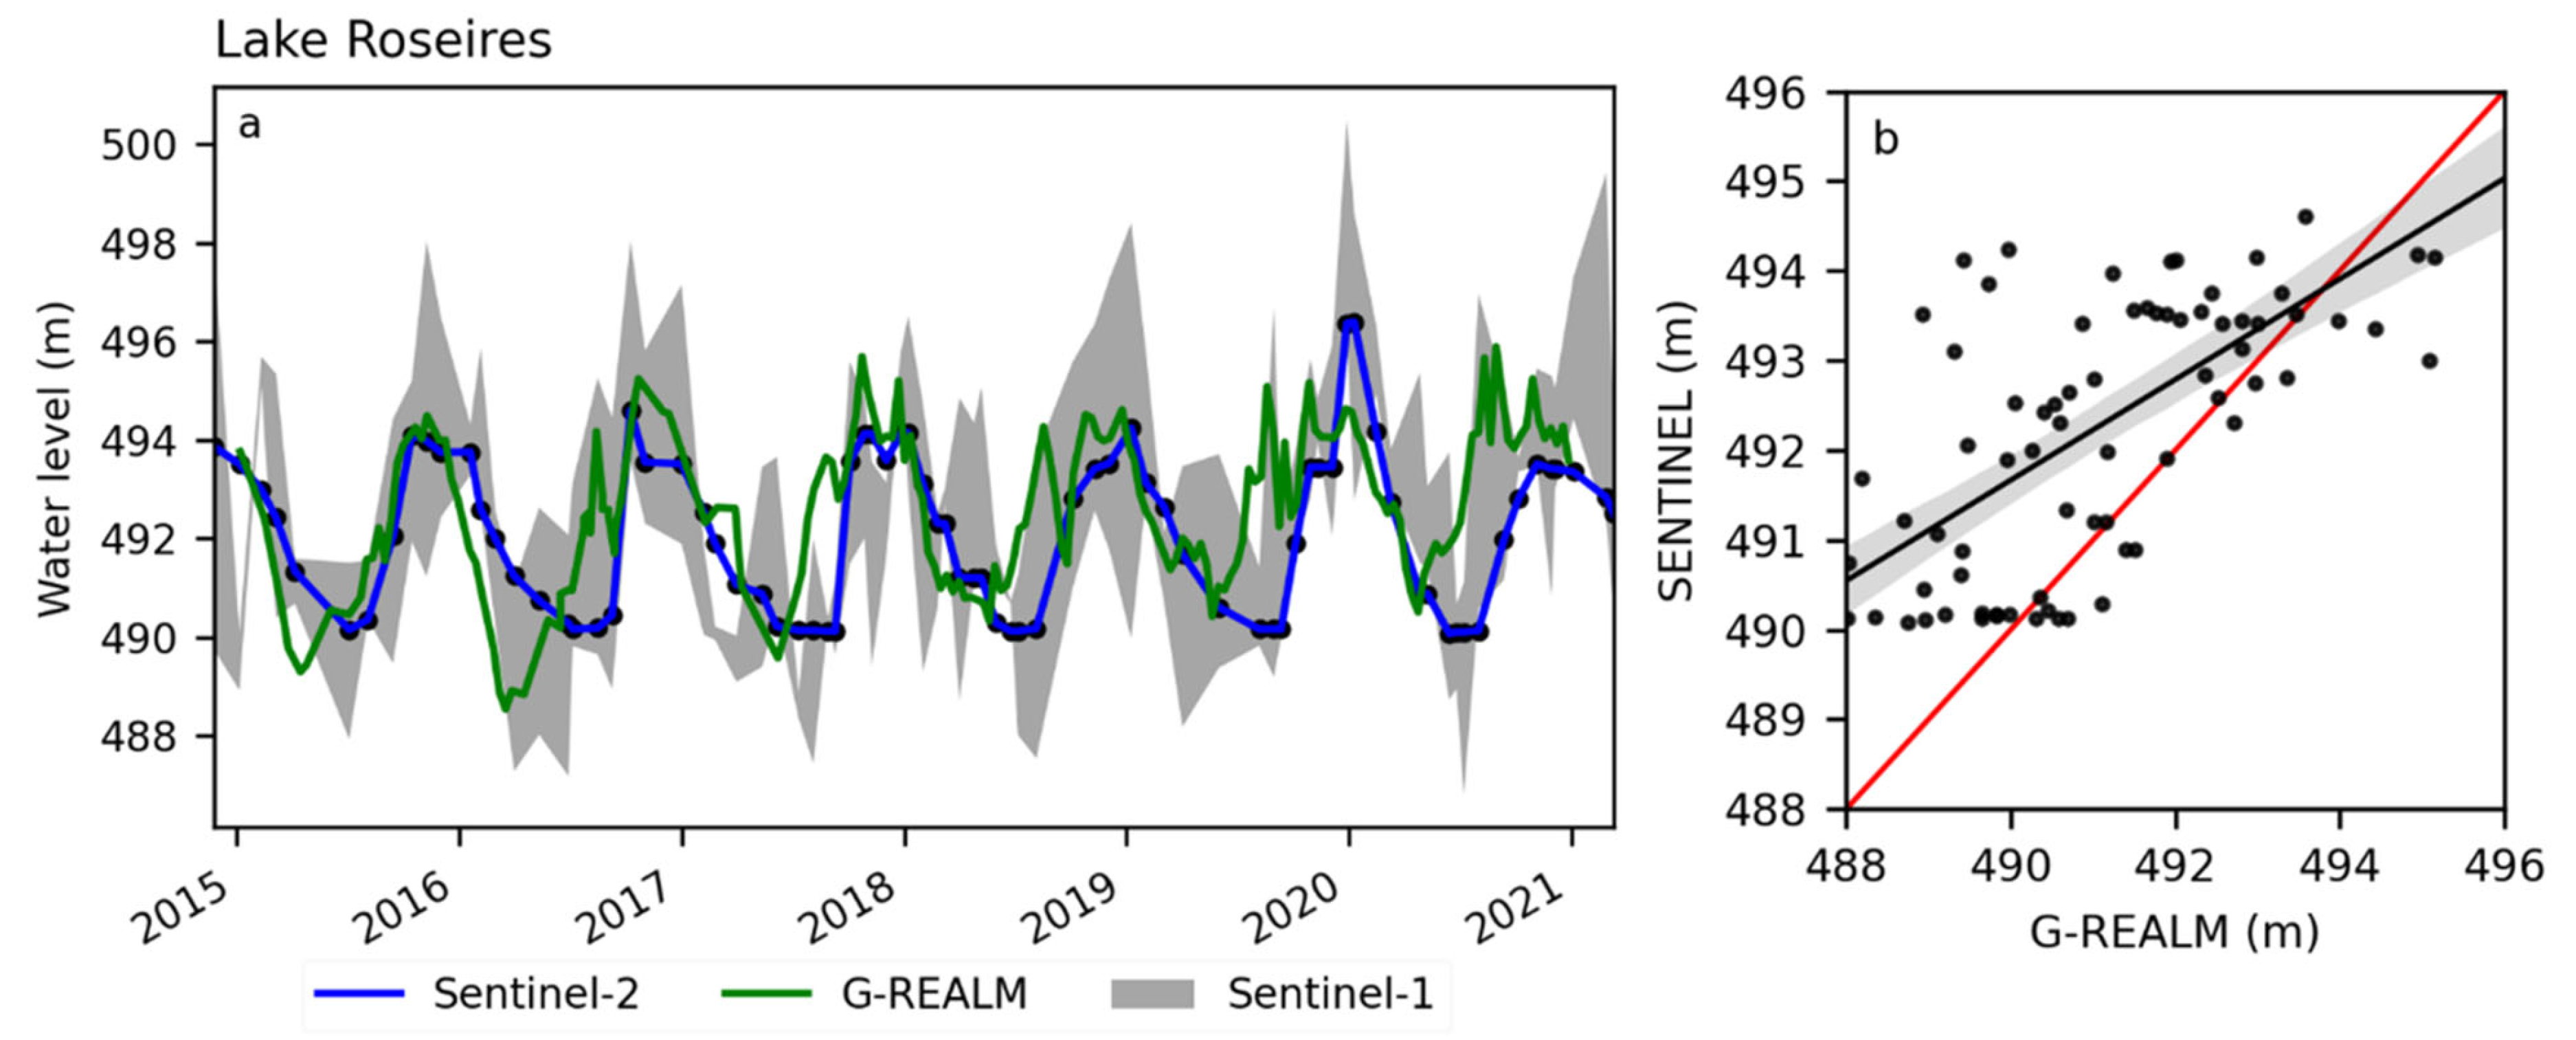
3.1.1. Lake Roseires
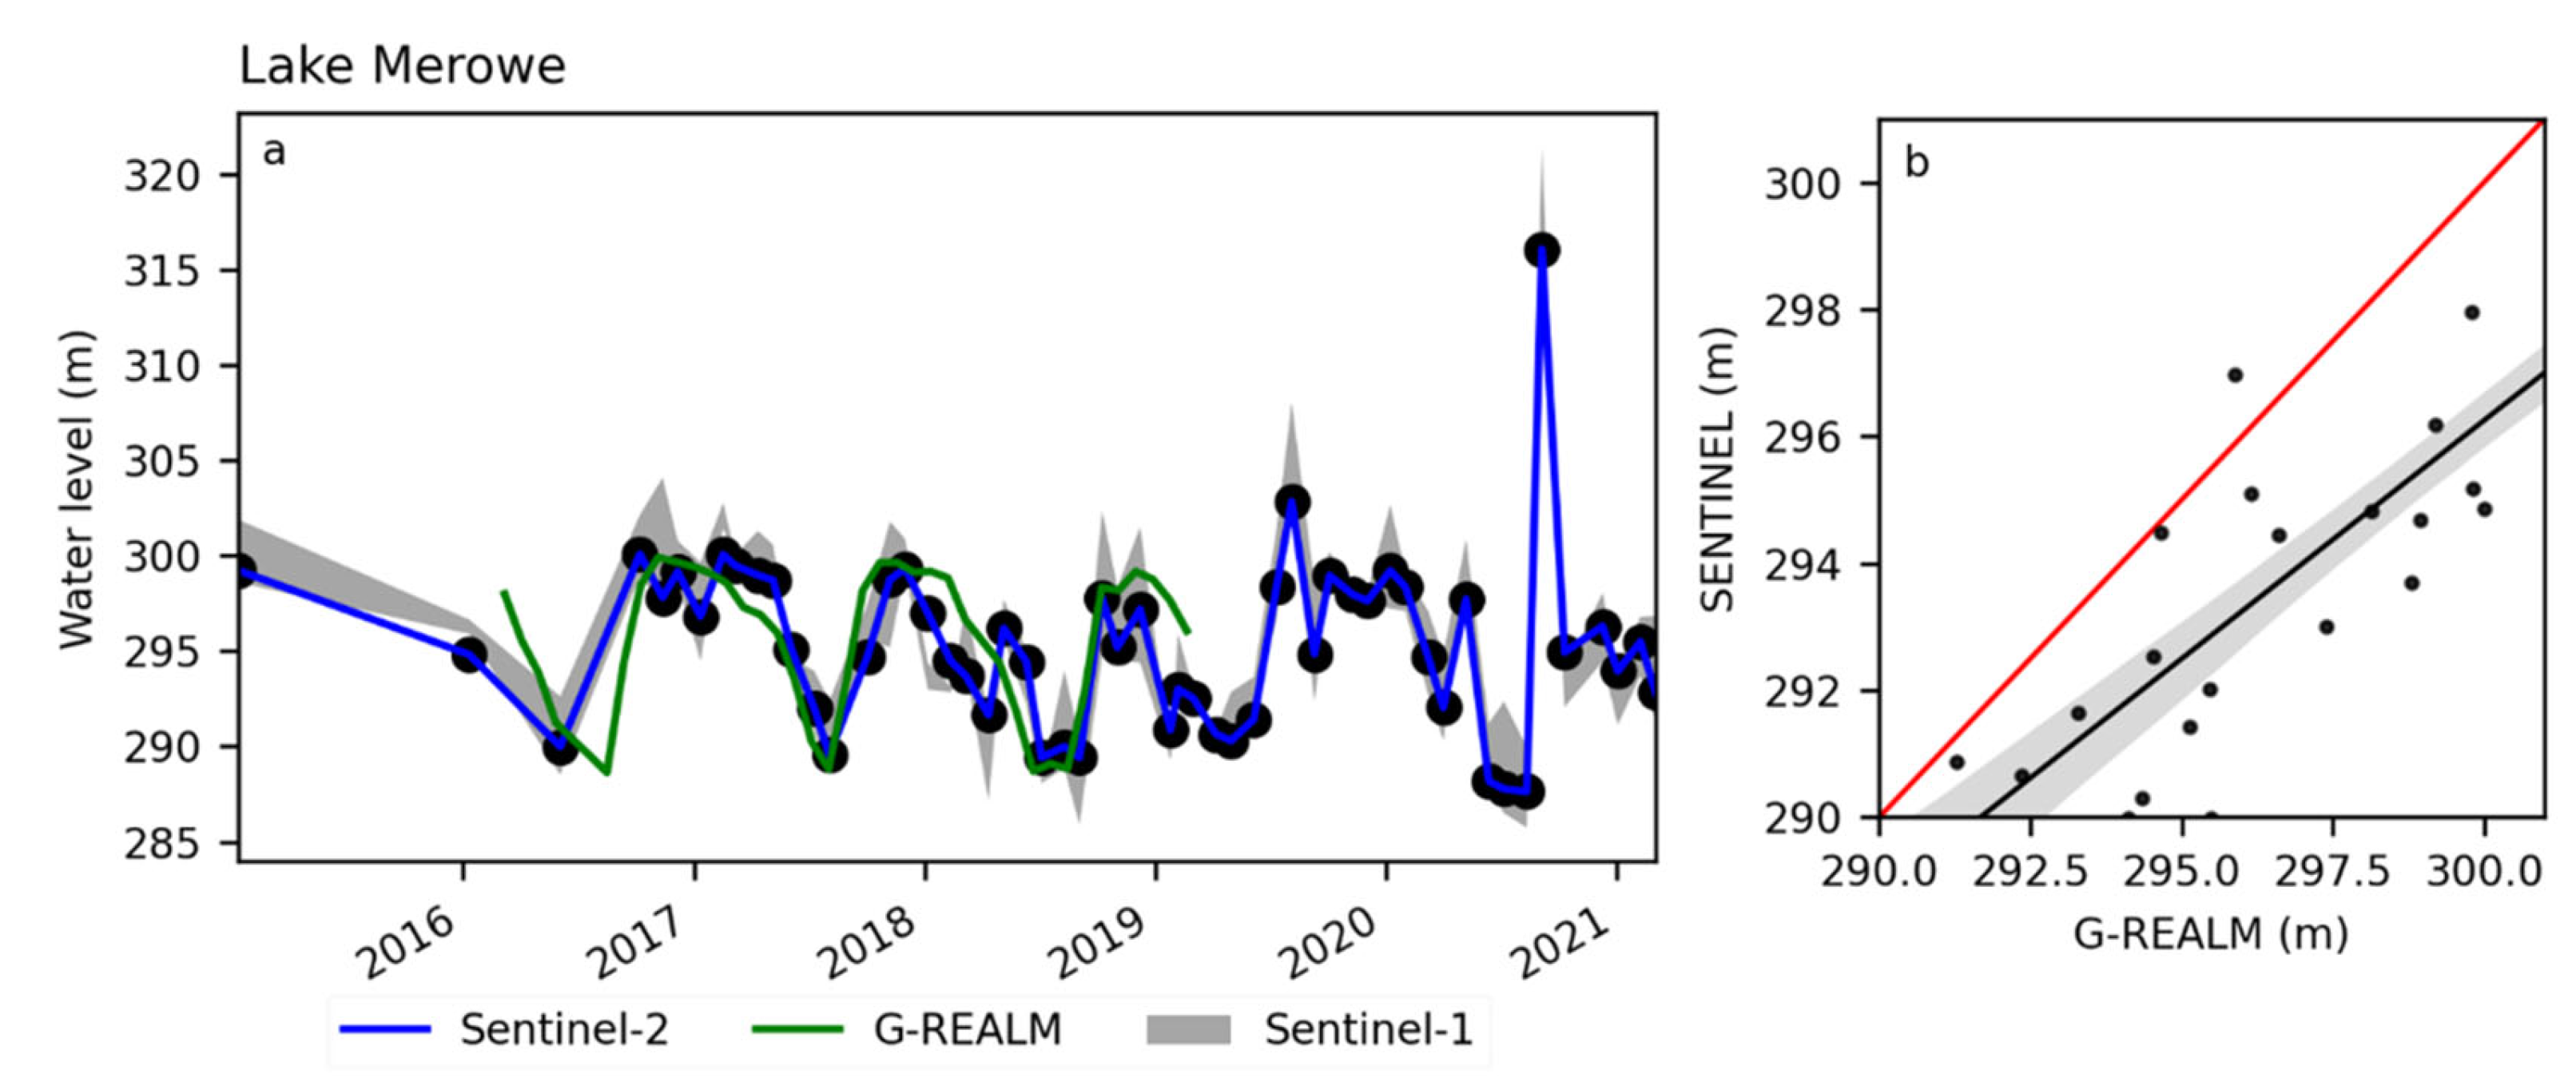
3.1.2. Lake Merowe
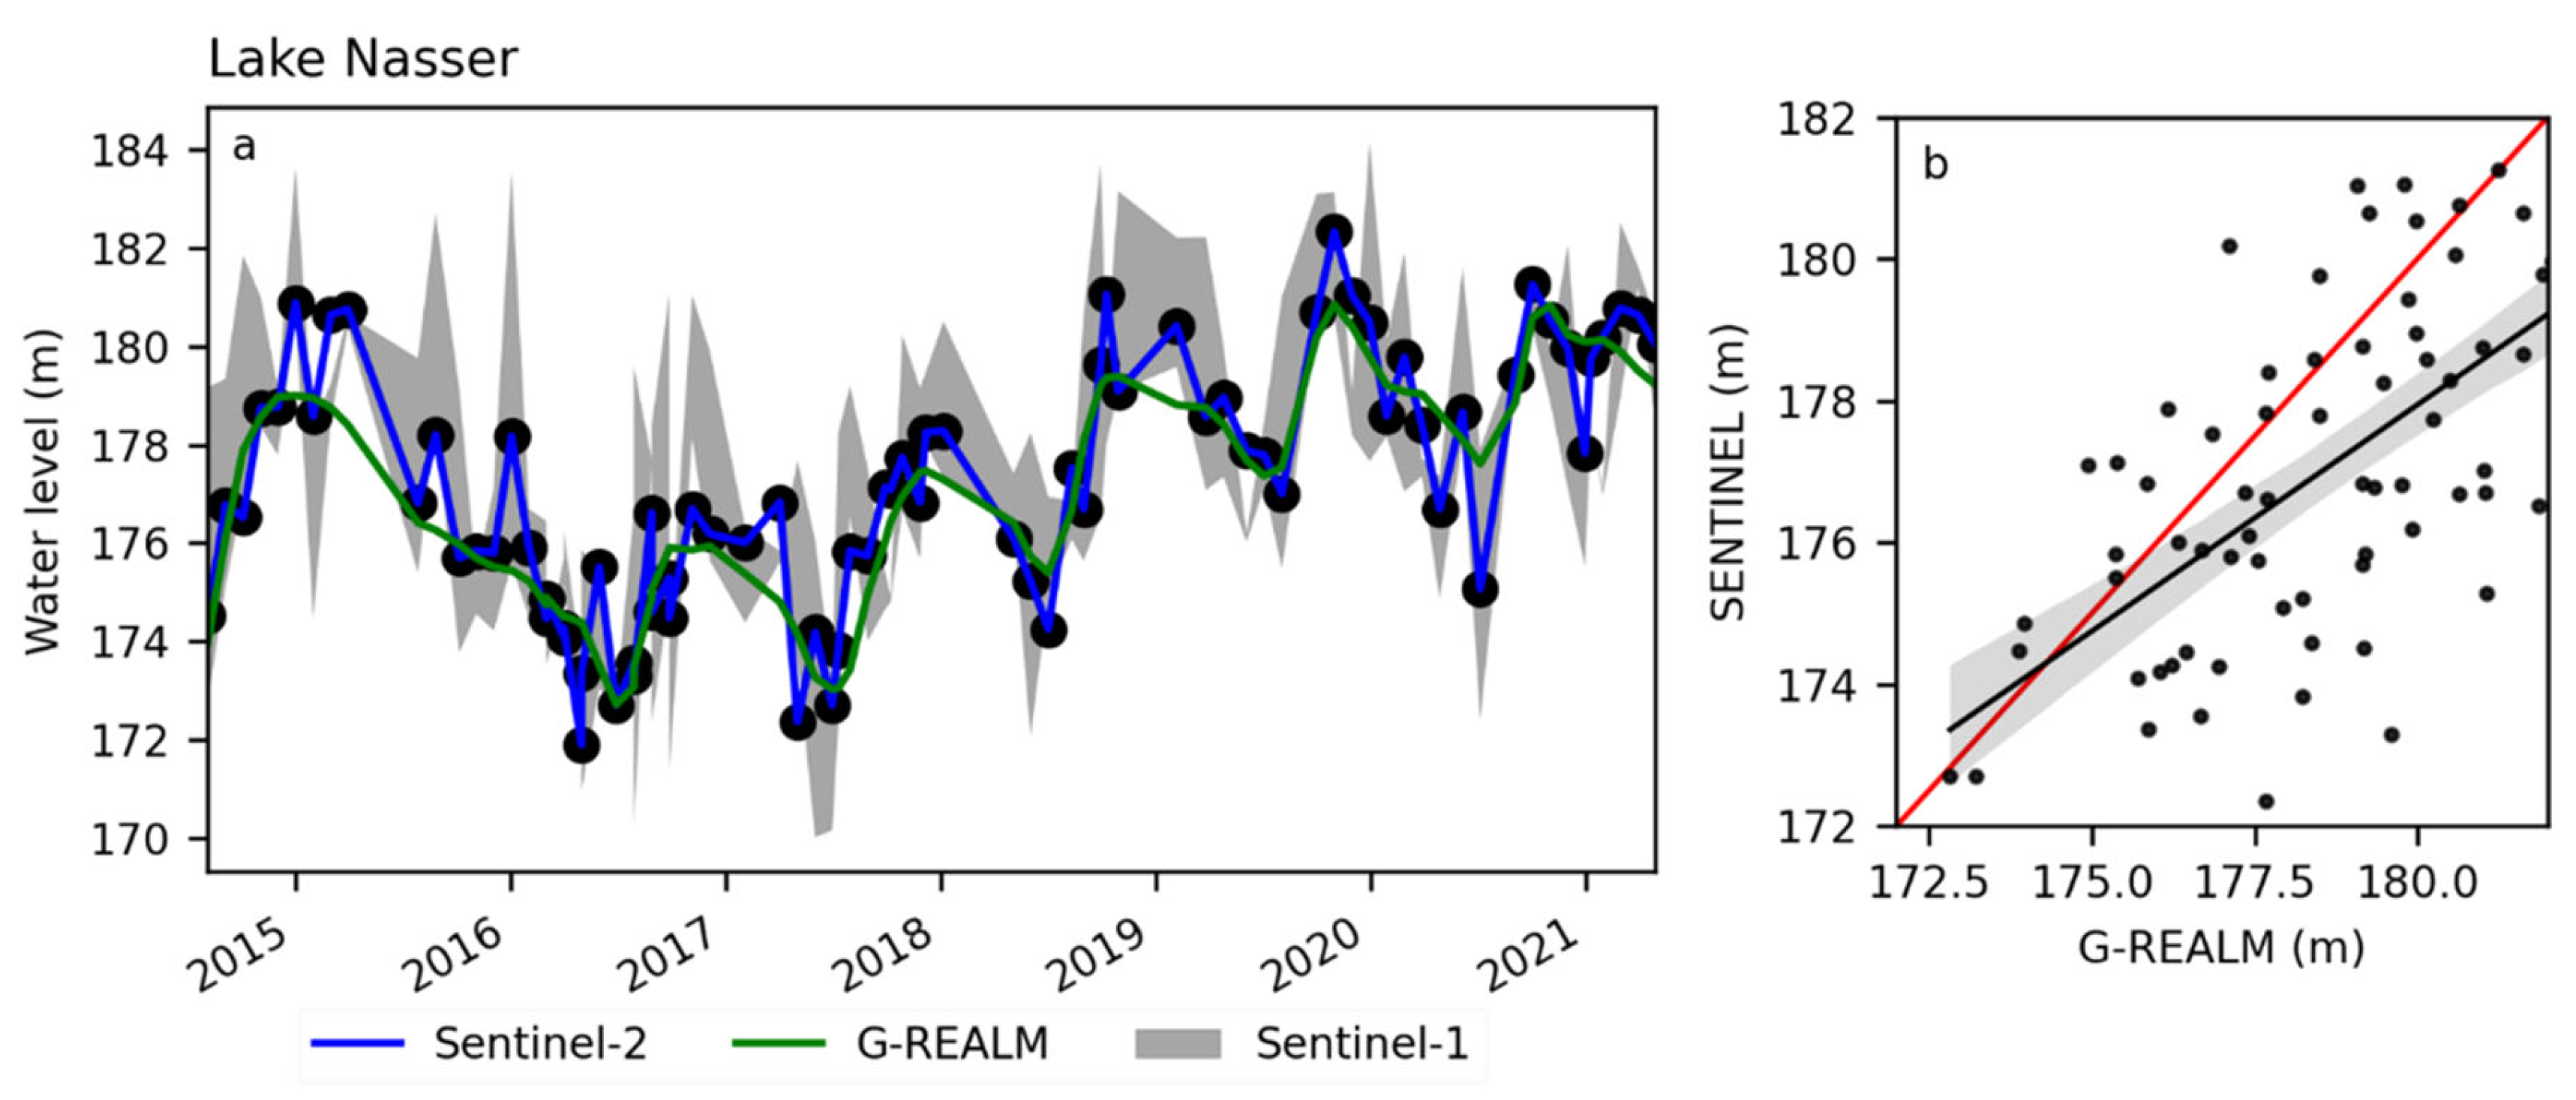
3.1.3. Lake Nasser
4. Discussion
5. Conclusions
Author Contributions
Funding
Data Availability Statement
Acknowledgments
Conflicts of Interest
References
- Alsdorf, D.E.; Rodríguez, E.; Lettenmaier, D.P. Measuring Surface Water from Space. Rev. Geophys. 2007, 45, 1–24. [Google Scholar] [CrossRef]
- Plengsaeng, B.; Wehn, U.; van der Zaag, P. Data-Sharing Bottlenecks in Transboundary Integrated Water Resources Management: A Case Study of the Mekong River Commission’s Procedures for Data Sharing in the Thai Context. Water Int. 2014, 39, 933–951. [Google Scholar] [CrossRef]
- Gerlak, A.K.; Lautze, J.; Giordano, M. Water Resources Data and Information Exchange in Transboundary Water Treaties. Int. Environ. Agreem. 2011, 11, 179–199. [Google Scholar] [CrossRef]
- Abd Ellah, R.G. Water Resources in Egypt and Their Challenges, Lake Nasser Case Study. Egypt. J. Aquat. Res. 2020, 46, 1–12. [Google Scholar] [CrossRef]
- Swain, A. The Nile River Basin Initiative: Too Many Cooks, Too Little Broth. SAIS Rev. 2002, 22, 293–308. [Google Scholar] [CrossRef]
- Taburet, N.; Zawadzki, L.; Vayre, M.; Blumstein, D.; le Gac, S.; Boy, F.; Raynal, M.; Labroue, S.; Crétaux, J.F.; Femenias, P. S3MPC: Improvement on Inland Water Tracking and Water Level Monitoring from the Oltc Onboard Sentinel-3 Altimeters. Remote Sens 2020, 12, 3055. [Google Scholar] [CrossRef]
- Ma, Y.; Xu, N.; Sun, J.; Wang, X.H.; Yang, F.; Li, S. Estimating Water Levels and Volumes of Lakes Dated Back to the 1980s Using Landsat Imagery and Photon-Counting Lidar Datasets. Remote Sens. Environ. 2019, 232, 111287. [Google Scholar] [CrossRef]
- Yuan, C.; Gong, P.; Liu, C.; Ke, C. Water-Volume Variations of Lake Hulun Estimated from Serial Jason Altimeters and Landsat TM/ETM+ Images from 2002 to 2017. Int. J. Remote Sens. 2019, 40, 670–692. [Google Scholar] [CrossRef]
- Shu, S.; Liu, H.; Beck, R.A.; Frappart, F.; Korhonen, J.; Xu, M.; Yang, B.; Hinkel, K.M.; Huang, Y.; Yu, B. Analysis of Sentinel-3 SAR Altimetry Waveform Retracking Algorithms for Deriving Temporally Consistent Water Levels over Ice-Covered Lakes. Remote Sens. Environ. 2020, 239, 111643. [Google Scholar] [CrossRef]
- Calmant, S.; Seyler, F.; Cretaux, J.F. Monitoring Continental Surface Waters by Satellite Altimetry. Surv. Geophys. 2008, 29, 247–269. [Google Scholar] [CrossRef]
- Sharma, K.D.; Singh, S.; Singh, N.; Kalla, A.K. Rôle de La Télédetection Par Satellite Dans La Surveillance Des Ressources En Eau de Surface Dans Un Milieu Aride. Hydrol. Sci. J. 1989, 34, 531–537. [Google Scholar] [CrossRef]
- Sheffield, J.; Wood, E.F.; Pan, M.; Beck, H.; Coccia, G.; Serrat-Capdevila, A.; Verbist, K. Satellite Remote Sensing for Water Resources Management: Potential for Supporting Sustainable Development in Data-Poor Regions. Water Resour. Res. 2018, 54, 9724–9758. [Google Scholar] [CrossRef]
- Crétaux, J.F.; Birkett, C. Lake Studies from Satellite Radar Altimetry. Comptes Rendus Geosci. 2006, 338, 1098–1112. [Google Scholar] [CrossRef]
- Zhang, J.; Xu, K.; Yang, Y.; Qi, L.; Hayashi, S.; Watanabe, M. Measuring Water Storage Fluctuations in Lake Dongting, China, by Topex/Poseidon Satellite Altimetry. Environ. Monit. Assess. 2006, 115, 23–37. [Google Scholar] [CrossRef] [PubMed]
- Kansara, P.; Li, W.; El-Askary, H.; Lakshmi, V.; Piechota, T.; Struppa, D.; Sayed, M.A. An Assessment of the Filling Process of the Grand Ethiopian Renaissance Dam and Its Impact on the Downstream Countries. Remote Sens. 2021, 13, 711. [Google Scholar] [CrossRef]
- Sulistioadi, Y.B.; Tseng, K.H.; Shum, C.K.; Hidayat, H.; Sumaryono, M.; Suhardiman, A.; Setiawan, F.; Sunarso, S. Satellite Radar Altimetry for Monitoring Small Rivers and Lakes in Indonesia. Hydrol. Earth Syst. Sci. 2015, 19, 341–359. [Google Scholar] [CrossRef]
- Schwatke, C.; Dettmering, D.; Seitz, F. Volume Variations of Small Inland Water Bodies from a Combination of Satellite Altimetry and Optical Imagery. Remote Sens. 2020, 12, 1606. [Google Scholar] [CrossRef]
- Troitskaya, Y.I.; Rybushkina, G.v.; Soustova, I.A.; Balandina, G.N.; Lebedev, S.A.; Kostyanoi, A.G.; Panyutin, A.A.; Filina, L.v. Satellite Altimetry of Inland Water Bodies. Water Resour. 2012, 39, 184–199. [Google Scholar] [CrossRef]
- Dettmering, D.; Ellenbeck, L.; Scherer, D.; Schwatke, C.; Niemann, C. Potential and Limitations of Satellite Altimetry Constellations for Monitoring Surface Water Storage Changes—A Case Study in the Mississippi Basin. Remote Sens. 2020, 12, 3320. [Google Scholar] [CrossRef]
- Li, Y.; Dang, B.; Zhang, Y.; Du, Z. Water Body Classification from High-Resolution Optical Remote Sensing Imagery: Achievements and Perspectives. ISPRS J. Photogramm. Remote Sens. 2022, 187, 306–327. [Google Scholar] [CrossRef]
- Huang, C.; Chen, Y.; Zhang, S.; Wu, J. Detecting, Extracting, and Monitoring Surface Water From Space Using Optical Sensors: A Review. Rev. Geophys. 2018, 56, 333–360. [Google Scholar] [CrossRef]
- Bioresita, F.; Puissant, A.; Stumpf, A.; Malet, J.P. A Method for Automatic and Rapid Mapping of Water Surfaces from Sentinel-1 Imagery. Remote Sens. 2018, 10, 217. [Google Scholar] [CrossRef]
- Schmitt, M. Potential of Large-Scale Inland Water Body Mapping from Sentinel-1/2 Data on the Example of Bavaria’s Lakes and Rivers. PFG J. Photogramm. Remote Sens. Geoinf. Sci. 2020, 88, 271–289. [Google Scholar] [CrossRef]
- Biancamaria, S.; Lettenmaier, D.P.; Pavelsky, T.M. The SWOT Mission and Its Capabilities for Land Hydrology; Springer: Cham, Switzerland, 2016; Volume 37, ISBN 9783319324494. [Google Scholar]
- Ebaid, H.M.I.; Ismail, S.S. Lake Nasser Evaporation Reduction Study. J. Adv. Res. 2010, 1, 315–322. [Google Scholar] [CrossRef]
- Mobasher, A.M.A. Adaptive Reservoir Operation Strategies under Changing Boundary Conditions—The Case of Aswan High Dam Reservoir. Ph.D. Thesis, Darmstadt University of Technology, Darmstadt, Germany, 2010. [Google Scholar]
- Kleinitz, C.; Näser, C. The Loss of Innocence: Political and Ethical Dimensions of the Merowe Dam Archaeological Salvage Project at the Fourth Nile Cataract (Sudan). Conserv. Manag. Archaeol. Sites 2011, 13, 253–280. [Google Scholar] [CrossRef]
- Mulat, A.G.; Moges, S.A.; Moges, M.A. Evaluation of Multi-Storage Hydropower Development in the Upper Blue Nile River (Ethiopia): Regional Perspective. J. Hydrol. Reg. Stud. 2018, 16, 1–14. [Google Scholar] [CrossRef]
- Alrajoula, M.T.; Al Zayed, I.S.; Elagib, N.A.; Hamdi, M.R. Hydrological, Socio-Economic and Reservoir Alterations of Er Roseires Dam in Sudan. Sci. Total Environ. 2016, 566–567, 938–948. [Google Scholar] [CrossRef]
- Huffman, G.J.; Bolvin, D.T.; Nelkin, E.J.; Tan, J. IMERG Technical Documentation. Available online: https://gpm.nasa.gov/sites/default/files/document_files/IMERG_doc_190909.pdf (accessed on 25 January 2020).
- Copernicus Sentinel Data Accessed from ESA Open Hub. Available online: https://scihub.copernicus.eu/dhus/ (accessed on 17 April 2022).
- Farr, T.G.; Rosen, P.A.; Caro, E.; Crippen, R.; Duren, R.; Hensley, S.; Kobrick, M.; Paller, M.; Rodriguez, E.; Roth, L.; et al. The Shuttle Radar Topography Mission. Rev. Geophys. 2007, 45, RG2004. [Google Scholar] [CrossRef]
- Tortini, R.; Noujdina, N.; Yeo, S.; Ricko, M.; Birkett, C.M.; Khandelwal, A.; Kumar, V.; Marlier, M.E.; Lettenmaier, D.P. Satellite-Based Remote Sensing Data Set of Global Surface Water Storage Change from 1992 to 2018. Earth Syst. Sci. Data 2020, 12, 1141–1151. [Google Scholar] [CrossRef]
- Gourgouletis, N.; Bariamis, G.; Anagnostou, M.N.; Baltas, E. Estimating Reservoir Storage Variations by Combining Sentinel-2 and 3 Measurements in the Yliki Reservoir, Greece. Remote Sens. 2022, 14, 1860. [Google Scholar] [CrossRef]
- Filipponi, F. Sentinel-1 GRD Preprocessing Workflow. Proceedings 2019, 18, 11. [Google Scholar]


| Reservoir Name | Year | Sentinel-1 | Altimetry | ||
|---|---|---|---|---|---|
| No. of Images Available | Average Water Level (m) | No. of Data Points Available | Average Water Level (m) | ||
| Lake Roseires | 2014 | 1 | 487 | 27 | 488 |
| 2015 | 16 | 484 | 29 | 489 | |
| 2016 | 14 | 485 | 28 | 489 | |
| 2017 | 15 | 484 | 30 | 490 | |
| 2018 | 16 | 484 | 28 | 490 | |
| 2019 | 17 | 483 | 29 | 489 | |
| 2020 | 16 | 487 | 27 | 490 | |
| 2021 | 15 | 485 | 28 | 488 | |
| Reservoir Name | Year | Sentinel-1 | Altimetry | ||
|---|---|---|---|---|---|
| No. of Images Available | Average Water Level (m) | No. of Data Points Available | Average Water Level (m) | ||
| Lake Merowe | 2014 | - | - | - | - |
| 2015 | 1 | 285 | - | - | |
| 2016 | 5 | 284 | 11 | 291 | |
| 2017 | 11 | 283 | 24 | 295 | |
| 2018 | 13 | 282 | 27 | 293 | |
| 2019 | 10 | 281 | 2 | 296 | |
| 2020 | 8 | 282 | - | - | |
| 2021 | 2 | 284 | 1 | 293 | |
| Reservoir Name | Year | Sentinel-1 | Altimetry | ||
|---|---|---|---|---|---|
| No. of Images Available | Average Water Level (m) | No. of Data Points Available | Average Water Level (m) | ||
| Lake Nasser | 2014 | 5 | 177 | 28 | 178 |
| 2015 | 14 | 176 | 27 | 176 | |
| 2016 | 16 | 174 | 29 | 175 | |
| 2017 | 15 | 173 | 30 | 174 | |
| 2018 | 17 | 175 | 28 | 175 | |
| 2019 | 16 | 178 | 27 | 178 | |
| 2020 | 16 | 179 | 28 | 180 | |
| 2021 | 16 | 179 | 30 | 181 | |
Publisher’s Note: MDPI stays neutral with regard to jurisdictional claims in published maps and institutional affiliations. |
© 2022 by the authors. Licensee MDPI, Basel, Switzerland. This article is an open access article distributed under the terms and conditions of the Creative Commons Attribution (CC BY) license (https://creativecommons.org/licenses/by/4.0/).
Share and Cite
Kansara, P.; Lakshmi, V. Water Levels in the Major Reservoirs of the Nile River Basin—A Comparison of SENTINEL with Satellite Altimetry Data. Remote Sens. 2022, 14, 4667. https://doi.org/10.3390/rs14184667
Kansara P, Lakshmi V. Water Levels in the Major Reservoirs of the Nile River Basin—A Comparison of SENTINEL with Satellite Altimetry Data. Remote Sensing. 2022; 14(18):4667. https://doi.org/10.3390/rs14184667
Chicago/Turabian StyleKansara, Prakrut, and Venkataraman Lakshmi. 2022. "Water Levels in the Major Reservoirs of the Nile River Basin—A Comparison of SENTINEL with Satellite Altimetry Data" Remote Sensing 14, no. 18: 4667. https://doi.org/10.3390/rs14184667