Article

Automatic Matching of Multimodal Remote Sensing Images via Learned Unstructured Road Feature

1
National Key Laboratory of Science and Technology on Vessel Integrated Power System, Naval University of Engineering, Wuhan 430033, China
2
School of Artificial Intelligence and Automation, Huazhong University of Science and Technology, Wuhan 430074, China
*
Author to whom correspondence should be addressed.
Remote Sens. 2022, 14(18), 4595; https://doi.org/10.3390/rs14184595
Submission received: 25 July 2022 / Revised: 24 August 2022 / Accepted: 12 September 2022 / Published: 14 September 2022

Abstract

:
Automatic matching of multimodal remote sensing images remains a vital yet challenging task, particularly for remote sensing and computer vision applications. Most traditional methods mainly focus on key point detection and description of the original image, thus ignoring the deep semantic feature information such as semantic road features, with the result that the traditional method can not effectively resist nonlinear grayscale distortion, and has low matching efficiency and poor accuracy. Motivated by this, this paper proposes a novel automatic matching method named LURF via learned unstructured road features for the multimodal images. There are four main contributions in LURF. To begin with, the semantic road features were extracted from multimodal images based on segmentation model CRESIv2. Next, based on semantic road features, a stable and reliable intersection point detector has been proposed to detect unstructured key points. Moreover, a local entropy descriptor has been designed to describe key points with the local skeleton feature. Finally, a global optimization strategy is adopted to achieve the correct matching. The extensive experimental results demonstrate that the proposed LURF outperforms other state-of-the-art methods in terms of both accuracy and efficiency on different multimodal image data sets.

Graphical Abstract

1. Introduction

The multimodal remote sensing image matching is a critical and challenging prerequisite in computer vision and remote sensing applications [1] such as UAV positioning [2], image mosaic, image fusion [3,4], object detection, and environment surveillance. The primary goal of multimodal remote sensing image matching is the process to obtain the accurate correspondences between the reference image and sensed image with overlapping regions, and to geometrically align these images. However, it is still an ill-posed problem that suffers from many uncertainties due to the differences in sensor devices, viewpoints, and imaging conditions [5]. Thus, for the same scene, the multimodal remote sensing images have quite different expressions, especially nonlinear radiation distortions (NRD), and this issue seriously affects image matching reliability and accuracy.
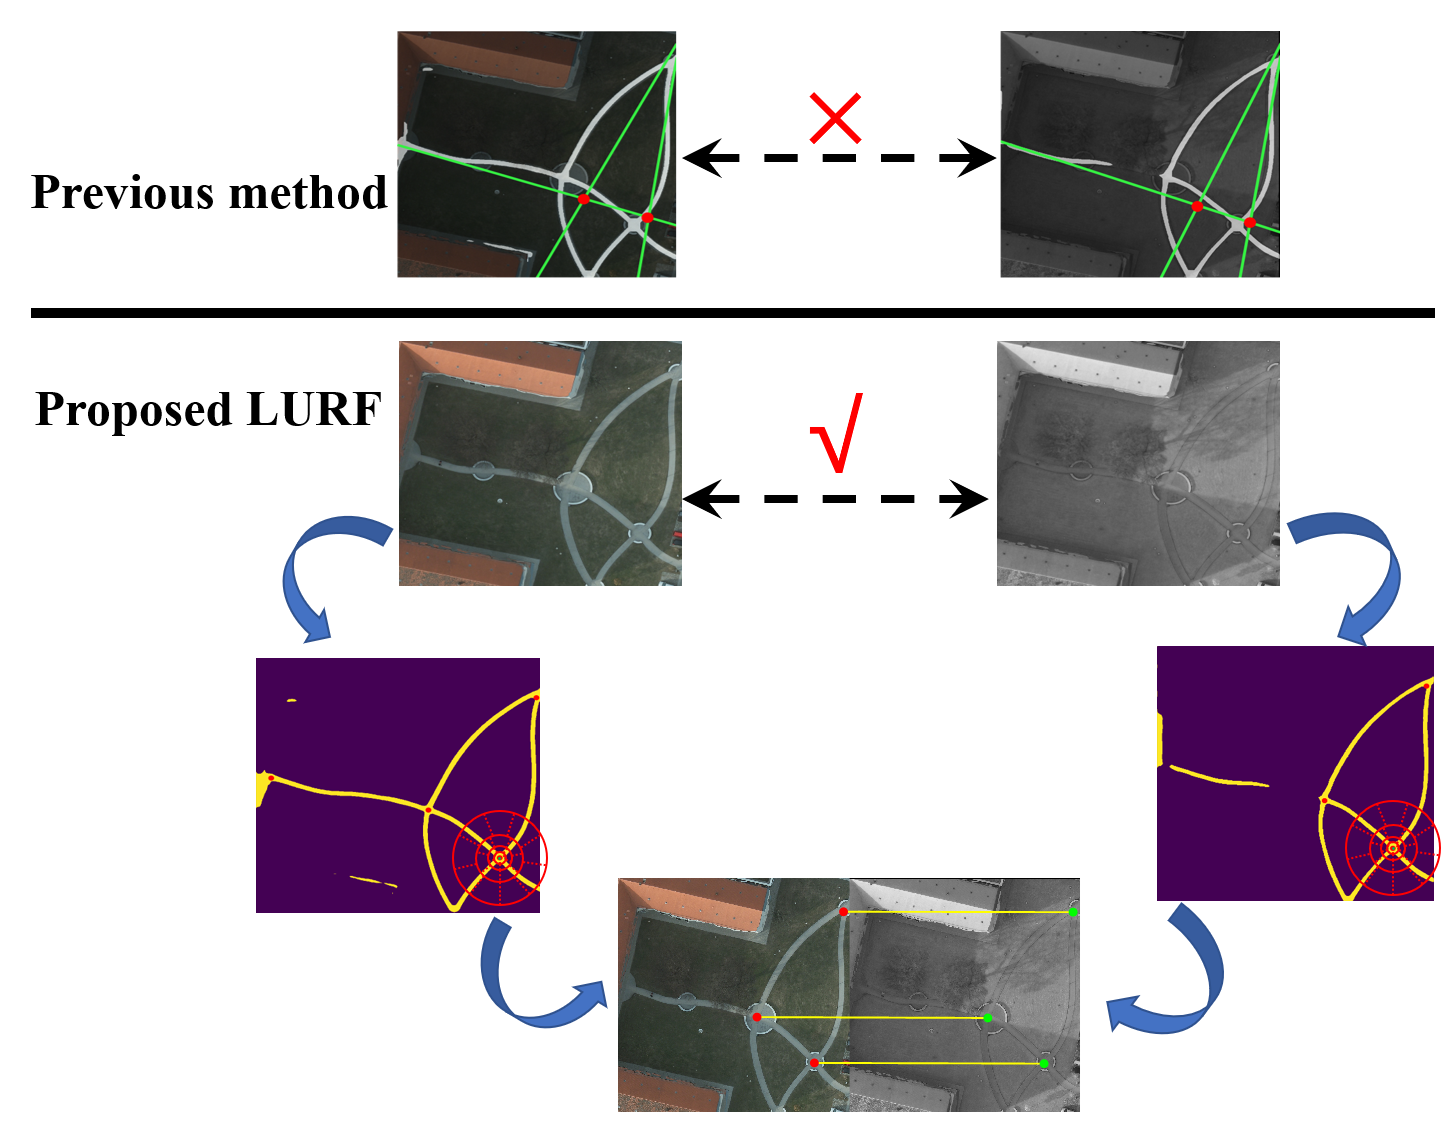
To alleviate the difficulty mentioned above, in our previous work, the triangular features have been proposed [6] for multimodal urban remote sensing image matching and has good robustness and efficienc based on semantic road features. On the contrary, its application limitations are obvious, which are embodied in the following aspects:
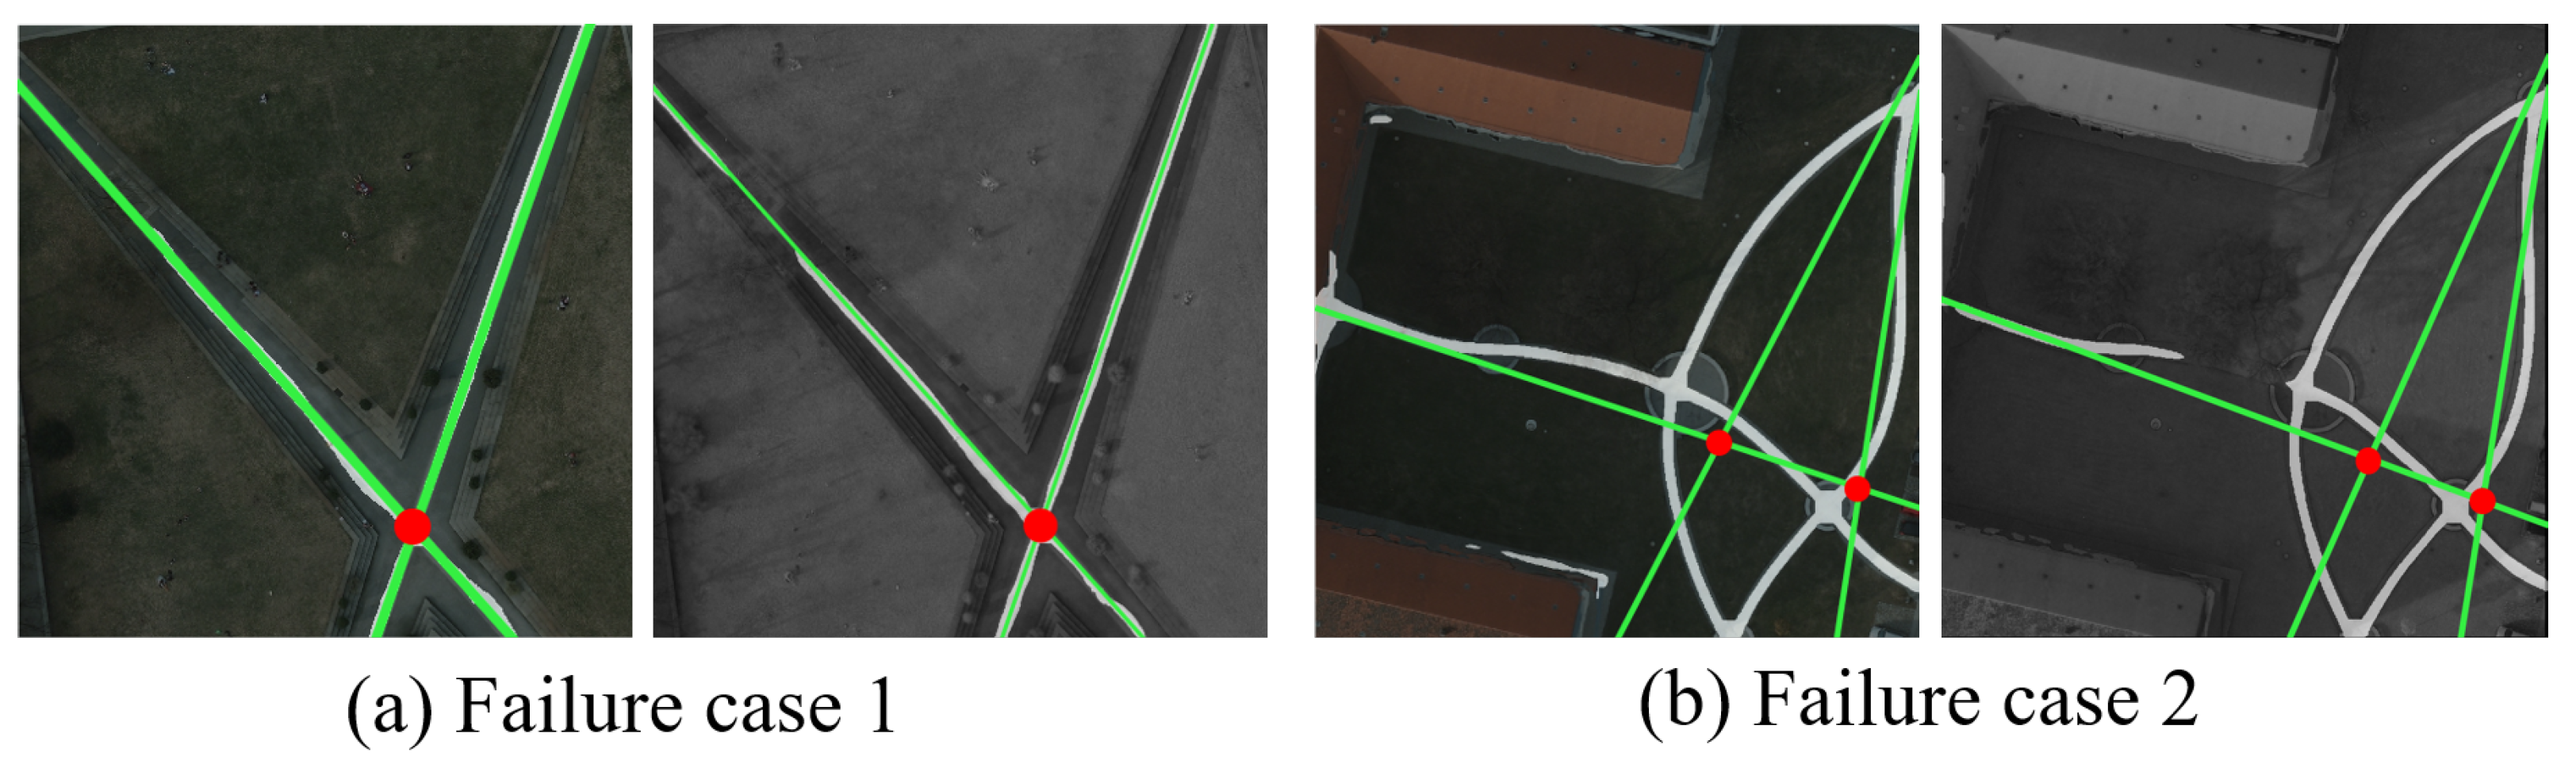
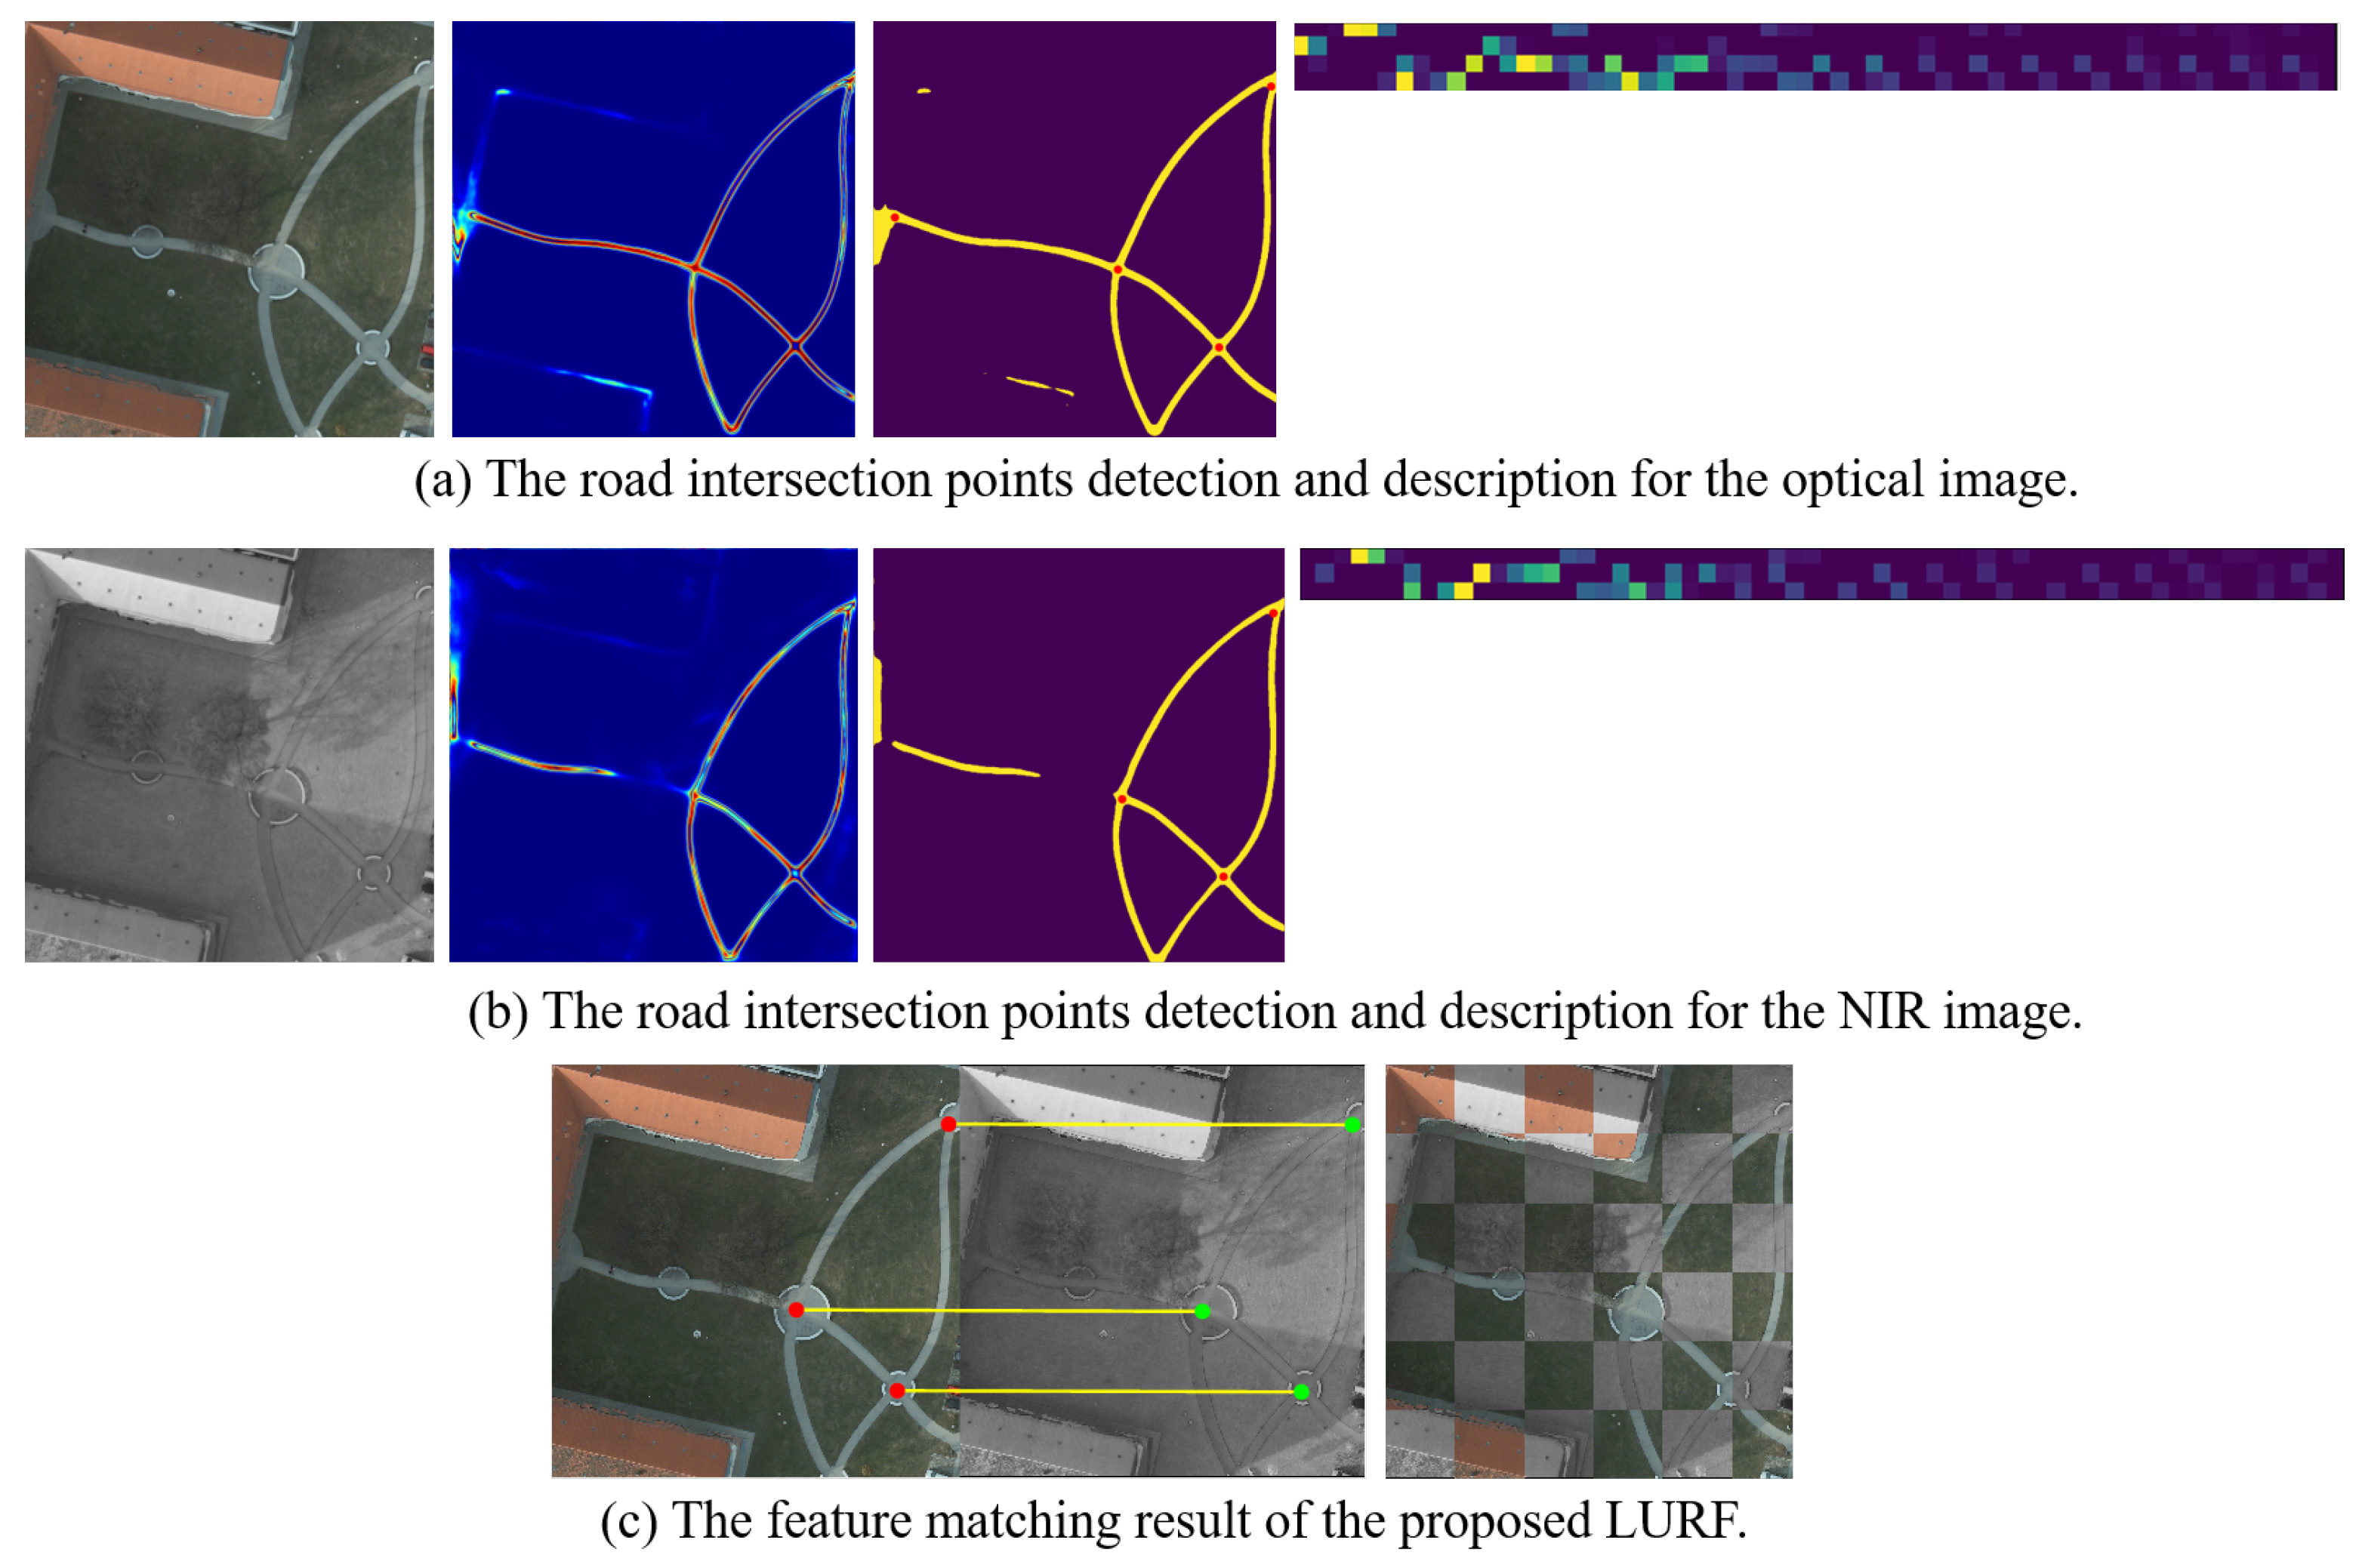
(1) The triangular feature construction and matching needs more than three road intersection points. When the number of detected road intersection points is only one or two, the method cannot construct and describe the feature information, resulting in a complete matching failure as seen in Figure 1a.
(2) When fitting the straight-line features of semantic road information, the performance of curve fitting is poor which directly affects the matching success and accuracy as seen in Figure 1b.
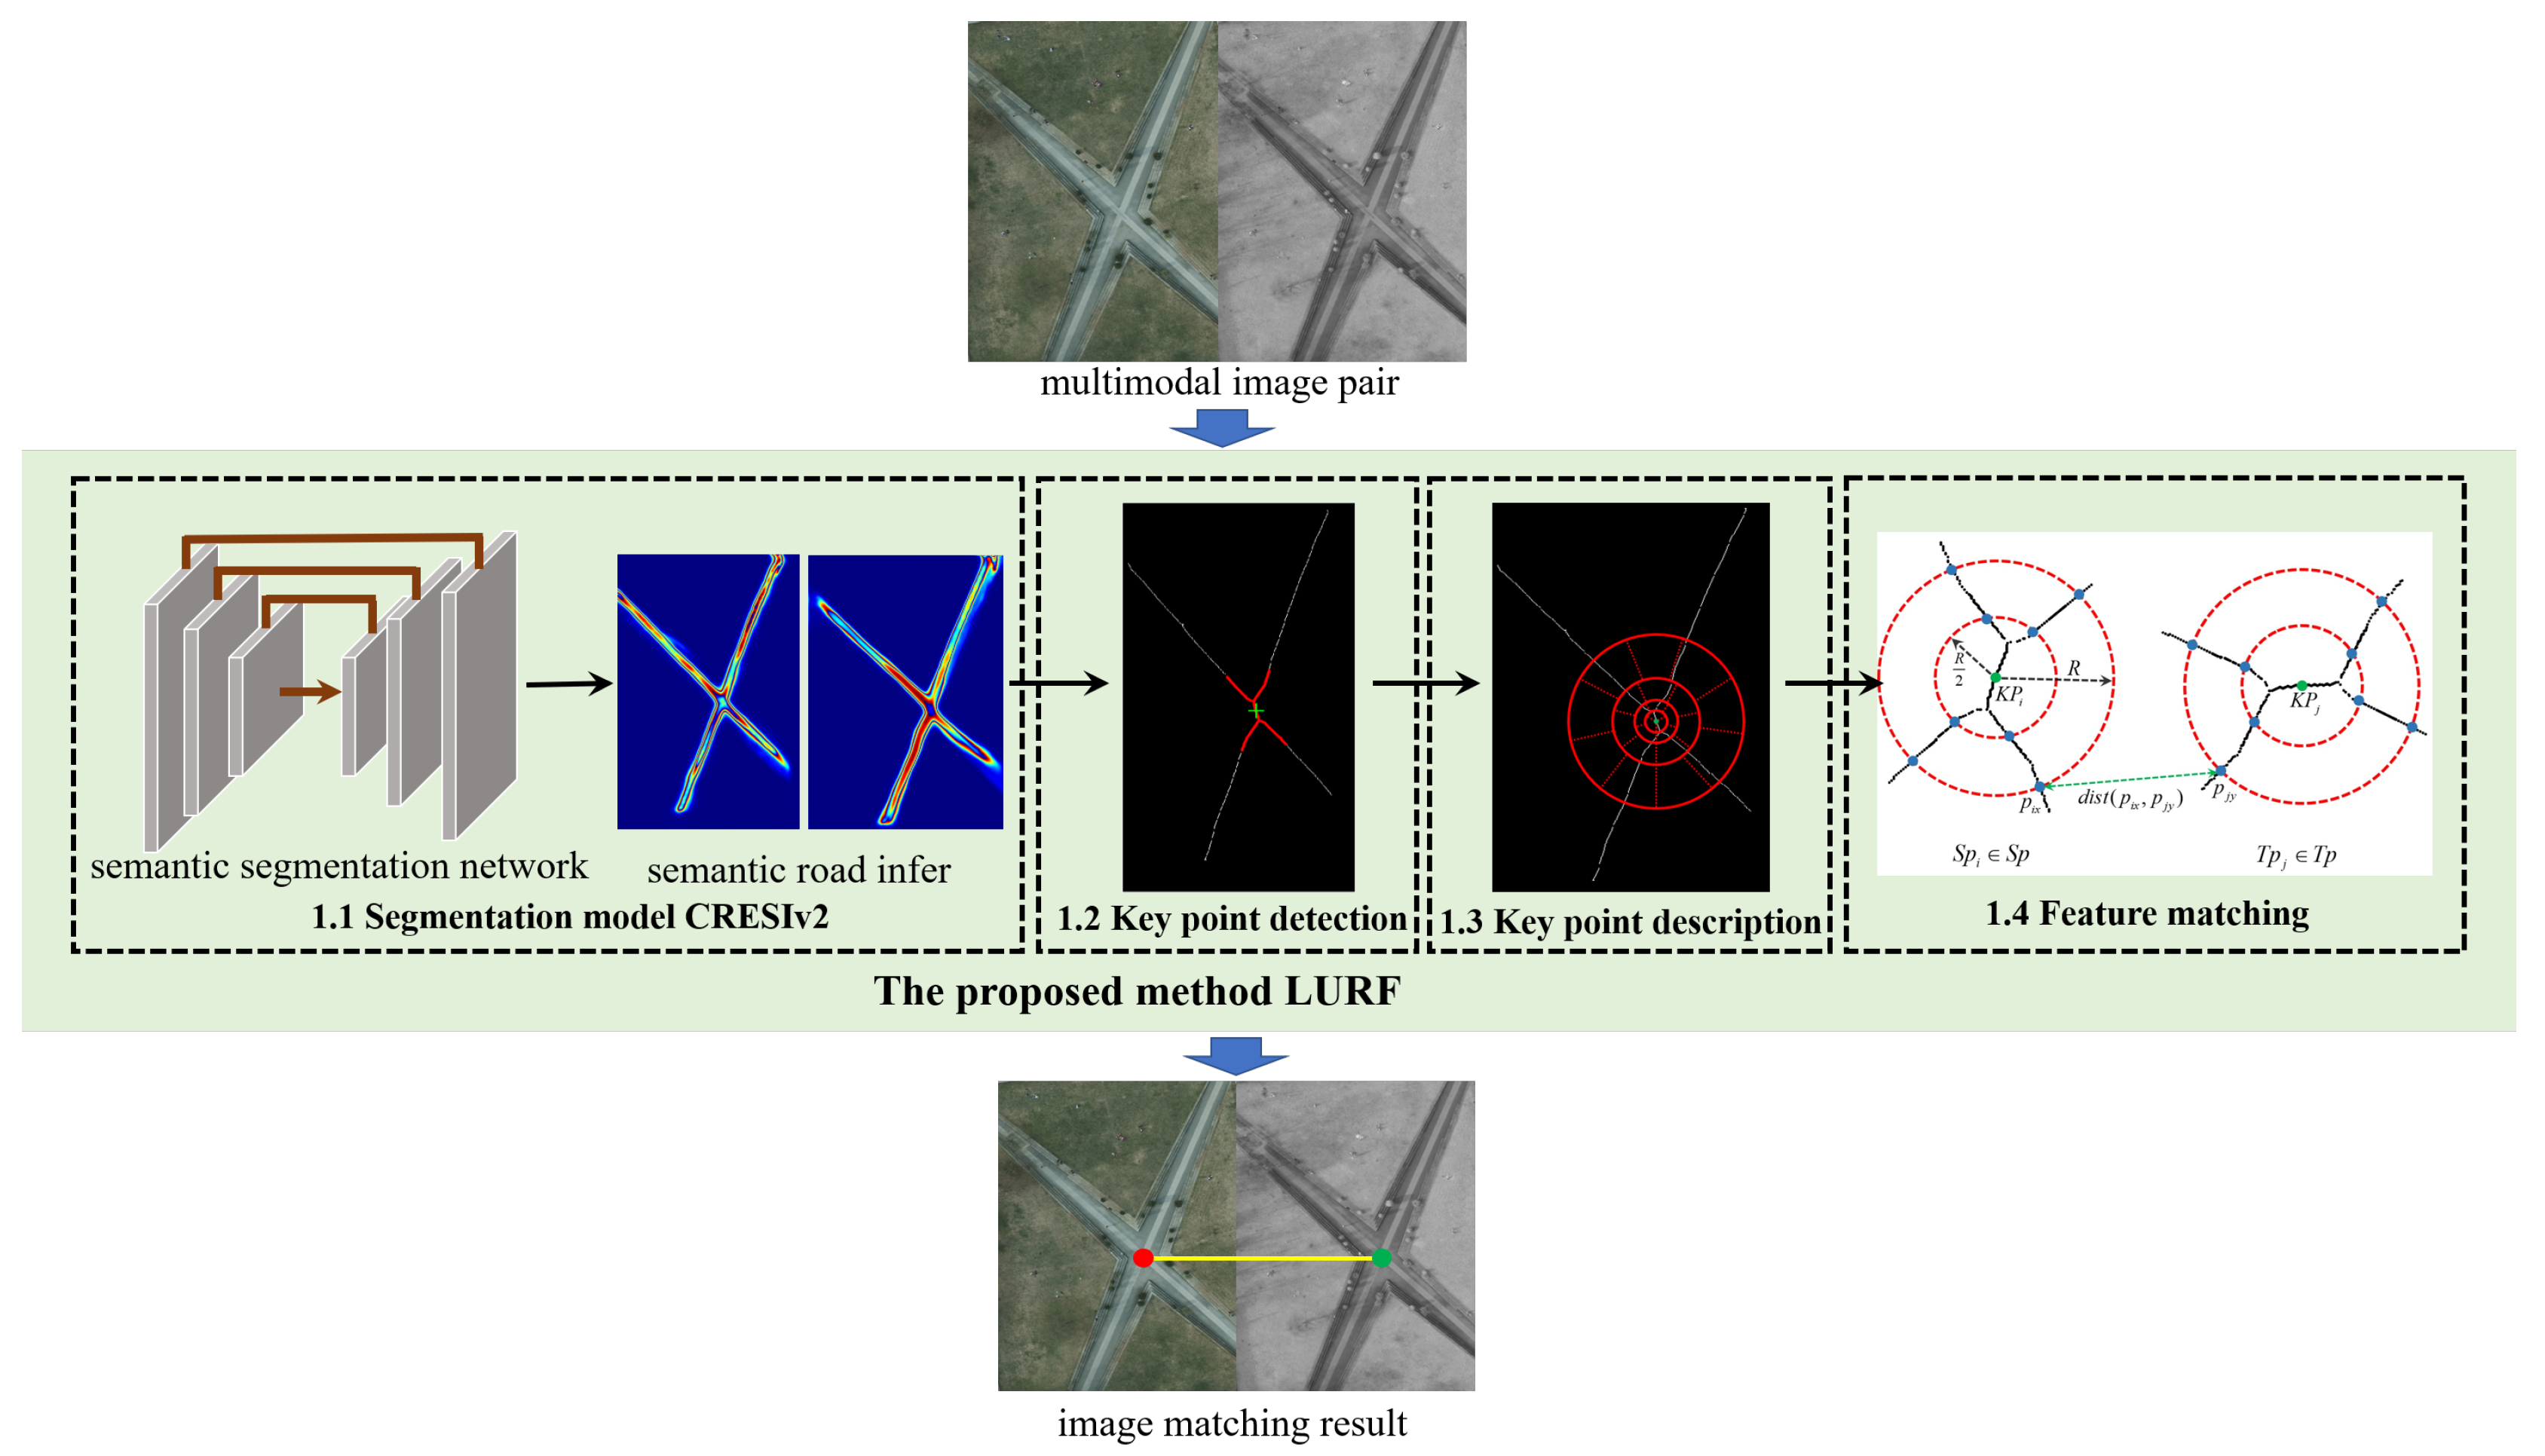
To address these issues, in this paper we propose a novel matching method named LURF via learned unstructured road features for multimodal remote sensing images. This article is an extension of our earlier published work [6]. The proposed method, LURF, is general and efficient, which can handle both very few feature points (even just one feature point) and road curve information with poor linear fitting. LURF also has good robustness for parameter estimation of nonlinear roads. The main contributions of this paper can be listed as follows:
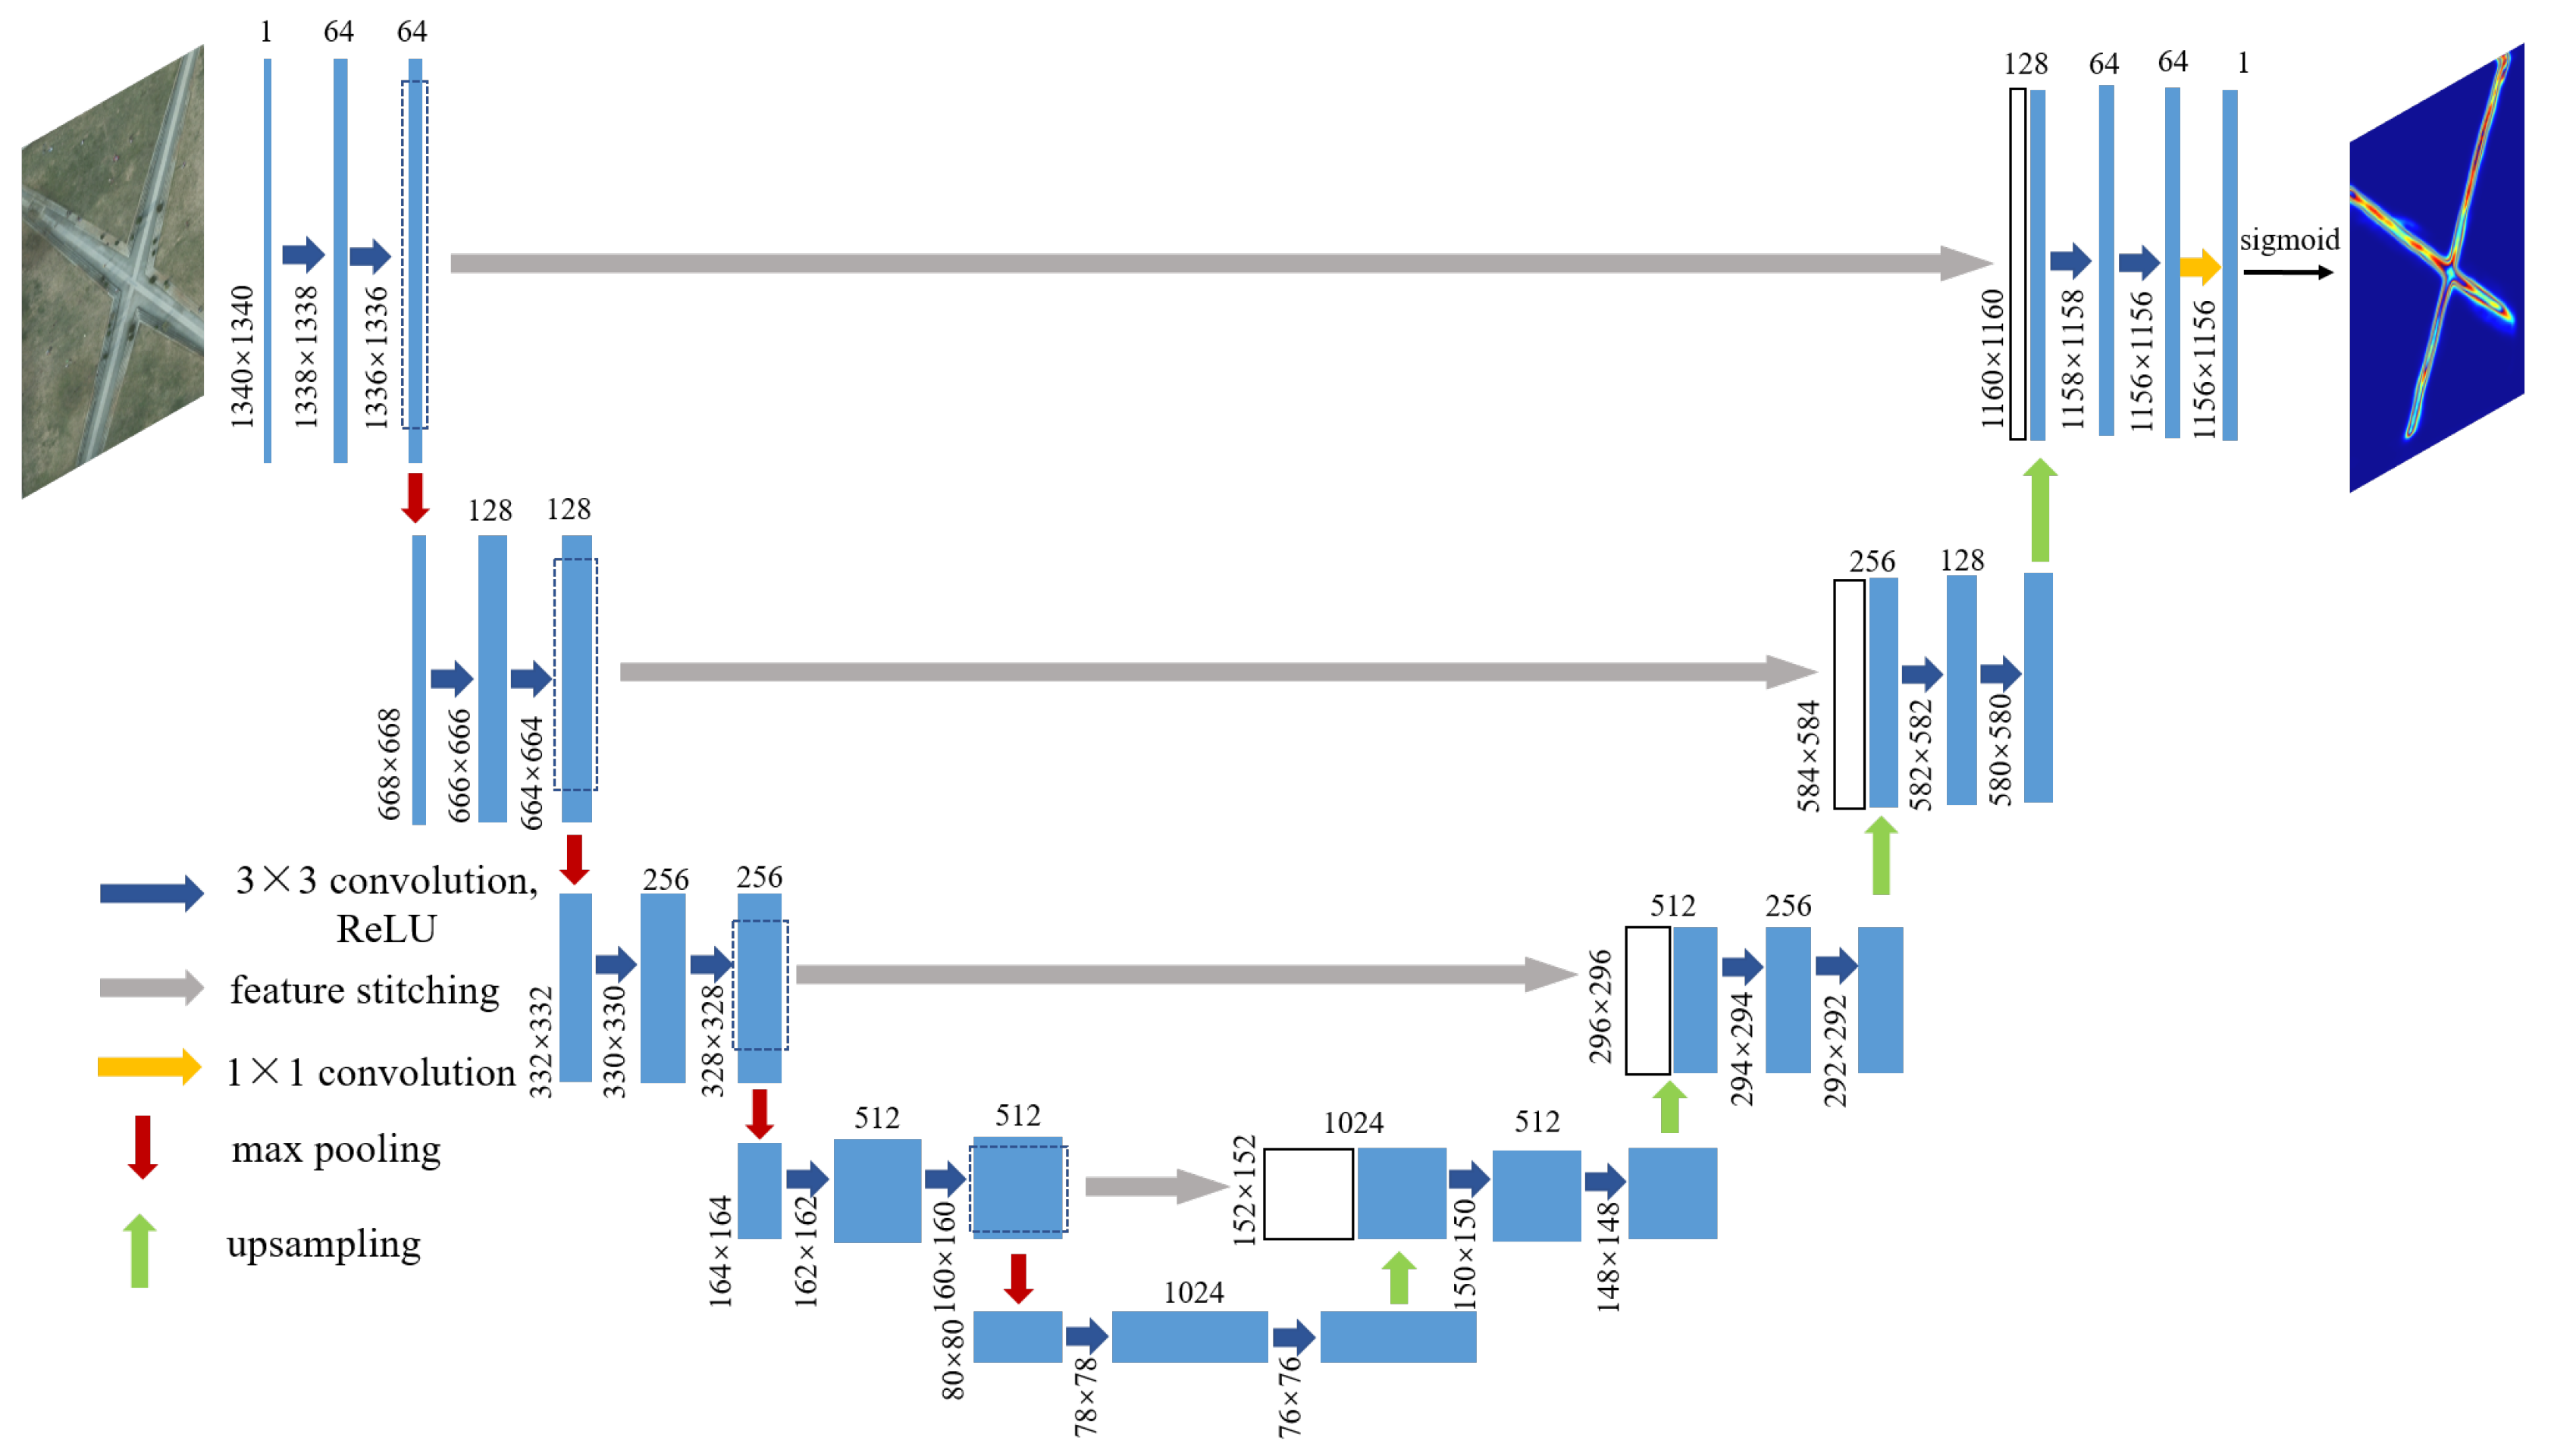
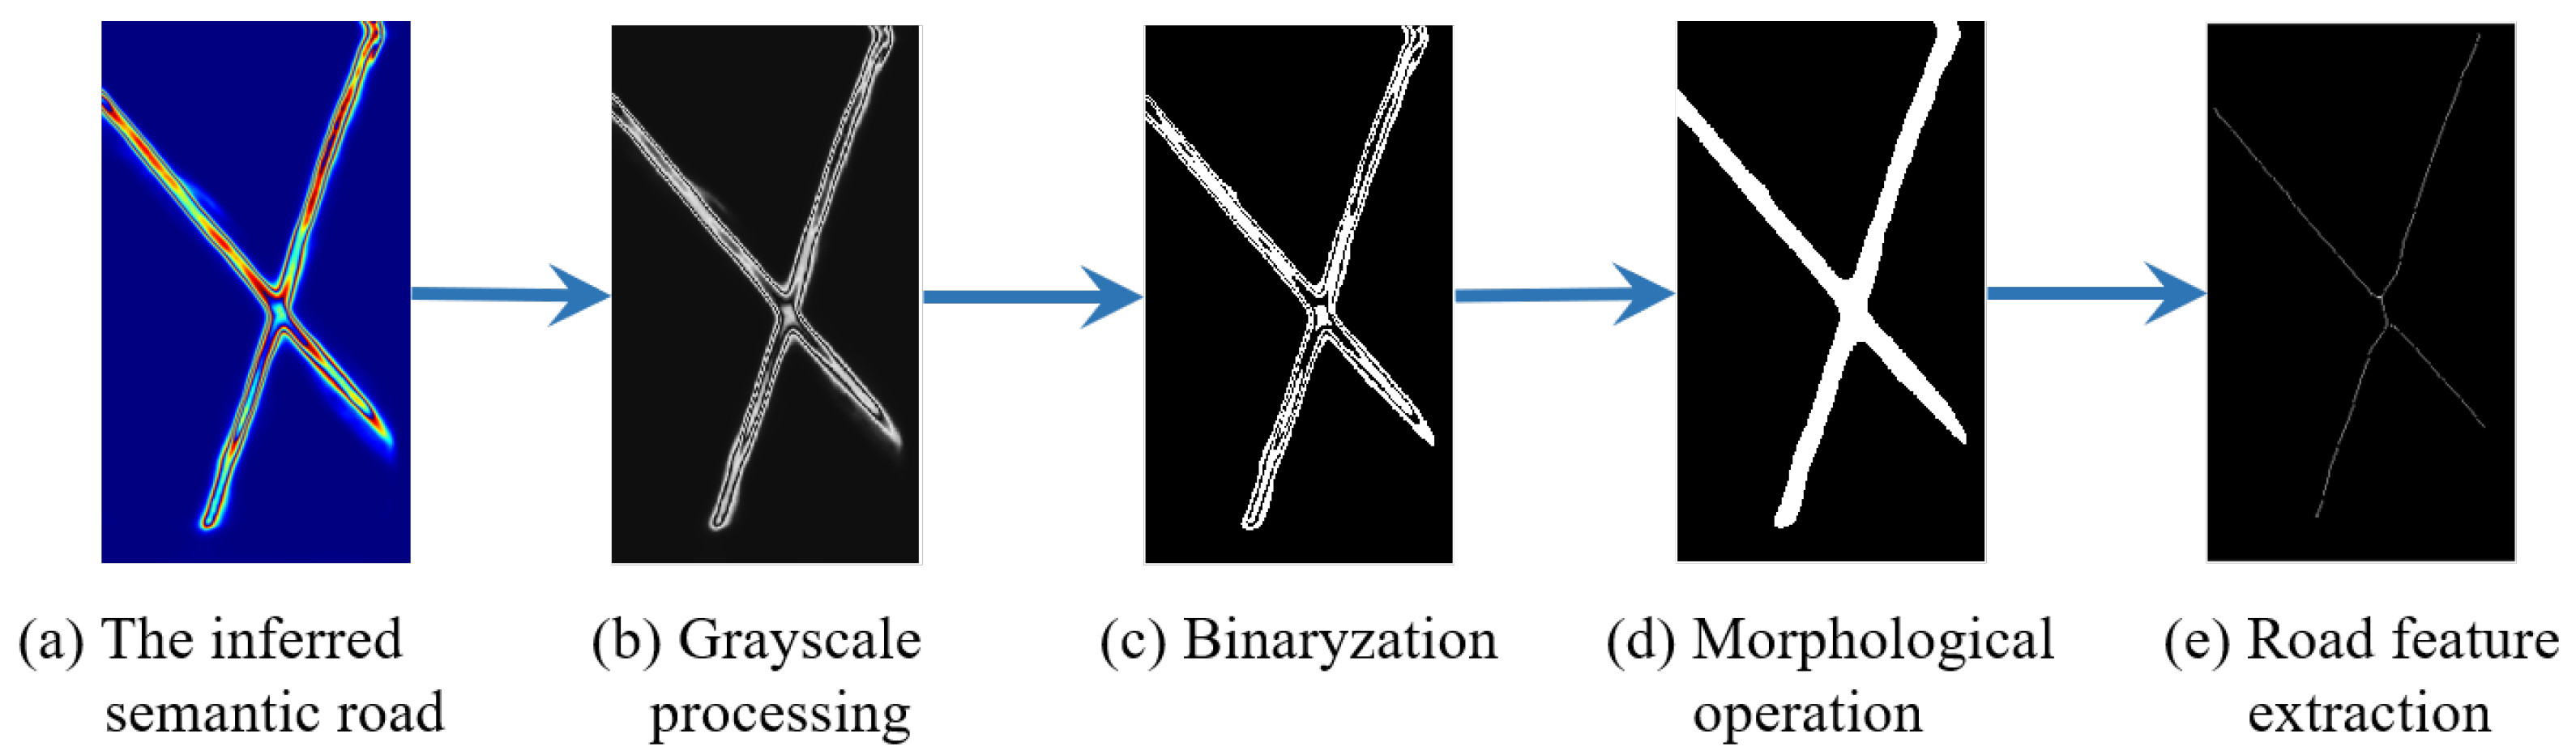
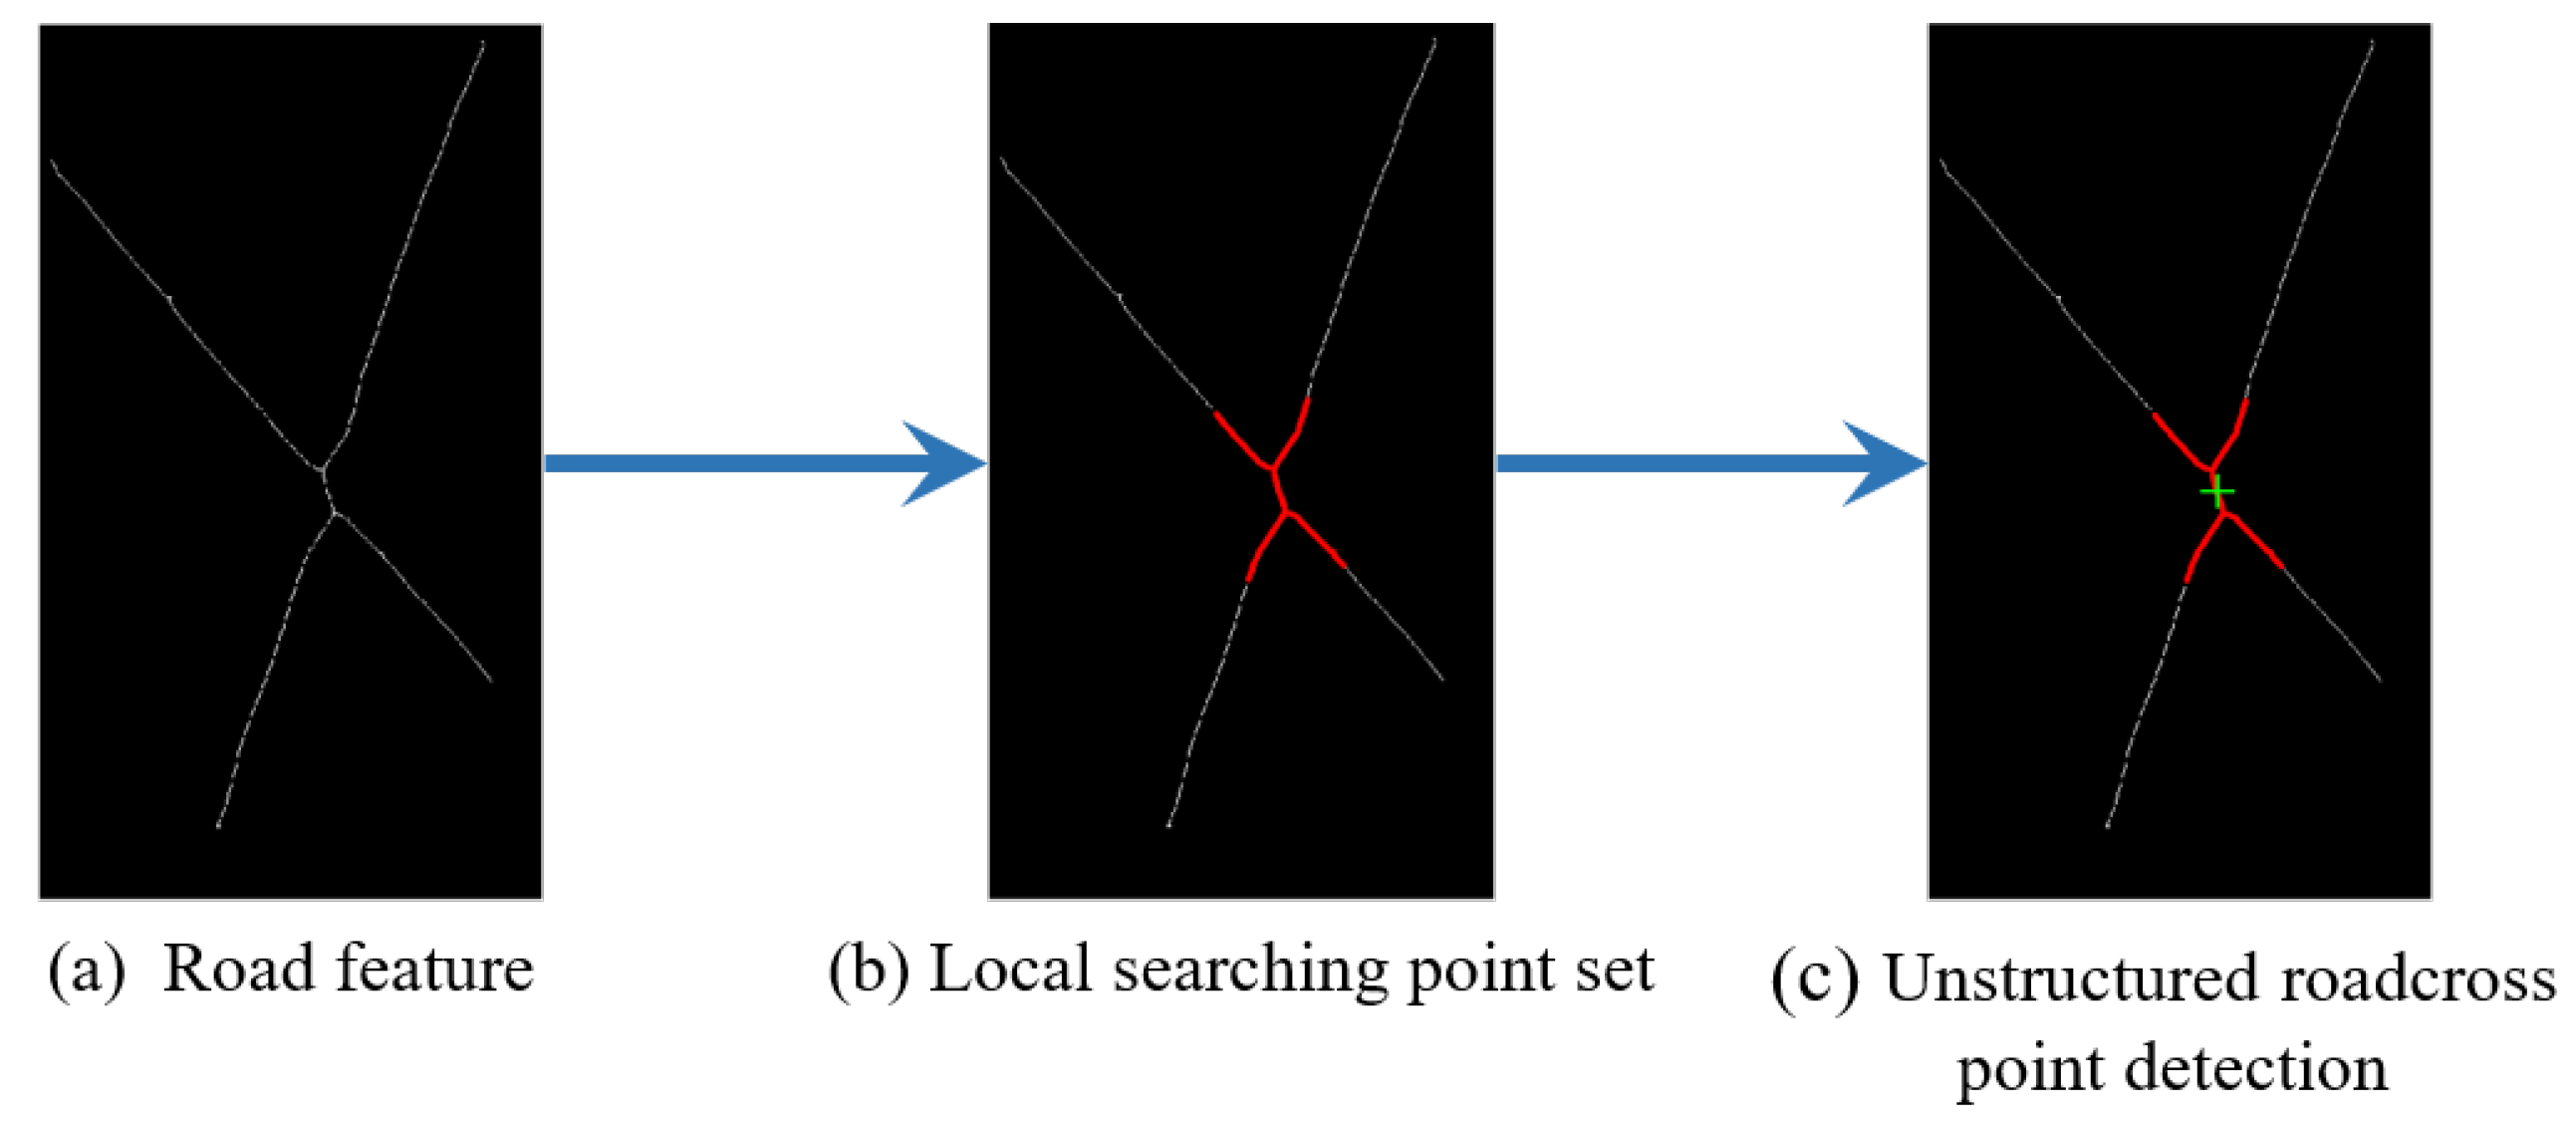
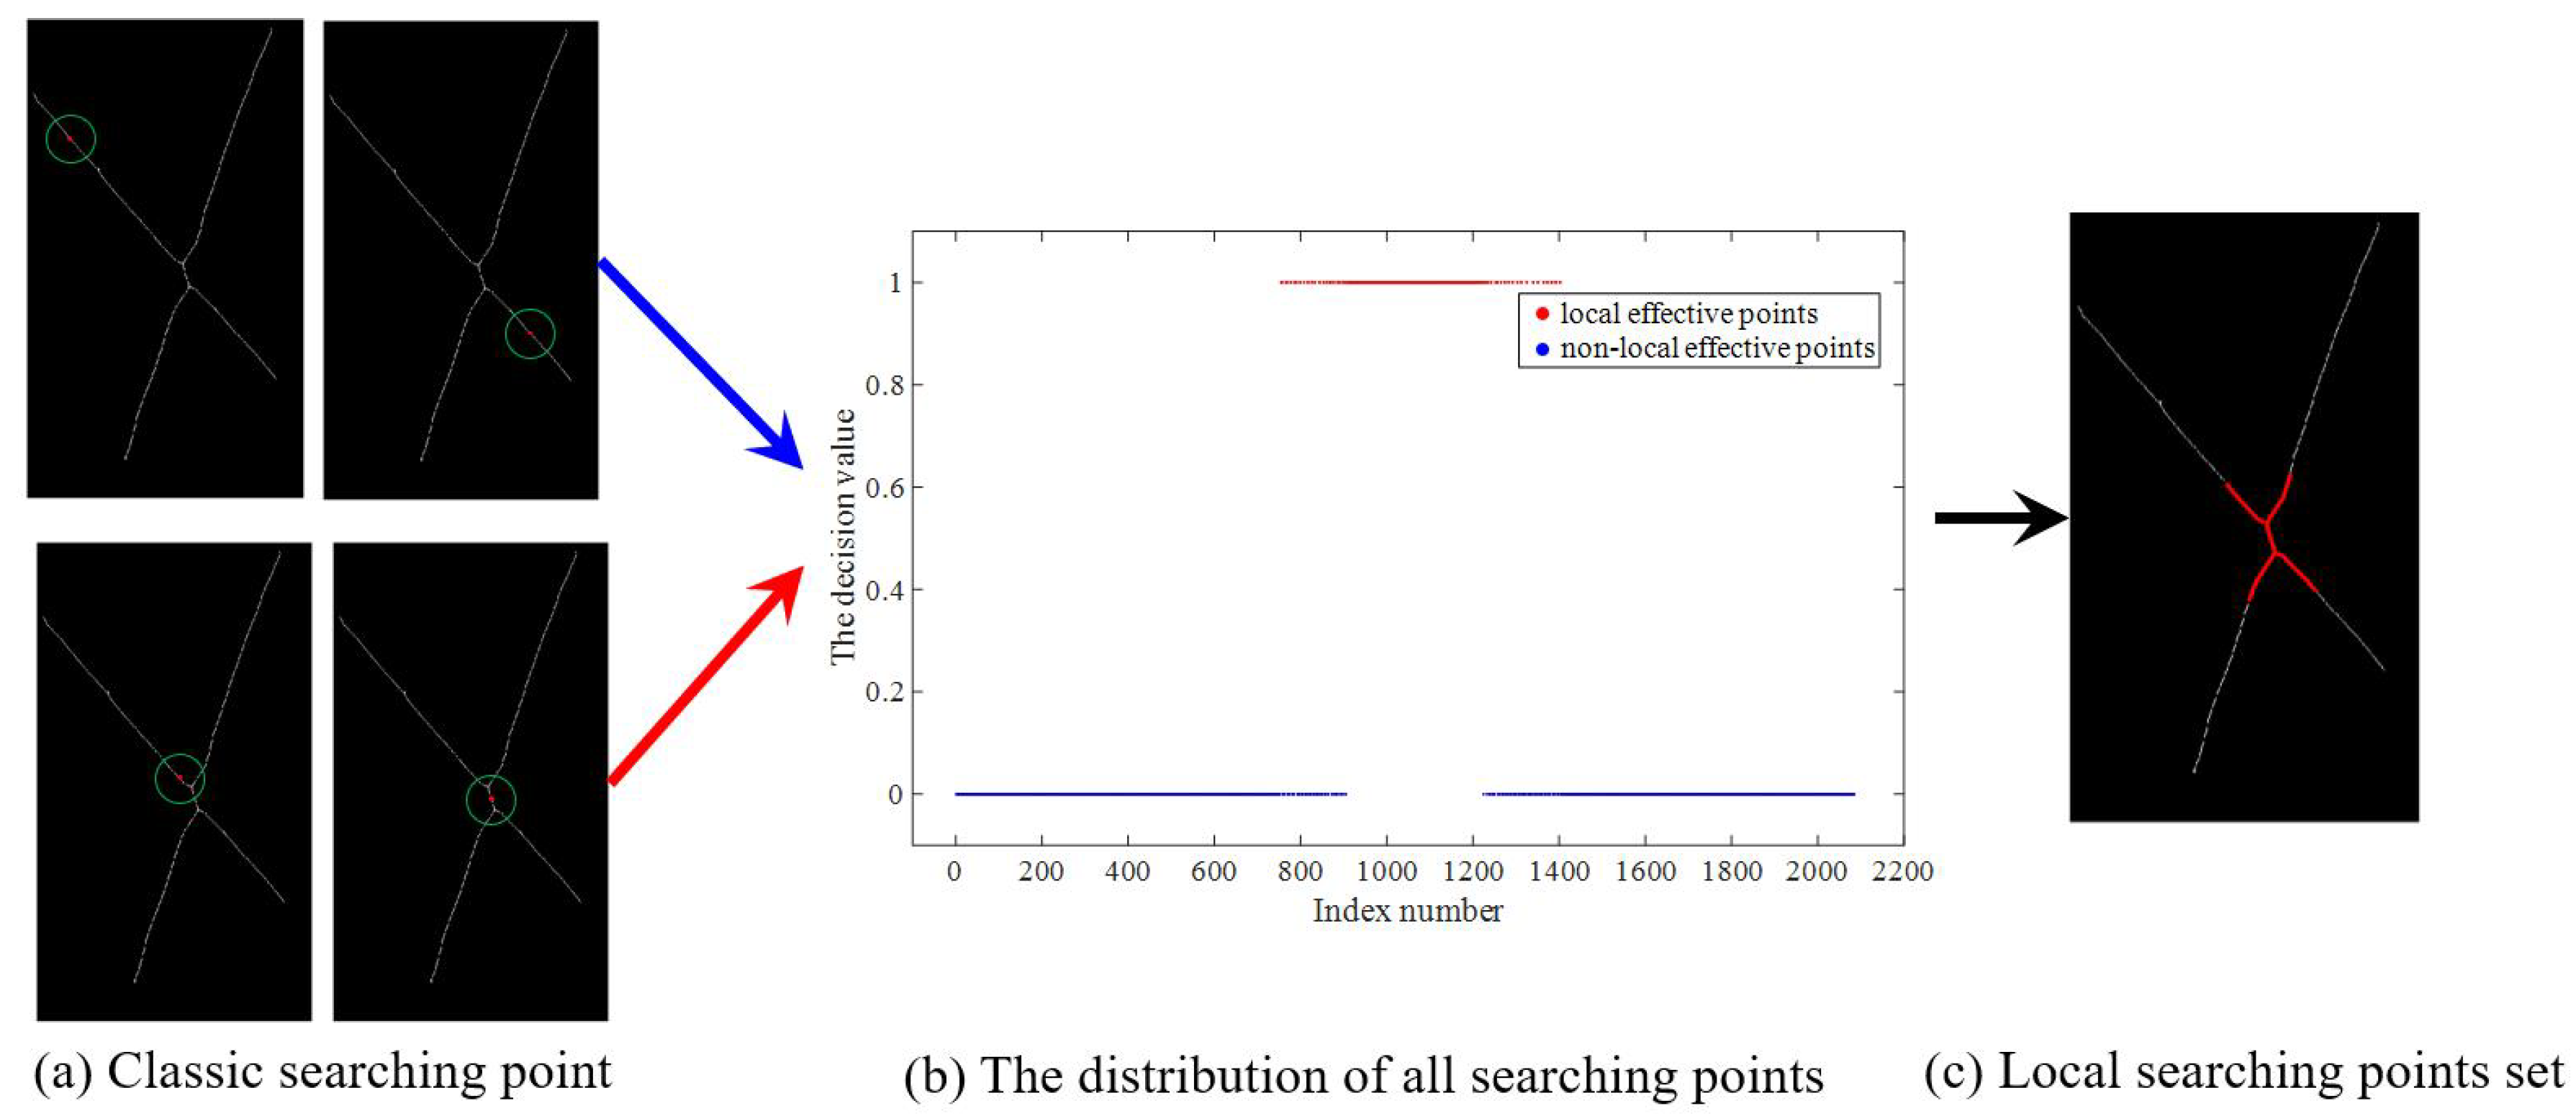
(1) The semantic road features were extracted from multimodal remote sensing images based on the segmentation model CRESIv2. Based on semantic road features, a stable and reliable intersection point detector has been proposed to detect unstructured key points.
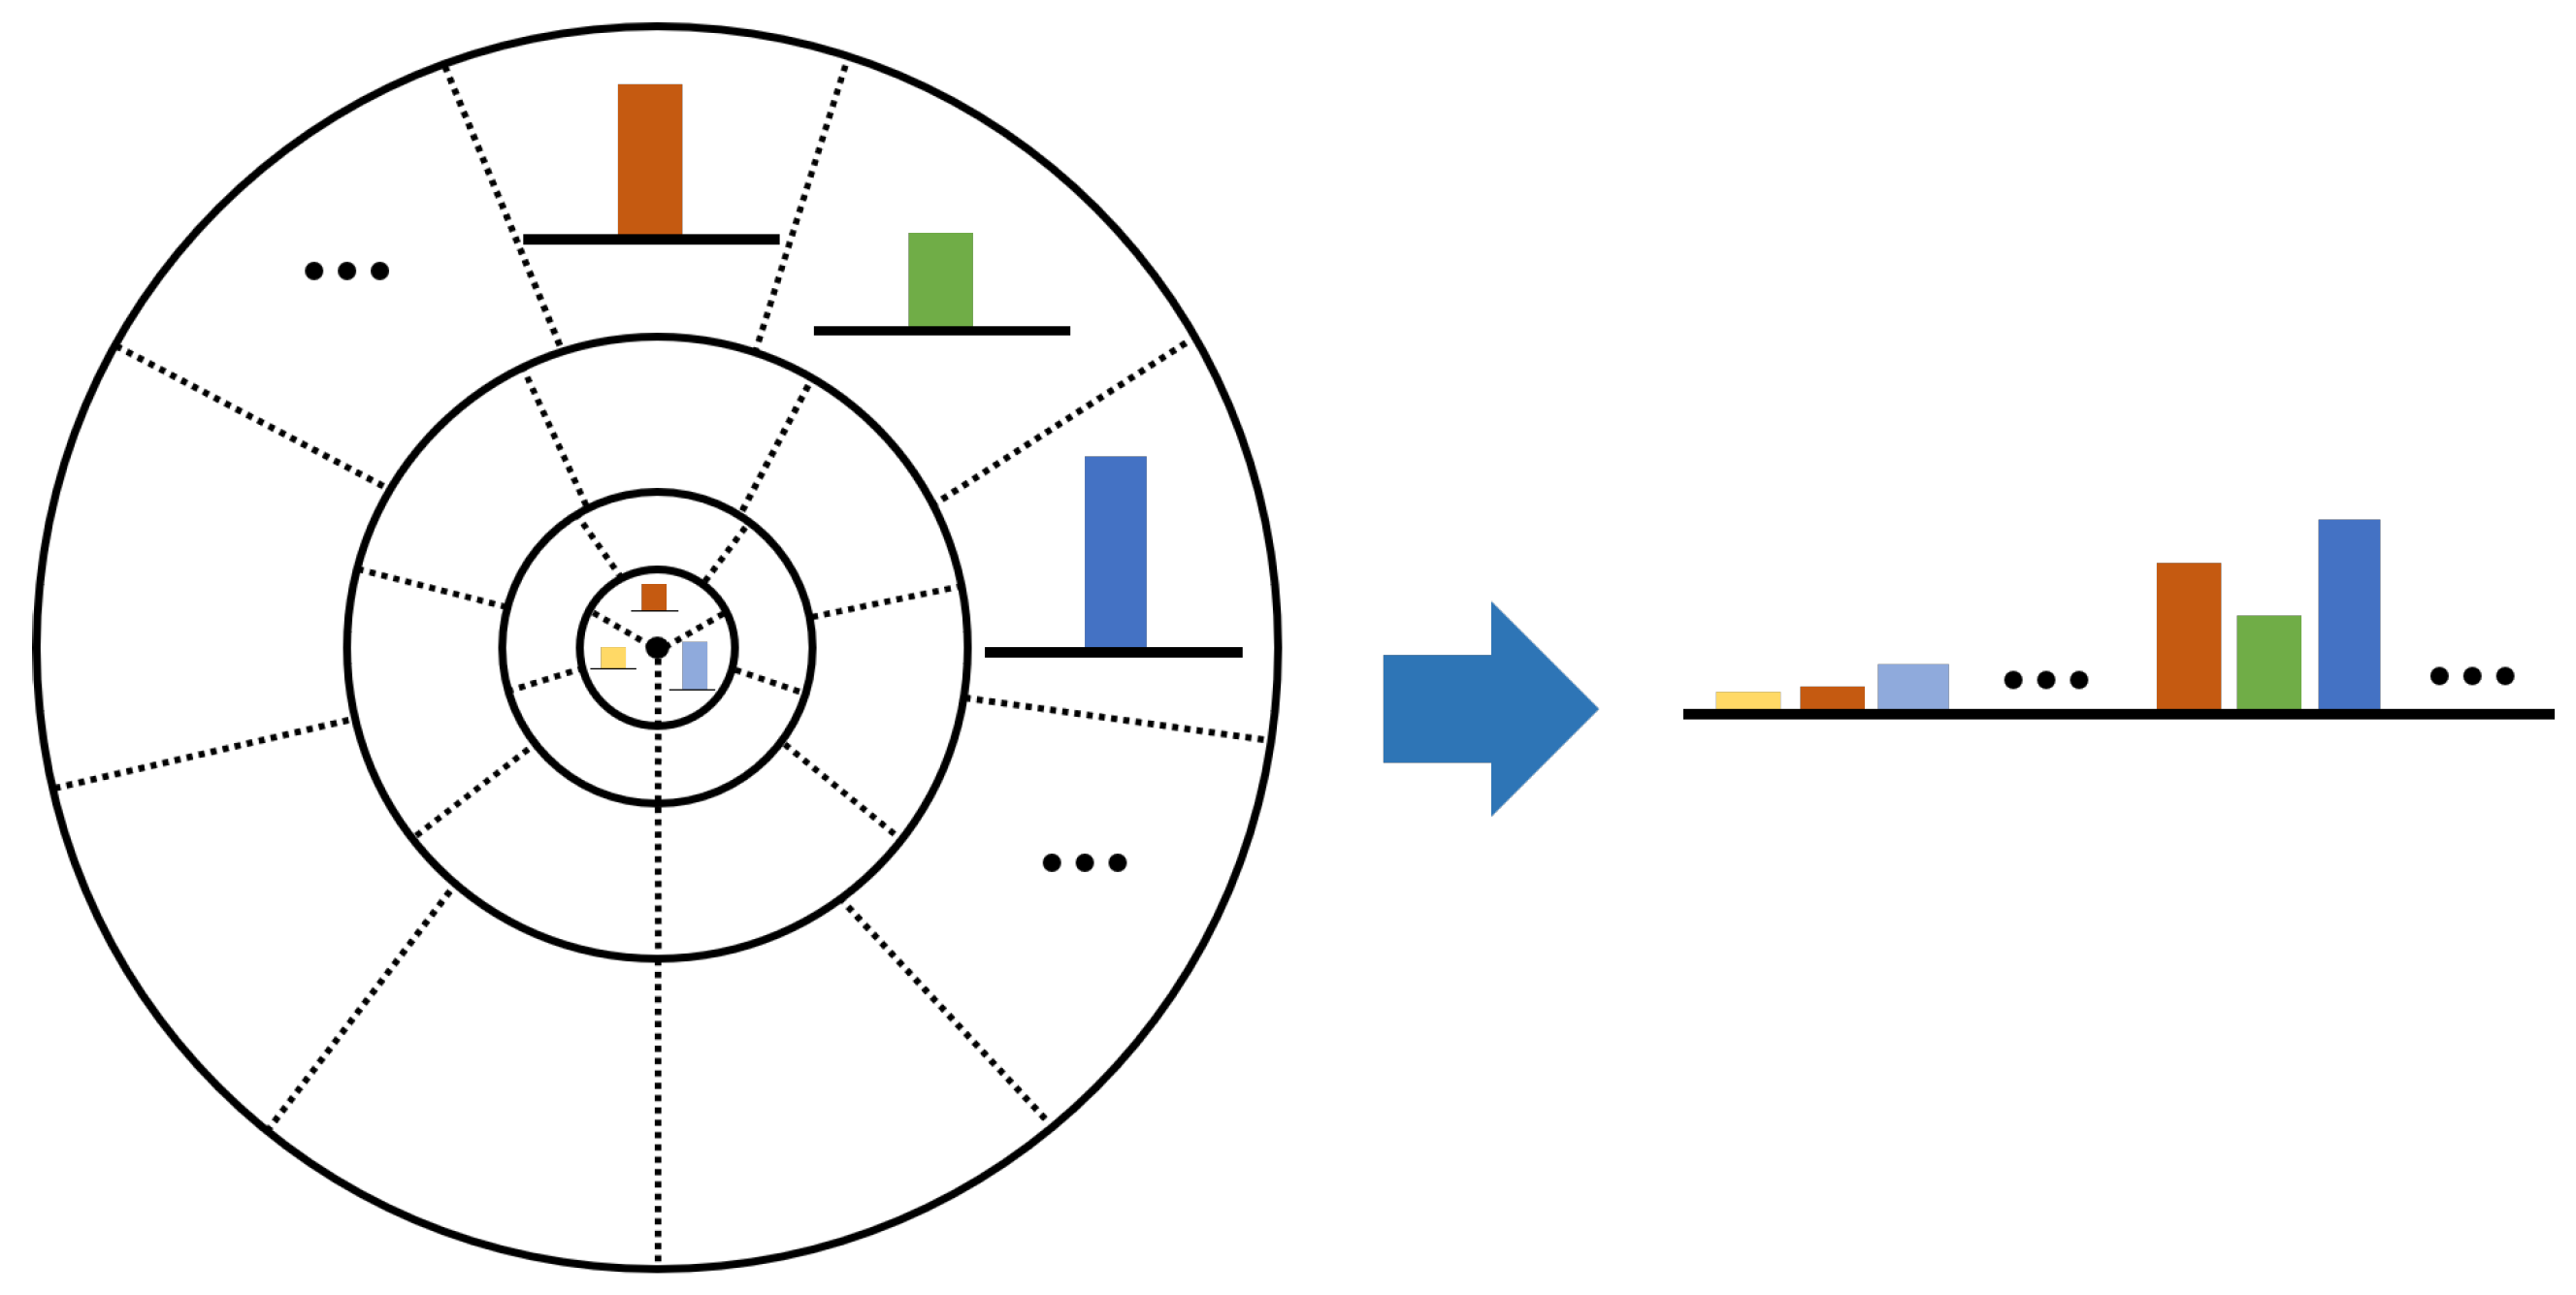
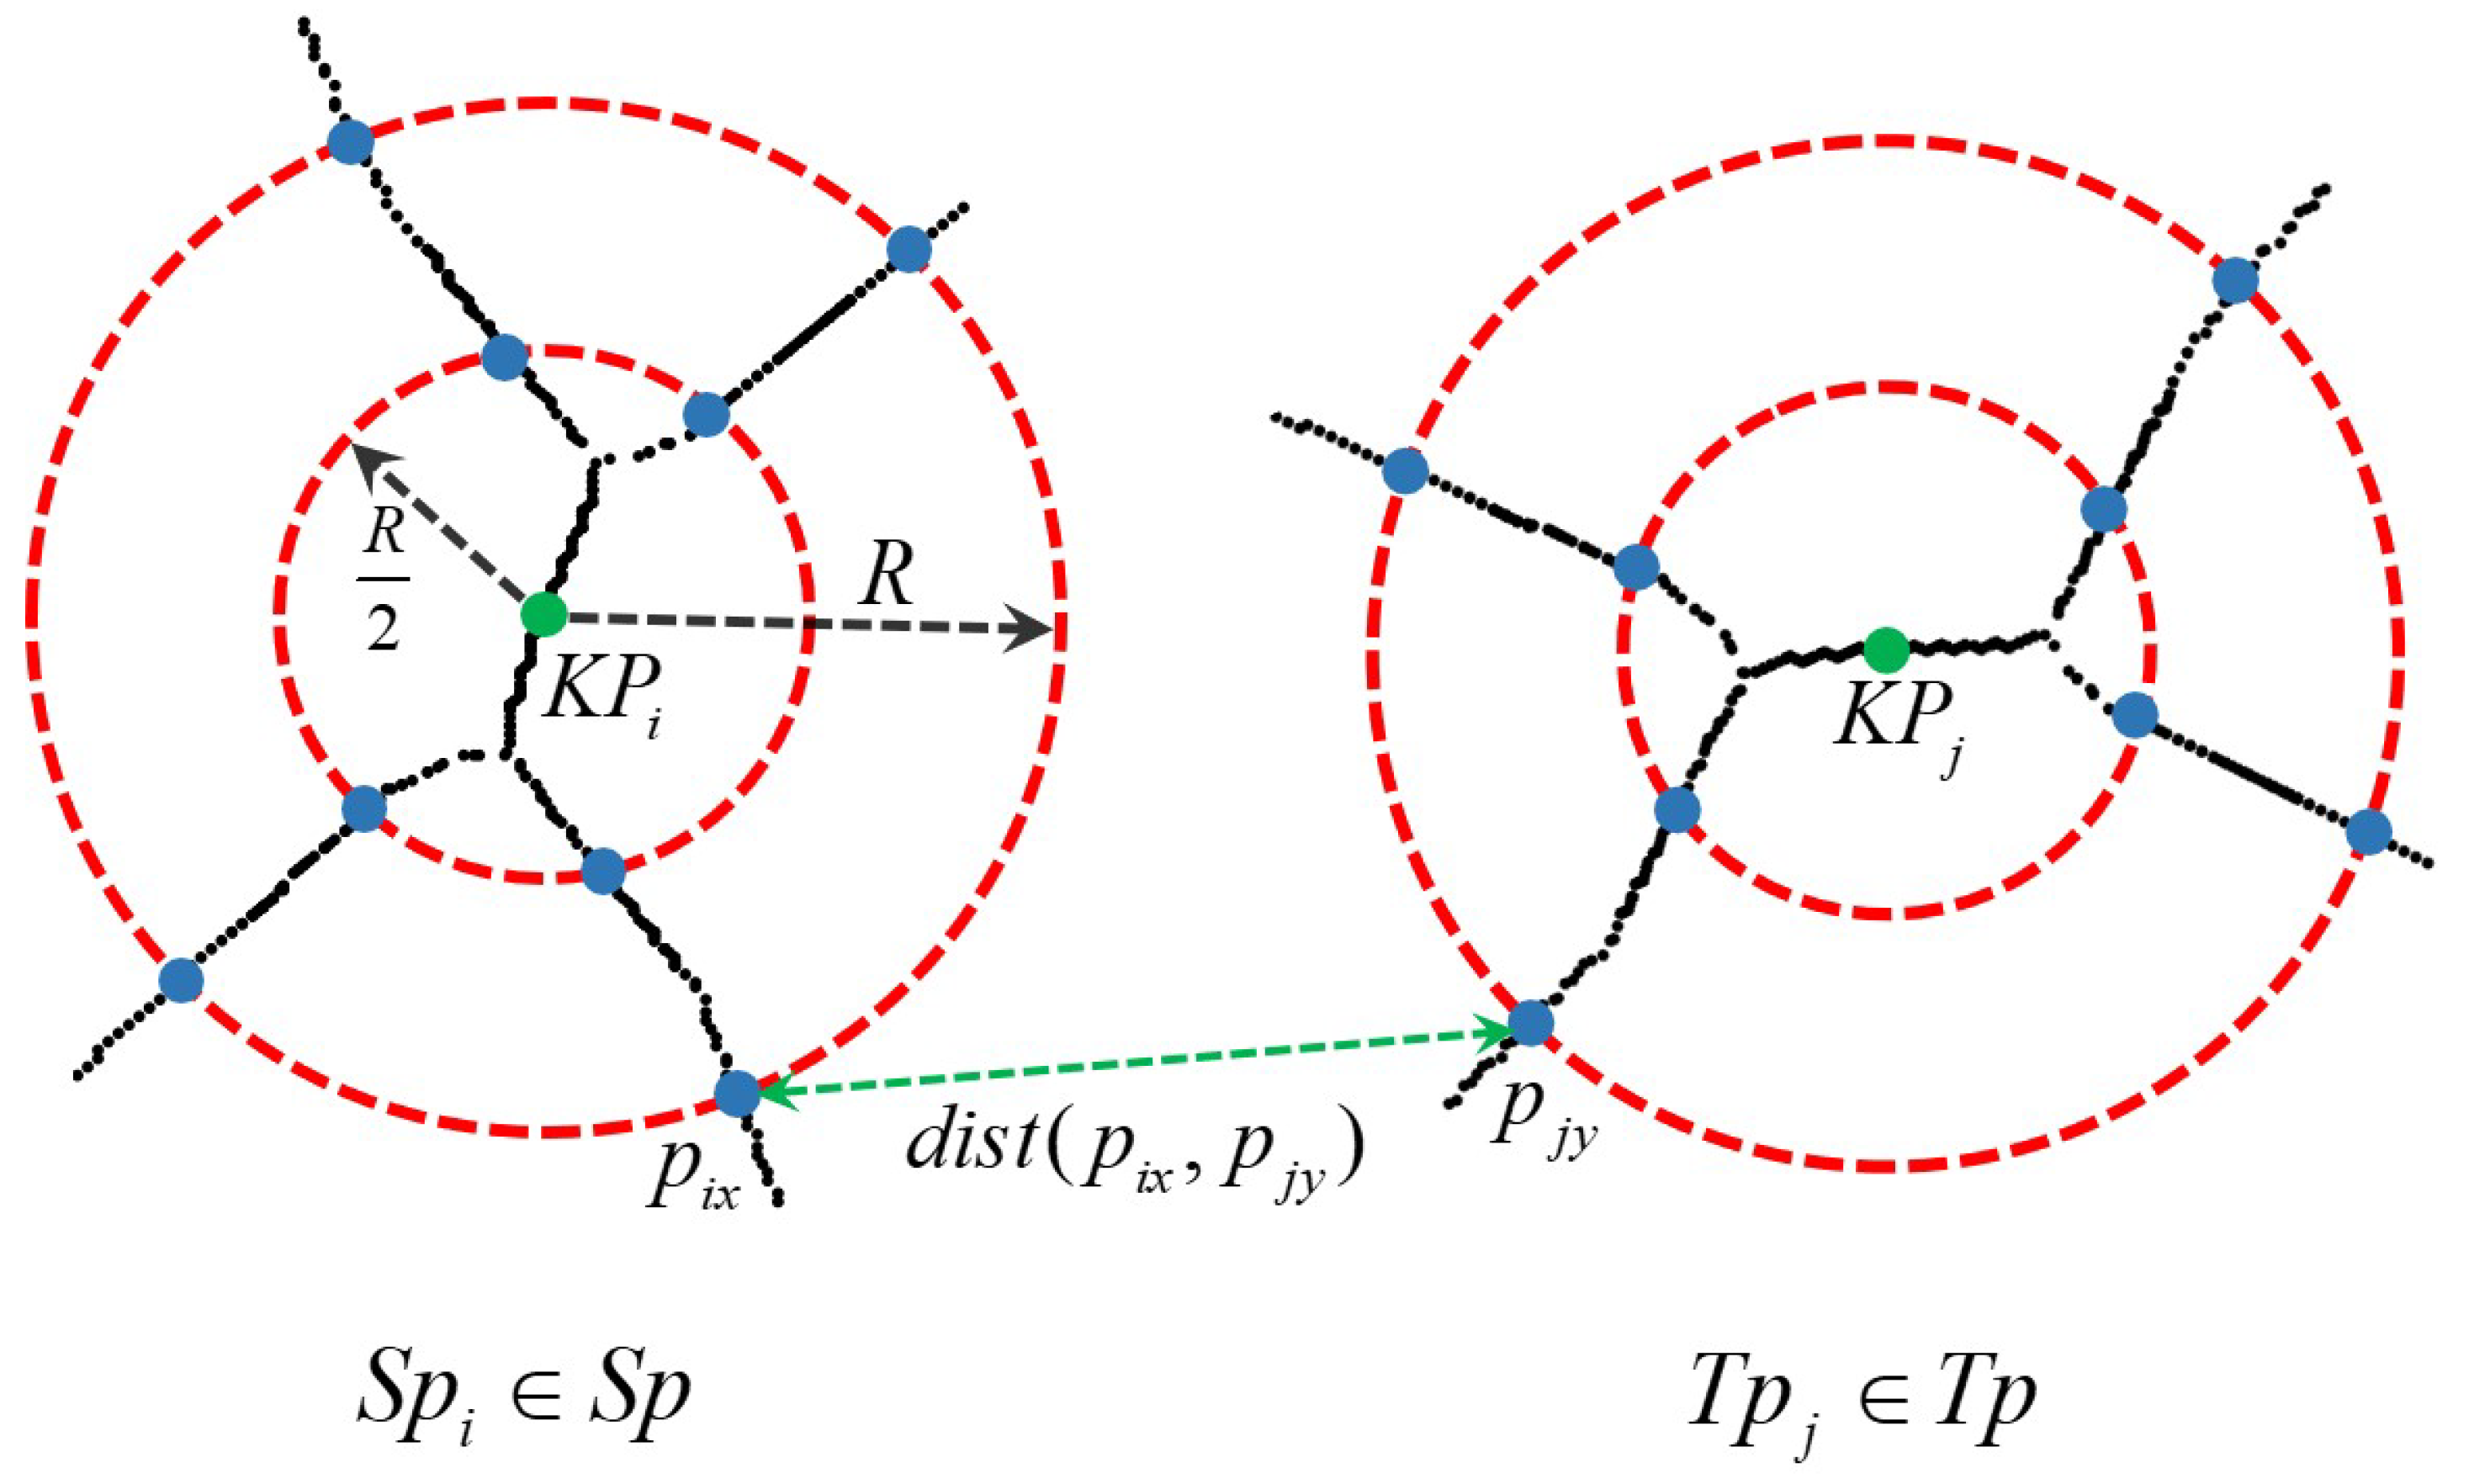
(2) A local binary entropy descriptor has been designed to describe key points with the local skeleton feature. The local binary entropy descriptor dimension is smaller, but its efficiency is higher.
(3) A global optimization strategy is adopted to achieve the correct matching.
(4) Our proposed method LURF has been validated on publicly available datasets, and LURF obtains better results than other state-of-the-art methods in terms of both accuracy and efficiency.
The remainder of this article is organized as follows: The related works of image matching for multimodal remote sensing images are reviewed in Section 1. Section 2 introduces the proposed matching method LURF. In Section 3, the experimental results and corresponding analyses are exhibited. Finally, Section 4 discusses the experiments and concludes this article.

2. Related Works

Multi-modal image matching has always been a hot research issue and many scholars involved in the study of multimodal remote sensing image matching problems in the past few decades [7]. Generally, the multimodal remote sensing image matching methods can be mainly divided into two categories [8]: area-based methods and feature-based methods. Area-based methods [9,10] usually attempt to search for the optimal geometric transform with a specified similarity metric and depend on an appropriate patch similarity measurement for pixel-level matching parameter estimation between the multimodal image pairs, and the distinctive information is provided by pixel intensities rather than by structure features. These methods generally can be classified into three types: correlation-like methods [11], Fourier methods [12], and mutual information methods [13]. Correlation-like methods such as cross-correlation are classical area-based methods [14]. The main idea of correlation-like methods is to compute the similarities of an overlapping region in the reference image and sensed image pairs, and consider the largest similarity as a correspondence. However, correlation-like methods have some drawbacks such as high computational complexity and the flatness of the similarity measure in textureless areas. Fourier methods adopt the Fourier representation of the multimodal image in the frequency domain. In Fourier methods, a commonly used technique is the phase correlation method based on the Fourier shift theorem, which was later extended to account for rotation and scaling [15]. These Fourier methods have some advantages such as computational efficiency and noise robustness than correlation-like methods. In addition, the mutual information (MI) methods can provide an attractive metric for maximizing the dependence, which is robust to NDR to a certain extent. However, MI method has a large amount of calculation, low efficiency, and is easy to fall into local extremum. Based on MI method, some improved methods have been proposed such as normalized mutual information (NMI) [16], entropy correlation coefficient (ECC) [17].
Compared with area-based methods, the feature-based methods have higher efficiency and better adaptability via point features, line features, contours features, or region features. The matching process of feature-based methods usually includes feature point detection, feature point description, and mismatching elimination [18]. The classic and representative method is scale-invariant feature transform(SIFT) [19]. SIFT can extract feature points in a DoG pyramid and filter feature points using the Hessian matrix of the local intensity values. On the basis of SIFT, the speed-up robust feature (SURF) [20] has been proposed. By approximating the Hessian matrix-based detector using Haar wavelet calculation, SURF can accelerate the SIFT, significantly. In order to detect and extract more robust feature points, HOPC [21] and DLSS [22] are proposed based on phase congruency. However, HOPC relies on accurate geographic information which is essentially a template matching method. HOPC is only designed for a slight translation and it is very sensitive to scale and rotation transformations. Based on HOPC, Li [23] proposed a feature matching method radiation-variation insensitive feature transform (RIFT). RIFT adopts phase congruency information instead of image intensity for feature point detection, and constructs a maximum index map (MIM) based on the log-Gabor convolution sequence for feature description. RIFT can detect and descript robust tie-points between multimodal remote sensing image pairs. However, RIFT does not build a scale space, and it cannot be applied to all scale scenes when the scales of the multimodal image are inconsistent. Chen [24] proposed a partial intensity invariant feature descriptor (PIIED) method for multimodal remote sensing images via symmetrical gradient direction histogram. EHD [25] adopts the edges orientation response of multioriented Sobel spatial filter. Based on the local EHD descriptor, the log-Gabor histogram descriptor(LGHD) [26] is proposed by using a multi-scaled and multi-oriented log-Gabor filter to replace the multi-oriented spatial filter, but LGHD is easy to suffers from low efficiency and high dimensionality.
Different from the traditional feature-based multimodal remote sensing image matching methods, learning-based feature matching methods have developed rapidly [27]. MatchNet [28] uses the deep convolutional neural network to learn local patch feature description and feature comparison. LIFT [29] uses the deep learning network to realize the complete image feature matching process and uses the Siamese network to realize the detection and description of feature points and direction estimation. An image matching method based on regularization generation adversarial network is proposed [30]. This method designs a new generative adversarial network for image transformation, and then uses local features to establish multi-source image matching relationships.
Due to the differences in imaging sensors and imaging conditions in multi-modal images, the traditional method of directly detecting and describing key points on the original image has poor robustness and instability. Among them, semantic segmentation information is important feature in multimodal remote sensing image pairs. The corresponding semantic feature is the high-level structure with high similarity of multimodal remote sensing image pairs. The semantic feature has better detection stability and robustness such as semantic road, semantic building, and semantic water area. Although our previous published work has achieved good performance, there are still some limitations such as curved roads. Therefore, this paper proposes a method via learned unstructured road feature (LURF) for multimodal remote sensing image matching, which can effectively address the above limitations.

3. Proposed Method

In this section, we present the details of the proposed method LURF for multimodal remote sensing image matching. We start by introducing the adopted semantic segmentation network CRESIv2 [31] and image processing methods to extract road feature from multimodal remote sensing image pairs. Then, we present a novel method for unstructured intersection point detection by considering the distribution of local searching point set. Finally, a descriptor have been designed for the unstructured intersection points. The flowchart of the proposed method LURF is shown in Figure 2.

3.1. Semantic Road Feature Extraction

The nonlinear grayscale distortion is a prominent problem that plagues multimodal image feature extraction. Unlike the traditional method that directly detects low-level features such as corner features from the multimodal image pair, the semantic feature is a high-level feature. Extracting semantic feature information from the multimodal image pair based on the deep learning network is an effective solution to resist nonlinear grayscale distortion.
In the beginning, the semantic segmentation network CRESIv2 has been adopted to infer the semantic road information from the multimodal remote sensing image, the model as shown in Figure 3. This model uses ResNet34 [32] and Unet [33] as encoder and decoder, respectively. It can also be understood as embedding the ResNet34 as a whole into the encoding module part of the Unet network, the CRESIv2 can achieve optimal semantic segmentation detail as a consequence of feature splicing and scale fusion. To meet the needs of extracting features, the last three layers of structure used for classification are discarded while retaining the structural body of ResNet34. During the downsampling step, the size of the stride and kernel in the transposed convolutional layer is set to 2 and 2 × 2. Upsampling and downsampling use the same scale information. At the same time, the same scale information is used for upsampling and downsampling. At the same time, in the upsampling and downsampling steps, a combination of 3 × 3 convolutional layers, batch normalization layers, and ReLU activation functions are used to fuse the same scale feature information.
When training the CRESIv2 network model, the loss function needs to be explicitly set to specify the learning target of the training model, that is, it is necessary to tell the model how to train to get the best effect, and how to find the best set of network parameters during the training process. The loss function L is defined as in Equation (1).
L = α · L B C E + ( 1 α ) · L D i c e
where, L B C E and L D i c e denote binary cross entropy loss function and distance loss function, respectively. During model training, the default value of α is 0.75. In addition, compared with the SGD [34] (Stochastic Gradient Descent) optimization algorithm, the Adam [35] (Adaptive Moment Estimation) optimization algorithm is adopted for model optimization strategy. The Adam optimization can provide different learning rates for different parameters. The learning rate can be acquired adaptively so that the model can converge faster and more efficiently.
Then, the road semantic information of the multimodal remote sensing image is inferred based on the deep learning network. This excellent performance can effectively resist the nonlinear grayscale distortion problem of multimodal images. It is necessary to extract road centerline features as accurately as possible in order to detect and describe the road intersection point. The road centerline refers to the set of points in the middle of the road width, which is inseparable from the detected road skeleton line position. The diagram of road skeleton curve line extraction from multimodal images is shown in Figure 4. The main steps in Figure 4 include the grayscale processing, binarization, morphological operation and skeleton curve line extraction (from left to right). Although the segmentation model CRESIv2 has good generalization ability and can extract road information in different imaging environments, there will inevitably be low probability information in the probability map. The designed road feature extraction method in Figure 4 can effectively eliminate the inferred false information as much as possible, which can greatly improve the accuracy of key points and the reliability of the description.
When extracting the road skeleton feature, the classic Steger [36] algorithm is adopted to extract the sub-pixel-level skeleton line as seen in Figure 4e. The core idea of the Steger algorithm is to calculate the normal direction of the road primitives based on the Hessian matrix, and to determine the sub-pixel skeleton line through the Taylor expansion. As for any pixel point P n ( x , y ) of morphologically reconstructed image as seen in Figure 4d, its Hessian matrix can be expressed as:
H ( x , y ) = r x x r x y r x y r y y
where parameters r x x , r x y , r y y indicate the second-order partial derivatives of pixel point P n ( x , y ) in different directions. The eigenvector corresponding to the largest eigenvalue of the Hessian matrix is the normal direction defined as ( N x , N y ) . Therefore, assuming that ( x 0 , y 0 ) represents the current reference point, the corresponding subpixel-level skeleton point coordinates ( S x , S y ) can be expressed as:
( S x , S y ) = ( x 0 + T s · N x , y 0 + T s · N y )
T s = r x N x + r y N y r x x N x 2 + 2 · r x y N x N y + r y y N y 2

3.2. The Unstructured Road Intersection Point Detection

To detect the road intersection points from the road skeleton feature, the most direct idea is to fit straight lines from skeleton features and detect straight line intersections as intersection point. Such ideas usually are unsatisfactory, because the real roads in reality do not always maintain the straight line features, that is, the extracted skeleton features are not linear sets. Therefore, there is a large error in the fitting, and the final confirmed position of intersection point does not coincide with the actual one. This case can be seen in Figure 1b.
To avoid the interference of global road skeleton features on the intersection point detection, we propose a road intersection point detection method. The proposed method contains two main steps as seen in Figure 5: (1) A local distribution characteristic statistics for all skeleton feature points have be established, and the local searching point set of intersection point is determined according to certain conditional criteria. (2) The clustering algorithm is used to determine the final unstructured intersection points on the local searching pointset, and the intersection point can be regarded as the key point for multimodal remote sensing image matching.
Suppose the central searching point is S x , the local searching radius is R, and all skeleton feature point set is S i . Then, the searching point set S P x satisfying the local searching range constraint can be defined as follows:
S P x = S i R 3 | ( R δ ) S i S x ( R + δ )
Figure 6 presents details of the local searching point set detection. Figure 6a presents several typical searching points, the red dots indicate the central searching point S x , the green circles indicate the current search range and its radius is R. When all skeleton feature points are traversed and calculated, search point sets are S P i . According to certain a priori conditions, we propose a criterion for determining the local search point set around the intersection point, that is, if the number of elements | S P i | in the point set is not less than 3, the current search point can be regarded as satisfying the local neighborhood condition. Among them, | S P i | is not less than 1, because the noise point has been filtered and removed during the morphological operation. Therefore, the decision value D i can be defined as follows:
D i = 1 , i f | S P i | 3 0 , i f 1 | S P i | < 3
Figure 6b shows the distribution of all searching points. Among them, the red dot indicates the local effective point, and the blue dot indicates the non-local effective point. According to this distribution characteristic, the skeleton feature point set in the neighborhood of intersection can be quickly extracted, as seen in Figure 6c.
To detect intersection points regarded as matching key point, DBSCAN [37] algorithm can quickly and accurately separate high-density regions as the separate intersection point classes from the local searching point sets. Further, the centroid point of each clustering category can be regarded as the location of the unstructured intersection point, as shown in Figure 5c. DBSCAN algorithm is insensitive to individual outlier data and has good stability for non-convex dataset clustering.
Figure 7 shows the main flow of road intersection points detection for multimodal image. As can be seen from the Figure 7, although the segmentation model CRESIv2 has good generalization ability and can extract road information in different imaging environments, there will inevitably be low probability information in the probability map such as false features, partial occlusion. The designed road intersection points extraction method in Figure 7 can effectively eliminate the inferred invalid information as much as possible, and the correct intersection points represented by the solid red dots are accurately extracted, which can greatly improve the accuracy of road intersection points and the reliability of local descriptor.

3.3. The Unstructured Road Intersection Point Description

Compared with other descriptor methods that describe the local information of key points on the original pixel image, the consistent skeleton feature image is chosen to describe the local description feature of the intersection points. In order to improve the description performance and the resistance to slight local geometric distortion, the proposed local binary entropy descriptor is designed as logarithmic partitions, and the schematic diagram of the proposed descriptor is shown in Figure 8. It can be seen in Figure 8, unlike other local descriptors such as SIFT using regular grids to divide local image blocks, the designed descriptor uses the logarithmic annular grid to divide key point neighborhood region, the radius of the annular region in each layer increases gradually along the radial direction. In addition, the number of grids in the different annular regions is different, the number of grids remains the same trend and increases from inside to outside along the radial direction. The advantage of designed local binary entropy descriptor is that the it can ensure the reliability of the description when there are some false road features, making it more suitable for describing road features in multimodal imaging. The descriptor can greatly improves the accuracy and robustness of feature matching.
In the details of the proposed descriptor, firstly, the local description region of the circle is divided into m non-overlapping annular R ^ along the radial direction. Then, the annular is divided into the grids based on the adaptive angle strategy, and its number can be expressed as N ^ . R ^ and N ^ can be exactly defined as:
R ^ = { r ^ 1 , r ^ 2 , r ^ 3 , , r ^ i , , r ^ m }
N ^ = { m ^ 1 , m ^ 2 , m ^ 3 , , m ^ i , , m ^ n }
where it can be understood that the annular r ^ i is divided into m ^ i grids with the same size. Subsequently, the each local binary entropy e i is calculated in each grid g i . The local entropy e i can be defined as follows [38]:
e i = e n t r o p y ( g i ) = i n p ( g i ) log ( p ( g i ) )
In particular, the pixel point in the road skeleton feature image is the binary form, that is to say, the pixel value in each grid g i satisfies the binomial distribution. Therefore, the Formula (9) can be simplified into the following formula:
e i = p ( g i ) · log ( p ( g i ) ) ( 1 p ( g i ) ) · log ( 1 p ( g i ) )
Finally, the local binary entropy values in all grids and all annular regions are sequentially spliced and normalized to form the final feature description vector E, which can be defined as follows:
E = { e 1 , e 2 , e 3 , , e i , , e m n }
Figure 9 shows the local binary entropy descriptor values of the detected road intersection points in the optical-NIR image pair. It can be seen that the descriptor information of the corresponding road intersection points in the multimodal image pair is very close and has a strong discriminating ability. The descriptor also shows good insensitivity to some interference factors such as false semantic features and partical occlusion, which will greatly improve the accuracy and robustness of feature matching.

3.4. Feature Matching

Given two multimodal image pairs S and T , the local feature point sets of all key points can be defined as Sp and Tp . Therefore, the local feature point sets around key points KP i and KP j in two image pairs can be represented as Sp i and Tp j , respectively. The schematic diagram of the corresponding local feature point sets is shown in Figure 10. In Figure 10, the concentric circles (shown in the dotted red circles) can be constructed respectively with key points KP i and KP j as radius R and R / 2 . The intersection points of concentric circles and local feature point sets are { p i x } and { p j y } , respectively. Assuming that the transformation parameters s, θ and t are estimated, the point set Sp can be transformed into the target image space, and the transformed point set can be denoted as Sp . For each transformed local feature point set Sp i , there is a corresponding point set in Tp j with the minimum distance. The minimum distance of these two point sets can be denoted as D m i n ( S p i , T p j ) :
D m i n ( S p i , T p j ) = x , y d i s t ( p i x , p j y )
When D m i n ( S p i , T p j ) is less than the threshold η , there will exist a pair of overlapping key points and their local feature point sets in the image pair. Similarly, after traversing and calculating the distance information of all key points and their local feature point sets, the number of key points satisfied with the transformation can be presented as N O s , θ , t . Ultimately, the normalized overlap rate is used for measuring the parameters s, θ and t, and the normalized overlapping rate is defined as follows:
N O s , θ , t = N O s , θ , t m a x ( | S p | , | T p | )
For each key point with the local feature point set, it can get a normalized overlapping rate. Therefore, the transformation parameter at the maximum overlapping rate can be regarded as the final initial transformation parameter:
( s * , θ * , t * ) = a r g m a x s , θ , t ( N O s , θ , t | η )

4. Experimental Results and Analyses

Here, to evaluate the multimodal remote sensing image matching performance of our proposed LURF we compare it with other five state-of-the-art feature matching methods such as SIFT [19], SURF [20], EHD [25], LGHD [26] and LPM [39] on two different multimodal remote sensing image data sets. Throughout the qualitative and quantitative evaluation experiments, all six methods’ parameters are all fixed. The experiments are performed on a laptop with 3.4-GHz CPU, 4GB memory, and MATLAB code.

4.1. Data Sets and Evaluation Metrics

The data sets mainly include training data set and test data set. For the training data set, we use the SpaceNet 3 data set [40] with road label to train our road semantic segmentation network CRESIv2. The data set includes the remote sensing images of Las Vegas, Paris, Shanghai, and Khartoum areas. To improve the generalization of our semantic segmentation network CRESIv2, the selected data sets with road labels contain some wide remote sensing geographic areas from 400 to 3600 square kilometers under different seasons and lighting conditions.
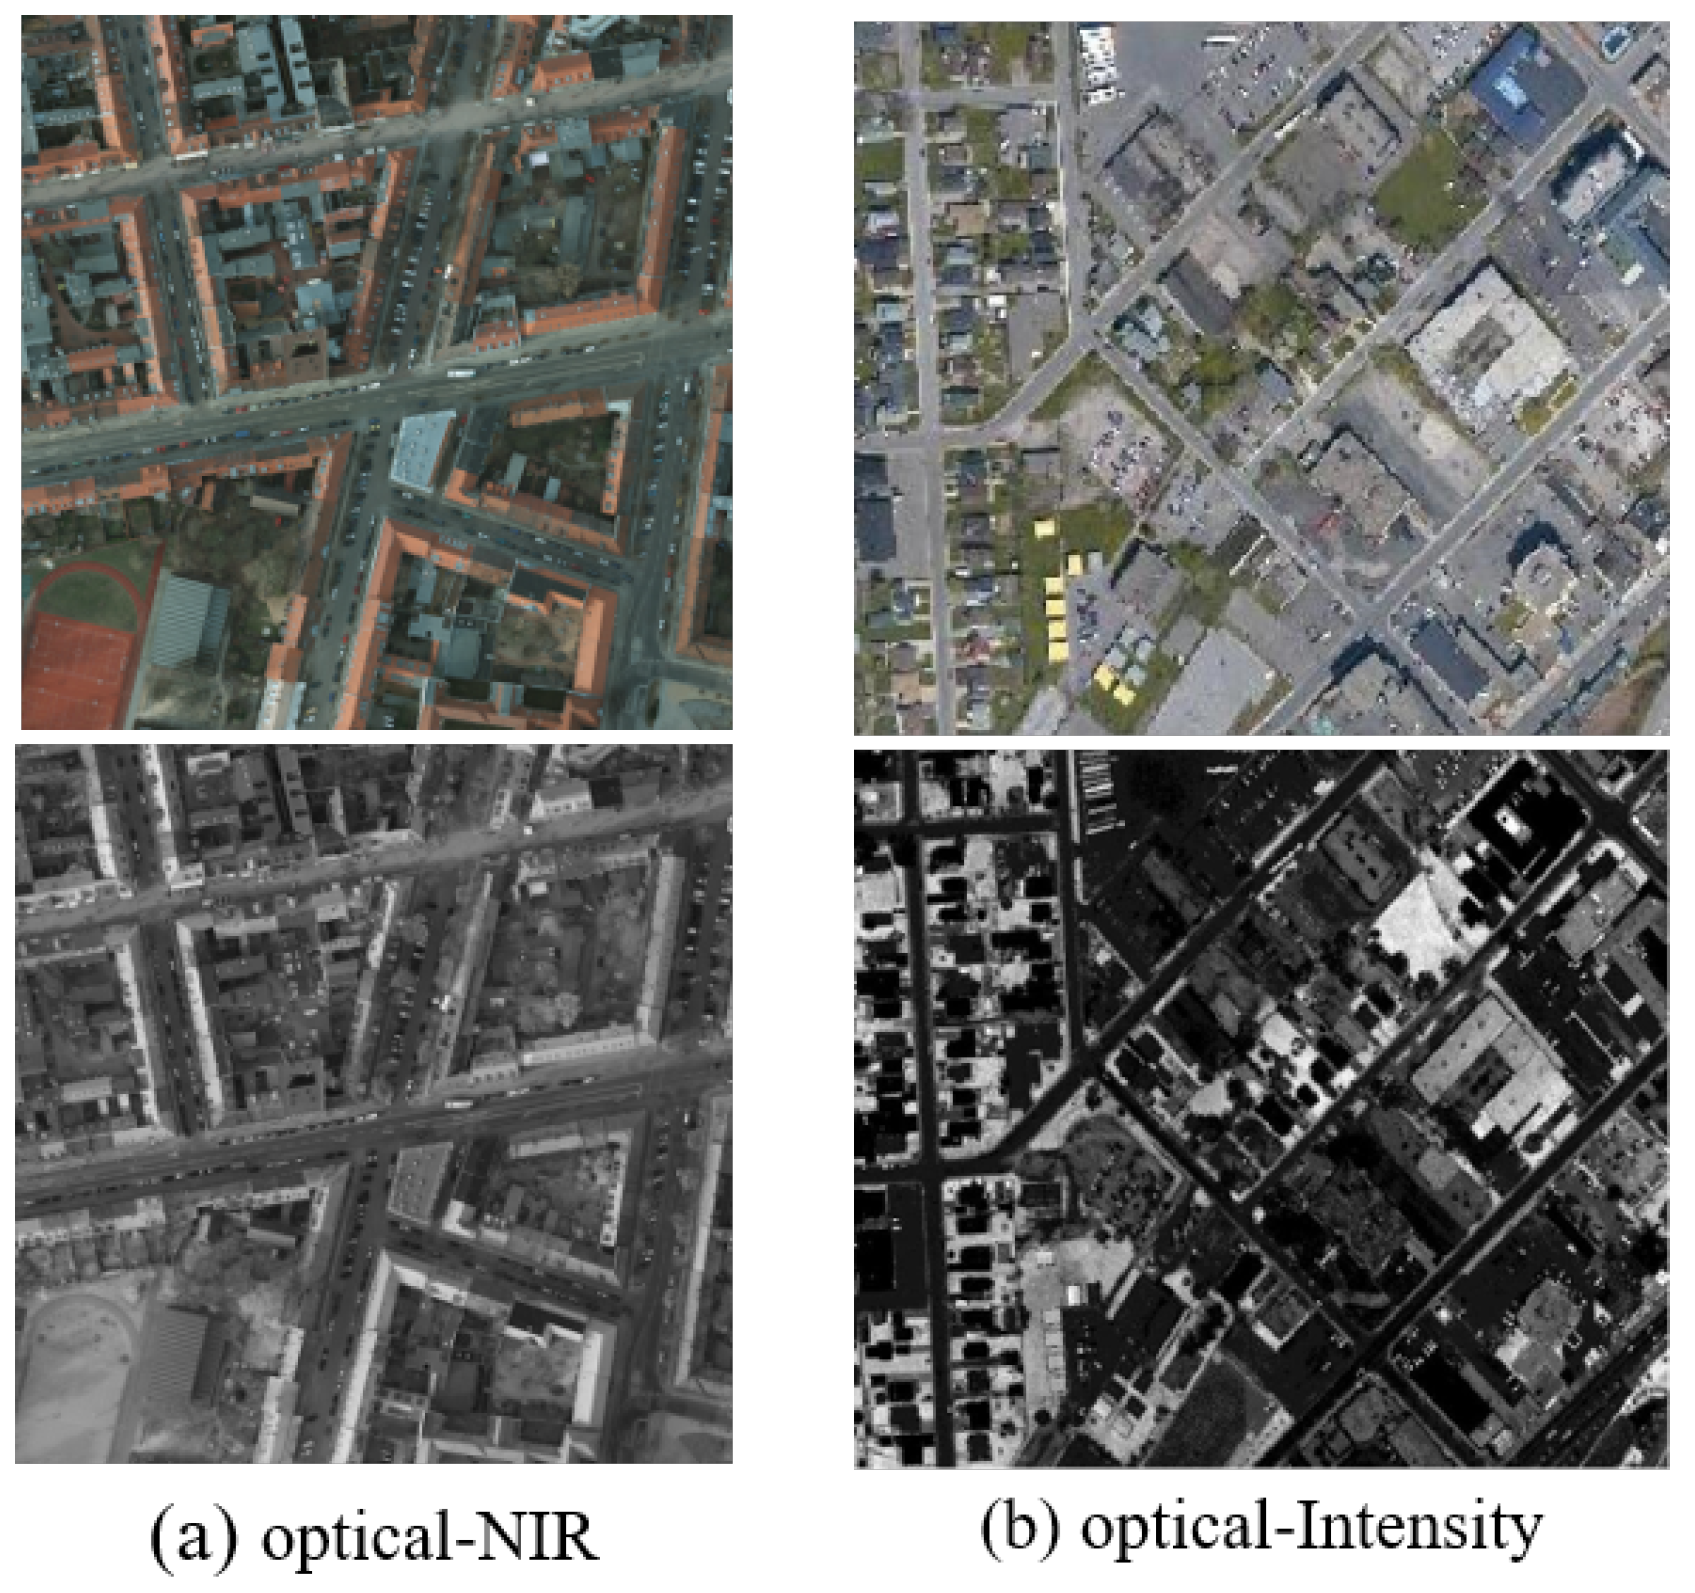
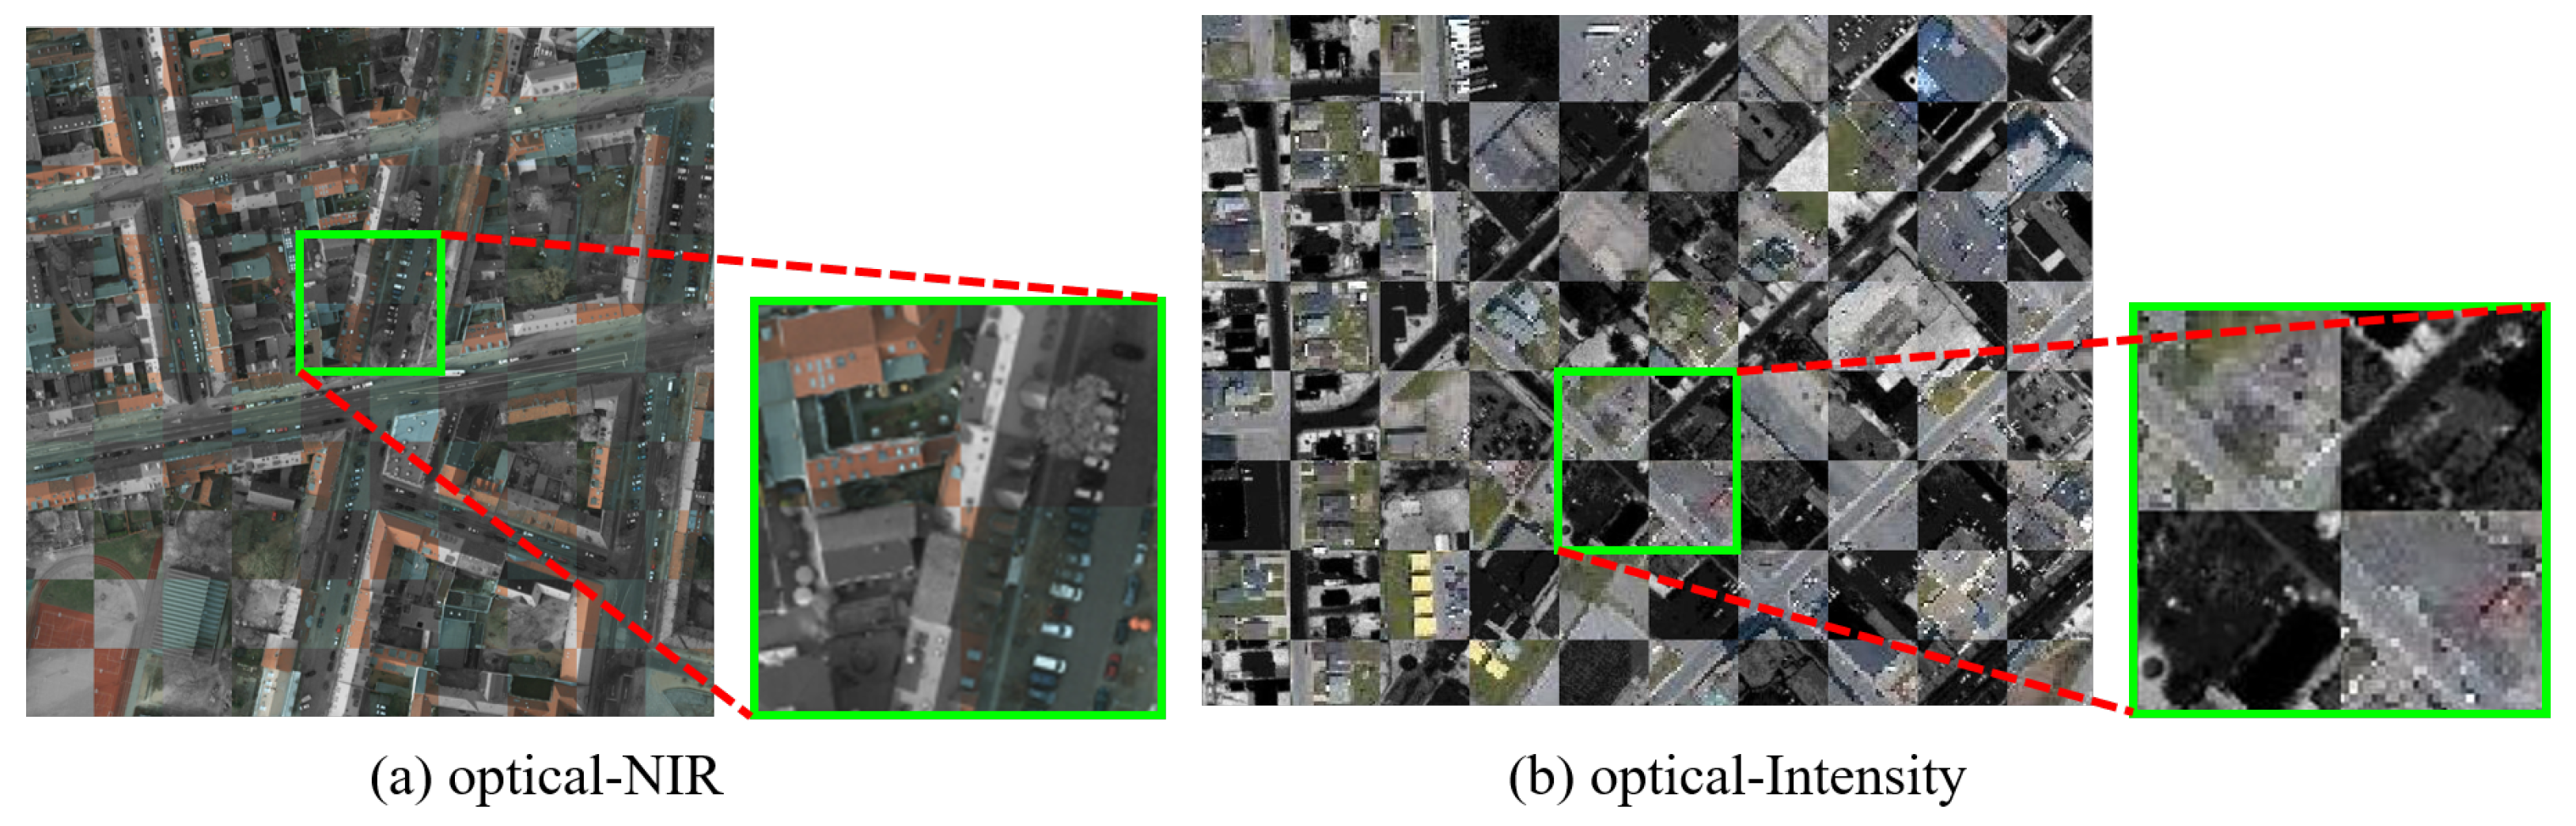
For the test data set, it contains two kinds of remote sensing image pairs with very different imaging styles as shown in Figure 11. Optical-NIR (near-infrared) image pairs are from the Potsdam data set [30] which contains 38 patches of equal size. The Potsdam data set mainly includes the multispectrum remote sensing images with a large number of ground repeatable structures and road feature information. Each patch image has the same size 6000 × 6000, and the resolution is about 5 cm/pixel. Furthermore, another test data set is the optical-Intensity image data set. The optical-Intensity image pair as aerial images contain optical spectral band and LiDAR intensity information on the Niagara city area in Canada. The intensity image refers to the echo intensity of laser pulse emitted by the LiDAR sensor, which is mainly related to laser incidence angle, ground reflectance, laser pulse transmission distance, and other factors. Under ideal conditions, the intensity value satisfies the Lambertian reflection model [41]. Therefore, there are great differences between optical image and intensity image in imaging principle and imaging conditions, and there is serious nonlinear mapping distortion in the grayscale values of the corresponding pixels, this nonlinear mapping distortion will bring a great challenge to the matching methods.
For all image pairs, the optical-NIR image pairs have been strictly aligned to evaluate the accuracy of all methods. While the optical-Intensity image pairs have not been aligned, and there is no true geometric transformation between image pairs. Therefore, quantitative evaluation can only be carried out by using the approximate value as the true value. In the specific operation process, we can manually select multiple uniformly distributed correspondence point pairs in the image pair, and use the Linear Least Squares to estimate the transformation parameters that are close to the true value.
In order to evaluate the matching performance of our proposed method LURF, state-of-the-art methods including SIFT, SURF, LGHD, and LPM are used to compare with LURF on multimodal remote sensing image data sets for qualitative and quantitative evaluations. According to the homography matrix between the image pair, it can be calculated to determine whether the feature points are repetitive, the repeatability R e p as the evaluation metric can be defined as follows:
R e p = N c ( n s + n t ) / 2 = | { x i s H · x i t } 3 } i = 1 n s | ( n s + n t ) / 2
where N c represents the number of repetitive correspondences, n s and n t represent the number of feature points in scene image S and target image T, respectively. H is the ground truth transformation between image S and T. x i s and x i t are the homogeneous coordinates of a feature in S and T, respectively. | { x i s H · x i t } 3 } i = 1 n s | represents the number of corresponding feature points pairs whose re-projection error less than three pixels.
Moreover, the correct matches rate (CMR) can be chosen as another evaluation criterion. CMR is defined as follows:
C M R = # C M # C
where # C M and # C represent the number of correct matching points and total matching point pairs, respectively.
In order to evaluate the registration alignment accuracy of the transformed image, the root mean square error (RMSE), mean error (ME), and the success rate can be adopted as the evaluation metrics.

4.2. Performance with Respect to Feature Point Detection

In this part, to evaluate the feature detection performance of the proposed LURF, a comparison of it with three state-of-the-art feature key point detectors is made, which are SIFT, SURF, and FAST [42]. Among five comparison methods including SIFT, SURF, EHD, LGHD and LPM, SIFT, and SURF find extreme points as feature points in constructed Gaussian scale space. Both EHD and LGHD chose to use the FAST detector to detect the key points. LPM is used to remove the mismatching relationship when SIFT is usually adopted to establish putative feature correspondences, and its essence is still to use SIFT to detect key points. In order to evaluate the key point detection methods fairly and effectively, the parameters of each comparison method are fine-tuned to obtain the best performance and are consistent in all test image pairs. SIFT is implemented by the open-source VLFEAT toolbox, and other comparison methods are obtained from the authors’ website. The results of our proposed LURF and the comparison methods for detecting key points in test image pairs are shown in Table 1.
Table 1 has shown the evaluation metrics R e p and N c , the highest repeatability values are highlighted with boldface font. Through observation and comparison, it can be found that R e p of our LURF maintains a high feature point repetition rate in all test data set, and is more than twice that of other comparison methods. It is worth noting that the number of repetitive correspondences N c , N c of LURF is not so many and far less than other key point detection comparison methods. The essential reason is that our proposed LURF is closely related to the actual number of intersection points in each multimodal image. Although there are not many intersection points in the image, considering these stable intersection points as key points can greatly improve the repetition rate R e p of key points and reduce redundant descriptions of a large number of invalid key points. This consideration for key point extraction will greatly improve the matching efficiency.

4.3. Performance with Respect to Matching

To demonstrate the matching performance of our proposed LURF, we compare it with the above five state-of-the-art methods, and the qualitative evaluation of all six methods is shown in Figure 12 and Figure 13. To investigate the influence of rotation and scale changes, we test the proposed method on two groups simulated images with different rotation angles and scale factors. The NIR image has affine transformation with rotate transform ( θ = 6 ) and scale transform (s = 0.75), and the intensity image has affine transformation with rotate transform ( θ = 0 ) and scale transform (s = 0.75). In order to fairly compare the performance of all methods, the threshold value of Nearest Neighbor Distance Ratio (NNDR) for SIFT and SURF methods was been set as 0.7. SIFT, SURF, EHD, and LGHD these four comparison methods can adopt Ransac [43] to remove mismatching point pairs. LPM can remove mismatching point pairs by preserving the local structure consistency of correct correspondences matching. The proposed LURF has a global optimization strategy to achieve the correct match.

4.3.1. Qualitative Comparisons
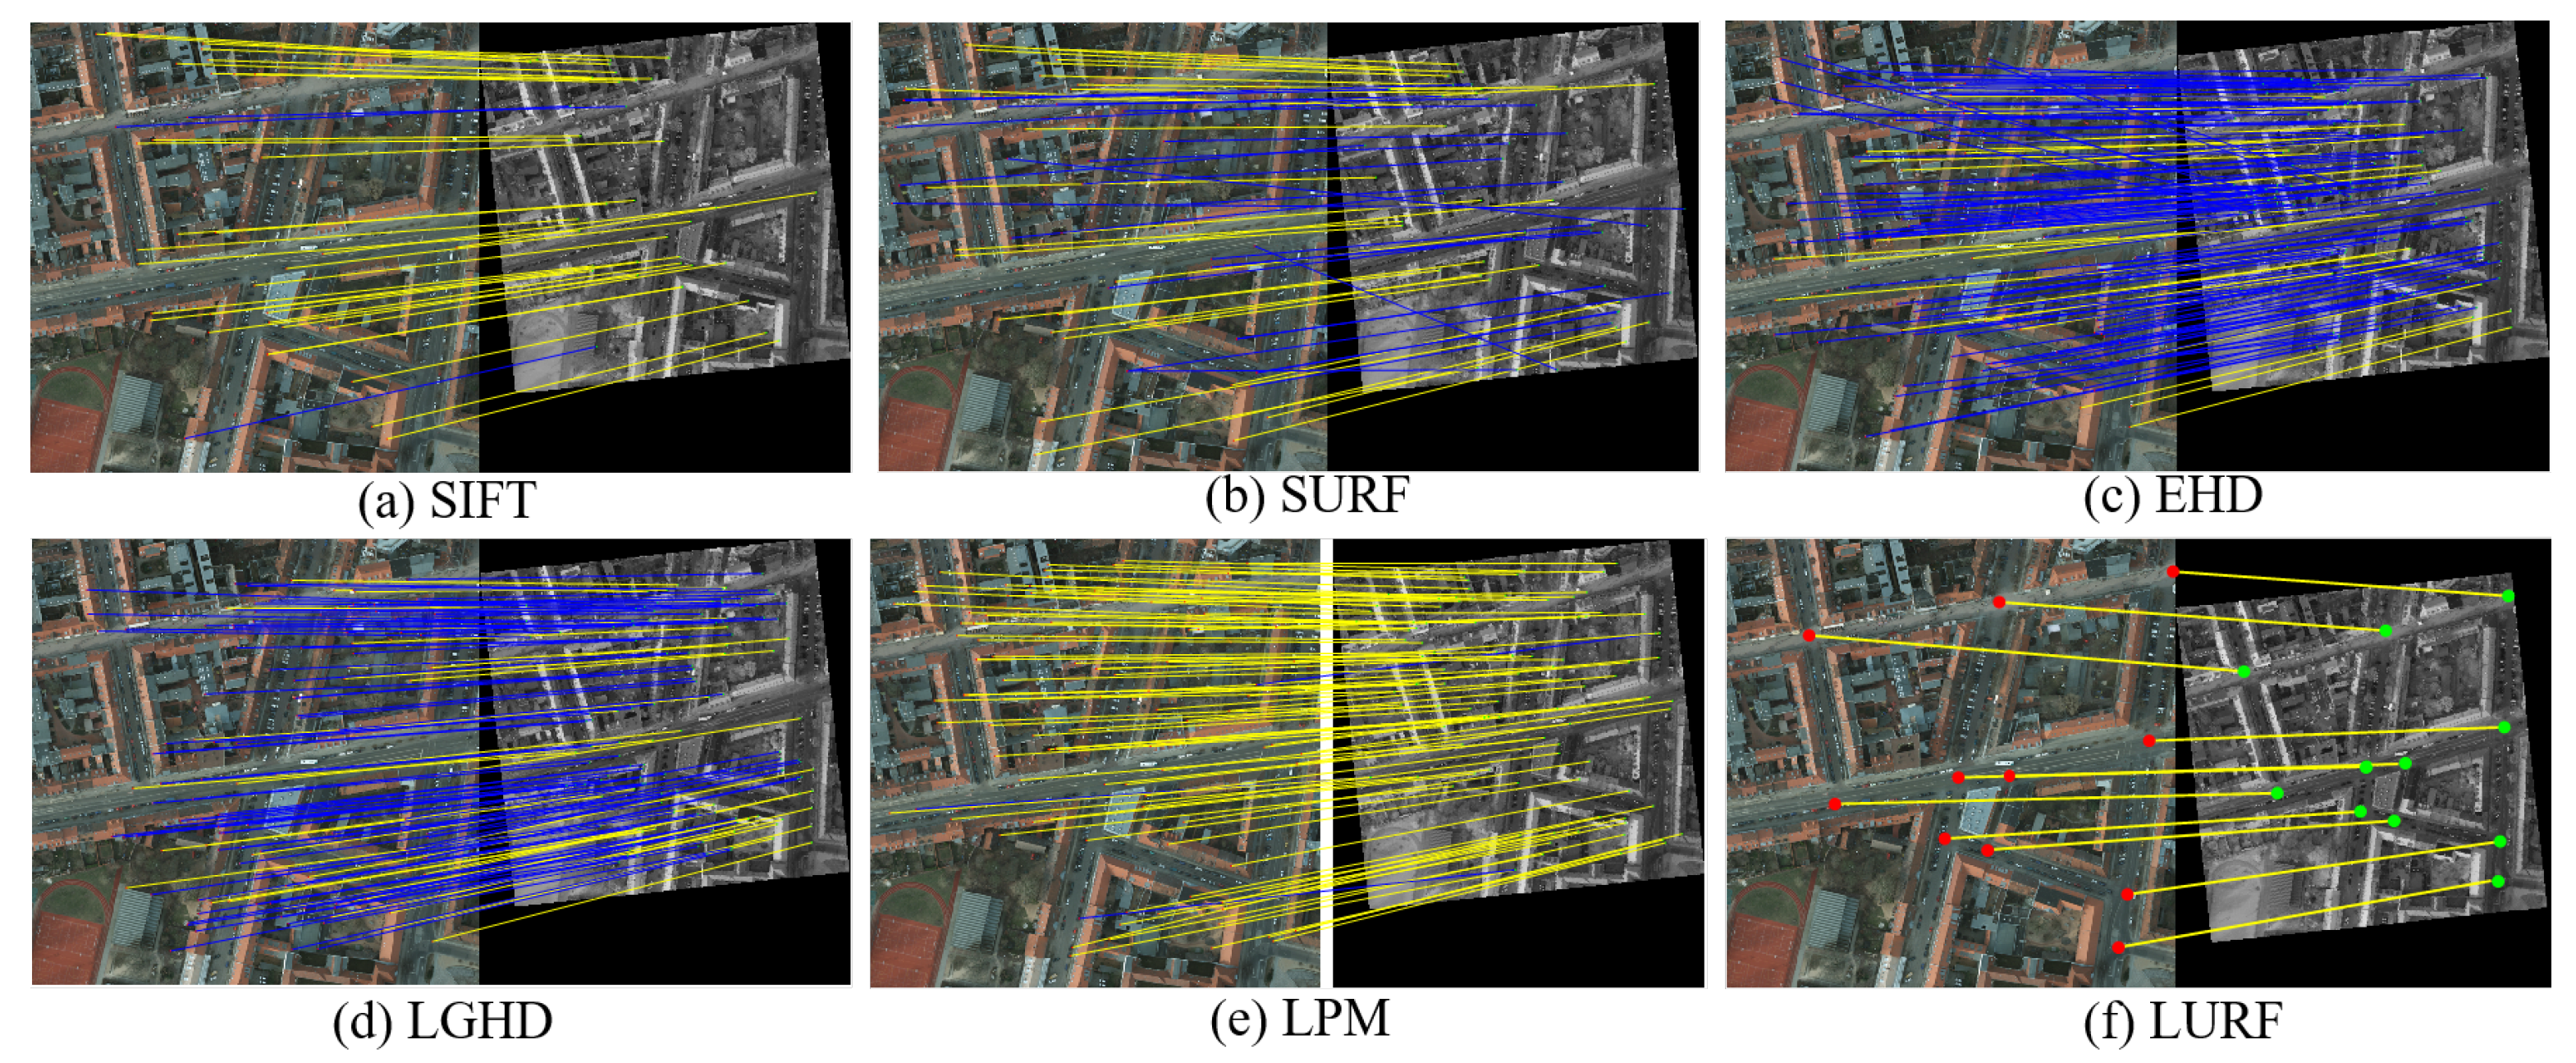
Figure 12 and Figure 13 show the qualitative comparison results of SIFT, SURF, EHD, LGHD, LPM, and proposed LURF in the sample image pairs from different multimodal data sets. As seen, SIFT, SURF, EHD, LGHD, LPM, and LURF all methods have a certain matching effect on the optical-NIR image pair shown in Figure 12, and the reason is that the spectrum of the near-infrared image is relatively close to that of optics, the grayscale value of the pixel corresponding to the image satisfies a certain linear mapping relationship, the nonlinear grayscale distortion is not obvious, and the details in the optical-NIR image pair have certain common characteristics. Among all methods, our proposed method LURF has obvious advantages and can accurately extract almost all intersection points as key points for matching. LURF has a high matching accuracy than the other five comparison methods. At the same time, we can also see that EHD has the least number of correct matches in all comparison methods, followed by the LGHD. The number of correct matches of LPM is significantly higher than other comparison methods, but there are still a small number of mismatching point pairs.
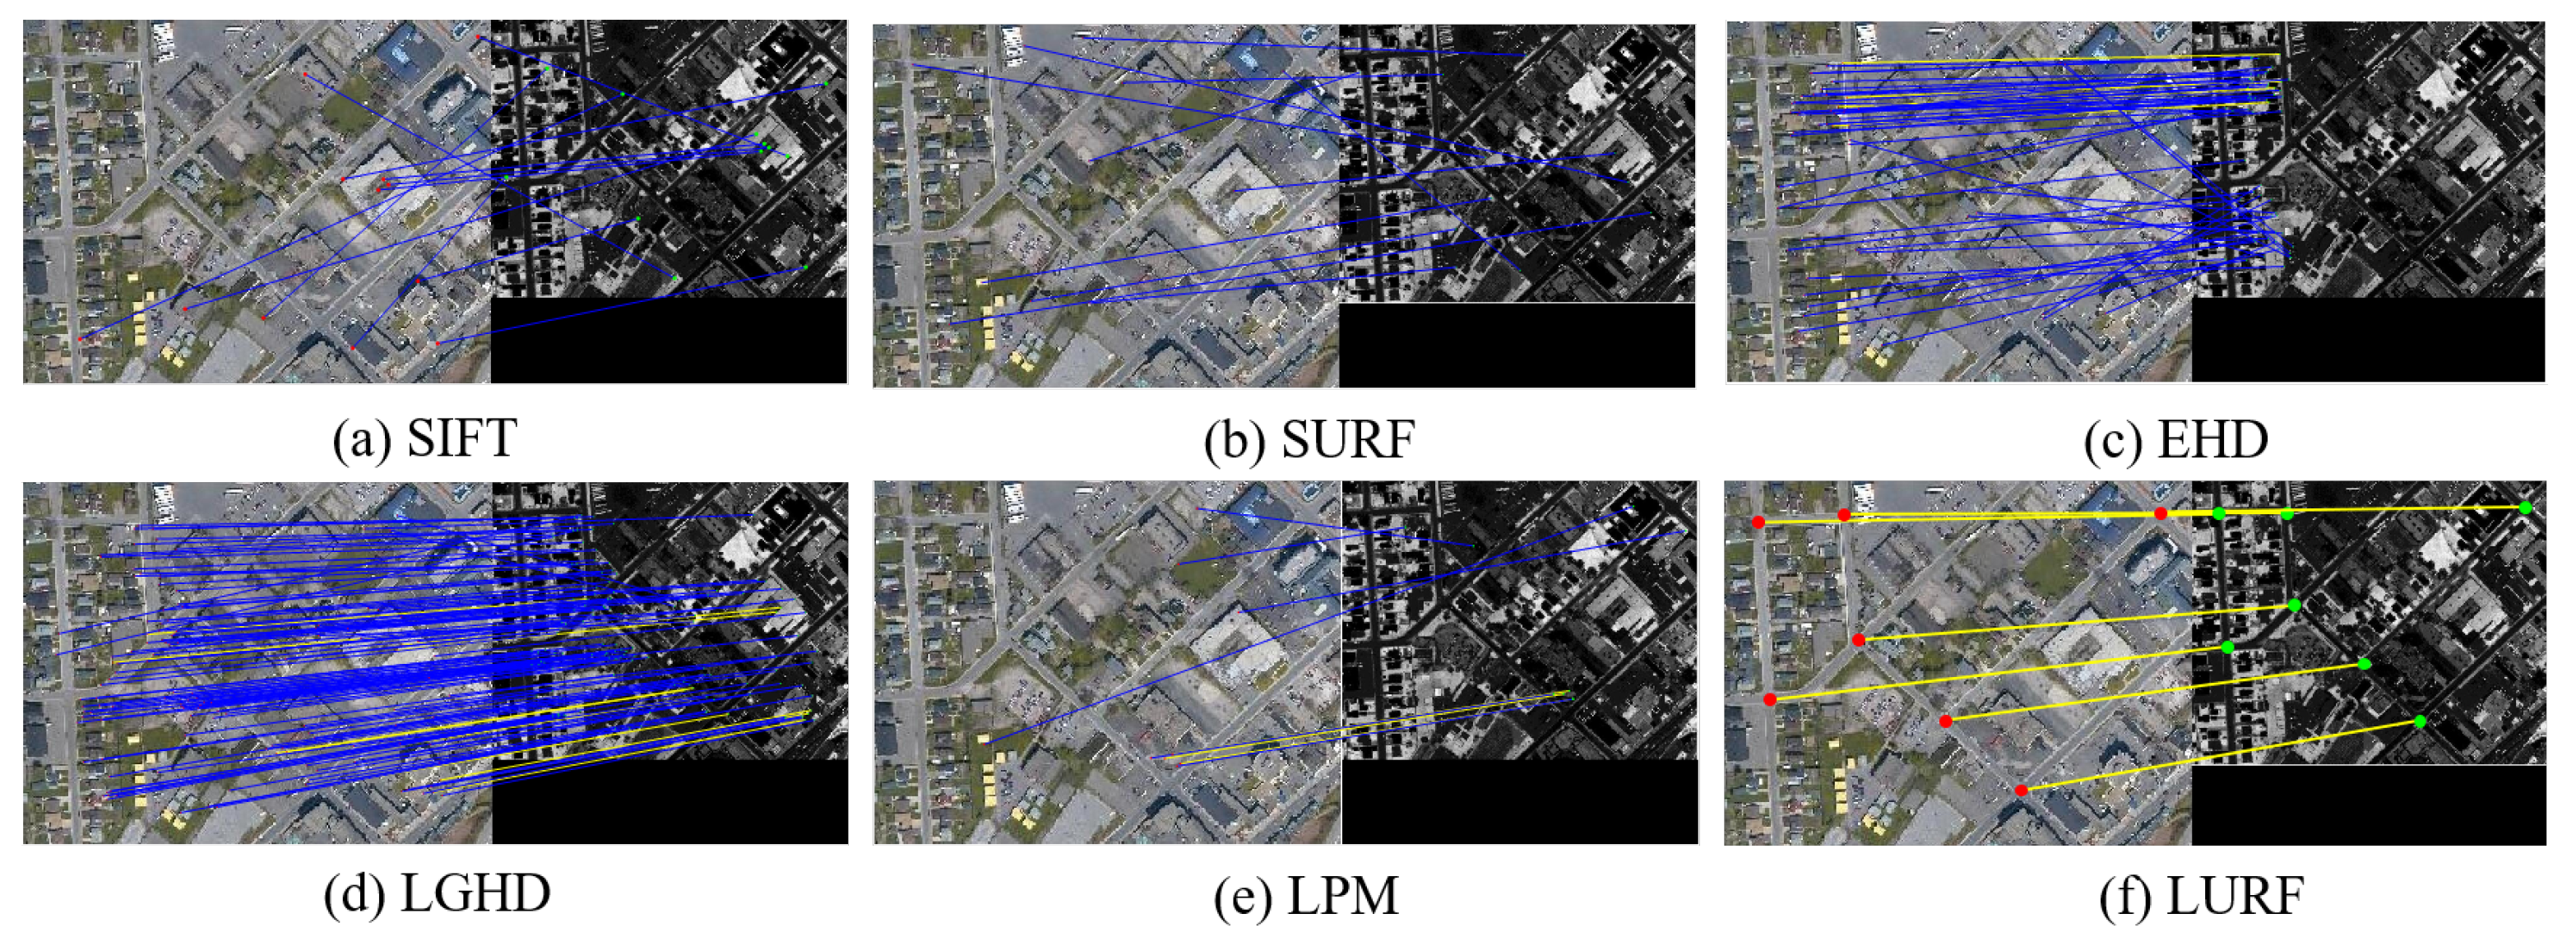
Due to the serious nonlinear grayscale distortion between the image pairs as seen in Figure 13, the number of correct matching point pairs in the image pair by all comparison methods is less than four, so the transformation matrix cannot be effectively and accurately estimated, and the image matching task can be regarded as a failure. In contrast, our proposed method LURF still achieves a good matching performance, despite serious differences in optical-Intensity image styles. The comparison method such as SIFT seems powerless in this case, the robustness of comparison methods is greatly reduced.
The image registration results with checkerboard mosaic display obtained by the proposed method LURF are shown in Figure 14. As seen, LURF can effectively overcome the different geometric transformation interferences of different image data sets to achieve the registration task.
Taken together, it can be seen from the qualitative evaluation experiments that our proposed method LURF is far superior to other state-of-the-art feature matching methods for multimodal remote sensing image matching. The reasons may be as follows: (1) Even though multimodal remote sensing image pairs may have a certain degree of nonlinear grayscale distortion, the deep semantic features will maintain a good consistency. (2) Compared with directly extracting feature key points from pixel grayscale, choosing more stable and reliable semantic intersection feature points with structural properties as key points undoubtedly is a better idea.

4.3.2. Quantitative Comparison

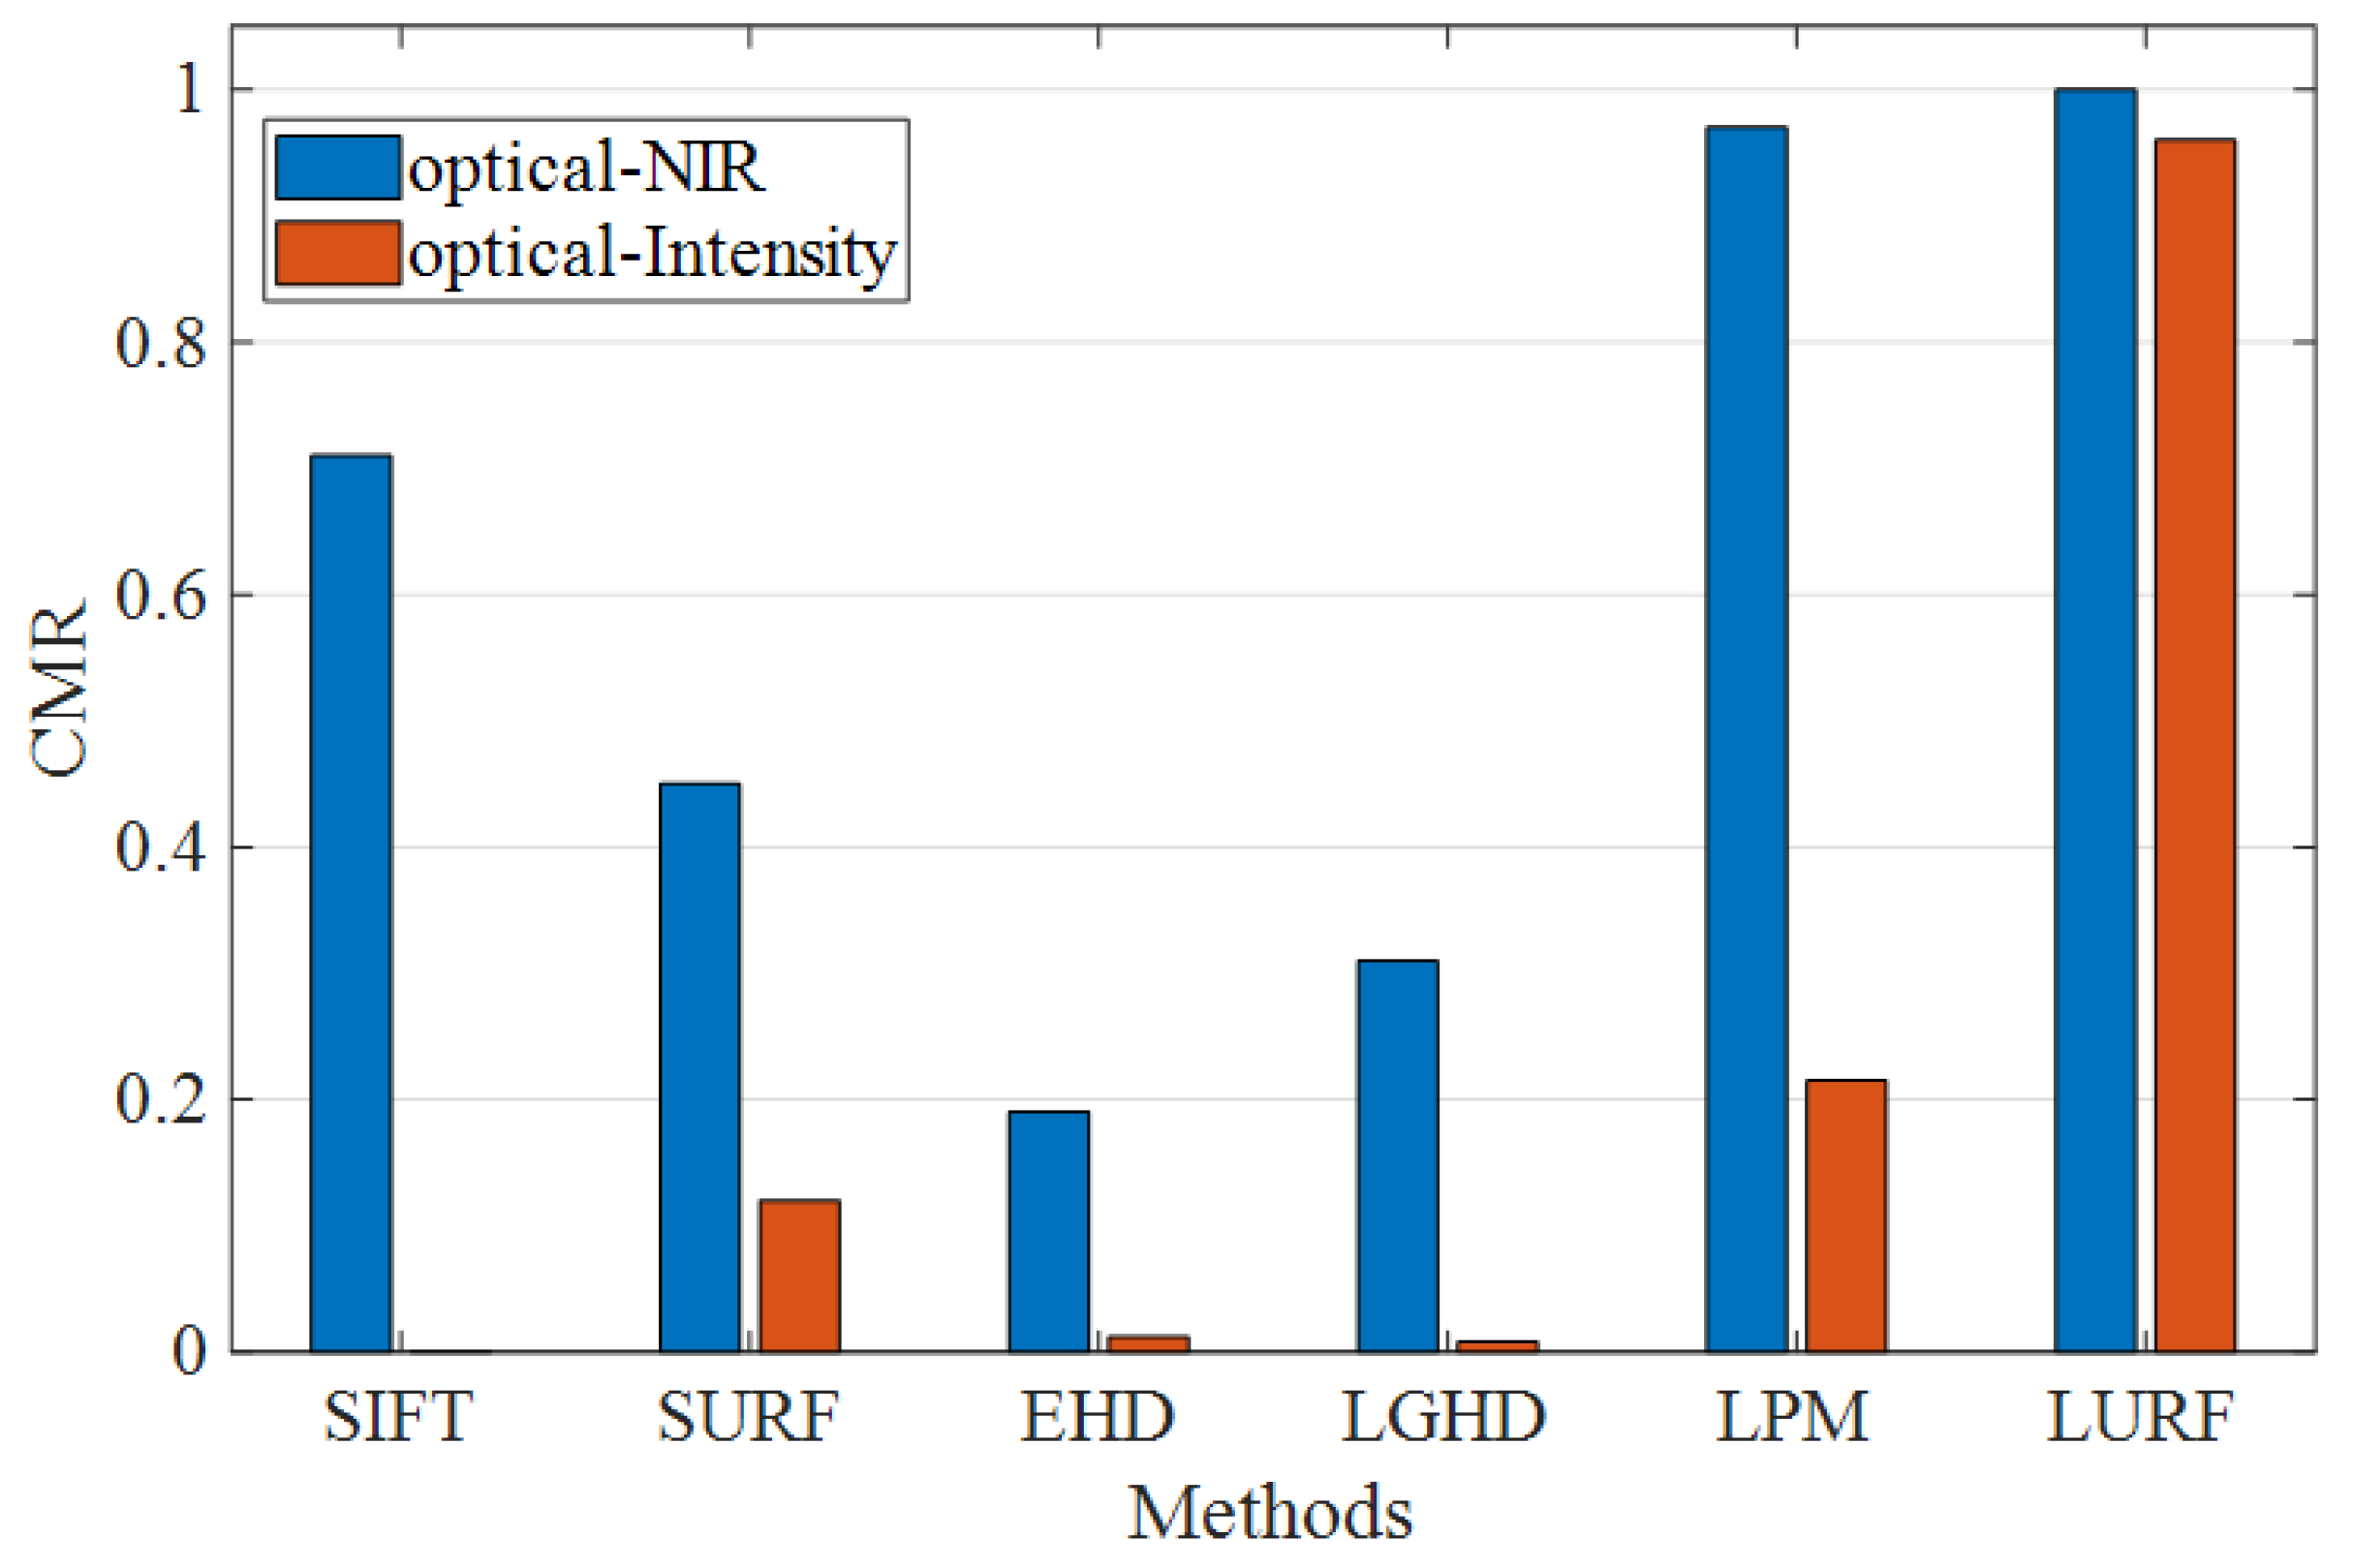
Figure 15 indicates the quantitative experiment results in terms of C M R values of all comparison methods and proposed method in different image pairs. As can be seen from Figure 15, in the optical-NIR data set, our proposed method LURF and five comparison methods have an overall correct match rate of more than 15%, and the EHD has the lowest C M R value among all the comparison methods. Compared with other comparison methods, LPM has the highest C M R value, which is nearly five times that of EHD. The C M R of our proposed LURF is slightly higher than LPM, and the gap is not obvious. In the optical-Intensity data set, it can be clearly seen that all comparison methods perform poorly, even fail completely. At the same time, our proposed method has obvious advantages and achieves the best correct matching performance, and the C M R of LURF exceeds the best results of the comparative method by more than three times. Among five comparison methods, SURF and LPM have better results than SIFT, EHD and LGHD.
To verify the alignment accuracy of proposed method LURF, Table 2 reports the evaluation metrics R M S E , M E and the success rate on all data sets. As seen, the proposed LURF has high accuracy, the R M S E error is 1.32 and 1.88 pixels in the optical-NIR and optical-Intensity image data sets, respectively. The M E error is only 1.27 and 1.57, respectively. The values of R M S E and M E are all less than the three-pixel error requirements. From the success rate evaluation metric, it can be seen that the proposed LURF achieves excellent performance on all datasets, with scores of 100% and 97.6%, respectively.
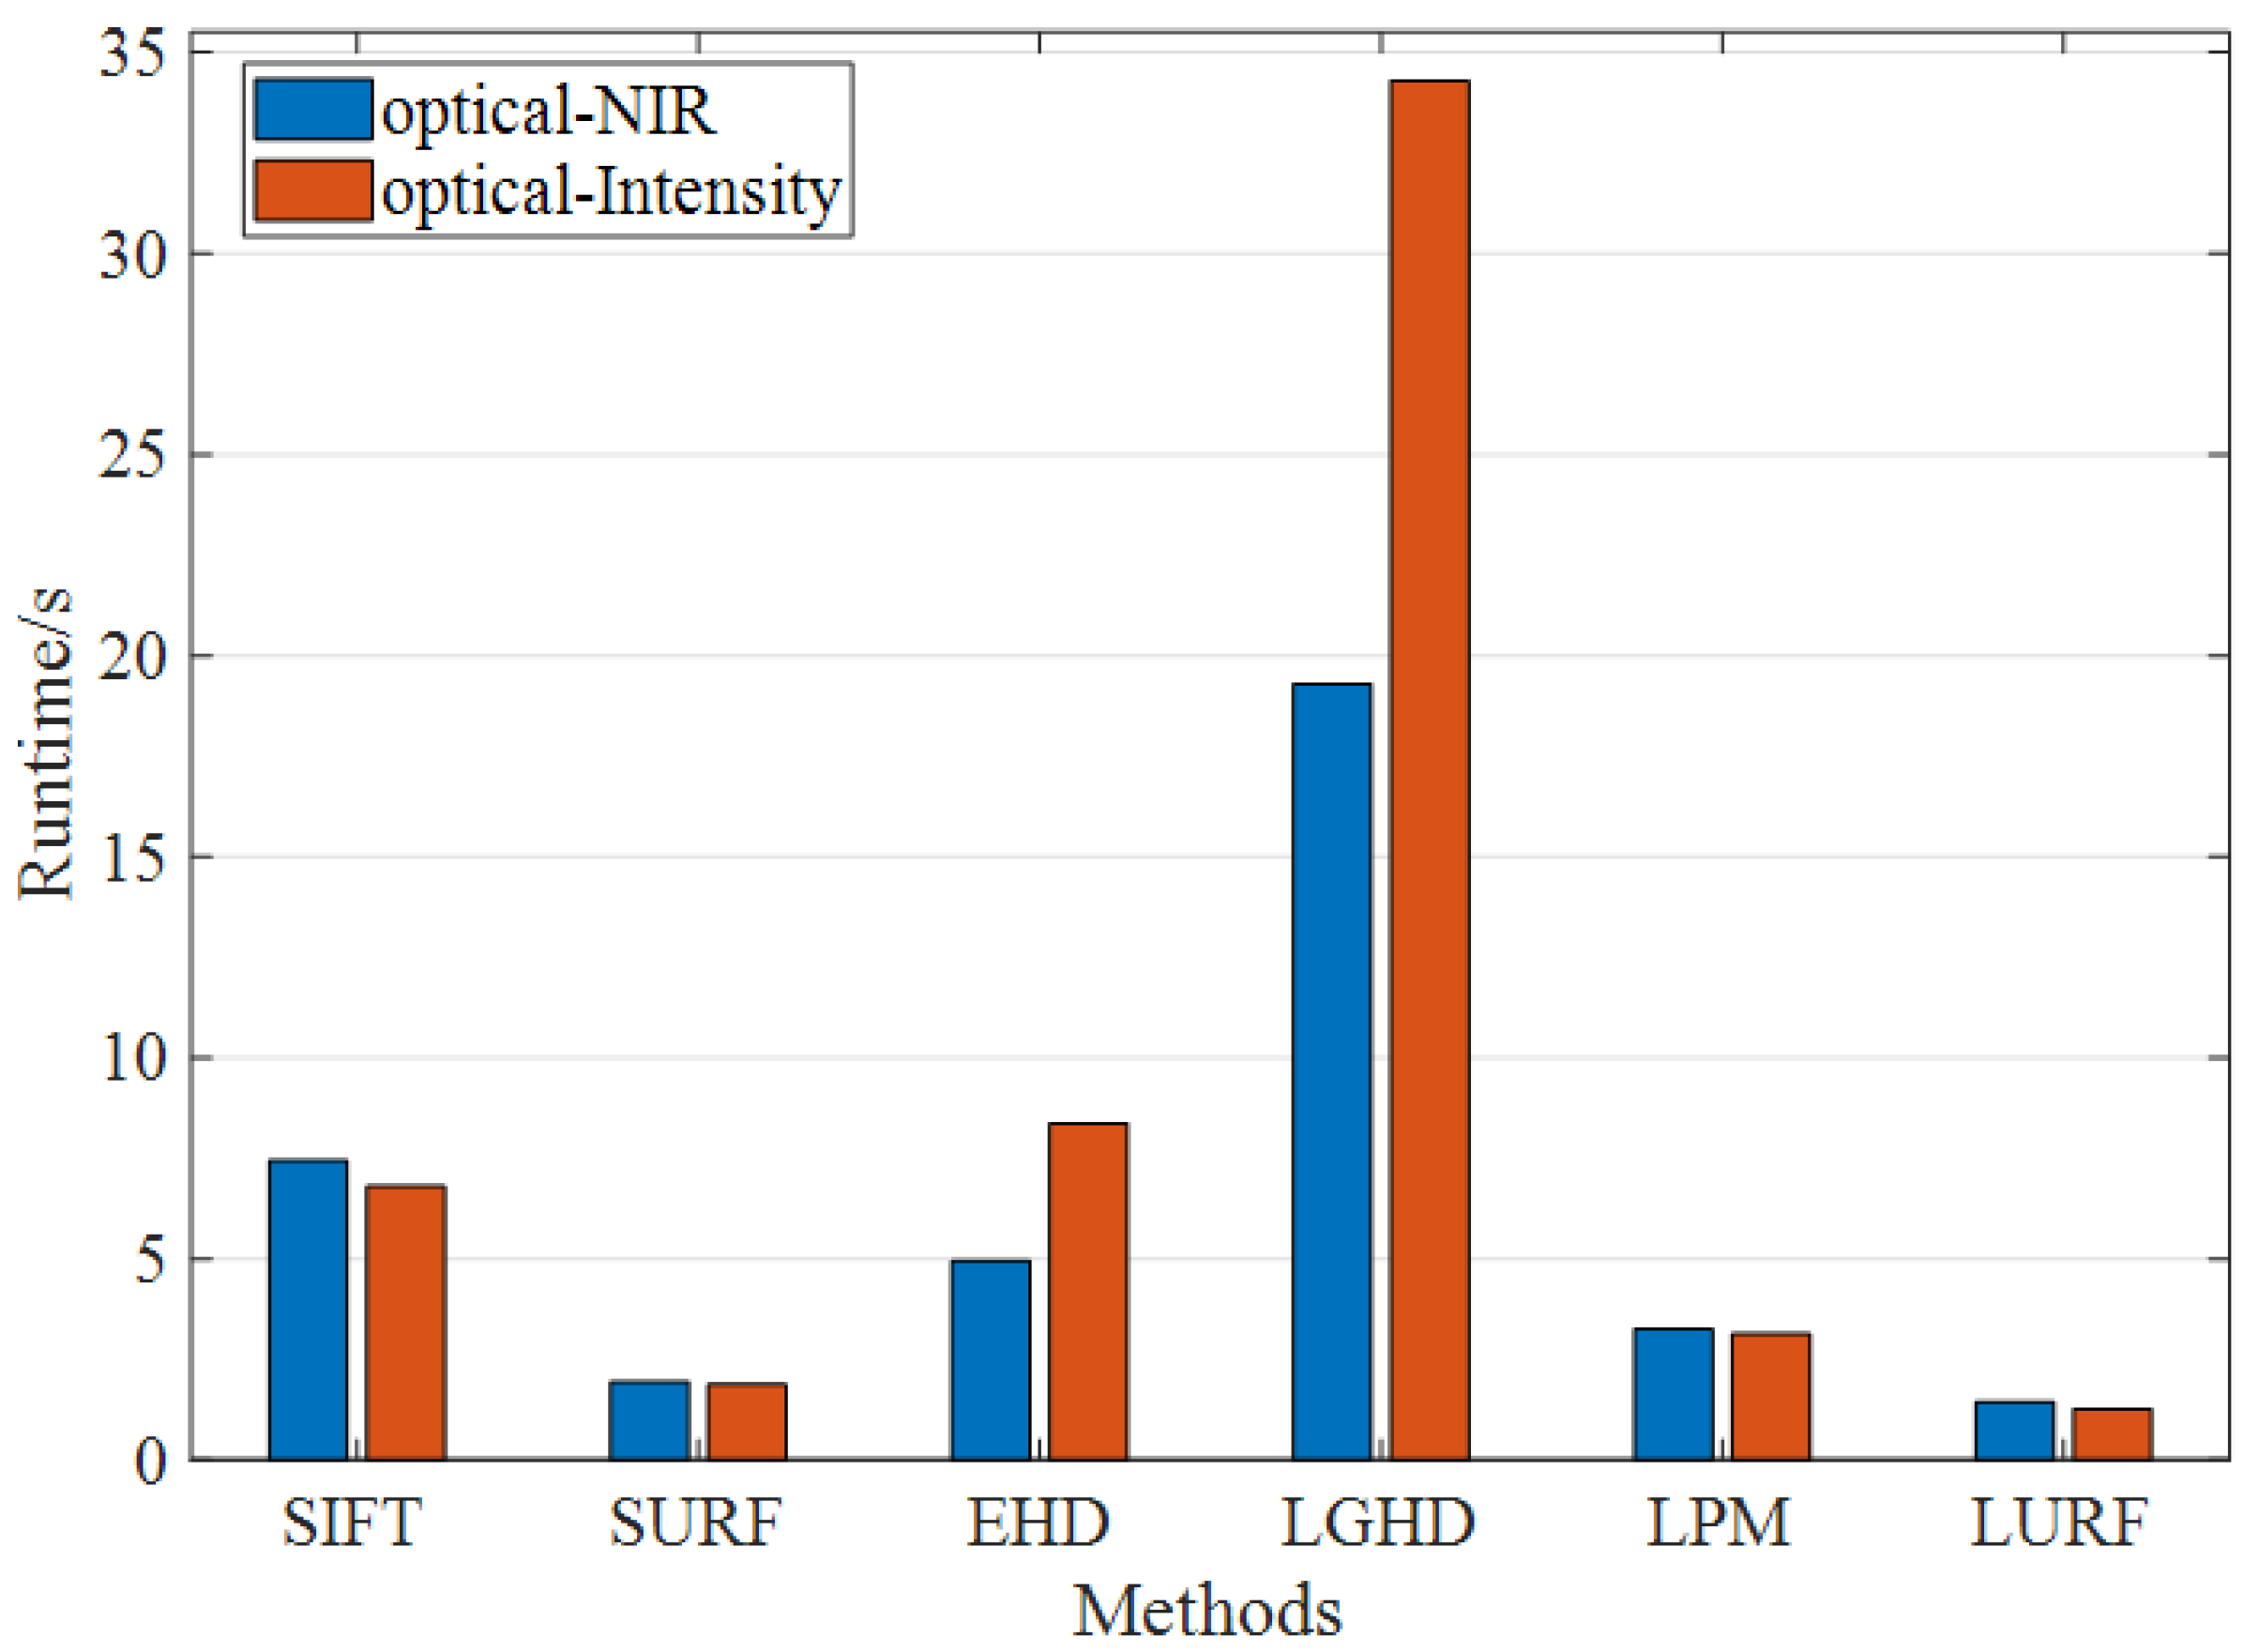
As well as the matching accuracy, the computational efficiency is another important metric for evaluating the matching performances. Figure 16 represents the average running time of each compared method on the whole image pairs. The running time experiment has been implemented in Matlab using a PC equipped with a 3.4 GHz CPU and 4 GB memory. As can be seen, the running time of LURF costs the shortest running time than other compared methods, which is about twice that of LPM and five times that of SIFT. Among all comparison methods, LGHD has the lowest matching efficiency and takes an average of about 20 and 35 s on the data set, respectively. The proposed method can achieve excellent matching efficiency, the reason is that the adopted CRESIv2Res-Unet network can quickly infer and extract road semantic features from the multimodal image. Meanwhile, the traditional method builds descriptors for all candidate key points, which increases the computational complexity. To cope with this issue, the proposed LURF focuses on the few but stable intersection points and the dimension of the local binary entropy descriptor is smaller than others.
In general, the proposed method LURF can have a higher CMR value while maintaining a shorter running time. The number of detected key points is small, but these key points have excellent stability and robustness, and the key point repetition rate and matching efficiency is better than the other five compared methods.

4.4. Performance with Respect to Curved Road Condition

Figure 17 shows the matching performance of the proposed LURF on multimodal image pair with curvy road information. Comparing Figure 17 with Figure 1, we can conclude that the proposed method LURF can effectively deal with the curvy road case for the multimodal image matching that the earlier method [6] can not. As can be seen from 
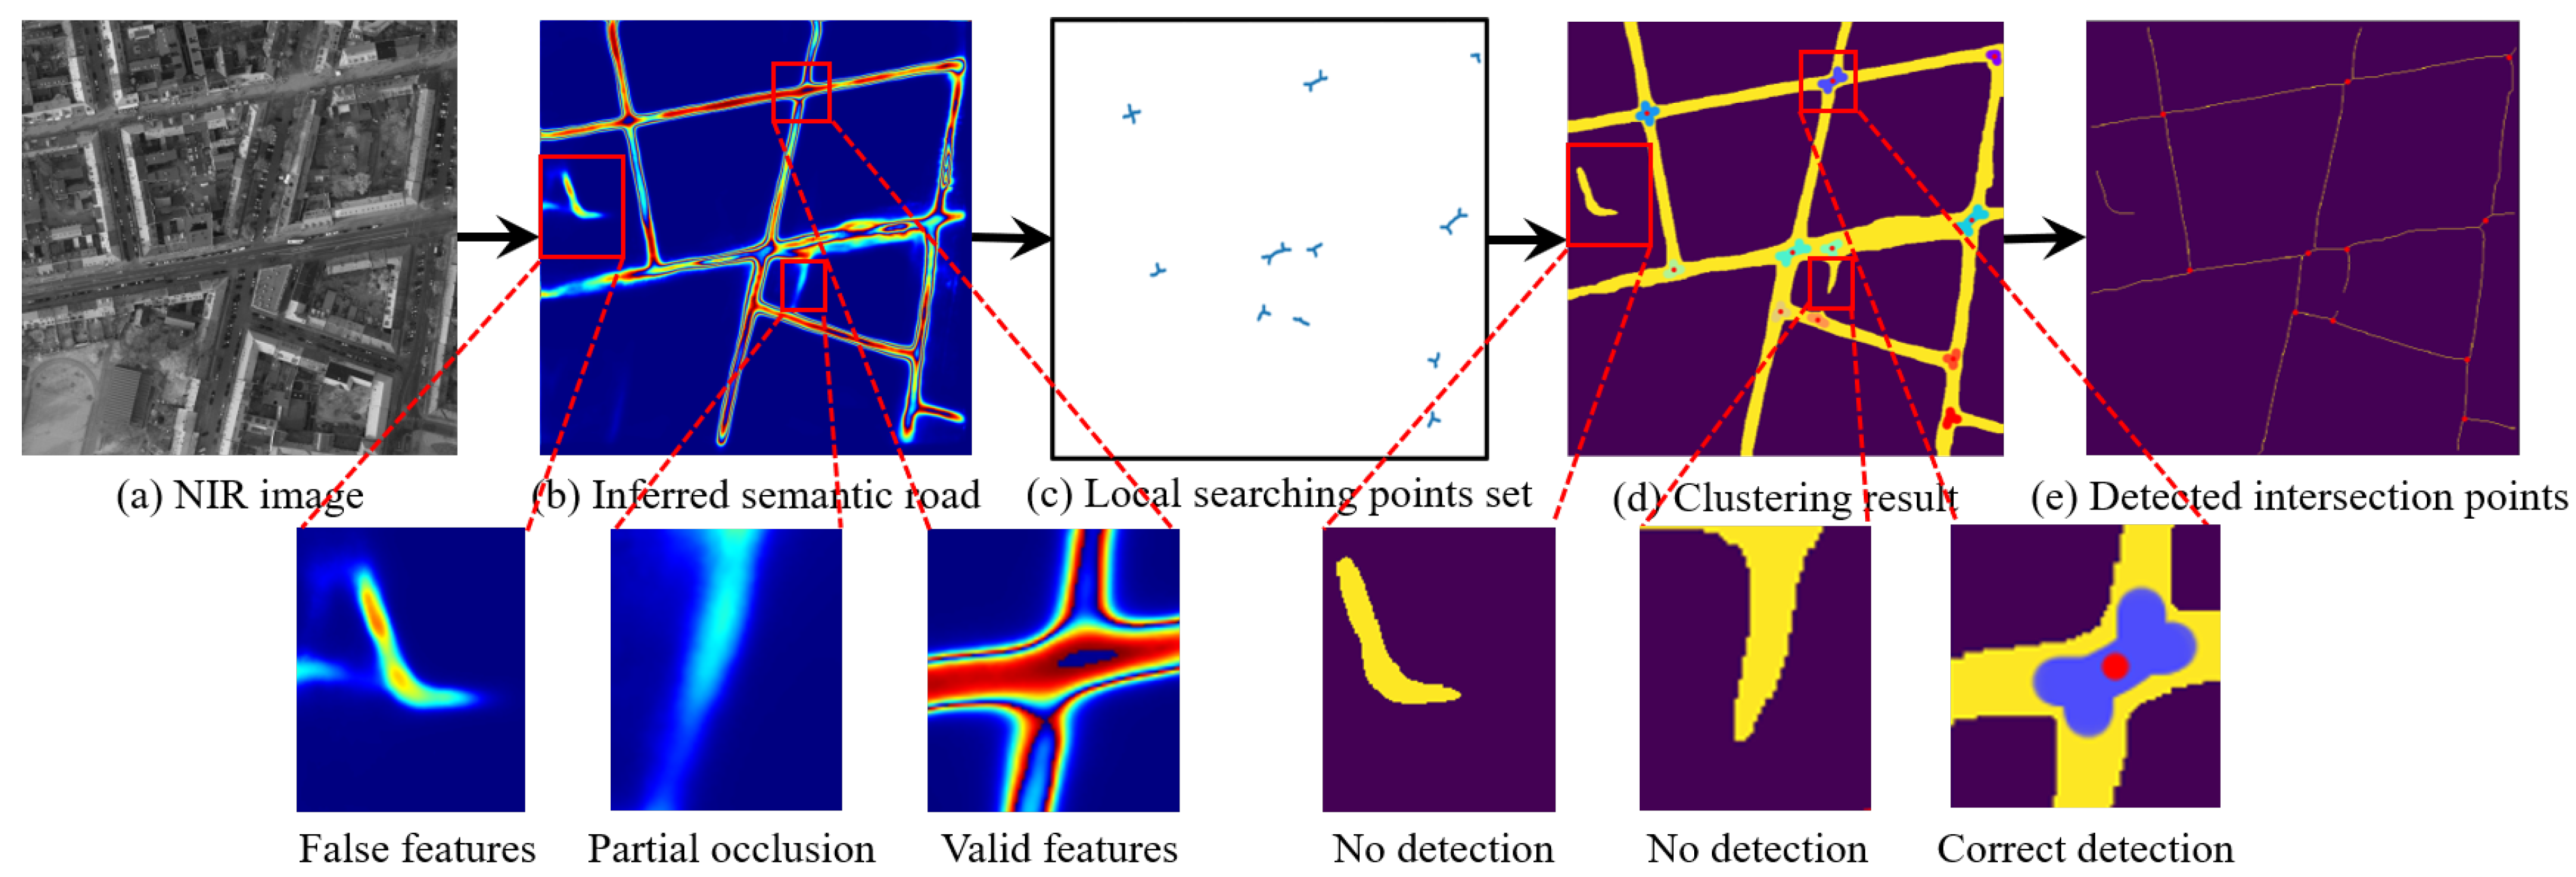
Figure 17, when the deep learning model CRESIv2 estimates road probability information, There are certain interfering factors such as false feature and partial occlusion, resulting in incomplete extraction of the semantic road features.
However, these issues can not prevent LURF from successfully achieving the feature matching task for multimodal images as seen in 
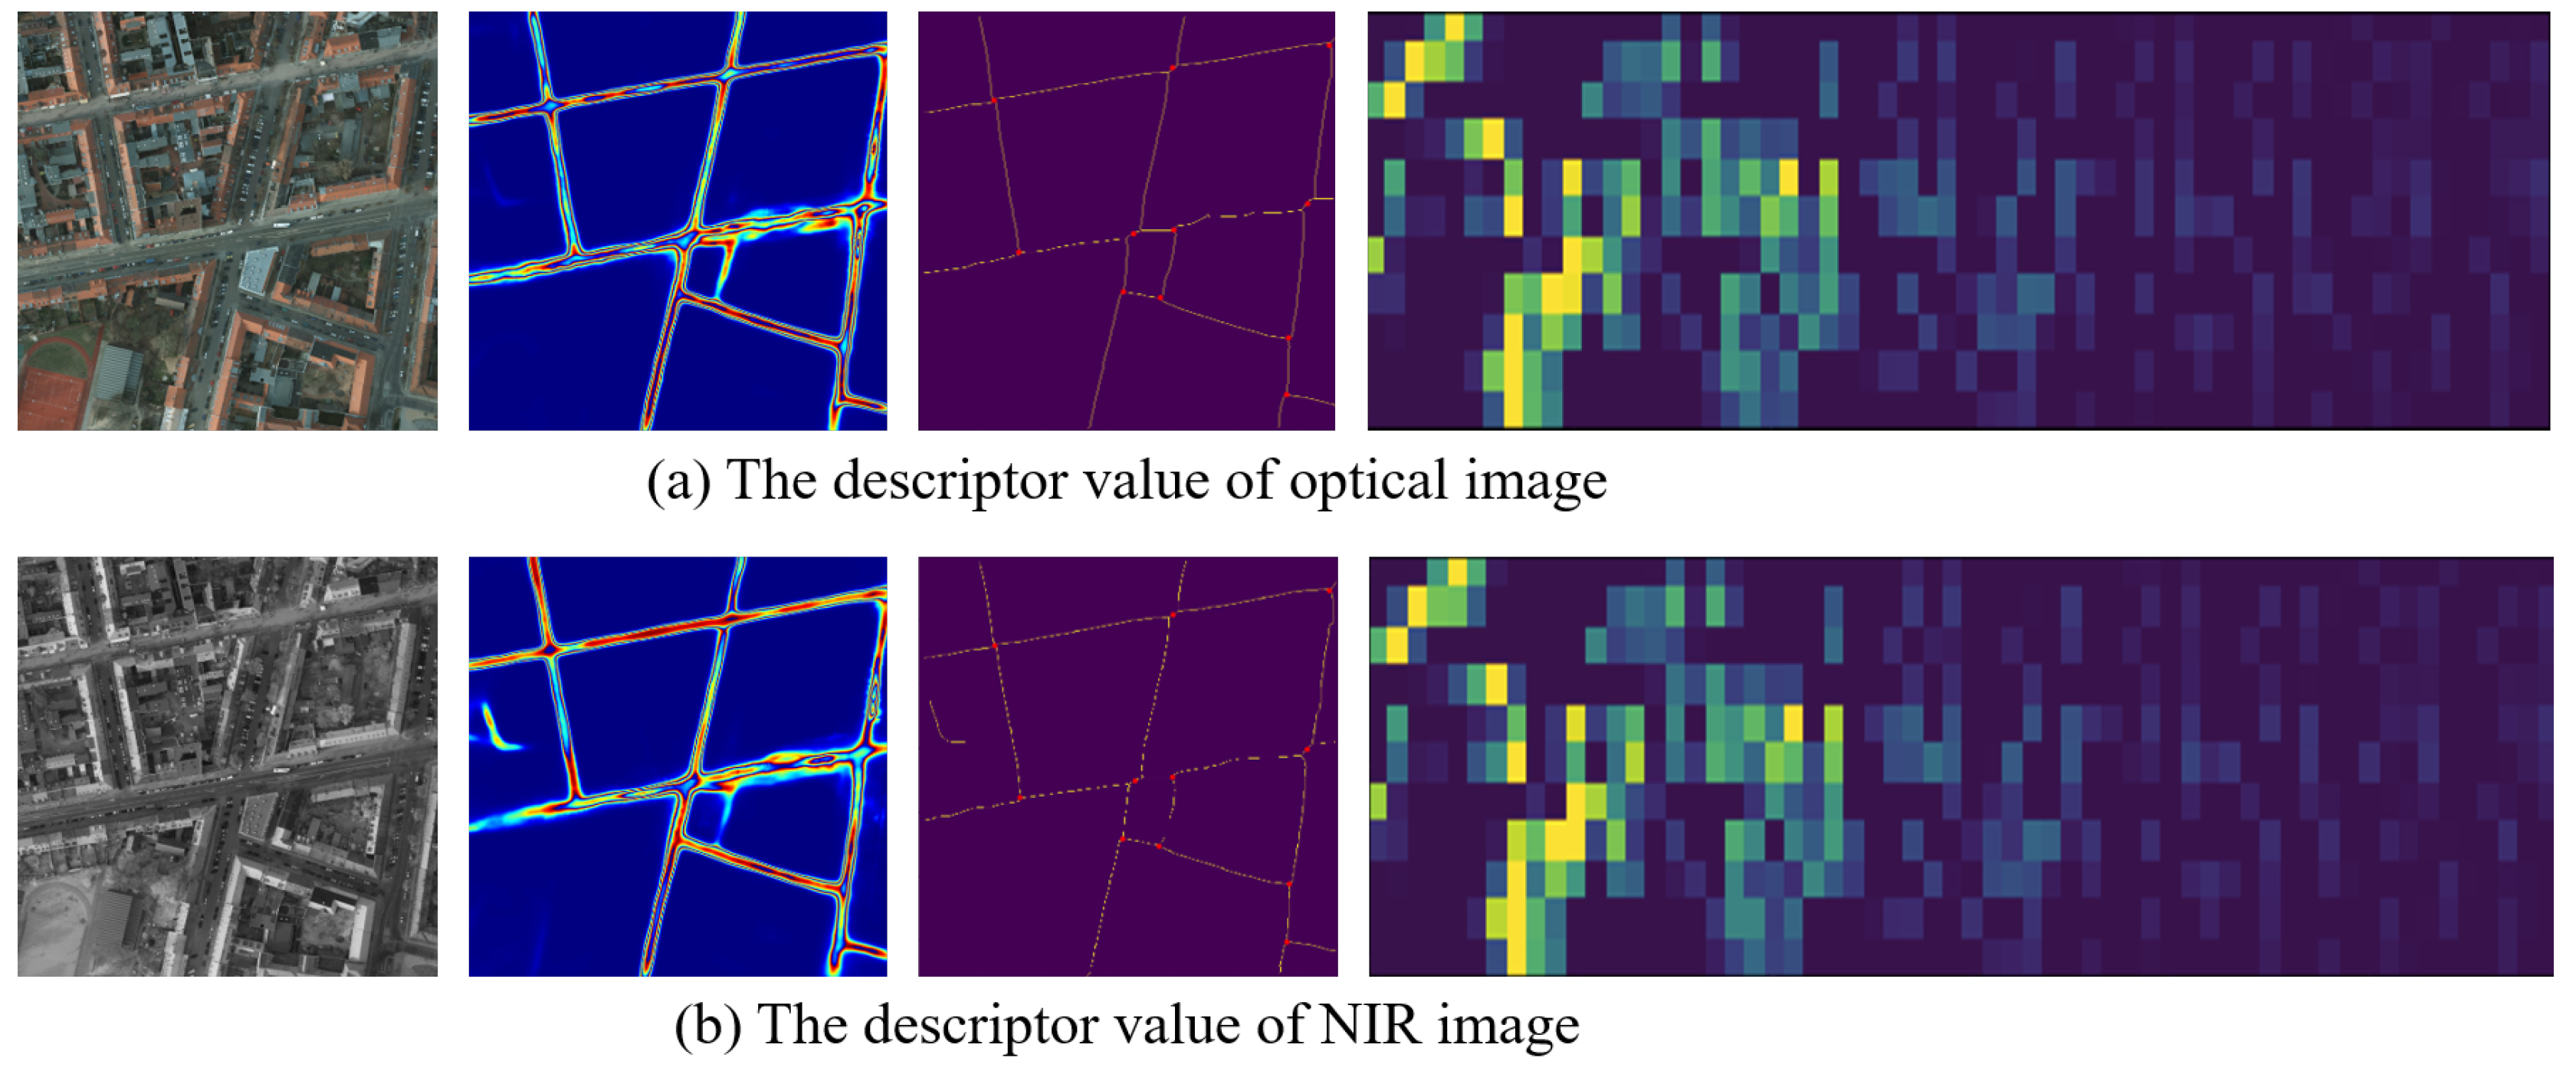
Figure 17c. It can be seen in Figure 17a,b, LURF can stably detect and accurately describe the road intersection points under the curved road condition, and the description values of the corresponding road intersection points are highly consistent, ensuring matching accuracy and reliability.

5. Conclusions

In this paper, we proposed a novel matching method named LURF via learned unstructured road feature for multimodal remote sensing image pairs. Firstly, the semantic road features were extracted from multimodal remote sensing images based on CRESIv2 network, which were invariant to nonlinear radiation distortions of multimodal image pair. Subsequently, based on semantic road features, a novel and accurate road intersection point detector has been proposed, and the detected unstructured intersection points can be considered as key points for matching. Then, a local binary entropy descriptor has been designed to represent key points with the local skeleton feature. Finally, for feature matching, a global optimization strategy is adopted to achieve the correct matching. The qualitative and quantitative experimental results on different multimodal remote sensing image data sets demonstrate that LURF is superior to other state-of-the-art methods, and has great efficiency and robustness for multimodal remote sensing image matching.

Author Contributions

Conceptualization, C.X. and J.M.; mthodology, K.Y.; software, B.F.; formal analysis, J.D.; validation, X.X.; investigation, X.B.; data curation, S.Q.; writing—original draft preparation, K.Y.; writing—review and editing, K.Y.; visualization, B.F. and J.D.; supervision, C.X. and J.M.; project administration, X.X.; funding acquisition, C.X., X.B. and S.Q. All authors have read and agreed to the published version of the manuscript.

Funding

This research was funded by the National Nature Science Foundation of China (No.62102436), the National Key Laboratory of Science and Technology (No.6142217210503), and the Projects Foundation of University (No.202250E050 and No.202250E060), the Hubei Province Natural Science Foundation (No.2021CFB279).

Data Availability Statement

The data that used in this study can be requested by contacting the first author.

Acknowledgments

We sincerely thank the authors of SIFT, SURF, EHD, LGHD and LPM for providing their algorithm codes to facilitate the comparative experiments, and thanks to Pei An for his advice on the experiments.

Conflicts of Interest

The authors declare no conflict of interest.

References

  1. Ma, J.; Jiang, X.; Jiang, J.; Gao, Y. Feature-guided Gaussian mixture model for image matching. Pattern Recognit. 2019, 92, 231–245. [Google Scholar] [CrossRef]
  2. Su, T.C. A study of a matching pixel by pixel (MPP) algorithm to establish an empirical model of water quality mapping, as based on unmanned aerial vehicle (UAV) images. Int. J. Appl. Earth Obs. Geoinf. 2017, 58, 213–224. [Google Scholar] [CrossRef]
  3. Ma, J.; Ma, Y.; Li, C. Infrared and visible image fusion methods and applications: A survey. Inf. Fusion 2019, 45, 153–178. [Google Scholar] [CrossRef]
  4. Ma, J.; Chen, C.; Li, C.; Huang, J. Infrared and visible image fusion via gradient transfer and total variation minimization. Inf. Fusion 2016, 31, 100–109. [Google Scholar] [CrossRef]
  5. Li, J.; Hu, Q.; Ai, M. 4FP-Structure: A Robust Local Region Feature Descriptor. Photogramm. Eng. Remote Sens. 2017, 83, 813–826. [Google Scholar] [CrossRef]
  6. Yu, K.; Zheng, X.; Fang, B.; An, P.; Huang, X.; Luo, W.; Ding, J.; Wang, Z.; Ma, J. Multimodal Urban Remote Sensing Image Registration Via Roadcross Triangular Feature. IEEE J. Sel. Top. Appl. Earth Obs. Remote Sens. 2021, 14, 4441–4451. [Google Scholar] [CrossRef]
  7. Ma, J.; Jiang, J.; Zhou, H.; Zhao, J.; Guo, X. Guided Locality Preserving Feature Matching for Remote Sensing Image Registration. IEEE Trans. Geosci. Remote Sens. 2018, 56, 4435–4447. [Google Scholar] [CrossRef]
  8. Ma, J.; Jiang, X.; Fan, A.; Jiang, J.; Yan, J. Image Matching from Handcrafted to Deep Features: A Survey. Int. J. Comput. Vis. 2020, 129, 23–79. [Google Scholar] [CrossRef]
  9. Dawn, S.; Saxena, V.; Sharma, B.D. Advanced free-form deformation and Kullback–Lieblier divergence measure for digital elevation model registration. Signal Image Video Process. 2015, 9, 1625–1635. [Google Scholar] [CrossRef]
  10. Wang, Z.; Bovik, A.C.; Sheikh, H.R.; Simoncelli, E.P. Image quality assessment: From error visibility to structural similarity. IEEE Trans. Image Process. 2004, 13, 600–612. [Google Scholar] [CrossRef] [Green Version]
  11. Burger, W.; Burge, M. Digital Image Processing; Texts in Computer Science; Springer: Berlin/Heidelberg, Germany, 2016. [Google Scholar]
  12. Boehme, T.K.; Bracewell, R.N. The Fourier Transform and its Applications. Am. Math. Mon. 1966, 73, 685. [Google Scholar] [CrossRef]
  13. Gong, M.; Zhao, S.; Jiao, L.; Tian, D.; Wang, S. A Novel Coarse-to-Fine Scheme for Automatic Image Registration Based on SIFT and Mutual Information. IEEE Trans. Geosci. Remote Sens. 2014, 52, 4328–4338. [Google Scholar] [CrossRef]
  14. Mahmood, A.; Khan, S. Correlation-Coefficient-Based Fast Template Matching Through Partial Elimination. IEEE Trans. Image Process. 2012, 21, 2099–2108. [Google Scholar] [CrossRef]
  15. Reddy, B.S.; Chatterji, B.N. An FFT-based technique for translation, rotation, and scale-invariant image registration. IEEE Trans. Image Process. A Publ. IEEE Signal Process. Soc. 1996, 5, 1266–1271. [Google Scholar] [CrossRef]
  16. Wu, S.; He, P.; Yu, S.; Zhou, S.; Xia, J.; Xie, Y. To Align Multimodal Lumbar Spine Images via Bending Energy Constrained Normalized Mutual Information. BioMed Res. Int. 2020, 2020, 5615371. [Google Scholar] [CrossRef]
  17. Liu, G.; Chen, S.; Zhou, X.; Wang, X.; Guan, Q.; Yu, H. Combining SIFT and Individual Entropy Correlation Coefficient for Image Registration. In Proceedings of the CCPR, Changsha, China, 17–19 November 2014. [Google Scholar]
  18. Ma, J.; Jiang, X.; Jiang, J.; Zhao, J.; Guo, X. LMR: Learning a Two-Class Classifier for Mismatch Removal. IEEE Trans. Image Process. 2019, 28, 4045–4059. [Google Scholar] [CrossRef]
  19. LoweDavid, G. Distinctive Image Features from Scale-Invariant Keypoints. Int. J. Comput. Vis. 2004. [Google Scholar]
  20. Bay, H.; Tuytelaars, T.; Gool, L.V. SURF: Speeded Up Robust Features. In Proceedings of the ECCV, Graz, Austria, 7–13 May 2006. [Google Scholar]
  21. Ye, Y.; Shen, L. Hopc: A novel similarity metric based on geometric structural properties for multi-modal remote sensing image matching. ISPRS Ann. Photogramm. Remote. Sens. Spat. Inf. Sci. 2016, 3, 9–16. [Google Scholar] [CrossRef]
  22. Ye, Y.; Shan, J.; Bruzzone, L.; Shen, L. Robust Registration of Multimodal Remote Sensing Images Based on Structural Similarity. IEEE Trans. Geosci. Remote Sens. 2017, 55, 2941–2958. [Google Scholar] [CrossRef]
  23. Li, J.; Hu, Q.; Ai, M. RIFT: Multi-Modal Image Matching Based on Radiation-Variation Insensitive Feature Transform. IEEE Trans. Image Process. 2020, 29, 3296–3310. [Google Scholar] [CrossRef]
  24. Chen, J.; Tian, J.; Lee, N.; Zheng, J.; Smith, R.T.; Laine, A.F. A Partial Intensity Invariant Feature Descriptor for Multimodal Retinal Image Registration. IEEE Trans. Biomed. Eng. 2010, 57, 1707–1718. [Google Scholar] [CrossRef] [Green Version]
  25. Manjunath, B.S.; Ohm, J.R.; Vasudevan, V.V.; Yamada, A. Color and texture descriptors. IEEE Trans. Circuits Syst. Video Technol. 2001, 11, 703–715. [Google Scholar] [CrossRef]
  26. Aguilera-Carrasco, C.A.; Sappa, A.D.; Toledo, R. LGHD: A feature descriptor for matching across non-linear intensity variations. In Proceedings of the 2015 IEEE International Conference on Image Processing (ICIP), Quebec City, QC, Canada, 27–30 September 2015; pp. 178–181. [Google Scholar]
  27. Jiang, X.; Ma, J.; Xiao, G.; Shao, Z.; Guo, X. A review of multimodal image matching: Methods and applications. Inf. Fusion 2021, 73, 22–71. [Google Scholar] [CrossRef]
  28. Han, X.; Leung, T.; Jia, Y.; Sukthankar, R.; Berg, A.C. MatchNet: Unifying feature and metric learning for patch-based matching. In Proceedings of the 2015 IEEE Conference on Computer Vision and Pattern Recognition (CVPR), Boston, MA, USA, 7–12 June 2015; pp. 3279–3286. [Google Scholar]
  29. Yi, K.M.; Trulls, E.; Lepetit, V.; Fua, P.V. LIFT: Learned Invariant Feature Transform. In European Conference on Computer Vision; Springer: Cham, Switzerland, 2016. [Google Scholar]
  30. Ma, T.; Ma, J.; Yu, K.; Zhang, J.; Fu, W. Multispectral Remote Sensing Image Matching via Image Transfer by Regularized Conditional Generative Adversarial Networks and Local Feature. IEEE Geosci. Remote Sens. Lett. 2021, 18, 351–355. [Google Scholar] [CrossRef]
  31. Etten, A.V. City-Scale Road Extraction from Satellite Imagery v2: Road Speeds and Travel Times. In Proceedings of the 2020 IEEE Winter Conference on Applications of Computer Vision (WACV), Snowmass Village, CO, USA, 2–5 March 2020; pp. 1775–1784. [Google Scholar]
  32. He, K.; Zhang, X.; Ren, S.; Sun, J. Deep Residual Learning for Image Recognition. In Proceedings of the 2016 IEEE Conference on Computer Vision and Pattern Recognition (CVPR), Las Vegas, NV, USA, 27–30 June 2016; pp. 770–778. [Google Scholar]
  33. Ronneberger, O.; Fischer, P.; Brox, T. U-Net: Convolutional Networks for Biomedical Image Segmentation. In Proceedings of the MICCAI, Munich, Germany, 5–9 October 2015. [Google Scholar]
  34. Allen-Zhu, Z.; Li, Y.; Song, Z. A Convergence Theory for Deep Learning via Over-Parameterization. In Proceedings of the 36th International Conference on Machine Learning, Long Beach, CA, USA, 10–15 June 2019. [Google Scholar]
  35. Kingma, D.P.; Ba, J. Adam: A Method for Stochastic Optimization. arXiv 2015, arXiv:1412.6980. [Google Scholar]
  36. Steger, C. An Unbiased Detector of Curvilinear Structures. IEEE Trans. Pattern Anal. Mach. Intell. 1998, 20, 113–125. [Google Scholar] [CrossRef]
  37. Sander, J.; Ester, M.; Kriegel, H.P.; Xu, X. Density-Based Clustering in Spatial Databases: The Algorithm GDBSCAN and Its Applications. Data Min. Knowl. Discov. 2004, 2, 169–194. [Google Scholar] [CrossRef]
  38. Wu, Y.; Zhou, Y.; Saveriades, G.; Agaian, S.S.; Noonan, J.P.; Natarajan, P. Local Shannon entropy measure with statistical tests for image randomness. Inf. Sci. 2013, 222, 323–342. [Google Scholar] [CrossRef]
  39. Ma, J.; Zhao, J.; Jiang, J.; Zhou, H.; Guo, X. Locality Preserving Matching. Int. J. Comput. Vis. 2018, 127, 512–531. [Google Scholar] [CrossRef]
  40. Etten, A.V.; Lindenbaum, D.; Bacastow, T.M. SpaceNet: A Remote Sensing Dataset and Challenge Series. arXiv 2018, arXiv:1807.01232. [Google Scholar]
  41. An, P.; Fu, W.; Gao, Y.; Ma, J.; Zhang, J.; Yu, K.; Fang, B. Lambertian Model-Based Normal Guided Depth Completion for LiDAR-Camera System. IEEE Geosci. Remote Sens. Lett. 2022, 19, 1–5. [Google Scholar] [CrossRef]
  42. Viswanathan, D. Features from Accelerated Segment Test (FAST). In Proceedings of the 10th Workshop on Image Analysis for Multimedia Interactive Services, London, UK, 6–8 May 2009. [Google Scholar]
  43. Kamangir, H.; Momeni, M.; Satari, M. Automatic centerline extraction of covered roads by surrounding objects from high resolution satellite images. Int. Arch. Photogramm. Remote Sens. Spat. Inf. Sci. 2017, 42, 111–116. [Google Scholar] [CrossRef] [Green Version]
Figure 1. Schematic diagram of the matching method [6] limitations: (a) The number of feature points is too small to construct triangular features. (b) Poor performance when fitting the curved semantic roads imformation.
Remotesensing 14 04595 g001
Figure 2. The flowchart of proposed method LURF for multimodal remote sensing image pair.
Remotesensing 14 04595 g002
Figure 3. The entire procedure of the semantic segmentation model CRESIv2 for road information inference.
Remotesensing 14 04595 g003
Figure 4. Schematic diagram of road feature extraction.
Remotesensing 14 04595 g004
Figure 5. Clustering result of the unstructured local searching point sets.
Remotesensing 14 04595 g005
Figure 6. Schematic diagram of the local searching point set detection.
Remotesensing 14 04595 g006
Figure 7. The flowchart of unstructured road intersection point detection. (The top row is the flowchart of intersection detection, the bottom row is the magnification displays of the typical road inference information, and the red solid dots are detection results of the road intersection points).
Remotesensing 14 04595 g007
Figure 8. Schematic diagram of the local binary entropy descriptor.
Remotesensing 14 04595 g008
Figure 9. The schematic diagram of the proposed descriptor for multimodal image pair.
Remotesensing 14 04595 g009
Figure 10. Schematic diagram of the corresponding local feature point sets.
Remotesensing 14 04595 g010
Figure 11. Examples of multimodal remote sensing image pairs from different test data sets. (The top row are optical images, and the bottom row from left to right present near infrared and intensity images, respectively).
Remotesensing 14 04595 g011
Figure 12. Qualitative comparison results of proposed method and other five methods on optical-NIR image data set. The NIR image has affine transformation with rotate transform ( θ = 6 ) and scale transform (s = 0.75). The feature matching points in two images have been marked as red dots and green dots, and yellow and blue matching lines mean true positive and true negative.
Remotesensing 14 04595 g012
Figure 13. Qualitative comparison results of proposed method and other five methods on optical-Intensity image data set. The intensity image has affine transformation with rotate transform ( θ = 0 ) and scale transform (s = 0.75). The feature matching points in two images have been marked as red dots and green dots, and yellow and blue matching lines mean true positive and true negative.
Remotesensing 14 04595 g013
Figure 14. The multimodal remote sensing image registration results with checkerboard mosaic display of our approach.
Remotesensing 14 04595 g014
Figure 15. The CMR of all methods on the optical-NIR and optical-Intensity data sets.
Remotesensing 14 04595 g015
Figure 16. The runtime metric of all methods on the optical-NIR and optical-Intensity data sets.
Remotesensing 14 04595 g016
Figure 17. The matching performance of the proposed LURF on multimodal image pair under curved road condition.
Remotesensing 14 04595 g017
Table 1. R e p and N c achieved by comparison methods and proposed LURF.
Optical-NIROptical-Intensity
Methods Rep N c Rep N c
SIFT0.455400.45553
SURF0.425110.43528
FAST0.455240.43549
LURF1.0071.009
Table 2. Quantitative Evaluation Error Results of Proposed Method LURF.
MetricsOptical-NIROptical-Intensity
RMSE/pixel1.321.88
ME/pixel1.271.57
Success rate100%97.6%
Publisher’s Note: MDPI stays neutral with regard to jurisdictional claims in published maps and institutional affiliations.

