Article

Fifteen-Year Trends (2005–2019) in the Satellite-Derived Ozone-Sensitive Regime in East Asia: A Gradual Shift from VOC-Sensitive to NOx-Sensitive

1
Sustainable System Research Laboratory (SSRL), Central Research Institute of Electric Power Industry (CRIEPI), Abiko, Chiba 270-1194, Japan
2
Center for Environmental Remote Sensing (CEReS), Chiba University, Inage-ku, Chiba 263-8522, Japan
3
Graduate School of Engineering, Osaka University, Suita, Osaka 565-0871, Japan
4
National Institute for Environmental Studies (NIES), Tsukuba, Ibaraki 305-8506, Japan
*
Author to whom correspondence should be addressed.
Remote Sens. 2022, 14(18), 4512; https://doi.org/10.3390/rs14184512
Submission received: 10 August 2022 / Revised: 25 August 2022 / Accepted: 7 September 2022 / Published: 9 September 2022

Abstract

:
To mitigate tropospheric ozone (O3) pollution with proper and effective emission regulations, diagnostics for the O3-sensitive regime are critical. In this study, we analyzed the satellite-measured formaldehyde (HCHO) and nitrogen dioxide (NO2) column densities and derived the HCHO to NO2 ratio (FNR) from 2005 to 2019. Over China, there was a clear increase in the NO2 column during the first 5-year period and a subsequent decrease after 2010. Over the Republic of Korea and Japan, there was a continuous decline in the NO2 column over 15 years. Over the entire East Asia, a substantial increase in the HCHO column was identified during 2015–2019. Therefore, FNR increased over almost all of East Asia, especially during 2015–2019. This increasing trend in FNR indicated the gradual shift from a volatile organic compound (VOC)-sensitive to a nitrogen oxide (NOx)-sensitive regime. The long-term changes in HCHO and NO2 columns generally corresponded to anthropogenic non-methane VOC (NMVOC) and NOx emissions trends; however, anthropogenic sources did not explain the increasing HCHO column during 2015–2019. Because of the reduction in anthropogenic sources, the relative importance of biogenic NMVOC sources has been increasing and could have a larger impact on changing the O3-sensitive regime over East Asia.

1. Introduction

Tropospheric ozone (O3) is a major component of urban smog, poses major risks to human health and the natural environment, and also acts as an important greenhouse gas [1]. O3 is a secondary air pollutant produced through chain reactions involving photochemical oxidation of nitrogen oxides (NOx) and volatile organic compounds (VOCs) [2]. Photochemically produced O3 linked to anthropogenic emissions and poor air quality is a global problem, especially in the northern hemisphere [3]. The situation in Asia is particularly concerning because of the continuous increase in anthropogenic emissions with the rapid expansion of the economy and population, in contrast to the decrease in Europe and the U.S.A. during 1990–2000 [4]. In Asia, China is responsible for the largest portion of anthropogenic emissions. Based on the bottom-up estimation, NOx emissions, which are directly related to NOx concentration as the precursor to O3, from China showed a dramatic increase during the 2000s, a peak in 2011–2012, and a subsequent decrease [5,6]. In contrast, VOC emissions from China increased slightly, did not decrease up to around 2015 [5,6], and then decreased slightly after 2015 [6,7]. Because of these large amounts of anthropogenic emissions in China and due to the relatively long lifetime of O3, the long-range transport of O3 from China to the downwind region of the Republic of Korea and Japan has been observed [8,9,10,11,12,13]. In Japan, O3 concentrations showed flat or slightly increasing trends despite the continuous decline of precursor emissions in Japan [14], possibly because of the long-range O3 transport from outside Japan. To mitigate local O3 pollution in Japan and to improve O3 pollution over East Asia, an appropriate strategy should be implemented to improve air quality in this region.
Simple emission reduction strategies for NOx and VOC precursors are not suitable for controlling O3, which is a secondary pollutant formed in the troposphere. Because O3 production depends on the local relative abundances of NOx and VOC, the diagnosis of an O3-sensitive regime is an important index [2]. O3 formation can be mitigated by reducing NOx emissions (i.e., a NOx-sensitive regime) or by reducing VOC emissions (i.e., a VOC-sensitive or NOx-saturated regime). To identify the NOx- and VOC-sensitive regimes, various indicators, such as total reactive nitrogen, formaldehyde (HCHO), hydrogen peroxide (H2O2), and nitric acid (HNO3) from observations, have been proposed [15,16]. The general feature of O3-sensitive regimes is a VOC-sensitive regime over urban areas and a NOx-sensitive regime over remote areas; however, sensitivity regimes also depend on various factors, such as temporal variations (diurnal and seasonal variation) and related atmospheric meteorological fields [2]. In addition to using indicators from observations, O3-sensitive regimes have also been estimated by numerical modeling, especially based on calculating the sensitivities of O3 concentration to NOx and VOC emissions [17,18,19,20,21,22]. Furthermore, sensitivity regimes have been detected by using space-borne satellite observations, and it was proposed that the ratio of HCHO column density to nitrogen dioxide (NO2) column density (HCHO to NO2 ratio; FNR) could be used [23,24]. The identification of the O3-sensitive regime is based on the following threshold values: FNR < 1.0 for the VOC-sensitive regime, FNR > 2.0 for the NOx-sensitive regime, and 1.0 < FNR < 2.0 for the transitional regime [24].
Because of the concern about O3 pollution in East Asia, satellite-derived FNR has been investigated in previous studies [25,26,27]. During 2005–2013, the rapid growth in NO2 column density with an insignificant trend in HCHO column density resulted in the transition from NOx-sensitive to VOC-sensitive regimes over most parts of China [26]. The trend obtained by FNR analyses showed complex behavior; for instance, Beijing had a flat trend in a VOC-sensitive regime, and Seoul and Tokyo showed an increasing trend in FNR, suggesting a weak shift toward a NOx-sensitive regime [27]. These previous studies have covered the period from 2005 to 2015 [25,26,27]. The O3-sensitive regime over China was recently updated from 2016 to 2019 based on satellite and ground-based observations with numerical modeling, and the results revealed that some cities shifted from a VOC-sensitive regime to a transitional regime due to the rapid drop in anthropogenic NOx emissions during this period [28]. These analyses using HCHO column density appear to contain more noise than those using NO2 column density, and this limitation needs to be overcome for further analysis of HCHO column density and FNR. From the viewpoint of emissions, most megacities in East Asia were under a VOC-sensitive regime, and measures to decrease NOx emissions contributed to an increase in O3 due to the weakening NO titration effect during 2005–2018 [29]. In Japan, the sensitivity simulation of emission regulations in numerical modeling suggested that regional countermeasures have been more important than nationwide regulation in Japan since 2006 [30]. To improve O3 pollution in East Asia, it is necessary to consider how to reduce precursor emissions effectively. To achieve this, past scenarios under an O3-sensitive regime and their relationships with precursor emissions should be analyzed and understood. Previous studies have only analyzed portions of the relevant period and do not cover the full available period over the long term. Thus, in this study, we analyzed the 15-year (2005–2019) long-term trends in FNR from satellite measurements and the latest available emission dataset over East Asia. The atmospheric environment was dramatically affected by the COVID-19 pandemic in 2020 because of large emission reductions, especially in NOx [31,32,33], and their effects on O3 have been identified [34]. However, these effects were time-limited by the economic recovery from the latter part of 2020 onward [7,35]. In this study, to focus on the long-term trends of FNR and precursor emissions based on the annual mean, 2020 was excluded. This study will contribute to understanding the long-term change in the O3-sensitive regime over East Asia measured by satellite observations and its relationship to precursor emissions before the COVID-19 pandemic.

2. Dataset

2.1. Satellite Observation

This study clarifies the long-term trends and changes in the O3-sensitive regime using satellite observations. The longest available space-based observation is appropriate, and hence, we used Ozone Monitoring Instrument (OMI) measurement data aboard the Aura spacecraft. The OMI instrument has a spatial resolution of 13 × 24 km on the nadir view, and each day has 14–15 orbits with an equatorial crossing time of 13:45 local time. The OMI data have been provided since October 2004, and we analyzed the 15-year trends from 2005 to 2019. The tropospheric NO2 column is used as a proxy for NOx emissions [36,37,38]. The level 3 daily global NO2 product released by NASA (OMNO2d) version 3.0 gridded onto a 0.25° × 0.25° grid was used [39]. The tropospheric column with cloud fractions of less than 30% was analyzed. HCHO is an intermediate in the oxidation of various VOCs, and the satellite-derived HCHO column is widely used to constrain anthropogenic and biogenic VOC emissions [40,41,42]. The level 3 daily global HCHO product released by NASA (OMHCHOd) gridded onto a 0.1° × 0.1° grid was used [43].
These publicly available datasets of NO2 and HCHO satellite measurements were analyzed by the following procedures. First, high HCHO vertical column densities greater than 1.0 × 10¹⁷ molecules cm−2 were discarded based on the data selection for HCHO analysis in a previous study [41]. Even after applying this criterion, the HCHO column density still showed noise in some cases. Second, the smoothing method, which was originally proposed for analyzing the SO2 column, was used to analyze the HCHO vertical column density in this study [44]. This smoothing method was confirmed to be effective for analyzing the SO2 column over East Asia in our previous study [45]. The HCHO column assigned at each grid was averaged over the eight surrounding grids in the smoothing method. Third, to derive the FNR, the grid resolutions of NO2 and HCHO must be unified, and thus the finer-scale resolution of HCHO was converted and averaged to the same grid resolution as NO2. Via this process, FNR was calculated by the HCHO column density divided by the NO2 column density at each 0.25° grid point. In this calculation, when the NO2 column density was lower than the HCHO column density, an excessively high FNR value could be obtained. To prevent this, FNR was calculated at only the grid points where the NO2 column density was higher than 1.0 × 10¹⁵ molecules cm−2, covering most of the East Asian region (Figure 1). This procedure was conducted for each day and then averaged over all seasons for the annual FNR for the cold seasons (October to March, analyzed within the same year and not continuously) and for the warm seasons (April to September). An O3-sensitive regime was identified by using FNR based on the following conventional threshold values [24,29,30]: FNR < 1.0, VOC-sensitive regime; FNR > 2.0, NOx-sensitive regime; 1.0 < FNR < 2.0, transitional regime.

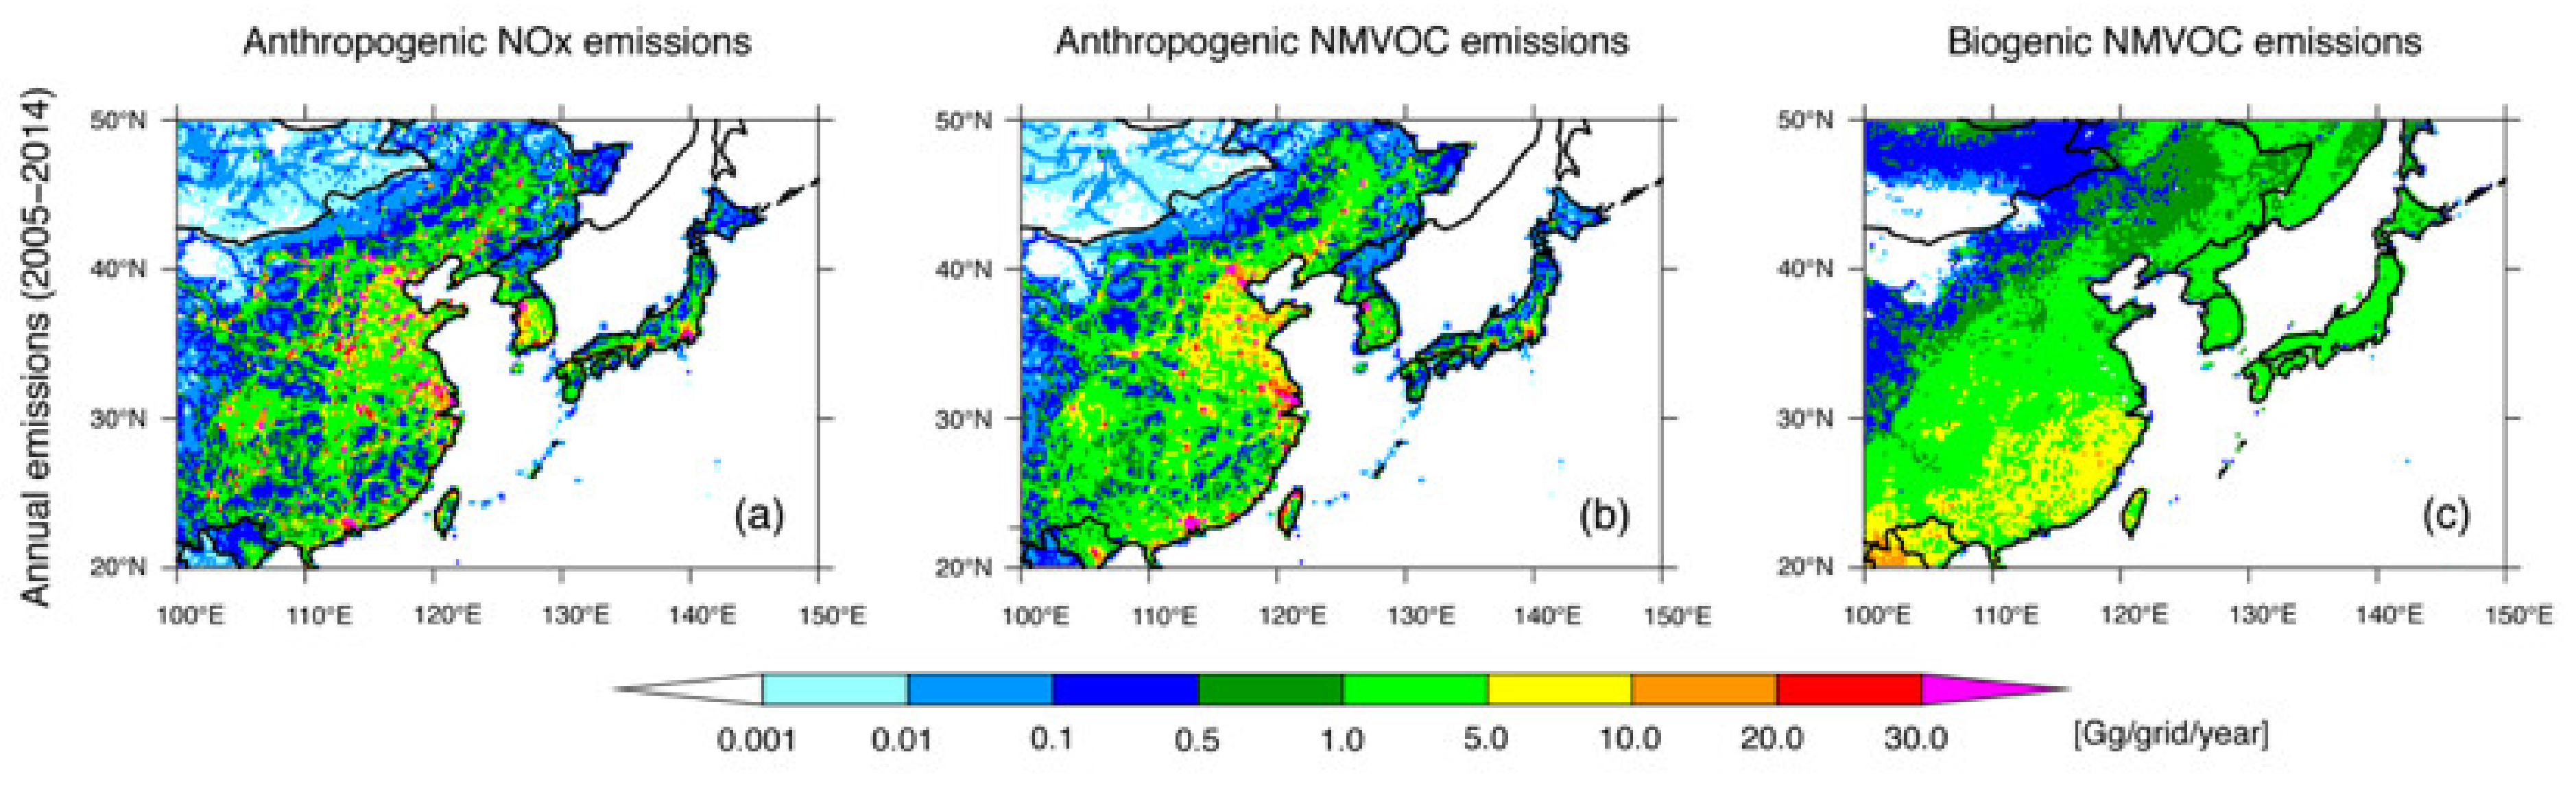
2.2. Emission Inventory

Because HCHO and NO2 column densities are closely related to precursor emissions, emission status is fundamental information. This study compiled the latest available emission inventories. The anthropogenic non-methane volatile organic compounds (NMVOCs) and NOx emissions from China, the Republic of Korea, and Japan during 2005–2015 were analyzed based on the Regional Emission inventory in Asia (REAS) version 3.2.1 [5]. Because this version of REAS covered up to 2015, the Chinese emission status was also analyzed by using the Multi-resolution Emission Inventory for China (MEIC) database [6,7]. The inventories reported by Zheng et al. in 2018 [6] and 2021 [7] covered the years from 2010 to 2017 and the years 2019 and 2020, respectively. Therefore, 2018 was analyzed in this study as the average of 2017 and 2019. Based on these datasets, the 15-year anthropogenic emissions gridded onto 0.25° × 0.25° grids from 2005 to 2019 were obtained. For HCHO, biogenic emissions are also an important source. We used the CAMS-GLOB-BIO version 3.1 dataset [46], which was calculated based on the Model of Emissions of Gases and Aerosols from Nature (MEGAN) [47] driven by the meteorological reanalyses of the European Centre for Medium-Range Weather Forecasts (ECMWF), and was gridded onto a 0.25° × 0.25° grid for the period of 2000–2019. These anthropogenic and biogenic emission inventories were analyzed to calculate the total emission amount for China, the Republic of Korea, and Japan and their trends over East Asia during 2005–2019, which corresponded to satellite measurements.

3. Results

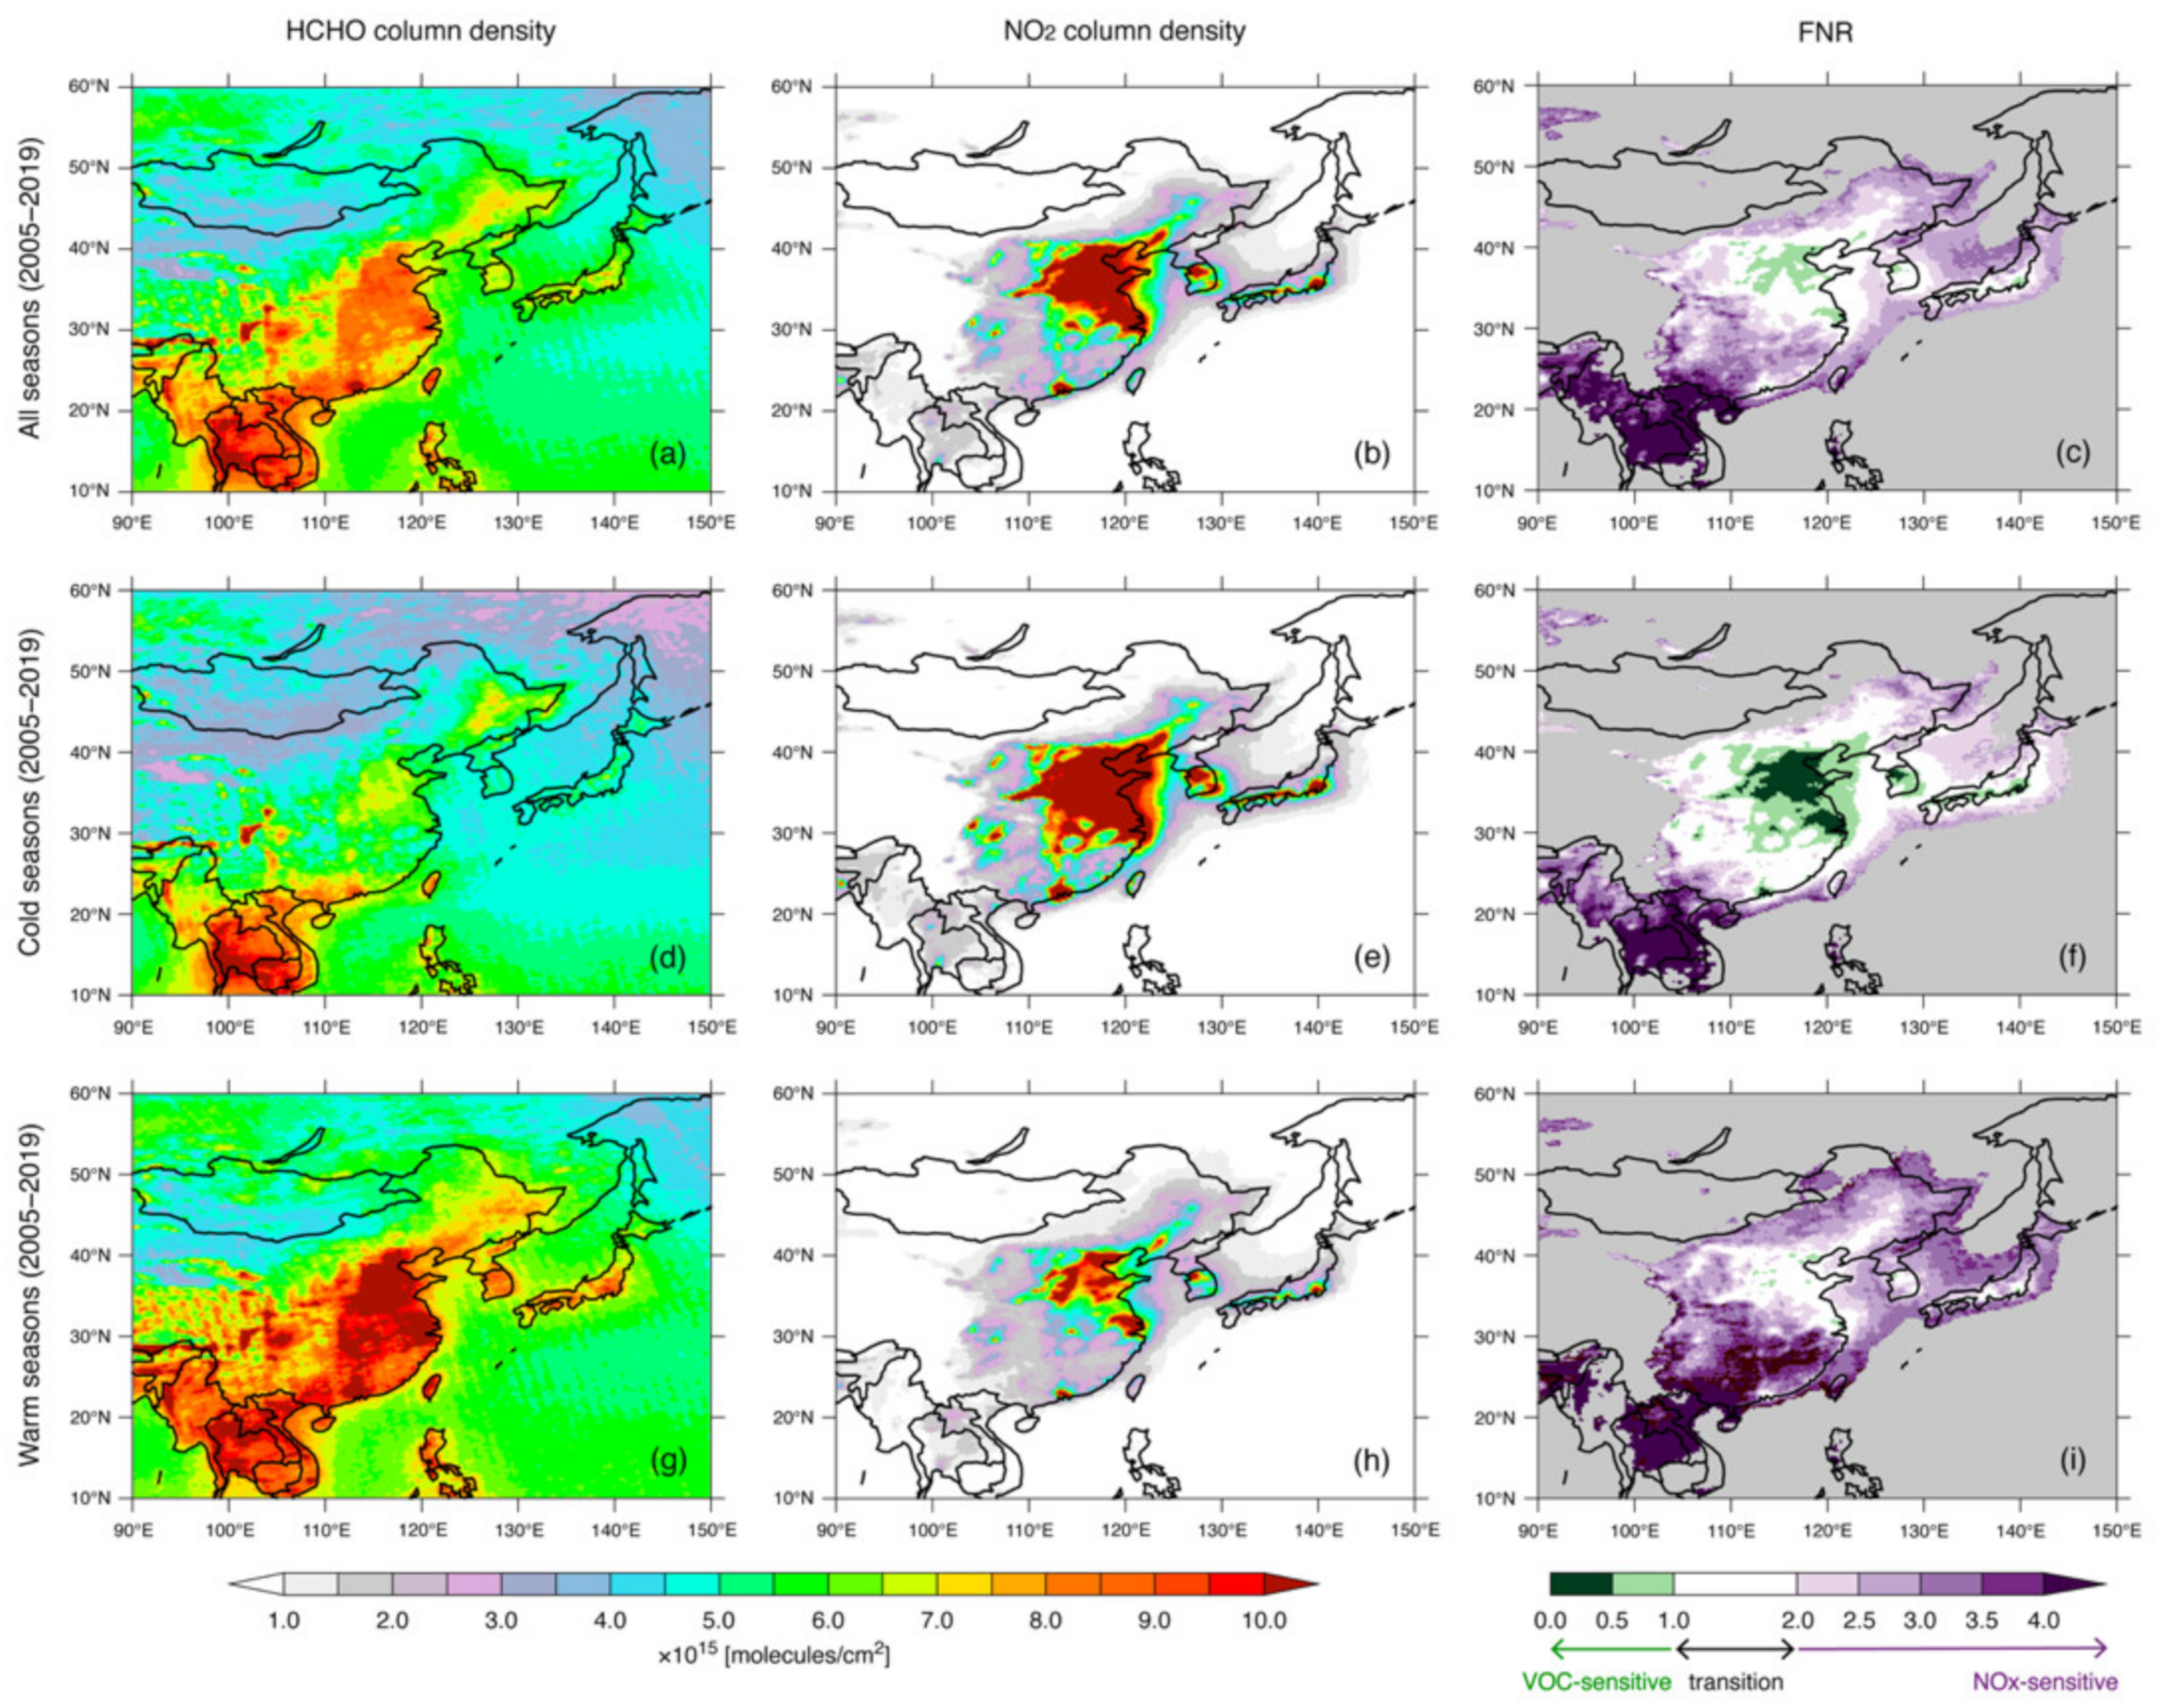
3.1. Overview of FNR over East Asia

The 15-year (2005–2019) averaged HCHO and NO2 column densities and the FNR are shown in Figure 1. HCHO column density averaged over all seasons (Figure 1a) showed a high concentration (>10.0 × 10¹⁵ molecules cm−2; dark red) over eastern China and Southeast Asia. The spatial distribution pattern of HCHO exhibited clear seasonal variation with a low during the cold seasons (Figure 1d) and a high during the warm seasons (Figure 1g). In the warm seasons, there were also high HCHO column densities (>10.0 × 10¹⁵ molecules cm−2; dark red) around Seoul and Pusan over the Republic of Korea, and around Osaka and Tokyo over Japan. The NO2 column density averaged over all seasons showed high concentrations (>10.0 × 10¹⁵ molecules cm−2; dark red) over eastern China, Seoul, and Tokyo (Figure 1b). The seasonal variation was also clear but showed the opposite behavior to the HCHO column density; the NO2 column density was high during cold seasons (Figure 1e) and low during warm seasons (Figure 1h). Consequently, the FNR also showed different features in cold and warm seasons. The FNR indicated that limited regions in eastern China were under a VOC-sensitive regime, and other regions in most of East Asia were under a transitional or NOx-sensitive regime when averaged over all seasons (Figure 1c). Over Seoul and Tokyo, which are centers of economic activity, O3-sensitive regimes were classified as transitional regimes when the FNR values were averaged over all seasons. The seasonal change in the O3-sensitive regime was dynamic, as determined from the HCHO and NO2 column densities. On the one hand, the VOC-sensitive regimes extended over eastern China and were also found over Seoul and Tokyo during the cold seasons (Figure 1f); on the other hand, VOC-sensitive regimes were not found and most East Asian regions were under a transitional or NOx-sensitive regime during the warm seasons (Figure 1i). The general features of O3-sensitive regimes indicated by the FNR values calculated from OMI satellite measurements, such as VOC-sensitive in the urban area and NOx-sensitive over remote areas, were consistent with previous studies for the limited period during 2005–2019 [20,25,26,27]. Moreover, our analysis method with the smoothing method to reduce the noise in the HCHO column densities was suitable for analyzing the behavior of the O3-sensitive regime over East Asia.

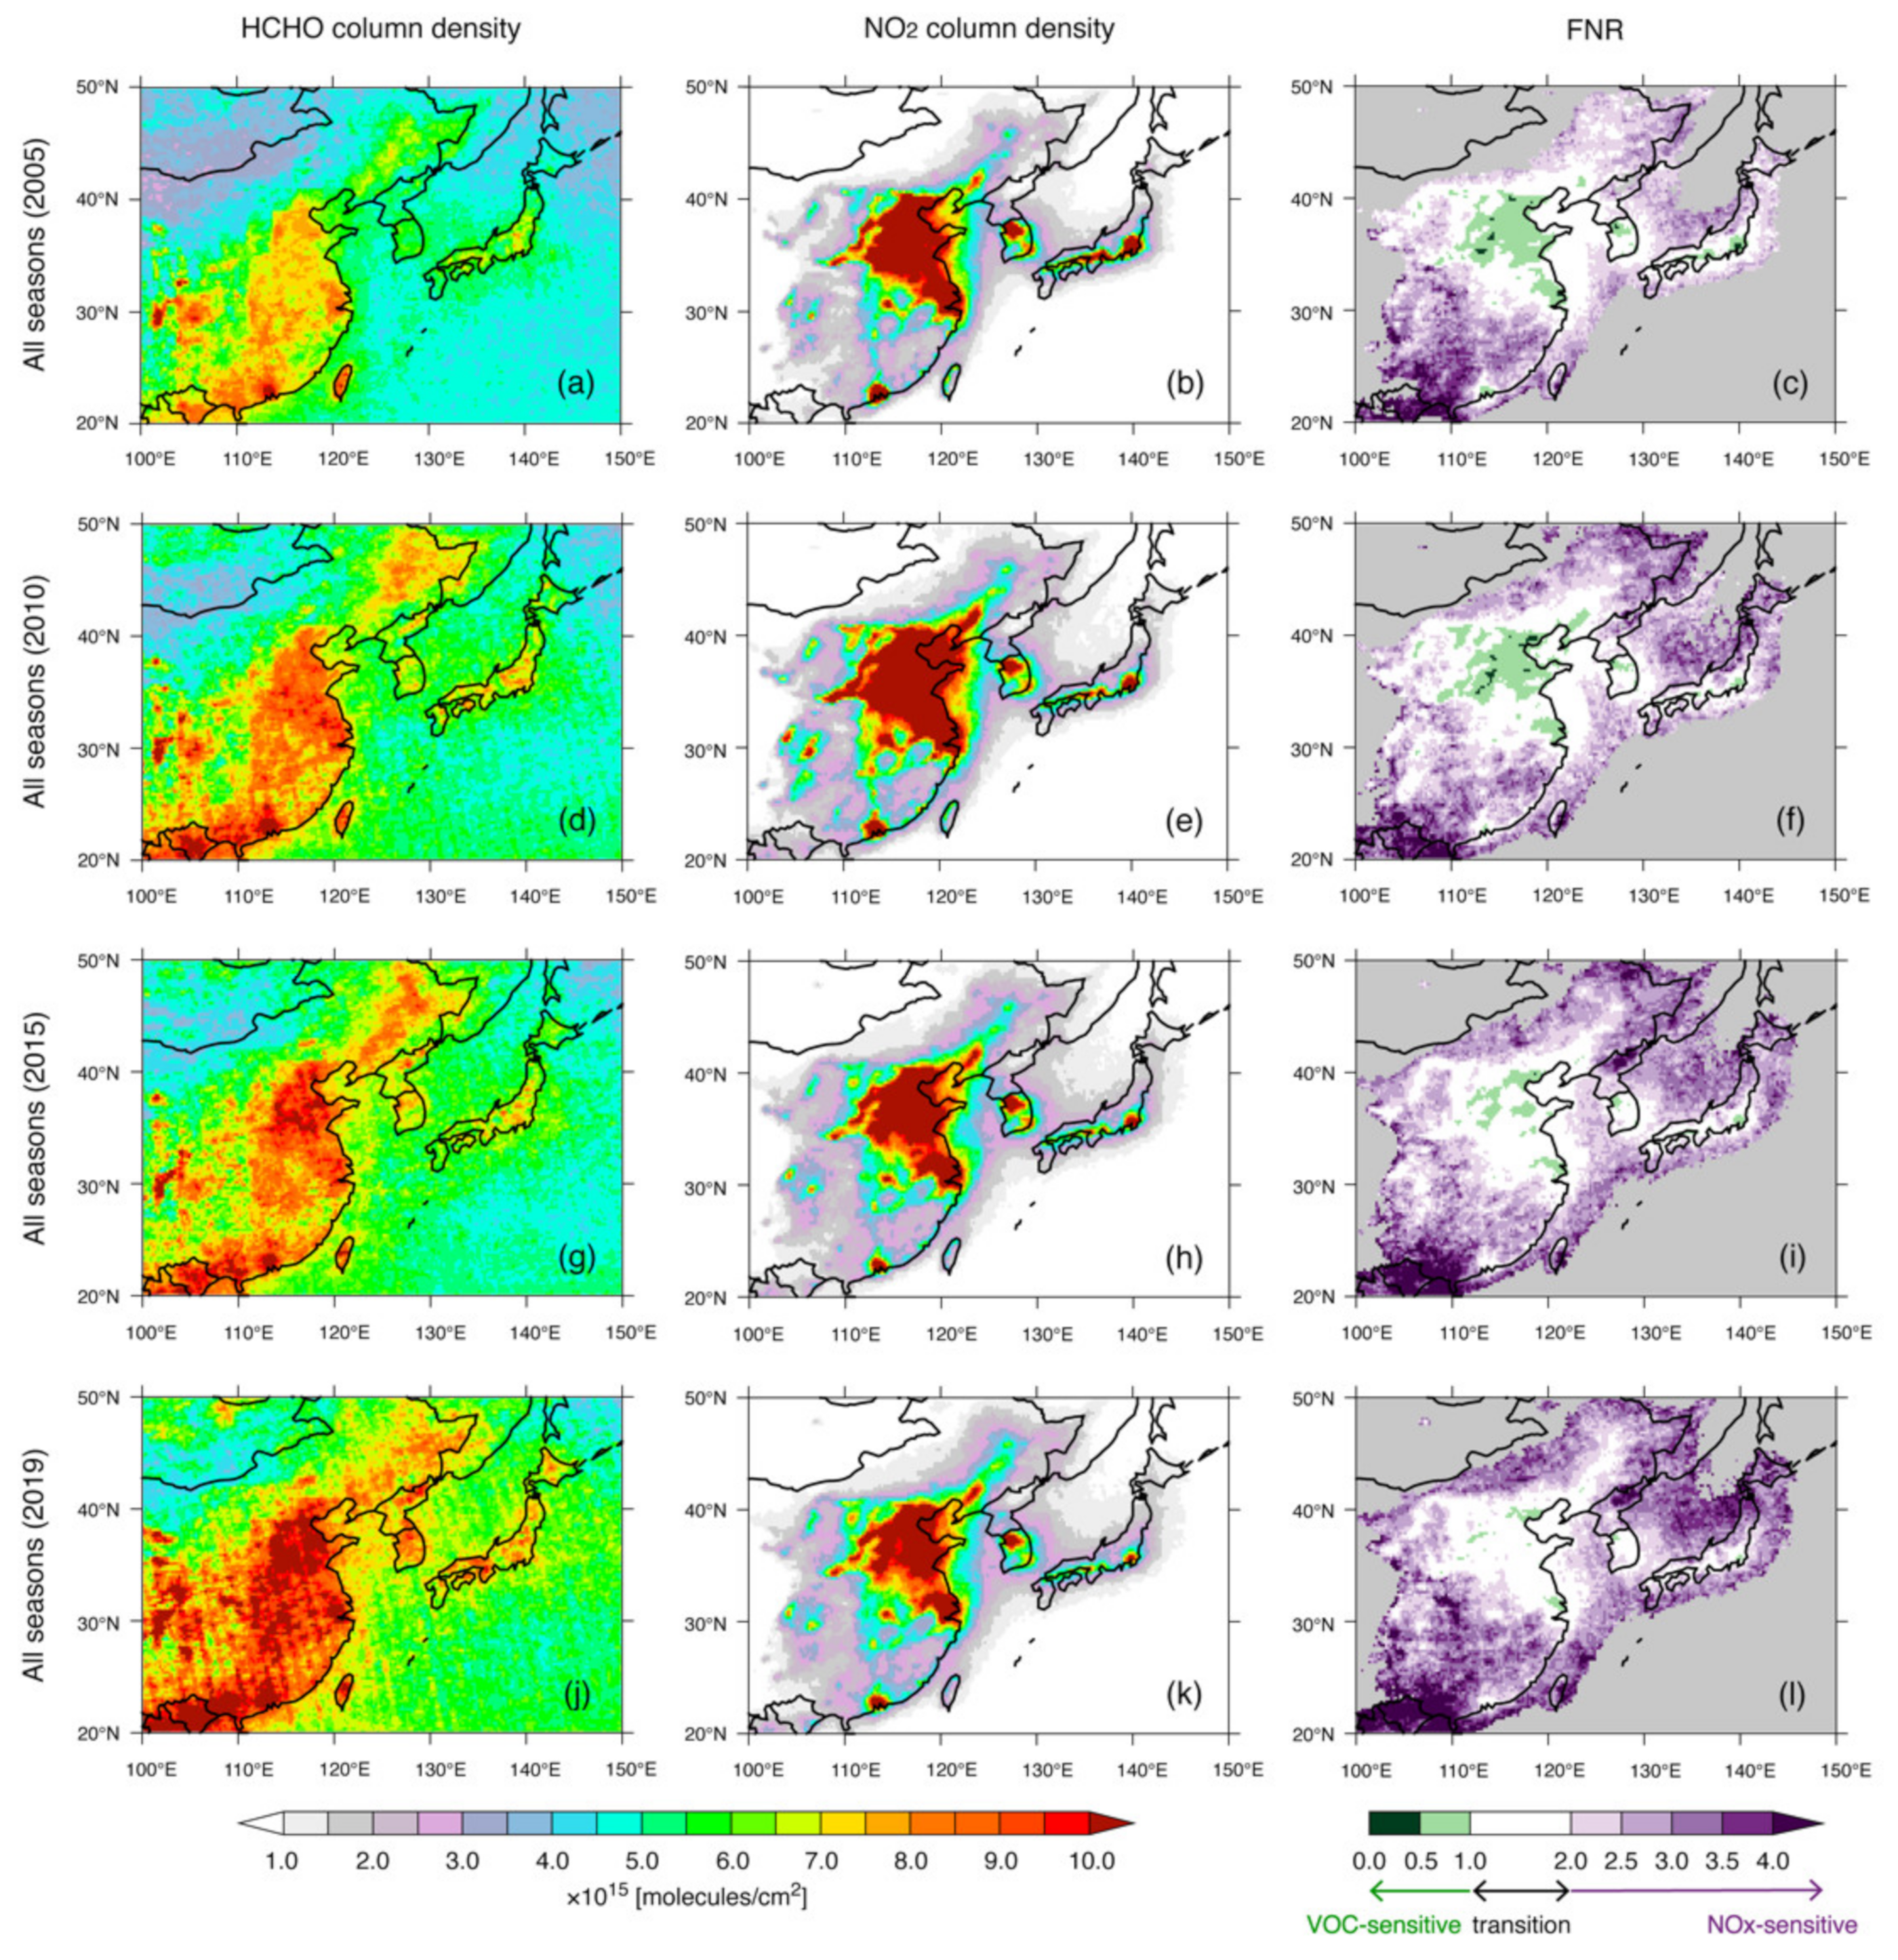
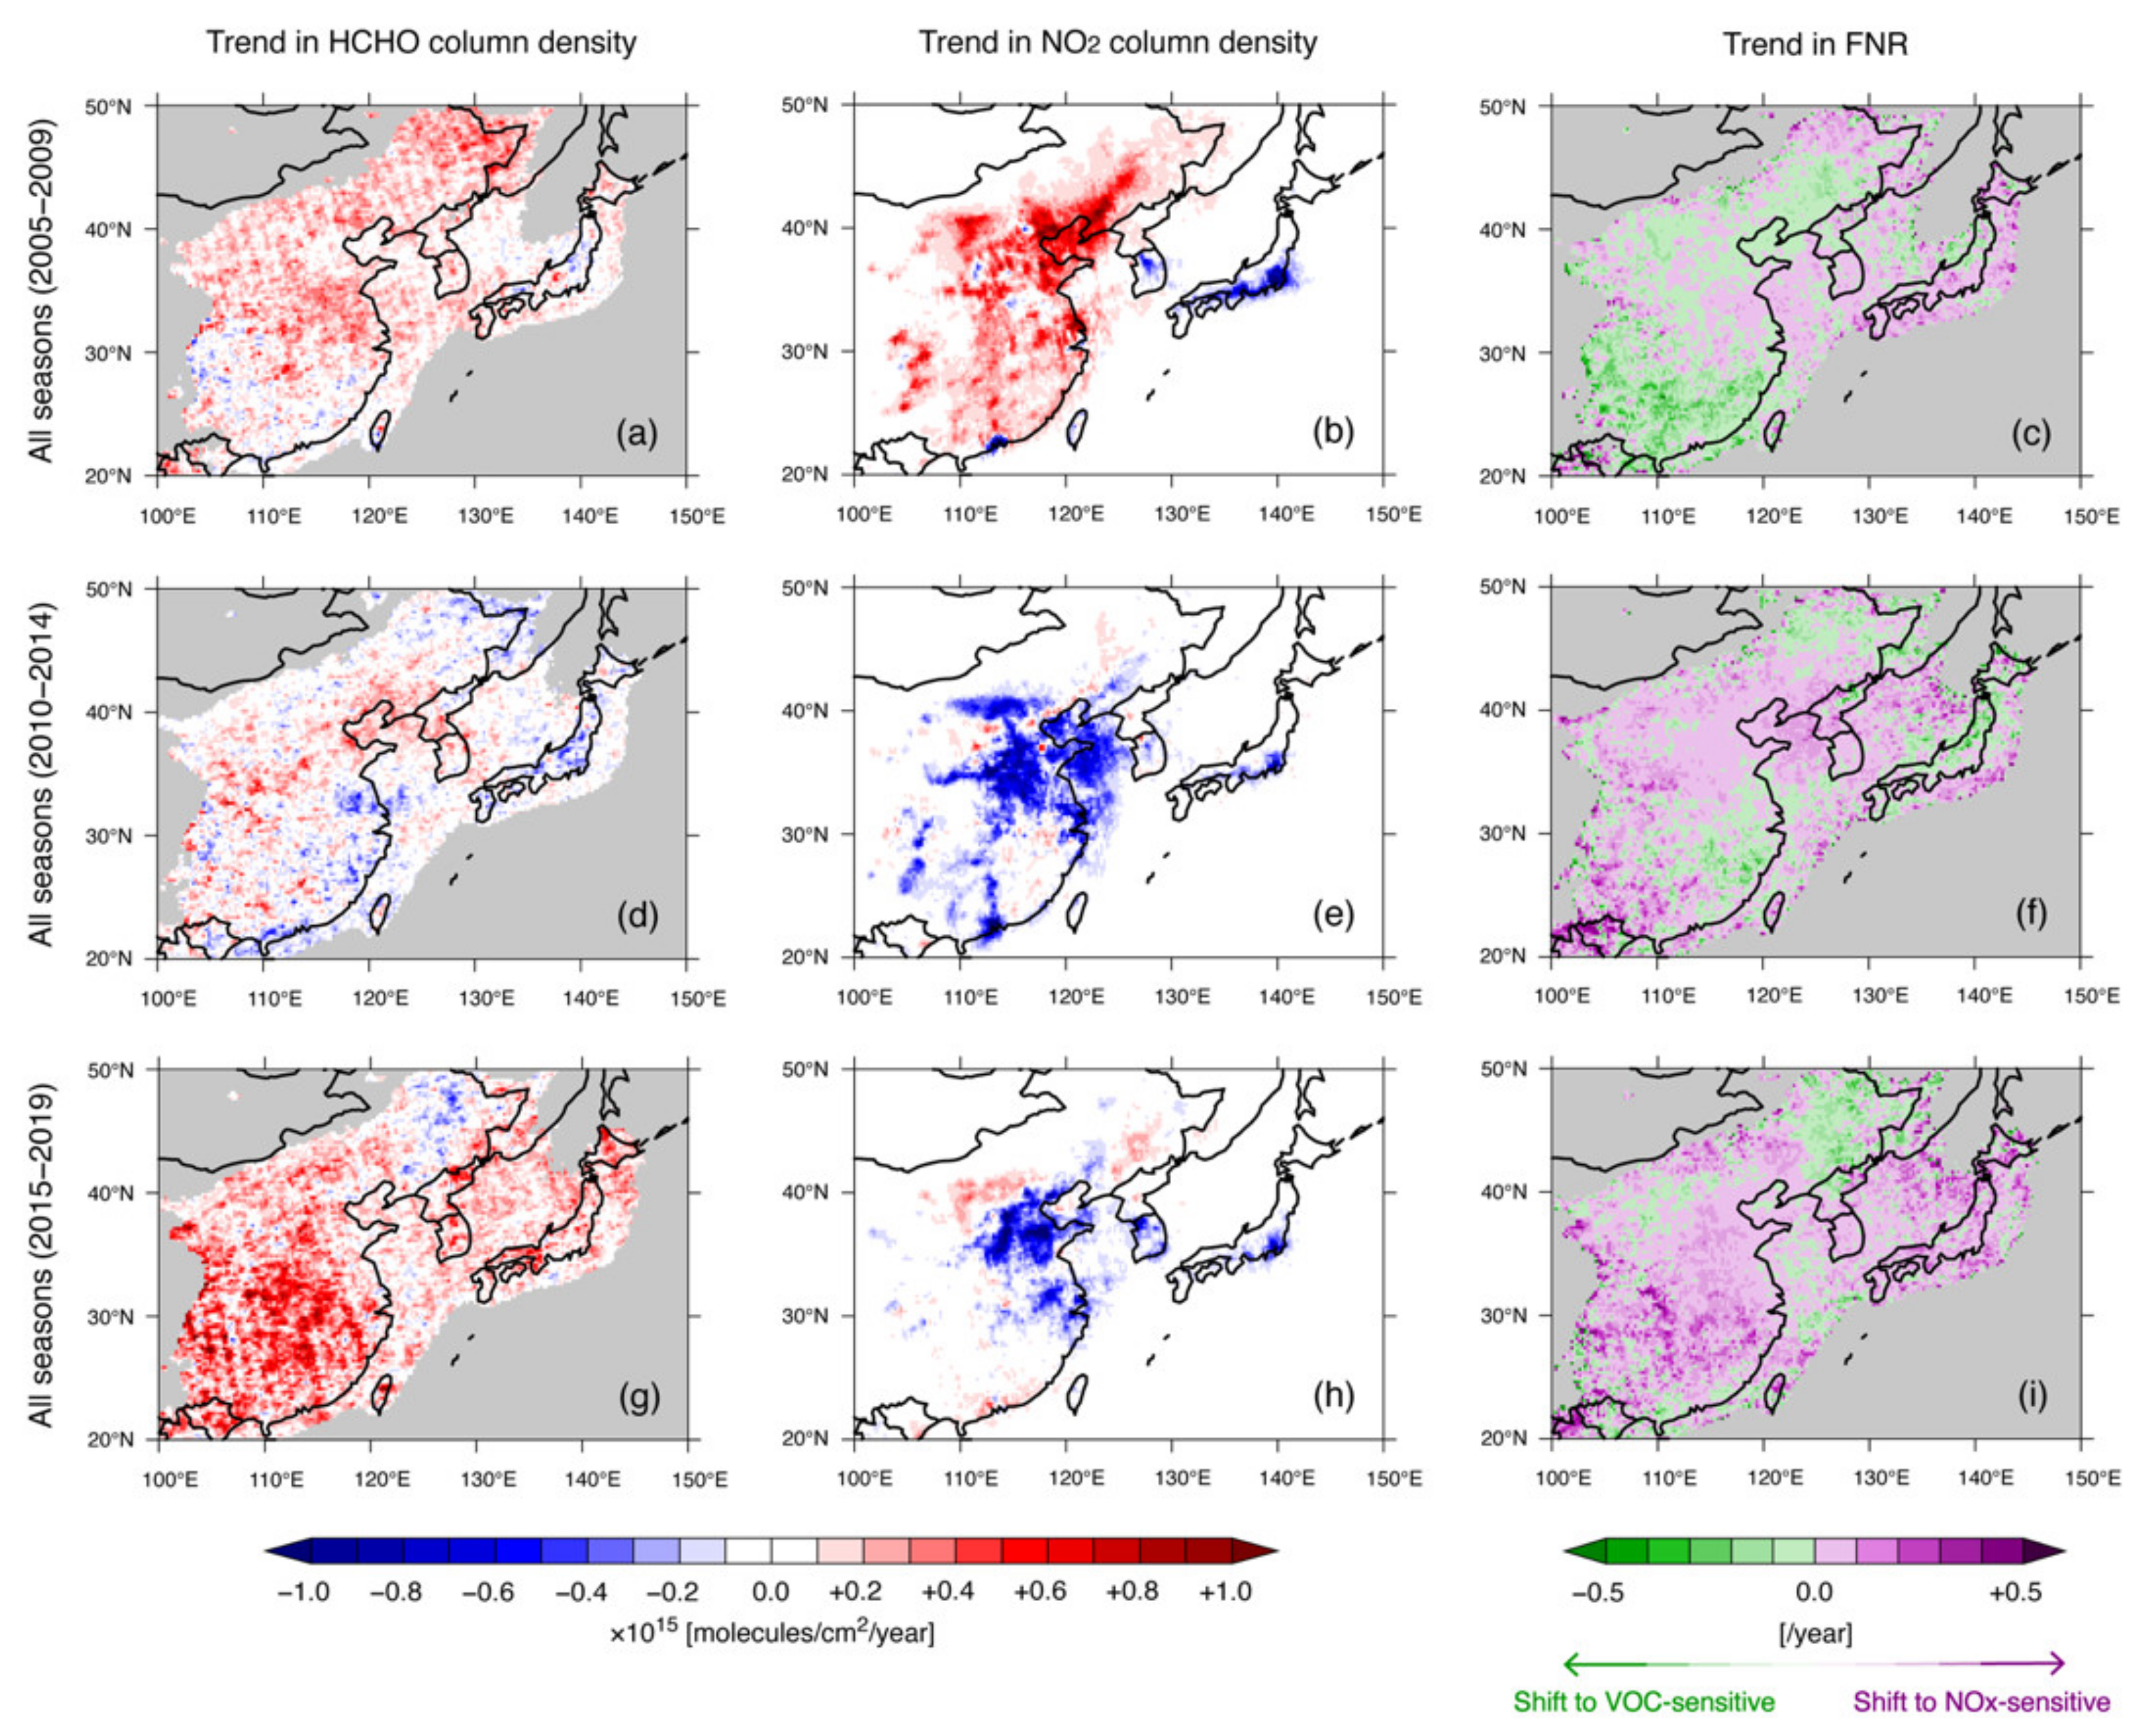
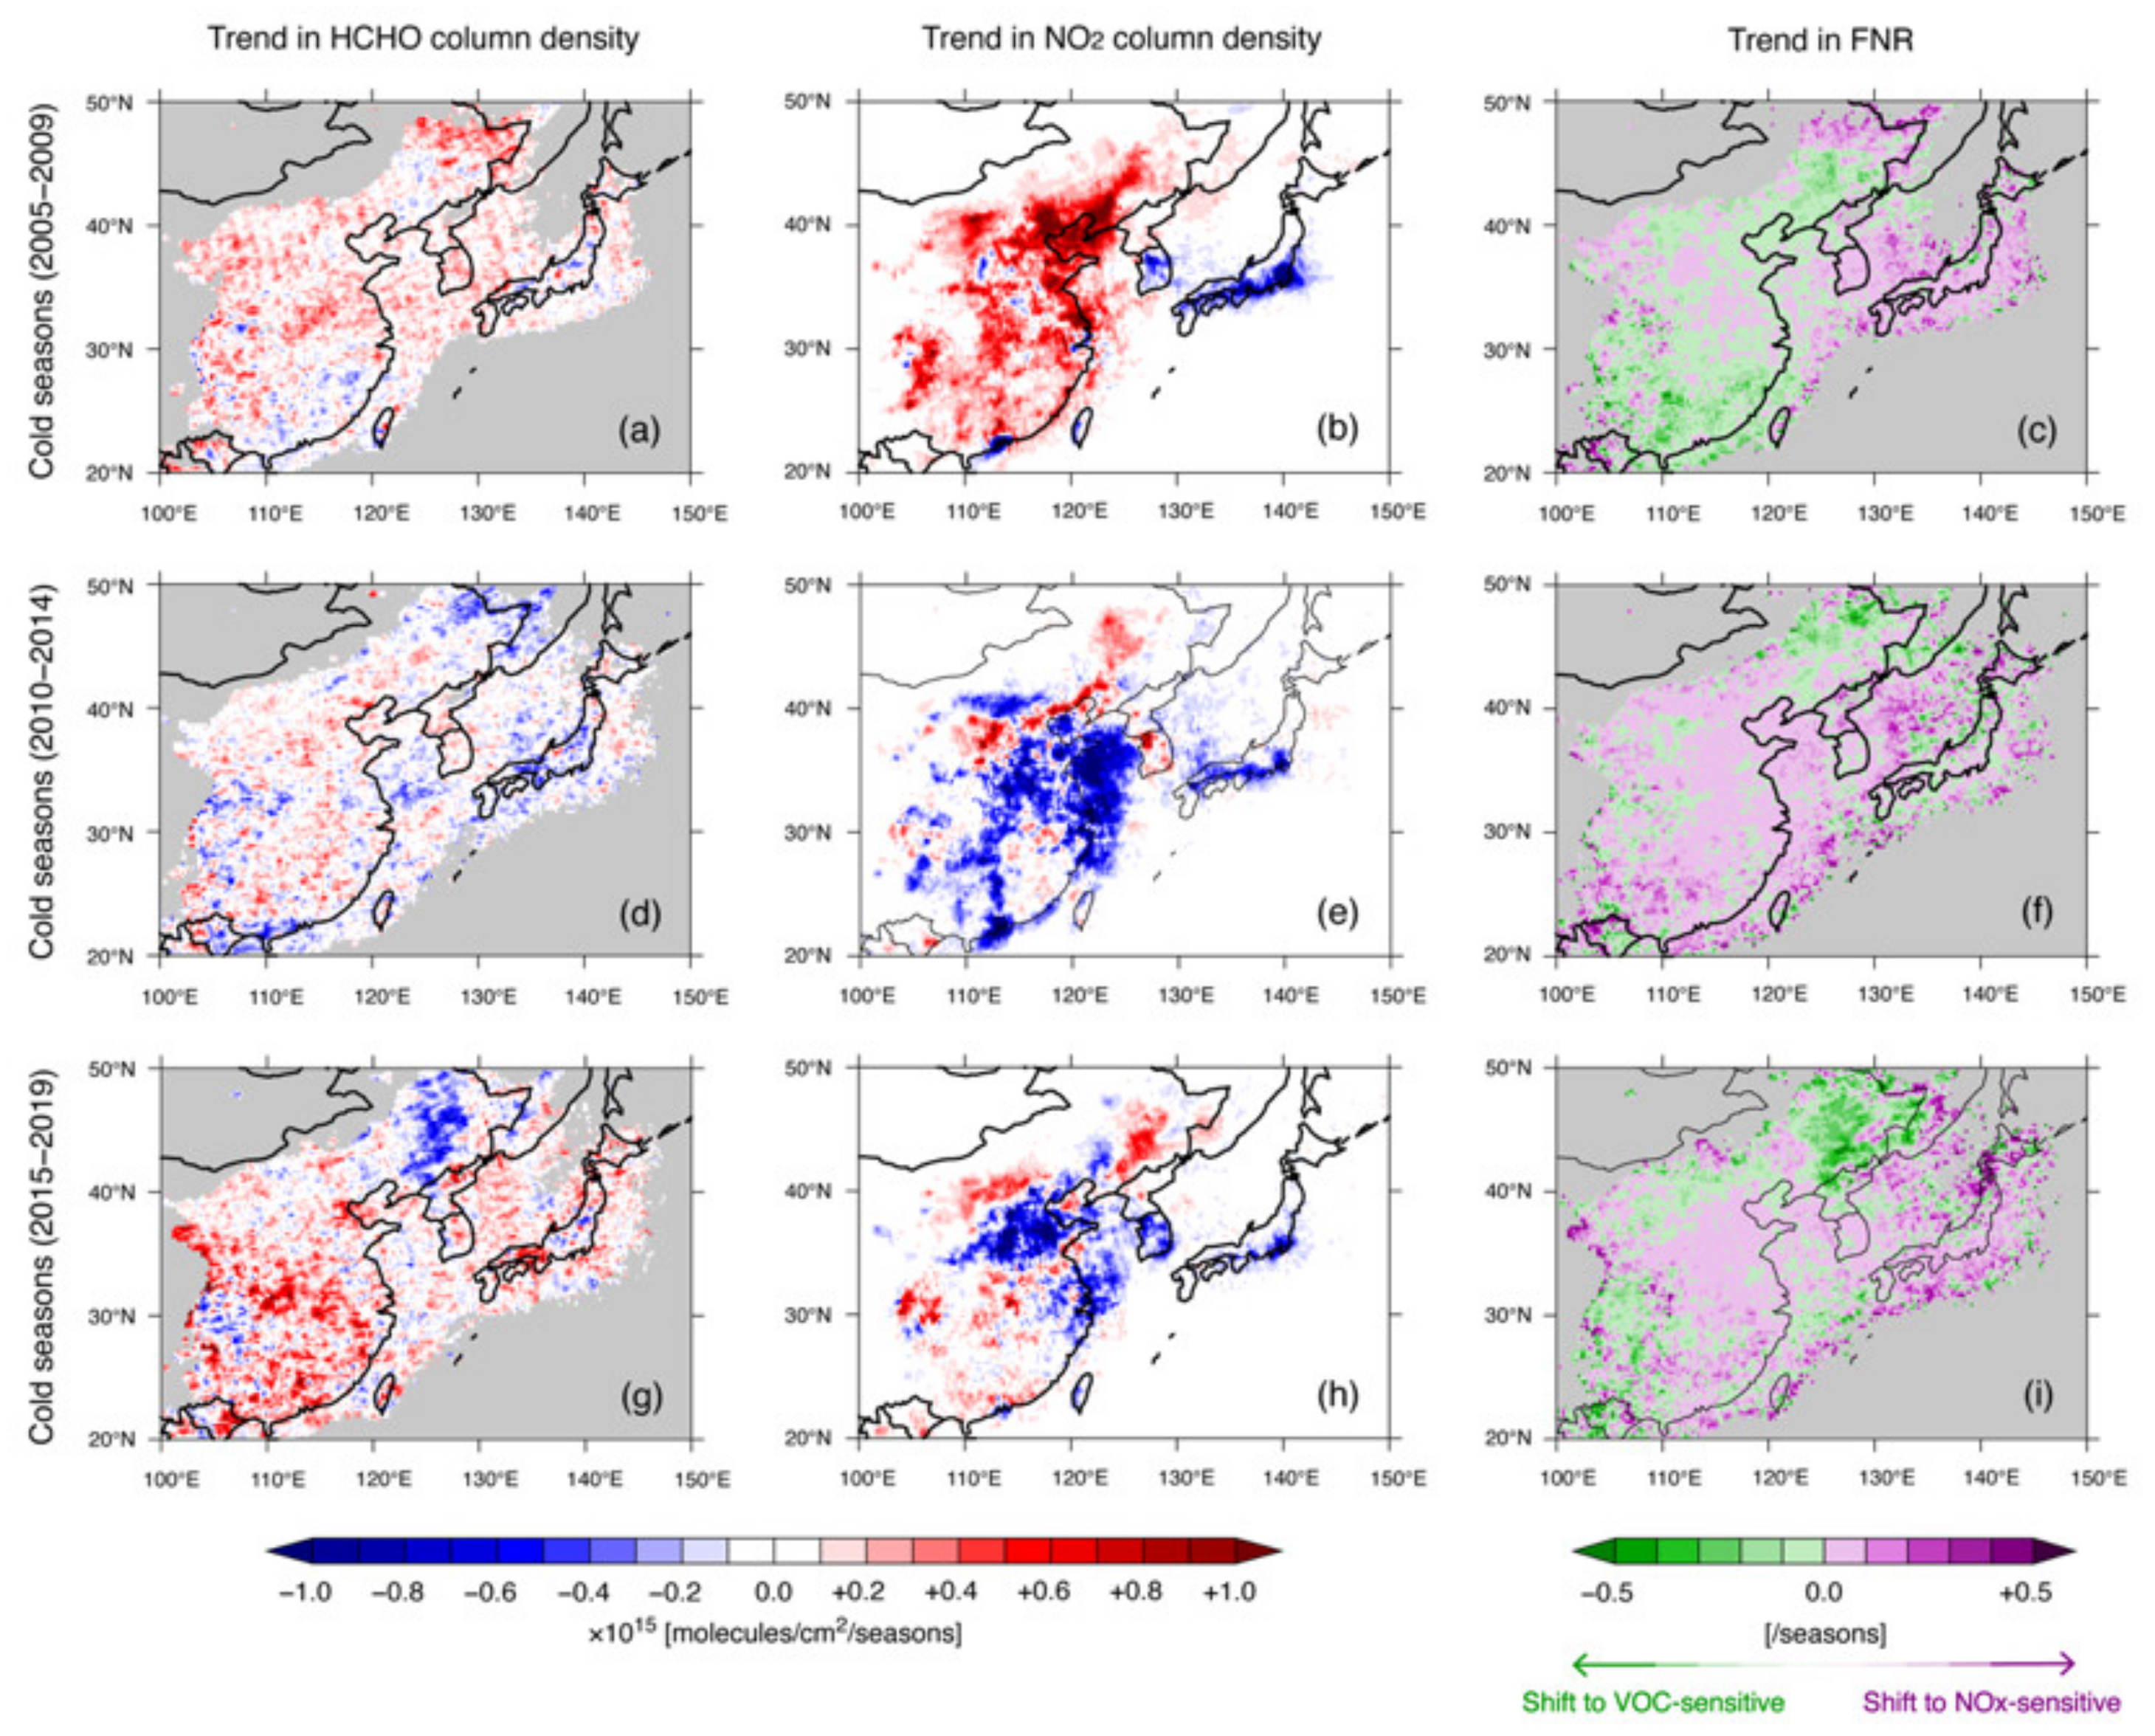
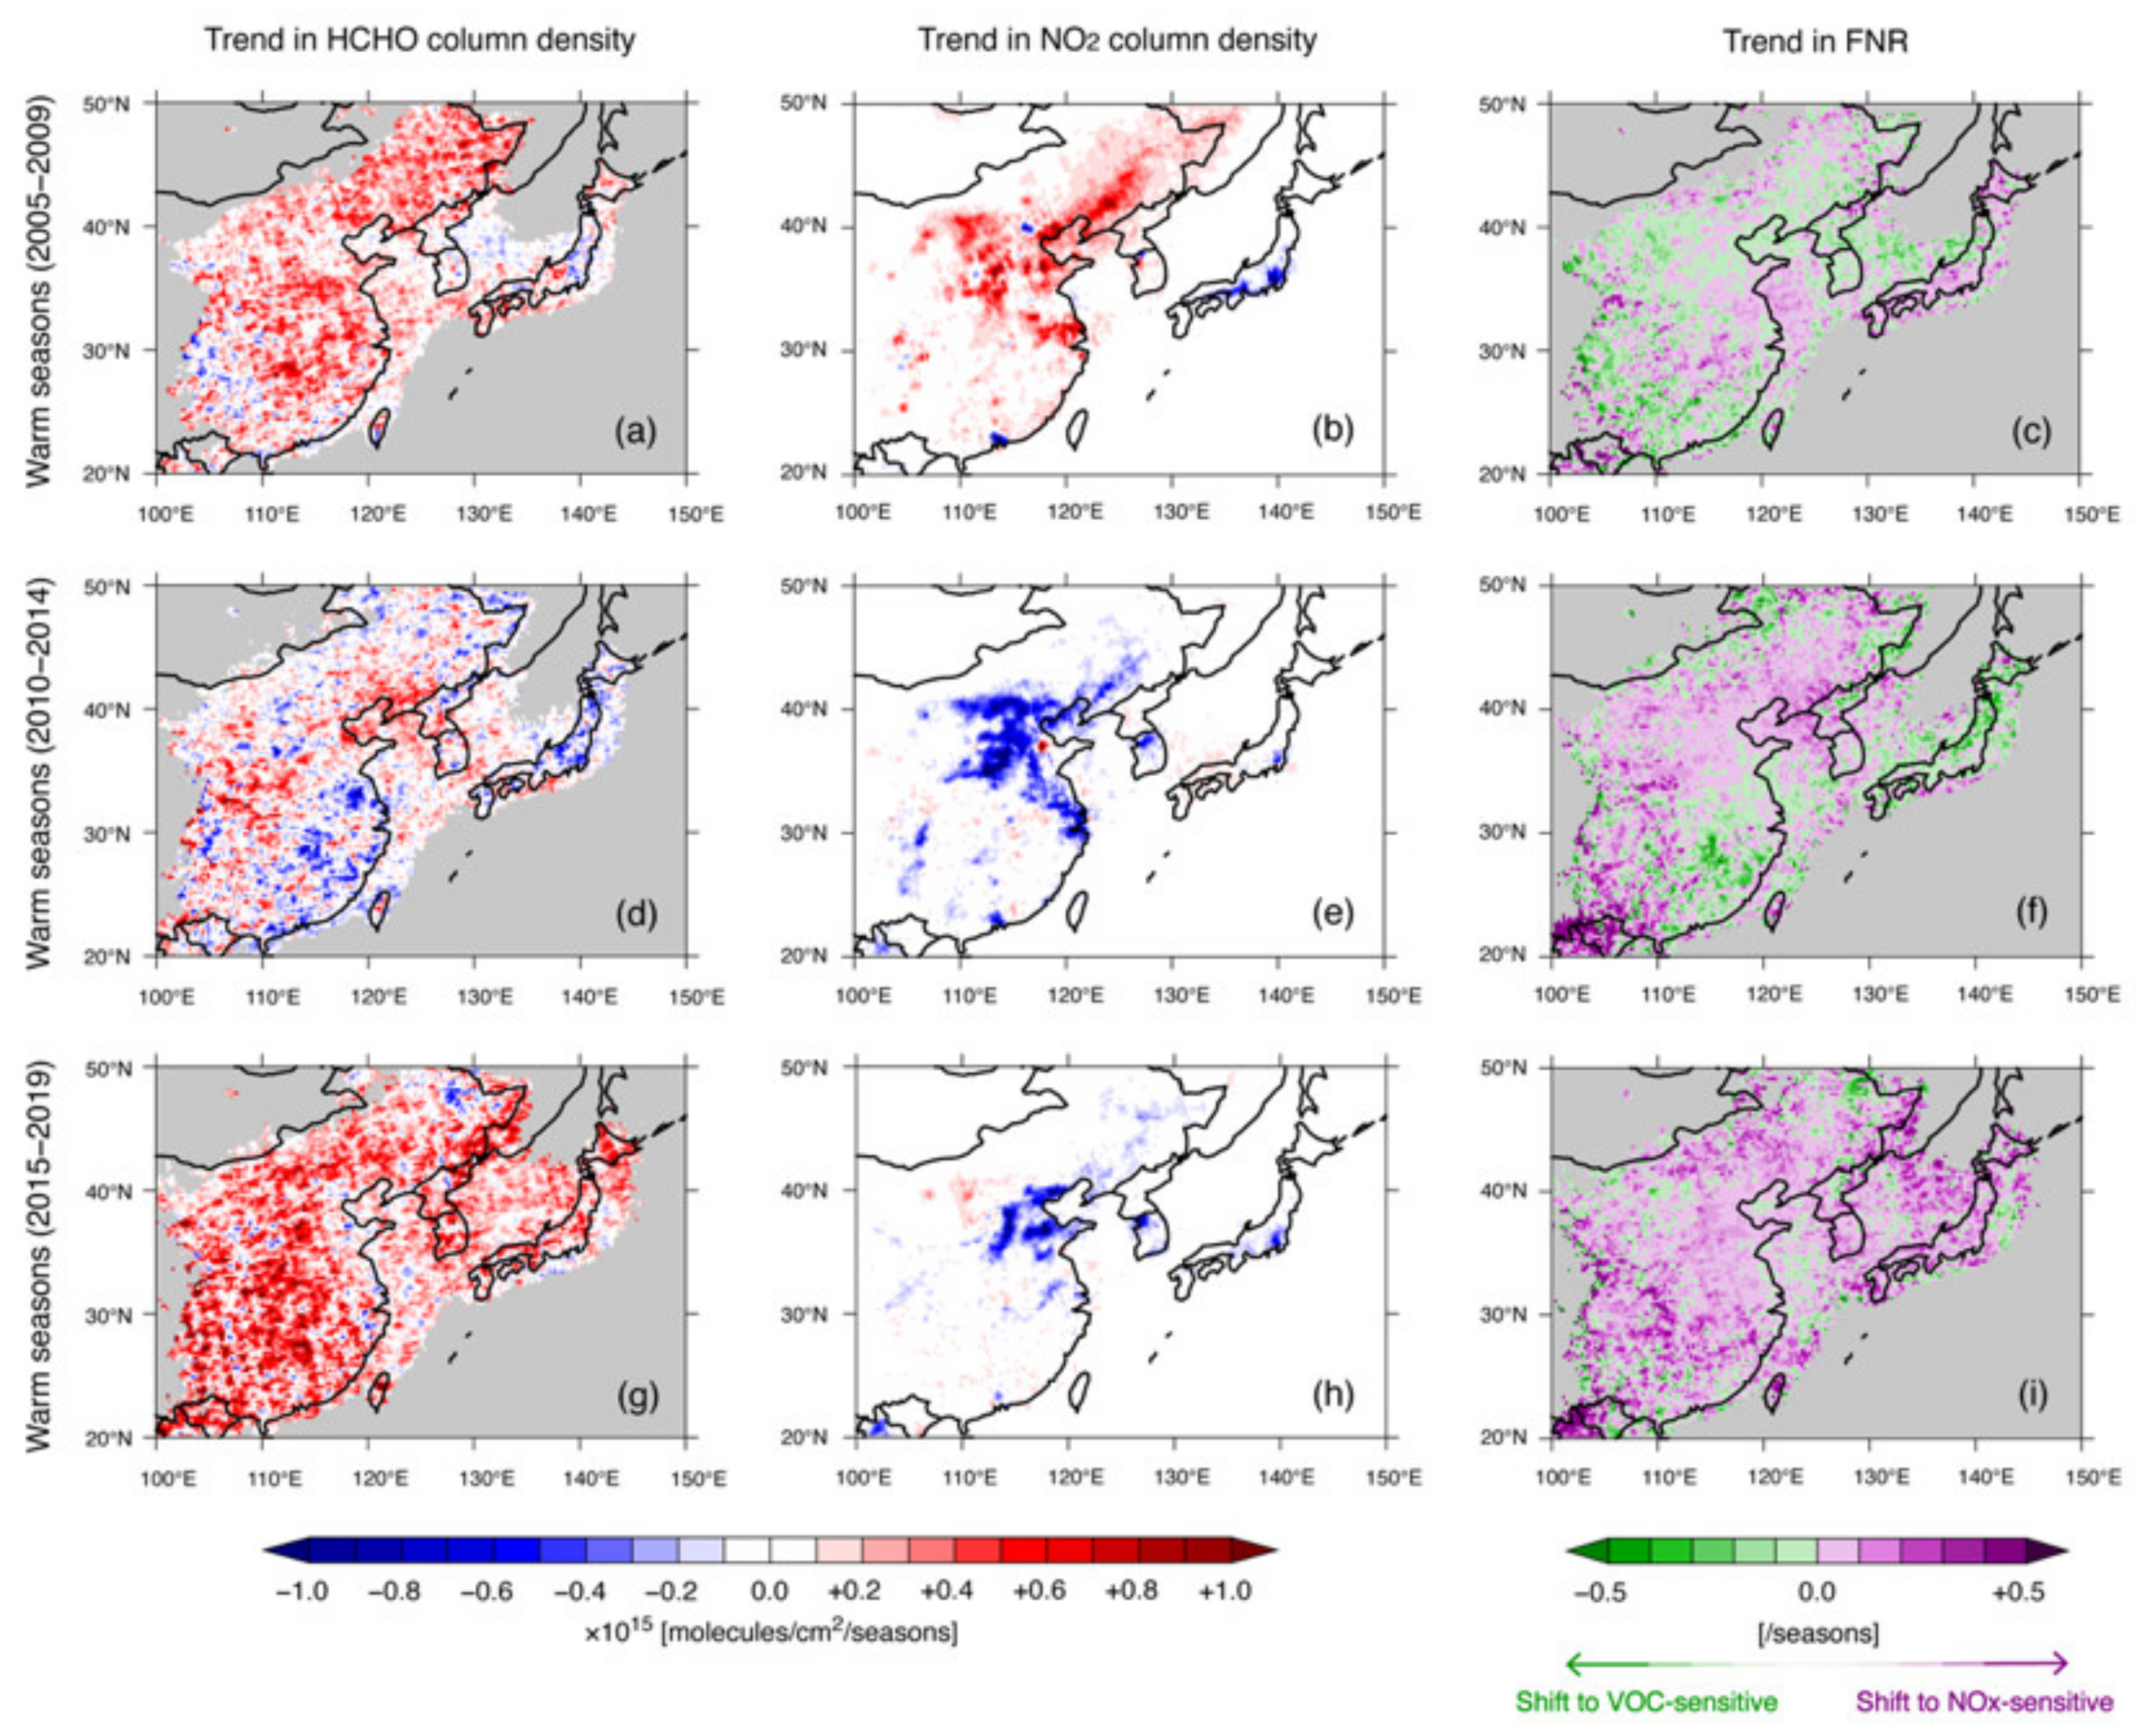
3.2. Trends in FNR over East Asia

To clarify the long-term trends in the O3-sensitive regime over East Asia, the years 2005, 2010, 2015, and 2019 were analyzed by averaging over all seasons for each year (Figure 2). The HCHO column density increased during this period. No HCHO column densities greater than 10.0 × 10¹⁵ molecules cm−2 (dark red in Figure 2a) were found in 2005 (Figure 2a), whereas they were found over eastern China in 2019 (Figure 2j). High NO2 column densities greater than 10.0 × 10¹⁵ molecules cm−2 (dark red in Figure 2b) were observed in 2010 (Figure 2e) and they decreased slightly in 2019 (Figure 2k). The FNR values were generally similar in 2005 (Figure 2c) and 2010 (Figure 2f), and subsequently increased (i.e., from VOC-sensitive toward NOx-sensitive regimes) in 2015 (Figure 2i) and 2019 (Figure 2l), corresponding to the substantial variations in increasing HCHO column density and decreasing NO2 column density. To clarify these features, trends were calculated based on the linear regression analyses conducted for 5-year intervals of 2005–2009, 2010–2014, and 2015–2019. The value of slope in the linear regression analyses was regarded as the trend throughout the analyses.
Trends were calculated by linear regression analyses for three 5-year periods of 2005–2009, 2010–2014, and 2015–2019 (Figure 3). During the first 5-year period (2005–2009), HCHO and NO2 column density both generally showed increasing trends (Figure 3a,b). The exceptions were decreasing trends in NO2 column density over the Pearl River Delta in China, Taiwan, Seoul, and the whole of Japan. The increasing trend in HCHO column density with higher rates in northern China and lower rates in southern China was consistent with previous findings [48], and the large increase in NO2 column density over the whole of China was also consistent with previous studies [36,37,49,50]. The FNR over China had complex features during the first 5-year period (2005–2009) because of the rates of change of the HCHO and NO2 column densities used to calculate FNR (Figure 3c). Due to the decreasing trends in NO2 column density (the denominator in the FNR) over the Republic of Korea and Japan, the FNR showed increasing trends (Figure 3c). The slight increasing trends (purple in Figure 3c) over the East China Sea to the Republic of Korea and Japan indicated that these regions gradually shifted into a NOx-sensitive regime during 2005–2009. Southern China and northeastern China showed decreasing trends in FNR, suggesting a shift into a VOC-sensitive regime during 2005–2009. During the second 5-year period (2010–2014), HCHO column density showed complex behavior, with slight increasing trends, except for the coastline over southern China and some parts of Japan (Figure 3d). The trends in NO2 column density in China and over all of East Asia turned negative (Figure 3e), which has been also highlighted in previous studies [36,37,51]. The increasing trend in HCHO column density (the numerator in the FNR) and decreasing trend in NO2 column density (the denominator in the FNR) both led to increases in FNR (Figure 3f). Except for southern China and some parts of Japan, the increasing trend in FNR (purple in Figure 3f) suggested the shift into a NOx-sensitive regime during the second 5-year period (2010–2014). During the third 5-year period (2015–2019), HCHO column density showed continuous increasing trends with a higher rate than in the second 5-year period (2010–2014), except over northeastern China (Figure 3g), and NO2 column density also showed continuous decreasing trends (Figure 3h). Consequently, FNR during this period showed greater increases, with the exception of northeastern China (Figure 3i). The linear regression analysis indicated an increasing trend in FNR over the 15-year period, especially during 2015–2019 over most of East Asia, notably over the mid-latitude region of 30–40°N, which includes the capitals Beijing, Seoul, and Tokyo. This result suggested that the O3-sensitive regime over East Asia gradually shifted from VOC-sensitive to NOx-sensitive during the 15 years. The linear regression analyses of FNR averaged over the warm and cold seasons are shown in Figure A1 and Figure A2 in Appendix A. The results revealed that the gradual shift from the VOC-sensitive to NOx-sensitive regime was found during both the cold and warm seasons; however, the trend was much clearer during the warm seasons.

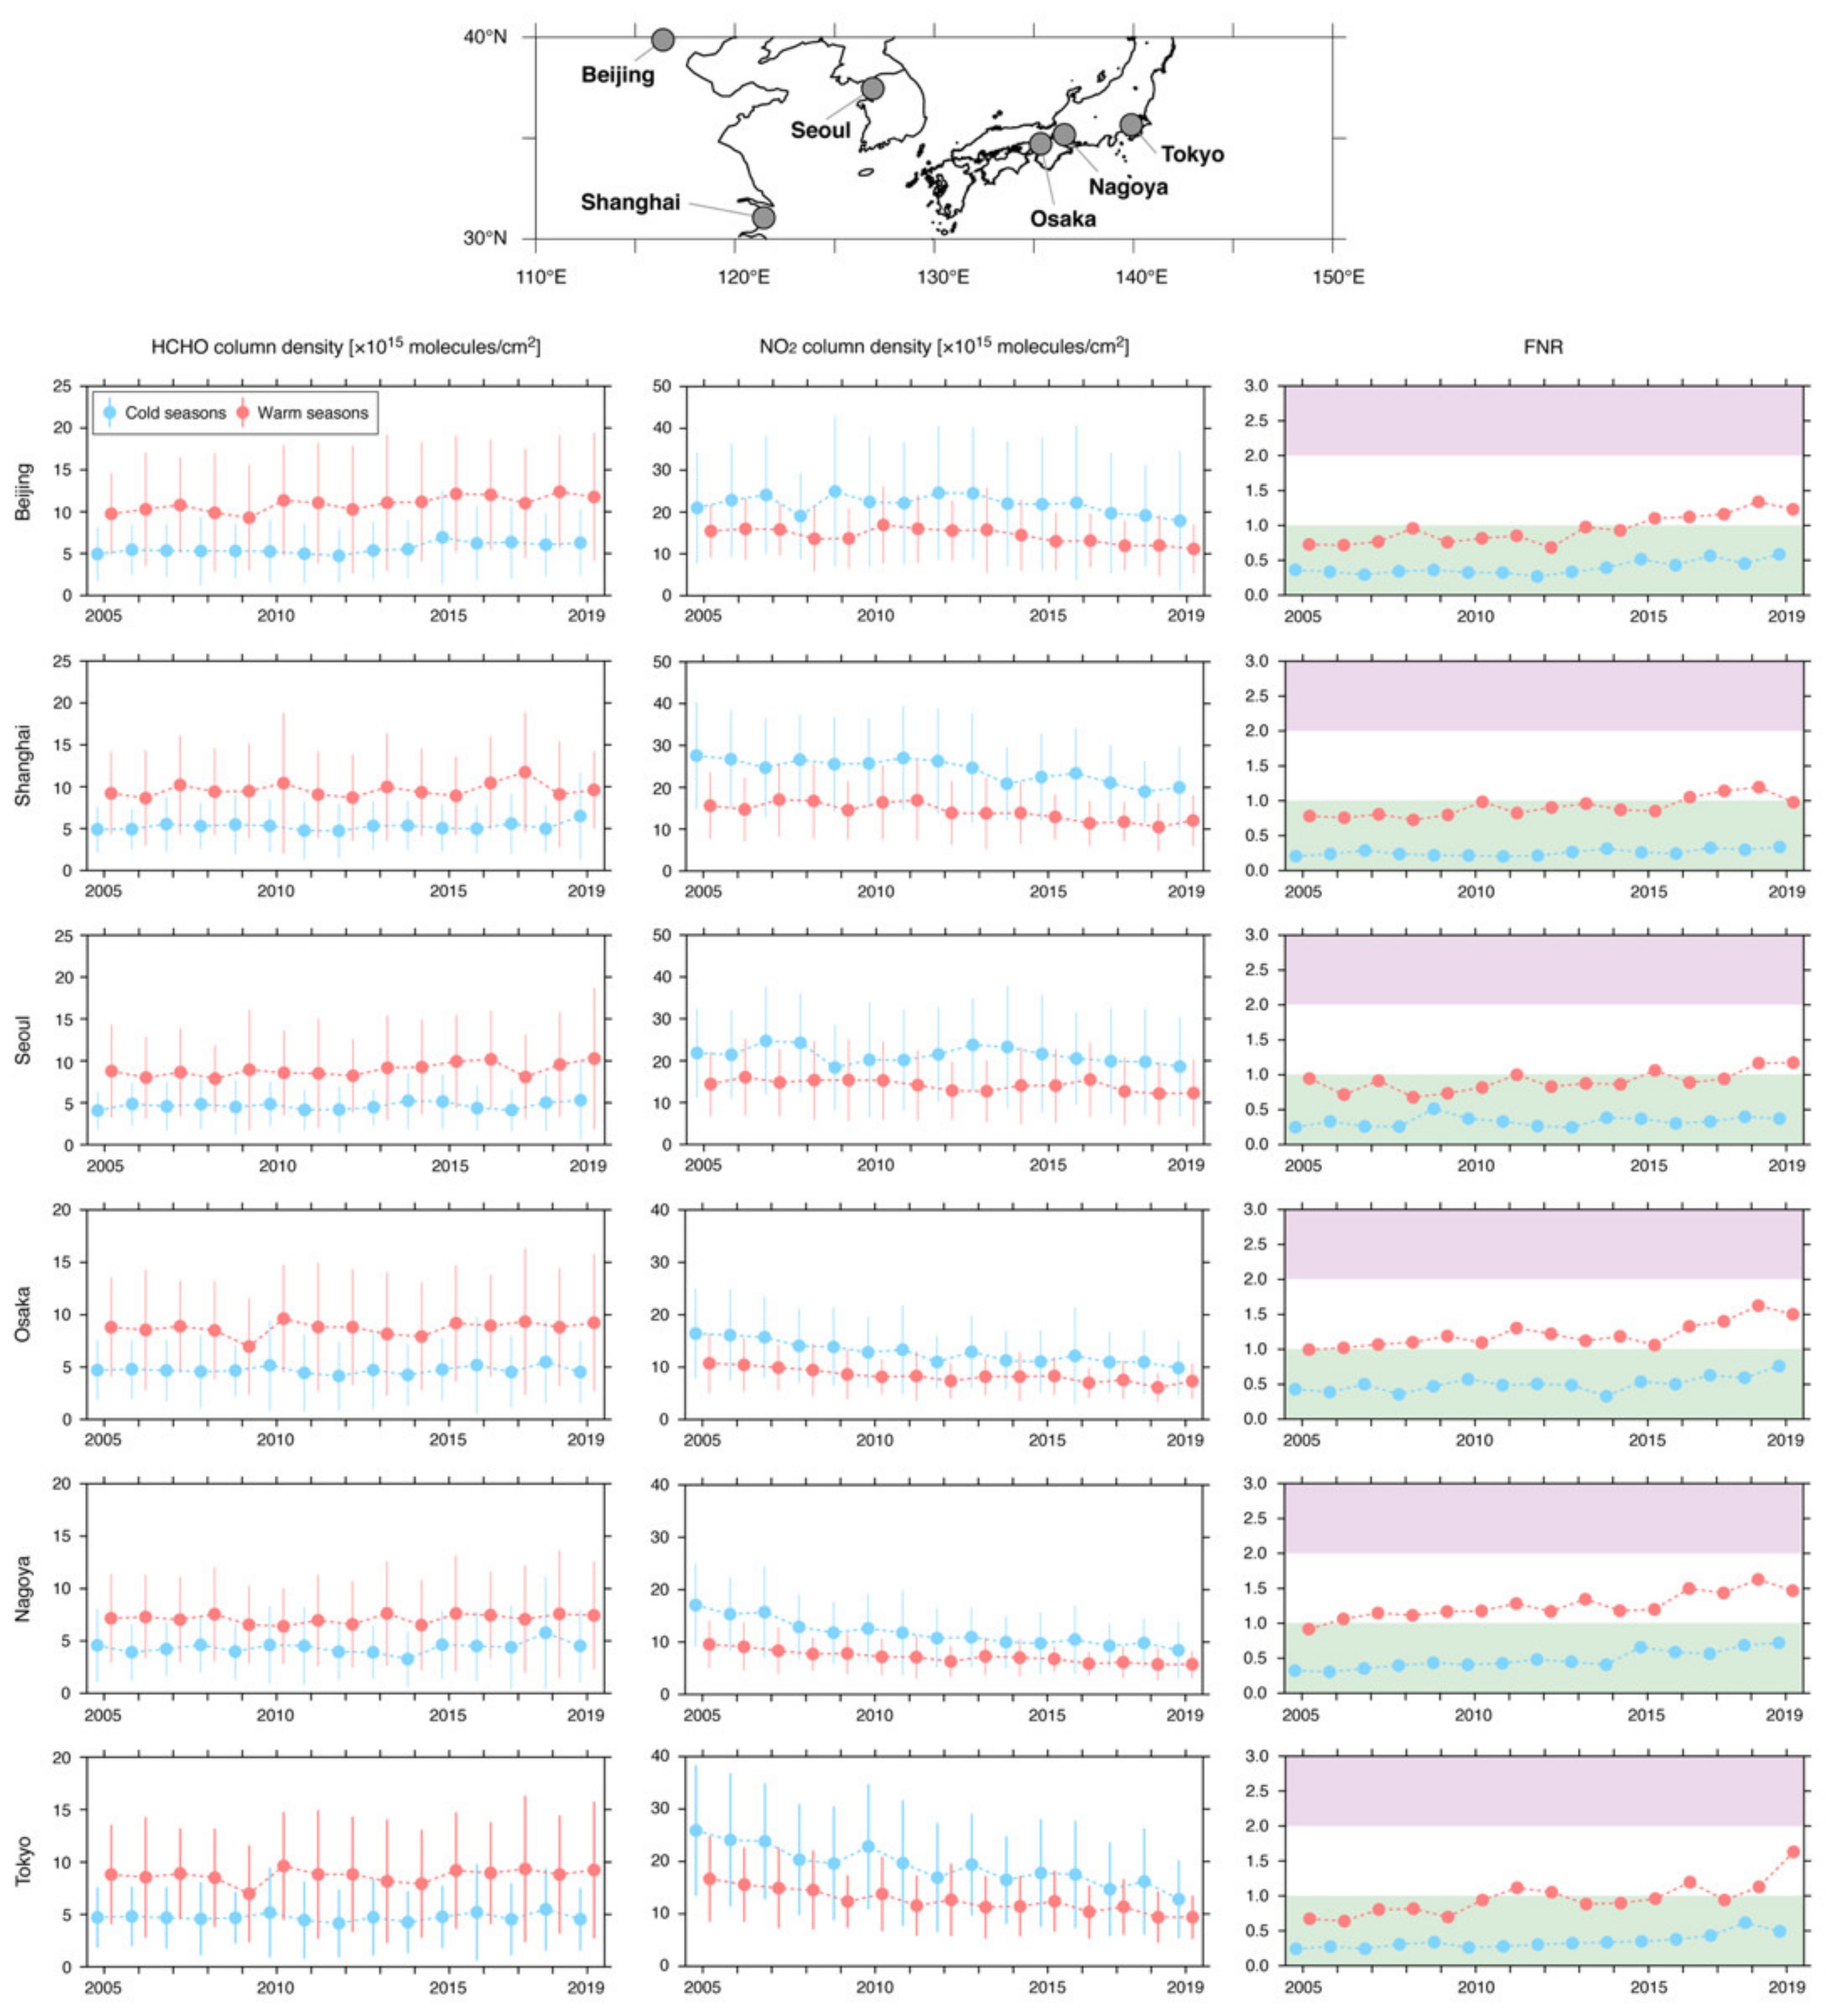
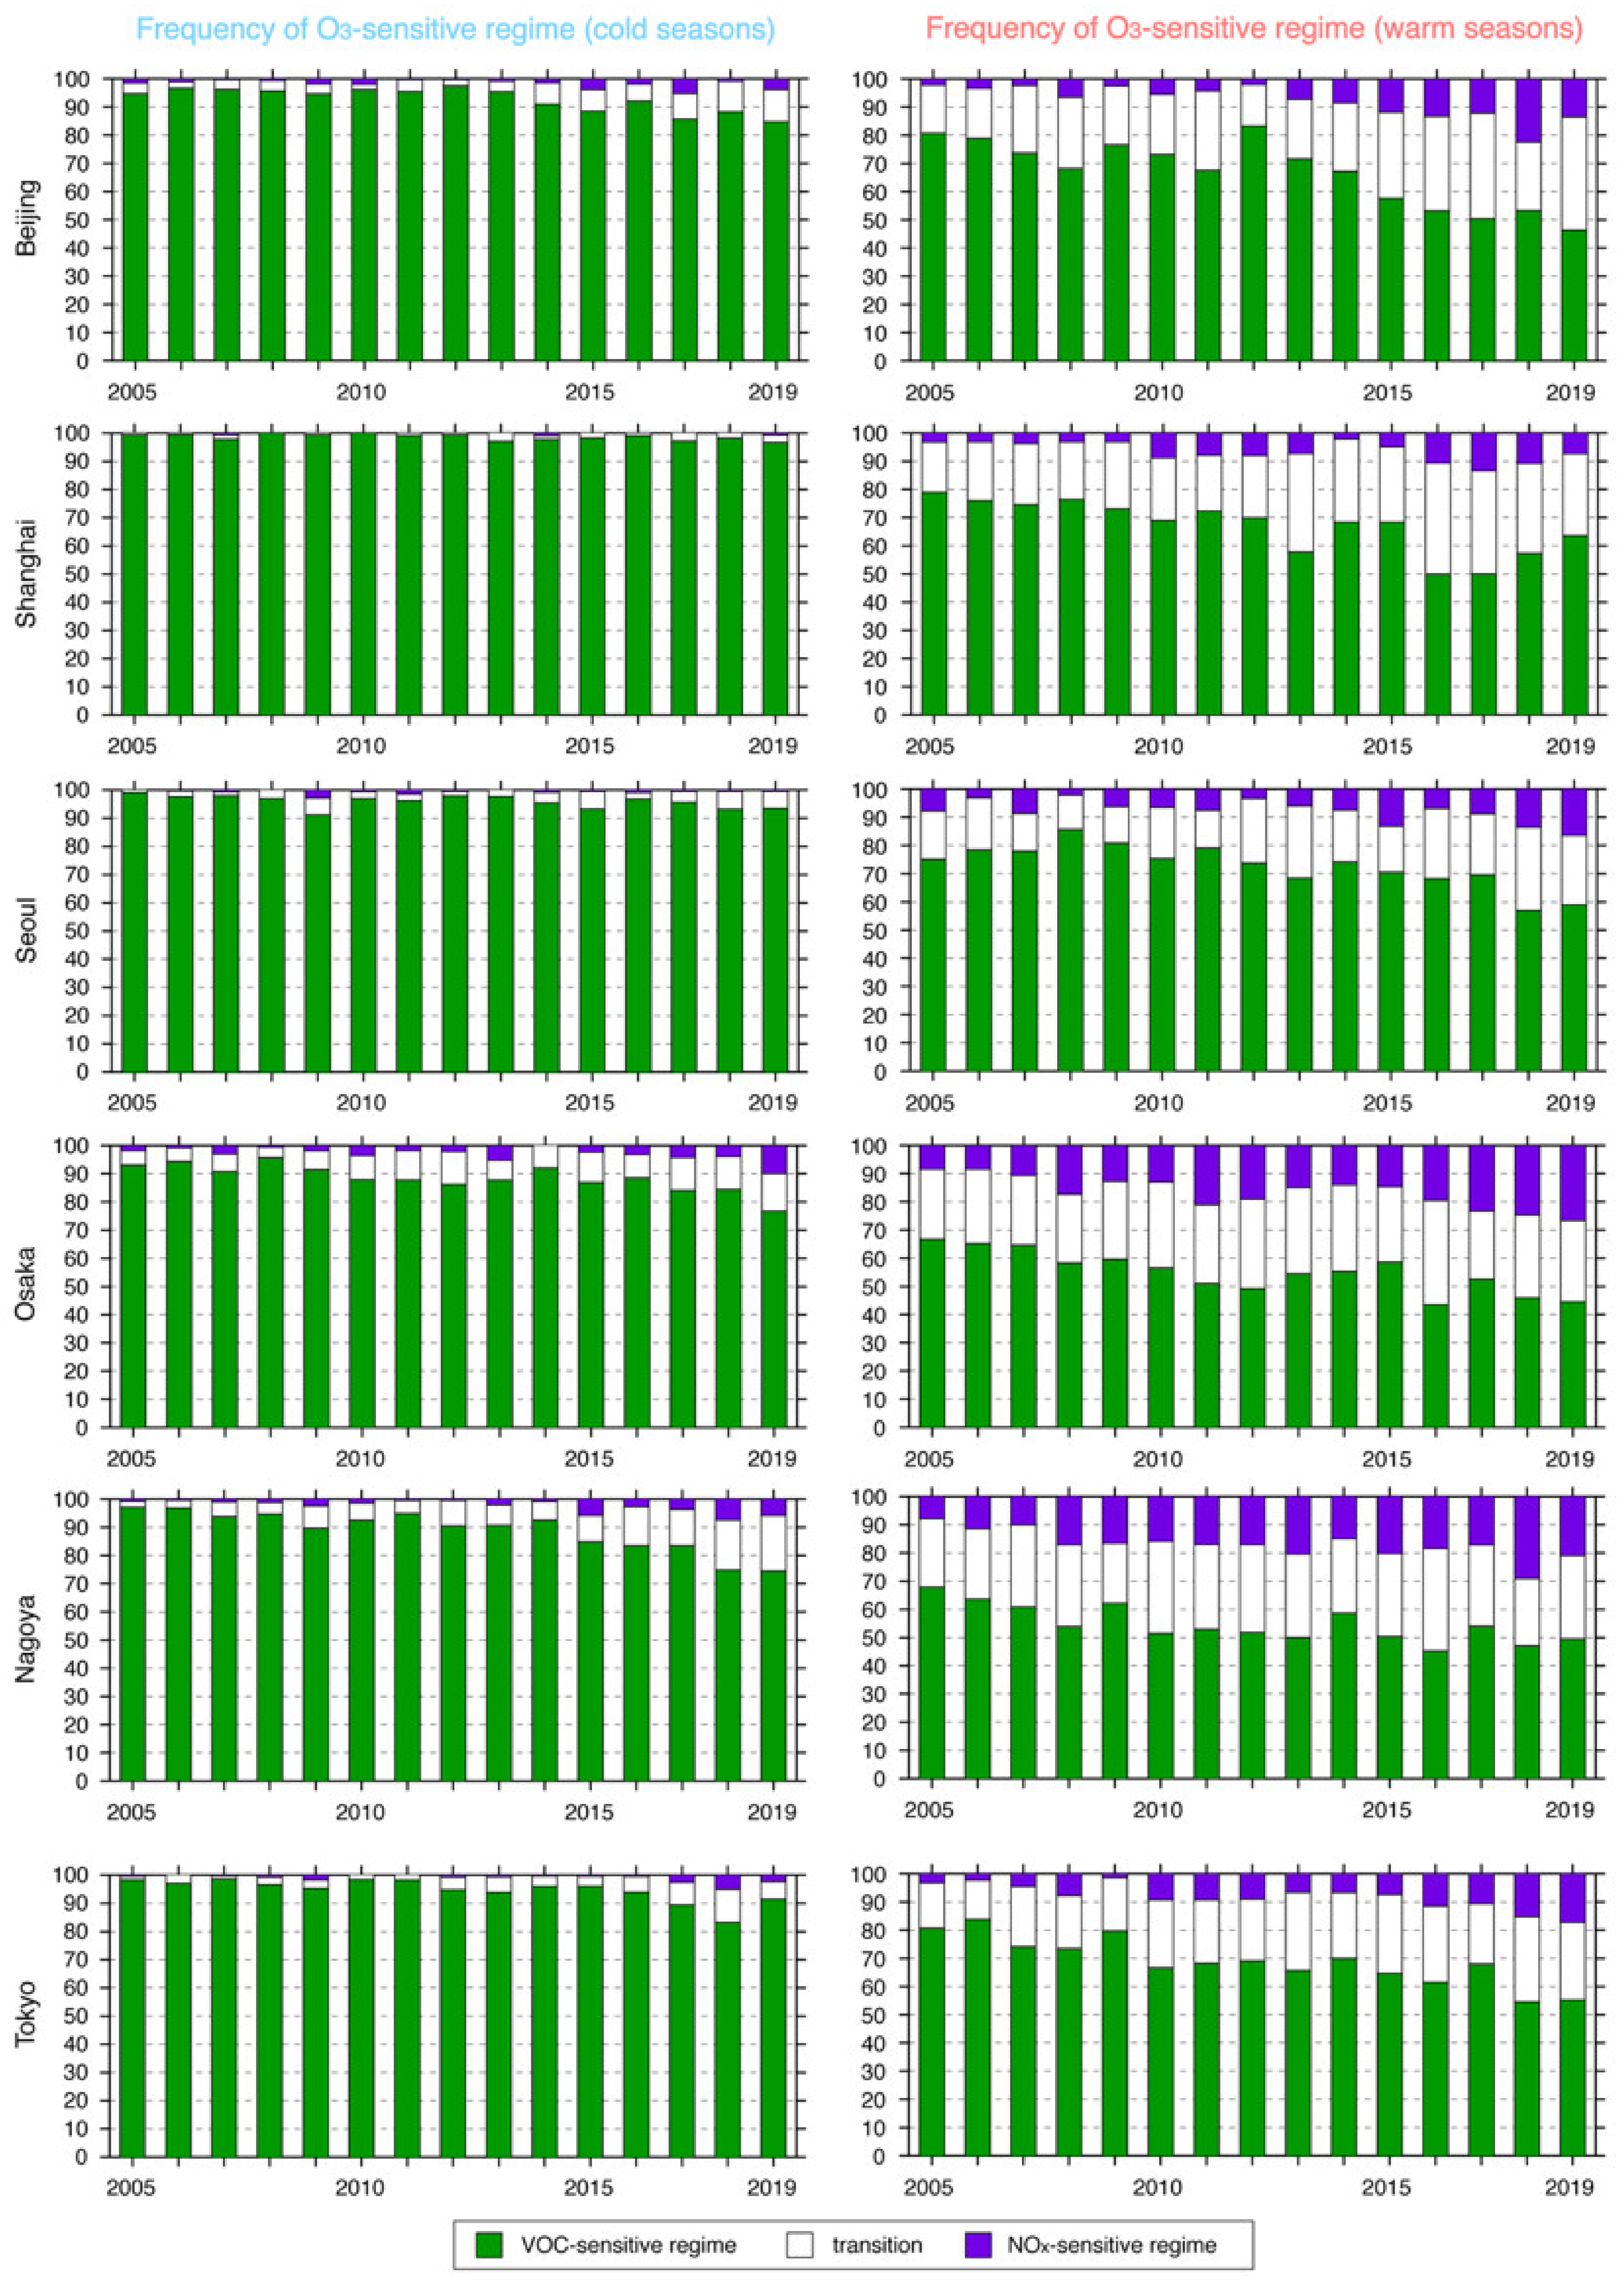
3.3. Grid Point Analyses of Megacities in East Asia

The FNR showed a gradual shift from VOC-sensitive to NOx-sensitive regimes, especially during 2015–2019, due to the increase in HCHO and decrease in NO2. Grid point analyses of six megacities in the region of 30–40 °N (Beijing and Shanghai in China; Seoul in the Republic of Korea; and Osaka, Nagoya, and Tokyo in Japan; see the top of Figure 4 for their locations) were performed and are shown as 15-year time series during 2005–2019 in Figure 4. To obtain sufficient numbers of observations, four grid points close to each city’s central point were averaged. Overall, HCHO column density exhibited almost flat or slightly increasing trends over the six megacities in cold and warm seasons, whereas NO2 column density showed a continuous decline; thus, FNR increased gradually. The FNR values were all below 1.0 and indicated VOC-sensitive regimes during both the cold and warm seasons over all six megacities in the first part of the 15-year period, although the FNR values increased gradually. In particular, there were increasing trends in FNR after 2015 averaged over warm seasons. The increasing trends in FNR shown by the grid point analyses were consistent with the spatial distribution of FNR (Figure 3i).
The statistical summaries of the mean and trend of FNR during the 5-year periods of 2005–2009, 2010–2014, and 2015–2019 are shown in Table 1. The FNR values increased continuously during the 15-year period, and the rate of increase was higher during 2015–2019 compared with other 5-year periods.
The gradual shift from the VOC-sensitive to NOx-sensitive regime was indicated by the FNR value, and this was clarified further by determining the frequency of occurrence of the O3-sensitive regime during the 15-year period (Figure 5). The O3-sensitive regime was identified by the conventional threshold values (see Section 2.1) and the frequency was analyzed over the cold and warm seasons for each year. Over the cold seasons, the VOC-sensitive regime was dominant and the NOx-sensitive regime did not appear during the first part of the period, whereas the transitional or NOx-sensitive regime was found at frequencies of 10–20% during the latter part of the period. The trends were clarified during warm seasons rather than cold seasons. During warm seasons, all six megacities were mostly dominated by the VOC-sensitive regime with frequencies of 70–80%, and the NOx-sensitive regime only occurred at a frequency of around 10% during the first part of the period. The frequency of the VOC-sensitive regime gradually declined over the period, and the NOx-sensitive regime occurred at a frequency of 10–20% during the latter part of the period. The frequency of occurrence of the transitional regime also gradually increased, and as a result, the VOC-sensitive regime occurred with a frequency of 50–60% during the latter part of the period. This analysis of the frequency of the O3-sensitive regime also indicated the gradual shift from the VOC-sensitive to NOx-sensitive regime over megacities in East Asia.

4. Discussion

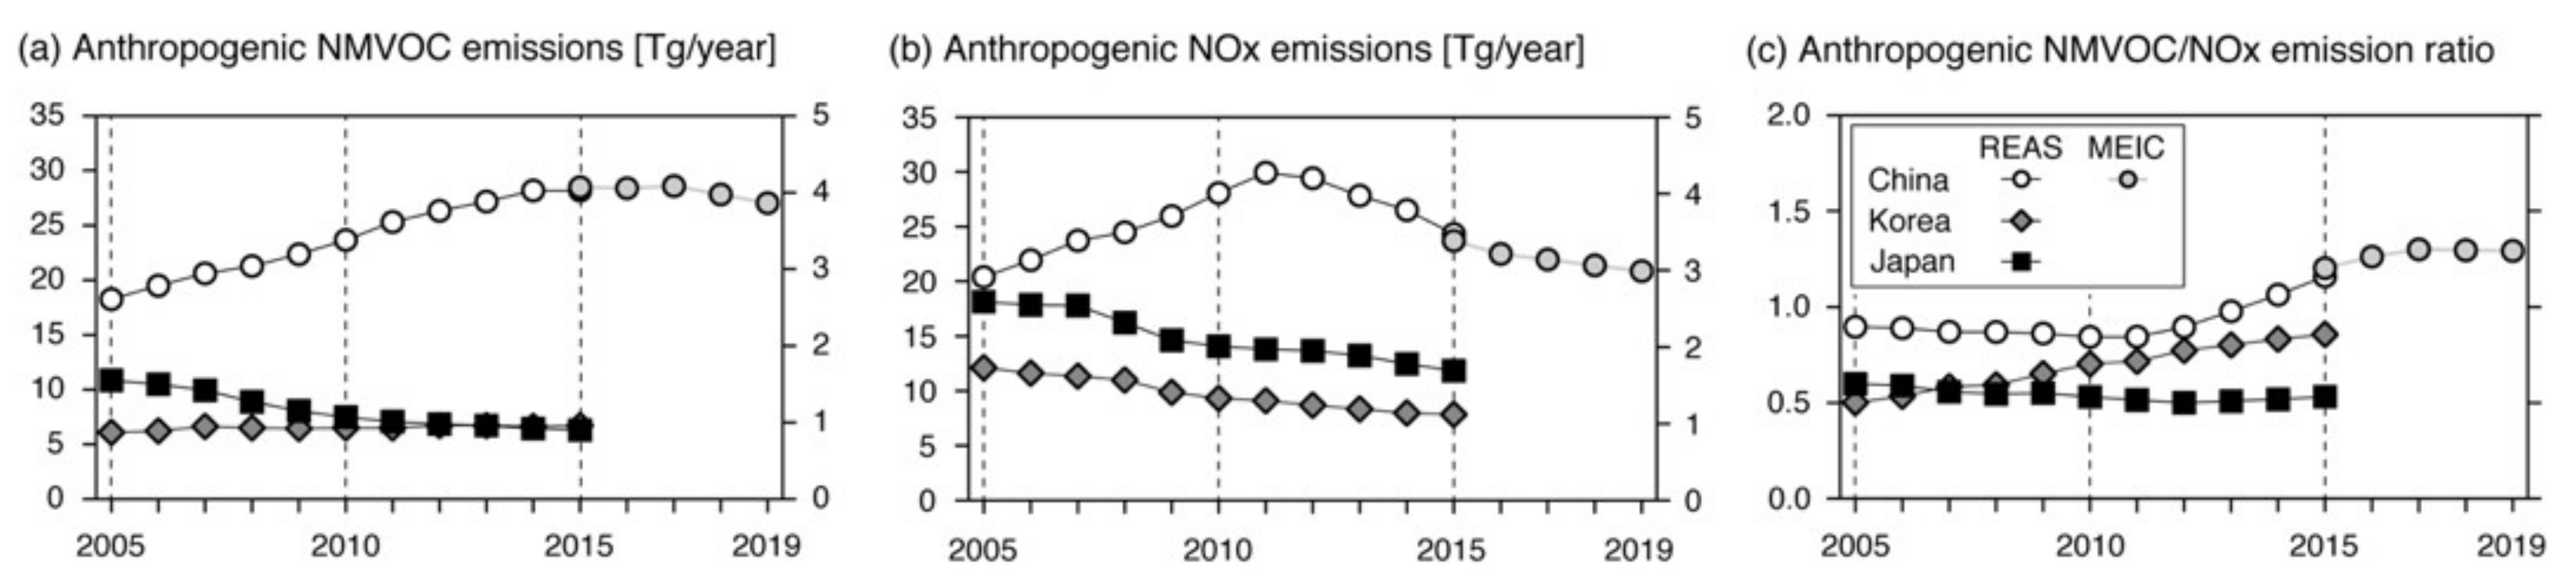
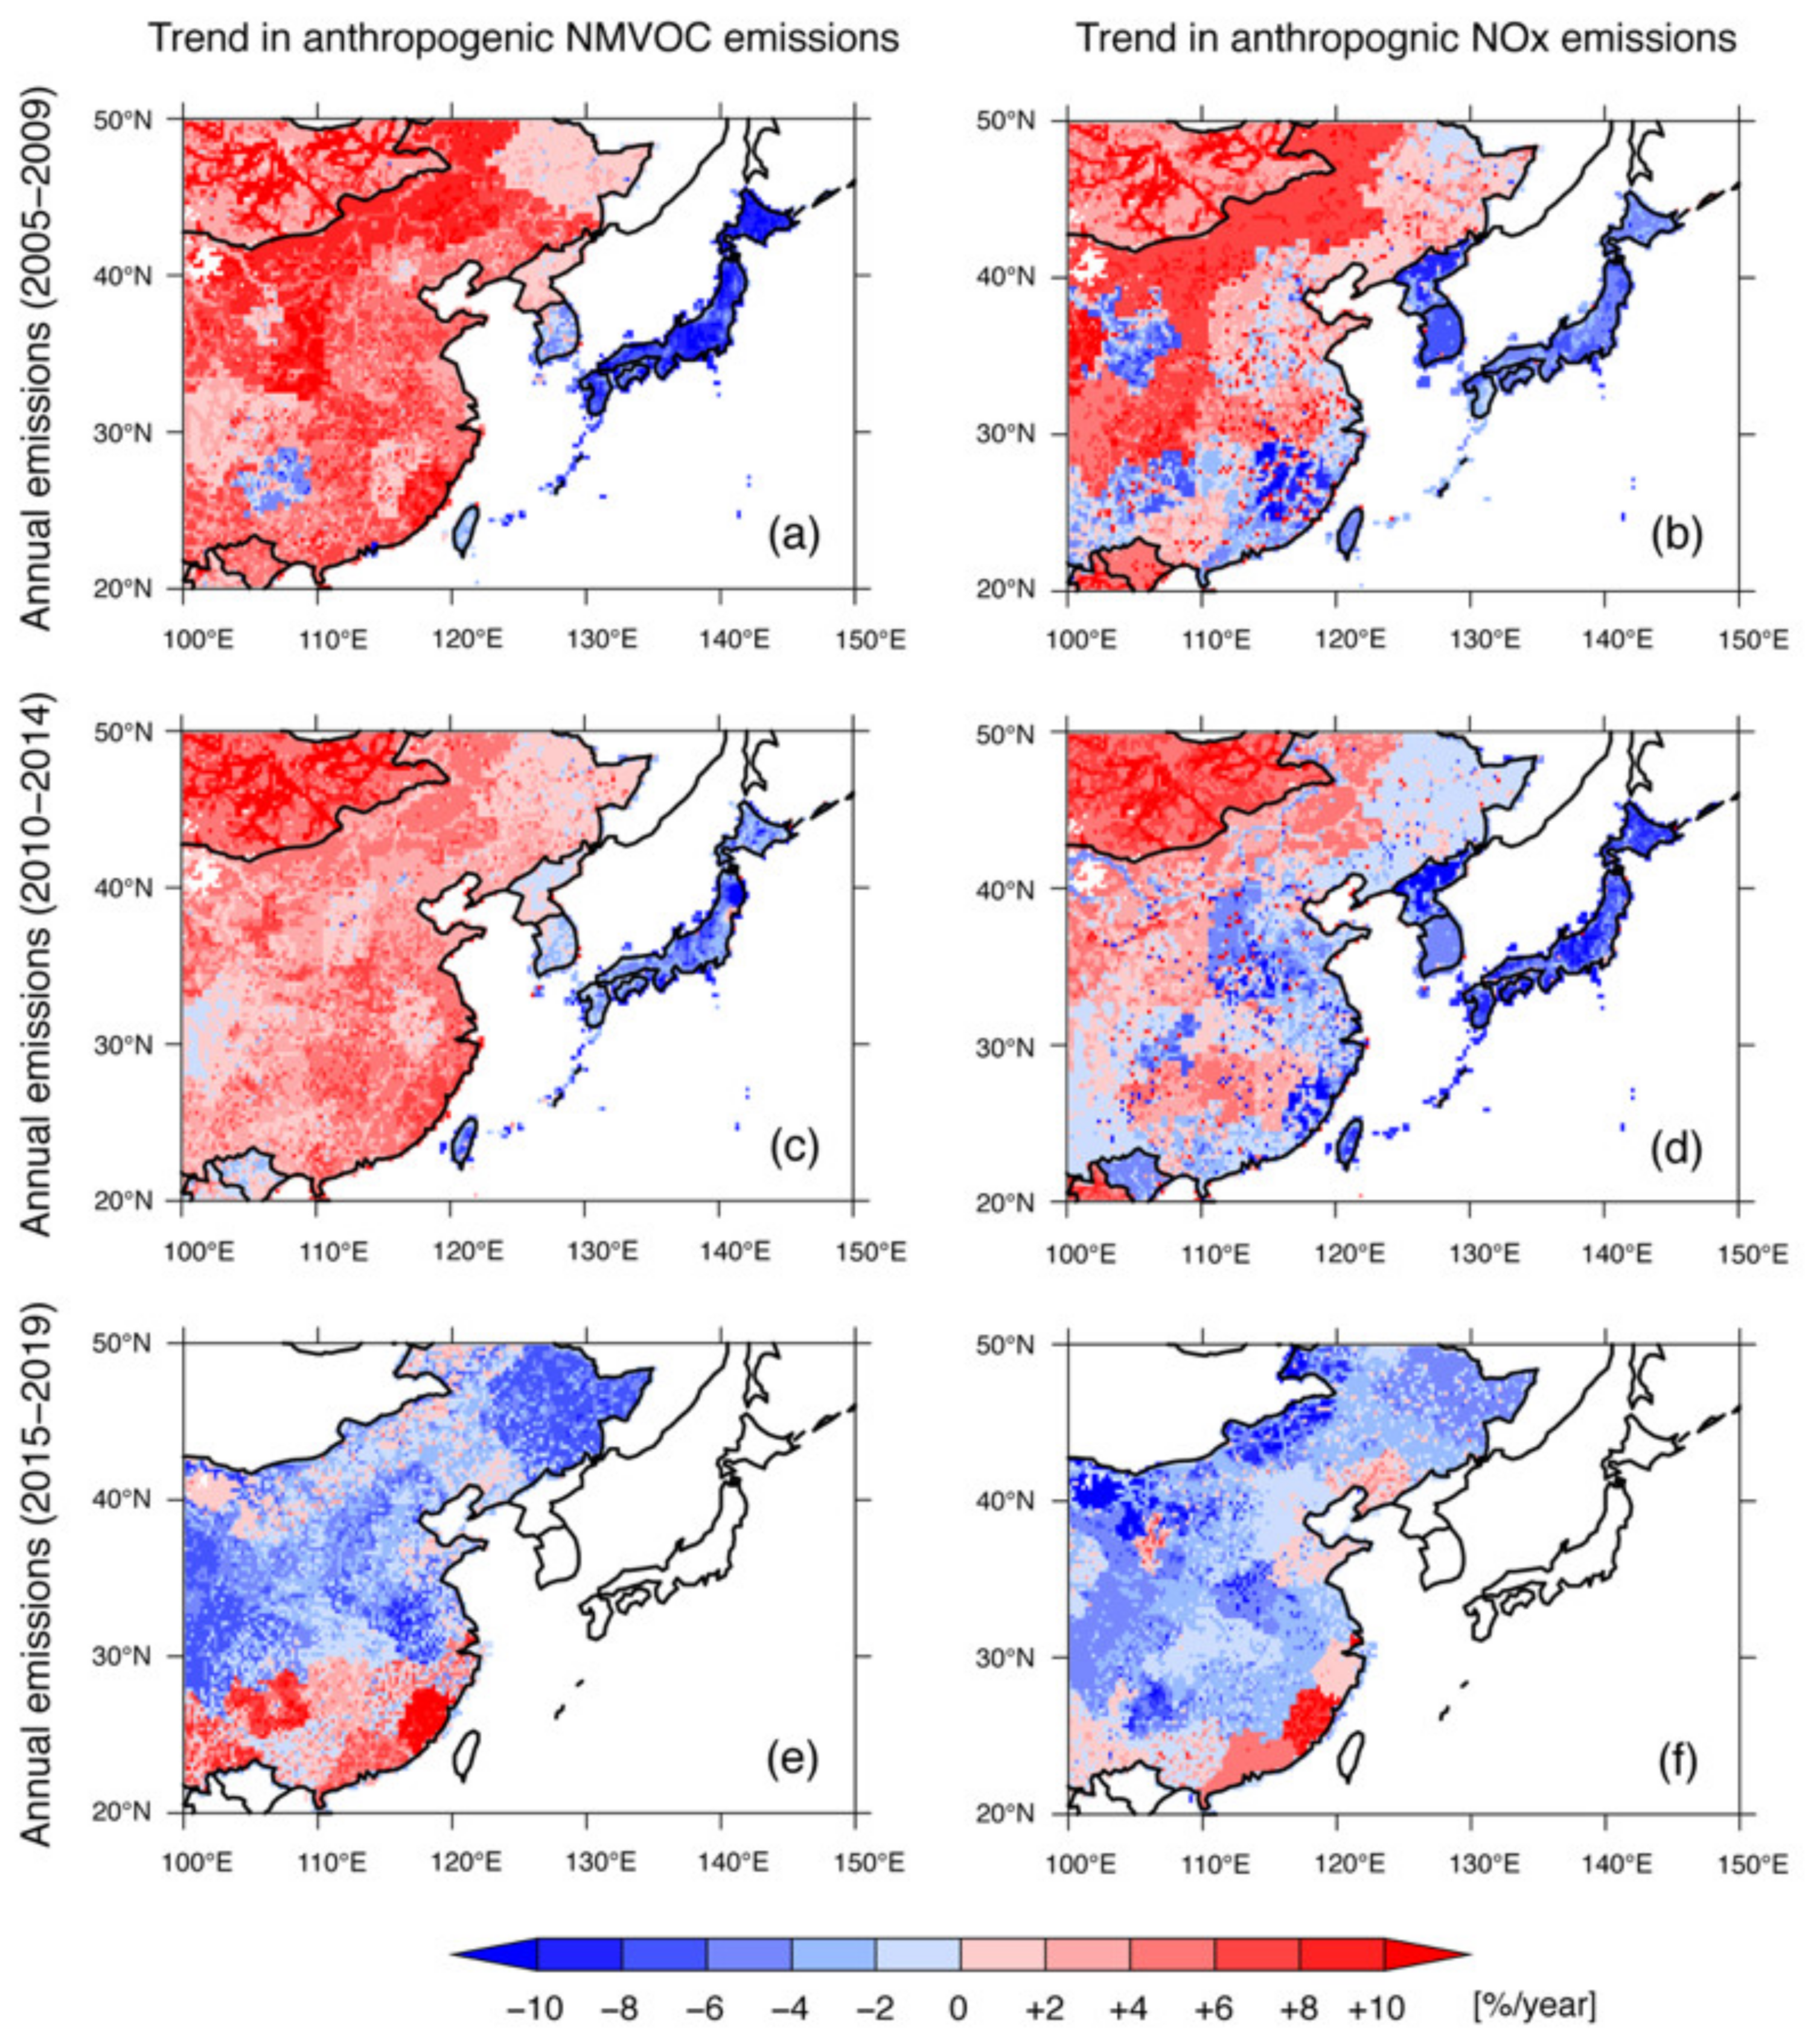
4.1. Trends in Anthropogenic Emissions over East Asia

To consider the reasons for the long-term trends in HCHO and NO2 column densities, and hence in the O3-sensitive regime over East Asia suggested by the FNR analysis, the trends in anthropogenic NMVOC and NOx emissions were investigated. The annual amount of anthropogenic NMVOC and NOx emissions from China, the Republic of Korea, and Japan during 2005–2019 are shown in Figure 6. This analysis was based on REAS, and the anthropogenic emissions from China during 2015–2019 from MEIC were added. The spatial distributions of the annual averaged anthropogenic NOx and NMVOC emissions during 2005–2014 based on REAS are presented in Figure A3 in Appendix A. Anthropogenic NMVOC emissions over China showed a continuous increase up to 2015 followed by a plateau, over the Republic of Korea they showed a slight increase, and over Japan, they showed a continuous decline to 2010 followed by a plateau (Figure 6a). The increase in anthropogenic NMVOC emissions was related to the increasing trends in HCHO column density up to 2015 (Figure 3a,d); however, anthropogenic NMVOC emissions during 2015–2019 over China appeared inconsistent with the overall increasing trend in HCHO column density (Figure 3g). Anthropogenic NOx emissions reached a peak in 2011 and subsequently decreased over China, and continuous decreasing trends were seen over the Republic of Korea and Japan (Figure 6b). These trends in anthropogenic NOx emissions corresponded well to the long-term variations in NO2 column density (Figure 3b,e,h). This result indicated that other NOx emissions sources such as lightning emissions and soil emissions could be lower and that anthropogenic emissions were the dominant factor during this period. The analysis of the anthropogenic NMVOC/NOx emission ratio also showed an important change in the anthropogenic emissions themselves (Figure 6c). The trend in the anthropogenic NMVOC/NOx emission ratio over China was flat during 2005–2009, increased during 2010–2015, and then leveled off at a higher value than in 2005–2009. The ratio over the Republic of Korea increased continuously, whereas that over Japan decreased slightly. This emission ratio was also related to the O3-sensitive regime behavior, and the increase in the ratio over China and the Republic of Korea also contributed to the gradual shift from the VOC-sensitive regime to the NOx-sensitive regime.
The total amounts of anthropogenic emissions on the whole-country scale were analyzed (Figure 6); however, geographical characteristics are also important factors in regional differences. Therefore, the linear regression analyses for anthropogenic NMVOC and NOx emissions using the same method as in Figure 3 were conducted for the three 5-year periods of 2005–2009, 2010–2014, and 2015–2019 (Figure 7). During the first 5-year period (2005–2009), anthropogenic NMVOC and NOx emissions both showed a generally increasing trend over China and a decreasing trend over the Republic of Korea and Japan (Figure 7a,b). During the second 5-year period (2010–2014), anthropogenic NMVOC emissions still showed an increasing trend over most of China and a continuously decreasing trend over the Republic of Korea and Japan (Figure 7c). In this period, overall anthropogenic NOx emissions over China started to decrease (Figure 6b), although they decreased over eastern China and increased over western China (Figure 7d). These regional features in China have been linked to the different emission regulation strategies [52]. Anthropogenic NOx emissions from the Republic of Korea and Japan showed a continuously decreasing trend (Figure 7d). Over the third 5-year period (2015–2019), anthropogenic NMVOC emissions over China showed increasing trends over the southern region and decreasing trends over the northern region (Figure 7e), and thus the total amount of emissions was almost unchanged (Figure 6a). Anthropogenic NOx emissions over China mainly decreased during this period (Figure 7f).
These anthropogenic NMVOC and NOx emissions trends (Figure 7) generally corresponded to the HCHO and NO2 column densities (Figure 3). NMVOC emissions increased with the HCHO column density during the first and second 5-year periods between 2005 and 2015, and the increase in HCHO column density during 2005–2016 has been reported in a previous study [53]. However, there was a clear discrepancy between the anthropogenic NMVOC emissions (Figure 7e) and HCHO column density (Figure 3g) during the third 5-year period of 2015–2019. The increasing anthropogenic NMVOC emissions over southern China (Figure 7e) could explain the increase in HCHO column density over this area (Figure 3g); however, the decreasing anthropogenic NMVOC emissions over northern China (Figure 7e) were not consistent with the increase in HCHO column density (Figure 3g). This analysis of anthropogenic emissions and the comparisons of the anthropogenic emission trends and column densities showed that anthropogenic emissions could generally explain the behavior of HCHO and NO2 column densities and hence that of the FNR values. However, anthropogenic NMVOC emissions did not solely explain the increasing HCHO column density during 2015–2019. Because the HCHO column density also depends on biogenic emission sources, we discuss this point next.

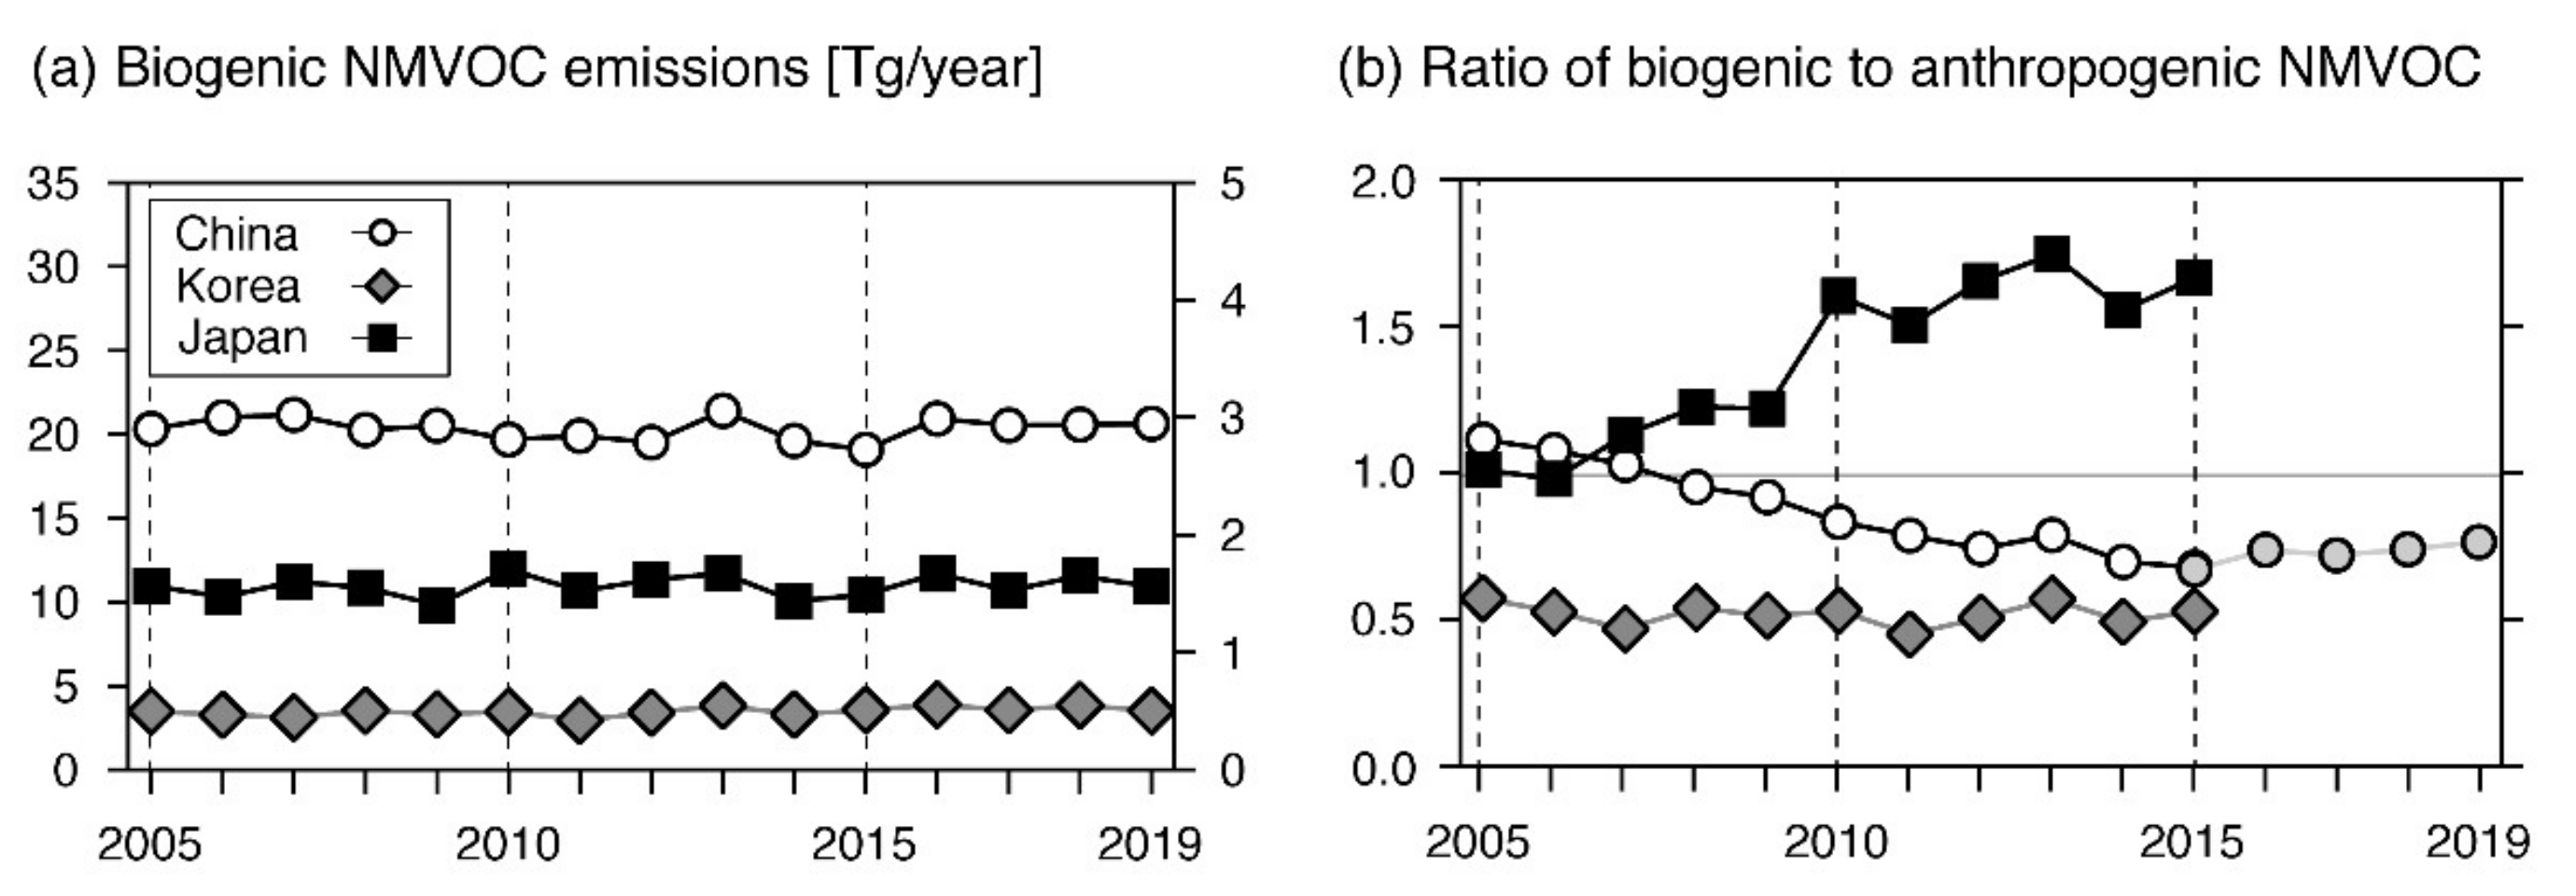
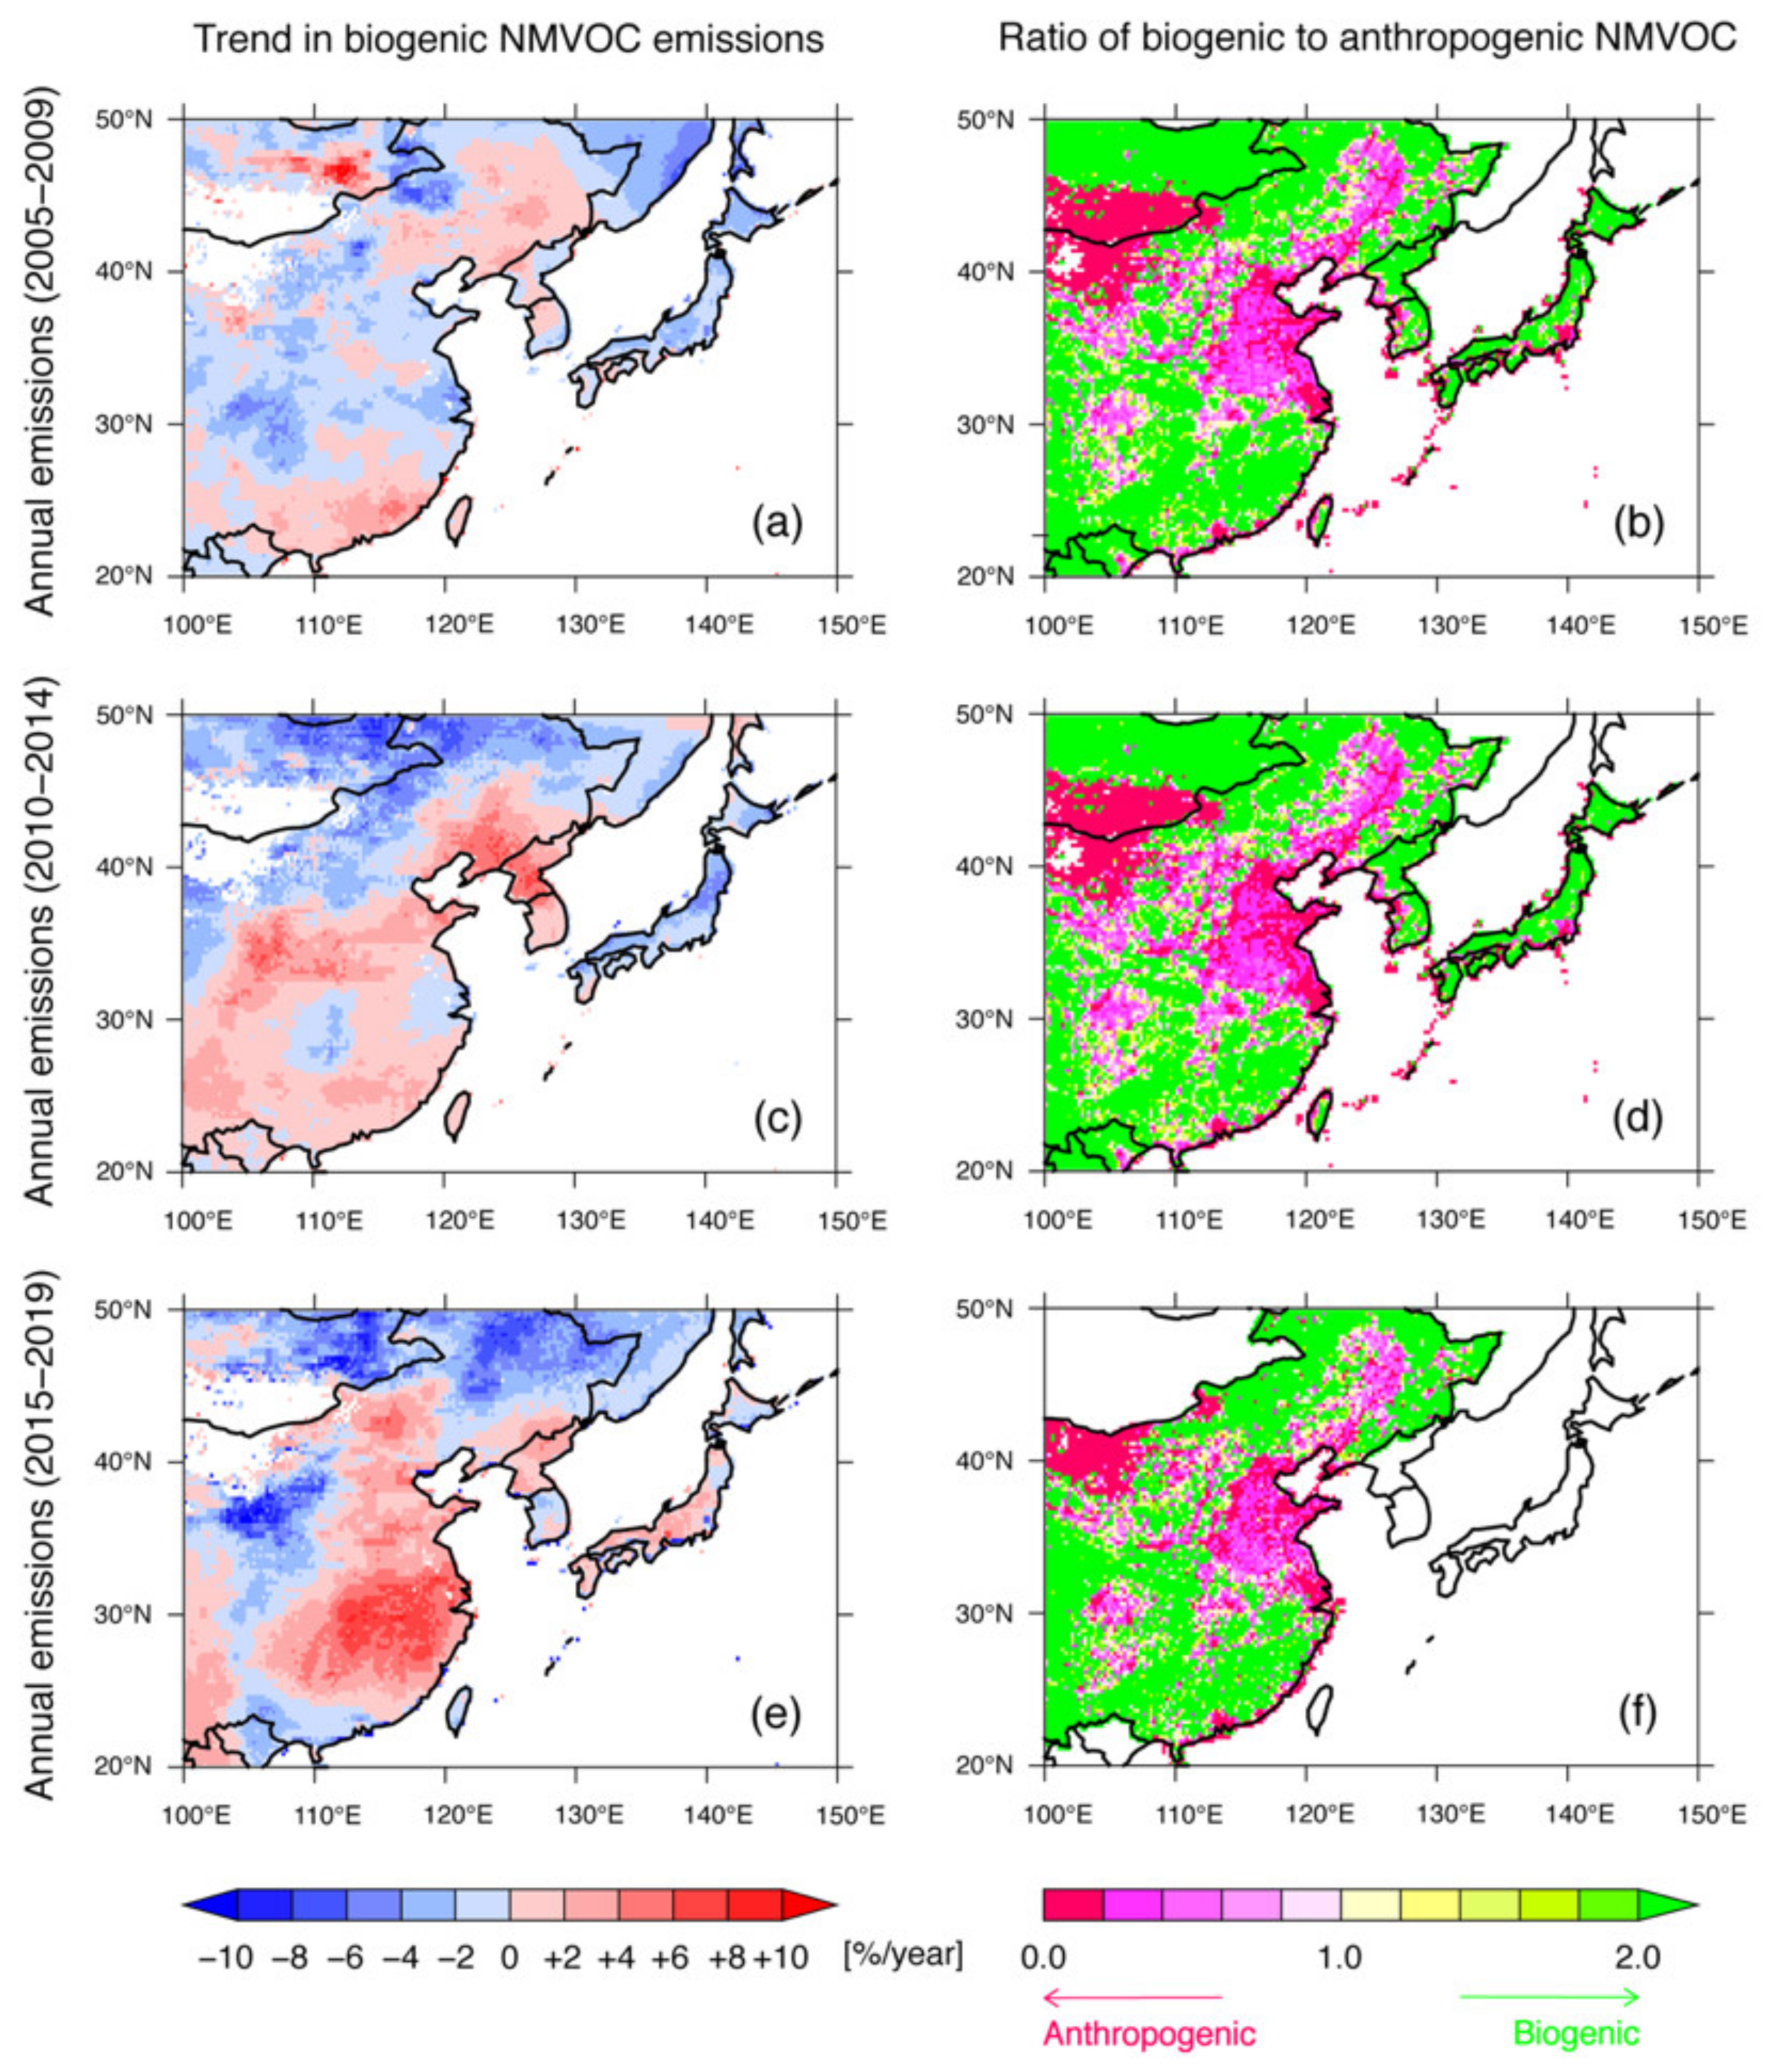
4.2. Trends of Biogenic Emissions over East Asia

The total amounts of biogenic emissions on the whole-country scale were analyzed based on the CAMS-GLOB-BIO dataset (Figure 8a). The spatial distribution of annual averaged biogenic NMVOC emission amounts during 2005–2014 is presented in Figure A3 in Appendix A. Generally, biogenic NMVOC emission showed nearly flat trends during the 15-year period over China, the Republic of Korea, and Japan. However, because of the variation of anthropogenic NMVOC emissions, the relative importance of biogenic emissions showed a major change during the 15-year period analyzed here. This change was observed in the analysis of the ratio of biogenic to anthropogenic NMVOC emissions (Figure 8b). In China, anthropogenic NMVOC emissions showed increasing trends up to 2015, and then leveled off; hence, the ratio of biogenic to anthropogenic NMVOC emissions was greater than 1.0 in 2005–2007 and around 0.7 during 2010–2019. Over the Republic of Korea, because the trend in anthropogenic NMVOC emissions was flat, the ratio remained around 0.5, indicating the dominance of anthropogenic NMVOC emissions. In Japan, anthropogenic NMVOC emissions showed gradual decreasing trends, and thus the relative importance of biogenic NMVOC emissions has been gradually increasing. In addition to the relative importance of biogenic emissions sources, the geographical patterns of biogenic emissions trends were also analyzed. Linear regression analyses performed using the same method as in Figure 3 and Figure 7 were conducted for biogenic NMVOC emissions during the three 5-year periods of 2005–2009, 2010–2014, and 2015–2019 (Figure 9). In addition, the spatial distribution of the ratio of biogenic to anthropogenic NMVOC emissions was analyzed.
The total amount of biogenic NMVOC emissions generally remained flat during the 15-year period over all three countries; however, their geographical trends showed regional characteristics. The regional differences were small during the first 5-year period of 2005–2010, whereas there were increases over eastern and southern China and decreases over northern China during the second and third periods during 2010–2019. Based on the comparison of anthropogenic NMVOC emissions and HCHO column density, we concluded that the decrease in anthropogenic NMVOC emissions over eastern China (Figure 7e) did not indicate an increase in HCHO column density (Figure 3g). The additional analysis of biogenic NMVOC emissions suggested that the increases in HCHO column density could be affected by increases in biogenic NMVOC emissions over eastern China (Figure 9e). Recent studies in China have also highlighted the effects of biogenic emissions [54,55,56]. Biogenic emissions due to variable vegetation biomass were estimated to increase summertime O3 and secondary organic aerosol over the Chengdu-Chongqing region in 2018 [54]. A modeling study of the North China Plain during 2014–2019 investigated severe O3 air pollution exacerbated by high temperatures, which are favorable conditions for O3 formation and are also related to increases in biogenic emissions [55]. In particular, the increased O3 concentration with biogenic emission sources driven by heat waves in June 2017 was reported as a concerning issue [56]. During the third 5-year period of 2015–2019, HCHO column density increased over the entirety of East Asia, except for small areas over northeastern China (Figure 3g). Considering the biogenic NMVOC emission variation, the growing relative importance of biogenic emissions over Japan (Figure 9e) could also explain the increasing HCHO column density. Because of the decline of anthropogenic NMVOC sources, the role of biogenic emissions could be problematic, and this has already been observed in the U.S. [41]. The analysis here suggests that biogenic emissions over East Asia may be similarly important in the future in light of projected reductions in NMVOC due to regulations [57,58].

4.3. Implications for Future Studies Using the Satellite-Derived O3-Sensitive Regime

In this study, we conducted a long-term analysis of satellite-derived HCHO and NO2 column densities and the FNR values during 2005–2019. In future studies, the following points should be considered. Studies using satellite observations are usually based on the column density integrated over the troposphere. Therefore, the quality of satellite measurement datasets themselves should be quantified [59,60,61], and the relationship between the surface and column density behavior should be clarified further. For example, in Tokyo, the O3-sensitive regime in the summer during 2005–2008 over the whole of Tokyo was estimated to be in the transitional regime between the VOC- and NOx-sensitive regimes [62]. Over Chiba, which is east of Tokyo, the FNR averaged over 0–1 km was almost constant during 2013–2019, as retrieved by the multi-axis differential optical absorption spectroscopy (MAX-DOAS) [63]. Our study showed a dominant VOC-sensitive regime during the first part of the 15-year period and increases in the FNR value, especially during the latter part of the 15-year period in Tokyo (Figure 4 and Figure 5). The characteristics of the near-surface and entire troposphere measurements could cause this difference. To investigate this relationship, numerical modeling covering any kind of targeted vertical direction can be a useful approach [64]. Numerical modeling can also help to refine the criteria for detecting the O3-sensitive regime. In this study, the O3-sensitive regime was identified based on the conventional threshold value; however, previous studies have proposed different threshold values [28,65,66]. Sensitivity analyses in which NOx and NMVOC emissions varied in the numerical modeling system are also an essential approach to accurate identification of the O3-sensitive regime and hence to appropriate emission regulation pathways.
In this study, steadily declining trends in anthropogenic NOx emissions, and thus in NO2 column density, were revealed as a cause of the increasing trend in FNR, which suggested a gradual shift to the NOx-sensitive regime in East Asia. However, the VOC-sensitive regime was still found over megacities in East Asia, and hence the decrease in NOx emissions may cause an increase in O3 through the weakening of the NOx titration effect. Recently, the aggravating effect of NOx emission control has been reported in China [67,68,69]. It is proposed that NOx control should be recommended only when the NMVOC/NOx ratio is higher and then this control can be applied to realize a denitrified society [70]. Moreover, the period of the COVID-19 pandemic, which unexpectedly caused a substantial change in human activity, has highlighted the need for anthropogenic emissions to be fully understood to construct realistic emission regulation pathways for mitigating O3 pollution.

5. Conclusions

We analyzed long-term trends in satellite-derived HCHO and NO2 column densities and calculated the FNR to investigate the O3-sensitive regime over East Asia over 15 years (2005–2019). The HCHO column density showed slightly increasing trends with a notable increase during 2015–2019 over East Asia, and the NO2 column density showed an increase and subsequent decrease from 2010 over China and a continuous decrease over the Republic of Korea and Japan. Thus, the results indicated a gradual shift from the VOC-sensitive to NOx-sensitive regimes over most regions of East Asia, especially during 2015–2019. The relationships between satellite-measured column densities and the available emission dataset during this period were investigated. The anthropogenic NMVOC and NOx emissions sources corresponded overall to the trends in the satellite-measured column densities. However, there was a discrepancy in the relationship between HCHO column density, which increased, and anthropogenic NMVOC emissions, which showed a general decrease, during 2015–2019. Thus, biogenic NMVOC emissions, which showed generally increasing trends, were considered a factor in the increasing trends in HCHO column density. Because of the decrease in anthropogenic emissions over East Asia, the relative importance of biogenic NMVOC emissions will increase in the future and play a key role in O3 pollution. These features obtained through satellite data analyses are needed to relate the near-surface information for mitigating O3 pollution over East Asia to numerical modeling.

Author Contributions

Conceptualization, S.I. and S.C.; methodology, S.I.; validation, S.I., H.I. and H.S.; formal analysis, S.I.; investigation, S.I., H.I. and H.S.; resources, S.I.; data curation, S.I. and S.C.; writing—original draft preparation, S.I.; writing—review and editing, S.I., H.I., H.S. and S.C.; visualization, S.I.; supervision, S.C.; project administration, S.C.; funding acquisition, S.C. All authors have read and agreed to the published version of the manuscript.

Funding

This research was performed by the Environment Research and Technology Development Fund (JPMEERF20192001 and JPMEERF20215005) of the Environmental Restoration and Conservation Agency provided by the Ministry of Environment of Japan. This research was also supported by the JSPS KAKENHI (Grant Numbers JP20H04320, JP21K12227, JP22H03727, and JP22H05004), the JAXA 3rd research announcement on the Earth Observations, and the Virtual Laboratory (VL) project by the Ministry of Education, Culture, Sports, Science and Technology (MEXT), Japan.

Data Availability Statement

Publicly available datasets were analyzed in this study. This data can be found here: https://disc.gsfc.nasa.gov/datasets/OMNO2d_003/summary for NO2 satellite data (accessed on 1 July 2022), https://disc.gsfc.nasa.gov/datasets/OMHCHOd_003/summary for HCHO satellite data (accessed on 1 July 2022), https://www.nies.go.jp/REAS/ for REAS emission data (accessed on 1 July 2022), http://meicmodel.org for MEIC emission data (accessed on 1 July 2022), https://eccad.aeris-data.fr for CAMS-GLOB-BIO emission data (accessed on 1 July 2022). Please also see Section 2 and relevant references. Please contact S.I. (isyuichi@criepi.denke.or.jp) for further information.

Acknowledgments

The authors acknowledge NASA for the availability of OMI satellite data for NO2 and HCHO. The authors are grateful for the availability of the REAS anthropogenic emission inventory and thank the MEIC emission developer team. The authors also thank ECCAD for the archiving and distribution of the biogenic emission inventory dataset of CAMS-GLOB-BIO.

Conflicts of Interest

The authors declare no conflict of interest.

Appendix A

Figure A1. Linear regression analyses for (a,d,g) HCHO column density, (b,e,h) NO2 column density, and (c,f,i) FNR over East Asia during the 5-year periods of (ac) 2005–2009, (df) 2010–2014, and (gi) 2015–2019 averaged over the cold seasons. HCHO column density and FNR are analyzed at grid points where NO2 column density is greater than 1.0 × 10¹⁵ molecules cm−2.
Remotesensing 14 04512 g0a1
Figure A2. Linear regression analyses for (a,d,g) HCHO column density, (b,e,h) NO2 column density, and (c,f,i) FNR over East Asia during the 5-year periods of (ac) 2005–2009, (df) 2010–2014, and (gi) 2015–2019 averaged over the warm seasons. HCHO column density and FNR are analyzed at grid points where NO2 column density is greater than 1.0 × 10¹⁵ molecules cm−2.
Remotesensing 14 04512 g0a2
Figure A3. Anthropogenic (a) NOx and (b) NMVOC emissions and (c) biogenic NMVOC emissions over East Asia as averaged during 2005–2014.
Remotesensing 14 04512 g0a3

References

  1. Jacobson, M.Z. Air Pollution and Global Warming, 2nd ed.; Cambridge University Press: Cambridge, UK, 2012. [Google Scholar]
  2. Seinfeld, J.H.; Pandis, S.N. Atmospheric Chemistry and Physics—From Air Pollution to Climate Change, 2nd ed.; John Wiley & Sons: New York, NY, USA, 2006. [Google Scholar]
  3. Lelieveld, J.; Dentener, F.J. What controls tropospheric ozone? J. Geophys. Res. 2000, 105, 3531–3551. [Google Scholar] [CrossRef]
  4. Akimoto, H. Global air quality and pollution. Science 2003, 302, 1716–1718. [Google Scholar] [CrossRef] [PubMed]
  5. Kurokawa, J.; Ohara, T. Long-term historical trends in air pollutant emissions in Asia: Regional Emission inventory in ASia (REAS) version 3. Atmos. Chem. Phys. 2020, 20, 12761–12793. [Google Scholar] [CrossRef]
  6. Zheng, B.; Tong, D.; Li, M.; Liu, F.; Hong, C.; Geng, G.; Li, H.; Li, X.; Peng, L.; Qi, J.; et al. Trends in China’s anthropogenic emissions since 2010 as the consequence of clean air actions. Atmos. Chem. Phys. 2018, 18, 14095–14111. [Google Scholar] [CrossRef]
  7. Zheng, B.; Zhang, Q.; Geng, G.; Chen, C.; Shi, Q.; Cui, M.; Lei, Y.; He, K. Changes in China’s anthropogenic emissions and air quality during the COVID-19 pandemic in 2020. Earth Syst. Sci. Data 2021, 13, 2895–2907. [Google Scholar] [CrossRef]
  8. Oh, I.-B.; Kim, Y.-K.; Hwang, M.-K.; Kim, C.-H.; Kim, S.-T.; Song, S.-K. Elevated ozone layers over the Seoul Metropolitan Region in Korea: Evidence for long-range ozone transport from eastern China and its contribution to surface concentration. J. Appl. Meteorol. Climatol. 2010, 49, 203–220. [Google Scholar] [CrossRef]
  9. Yamaji, K.; Ohara, T.; Uno, I.; Tanimoto, H.; Kurokawa, J.; Akimoto, H. Analysis of the seasonal variation of ozone in the boundary layer in East Asia using the Community Multi-scale Air Quality model: What controls surface ozone levels over Japan? Atmos. Environ. 2006, 40, 1856–1868. [Google Scholar] [CrossRef]
  10. Tanimoto, H.; Ohara, T.; Uno, I. Asian anthropogenic emissions and decadal trends in springtime tropospheric ozone over Japan: 1998–2007. Geophys. Res. Let. 2009, 36, L23802. [Google Scholar] [CrossRef]
  11. Nagashima, T.; Ohara, T.; Sudo, K.; Akimoto, H. The relative importance of various source regions on East Asian surface ozone. Atmos. Chem. Phys. 2010, 10, 11305–11322. [Google Scholar] [CrossRef]
  12. Chatani, S.; Yamaji, K.; Itahashi, S.; Saito, M.; Takigawa, M.; Morikawa, T.; Kanda, I.; Miya, Y.; Komatsu, H.; Sakurai, T.; et al. Identifying key factors influencing model performance on ground-level ozone over urban areas in Japan through model inter-comparisons. Atmos. Environ. 2020, 223, 117255. [Google Scholar] [CrossRef]
  13. Chatani, S.; Shimadera, H.; Itahashi, S.; Yamaji, K. Comprehensive analyses of source sensitivities and apportionments of PM2.5 and ozone over Japan via multiple numerical techniques. Atmos. Chem. Phys. 2020, 20, 10311–10329. [Google Scholar] [CrossRef]
  14. Wakamatsu, S.; Morikawa, T.; Ito, A. Air pollution trends in Japan between 1970 and 2012 and impact of urban air pollution countermeasures. Asian J. Atmos. Environ. 2013, 7–4, 177–190. [Google Scholar] [CrossRef]
  15. Milford, J.; Gao, D.; Sillman, S.; Blossey, P.; Russell, A.G. Total reactive nitrogen (NOy) as an indicator for the sensitivity of ozone to NOx and hydrocarbons. J. Geohys. Res. 1994, 99, 3533–3542. [Google Scholar] [CrossRef]
  16. Sillman, S. The use of NOy, H2O2, and HNO3 as indicators for ozone-NOx-hydrocarbon sensitivity in urban locations. J. Geophys. Res. 1994, 99, 3533–3542. [Google Scholar]
  17. Hakami, A.; Odman, M.T.; Russell, A.G. High-order, direct sensitivity analysis of multidimensional air quality models. Environ. Sci. Tech. 2003, 37, 2442–2452. [Google Scholar] [CrossRef]
  18. Cohan, D.S.; Hakami, A.; Hu, Y.; Russell, A.G. Nonlinear response of ozone to emissions: Source apportionment and sensitivity analysis. Environ. Sci. Tech. 2005, 39, 6739–6748. [Google Scholar] [CrossRef]
  19. Wang, X.; Zhang, Y.; Hu, Y.; Zhou, W.; Zeng, L.; Hu, M.; Cohan, D.S.; Russell, A.G. Decoupled direct sensitivity analysis of regional ozone pollution over the Pearl River Delta during the PRIDE-PRD2004 campaign. Atmos. Environ. 2011, 45, 4941–4949. [Google Scholar] [CrossRef]
  20. Itahashi, S.; Uno, I.; Kim, S.-T. Seasonal source contributions of tropospheric ozone over East Asia based on CMAQ-HDDM. Atmos. Environ. 2013, 70, 204–217. [Google Scholar] [CrossRef]
  21. Itahashi, S.; Hayami, H.; Uno, I. Comprehensive study of emission source contributions for tropospheric ozone formation over East Asia. J. Geophys. Res. Atmos. 2015, 120, 331–358. [Google Scholar] [CrossRef]
  22. Itahashi, S.; Mathur, R.; Hogrefe, C.; Napelenock, S.; Zhang, Y. Modeling stratospheric intrusion and trans-Pacific transport on tropospheric ozone using hemispheric CMAQ during April 2010—Part 2: Examination of emission impacts based on the higher-order decoupled direct method. Atmos. Chem. Phys. 2021, 20, 3397–3413. [Google Scholar] [CrossRef]
  23. Martin, R.V.; Fiore, A.M.; Donkelaar, A.V. Space-based diagnosis of surface ozone sensitivity to anthropogenic emissions. Geophys. Res. Lett. 2004, 31, L06120. [Google Scholar] [CrossRef] [Green Version]
  24. Duncan, B.N.; Yoshida, Y.; Olson, J.R.; Sillman, S.; Martin, R.V.; Lamsal, L.; Hu, Y.; Pickering, K.E.; Retcher, C.; Allen, D.J.; et al. Application of OMI observations to a space-based indicator of NOx and VOC controls on surface ozone formation. Atmos. Environ. 2010, 44, 2213–2223. [Google Scholar] [CrossRef]
  25. Souri, A.H.; Choi, Y.; Jeon, W.; Woo, J.-H.; Zhang, Q.; Kurokawa, J. Remote sensing evidence of decadal changes in major tropospheric ozone precursors over East Asia. J. Geohys. Res. 2017, 122, 2474–2492. [Google Scholar] [CrossRef]
  26. Jin, X.; Holloway, T. Spatial and temporal variability of ozone sensitivity over China observed from the Ozone Monitoring Instrument. J. Geophys. Res. 2015, 120, 7229–7246. [Google Scholar] [CrossRef]
  27. Jin, X.; Fiore, A.M.; Murray, L.T.; Valin, L.C.; Lamsal, L.K.; Duncan, B.; Boersma, K.F.; Smedt, I.D.; Gonzáles Abad, G.; Change, K.; et al. Evaluating a space-based indicator of surface ozone-NOx-VOC sensitivity over Midlatitude source regions and application to decadal trends. J. Geophys. Res. 2017, 122, 10439–10461. [Google Scholar] [CrossRef] [PubMed]
  28. Wang, W.; van der, A.R.; Ding, J.; van Weele, M.; Cheng, T. Spatial and temporal changes of the ozone sensitivity in China based on satellite and ground-based observations. Atmos. Chem. Phys. 2021, 21, 7253–7269. [Google Scholar] [CrossRef]
  29. Lee, H.-J.; Chang, L.-S.; Jaffe, D.A.; Bak, J.; Liu, X.; Gonzáles Abad, G.; Jo, H.-Y.; Jo, Y.-J.; Lee, J.-B.; Kim, C.-H. Ozone continues to increase in East Asia despite decreasing NO2: Causes and abatements. Remote Sens. 2021, 13, 2177. [Google Scholar] [CrossRef]
  30. Inoue, K.; Tonokura, K.; Yamada, H. Modeling study on the spatial variation of the sensitivity of photochemical ozone concentrations and population exposure to VOC emission reduction in Japan. Air Qual. Atmos. Health 2019, 12, 1035–1047. [Google Scholar] [CrossRef]
  31. Wang, Z.; Uno, I.; Yumimoto, K.; Itahashi, S.; Chen, X.; Yang, W.; Wang, Z. Impacts of COVID-19 lockdown, Spring Festival, and meteorology on the NO2 variations in early 20020 over China based on in-situ observations, satellite retrievals and model simulations. Atmos. Environ. 2021, 244, 117972. [Google Scholar] [CrossRef]
  32. Liu, F.; Page, A.; Strode, S.A.; Yoshida, Y.; Choi, S.; Zheng, B.; Lamsal, L.N.; Li, C.; Krotkov, N.A.; Eskes, H.; et al. Abrupt decline in tropospheric nitrogen dioxide over China after the outbreak of COVID-19. Sci. Adv. 2020, 6, eabc2992. [Google Scholar] [CrossRef]
  33. Forster, P.M.; Forster, H.I.; Evans, M.J.; Gidden, M.; Jones, C.D.; Keller, C.A.; Lamboll, R.D.; Quéré, C.L.; Rogelj, J.; Rosen, D.; et al. Current and future global climate impacts resulting from COVID-19. Nat. Clim. Chang. 2020, 10, 913–919. [Google Scholar] [CrossRef]
  34. Miyazaki, K.; Bowman, K.; Sekiya, T.; Takigawa, M.; Neu, J.L.; Sudo, K.; Osterman, G.; Eskes, H. Global tropospheric ozone responses to reduced NOx emissions linked to the COVID-19 worldwide lockdowns. Sci. Adv. 2021, 7, eabf7460. [Google Scholar] [CrossRef]
  35. Itahashi, S.; Yamamura, Y.; Wang, Z.; Uno, I. Returning long-range PM2.5 transport into the leeward of East Asia in 2021 after Chinese economic recovery from the COVID-19 pandemic. Sci. Rep. 2021, 12, 5539. [Google Scholar] [CrossRef]
  36. Irie, H.; Muto, T.; Itahashi, S.; Kurokawa, J.; Uno, I. Turnaround of tropospheric nitrogen dioxide pollution trends in China, Japan, and South Korea. SOLA 2016, 12, 170–174. [Google Scholar] [CrossRef]
  37. Itahashi, S.; Yumimoto, K.; Kurokawa, J.; Morino, Y.; Nagashima, T.; Miyazaki, K.; Maki, T.; Ohara, T. Inverse estimation of NOx emissions over China and India 2005–2016: Contrasting recent trends and future perspectives. Environ. Res. Lett. 2019, 14, 124020. [Google Scholar] [CrossRef]
  38. Goldberg, D.L.; Anenberg, S.C.; Lu, Z.; Streets, D.G.; Lamsal, L.N.; McDuffie, E.E.; Smitth, S.J. Urban NOx emissions around the world declined faster than anticipated between 2005 and 2019. Environ. Res. Lett. 2021, 16, 115004. [Google Scholar] [CrossRef]
  39. Krotkov, N.A.; Lamsal, L.N.; Marchenko, S.V.; Celarier, E.A.; Bucsela, E.J.; Swartz, W.H.; Joiner, J.; OMI Core Team. OMI/Aura NO2 Cloud-Screened Total and Tropospheric Column L3 Global Gridded 0.25 degree x 0.25 degree V3, NASA Goddard Space Flight Center, Goddard Earth Sciences Data and Information Services Center (GES DISC). Available online: https://disc.gsfc.nasa.gov/datasets/OMNO2d_003/summary (accessed on 28 February 2022).
  40. Gonzáles Abad, G.; Liu, X.; Chance, K.; Wang, H.; Kurosu, T.P.; Suleiman, R. Updated Smithsonian Astrophysical Observatory Ozone Monitoring Instrument (SAO OMI) formaldehyde retrieval. Atmos. Meas. Tech. 2015, 8, 19–32. [Google Scholar] [CrossRef]
  41. Zhu, L.; Mickley, L.J.; Jacob, D.J.; Marais, E.A.; Sheng, J.; Hu, L.; Gonzáles Abad, G.; Chance, K. Long-term (2005–2014) trends in formaldehyde (HCHO) columns across North America as seen by the OMI satellite instrument: Evidence of changing emissions of volatile organic compounds. Geophys. Res. Lett. 2017, 44, 7079–7086. [Google Scholar] [CrossRef]
  42. Liao, J.; Hanisco, T.F.; Wolfe, G.M.; St Clair, J.; Jimenez, J.L.; Campuzano-Jost, P.; Nault, B.A.; Fried, A.; Marais, E.A.; González Abad, G.; et al. Towards a satellite formaldehyde—In situ hybrid estimate for organic aerosol abundance. Atmos. Chem. Phys. 2019, 19, 2765–2785. [Google Scholar] [CrossRef]
  43. Chance, K. OMI/Aura Formaldehyde (HCHO) Total Column Daily L3 Weighted Mean Global 0.1deg Lat/Lon Grid V003, Greenbelt, MD, USA, Goddard Earth Sciences Data and Information Services Center (GES DISC). Available online: https://disc.gsfc.nasa.gov/datasets/OMHCHOd_003/summary (accessed on 28 February 2022).
  44. Koukouli, M.E.; Balis, D.S.; van der, A.R.J.; Theys, N.; Hedelt, P.; Richter, A.; Krotkov, N.; Li, C.; Taylor, M. Anthropogenic sulphur dioxide load over China as observed from different satellite sensors. Atmos. Environ. 2016, 145, 45–59. [Google Scholar] [CrossRef]
  45. Itahashi, S.; Yumimoto, K.; Uno, I.; Hayami, H.; Fujita, S.; Pan, Y.; Wang, Y. A 15-year record (2001–2015) of the ratio of nitrate to non-seasalt sulfate in precipitation over East Asia. Atmos. Chem. Phys. 2018, 18, 2835–2852. [Google Scholar] [CrossRef] [Green Version]
  46. Sindelarova, K.; Markova, J.; Simpson, D.; Huszar, P.; Karlicky, J.; Darras, S.; Granier, C. High-resolution biogenic global emission inventory for the time period 2000–2019 for air quality modeling. Earth Syst. Sci. Data 2022, 14, 251–270. [Google Scholar] [CrossRef]
  47. Guenther, A.B.; Jiang, X.; Heald, C.L.; Sakulyanontvittaya, T.; Duhl, T.; Emmons, L.K.; Wang, X. The Model of Emissions of Gases and Aerosols from Nature version 2.1 (MEGAN2.1): An extended and updated framework for modeling biogenic emissions. Geosci. Model Dev. 2012, 5, 1471–1492. [Google Scholar] [CrossRef]
  48. De Smedt, I.; Stavrakou, T.; Müller, J.-F.; van der, A.R.J.; Van Roozendael, M. Trend detection in satellite observations of formaldehyde tropospheric column. Geophys. Res. Lett. 2010, 37, L18808. [Google Scholar] [CrossRef]
  49. Hilboll, A.; Richter, A.; Burrows, J.P. Long-term changes of tropospheric NO2 over megacities derived from multiple satellite instruments. Atmos. Chem. Phys. 2013, 13, 4145–4169. [Google Scholar] [CrossRef]
  50. Itahashi, S.; Uno, I.; Irie, H.; Kurokawa, J.; Ohara, T. Regional modeling of tropospheric NO2 vertical column density over East Asia during the period 2000–2010: Comparison with multisatellite observation. Atmos. Chem. Phys. 2014, 14, 3623–3635. [Google Scholar] [CrossRef]
  51. Van der, A.R.J.; Mijling, B.; Ding, J.; Koukouli, M.E.; Liu, F.; Li, Q.; Mao, H.; Theys, N. Cleaning up the air: Effectiveness of air quality policy for SO2 and NOx emissions in China. Atmos. Chem. Phys. 2017, 17, 1775–1789. [Google Scholar] [CrossRef]
  52. Cui, Y.; Lin, J.; Song, C.; Liu, M.; Yan, Y.; Xu, Y.; Huang, B. Rapid growth in nitrogen dioxide pollution over Western China, 2005–2013. Atmos. Chem. Phys. 2016, 16, 6207–6221. [Google Scholar] [CrossRef]
  53. Shen, L.; Jacob, D.J.; Zhu, L.; Zhang, Q.; Zheng, B.; Sulprizio, M.P.; Li, K.; De Smedt, I.; Gonzáles Abad, G.; Cao, H.; et al. The 2005–2016 trends of formaldehyde columns over China observed by satellites: Increasing anthropogenic emissions of volatile organic compounds and decreasing agricultural fire emissions. Geophys. Res. Lett. 2019, 46, 4468–4475. [Google Scholar] [CrossRef]
  54. Cao, J.; Situ, S.; Hao, Y.; Xie, S.; Li, L. Enhanced summertime ozone and SOA from biogenic volatile organinc compound (BVOC) emissions due to vegetation biomass variablity during 1981–2018 in China. Atmos. Chem. Phys. 2022, 22, 2351–2364. [Google Scholar] [CrossRef]
  55. Wang, P.; Yang, Y.; Li, H.; Chen, L.; Dang, R.; Xue, D.; Li, B.; Tang, J.; Leung, L.R.; Liao, H. North China Plain as a hot spot of ozone pollution exacerbated by extreme high temperatures. Atmos. Chem. Phys. 2022, 22, 4705–4719. [Google Scholar] [CrossRef]
  56. Ma, M.; Gao, Y.; Wang, Y.; Zhang, S.; Leung, L.R.; Liu, C.; Wang, S.; Zhao, B.; Chang, X.; Su, H.; et al. Substantial ozone enhancement over the North China Plain from increased biogenic emissions due to heat waves and land cover in summer 2017. Atmos. Chem. Phys. 2019, 19, 12195–12207. [Google Scholar] [CrossRef]
  57. Tong, D.; Cheng, J.; Liu, Y.; Yu, S.; Yan, L.; Hong, C.; Qin, Y.; Zhao, H.; Zheng, Y.; Geng, G.; et al. Dynamic projection of anthropogenic emissions in China: Methodology and 2015–2050 emission pathways under a range of socio-economic, climate policy, and pollution control strategy. Atmos. Chem. Phys. 2020, 20, 5729–5757. [Google Scholar] [CrossRef]
  58. Gao, Y.; Yan, F.; Ma, M.; Ding, A.; Liao, H.; Wang, S.; Wang, X.; Zhao, B.; Cai, W.; Su, H.; et al. Unveiling the dipole synergic effect of biogenic and anthropogenic emissions on ozone concentrations. Sci. Total Environ. 2022, 818, 151722. [Google Scholar] [CrossRef]
  59. Pinardi, G.; Van Roozendael, M.; Hendrick, F.; Theys, N.; Abuhassan, N.; Bais, A.; Boersma, F.; Cede, A.; Chong, J.; Donner, S.; et al. Validation of tropospheric NO2 column measurements of GOME-2A and OMI using MAX-DOAS and direct sun network observations. Atmos. Meas. Tech. 2020, 13, 6141–6174. [Google Scholar] [CrossRef]
  60. Wang, Y.; Wang, Z.; Yu, C.; Zhu, S.; Cheng, L.; Zhang, Y.; Chen, L. Validation of OMI HCHO products using MAX-DOAS observations from 2010 to 2016 in Xianghe, Beijing: Investigation of the effects of aerosols on satellite products. Remote Sens. 2019, 11, 203. [Google Scholar] [CrossRef]
  61. De Smedt, I.; Pinardi, G.; Vigouroux, C.; Compernolle, S.; Bais, A.; Benavent, N.; Boersma, F.; Chan, K.-L.; Donner, S.; Eichmann, K.-U.; et al. Comparative assessment of TROPOMI and OMI formaldehyde observations and validation against MAX-DOAS network column measurements. Atmos. Chem. Phys. 2021, 21, 12561–12593. [Google Scholar] [CrossRef]
  62. Sadanaga, Y.; Sengen, M.; Takenaka, N.; Bandow, H. Analyses of the ozone weekend effect in Tokyo, Japan: Regime of oxidant (O3 + NO2) Production. Aerosol Air Qual. Res. 2012, 12, 161–168. [Google Scholar] [CrossRef]
  63. Irie, H.; Yonekawa, D.; Damiani, A.; Hoque, H.M.S.; Sudo, K.; Itahashi, S. Continuous multi-component MAX-DOAS observations for the planetary boundary layer ozone variation analysis at Chiba and Tsukuba, Japan, from 2013 to 2019. Prog. Earth Planet. Sci. 2021, 8, 31. [Google Scholar] [CrossRef]
  64. Itahashi, S.; Irie, H. Surface and aloft NO2 pollution over the greater Tokyo area observed by ground-based and MAX-DOAS measurements bridged by kilometer-scale regional air quality modeling. Prog. Earth Planet. Sci. 2022, 9, 15. [Google Scholar] [CrossRef]
  65. Souri, A.H.; Nowlan, C.R.; Wolfe, G.M.; Lamsal, L.N.; Miller, C.E.C.; Gonzáles Abad, G.; Janz, S.J.; Fried, A.; Blake, D.R.; Weinheimer, A.J.; et al. Revisiting the effectiveness of HCHO/NO2 ratios for inferring ozone sensitivity to its precursors using high resolution airborne remote sensing observations in a high ozone episode during the KORUS-AQ campaign. Atmos. Environ. 2020, 224, 117341. [Google Scholar] [CrossRef]
  66. Schroeder, J.R.; Crawford, J.H.; Fried, A.; Walega, J.; Weinheimer, A.; Wishthaler, A.; Müller, M.; Mikoviny, T.; Chen, G.; Shook, M.; et al. New insights into the column CH2O/NO2 ratio as an indicator of near-surface ozone sensitivity. J. Geophys. Res. 2017, 122, 8885–8907. [Google Scholar] [CrossRef]
  67. Wang, N.; Lyu, X.; Deng, X.; Huang, X.; Jiang, F.; Ding, A. Aggravating O3 pollution due to NOx emission control in eastern China. Sci. Total Environ. 2019, 677, 732–744. [Google Scholar] [CrossRef]
  68. Lee, H.-J.; Chang, L.-S.; Jaffe, D.A.; Bak, J.; Liu, X.; Gonzáles Abad, G.; Jo, H.-Y.; Jo, Y.-J.; Lee, J.-B.; Yang, G.-H.; et al. Satellite-based diagnosis and numerical verification of ozone formation regimes over nine megacities in East Asia. Remote Sens. 2022, 14, 1285. [Google Scholar] [CrossRef]
  69. Chen, X.; Jiang, Z.; Shen, Y.; Li, R.; Fu, Y.; Liu, J.; Han, H.; Liao, H.; Cheng, X.; Jones, D.B.A.; et al. Chinese regulations are working—Why is surface ozone over industrialized areas still high? Applying lessons from northeast US air quality evolution. Geophys. Res. Lett. 2021, 48, e2021GL092816. [Google Scholar] [CrossRef]
  70. Akimoto, H.; Tanimoto, H. Rethinking of the adverse effects of NOx-control on the reduction of methane and tropospheric ozone—Challenges toward a denitrified society. Atmos. Environ. 2022, 277, 119033. [Google Scholar] [CrossRef]
Figure 1. Spatial distribution of (a,d,g) HCHO column density, (b,e,h) NO2 column density, and (c,f,i) FNR over East Asia averaged over 15 years (2005–2019) during (ac) all seasons, (df) cold seasons (October to March), and (gi) warm seasons (April to September). FNR is analyzed at grid points where NO2 column density is greater than 1.0 × 10¹⁵ molecules cm−2 (white in (b,e,h)).
Remotesensing 14 04512 g001
Figure 2. Spatial distribution of (a,d,g,j) HCHO column density, (b,e,h,k) NO2 column density, and (c,f,i,l) FNR over East Asia averaged over all seasons for the year (ac) 2005, (df) 2010, (gi) 2015, and (jl) 2019. FNR is analyzed at grid points where NO2 column density is greater than 1.0 × 10¹⁵ molecules cm−2 (white in (b,e,h,k)).
Remotesensing 14 04512 g002
Figure 3. Linear regression analyses for (a,d,g) HCHO column density, (b,e,h) NO2 column density, and (c,f,i) FNR over East Asia during the 5-year periods of (ac) 2005–2009, (df) 2010–2014, and (gi) 2015–2019 averaged over all seasons. HCHO column density and FNR are analyzed at grid points where NO2 column density is greater than 1.0 × 10¹⁵ molecules cm−2.
Remotesensing 14 04512 g003
Figure 4. Temporal variation of HCHO column density, NO2 column density, and FNR during 2005–2019 over Beijing and Shanghai in China, Seoul in the Republic of Korea, and Osaka, Nagoya, and Tokyo in Japan averaged over cold seasons (light blue symbols) and warm seasons (light red symbols) for each year. The green, white, and purple shading in the FNR panels indicates VOC-sensitive, transitional, and NOx-sensitive regimes, respectively.
Remotesensing 14 04512 g004
Figure 5. Frequency of occurrence of the O3-sensitive regime for the (green) VOC-sensitive regime, (white) transitional regime, and (purple) NOx-sensitive regime over Beijing and Shanghai in China, Seoul in the Republic of Korea, and Osaka, Nagoya, and Tokyo in Japan during (left) cold seasons and (right) warm seasons.
Remotesensing 14 04512 g005
Figure 6. Annual amounts of anthropogenic emissions of (a) NMVOC and (b) NOx, and (c) the NMVOC/NOx ratio over China (white circles, left axis), the Republic of Korea (gray diamonds, right axis), and Japan (black squares, right axis) during 2005–2015 calculated from REAS. The values over China during 2015–2019 calculated from MEIC are also shown (light-gray circles, left axis).
Remotesensing 14 04512 g006
Figure 7. Linear regression analyses for the annual amount of (a,c,e) anthropogenic NMVOC emissions and (b,d,f) anthropogenic NOx emissions over East Asia during the 5-year periods of (a,b) 2005–2009, (c,d) 2010–2014, and (e,f) 2015–2019. White areas indicate no available data.
Remotesensing 14 04512 g007
Figure 8. (a) Annual amounts of NMVOC biogenic emissions over China (white circles, left axis), the Republic of Korea (gray diamonds, right axis), and Japan (black squares, right axis) during 2005–2019. (b) The ratio of biogenic to anthropogenic NMVOC emissions over China (white circles), the Republic of Korea (gray diamonds), and Japan (black squares). The values are calculated based on REAS during 2005–2015, and the values over China during 2015–2019 are also calculated based on MEIC (light-gray circles; see also Figure 6).
Remotesensing 14 04512 g008
Figure 9. (a,c,e) Linear regression analyses for the annual amount of biogenic NMVOC emissions and (b,d,f) the ratio of biogenic to anthropogenic NMVOC emissions over East Asia during the 5-year periods of (a,b) 2005–2009, (c,d) 2010–2014, and (e,f) 2015–2019. White areas indicate no available data.
Remotesensing 14 04512 g009
Table 1. Summary of city-level grid point analyses of the mean and trend of FNR during the 5-year periods of 2005–2009, 2010–2014, and 2015–2019 averaged over cold and warm seasons.
CityPeriodFNR
Cold SeasonsWarm Seasons
Mean 1Trend 2Mean 1Trend 2
Beijing2005–20090.34+0.070.79+3.90
2010–20140.33+4.390.85+4.09
2015–20190.51+3.301.19+3.98
Shanghai2005–20090.24+1.080.77+0.05
2010–20140.24+10.600.91−1.00
2015–20190.29+7.311.04+3.78
Seoul2005–20090.32+14.220.80−5.77
2010–20140.32−1.900.88−0.35
2015–20190.36+2.801.05+4.78
Osaka2005–20090.43+1.251.07+4.38
2010–20140.48−10.301.19−0.04
2015–20190.60+8.971.38+8.49
Nagoya2005–20090.36+8.771.08+5.14
2010–20140.43+0.511.23+0.57
2015–20190.64+3.401.45+4.63
Tokyo2005–20090.28+8.150.73+3.18
2010–20140.30+6.460.98−3.28
2015–20190.45+11.591.17+10.87
1 Units for the mean of FNR is dimensionless. 2 Units for the trend are %/year.
Publisher’s Note: MDPI stays neutral with regard to jurisdictional claims in published maps and institutional affiliations.

