Technical Note

Characteristics of the Greenland Ice Sheet Mass Variations Revealed by GRACE/GRACE Follow-On Gravimetry

1
The MOE Key Laboratory of Fundamental Physical Quantities Measurement and Hubei Key Laboratory of Gravitation and Quantum Physics, PGMF and School of Physics, Huazhong University of Science and Technology, Wuhan 430074, China
2
Institute of Geophysics, Huazhong University of Science and Technology, Wuhan 430074, China
*
Author to whom correspondence should be addressed.
Remote Sens. 2022, 14(18), 4442; https://doi.org/10.3390/rs14184442
Submission received: 27 July 2022 / Revised: 1 September 2022 / Accepted: 2 September 2022 / Published: 6 September 2022
(This article belongs to the Special Issue Carbon, Water and Climate Monitoring Using Space Geodesy Observations)

Abstract

:
As a major contributor to global mean sea-level rise, the Greenland ice sheet (GrIS) and the patterns of its mass change have attracted wide attention. Based on Gravity Recovery and Climate Experiment (GRACE)/GRACE Follow-On (GRACE-FO) gravimetry data, we computed monthly non-cumulative mass change time series of the GrIS, which agree with those from the mass budget method confirming the reliability of GRACE-FO-derived mass change. Over the GrIS, mass was mainly gained in winter, followed by spring. It primarily lost mass in summer, with the percentage of summer mass loss versus the corresponding annual mass loss ranging from 61% to 96%. We report that spring mass loss has become more frequent since 2015, and autumn mass gain occurred more frequently after 2014. By separating mass gain from mass loss at the annual timescale, we find that both the mass gain and mass loss showed a slightly increasing trend during 2003–2020, which might be a response to the ongoing Arctic warming. Summer mass variations highly correlated with the summer North Atlantic Oscillation index are dominated by temperature-associated precipitation and meltwater runoff. This study suggests that long-term observations would be necessary to better understand patterns of the GrIS mass variations in future.

Graphical Abstract

1. Introduction

The Greenland ice sheet (GrIS) covers an area of up to 1.7 million square kilometers, with an average ice thickness of about 1700 m [1,2]. It has been losing mass over the past two decades, and it is virtually certain that the GrIS will experience continued ice loss over the 21st century [3]. As one of the dominant contributors to global mean sea level rise at present, the GrIS’s continued ice loss could pose a threat to human daily life and ecological environment security in certain coastal areas. Suffering from varying degrees of mass loss including sustained acceleration and abrupt deceleration, the GrIS and its mass change patterns cause widespread concern. Consequently, accurately monitoring the GrIS mass variations and fully investigating the potential characteristics of its mass change would be of great significance in the context of Arctic warming.
Since March 2002, the gravity recovery and climate experiment (GRACE) mission provided the first direct measurement of polar ice mass change [4]. Using GRACE data during different time spans, the signal of ice mass loss was clearly revealed over the GrIS in previous studies [5,6]. Most studies were mainly focused on the linear or long-term mass trend of the GrIS, with monthly cumulative mass change derived from GRACE data [7,8,9,10,11,12]. Some studies analyzed GRACE-estimated cumulative mass loss of the GrIS at a regional scale, including investigating the main cause of mass loss [13,14,15]. There have also been a few studies focused on short-term changes or inter-annual mass variations of the GrIS using GRACE data [16,17,18,19]. The launch of GRACE Follow-On (GRACE-FO) satellites in May 2018 extended GRACE-based estimates of mass change on Earth [20]. As there was a data gap of 11 months between the two missions and the GRACE-FO satellites could rely on only one accelerometer, efforts had to be put into verifying data quality and the continuity of the GRACE and GRACE-FO missions [6]. Using independent data sources (the mass budget method, MBM), for instance, the combination of modeled surface mass balance (SMB) from regional climate models [21,22] and estimates of ice discharge [23,24], it was confirmed that GRACE and GRACE-FO missions showed data continuity in ice-sheet mass variations [25,26].
The increasing length of the GRACE/GRACE-FO time series enable us to statistically analyze the characteristics of the GrIS mass variations at different timescales, which could be useful for better understanding the status of the GrIS. Additionally, the MBM makes it possible for us to determine the main factors of mass change over the GrIS. In this study, to avoid the contamination from potential bias between GRACE and GRACE-FO missions, we separately computed and compared monthly non-cumulative mass change of the GrIS from GRACE/GRACE-FO gravimetry and the MBM. We statistically analyzed the characteristics of the GrIS mass variations during the observation period of GRACE/GRACE-FO satellites at monthly, seasonal, and annual timescales. With individual components from the MBM, the leading factors of mass change of the GrIS were analyzed together with the associated temperature change. The impact from each factor on the GrIS’s monthly mass change was further quantified. Finally, we explored the possible links between summer mass variations of the GrIS and the mean atmospheric pressure gradient measured by the North Atlantic Oscillation (NAO) index [27].

2. Data and Methods

2.1. GRACE and GRACE-FO Data

In this study, we utilized GRACE and GRACE-FO level 2 Release 06 monthly gravity field solutions provided by three data processing centers, namely the Center for Space Research (CSR) at the University of Texas in Austin [28], the Jet Propulsion Laboratory (JPL) [29], and the German Research Center for Geosciences (GFZ) [30]. All the solutions are provided as fully normalized spherical harmonic coefficients with degree and order up to 60. For GRACE data, all the solutions during the time span from April 2002 to June 2017 were analyzed. As to GRACE-FO data, we used these from the period from June 2018 to February 2021. Due to poor data quality or instrument anomalies, some gravity field solutions in certain months, i.e., June 2002, July 2002, and June 2003 and so on, were not available. This case existed for both GRACE and GRACE-FO missions. To fill in these missing gravity field solutions, a linear interpolation between adjacent solutions was used. In total, we added 22 monthly gravity fields, most of which were isolated or paired. We note that on the cryosphere, the data gap between GRACE and GRACE-FO missions could be filled by using the singular spectrum analysis gap-filling technique or applying gravity fields measured by Swarm satellites [31,32]. Considering our study was focused on the characteristics of the GrIS mass variations revealed by observations from GRACE/GRACE-FO gravimetry, we did not fill the 11-month gap between the two missions. As reported by previous studies [33,34,35], low degree terms, especially degree one terms and degree two zonal terms, have some impacts on GRACE-derived polar ice sheet mass variations. Here we added degree one terms from GRACE/GRACE-FO Technical Note 13 (TN-13) [36]. We replaced degree two zonal terms with those in Technical Note 14 (TN-14) from satellite laser ranging [33]. To avoid the potential bias between mass change separately derived from GRACE and GRACE-FO missions, we computed monthly non-cumulative mass change time series through the following steps: (1) selecting gravity field solutions in two successive months provided by CSR, i.e., those in December 2002 and January 2003; (2) subtracting the former from the latter solution (the solution in January 2003 minus that in December 2002); (3) computing mass change, which was defined as the non-cumulative mass in the latter month, based on the difference between solutions in two successive months in step 2; (4) moving forward one month at a time (the solutions in January and February 2003 next time), and repeating the previous steps until the end of GRACE/GRACE-FO data. Note, we removed the glacial isostatic adjustment (GIA) effect, using the GIA model provided by [37]. Considering the north–south strips on the maps of GRACE-derived mass change, Gaussian smoothing with a radius of 300 km was applied [38]. When Gaussian smoothing caused signals of mass change leaking into coastal ocean, a leakage reduction was then performed according to [39] to minimize the leakage error. Finally, monthly non-cumulative mass change time series were derived over the GrIS for the GRACE/GRACE-FO mission timespan.

2.2. SMB Model and Ice-Discharge Data

To enhance the confidence of GRACE/GRACE-FO-derived non-cumulative mass change time series over the GrIS, we also computed monthly mass variations of the GrIS using the MBM. As aforementioned, the MBM combines the individual components of ice sheet surface mass balance (SMB) and ice discharge. For SMB, we used monthly outputs with a 1 km grid interval from the Regional Atmospheric Climate Model (RACMO) 2.3p2 [22]. It was confirmed that monthly cumulative SMB combined with ice discharge agreed well with those from GRACE data [40]. As we did not need to form monthly cumulative SMB variations, we directly adopted the SMB data available. The timespan of SMB data was from January 2002 to December 2020. The monthly SMB values were obtained from the following equation:
SMB = P t o t R U S U E d s
where P t o t is the total precipitation, R U indicates meltwater runoff, S U means sublimation, and E d s is erosion/deposition due to drifting snow. Note, we also analyzed each component of SMB, aiming at figuring out the leading factors of the GrIS’s mass variations.
In order for results to be commensurate with GRACE/GRACE-FO data, i.e., the same spatial resolution, Gaussian smoothing with a radius of 300 km was separately applied to SMB data and its individual components. The signal leakage correction was also performed as was done for GRACE/GRACE-FO data. As to ice discharge, we adopted monthly GrIS discharge estimates provided by [41], which covered the period from January 2002 to November 2020.

2.3. Climate Data

In this study, we used the temperature of air at 2 m above the surface of the Earth at monthly intervals to analyze its potential relationship with the leading factors of the GrIS’s mass change. Two meter temperature data were provided by the ERA5 dataset, which is the fifth generation of the ECMWF reanalysis for global climate and weather [42]. To figure out the potential links between summer mass variations of the GrIS and the atmosphere conditions, the NAO index from NOAA standardized to the period 1981–2010 was used [27,43].

3. Results

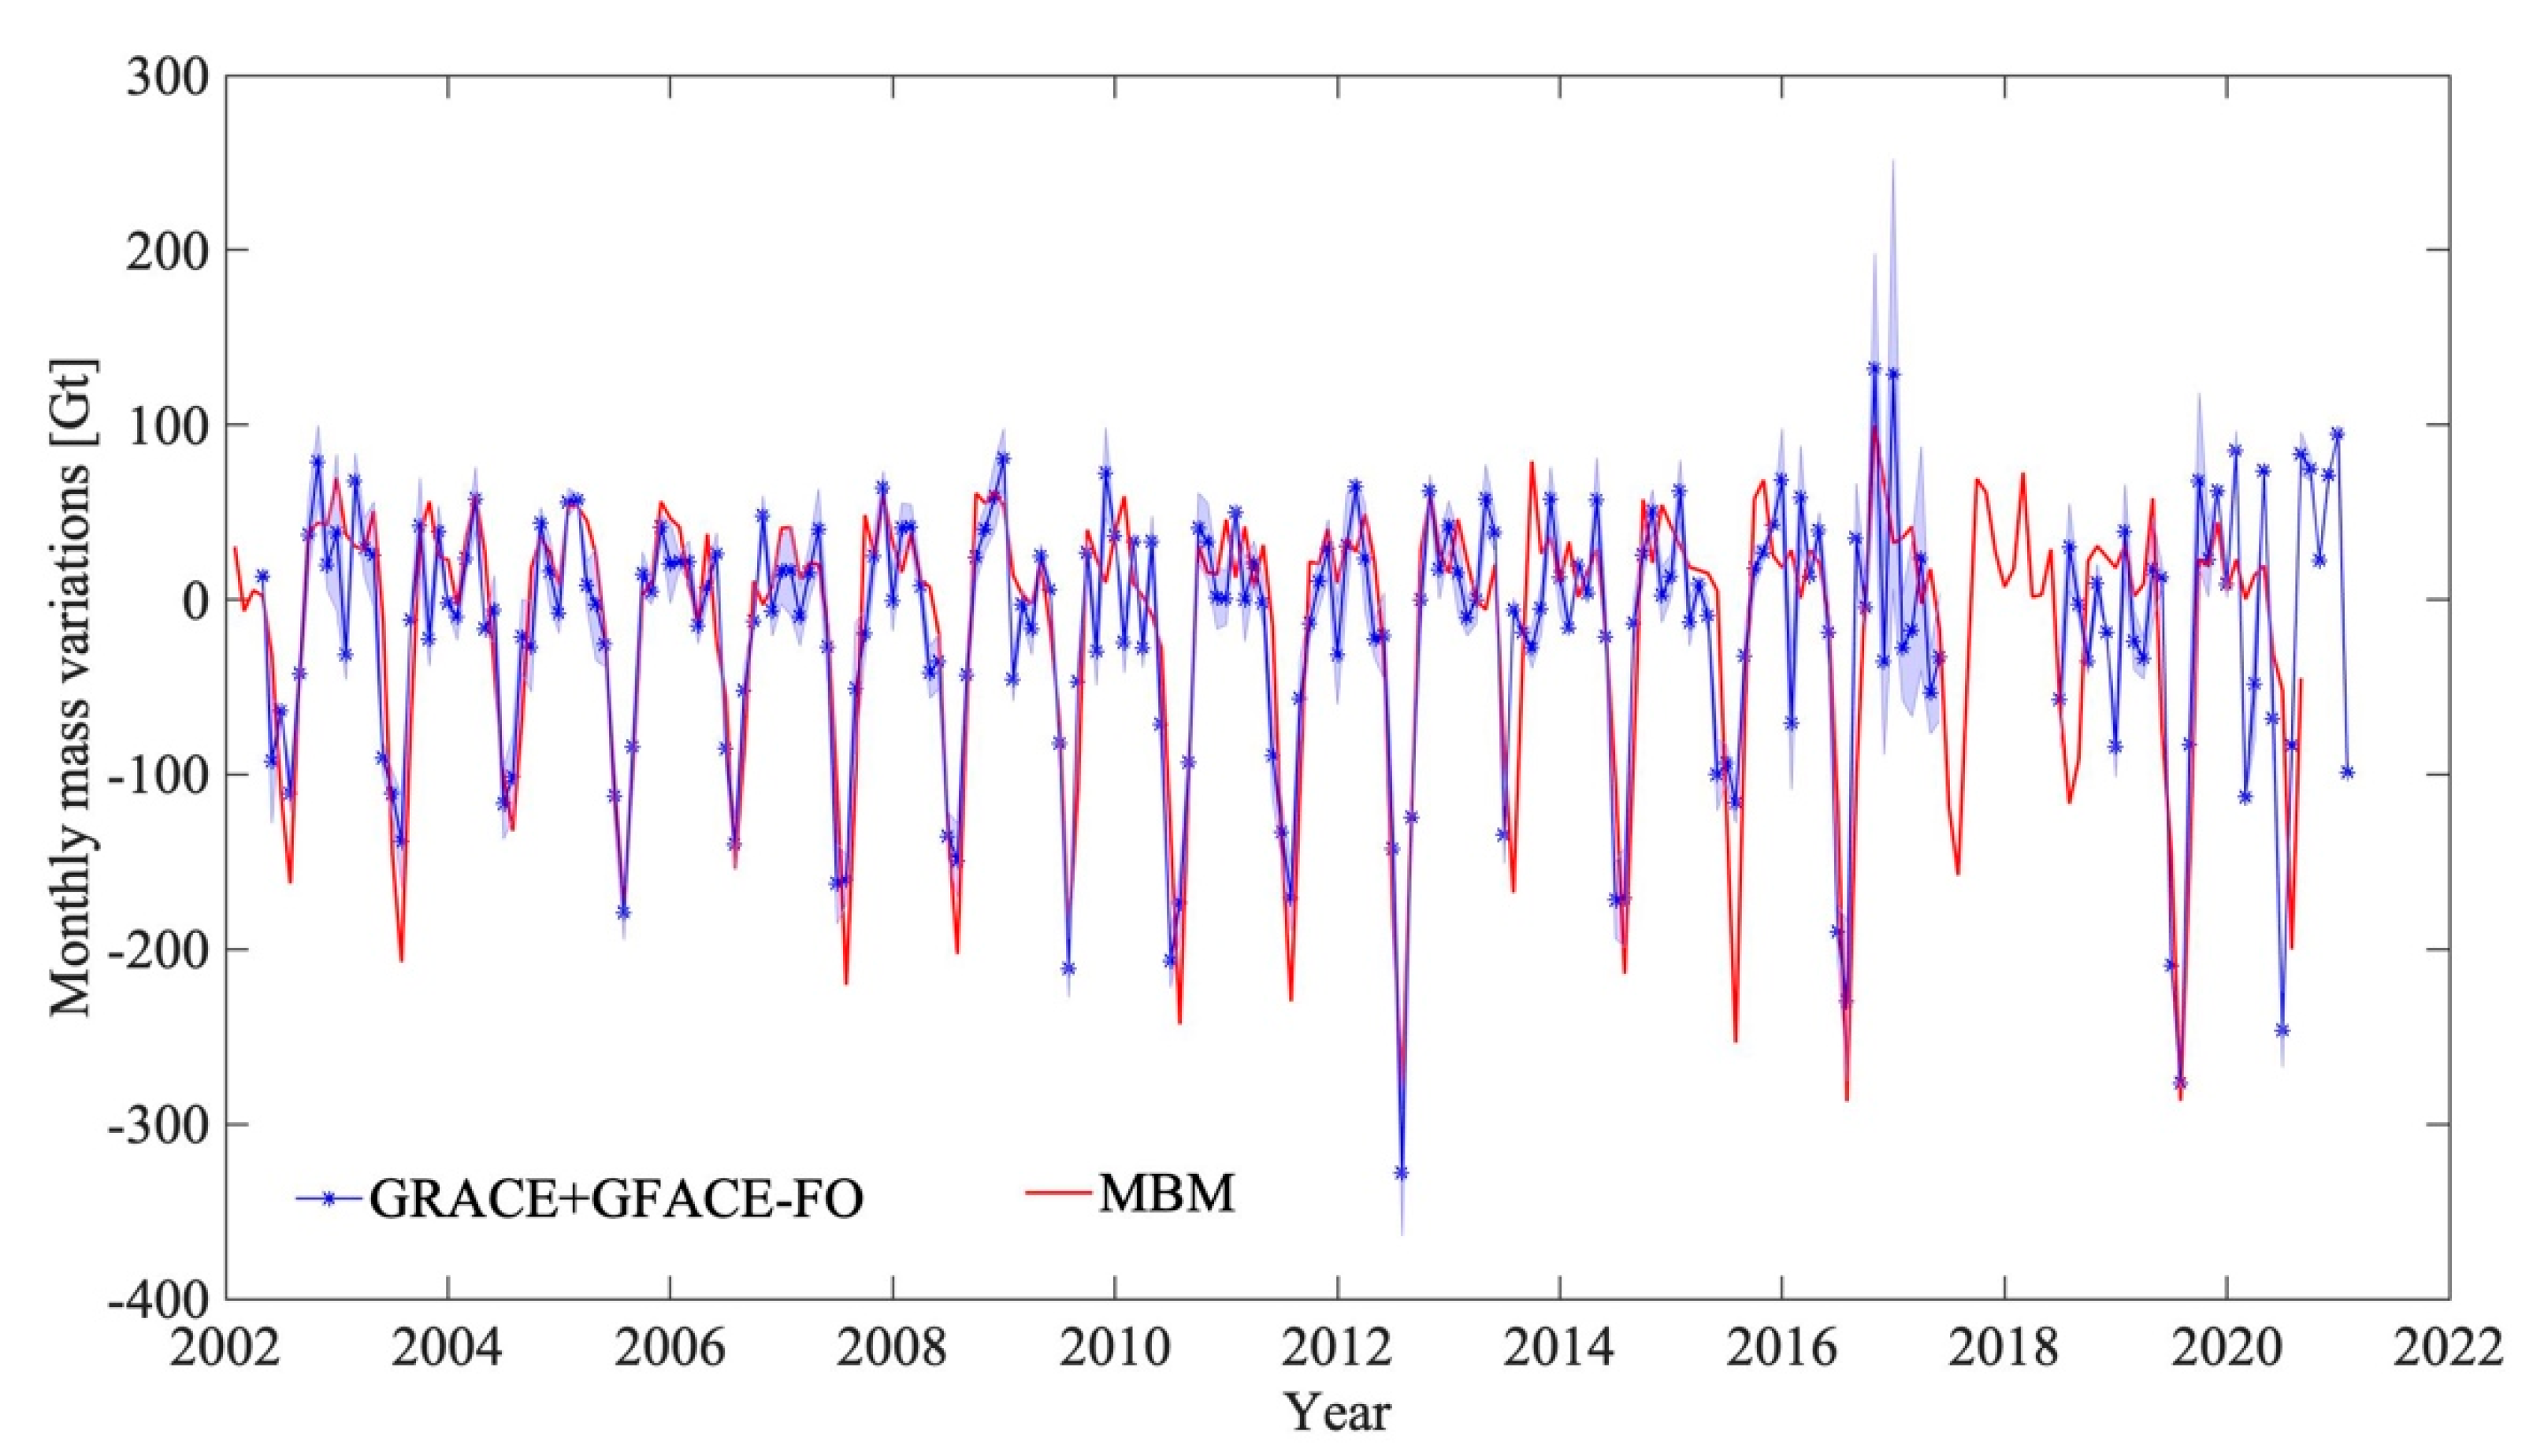
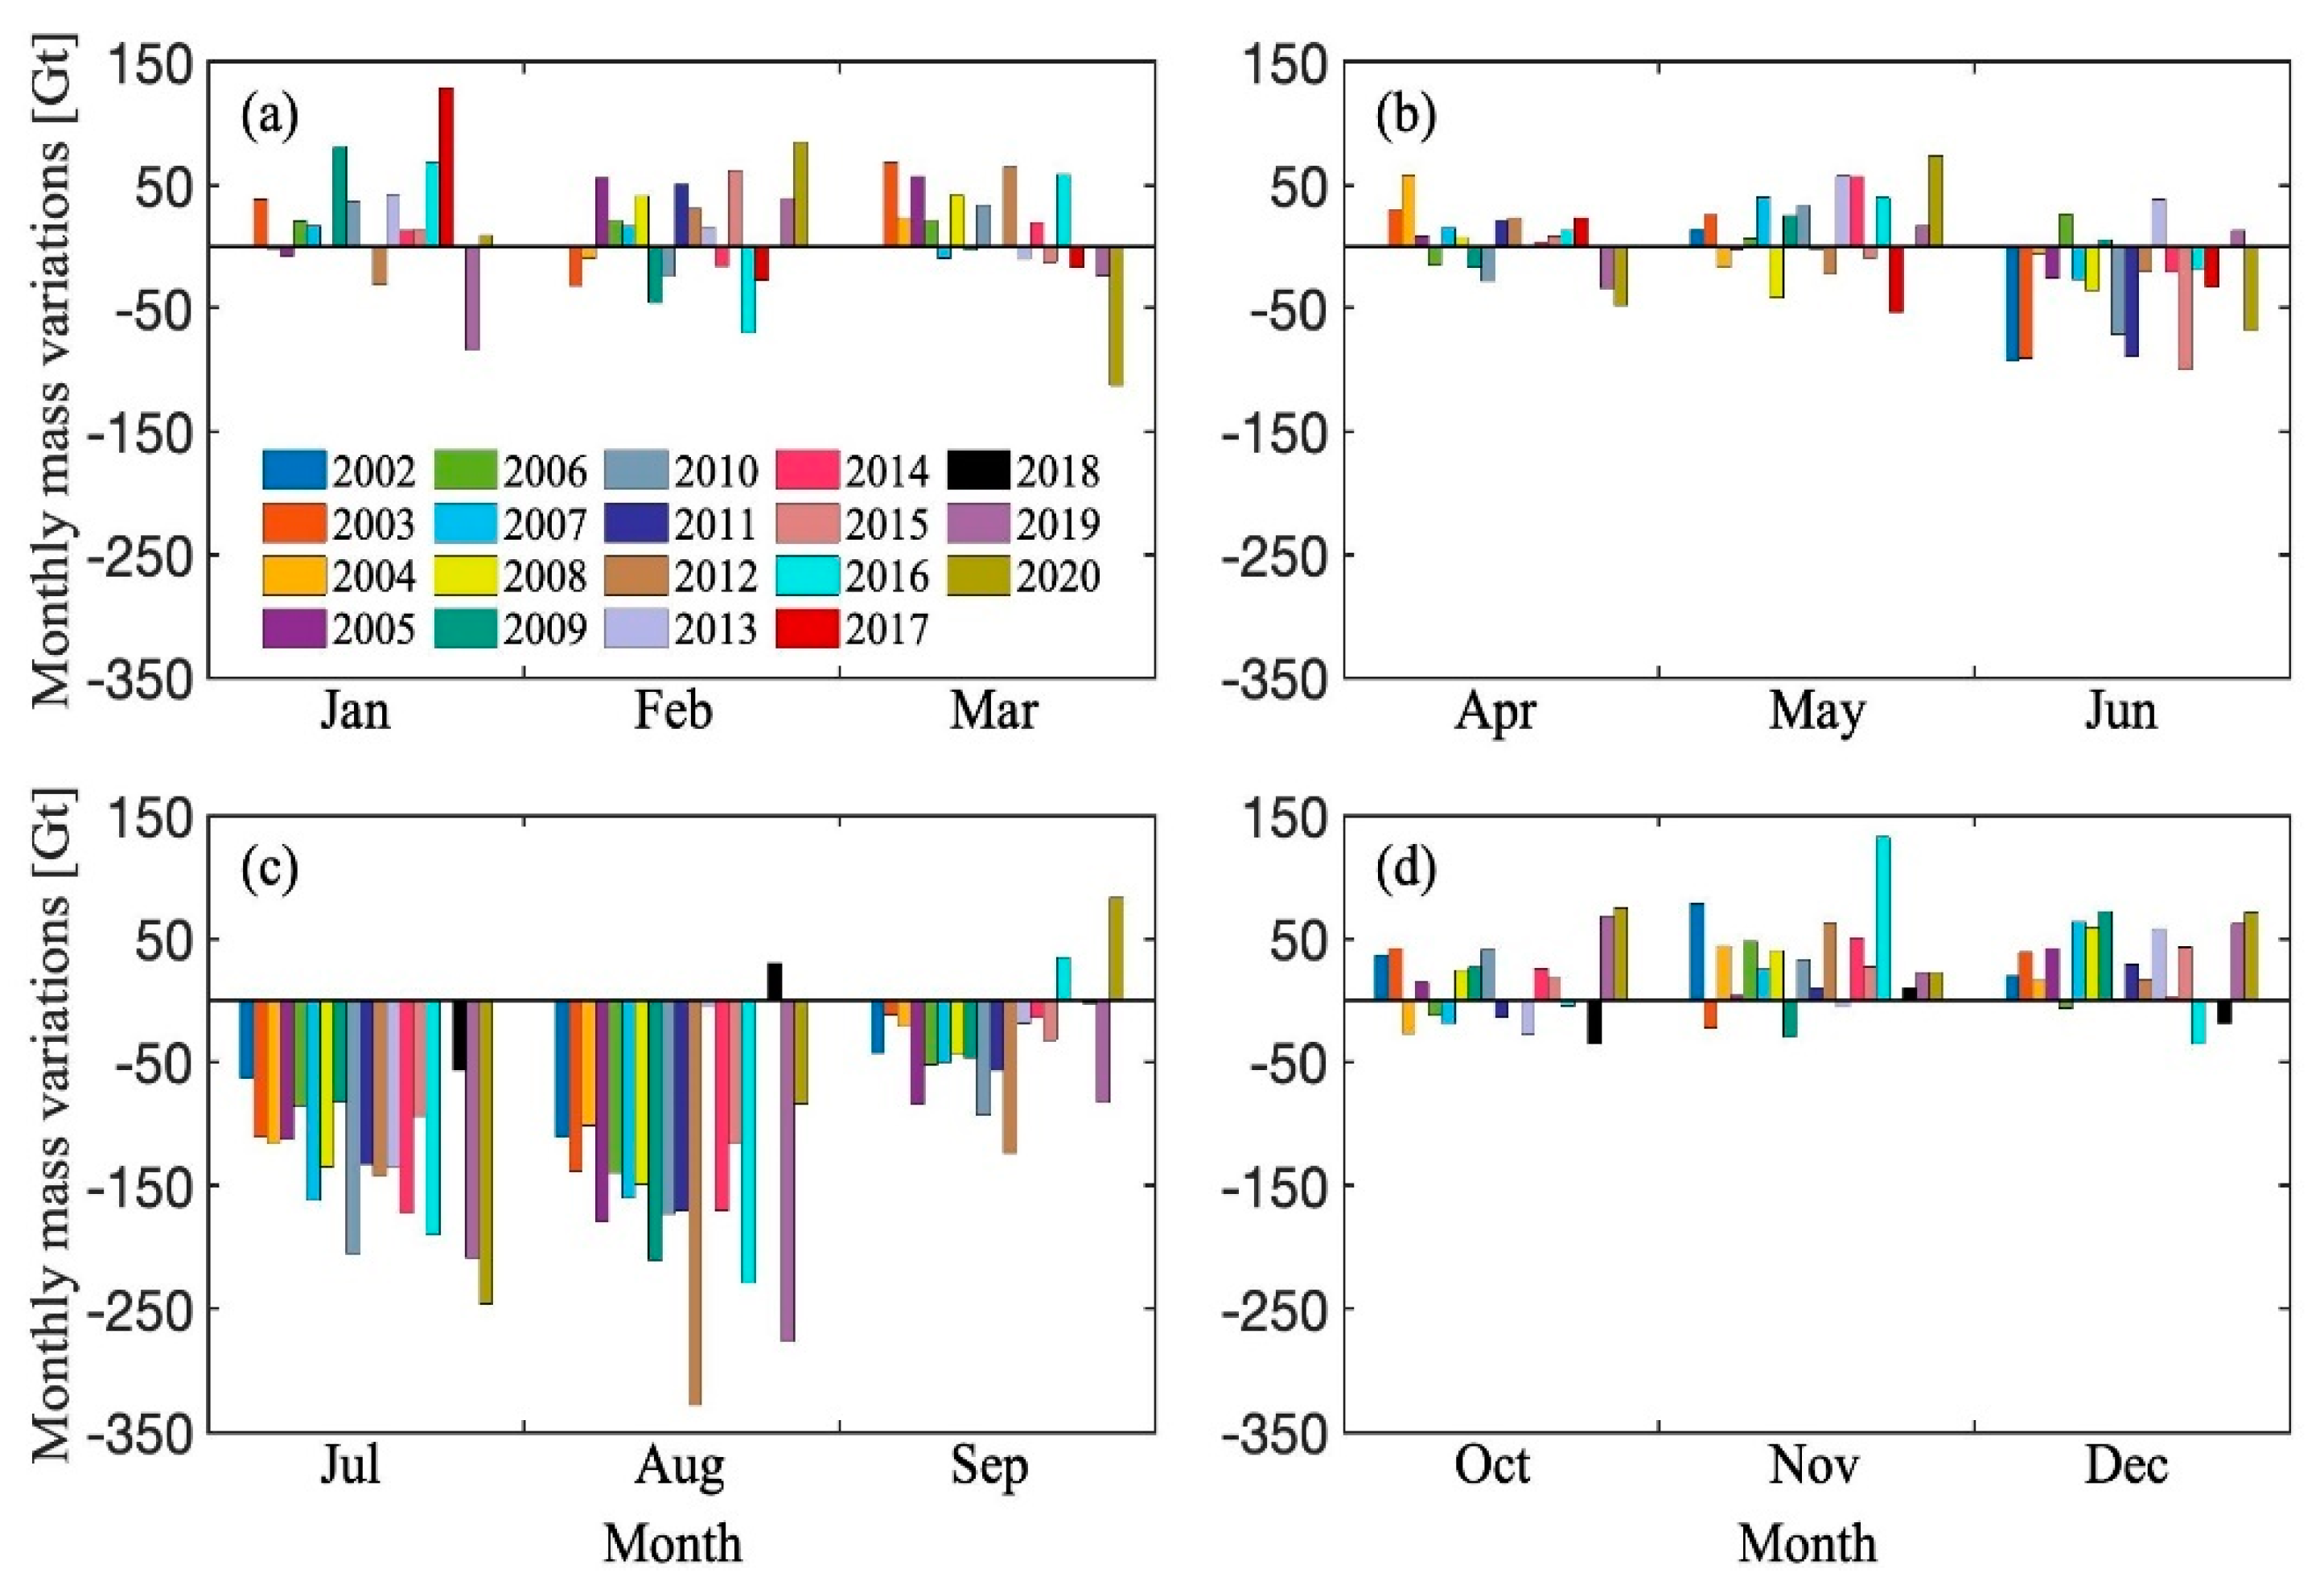
3.1. Monthly Non-Cumulative Mass Variations of the GrIS

As mentioned in Section 2.1, we calculated GRACE/GRACE-FO-derived monthly non-cumulative mass change time series over the GrIS (blue line with asterisk in Figure 1) in order to avoid the potential bias between mass variations from both missions. To examine the reliability of GRACE/GRACE-FO-derived non-cumulative mass change time series and enhance our confidence on the data postprocessing, monthly non-cumulative mass variations of the GrIS were also computed from the MBM (red line in Figure 1) through the combination of SMB and ice discharge. It is apparent that both monthly non-cumulative mass change time series generally agreed with each other. Within each year, the monthly non-cumulative mass change exceeded −100 Gt at least once or twice or even more, which suggests numerous mass loss incidents occurred over the GrIS in summer. The most negative monthly mass change (−328 Gt/month) was revealed by GRACE measurements in the record melt year 2012. GRACE-FO measurements detected a peak monthly mass change in August 2019 of −277 Gt/month, ranking second behind 2012 and being followed by −246 Gt/month in July 2020. We noticed that the most negative and the second most negative monthly mass changes were also reported by [25] but with relatively smaller values. The numerical difference of monthly mass change can be primarily attributed to the different data postprocessing techniques, e.g., the radius of Gaussian smoothing and the approach of leakage reduction, GRACE/GRACE-FO data and also the coverage of the GrIS [12].
To understand the pattern of non-cumulative mass change in the same month but in different years over the GrIS, we compared data month by month, as shown in Figure 2. It can be seen that monthly mass gain or loss occurred in every month except for July, in which only monthly mass loss occurred during 2002–2020. Obviously, monthly mass loss was more frequent in June, July, and August as well as September than that occurring in other months. It seems that monthly mass losses in July and August have increased in magnitude during the past two decades, if we neglect several values such as those in August 2013 and 2018. In March, monthly mass change was dominated by mass gain before 2012, and monthly mass loss became more frequent after that. High monthly mass gain can also be clearly observed in November 2016 and January 2017. Moderate monthly mass gain occurred in September 2020 and October 2019 and 2020. High monthly mass loss appeared in March 2020.

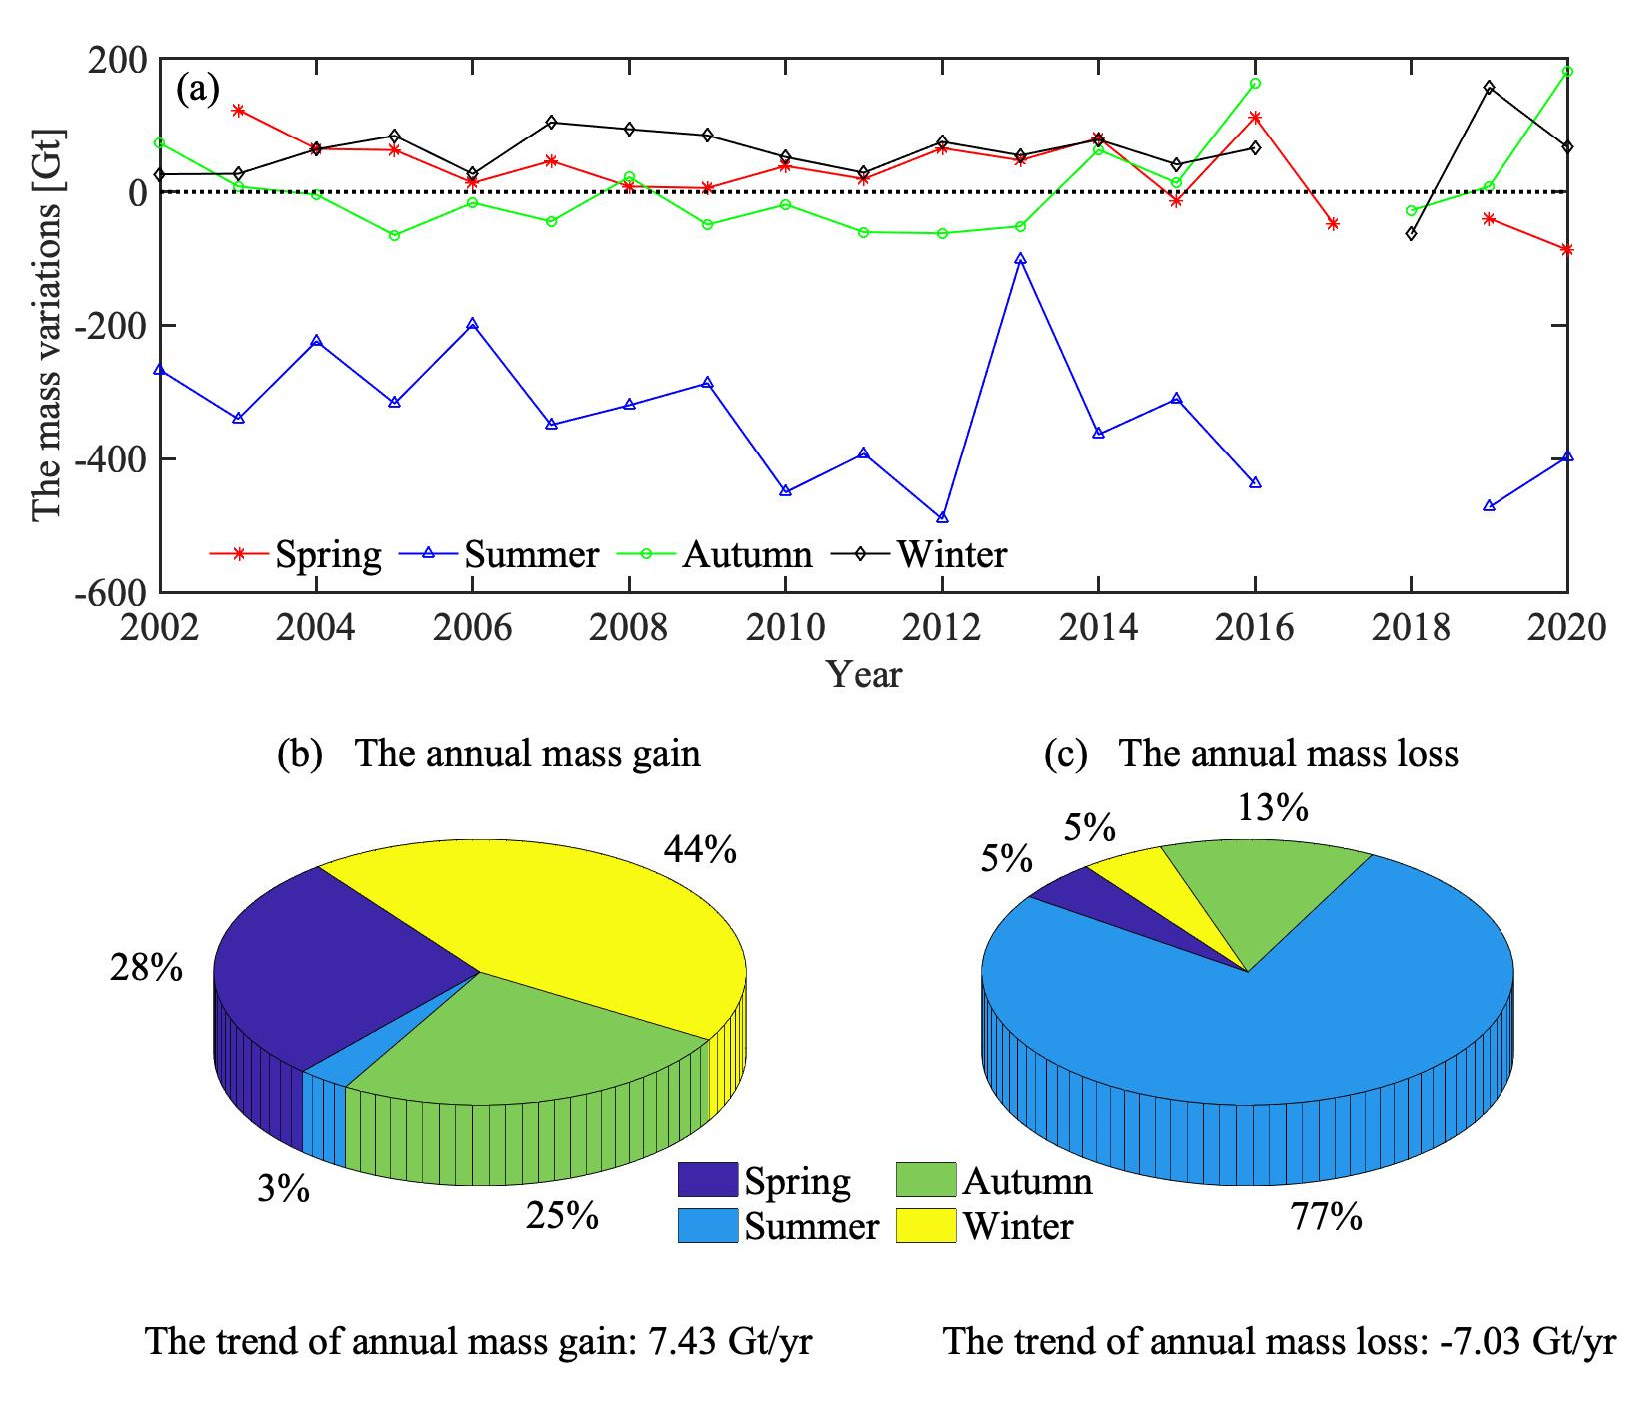
3.2. Seasonal Mass Variations of the GrIS

To understand the characteristics of the GrIS mass variations at seasonal timescale, we computed mass change in four seasons in the northern hemisphere, namely spring (March, April, and May), summer (June, July, and August), autumn (September, October, and November) and winter (December, January, and February). It should be noted that winter includes December in the current year, and January and February in the next year. As shown in Figure 3, summer mass loss dominated mass change over the GrIS, with the mean magnitude in absolute value exceeding by 5 times that in other seasons. Mass was mainly accumulated in winter, followed by spring. In spring, it is obvious that mass was mostly accumulated before 2015 but lost more frequently after that. In contrast, in autumn, mass was mainly lost before 2014 but gained more frequently after that. This could be associated with the seasonal weather patterns in Greenland; for instance, dry and warm/cold and snowy weather, the early or late beginning of melting season, the low or high degree of melting season, or the duration of the melting season and so on. According to the polar portal season report provided by the Danish Arctic research institution (http://polarportal.dk/en/home/, accessed on 19 February 2020), the melting season sometimes came earlier such as those in 2016 (12 May), 2017 (5 May), 2019 (30 April), compared to the melting seasons since 1981. Note, an early melting season does not necessarily mean high melting loss. For instance, the one in 2017 was quickly interrupted by cold weather and snow and the melting season in 2017 was relatively short. It is certain that more mass would be accumulated in spring if no melting season began in spring. In autumn, the record low temperature and high amount of rain and snow or a number of unusually severe storms may account for the more frequent mass gain occurring in the season in recent years. For instance, in October 2016, a very large amount of rain and snow hit the eastern part of the GrIS.
As seasonal mass change consists of monthly mass gain, or monthly mass loss or both, here we attempted to partition mass change in each season into mass gain and mass loss. As shown in Table 1, apparently, mass was primarily gained in spring, autumn, and winter. The corresponding mean value of mass gain in winter during 2003–2020 (excluding the years 2017 and 2018) was 92.75 Gt, compared to 59.80 Gt in spring and 61.22 Gt in autumn. Mass accumulation in winter played an important role in maintaining the GrIS, with the percentage of total mass accumulation in the corresponding year ranging from 19% to 67%. Occasionally, slight mass gains occurred in summer during the past two decades, such as in the summers in 2006, 2009, and 2013 as well as 2019. Mass loss mainly occurred in summer, with the percentage of total mass loss in the corresponding year ranging from 61% to 96%. That is, summer mass loss was the major cause of shrinkage of the GrIS. Indeed, we find that all summer mass losses in 2010, 2011, 2012, 2016, 2019, and 2020 exceeded 390 Gt, with those in 2012 (−490.59 Gt) and 2019 (−485.75 Gt) ranking in the top two in the past 20 years. Although the summer mass loss in 2013 was the lowest (−140.07 Gt), it made up 64% of the total mass loss in that year.
In addition, to understand the spatial characteristics of the GrIS’s seasonal mass variations, we calculated mass variations in the four seasons in 2012, 2013, 2019, and 2020, as depicted in Figure 4. Here we divide the GrIS into seven sections: South West (SW), West (W), North West (NW), North (N), North East (NE), East (N), and South East (SE) (Figure 4a). It is apparent that mass loss mainly occurred in summer, with severe mass loss concentrated on the marginal regions of the GrIS. Summer mass losses in 2012, 2019, and 2020 were much larger and more widespread than that in 2013. There was a slight mass gain in summer 2013 in NW and N areas of the GrIS, while severe mass loss can be seen over these in summer 2012, 2019, and 2020. Mass gain mainly appeared in the SW and SE of the GrIS in winter. Significant mass gain could also be seen in the NW and NE in winter 2019 and autumn 2020. Compared with mass variations in spring 2012 and 2013, more mass loss was found in the NW, N, and NE in spring 2019 and 2020. In autumn, less mass loss and more mass gain can be seen in 2019 and 2020 when compared to those in 2012 and 2013.

3.3. Annual Mass Variations of the GrIS

To analyze the characteristics of the GrIS’s annual mass variations for each year, we calculated its annual mass change by adding up monthly non-cumulative mass changes (from January to December), which are shown in Figure 1. In Figure 5a, GRACE and GRACE-FO-derived annual mass change are marked in blue bars. During the period from 2003 to 2016, the pattern of annual mass variations of the GrIS is quite similar to that shown by Figure 2a in [5], which also confirms the feasibility of our data postprocessing. From Figure 5a, much more negative annual mass change can be seen in 2010, 2011, and 2012 as well as in 2019, compared to that in other years. Annual mass change with a slightly positive value was only visible in 2013, which suggests a small amount of mass gain occurred over the GrIS if neglecting the corresponding uncertainty. When excluding annual mass change in 2010, 2011, 2012, and 2013 as well as 2019, the mean value of the GrIS’s annual mass change was −193.18 Gt. It rose to −240.05 Gt when including those years with a high degree of mass loss. Due to the data gap between GRACE and GRACE-FO measurements, annual mass change in 2017 and 2018 was not available using GRACE-like gravimetry. Considering the good agreement of monthly mass change time series derived separately from GRACE/GRACE-FO gravimetry and the MBM (Figure 1), here we attempt to fill in the annual mass change gap in 2017 and 2018 using the MBM. As shown in red bars in Figure 5a, over the GrIS, annual mass losses in 2017 and 2018 were relatively small (<−100 Gt), compared to those in other years excluding 2013. If considering mass losses measured in two consecutive years, the GrIS’s mass losses observed in 2017 and 2018 were the lowest of all mass losses in any other two-year period between 2003 and 2020. This is consistent with the result reported by [25]. According to the aforementioned polar portal season report, the melting season in 2017 was short over the GrIS. Large amount of snowfall hit the SE part of the GrIS. The temperatures proved to be more than a standard deviation below average in summer (June, July, and August). Then, the albedo was the third highest in the past 18 years, which means more sunlight was reflected and thereby less energy was taken up from the Sun. In 2018, the albedo was at a record high in May, June, and the beginning of August. The GrIS experienced a low degree of melting and major storms which dumped large amounts of snow on the ice sheet. To some extent, this explained that the lowest mass loss was in 2017 and 2018 according to the MBM.
Considering annual mass change consists of monthly mass gain or mass loss, we separately computed mass gain (accumulation) and mass loss at the annual timescale. Being limited by the temporal resolution of one month for GRACE/GRACE-FO gravity field solutions, here we defined mass accumulation/loss at annual timescale like this: arbitrarily select one year, i.e., 2003, then mass accumulation at annual timescale means the summation of all monthly mass changes with positive values in 2003 (Figure 1), and mass loss at annual timescale means the summation of all monthly mass changes with negative values. Using the MBM, the data gaps for mass accumulation and loss at annual timescale were separately filled up. As depicted by Figure 5b, in the past two decades, mass accumulation time series showed a positive trend (7.43 Gt/yr), while a negative trend of −7.03 Gt/yr can be found from mass loss time series. This means that both mass accumulation and mass loss at annual timescale were increasing over the GrIS in the past two decades. It should be noted that the magnitude of mass loss in absolute value was much larger than that of the corresponding mass accumulation (excluding year 2013), with the mean value of their ratios being two times higher. The total annual mass variations show a quite weak mass trend of 0.40 Gt/yr. To better understand the characteristics of annual mass variations of the GrIS, it would be necessary to carry out observations in a timespan as long as possible in future.
We also mapped the spatial distribution of annual mass change over the GrIS (years 2003–2020, excluding 2017 and 2018), as depicted in Figure 6. It is obvious that the spatial patterns of annual mass change of the GrIS were different from year to year. From 2004 to 2006, accelerated mass loss can be seen over the SE of the GrIS. Large amount of mass losses occurred in marginal regions in the SW, N, and NW in 2007, 2008, and 2009. During the period from 2010 to 2012, severe and widespread mass losses were mainly concentrated in the SW and SE part of the GrIS. In 2013, mass loss was significantly reduced, with a large amount of mass gain occurring in part of the SW and a moderate amount of mass gain appearing in the N. Mass losses mainly occurred in the western part of the GrIS in 2014 and 2016, and changed to the northern part in 2015. Note, the above spatial patterns of annual mass change of the GrIS were revealed by GRACE gravimetry. According to GRACE-FO’s measurements, widespread and severe mass loss occurred again over the GrIS in 2019, which was reported by [25,26]. Here, we find that annual mass loss of the GrIS was significantly reduced in 2020, with parts of the NW and SE showing a large amount of mass loss.

3.4. The Factors Dominating Mass Variations of the GrIS

In order to understand the factors that influence the GrIS’s mass change, we analyzed each component of SMB data from the RACMO2.3p2 [22] and also ice-discharge data [41]. As aforementioned, monthly SMB data consist of total precipitation ( P t o t ), meltwater runoff ( R U ), sublimation ( S U ), and erosion/deposition ( E d s ). We also considered the potential influence from surface temperature. We used the monthly mean temperature of 2 m provided by the ERA5. Figure 7 depicts monthly variations of each component from SMB data, ice discharge, and 2 m temperature. Note, only monthly temperature variations correspond to the vertical axis on the right. We find that the magnitude of R U achieved the peak in summer in each year, which was the largest of all the components from SMB data. It had a maximum (~273.40 Gt) in July 2012, followed by that (~259.80 Gt) in July 2019. P t o t contributed a lot to mass accumulation over the GrIS, with amplitude ranging from ~40 Gt to 100 Gt from month to month. The magnitude of P t o t was moderate, while those of S U and E d s were quite small. Monthly ice discharge showed moderate magnitude (~41.03 Gt/month) with small change (~5.80 Gt). Monthly variations of 2 m temperature showed very similar phases with monthly meltwater runoff time series, with a correlation coefficient of 0.78. It was mentioned by [38] that the amount of melting and runoff induced by a temperature increase strongly depended on variables such as initial surface temperature, latitude, and elevation as well as time of year.
To quantify the impact of each component of SMB data and also ice-discharge data on monthly mass variations of the GrIS, we first computed the mean value of each component at each month during 2002–2020. For instance, in January, the mean value of P t o t was computed. Similar calculations were done for R U , S U , and E d s as well as for ice discharge in January. The sum of absolute value of these means were also computed in January, which we marked as M t o t . The mean of P t o t in absolute value in January divided by M t o t was then defined as the quantity which indicates the contribution of P t o t to mass change of the GrIS in January. Thus, the contribution of each component to the GrIS’s mass variations could be calculated at each month. As provided in Figure 8, if excluding June, July, and August, P t o t almost accounted for more than 50% of the GrIS’s monthly mass change and ice discharge contributed more than 30%. Apparently, the contribution of R U increased from May, and achieved a maximum (exceeding 63%) in July. It slightly decreased in August and significantly reduced in September. E d s and S U had relatively small contributions to monthly mass change of the GrIS.

4. Connection between Summer Mass Change of the GrIS and Summer NAO Index

Our analysis of the GrIS mass variations at different timescales demonstrates that summer mass change dominated mass loss of the GrIS in the corresponding year. It primarily depended on changes of total precipitation and meltwater runoff which are the main components of SMB. Previous studies [42,43,44] noted that there were potential links between summer mass loss of the GrIS observed by GRACE and the summer NAO index. The latter reflects the state of the general atmospheric circulation over the GrIS. With a negative phase of the summer NAO index, high pressure and clear-sky conditions prevail, which can enhance surface absorption of solar radiation and decrease snowy weather. All these changes further promote higher air temperature, a long duration of melting season, and a high degree of melting and runoff. In contrast, when the positive phase happens, less mass loss will prevail. Here, in order to analyze the relationship between the GrIS’s summer mass change observed by GRACE/GRACE-FO and the phase of the summer NAO index (the average of June–July–August), we applied the monthly tabulated NAO index from the National Oceanic and Atmospheric Administration (NOAA) that was standardized by the 1981–2010 climatology. As shown in Figure 9, a distinct positive correlation can be found between summer mass variations of the GrIS and the phase of the summer NAO index. If selecting the period from 2002 to 2016, their temporal correlation coefficient was 0.74. We also computed the summer SMB of the GrIS, as depicted by the black dotted line in Figure 9. It was also strongly correlated with the phase of the summer NAO index during the period from 2002 to 2020. Besides, it can be seen that the record mass loss in 2012 correlated with the increasing negative phase of the summer NAO index during six successive summers [42]. The summer NAO index turned positive in 2013, with significantly reduced runoff, increased precipitation, and decreased temperature (Figure 7) resulting in a shorter melting season and much smaller summer mass loss. When the summer NAO index again turned increasing negative in 2016, significant summer mass loss occurred again. In 2017 and 2018, the summer NAO indices again became positive, with largely reduced runoff leading to smaller mass loss. In 2019, the summer NAO index again turned strongly negative, with decreased precipitation, increased temperature and runoff again resulting in widespread mass loss. Even in 2020, the phase of the summer NAO index still remained negative, and a large amount of summer mass loss also widely occurred, as provided by Figure 4. Note, the annual mass loss of the GrIS in 2020 was much smaller than that in 2019, as heavy mass gain appeared in February, May, September, October, as well as December (Figure 2), which benefited the GrIS.

5. Conclusions

In this study, we computed monthly non-cumulative mass variations of the GrIS in order to avoid potential bias between GRACE and GRACE-FO-derived mass variations, aiming at analyzing the characteristics of the GrIS mass variations at monthly, seasonal, and annual timescales. To validate the measurements obtained from GRACE-FO, monthly non-cumulative mass variations of the GrIS were also computed using SMB from the RACMO2.3p2 and ice discharge data (the MBM). We find that monthly non-cumulative mass variations derived from GRACE/GRACE-FO and the MBM show good agreement with each other over the GrIS during the study period. The statistics of seasonal mass changes demonstrate that ice mass mainly lost at summer and autumn over the GrIS, and it primarily accumulated in winter, followed by spring. We report that mass mostly accumulated in spring before 2015 but was lost more frequently after that. In contrast, in autumn, mass was mainly lost before 2014 but gained more frequently after that. At annual timescale, ice mass changes were divided into mass accumulation (the sum of monthly non-cumulative mass change with magnitude larger than zero) and mass loss (the sum of monthly non-cumulative mass change with magnitude less than zero). We find that in the most recent two decades, mass accumulation time series show a positive trend (7.43 Gt/yr), while a negative trend of −7.03 Gt/yr can be found from mass loss time series. Additionally, based on all the components of SMB from the RACMO2.3p2 and ice discharge data, the factors dominating mass change of the GrIS were analyzed. If excluding June, July, and August, P t o t and ice discharge separately accounted for more than 50% and 30% of the GrIS’s monthly mass change. A significantly increased contribution from R U can be seen in June, July, and August, with the maximum exceeding 63%. In addition, the link between summer mass change of the GrIS observed by GRACE/GRACE-FO and the phase of the summer NAO index was studied. When the summer NAO index turned strongly negative, the decreased precipitation, increased temperature and runoff led to widespread mass loss over the GrIS.

Author Contributions

P.S. processed the data and sorted out figures. X.S. performed the analysis and wrote the manuscript. P.S., X.S. and Z.L. revised the manuscript. All authors have read and agreed to the published version of the manuscript.

Funding

This research is funded by the National Natural Science Foundation of China, grant number 41804014 and 42061134007.

Data Availability Statement

In this study, the spherical harmonic coefficients of three data processing centers are available through ftp://podaac.jpl.nasa.gov/allData/grace/L2/CSR/RL06/ (accecced on 5 October 2020), http://isdc.gfz-potsdam.de/grace and ftp://isdcftp.gfz-potsdam.de/grace-fo/. The auxiliary data for the corrections of degree one terms, and SLR-based C20 estimates are also available at ftp://isdcftp.gfz-potsdam.de/grace-fo/DOCUMENTS/TECHNICAL_NOTES. For SMB, we obtained the monthly data at http://ramadda.science.uu.nl:8080/repository? The discharge can be accessible at https://github.com/GEUS-PROMICE/ice_discharge. In addition, the temperature at 2 m above the surface of the Earth can be downloaded from https://www.ecmwf.int/. The NAO index can be accessed at https://www.ncdc.noaa.gov/teleconnections/nao/. The polar portal season reports are available through http://polarportal.dk/en/home/.

Acknowledgments

We are grateful for B. Noël (Institute for Marine and Atmospheric Research, Utrecht University), who provided the SMB outputs from the RACMO 2.3p2. We would like to thank K.D. Mankoff for sharing the ice discharge data. We wish to thank those who have made the following data available: the spherical harmonic coefficients of three data processing centers, the auxiliary data for the corrections of degree one terms, SLR-based C20 estimates, the 2 m temperature data, and the NAO index as well as the polar portal season reports.

Conflicts of Interest

The authors declare no conflict of interest.

Abbreviations

AcronymsThe full name
GrISGreenland ice sheet
GRACEGravity Recovery and Climate Experiment
GRCAE-FOGravity Recovery and Climate Experiment Follow-On
SMBSurface mass balance
DIce discharge
MBMMass budget method
RACMORegional Atmospheric Climate Model
CSRCenter for Space Research
JPLJet Propulsion Laboratory
GFZGerman Research Center for Geoscience
TN-13Technical Note 13
TN-14Technical Note 14
GIAGlacial isostatic adjustment
P t o t Precipitation
R U Meltwater runoff
S U Sublimation
E d s Erosion/deposition
NAONorth Atlantic Oscillation
sNAOSummer North Atlantic Oscillation
NOAANational Oceanic and Atmospheric Administration
SWSouth west
WWest
NWNorth west
NNorth
NENorth east
EEast
SESouth east

References

  1. Bamber, J.L.; Layberry, R.L.; Gogineni, S.P. A new ice thickness and bed data set for the Greenland ice sheet: 1. Measurement, data reduction, and errors. J. Geophys. Res. 2001, 106, 33773–33780. [Google Scholar] [CrossRef]
  2. Comiso, J.C.; Parkinson, C.L. Satellite-Observed Changes in the Arctic. Phys. Today 2004, 57, 38–44. [Google Scholar] [CrossRef]
  3. Masson-Delmotte, V.; Zhai, P.; Pirani, A.; Connors, S.L.; Péan, C.; Berger, S.; Caud, N.; Chen, Y.; Goldfarb, L.; Gomis, M.I. (Eds.) IPCC, 2021: Summary for Policymakers. In Climate Change 2021: The Physical Science Basis. Contribution of Working Group I to the Sixth Assessment Report of the Intergovernmental Panel on Climate Change; Cambridge University Press: Cambridge, UK; New York, NY, USA, 2021; pp. 3–32. [Google Scholar] [CrossRef]
  4. Tapley, B.D.; Bettadpur, S.; Watkins, M.; Reigber, C. The gravity recovery and climate experiment: Mission overview and early results. Geophys. Res. Lett. 2004, 31, L09607. [Google Scholar] [CrossRef]
  5. Tapley, B.D.; Watkins, M.M.; Flechtner, F.; Reigber, C.; Bettadpur, S.; Rodell, M.; Sasgen, I.; Famiglietti, J.S.; Landerer, F.W.; Chambers, D.P.; et al. Contributions of GRACE to understanding climate change. Nat. Clim. Chang. 2019, 5, 358–369. [Google Scholar] [CrossRef] [PubMed]
  6. Chen, J.L.; Cazenave, A.; Dahle, C.; Llovel, W.; Panet, I.; Pfeffer, J.; Moreira, L. Applications and challenges of GRACE and GRACE Follow-On satellite gravimetry. Surv. Geophys. 2022, 43, 305–345. [Google Scholar] [CrossRef]
  7. Velicogna, I.; Wahr, J. Greenland mass balance from GRACE. Geophys. Res. Lett. 2005, 32, L18505. [Google Scholar] [CrossRef]
  8. Chen, J.L.; Wilson, C.R.; Tapley, B.D. Satellite gravity measurements confirm accelerated melting of Greenland ice sheet. Science 2006, 313, 1958–1960. [Google Scholar] [CrossRef]
  9. Velicogna, I. Increasing rates of ice mass loss from the Greenland and Antarctic ice sheets revealed by GRACE. Geophys. Res. Lett. 2009, 36, L19503. [Google Scholar] [CrossRef]
  10. Velicogna, I.; Sutterley, T.C.; van den Broeke, M.R. Regional acceleration in ice mass loss from Greenland and Antarctica using GRACE time-variable gravity data. Geophys. Res. Lett. 2014, 41, 8130–8137. [Google Scholar] [CrossRef] [Green Version]
  11. Jin, S.; Zou, F. Re-estimation of glacier mass loss in Greenland from GRACE with correction of land-ocean leakage effects. Glob. Planet. Chang. 2015, 135, 170–178. [Google Scholar] [CrossRef]
  12. Groh, A.; Horwath, M.; Horvath, A.; Meister, R.; Sorensen, L.S.; Barletta, V.R.; Forsberg, R.; Wouters, B.; Ditmar, P.; Ran, J.; et al. Evaluating GRACE Mass Change Time Series for the Antarctic and Greenland Ice Sheet—Methods and Results. Geosciences 2019, 9, 415. [Google Scholar] [CrossRef]
  13. Wouters, B.; Chambers, D.; Schrama, E.J.O. GRACE observes small-scale mass loss in Greenland. Geophys. Res. Lett. 2008, 35, L20501. [Google Scholar] [CrossRef]
  14. Sasgen, I.; van den Broeke, M.; Bamber, J.L.; Rignot, E.; Sorensen, L.S.; Wouters, B.; Martinec, Z.; Velicogna, I.; Simonsen, S.B. Timing and origin of recent regional ice-mass loss in Greenland. Earth Planet. Sci. Lett. 2012, 333–334, 293–303. [Google Scholar] [CrossRef]
  15. Ran, J.; Vizcaino, M.; Ditmar, P.; van den Broeke, M.R.; Moon, T.; Steger, C.R.; Enderlin, E.M.; Wouters, B.; Noël, B.; Reijmer, C.H.; et al. Seasonal mass variations show timing and magnitude of meltwater storage in the Greenland Ice Sheet. Cryosphere 2018, 12, 2981–2999. [Google Scholar] [CrossRef]
  16. Zhang, B.; Zhang, E.; Liu, L.; Khan, S.A.; van Dam, T.; Yao, Y.; Bevis, M.; Helm, V. Geodetic measurements reveal short-term changes of glacial mass near Jakobshavn Isbræ (Greenland) from 2007 to 2017. Earth Planet. Sci. Lett. 2018, 503, 218–226. [Google Scholar] [CrossRef]
  17. Ramillien, R.; Lombard, A.; Cazenave, A.; Ivins, E.R.; Llubes, M.; Remy, F.; Biancale, R. Interannual variations of the mass balance of the Antarctica and Greenland ice sheets from GRACE. Glob. Planet. Chang. 2006, 53, 198–208. [Google Scholar]
  18. Chen, J.L.; Wilson, C.R.; Tapley, B.D. Interannual variability of Greenland ice losses from satellite gravimetry. J. Geophys. Res. 2011, 116, B7. [Google Scholar] [CrossRef]
  19. Su, X.; Shum, C.K.; Guo, J.; Duan, J.; Howat, I.; Yi, Y. High resolution Greenland ice sheet inter-annual mass variations combining GRACE gravimetry and Envisat altimetry. Earth Planet. Sci. Lett. 2015, 422, 11–17. [Google Scholar] [CrossRef]
  20. Landerer, F.W.; Flechtner, F.M.; Save, H.; Webb, F.H.; Bandikova, T.; Bertiger, W.I.; Bettadpur, S.V.; Byun, S.H.; Dahle, C.; Dobslaw, H.; et al. Extending the global mass change data record: GRACE Follow-On instrument and science data performance. Geophys. Res. Lett. 2020, 47, e2020GL088306. [Google Scholar] [CrossRef]
  21. Fettweis, X.; Box, J.E.; Agosta, C.; Amory, C.; Kittel, C.; Lang, C.; Van As, D.; Machguth, H.; Gallée, H. Reconstructions of the 1900–2015 Greenland ice sheet surface mass balance using the regional climate MAR model. Cryosphere 2017, 11, 1015–1033. [Google Scholar] [CrossRef] [Green Version]
  22. Noël, B.; Van De Berg, W.J.; Van Wessem, J.M.; Van Meijgaard, E.; Van As, D.; Lenaerts, J.T.M.; Lhermitte, S.; Kuipers Munneke, P.; Smeets, C.J.P.P.; Van Ulft, L.H.; et al. Modelling the climate and surface mass balance of polar ice sheets using RACMO2–Part 1: Greenland (1958–2016). Cryosphere 2018, 12, 811–831. [Google Scholar] [CrossRef]
  23. King, M.D.; Howat, I.M.; Jeong, S.; Noh, M.J.; Wouters, B.; Noël, B.; Van Den Broeke, M.R. Seasonal to decadal variability in ice discharge from the Greenland Ice Sheet. Cryosphere 2018, 12, 3813–3825. [Google Scholar] [CrossRef] [PubMed]
  24. Mouginot, J.; Rignot, E.; Bjørk, A.A.; Van Den Broeke, M.; Millan, R.; Morlighem, M.; Noël, B.; Scheuchl, B.; Wood, M. Forty-six years of Greenland Ice Sheet mass balance from 1972 to 2018. Proc. Natl Acad. Sci. USA 2019, 116, 9239–9244. [Google Scholar] [CrossRef] [PubMed]
  25. Sasgen, I.; Wouters, B.; Gardner, A.S.; King, M.D.; Tedesco, M.; Landerer, F.W.; Dahle, C.; Save, H.; Fettweis, X. Return to rapid ice loss in Greenland and record loss in 2019 detected by the GRACE-FO satellites. Commun. Earth Environ. 2020, 1, 8. [Google Scholar] [CrossRef]
  26. Velicogna, I.; Mohajerani, Y.; Geruo, A.; Landerer, F.; Mouginot, J.; Noel, B.; Rignot, E.; Sutterley, T.; van den Broeke, M.; van Wessem, M.; et al. Continuity of ice sheet mass loss in Greenland and Antarctica from the GRACE and GRACE Follow-On missions. Geophys. Res. Lett. 2020, 47, e2020GL087291. [Google Scholar] [CrossRef]
  27. Osborn, T.J. Winter 2009/2010 temperatures and a record-breaking North Atlantic Oscillation index. Weather 2011, 66, 19–21. [Google Scholar] [CrossRef]
  28. Bettadpur, S. UTCSR Level-2 Processing Standards Document for Level-2 Product Release 0006; Technical Report, GRACE 327–742 (Rev 5.0); Center for Space Research, The University of Texas: Austin, TA, USA, 2018. [Google Scholar]
  29. Yuan, D.-N. JPL Level-2 Processing Standards Document for Level-2 Product Release 06; GRACE 327–744; Jet Propulsion Laboratory, California Institute of Technology: Pasadena, CA, USA, 2018. [Google Scholar]
  30. Dahle, C.; Flechtner, F.; Murböck, M.; Michalak, G.; Neumayer, H.; Abrykosov, O.; Reinhold, A.; König, R. GRACE Geopotential GSM Coefficients GFZ RL06; V. 6.0. GFZ Data Services; GeoForschungsZentrum Potsdam: Potsdam, Germany, 2018; Available online: https://podaac.jpl.nasa.gov/announcements/2018-07-16_UTCSR/JPL_GRACE_Level-2_RL06_datasets_release (accessed on 3 August 2018).
  31. Yi, S.; Sneeuw, N. Filling the Data Gaps Within GRACE Missions Using Singular Spectrum Analysis. J. Geophys. Res. Solid Earth 2021, 126, 1–22. [Google Scholar] [CrossRef]
  32. Richter, H.M.P.; Lück, C.; Klos, A.; Sideris, M.G.; Rangelova, E.; Kusche, J. Reconstructing GRACE-type time-variable gravity from the Swarm satellites. Sci. Rep. 2021, 11, 1117. [Google Scholar] [CrossRef] [PubMed]
  33. Loomis, B.D.; Rachlin, K.E.; Luthcke, S.B. Improved Earth oblateness rate reveals increased ice sheet losses and mass-driven sea level rise. Geophys. Res. Lett. 2019, 46, 6910–6917. [Google Scholar] [CrossRef]
  34. Loomis, B.D.; Rachlin, K.E.; Wiese, D.; Landerer, F.; Luthcke, S.B. Replacing GRACE/GRACE-FO C30 with satellite laser ranging: Impacts on Antarctic Ice Sheet mass change. Geophys. Res. Lett. 2020, 47, e2019GL085488. [Google Scholar] [CrossRef]
  35. Su, X.; Guo, J.; Shum, C.K.; Luo, Z.; Zhang, Y. Increased low degree spherical harmonic influences on polar ice sheet mass change derived from GRACE Mission. Remote Sens. 2020, 12, 4178. [Google Scholar] [CrossRef]
  36. Sun, Y.; Riva, R.; Ditmar, P. Optimizing estimates of annual variations and trends in geocenter motion and J2 from a combination of GRACE data and geophysical models. J. Geophys. Res. Solid Earth 2016, 121, 8352–8370. [Google Scholar] [CrossRef]
  37. van der Wal, W.; Kurtenbach, E.; Kusche, J.; Vermeersen, B. Radial and tangential gravity rates from GRACE in areas of glacial isostatic adjustment. Geophys. J. Int. 2011, 187, 797–812. [Google Scholar] [CrossRef]
  38. Jekeli, C. Alternative Methods to Smooth the Earth’s Gravity Field; Report No. 327; Geodetic and GeoInformation Science Department of Civil and Environmental Engineering and Geodetic Science, The Ohio State University: Columbus, OH, USA, 1981. [Google Scholar]
  39. Guo, J.Y.; Duan, X.J.; Shum, C.K. Non-isotropic Gaussian smoothing and leakage reduction for determining mass changes over land and ocean using GRACE data. Geophys. J. Int. 2010, 181, 290–302. [Google Scholar] [CrossRef]
  40. van den Broeke, M.R.; Bamber, J.; Ettema, J.; Rignot, E.; Schrama, E.; van den Berg, W.J.; van Meijgaard, E.; Velicogna, I.; Wouters, B. Partitioning recent Greenland mass loss. Science 2009, 326, 984–986. [Google Scholar] [CrossRef]
  41. Mankoff, K.D.; Solgaard, A.; Colgan, W.; Ahlstrøm, A.P.; Khan, S.A.; Fausto, R.S. Greenland Ice Sheet solid ice discharge from 1986 through March 2020. Earth Syst. Sci. Data 2020, 12, 1367–1383. [Google Scholar] [CrossRef]
  42. Bevis, M.; Harig, C.; Khan, S.A.; Brown, A.; Simons, F.J.; Willis, M.; Fettweis, X.; van den Broeke, M.R.; Madsen, F.B.; Kendrick, E.; et al. Accelerating changes in ice mass within Greenland, and the ice sheet’s sensitivity to atmospheric forcing. Proc. Natl. Acad. Sci. USA 2019, 116, 1934–1939. [Google Scholar] [CrossRef]
  43. Van Angelen, J.H.; Van Den Broeke, M.R.; Wouters, B.; Lenaerts, J.T.M. Contemporary (1960–2012) Evolution of the Climate and Surface Mass Balance of the Greenland Ice Sheet. Surv. Geophys. 2014, 35, 1155–1174. [Google Scholar] [CrossRef]
  44. Zou, F.; Tenzer, R.; Fok, H.S.; Nichol, J.E. Recent climate change feedbacks to greenland ice sheet mass changes from grace. Remote Sens. 2020, 12, 3250. [Google Scholar] [CrossRef]
Figure 1. Monthly non-cumulative mass change time series of the GrIS derived separately from GRACE/GRACE-FO gravimetry and the MBM during 2002–2020.
Remotesensing 14 04442 g001
Figure 2. GRACE/GRACE-FO-derived non-cumulative mass change of the GrIS in the same month but different years (2002–2020). Non-cumulative mass change of the GrIS from January–March (a), April–June (b), July–September (c), October–December (d).
Remotesensing 14 04442 g002
Figure 3. Seasonal mass variations of the GrIS derived from GRACE/GRACE-FO data during 2002–2020.
Remotesensing 14 04442 g003
Figure 4. Spatial distribution of seasonal mass variations over the GrIS in 2012 (ad), 2013 (eh), 2019 (il), and 2020 (mp). Note, the following abbreviations are used: South West (SW), West (W), North West (NW), North (N), North East (NE), East (E), and South East (SE).
Remotesensing 14 04442 g004
Figure 5. (a) Annual mass variations of the GrIS, with blue bars indicating those from GRACE/GRACE-FO and red bars those from the MBM. (b) Mass accumulation (blue dotted line), mass loss (red dotted line) at annual timescale and total annual mass change (black dotted line) of the GrIS.
Remotesensing 14 04442 g005
Figure 6. Spatial distribution of annual mass variations of the GrIS during the period from 2003 to 2020 (excluding 2017 and 2018). The spatial distribution of annual mass variation over GrIS from 2003–2006 (ad), 2007–2010 (eh), 2011–2014 (il), 2015–2020 (mp), excluding 2017 and 2018.
Remotesensing 14 04442 g006
Figure 7. The factors impacting mass change of the GrIS. The following abbreviations are used: total precipitation ( P t o t , magenta with asterisk), meltwater runoff ( R U , blue line with asterisk), sublimation ( S U , green line with asterisk), and erosion/deposition ( E d s , black line with asterisk), discharge (yellow line with asterisk), and temperature (red line).
Remotesensing 14 04442 g007
Figure 8. The contribution of factors including P t o t , R U , S U , and E d s as well as ice discharge to monthly mass variations of the GrIS in each month during 2002–2020. The ratio was computed by absolute value of the mean of each factor at each month divided by the corresponding M t o t .
Remotesensing 14 04442 g008
Figure 9. Summer mass change (blue line with rhombus) observed by GRACE/GRACE-FO and summer SMB (black line with asterisk) of the GrIS and summer NAO (sNAO) index (red line with circle).
Remotesensing 14 04442 g009
Table 1. Partitioning seasonal mass change into seasonal mass accumulation and seasonal mass loss in each year.
YearSeasonal Mass Accumulation [Gt]Seasonal Mass Loss [Gt]
SpringSummerAutumnWinterSpringSummerAutumnWinter
2003123.63042.5039.050−340.13−34.28−11.92
200481.30043.8371.82−16.64−223.72−48.00−7.81
200565.69019.1684.43−2.79−316.92−83.890
200628.4626.4747.8733.46−14.87−225.14−64.10−6.41
200755.92025.15105.4−9.45−349.18−69.31−0.87
200849.56065.35139.69−41.47−319.56−43.15−45.35
200925.386.0226.93109.25−19.49−292.59−75.87−24.33
201066.67074.1552.37−27.77−450.42−93.070
201121.45010.0560.07−2.02−392.52−70.32−31.22
201288.21062.5075.33−22.52−490.59−124.470
201357.6738.42071.06−10.16−140.07−51.38−16.11
201480.89076.6678.470−363.42−13.430
20158.76045.56111.66−21.79−310.17−32.10−70.45
2016111.980167.54128.970−437.95−4.45−62.85
201917.2713.0091.26156.75−57.15−485.75−82.940
202073.900180.96166.27−160.49−397.650−98.75
Publisher’s Note: MDPI stays neutral with regard to jurisdictional claims in published maps and institutional affiliations.

