Technical Note

Reference Data Accuracy Impacts Burned Area Product Validation: The Role of the Expert Analyst

by
Magí Franquesa
1,*,
Armando M. Rodriguez-Montellano
2,3,
Emilio Chuvieco
1 and
Inmaculada Aguado
1
1
Environmental Remote Sensing Research Group, Department of Geology, Geography and Environment, University of Alcalá UAH, C/Colegios 2, 28801 Alcalá de Henares, Spain
2
Fundación Amigos de la Naturaleza—FAN, km 7.5 Carretera a la Guardia, Santa Cruz 2241, Bolivia
3
Facultad de Ciencias Agrícolas, Universidad Autónoma Gabriel René Moreno, El Vallecito km 9 carretera al Norte, Santa Cruz 2489, Bolivia
*
Author to whom correspondence should be addressed.
Remote Sens. 2022, 14(17), 4354; https://doi.org/10.3390/rs14174354
Submission received: 4 August 2022 / Revised: 30 August 2022 / Accepted: 31 August 2022 / Published: 2 September 2022

Abstract

:
Accurate reference data to validate burned area (BA) products are crucial to obtaining reliable accuracy metrics for such products. However, the accuracy of reference data can be affected by numerous factors; hence, we can expect some degree of deviation with respect to real ground conditions. Since reference data are usually produced by semi-automatic methods, where human-based image interpretation is an important part of the process, in this study, we analyze the impact of the interpreter on the accuracy of the reference data. Here, we compare the accuracy metrics of the FireCCI51 BA product obtained from reference datasets that were produced by different analysts over 60 sites located in tropical regions of South America. Additionally, fire severity, tree cover percentage, and canopy height were selected as explanatory sources of discrepancies between interpreters’ reference BA classifications. We found significant differences between the FireCCI51 accuracy metrics obtained with the different reference datasets. The highest accuracies (highest Dice coefficient) were obtained with the reference dataset produced by the most experienced interpreter. The results indicated that fire severity is the main source of discrepancy between interpreters. Disagreement between interpreters was more likely to occur in areas with low fire severity. We conclude that the training and experience of the interpreter play a crucial role in guaranteeing the quality of the reference data.

Graphical Abstract

1. Introduction

Burned area (BA) products are an essential source of information to understand the role of fire in ecosystems [1], the links between fire and climate change [2,3], and its impacts on biodiversity [4,5] and on health and human properties [6,7]. Remote sensing has provided an accessible, cost-effective, and systematic way to obtain images of the entire Earth’s surface, from which it is possible to generate cartographic products of numerous biophysical phenomena of the Earth system, among which we find global and regional BA products. However, these satellite-derived products, commonly produced from automatic classification algorithms, are subject to errors and uncertainties that should be quantified if they are to be reliably used. This accuracy assessment process implies comparing BA detections with reference data that are assumed to be the best representation available of ground conditions. For this reason, reference data are commonly derived from reliable sources, which are commonly higher-resolution images than those used to generate the product evaluated. This process usually uses supervised classification procedures, followed by visual inspection by expert analysts [8]. Although very-high-resolution commercial satellite images are now widely available, they are not systematically acquired and may be expensive to analyze, and therefore medium-resolution imagery (i.e., 10–30 m) is most commonly used to produce reference data for the validation of global to regional BA products.
Despite the efforts dedicated to generating highly accurate reference data for validation activities, obtaining perfect, error-free reference data is, in practical terms, unrealistic. In this sense, numerous factors can affect the accuracy of reference burned area data [9]. The most significant are: (i) image quality: image artifacts or anomalies such as banding, dropped scan lines, or detector failures, as well as cloud and cloud shadow contamination, topographic shadows, or snow and ice that may compromise the image suitability for a specific application; (ii) landscape composition: land cover classes with a spectral response similar to burned areas (e.g., harvested fields, water surfaces, cloud shadows or dark soils) are known as sources of error affecting burned area mapping [10,11,12,13]; (iii) fire size and severity: small fire patches are more difficult to detect [14] and low-severity burned areas may have poor separability from unburned areas [12]; (iv) image availability: since burned reference data are commonly derived from multitemporal image comparison (e.g., two Landsat scenes) [15,16], the lower the availability of reliable images for a particular site, the greater the temporal separation between images, and the greater this temporal separation, the greater the probability that the burned signal will weaken or disappear due to vegetation recovery [17], thus affecting the ability to properly detect and map the reference burned areas [8,15,18,19,20,21].
There is, however, one critical factor affecting the accuracy of the reference data that is often neglected and that is related to the subjectivity of the image interpreter. Virtually all BA validation studies explicitly mention that the reference data were generated and visually inspected by one or more expert or trained image analysts [16,18,20,22,23,24,25], which is considered a guarantee of data quality. However, the generation of reference data is a complex task that requires a high degree of expertise. The analyst in charge of generating the reference data must be able to assess whether an image is reliable and to identify, with the minimum possible margin of error, the burned and unburned areas that will be selected to train a supervised classification algorithm, a task which can be especially challenging depending on the conditions of the study or validation area. Ultimately, since a full independent accuracy assessment of the reference BA data is generally not feasible due to the lack of a more accurate data source or project resource limitations, the analyst should be able to judge whether the reference data have the consistency and quality to be used in a validation exercise.
The issue of the reference BA data accuracy was previously addressed by Roy et al. [16], who recognized that image interpretation should be conducted by expert analysts, and provided a very valuable recommendation to maximize the accuracy of the reference data, which was to use multitemporal image comparison to map the reference BA, instead of using single images. This recommendation was further developed to provide a standard protocol to derive reference BA data, which was adopted by the Committee on Earth Observation Satellites (CEOS) [15]. More recently, the implementation of reference BA production tools in cloud-based platforms such as Google Earth Engine (GEE) [26] facilitated the process and the workload involved in reference data generation, providing a tool that can be used as a standard procedure by the scientific community. However, while we can expect that the standardization of protocols and the development of reference data generation tools will benefit the quality of the reference data, it cannot be ignored that human-based interpretation is a fundamental part of reference data production and it is necessarily dependent on the expertise of the interpreters.
This study aims to draw attention to the image interpreter’s key role in the validation process. Here, we compare the accuracy metrics of the FireCCI51 BA product [23], generated from MODIS images at 250 m spatial resolution, using reference datasets derived from Sentinel-2 images that were produced independently by different interpreters within 60 sites located in the Amazon Socio-Environmental Information Network (RAISG) area (https://www.amazoniasocioambiental.org/en/, accessed on 30 July 2022). In addition, several variables were statistically analyzed to identify the sources of discrepancies between interpreters when defining reference BA, including the difference Normalized Burned Area index (dNBR) as a function of the fire severity, the vegetation continuous field (VCF) from the MOD44B Version 6 VCF product [27], and the canopy height from the Global Forest Canopy Height (GFCH) dataset [28].

2. Materials and Methods

2.1. Study Area

The area selected for this study corresponds to the area delimited by the RAISG project, which includes the Amazon basin, most of the Bolivian territory except the Andean region, and part of the Brazilian Cerrado, which is a highly fire-prone area. The total area of RAISG covers a vast extension of 8,274,432 km2 and includes three major biomes according to the 2017 map of the Terrestrial Ecoregions of the World [29]: temperate savanna (118,909 km2), tropical savanna (1,322,824 km2), and tropical forest (6,951,490 km2) (Figure 1).

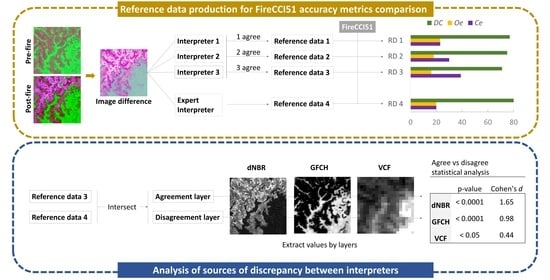
2.2. Reference Burned Area Data Production

Under the RAISG project, a Sentinel-2-based BA product, named AQS2GEE, was developed for the entire region for the year 2019. Reference burned areas, based on the same sensor, were produced to validate such a product. To select the reference sites, a grid of 10 km × 10 km cells was created to divide the entire RAISG region into non-overlapping areas. The resulting grid contained a total of 69,729 cells, of which all those that met the following criteria were excluded: (i) cells that did not intersect any active fire according to the VIIRS (S-NPP) I Band 375 m Active Fire Product NRT (VNP14IMGTDL_NRT) (https://earthdata.nasa.gov/earth-observation-data/near-real-time/firms/v1-vnp14imgt, accessed on 30 July 2022) for the 2019 year; (ii) cells that did not intersect any burned area according to the FireCCI51 BA product (https://catalogue.ceda.ac.uk/uuid/58f00d8814064b79a0c49662ad3af537, accessed on 30 July 2022) during 2019; (iii) cells that intersected two or more biomes according to the Ecoregions 2017 map product [29] (https://ecoregions.appspot.com/, accessed on 30 July 2022); (iv) cells that intersect two or more Sentinel-2 tiles, and (v) cells without availability of images with cloud cover less than 20% (i.e., the maximum cloud cover allowed) and a maximum time gap between them of 35 days. Of the total number of cells that did not meet the above criteria, 5% of cells for each biome were randomly selected, providing a total of 100 reference sites (Figure 1). We should note that since the primary goal of the present study was to show how the subjectivity of analysts can influence reference data accuracy and therefore affect accuracy assessment metrics, we explain here how sites were selected, but whether the criteria adopted for the sampling design were appropriate or not was irrelevant in our study.
Reference BA perimeters were extracted for each reference site from the multitemporal comparison of Sentinel-2 images. For this purpose, a supervised burned area classification algorithm (BAMT) implemented in the Google Earth Engine cloud computing platform was used [26]. The reference files, generated from images corresponding to July and August, i.e., the period of highest fire activity [30,31], included burned, unburned, and no-data areas, the latter corresponding to unobserved areas due to the presence of clouds, cloud shadows, or water surfaces. To generate the reference data, a group of inexperienced interpreters was first trained to ensure the quality of the data. Using the mentioned BAMT tools, each site was independently interpreted by three of the trained interpreters of the RAISG project validation team (the three interpreters were not always the same for all reference sites). For clarification, it should be noted that the interpreters used the same classification algorithm and input images, which ensured that the burned area classification discrepancies were due to the training areas selected by each interpreter.
Following the approach of Vanderhoof et al. [25], the three reference BA datafiles produced for each site were then used to create three reference BA data collections. Thus, for reference data collection 1 (RDc1), all those pixels classified as burned by at least one interpreter were considered burned (1 agreed); for RDc2, pixels were considered burned if at least two interpreters agreed that a given pixel was burned (2 agreed), and for RDc3, pixels were considered burned when the three interpreters agreed that a given pixel was burned (3 agreed). In all three collections, pixels not considered burned were assigned to the unburned category, and unobserved pixels by any of the interpreters were kept as such (Figure 2).
Additionally, and following the same reference BA data production procedures as the RAISG validation team, an external independent and highly experienced analyst produced, specifically for this study, a fourth reference dataset (Figure 2). From our experience, we have observed that inexperienced interpreters usually tend to select for training those burned areas (pixels) that can be easily identified as burned, which causes the omission of those areas with a weaker burned signal. Therefore, it is expected that the experienced analyst will be able to identify a wider range of burned pixels, which would result in higher accuracy of the reference data.
To ensure that differences between the four reference datasets (i.e., the three RDc’s and the external reference dataset) were not introduced by the interpretation of cloudy images, only those reference sites without unobserved pixels were selected; thus, 40 of the initial 100 sites were discarded (Figure 1).

2.3. Accuracy Metrics Comparison

To quantify the impact of using different reference datasets on the accuracy metrics obtained from the validation of a BA product, the external reference dataset and each of the three reference collections were compared with the FireCCI51 BA product. To do this, the BA product was clipped and filtered using the date of burn detection layer (i.e., day of the year from 1 to 366) to match the spatial extent and period covered by each reference data file, and then intersected with the reference data in vectorial format to obtain the areas of agreement and disagreement between them at each of the 60 sites (i.e., the remaining sites after discarding the 40 cloud-contaminated sites). Error matrices populated with those areas of agreement and disagreement were then summarized to obtain the commonly used accuracy metrics in BA product assessment: commission error (Ce), omission error (Oe), and Dice Coefficient (DC) [32]. The accuracy metrics obtained with each of the three collections were statistically compared with those obtained with the external reference dataset using the Student’s t-test.

2.4. Analysis of Sources of Discrepancy between Interpreters

To analyze the sources of discrepancy between the reference datasets, we used the RDc3 and the external reference dataset. Both reference datasets were intersected to obtain the areas of agreement and areas of disagreement in the form of vector layers. We selected several variables as explanatory factors for classification discrepancies between interpreters, including the dNBR, VCF, and GFCH. These variables were extracted for the agreement and disagreement layers to test for statistically significant differences. Thus, the distribution of such variables in agreement versus disagreement layers was tested for significant differences with the t-test and the effect size was computed with Cohen’s d, which complements the statistical hypothesis testing by providing a measure of the magnitude of the difference between groups.
dNBR images were generated in the GEE cloud computing platform. The NBR band of the pre- and post-images used to extract the fire reference perimeters and their difference (dNBR = NBRpre − NBRpost) were computed for each reference site. The VCF product (https://lpdaac.usgs.gov/products/mod44bv006/, accessed on 30 July 2022) is a yearly global 250 m spatial resolution product that offers information about surface vegetation cover and provides three layers: percent tree cover, percent non-tree cover, and percent non-vegetated (bare soil). For this study, only the percent tree cover band was used. The GFCH (https://glad.umd.edu/dataset/gedi, accessed on 30 July 2022) is a global 30 m spatial resolution dataset available for the year 2019 that integrates lidar and Landsat optical time-series data and offers a single band with continuous data of vegetation.
From this analysis, we expect that areas of low burned severity would be more difficult to identify than high severity burned areas, a fairly common situation at the edges of burned areas. Similarly, vegetation areas with dense and high tree layers could hide the burned signal of lower strata, thus making their identification more difficult by the analysts.

3. Results

3.1. Accuracy Metrics Comparison

Figure 3 shows the FireCCI51 BA accuracy metric distribution derived from each reference data collection and the external reference dataset for the 60 sites, and Table 1 shows the FireCCI51 BA product overall accuracy metrics for the selected sites. It should be noted that the accuracies reported in this section are intended to allow comparison between analysts and should not be interpreted as the results of a validation exercise of the FireCCI51 product for the RAISG region.
The highest accuracy (DC = 80) was obtained with the reference data generated by the external analyst. Accuracy metrics derived with the RDc1 were similar to those obtained with the external dataset; however, accuracy decreased when using RDc2 (DC = 75) and RDc3 (DC = 71). We observe the highest Ce value for the more conservative reference dataset (RDc3)—that is, when we consider a pixel burned if it was classified as burned by the three interpreters. The opposite occurs with Oe, whose values decreased from the more liberal reference dataset (1 agreed) to the more conservative one (3 agreed). It should be noted that, for our reference sites, the impact of the reference data accuracy was greater on Ce than on Oe. In this sense, while the Oe obtained with RDc3 was only 4 percentage points lower than that obtained with the external RD, Ce was 19 percentage points higher when using RDc3 (Ce = 39) compared to the Ce obtained with the external reference dataset (Ce = 20). The significance test did not show differences for omission error values obtained from each of the three collections with respect to those obtained from the external reference data collection. However, significant differences were found for commission errors between RDc2 (p-value < 0.01) and RDc3 (p-value < 0.0001) with respect to the external RD. Regarding the DC, only the RDc3 showed significant differences when compared to the external RD (Table 1).

3.2. Analysis of the Sources of Discrepancy between Interpreters

The results of the statistical analysis of the three variables (dNBR, VCF, and GFCH) considered as explanatory factors of the discrepancies between the classifications of the different interpreters are shown in Table 2. The variable that showed a higher significant difference between its distribution in agreement versus disagreement layers was the dNBR (p-value < 0.0001, d = 1.65), followed by GFCH (p-value < 0.0001, d = 0.98), while VCF showed a lower significance (p-value = 0.03) and a weaker magnitude of d (d = 0.44).

4. Discussion

This paper highlights the importance of the interpreter’s expertise in generating BA reference perimeters for validation. We quantified the impact of using several reference datasets, independently generated by different analysts, on the accuracy metrics obtained for a widely used BA product, the FireCCI51. To understand the causes of reference data variability introduced by the analysts, the dNBR, VCF, and GFCH variables were used to test for significant differences between their distribution in agreement and disagreement layers.
Our results showed that the accuracy metrics obtained for a specific BA product can be significantly altered depending on the accuracy of the reference data. Thus, in our study, we found that Ce ranged from 20% with the external dataset to 39% with the RDc3 collection and Oe ranged from 16% with the RDc3 to 23% with the RDc1 collection. These results also suggest that the generation of reference data by several interpreters where conservative criteria are adopted (i.e., interpreters should agree on whether a pixel is burned in order to consider it as burned) does not necessarily imply a guarantee of reference data quality. On the contrary, this practice could be favoring an underestimation of the reference BA by prioritizing those areas that present less uncertainty of being burned. Using such reference data would tend to increase commission errors and decrease omission errors of a specific BA product, as we have observed in our results.
The analysis of the variables that could explain the discrepancies between the classifications of different interpreters revealed that fire severity (dNBR) and the height of the forest canopy (GFCH) were important drivers of these differences. As expected, those areas where the burned signal was stronger were more easily identified by the interpreters and therefore selected to train the BA classification algorithms, while low-severity areas generated greater uncertainty when deciding whether they were burned or unburned.
Another factor that could affect the accuracy of the reference data that has not been analyzed in this study is the persistence of the BA signal over time, which depends on the fire severity, fire size, land cover type, time of burning, and weather conditions. Thus, areas where the BA signal remains strong for long periods, such as boreal regions, would be expected to be more easily and more accurately interpreted than areas characterized by fast vegetation recovery coupled with poor reliable image availability, such as the tropics. In this regard, differences between interpreters’ reference BA classifications are expected to vary across regions with different fire regimes.
From our experience, the correct identification of low-severity burned areas and their inclusion as training areas is crucial and can make the difference between an accurate or an inappropriate reference dataset for validation. From our point of view, apart from following the established recommendations and standard protocols, the best guarantee to reduce errors in the reference data is undoubtedly to invest in interpreter training and produce the reference data by an experienced interpreter. A good understanding of the classification algorithm or tool used to generate the reference perimeters is also crucial. For example, use of the BAMT tool often requires multiple iterations of training, followed by visual inspection to obtain the most accurate results [26], and manual editing is sometimes needed to remove commission errors from the reference data. Additionally, the ideal expert interpreter should also have regional knowledge with field observation experience, which can be of great help when interpreting satellite imagery.
Although our study suggests that the most liberal criterion (i.e., combining pixels classified as burned by all the interpreters) is the one that most closely matched the reference dataset produced by the external and experienced interpreter, when different interpreters are involved in the validation process, supervision by an expert interpreter would be always recommended.
Ultimately, a good practice in remote sensing product validation would be to publish the reference data in easily accessible repositories, which constitutes an exercise in transparency, thus offering the possibility of verifying the reliability of the reference data.

Author Contributions

Conceptualization, M.F.; methodology, M.F.; formal analysis, M.F.; investigation, M.F. and A.M.R.-M.; writing—original draft preparation, M.F.; writing—review and editing, M.F., A.M.R.-M., I.A. and E.C.; project administration, I.A.; funding acquisition, I.A. and E.C. All authors have read and agreed to the published version of the manuscript.

Funding

This research was funded by the MCIU/AEI/FEDER, UE, RTI2018-097538-B-I00, Global analysis of human factors of fire risk (AnthropoFire Project), and the Climate Change Initiative (CCI) Fire_cci project (Contract 4000126706/19/I-NB).

Data Availability Statement

The reference datasets used in this study are available upon request.

Acknowledgments

We would like to thank M. Lucrecia Pettinari and the reviewers for their suggestions and comments, which allowed us to improve the original manuscript.

Conflicts of Interest

The authors declare no conflict of interest.

References

  1. Bond, W.J.; Woodward, F.I.; Midgley, G.F. The global distribution of ecosystems in a world without fire. New Phytol. 2005, 165, 525–538. [Google Scholar] [CrossRef] [PubMed]
  2. Langmann, B.; Duncan, B.; Textor, C.; Trentmann, J.; van der Werf, G.R. Vegetation fire emissions and their impact on air pollution and climate. Atmos. Environ. 2009, 43, 107–116. [Google Scholar] [CrossRef]
  3. Dong, X.; Li, F.; Lin, Z.; Harrison, S.P.; Chen, Y.; Kug, J.-S. Climate influence on the 2019 fires in Amazonia. Sci. Total Environ. 2021, 794, 148718. [Google Scholar] [CrossRef] [PubMed]
  4. Kelly, L.; Brotons, L. Using fire to promote biodiversity. Science 2017, 355, 1264–1265. [Google Scholar] [CrossRef]
  5. Kelly, L.; Giljohann, K.; Duane, A.; Aquilué, N.; Archibald, S.; Batllori, E.; Bennett, A.; Buckland, S.; Canelles, Q.; Clarke, M.; et al. Fire and biodiversity in the Anthropocene. Science 2020, 370, eabb0355. [Google Scholar] [CrossRef]
  6. Bowman, D.; Williamson, G.; Abatzoglou, J.; Kolden, C.A.; Cochrane, M.; Smith, A.M.S. Human exposure and sensitivity to globally extreme wildfire events. Nat. Ecol. Evol. 2017, 1, 58. [Google Scholar] [CrossRef]
  7. Turco, M.; Jerez, S.; Augusto, S.; Tarín-Carrasco, P.; Ratola, N.; Jiménez-Guerrero, P.; Trigo, R.M. Climate drivers of the 2017 devastating fires in Portugal. Sci. Rep. 2019, 9, 13886. [Google Scholar] [CrossRef]
  8. Franquesa, M.; Vanderhoof, M.K.; Stavrakoudis, D.; Gitas, I.Z.; Roteta, E.; Padilla, M.; Chuvieco, E. Development of a standard database of reference sites for validating global burned area products. Earth Syst. Sci. Data 2020, 12, 3229–3246. [Google Scholar] [CrossRef]
  9. Chuvieco, E. Fundamentals of Satellite Remote Sensing: An Environmental Approach, 3rd ed.; CRC Press: Boca Raton, FL, USA, 2020. [Google Scholar]
  10. Bastarrika, A.; Chuvieco, E.; Martín, M.P. Mapping burned areas from Landsat TM/ETM+ data with a two-phase algorithm: Balancing omission and commission errors. Remote Sens. Environ. 2011, 115, 1003–1012. [Google Scholar] [CrossRef]
  11. Chuvieco, E.; Mouillot, F.; van der Werf, G.R.; San Miguel, J.; Tanasse, M.; Koutsias, N.; García, M.; Yebra, M.; Padilla, M.; Gitas, I.; et al. Historical background and current developments for mapping burned area from satellite Earth observation. Remote Sens. Environ. 2019, 225, 45–64. [Google Scholar] [CrossRef]
  12. Pereira, J.M.; Sá, A.C.; Sousa, A.M.; Silva, J.M.; Santos, T.N.; Carreiras, J.M. Spectral characterisation and discrimination of burnt areas. In Remote Sensing of Large Wildfires; Springer: Berlin/Heidelberg, Germany, 1999; pp. 123–138. [Google Scholar]
  13. Trigg, S.; Flasse, S. An evaluation of different bi-spectral spaces for discriminating burned shrub-savannah. Int. J. Remote Sens. 2001, 22, 2641–2647. [Google Scholar] [CrossRef]
  14. Campagnolo, M.L.; Libonati, R.; Rodrigues, J.A.; Pereira, J.M.C. A comprehensive characterization of MODIS daily burned area mapping accuracy across fire sizes in tropical savannas. Remote Sens. Environ. 2021, 252, 112115. [Google Scholar] [CrossRef]
  15. Boschetti, L.; Roy, D.; Justice, C. International Global Burned Area Satellite Product Validation Protocol Part I—Production and Standardization of Validation Reference Data (to Be Followed by Part II—Accuracy Reporting); Committee on Earth Observation Satellites: Silver Spring, MD, USA, 2009. [Google Scholar]
  16. Roy, D.P.; Frost, P.G.H.; Justice, C.O.; Landmann, T.; Le Roux, J.L.; Gumbo, K.; Makungwa, S.; Dunham, K.; Du Toit, R.; Mhwandagara, K.; et al. The Southern Africa Fire Network (SAFNet) regional burned-area product-validation protocol. Int. J. Remote Sens. 2005, 26, 4265–4292. [Google Scholar] [CrossRef]
  17. Melchiorre, A.; Boschetti, L. Global Analysis of Burned Area Persistence Time with MODIS Data. Remote Sens. 2018, 10, 750. [Google Scholar] [CrossRef]
  18. Boschetti, L.; Roy, D.P.; Giglio, L.; Huang, H.; Zubkova, M.; Humber, M.L. Global validation of the collection 6 MODIS burned area product. Remote Sens. Environ. 2019, 235, 111490. [Google Scholar] [CrossRef]
  19. Padilla, M.; Stehman, S.V.; Chuvieco, E. Validation of the 2008 MODIS-MCD45 global burned area product using stratified random sampling. Remote Sens. Environ. 2014, 144, 187–196. [Google Scholar] [CrossRef]
  20. Padilla, M.; Stehman, S.; Litago, J.; Chuvieco, E. Assessing the Temporal Stability of the Accuracy of a Time Series of Burned Area Products. Remote Sens. 2014, 6, 2050. [Google Scholar] [CrossRef]
  21. Franquesa, M.; Lizundia-Loiola, J.; Stehman, S.V.; Chuvieco, E. Using long temporal reference units to assess the spatial accuracy of global satellite-derived burned area products. Remote Sens. Environ. 2022, 269, 112823. [Google Scholar] [CrossRef]
  22. Hawbaker, T.J.; Vanderhoof, M.K.; Schmidt, G.L.; Beal, Y.-J.; Picotte, J.J.; Takacs, J.D.; Falgout, J.T.; Dwyer, J.L. The Landsat Burned Area algorithm and products for the conterminous United States. Remote Sens. Environ. 2020, 244, 1–24. [Google Scholar] [CrossRef]
  23. Lizundia-Loiola, J.; Otón, G.; Ramo, R.; Chuvieco, E. A spatio-temporal active-fire clustering approach for global burned area mapping at 250 m from MODIS data. Remote Sens. Environ. 2020, 236, 111493. [Google Scholar] [CrossRef]
  24. Tanase, M.A.; Belenguer-Plomer, M.A.; Roteta, E.; Bastarrika, A.; Wheeler, J.; Fernández-Carrillo, Á.; Tansey, K.; Wiedemann, W.; Navratil, P.; Lohberger, S.; et al. Burned Area Detection and Mapping: Intercomparison of Sentinel-1 and Sentinel-2 Based Algorithms over Tropical Africa. Remote Sens. 2020, 12, 334. [Google Scholar] [CrossRef]
  25. Vanderhoof, M.K.; Fairaux, N.; Beal, Y.-J.G.; Hawbaker, T.J. Validation of the USGS Landsat Burned Area Essential Climate Variable (BAECV) across the conterminous United States. Remote Sens. Environ. 2017, 198, 393–406. [Google Scholar] [CrossRef]
  26. Roteta, E.; Bastarrika, A.; Franquesa, M.; Chuvieco, E. Landsat and Sentinel-2 Based Burned Area Mapping Tools in Google Earth Engine. Remote Sens. 2021, 13, 816. [Google Scholar] [CrossRef]
  27. DiMiceli, C.; Carroll, M.; Sohlberg, R.; Kim, D.; Kelly, M.; Townshend, J. MOD44B MODIS/Terra Vegetation Continuous Fields Yearly L3 Global 250 m SIN Grid V006; USGS: Reston, VA, USA, 2015. [Google Scholar] [CrossRef]
  28. Potapov, P.; Li, X.; Hernandez-Serna, A.; Tyukavina, A.; Hansen, M.C.; Kommareddy, A.; Pickens, A.; Turubanova, S.; Tang, H.; Silva, C.E.; et al. Mapping global forest canopy height through integration of GEDI and Landsat data. Remote Sens. Environ. 2021, 253, 112165. [Google Scholar] [CrossRef]
  29. Dinerstein, E.; Olson, D.; Joshi, A.; Vynne, C.; Burgess, N.D.; Wikramanayake, E.; Hahn, N.; Palminteri, S.; Hedao, P.; Noss, R.; et al. An Ecoregion-Based Approach to Protecting Half the Terrestrial Realm. BioScience 2017, 67, 534–545. [Google Scholar] [CrossRef]
  30. Alonso-Canas, I.; Chuvieco, E. Global burned area mapping from ENVISAT-MERIS and MODIS active fire data. Remote Sens. Environ. 2015, 163, 140–152. [Google Scholar] [CrossRef]
  31. Alves, D.B.; Pérez-Cabello, F. Multiple remote sensing data sources to assess spatio-temporal patterns of fire incidence over Campos Amazônicos Savanna Vegetation Enclave (Brazilian Amazon). Sci. Total Environ. 2017, 601–602, 142–158. [Google Scholar] [CrossRef] [PubMed]
  32. Dice, L.R. Measures of the amount of ecologic association between species. Ecology 1945, 26, 297–302. [Google Scholar] [CrossRef]
Figure 1. Amazon Socio-Environmental Information Network (RAISG) area. The figure shows the 100 reference sites (black + red) sampled to validate a Sentinel-2 burned area product produced within the RAISG project. Cloud-free reference data (red sites) were selected for the present study.
Remotesensing 14 04354 g001
Figure 2. Illustration of the reference datasets and reference data collection generation process. Pre- and post-fire images (RGB composition: SWIR-2, NIR, RED) were used to derive the image of difference, which was classified by each of the four interpreters. Reference datasets obtained for the three RAISG analysts were used to create the three reference data collections (RDc).
Remotesensing 14 04354 g002
Figure 3. Distribution of the FireCCI51 accuracy metrics across the 60 sites obtained with the external reference dataset and the three reference data collections.
Remotesensing 14 04354 g003
Table 1. FireCCI51 overall accuracy metrics (%) derived from the four reference datasets in the 60 selected sites within the RAISG study area. The level of significance between the accuracy metrics obtained from each RDc with respect the external RD is labelled by ** (p-value < 0.01) and **** (p-value < 0.0001).
RDc1RDc2RDc3External RD
Ce2330 **39 ****20
Oe23181620
DC777571 **80
Table 2. Mean, p-value of the t-test and Cohen’s d between dNBR, VCF, and GFCH values for agreement versus disagreement layers obtained from the reference data collection RDc3 and the external reference dataset.
AgreeDisagreeAgreement vs. Disagreement Layers
MeanMeanp-ValueCohen’s d
Severity (dNBR)0.30.2<0.00011.65
Vegetation Continuous Field (VCF)25.430.7<0.050.44
Global Forest Canopy High (GFCH)2.55.1<0.00010.98
Publisher’s Note: MDPI stays neutral with regard to jurisdictional claims in published maps and institutional affiliations.

