

An Improved Retrieval Method for Porphyra Cultivation Area Based on Suspended Sediment Concentration


Abstract
:
1. Introduction
2. Data and Methods
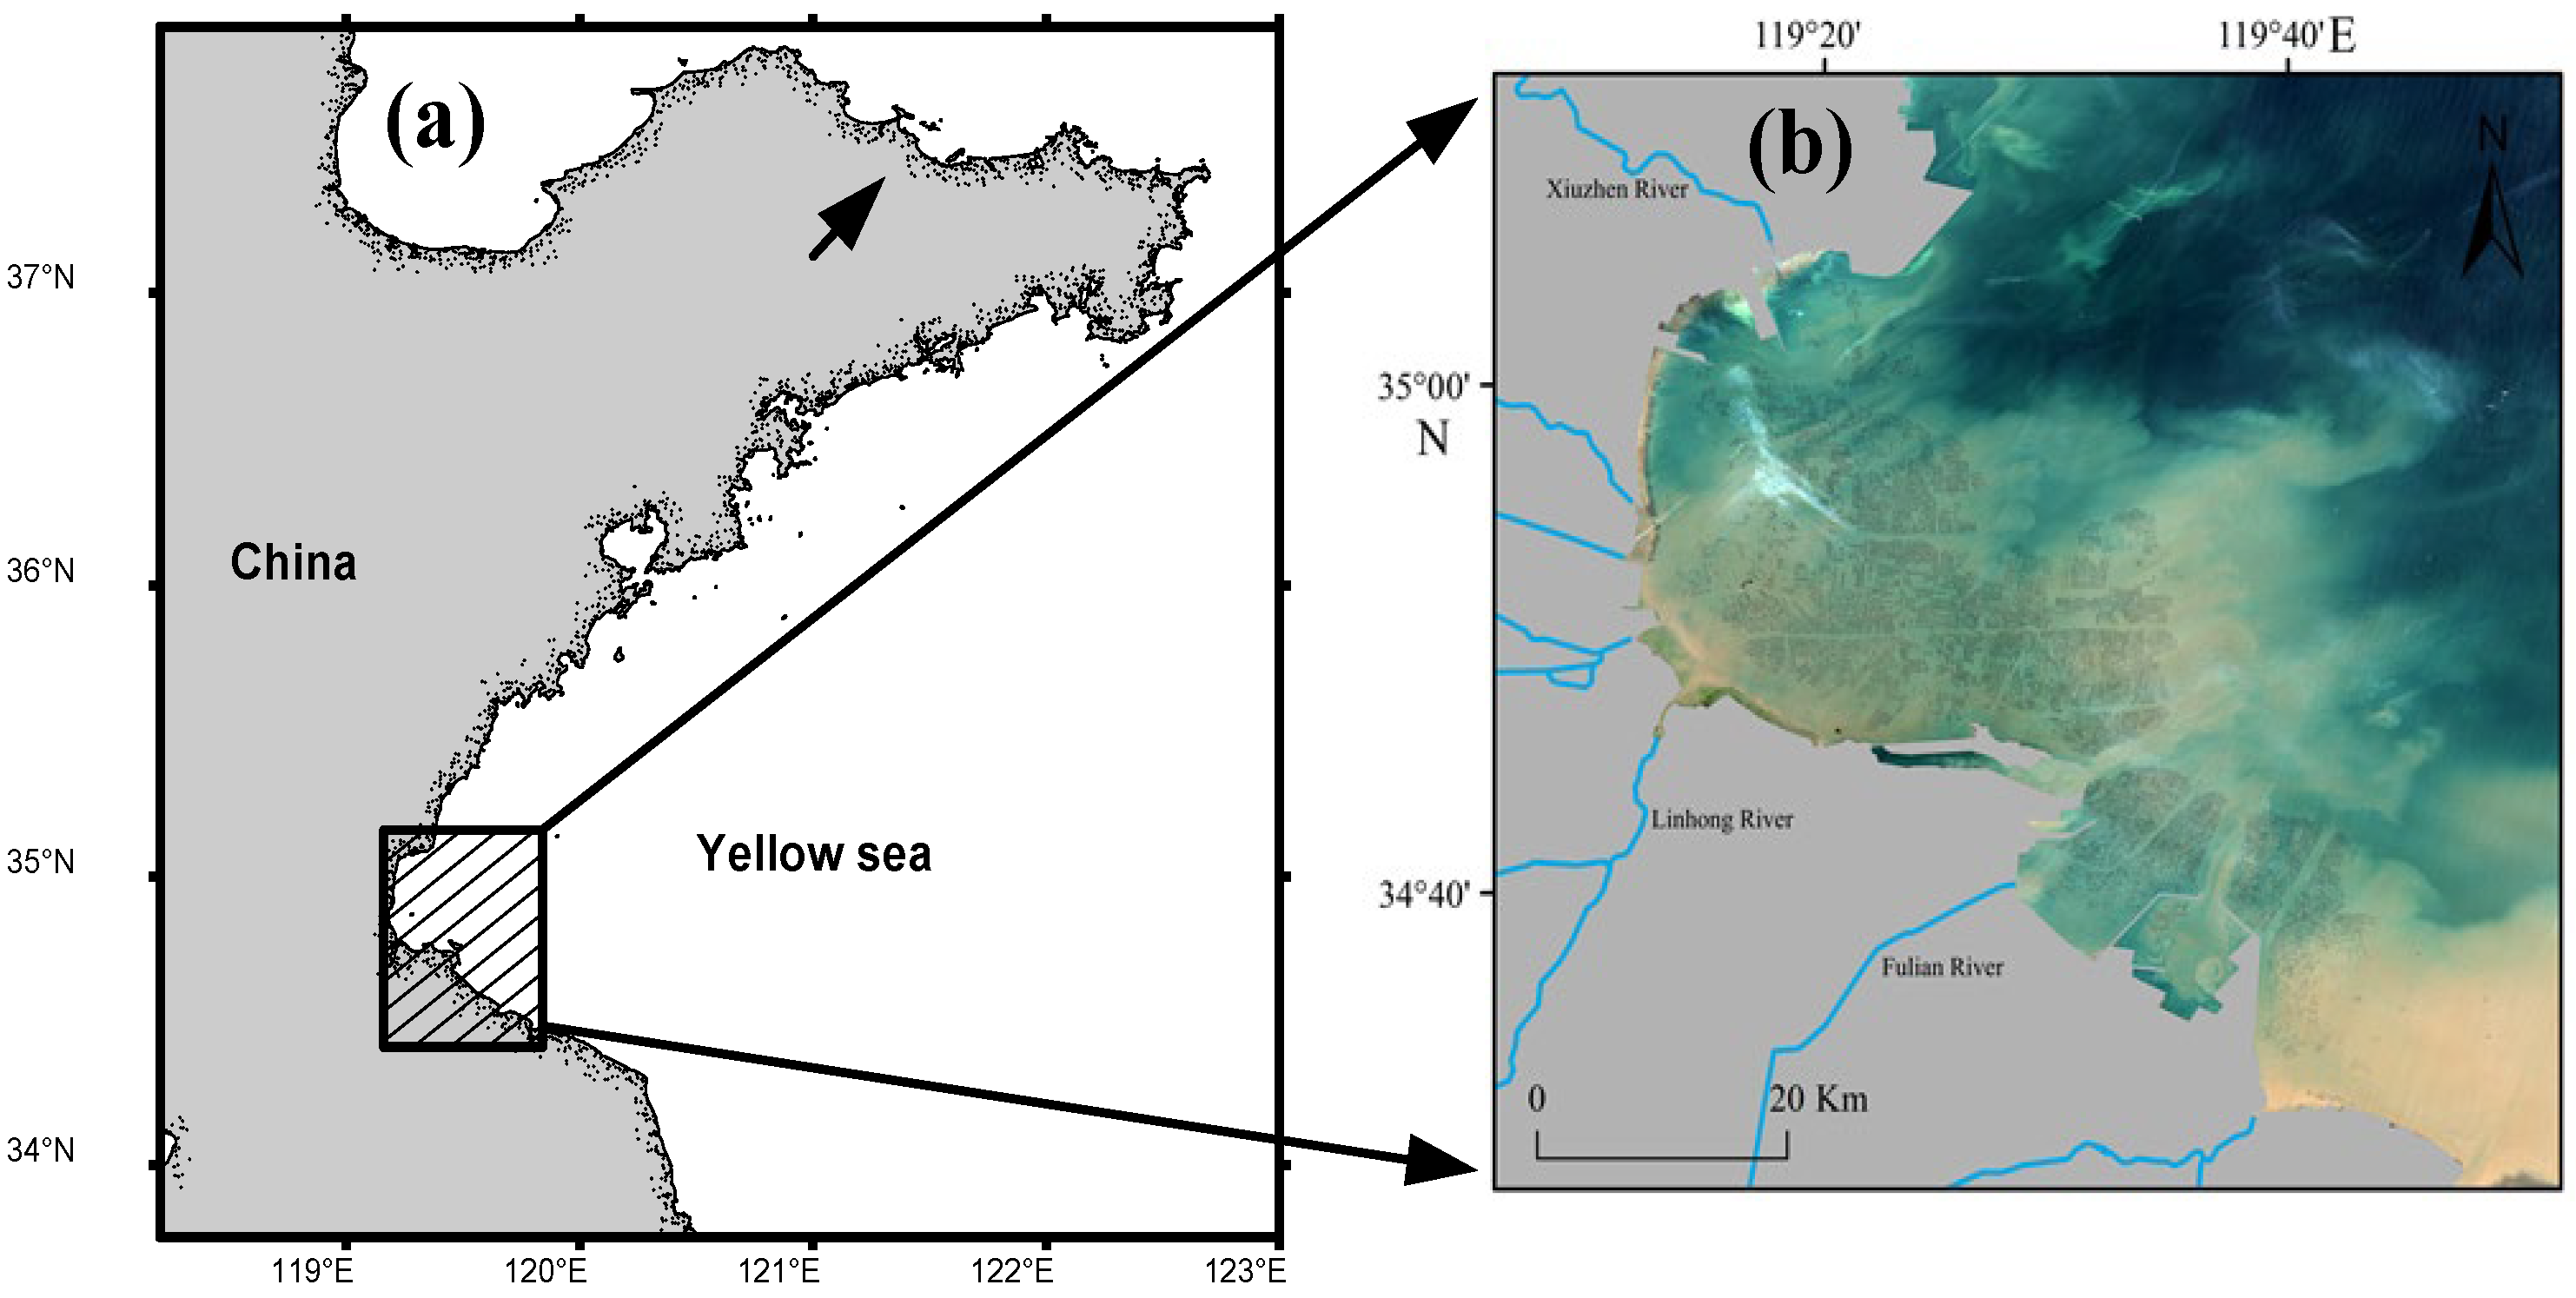
2.1. Study Area
2.2. Remote-Sensing Data
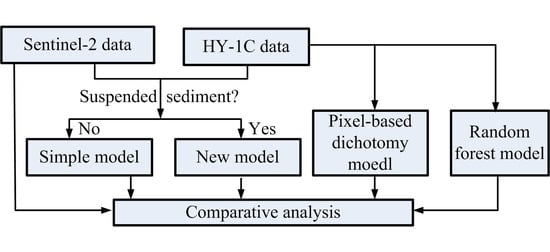
2.3. Methods
2.3.1. Data Preprocessing
2.3.2. Vegetation Index Calculation
2.3.3. Random Forest Classification Model
2.3.4. Pixel-Based Dichotomy Model
2.3.5. New and Simple Model
2.3.6. Accuracy Assessment Parameters
3. Comparative Analysis with Other Three Models
3.1. Accuracy Assessment of Porphyra Cultivation Area Retrieved from Sentinel-2 Image
3.2. Analysis of the Qualitative Impact
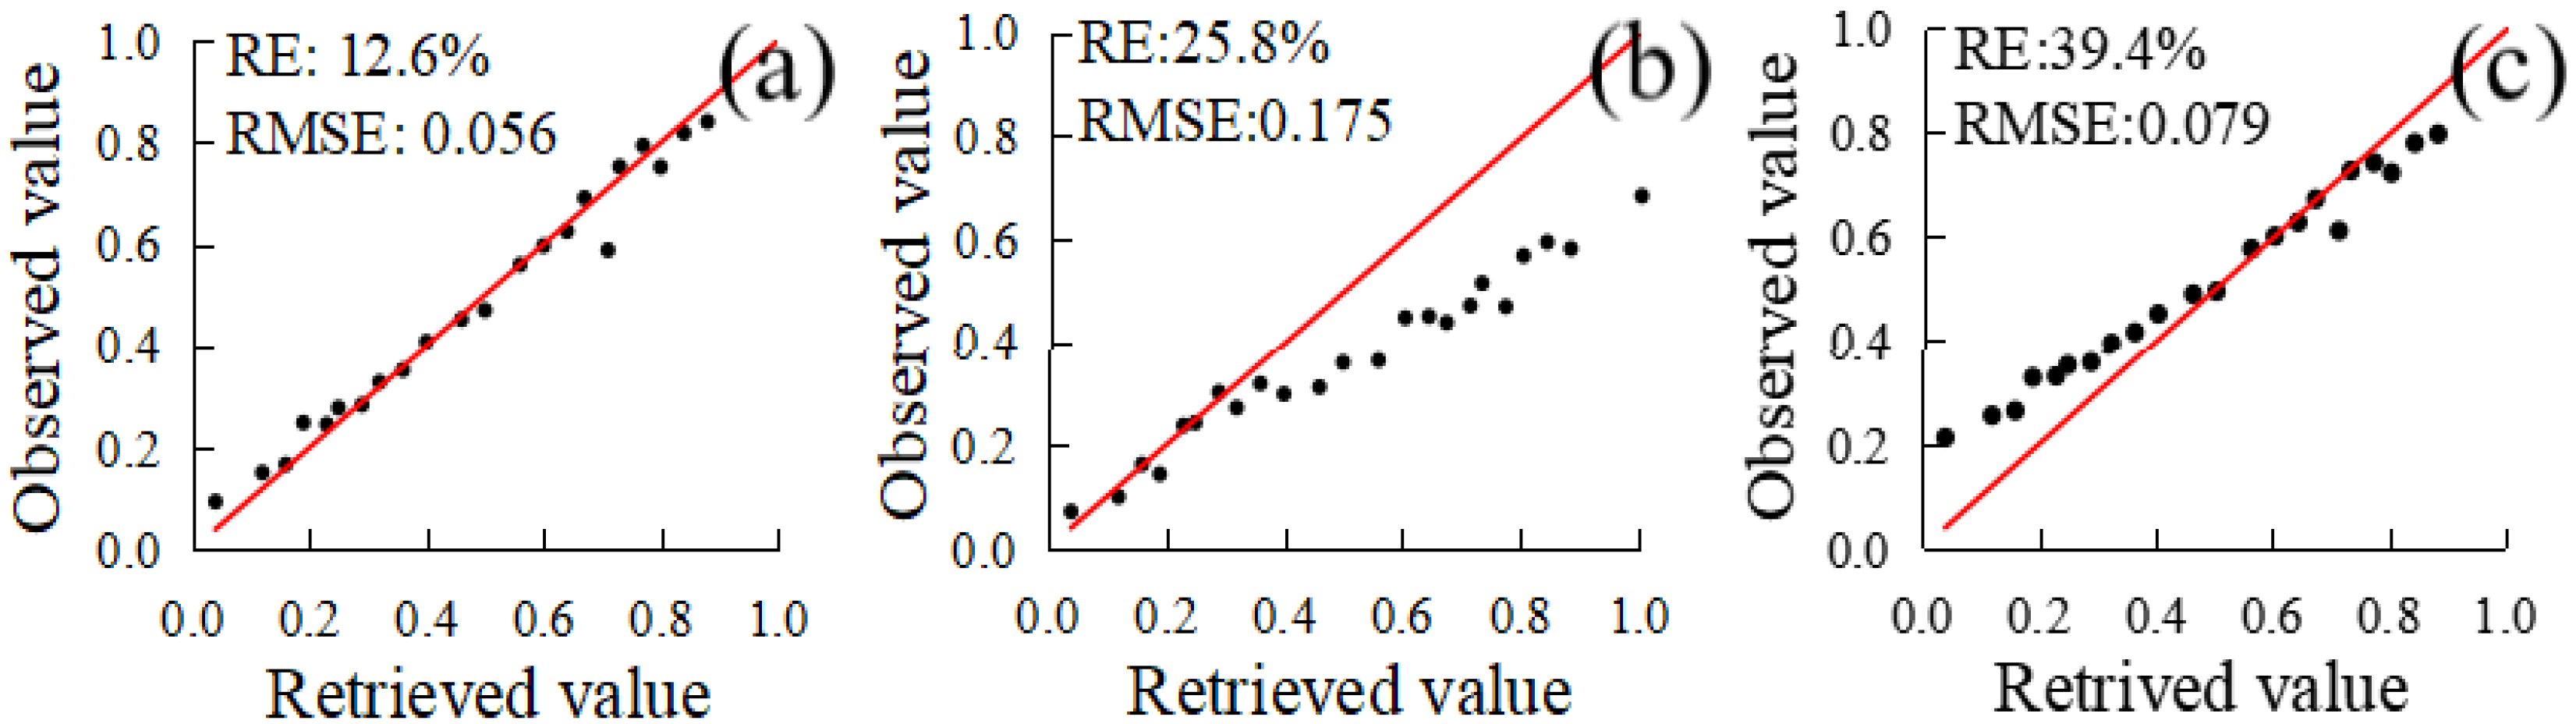
3.3. Accuracy Analysis of New Model
3.4. Effect of Suspended Sediment on New Model
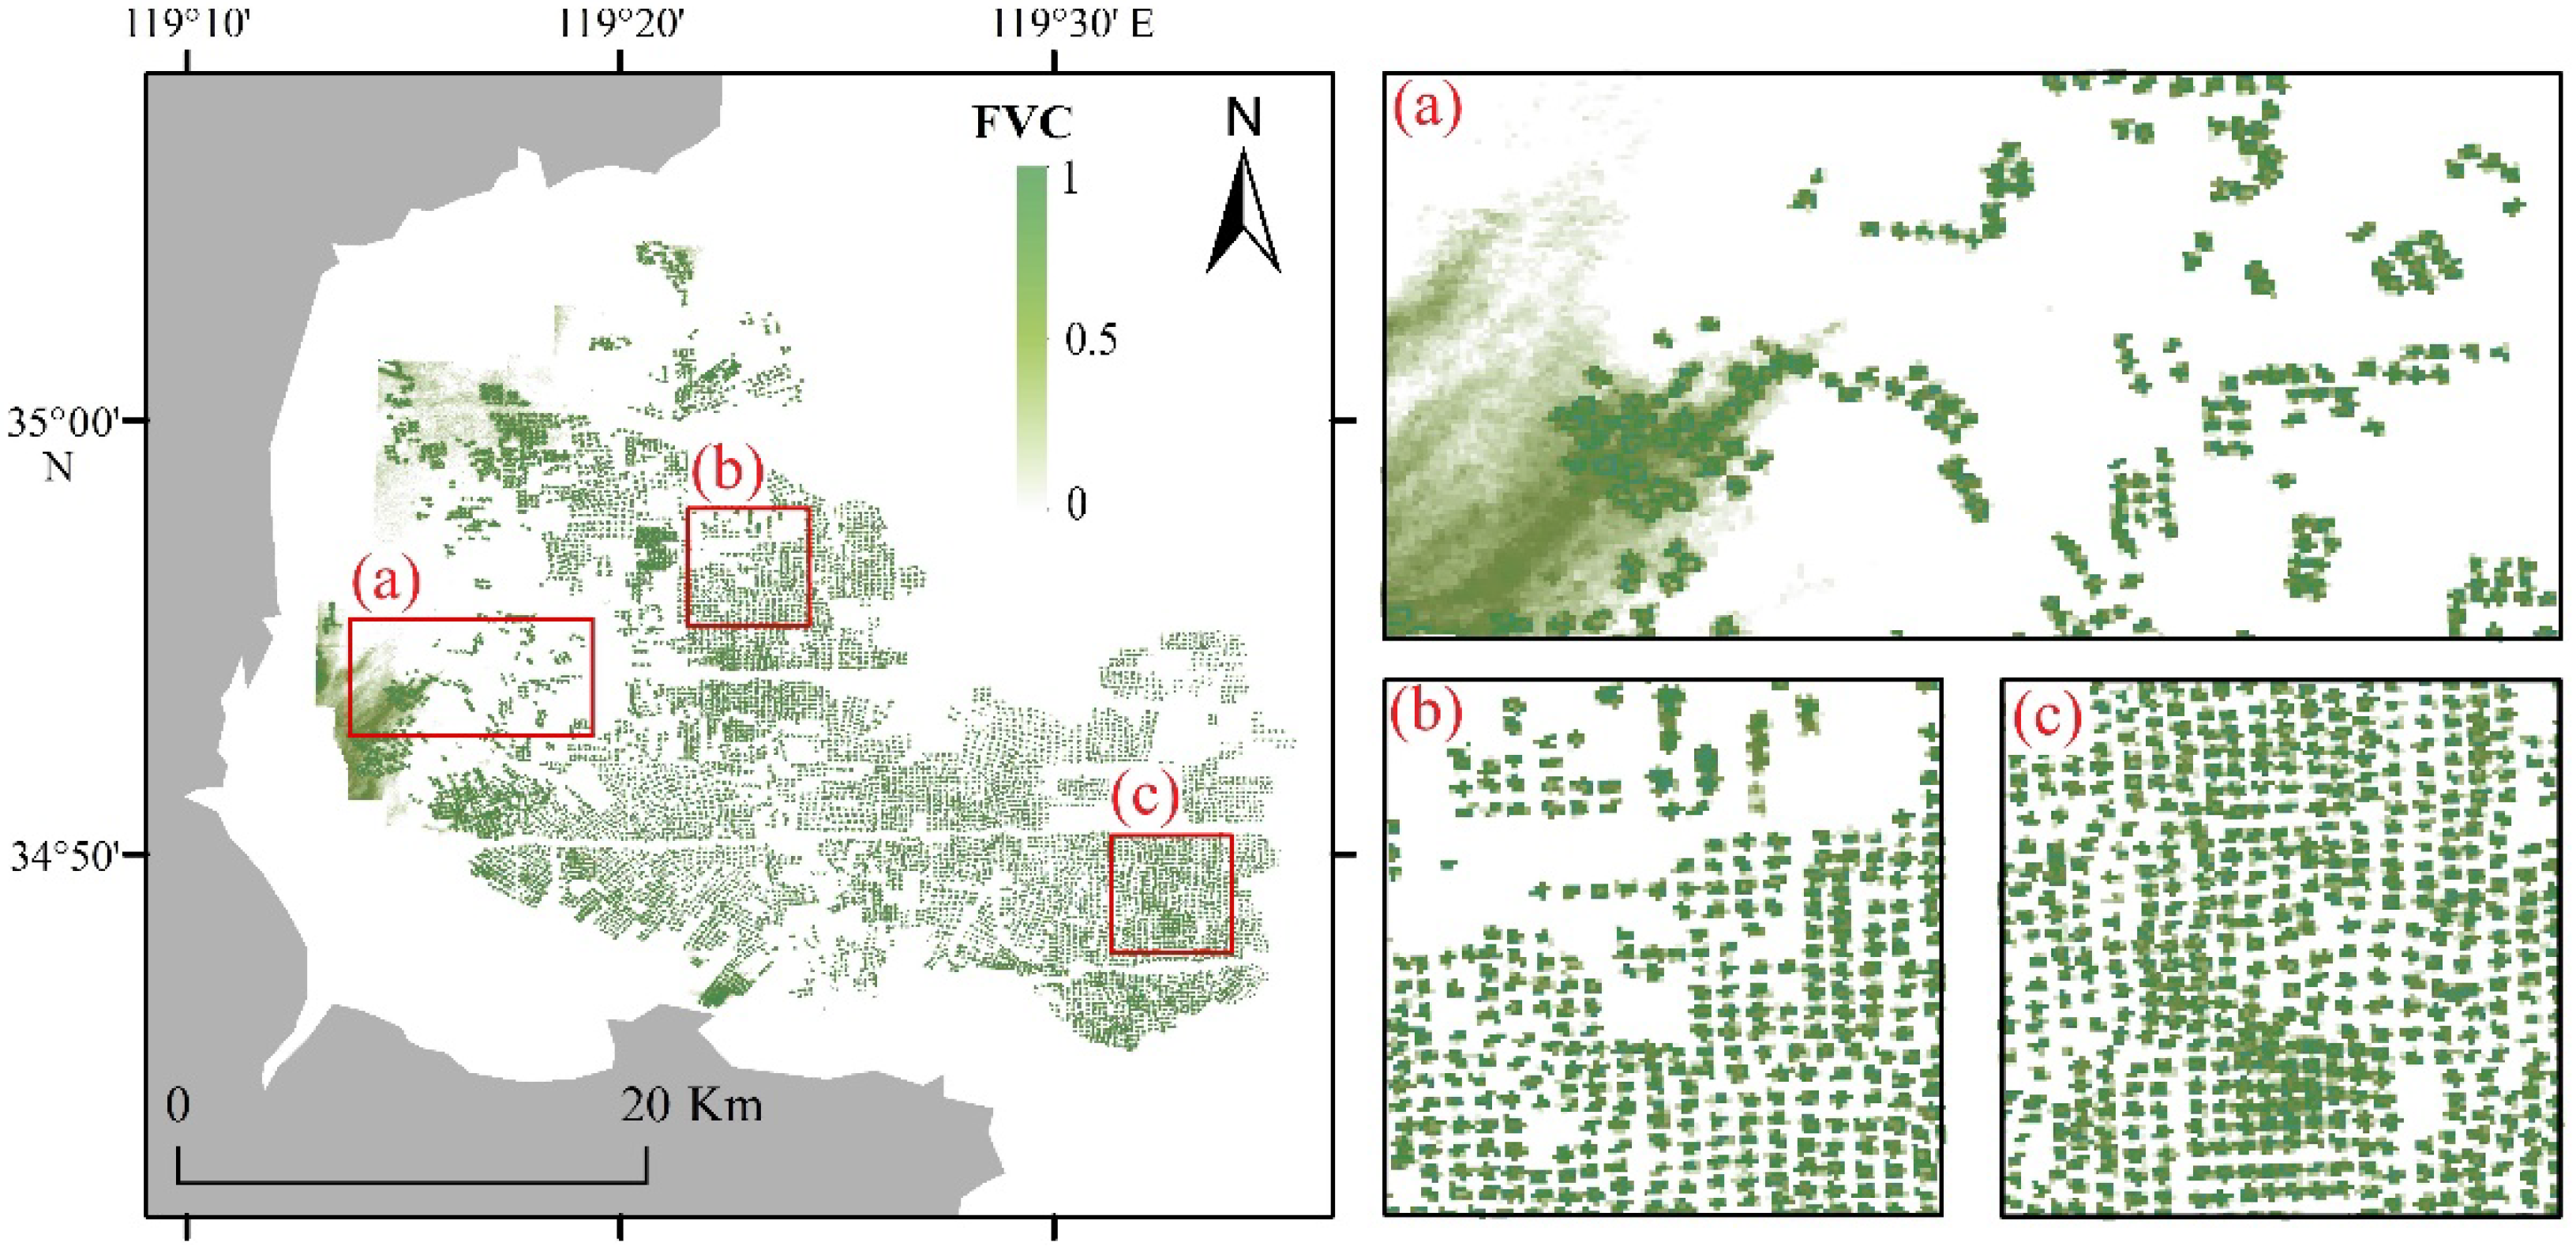
3.5. Application of New Model in Haizhou Bay
4. Conclusions
Author Contributions
Funding
Data Availability Statement
Acknowledgments
Conflicts of Interest
References
- Baweja, P.; Kumar, S.; SahooI, D.; Levine, I. Seaweed in Health and Disease Prevention; Academic Press: Amsterdam, The Netherlands, 2016; p. 70. [Google Scholar]
- Cheng, T.F.; Zhou, W.F.; Fan, W. Progress in the Methods for extracting aquaculture areas from remote sensing data. Remote Sens. Land Resour. 2012, 3, 1–5. [Google Scholar]
- Fisheries Administration of Ministry of Agriculture and Rural Affairs. China Fishery Statistical Yearbook 2020; Agriculture Press: Beijing, China, 2021; p. 72. [Google Scholar]
- Lin, H.; Lu, X.; Wang, X.; He, S.; Li, S.; Zheng, W.; Luo, W. Research on spatial expansion mode of laver farming area in Jiangsu province. Mar. Sci. Bull. 2021, 40, 206–216. [Google Scholar]
- Yang, L.; Wang, P.; Cao, L.; Liu, Y.; Chen, L. Studies on charges for sea area utilization management and its effect on the sustainable development of marine economy in Guangdong Province, China. Sustainability 2016, 8, 116. [Google Scholar] [CrossRef]
- Lu, X.; Zhang, Y.; Zhang, S.; Li, Y. Spatial change analysis of Porphyra yezoensis aquaculture in the Lianyungang coastal area by the use of remote sensing and geographic information system technology. J. Indian Soc. Remote Sens. 2019, 47, 1609–1622. [Google Scholar] [CrossRef]
- Shu, T.; Luo, L.; Wen, Y. Effects of mariculture on coastal ecological environment. Mar. Environ. Sci. 2002, 2, 74–79. [Google Scholar]
- Liu, F.; Feng, S.J. Research advances on green tides in the Yellow Sea. Adv. Mar. Sci. 2012, 30, 441–449. [Google Scholar]
- Yi, J.T.; Huang, J.T.; Song, J.L. Initial understand of enteromorpha prolifera occurred in Yancheng coastal waters in 2008. Mar. Environ. Sci. 2009, 28, 57–58. [Google Scholar]
- Pan, C.; Xia, L.H.; Wu, Z.; Wang, M.; Xie, X.; Wang, F. Remote Sensing Retrieval of Chlorophyll-a Concentration in coastal aquacultivation area of Zhelin Bay. J. Trop. Oceanogr. 2021, 40, 142–153. [Google Scholar]
- Wang, Z.; Xiao, J.; Fan, S.; Li, Y.; Liu, X.; Liu, D. Who made the world′s largest green tide in China?—An integrated study on the initiation and early development of the green tide in Yellow Sea. Limnol. Oceanogr. 2015, 60, 1105–1117. [Google Scholar] [CrossRef]
- Xing, Q.; Wu, L.; Tian, L.; Cui, T.; Li, L.; Kong, F.; Gao, X.; Wu, M. Remote sensing of early-stage green tide in the Yellow Sea for floating-macroalgae collecting campaign. Mar. Pollut. Bull. 2018, 133, 150–156. [Google Scholar] [CrossRef]
- Xia, Y.; Fan, J.; Li, L.; Li, X. Comparisons on sparse alpine grassland based on vegetation coverage inversion models of remote sensing. J. Sichuan Agric. Univ. 2017, 35, 37–44+59. [Google Scholar]
- Shen, Y.; Liu, J.; Ding, J.; Jiao, J.; Sun, S.; Lu, Y. HY-1C COCTS and CZI observation of marine oil spills in the South China Sea. Natl. Remote Sens. Bull. 2020, 24, 933–944. [Google Scholar]
- Zhang, X.; Wang, H.; Fang, E.J.; Gao, Y.; Guo, B.; Liu, K.; Xu, F.; Chen, W. Preliminary study on the cultivation of Porphyra Yezoensis in Bohai Bay. Mar. Sci. Bull. 2019, 2, 147–152. [Google Scholar]
- Zhou, X.; Wang, X.; Xiang, T.; Jiang, H. Method of automatic extracting seaside aquaculture land based on ASTER remote sensing image. Wetl. Sci. 2006, 4, 64–68. [Google Scholar]
- Blaschke, T. Object based image analysis for remote sensing. ISPRS J. Photogramm. Remote Sens. 2010, 65, 2–16. [Google Scholar] [CrossRef]
- Wu, Y.; Zhang, J.; Tian, G.; Cai, D.; Liu, S. A Survey to aquiculture with remote sensing technology in Hainan province. Chin. J. Trop. Crops 2006, 27, 108–111. [Google Scholar]
- Lin, Q.; Lin, G.; Chen, Z.; Chen, Y. The analysis on spatial-temporal evolution of beach cultivation and its policy driving in Xiamen in recent two decades. Geo-Inf. Sci. 2007, 9, 9–13. [Google Scholar]
- Xu, Y.; Zhang, Z.; Wang, X. Remote sensing monitoring analysis of coastal farming land in Shandong Province in Recent 30 Years. Earth Inf. Sci. 2014, 16, 482–489. [Google Scholar]
- Lu, X.; Gu, Y.; Wang, X.; Lin, Y.; Zhao, Q.; Wang, K.; Fei, X. The identification of Porphyra cultivation area by remote sensing and spatial distribution change and driving factors analysis. Mar. Sci. 2018, 42, 87–96. [Google Scholar]
- Wei, Z.; Xing, Q.; Guo, R.; Li, L. Study on the spatial distribution variation of Porphyra aquaculture in the southern Yellow Sea during the period 2000-2015 retrieved by satellite remote sensing. J. Ocean. Technol. 2018, 37, 17–22. [Google Scholar]
- He, Q.; Zhou, J.; Yu, S.; Li, C.; Yu, D. Remote Sensing Survey on the Distribution of Cage-Fenced Culture in the Top 10 Reservoirs of Hunan Province based on GF-2 data. Bull. Surv. Mapp. 2019, 10, 8–11+159. [Google Scholar]
- Xu, H.; Zhang, Y.; Zhang, J. Research on the automatic extraction of floating raft aquaculture based on SR-NDVI and median filtering in Lianyungang. J. Ocean Technol. 2021, 40, 1–8. [Google Scholar]
- Wang, X.; Liu, J.; Xing, Q.; Chen, Y. Monitoring of Porphyra cultivation dynamics in Lianyungang based on coastal zone image. Mar. Sci. 2021, 45, 9–17. [Google Scholar]
- Chu, J.; Zhao, D.; Zhang, F. Wakame raft interpretation method of remote sensing based on association rules. Remote Sens. Technol. Appl. 2012, 27, 941–946. [Google Scholar]
- Wang, F.; Xia, L.; Chen, Z.; Cui, W. Remote sensing identification of coastal zone mariculture modes based on association-rules object-oriented method. Trans. Chin. Soc. Agric. Eng. 2018, 34, 210–217. [Google Scholar]
- Guo, R. Evaluation on the Changes in the Seaweed (Porphyra Yezoensis) Aquaculture in Jiangsu Coastal Waters Using Remote Sensing; University of Chinese Academy of Sciences: Beijing, China, 2017. [Google Scholar]
- Xing, Q.; An, D.; Zheng, X.; Wei, Z.; Wang, X.; Li, L.; Tian, L.; Chen, J. Monitoring seaweed aquaculture in the Yellow Sea with multiple sensors for managing the disaster of macroalgal blooms. Remote Sens. Environ. 2019, 231, 111279. [Google Scholar] [CrossRef]
- Lin, M.; He, X.; Jia, Y. Advancesin marine satellite remote sensing technology in China. Acta Oceanogr. Sin. 2019, 41, 99–112. [Google Scholar]
- Kaur, S.; Bansal, R.K.; Mittal, M.; Goyal, L.M.; Kaur, I.; Verma, A.; Son, L.H. Mixed pixel decomposition based on extended fuzzy clustering for single spectral value remote sensing images. J. Indian Soc. Remote Sens. 2019, 47, 427–437. [Google Scholar] [CrossRef]
- Yang, H.; Deng, F.; Fu, H.; Zhang, J. Estimation of rape-cultivated area based on decision tree and mixed pixel decomposition. J. Indian Soc. Remote Sens. 2021, 49, 1285–1292. [Google Scholar] [CrossRef]
- Gao, Y.; Pan, Y.; Huang, H.; Mohamed, E.R.; Aly, Z.M. Swarm Intelligence Algorithm for Extracting Spatial Spectrum Features of Hyperspectral Remote Sensing Image and Decomposing Mixed Pixels. J. Intell. Fuzzy Syst. 2020, 39, 5045–5055. [Google Scholar] [CrossRef]
- Sun, Y.; Gu, Z.; Li, D. Study on remote sensing retrieval of leaf area index based on unmanned aerial vehicle and satellite image. Sci. Surv. Mapp. 2021, 46, 106–112+145. [Google Scholar]
- Pope, R.; Fry, E. Absorption spectrum (380–700 nm) of pure water. II. integrating cavity measurements. Appl. Opt. 1997, 36, 8710–8723. [Google Scholar] [CrossRef] [PubMed]
- Hou, P.; Wang, L.; Cao, G.; Yang, F. Analysis and research of remote sensing for suspended sediment in water. Proc. SPIE Int. Soc. Opt. Eng. 2004, 5239, 89–97. [Google Scholar]
- Pereira, R.; Yarish, C. Mass Production of Marine Macroalgae. Encycl. Ecol. 2008, 5, 2236–2247. [Google Scholar]
- Gitelson, A.A.; Kaufman, Y.J.; Stark, R.; Rundquist, D. Novel algorithms for remote estimation of vegetation fraction. Remote Sens. Environ. 2002, 80, 76–87. [Google Scholar] [CrossRef]
- Markham, B.L.; Barker, J.L. Thematic mapper bandpass solar exoatmospheric irradiances. Int. J. Remote Sens. 1987, 8, 517–523. [Google Scholar] [CrossRef]
- Paruelo, J.M.; Epstein, H.E.; Lauenroth, W.K. ANPP estimates from NDVI for the central grassland region of the United States. Ecology 1997, 78, 953–958. [Google Scholar] [CrossRef]
- Xu, H. A Study on information extraction of water body with the modified normalized difference water index. Natl. Remote Sens. Bull. 2005, 5, 589–595. [Google Scholar]
- Cai, L.; Zhou, M.; Liu, J.; Tang, D.; Zuo, J. HY-1C observations of the impacts of islands on suspended sediment distribution in Zhoushan coastal waters, China. Remote Sens. 2020, 12, 1766. [Google Scholar] [CrossRef]
- Van der Linden, S.; Rabe, A.; Held, M. The EnMAP-box—A toolbox and application programming interface for EnMAP data processing. Remote Sens. 2015, 7, 11249–11266. [Google Scholar] [CrossRef] [Green Version]


| Sensor | Bands | Wavelength Range (μm) | Spatial Resolution (m) | Swath Width (km) | Revisit Period (days) |
|---|---|---|---|---|---|
| HY-1C | 1–Blue | 0.420–0.500 | 50 | 950 | 3 |
| 2–Green | 0.520–0.600 | ||||
| 3–Red | 0.610–0.690 | ||||
| 4–NIR * | 0.760–0.890 | ||||
| Sentinel-2 | 2–Blue | 0.459–0.525 | 10 | 290 | 5 |
| 3–Green | 0.541–0.577 | ||||
| 4–Red | 0.649–0.684 | ||||
| 8–NIR * | 0.780–0.886 |
| NO. of Images | Date of HY-1C CZI | Date of Sentinel-2 Images | Data Usage |
|---|---|---|---|
| 1 | 31 January 2020 | 12 January 2020 | Building models and validating and assessing the models |
| 2 | 9 February 2020 | 16 February 2020 | Time series application for the new model and assessing model indirectly |
| 3 | 19 March 2020 | 16 February 2020 |
| Category | Actual Value * | ||||
|---|---|---|---|---|---|
| PCA | SW | Total | UA(%) | ||
| Visual interpretation resamples | PCA | 336 | 20 | 356 | 94.3 |
| SW | 18 | 626 | 644 | 97.2 | |
| Total | 354 | 646 | 1000 | ---- | |
| PA/% | 95.0 | 97.0 | ---- | ---- | |
| OA/% | ---- | ---- | 96.2 | ---- | |
| Kappa | ---- | ---- | 0.92 | ---- | |
| Methods | RE/% | |
|---|---|---|
| Observed value | 116.9 | |
| New model | 134.3 | 15 |
| Simple model | 144.7 | 24 |
| Pixel-based dichotomy model | 151.2 | 29 |
| Random forest classification | 72.9 | 37 |
| Sea Region | Method | Total Area () | RE in Area (%) | RE in Validation Points (%) | RMSE in Validation Points |
|---|---|---|---|---|---|
| Ⅰ | Observed value | 3.26 | ---- | ---- | ---- |
| New model | 3.36 | 3 | 6 | 0.102 | |
| Simple model | 4.78 | 47 | 16 | 0.173 | |
| Pixel-based dichotomy model | 7.18 | 120 | 35 | 0.405 | |
| Random forest classification model | 2.67 | 18 | ---- | ---- | |
| Ⅱ | Observed value | 3.41 | ---- | ---- | ---- |
| New model | 3.30 | 3 | 8 | 0.089 | |
| Simple model | 3.25 | 5 | 14 | 0.152 | |
| Pixel-based dichotomy model | 3.59 | 5 | 17 | 0.149 | |
| Random forest classification model | 2.94 | 14 | ---- | ---- |
Publisher’s Note: MDPI stays neutral with regard to jurisdictional claims in published maps and institutional affiliations. |
© 2022 by the authors. Licensee MDPI, Basel, Switzerland. This article is an open access article distributed under the terms and conditions of the Creative Commons Attribution (CC BY) license (https://creativecommons.org/licenses/by/4.0/).
Share and Cite
Cheng, Y.; Sun, Y.; Peng, L.; He, Y.; Zha, M. An Improved Retrieval Method for Porphyra Cultivation Area Based on Suspended Sediment Concentration. Remote Sens. 2022, 14, 4338. https://doi.org/10.3390/rs14174338
Cheng Y, Sun Y, Peng L, He Y, Zha M. An Improved Retrieval Method for Porphyra Cultivation Area Based on Suspended Sediment Concentration. Remote Sensing. 2022; 14(17):4338. https://doi.org/10.3390/rs14174338
Chicago/Turabian StyleCheng, Yinhe, Yue Sun, Lin Peng, Yijun He, and Mengling Zha. 2022. "An Improved Retrieval Method for Porphyra Cultivation Area Based on Suspended Sediment Concentration" Remote Sensing 14, no. 17: 4338. https://doi.org/10.3390/rs14174338