Article

Detecting Spatial-Temporal Changes of Urban Environment Quality by Remote Sensing-Based Ecological Indices: A Case Study in Panzhihua City, Sichuan Province, China

1
School of Earth Science, Chengdu University of Technology, Chengdu 610059, China
2
State Key Laboratory of Geohazard Prevention and Geoenvironment Protection, Chengdu University of Technology, Chengdu 610059, China
3
Northwest Engineering Corporation Limited, Xi’an 710065, China
4
Land Satellite Remote Sensing Application Center, Ministry of Natural Resources of China, Beijing 100048, China
5
Southwest Branch of China Petroleum Engineering Construction Co., Ltd., Chengdu 610059, China
*
Author to whom correspondence should be addressed.
Remote Sens. 2022, 14(17), 4137; https://doi.org/10.3390/rs14174137
Submission received: 28 July 2022 / Revised: 19 August 2022 / Accepted: 20 August 2022 / Published: 23 August 2022
(This article belongs to the Section Environmental Remote Sensing)

Abstract

:
Panzhihua City is a typical agricultural-forestry-pastoral and ecologically sensitive city in China. It is also an important ecological defense in the upper Yangtze River. It has abundant mineral resources, including vanadium, titanium, and water supplies. However, ecological and environmental problems emerge due to the excessive development of mining, agriculture, animal husbandry, and other non-natural urban economies. Therefore, a scientific understanding of the spatio-temporal changes of the eco-environment of Panzhihua is critical for environmental protection, city planning, and construction. To objectively evaluate the eco-environmental status of Panzhihua, the remote sensing-based ecological index (RSEI) was first applied to Panzhihua, a typical resource-based city, and its ecological environmental quality (EEQ) was quantitatively assessed from 1990 to 2020. This study explored the effects of mining activities and policies on EEQ and used change detection to reveal the spatial-temporal changes of EEQ in Panzhihua City over the past three decades. In addition, this study also verified the suitability of RSEI for evaluating EEQ in resource-based city using spatial autocorrelation, revealed the spatial heterogeneity of EEQ in Panzhihua City using optimized hot spot analysis, and showed different ecological clustering by hot spot analysis at two scales of urban and mining areas. According to the results: (1) From 1990 to 2020, the general eco-environmental condition of Panzhihua is improving, but there are still regional differences. (2) The Moran’s I value ranges from 0.436 (1990) to 0.700 (2020), indicating that there is autocorrelation in the distribution of eco-environmental quality. (3) At the mine, the mean value of RSEI dropped by 20–40%, and the EEQ decreased significantly due to mining activities. (4) A series of ecological restoration policies can buffer the negative impact of mining activities on the ecosystem, resulting in a slight improvement in the quality of the ecological environment. This study evaluates the EEQ of resource-based city and its spatial-temporal changes using RSEI constructed by the Google Earth Engine (GEE) platform, which can provide theoretical support for ecological and environmental conditions monitoring, development planning, and environmental protection policy-making of a resource-based city.

1. Introduction

A healthy natural setting ensures that human civilization will advance sustainably. However, amid the large-scale development of China’s western region and the demand for natural resources for social and economic development, human activities have significantly impacted the ecological environment in western China, resulting in a growing number of ecological and environmental issues in this region, which is against the principles of green economy and sustainable development [1]. Therefore, timely estimation of the spatio-temporal changes in ecological environmental quality (EEQ) in resource-based city is very important to environmental protection and regional sustainability.
Remote sensing technology is extensively used in the area of environmental science for its high effectiveness, precision, and widespread simultaneous detection. In addition, some remote sensing-based indicators are employed to assess the eco-environmental status. The NPP (net primary productivity) [2,3], which reflects the efficiency of plants in fixing and converting light energy into compounds, is an indicator to describe the dynamic changes of plants and their reaction to climatic change. The Normalized Difference Vegetation Index (NDVI) [4] is the best indicator for global greening and has been frequently employed in numerous ecological and environmental research [5,6,7,8]. Remote sensing was used to calculate the ratio between the impervious surface and the urban land area to explore its relationship with the urban thermal environment [9]. The urban heat island effect is measured using the land surface temperature (LST) [10]. The Fraction of Photosynthetically Active Radiation (FPAR) is employed to compute and track vegetation phenology and ecosystem production [11]. However, to assess the state of an ecosystem that is subject to a complex and varied range of effects, it is not acceptable to employ a single ecological indicator.
In order to conduct a thorough assessment of the ecosystem, various remote sensing-based integrated ecological indicators were developed to examine the ecological condition. The integrated ecological indicator is better than the single ecological indicator because two or more indicators are used to comprehensively evaluate the ecological condition [12]. The Ecological Index (EI) can be a good indicator of the ecological condition of an area and thus is commonly used to assess the EEQ of watersheds [13] and sea island cities [14]. Although these integrated ecological indicators represent additional ecological characteristics [12], challenges remain in acquiring and constructing the indicators, such as the visualization of evaluation results and the reasonable weights of different indicators.
In 2013, Xu [15] presented the remote sensing-based ecological index (RSEI) based on EI. The four indicators (dryness, greenness, heat, and wetness) that constitute RSEI are strongly related to the environmental quality on an ecological level. Therefore, RSEI shows the consequences of urbanization, vegetation cover change, and climatic change (temperature and humidity) on the environment, which helps to quantitatively assess the changes of regional EEQ [16]. Currently, RSEI is widely employed in urban development zones [17], land project consolidation areas [18], wetlands [19], watersheds [13,20,21,22,23], basins [24], and woodlands [25], while it is rarely seen in mining areas. At present, the calculation of RSEI is gradually transferred from the traditional remote sensing image processing software to the remote sensing cloud computing platform. Many scholars have extracted RSEI with Google Earth Engine (GEE) platform [21,22,26].
Currently, the GEE platform is a comprehensive platform with the most advanced features for analyzing and visualizing geographic information data [27]. It is widely used, especially in processing large-scale data on a global scene [28]. Users can process data directly on the platform. In addition, some datasets (such as the Landsat series and MODIS product data series) have been pre-processed and are ready for further analysis. There is no need for radiometric calibration or atmospheric correction [29]. As compared to traditional remote sensing image processing software, the GEE platform is better suited for building a large-scale RSEI and evaluating the ecological environmental quality.
At present, the ecological environmental evaluation of resource-based city mainly focuses on industrial transformation and sustainable development [30,31], ecological service system [32], ecological vulnerability evaluation [33], and other aspects. Many scholars have already evaluated the ecological status of the resource-based city of Panzhihua. Wang [34] conducted the current situation analysis of the comprehensive evaluation of the eco-environmental carrying capacity of Panzhihua based on the composite model of principal component analysis and entropy value method, which avoids the influence of artificially set weights on the evaluation results. Shao et al. [35] used artificial neural networks to evaluate the ecological vulnerability of Panzhihua and solved the nonlinear relationship between the evaluation indexes of mining cities and the degree of ecological fragility. Zhang et al. [36] used NPP to establish various ecological footprint data to estimate the regional capacity of sustainable development in Panzhihua City. Dai et al. [37] selected 13 evaluation factors, such as topography, soil, vegetation, and meteorology, to establish an assessment system suitable for the fragile ecosystem of Panzhihua, and used principal component analysis, CA-Markov model, and Geodetector to systematically reveal the spatial-temporal evolution and drivers of ecological vulnerability in Panzhihua. These studies have achieved relatively good results, but there are some shortcomings, such as a large amount of data, complicated model calculations, and long interval time. The RSEI relies entirely on remote sensing data, so it has the unique advantage of being fast, accurate, and efficient in long-time series monitoring of the ecological environment.
Panzhihua is an important resource-based city and one of China’s four major mining zones. It accounts for 93% of the associated resource reserves in China, ranking first in the world. Over the last half century, high-intensity industrial activities such as metallurgical activities and mining have resulted in serious air pollution and harmed the eco-environment of Panzhihua [38]. It has become an important issue to balance mining and ecological environmental protection. As a result, it is essential to observe the spatial-temporal changes of the natural environment in Panzhihua over the past three decades and conduct scientific studies on the impact of resource exploitation on the ecological environment of Panzhihua to make scientific decisions in sustainable mining in the future. To this end, this research aims to (1) apply RESI to the EEQ evaluation of resource-based city to achieve a quick, quantitative, and accurate assessment of its EEQ, and explore its spatial distribution pattern; (2) reveal the spatial heterogeneity and clustering of EEQ through optimized hot spot analysis; (3) monitor the spatial-temporal changes of EEQ in Panzhihua from 1990 to 2020 using change detection; (4) explore the effect of mining activities on the EEQ of mining areas.

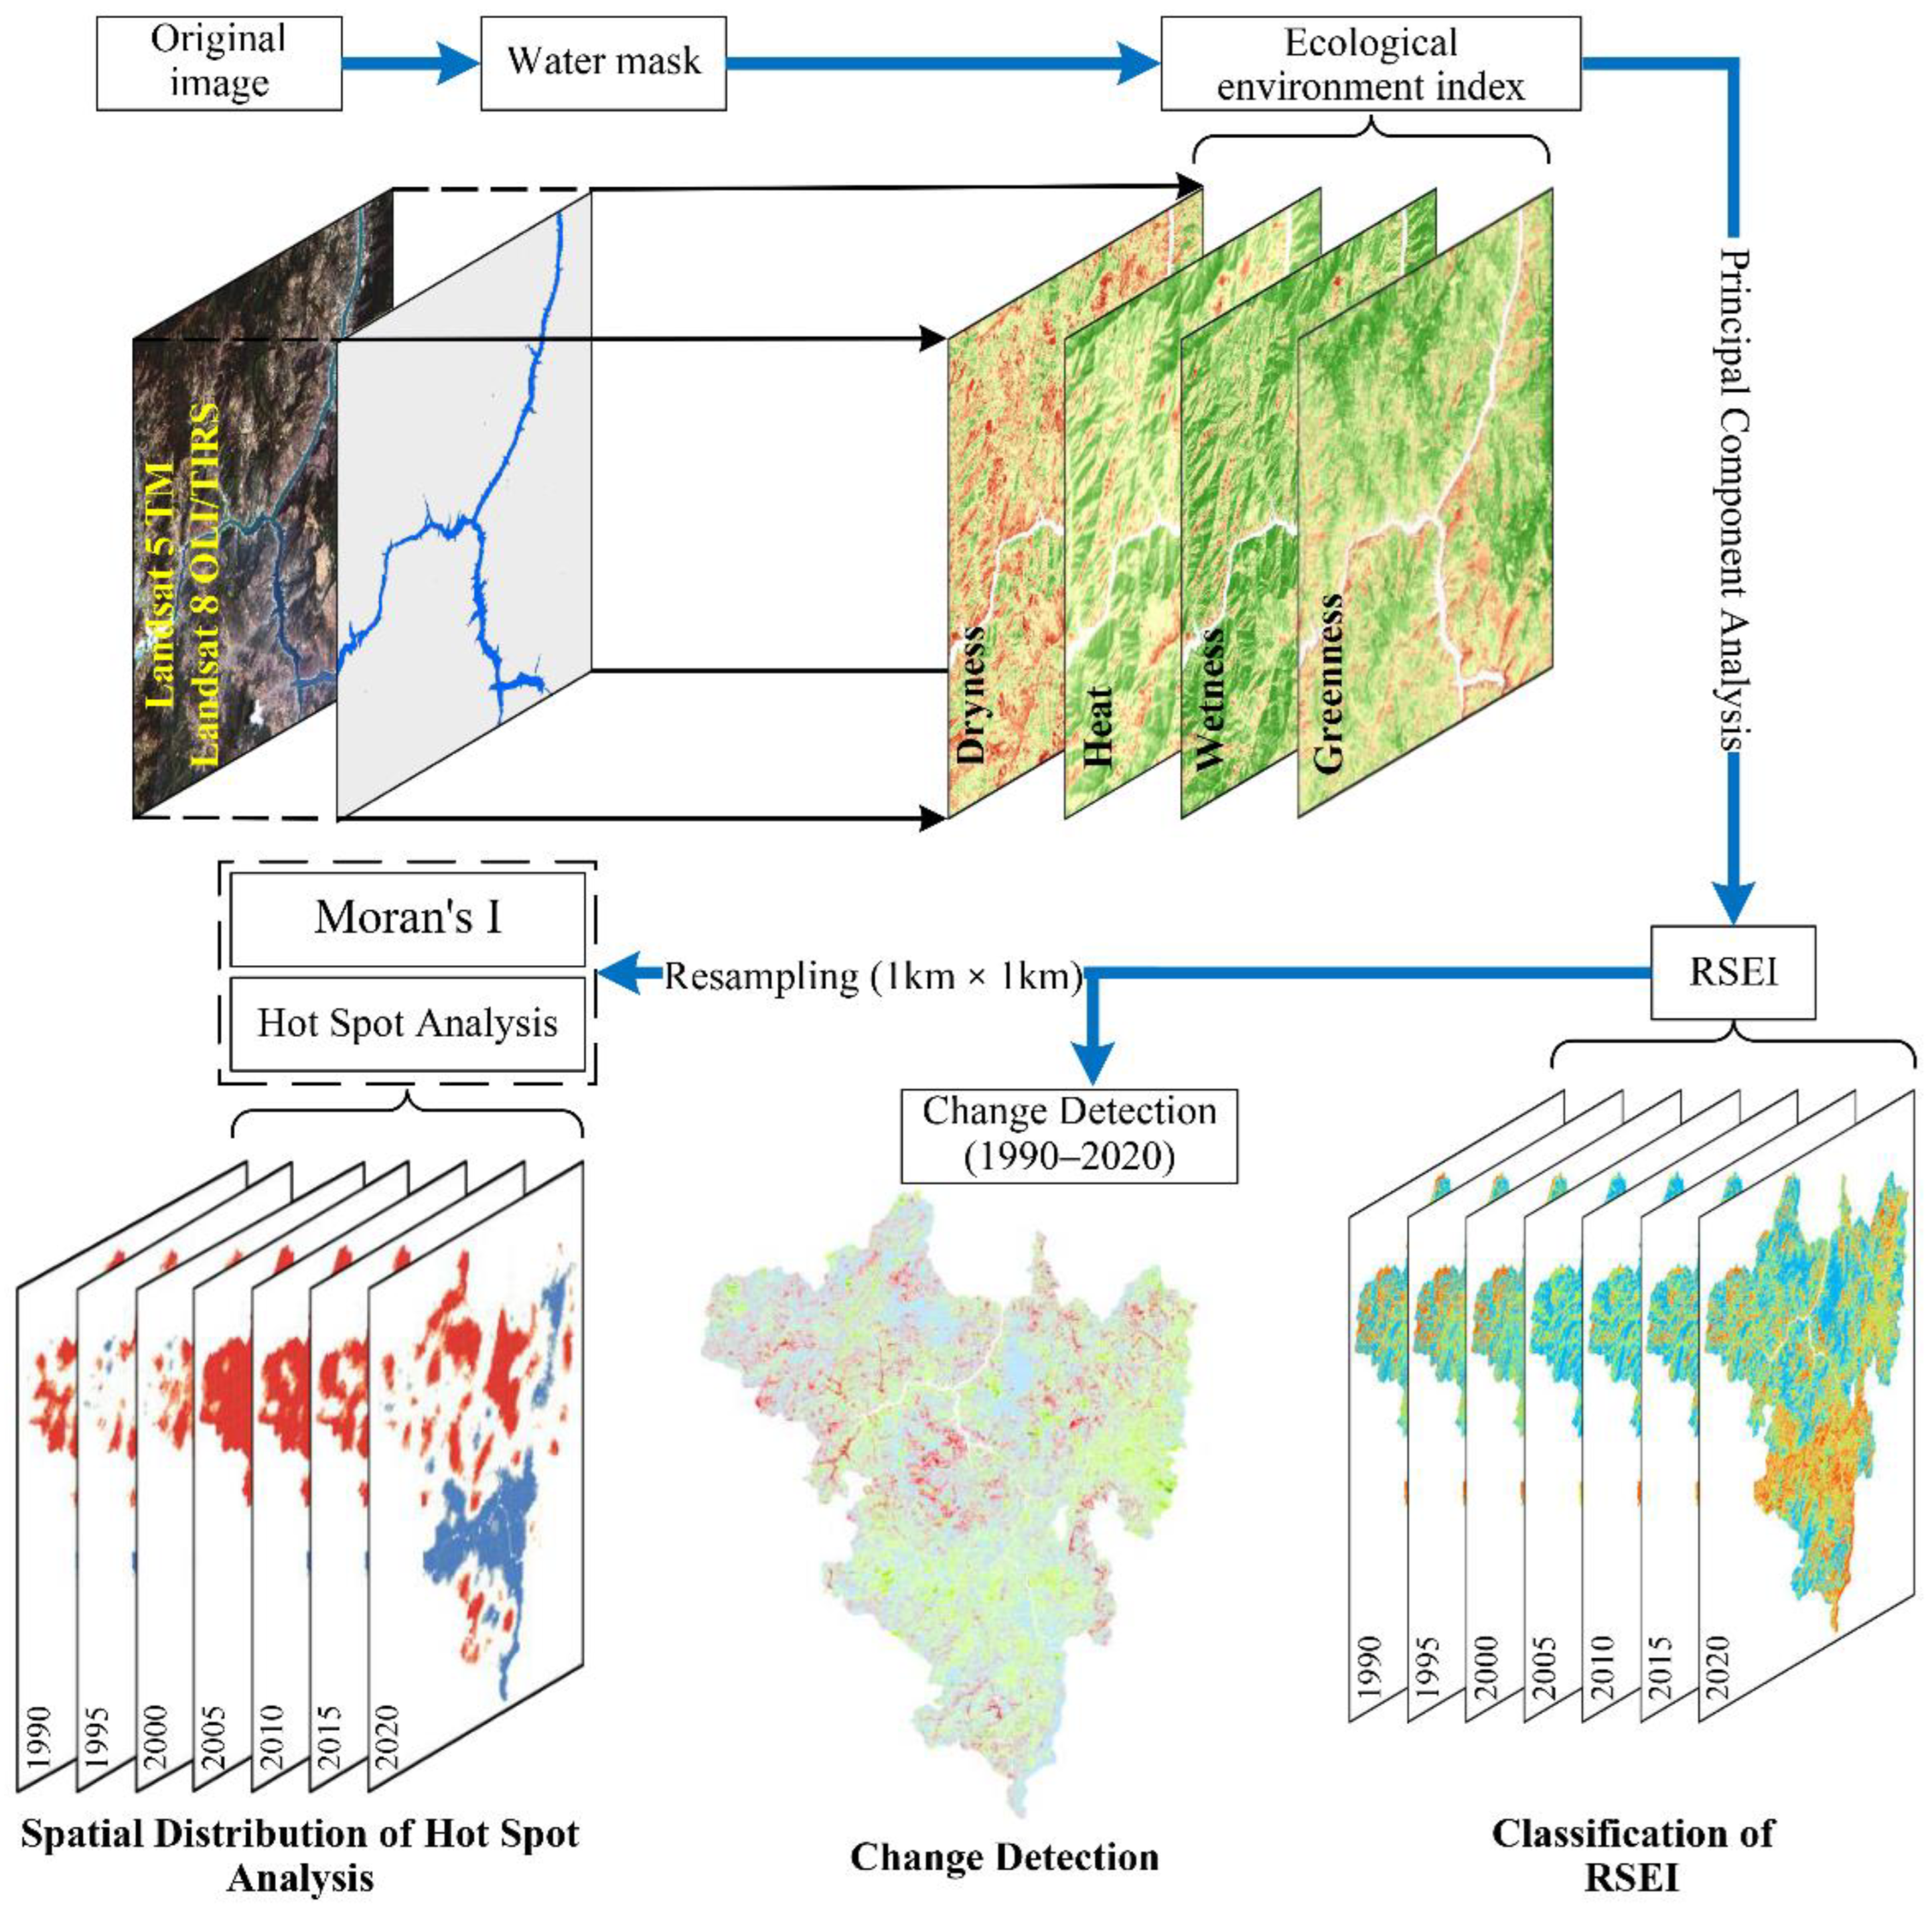
2. Materials and Methods
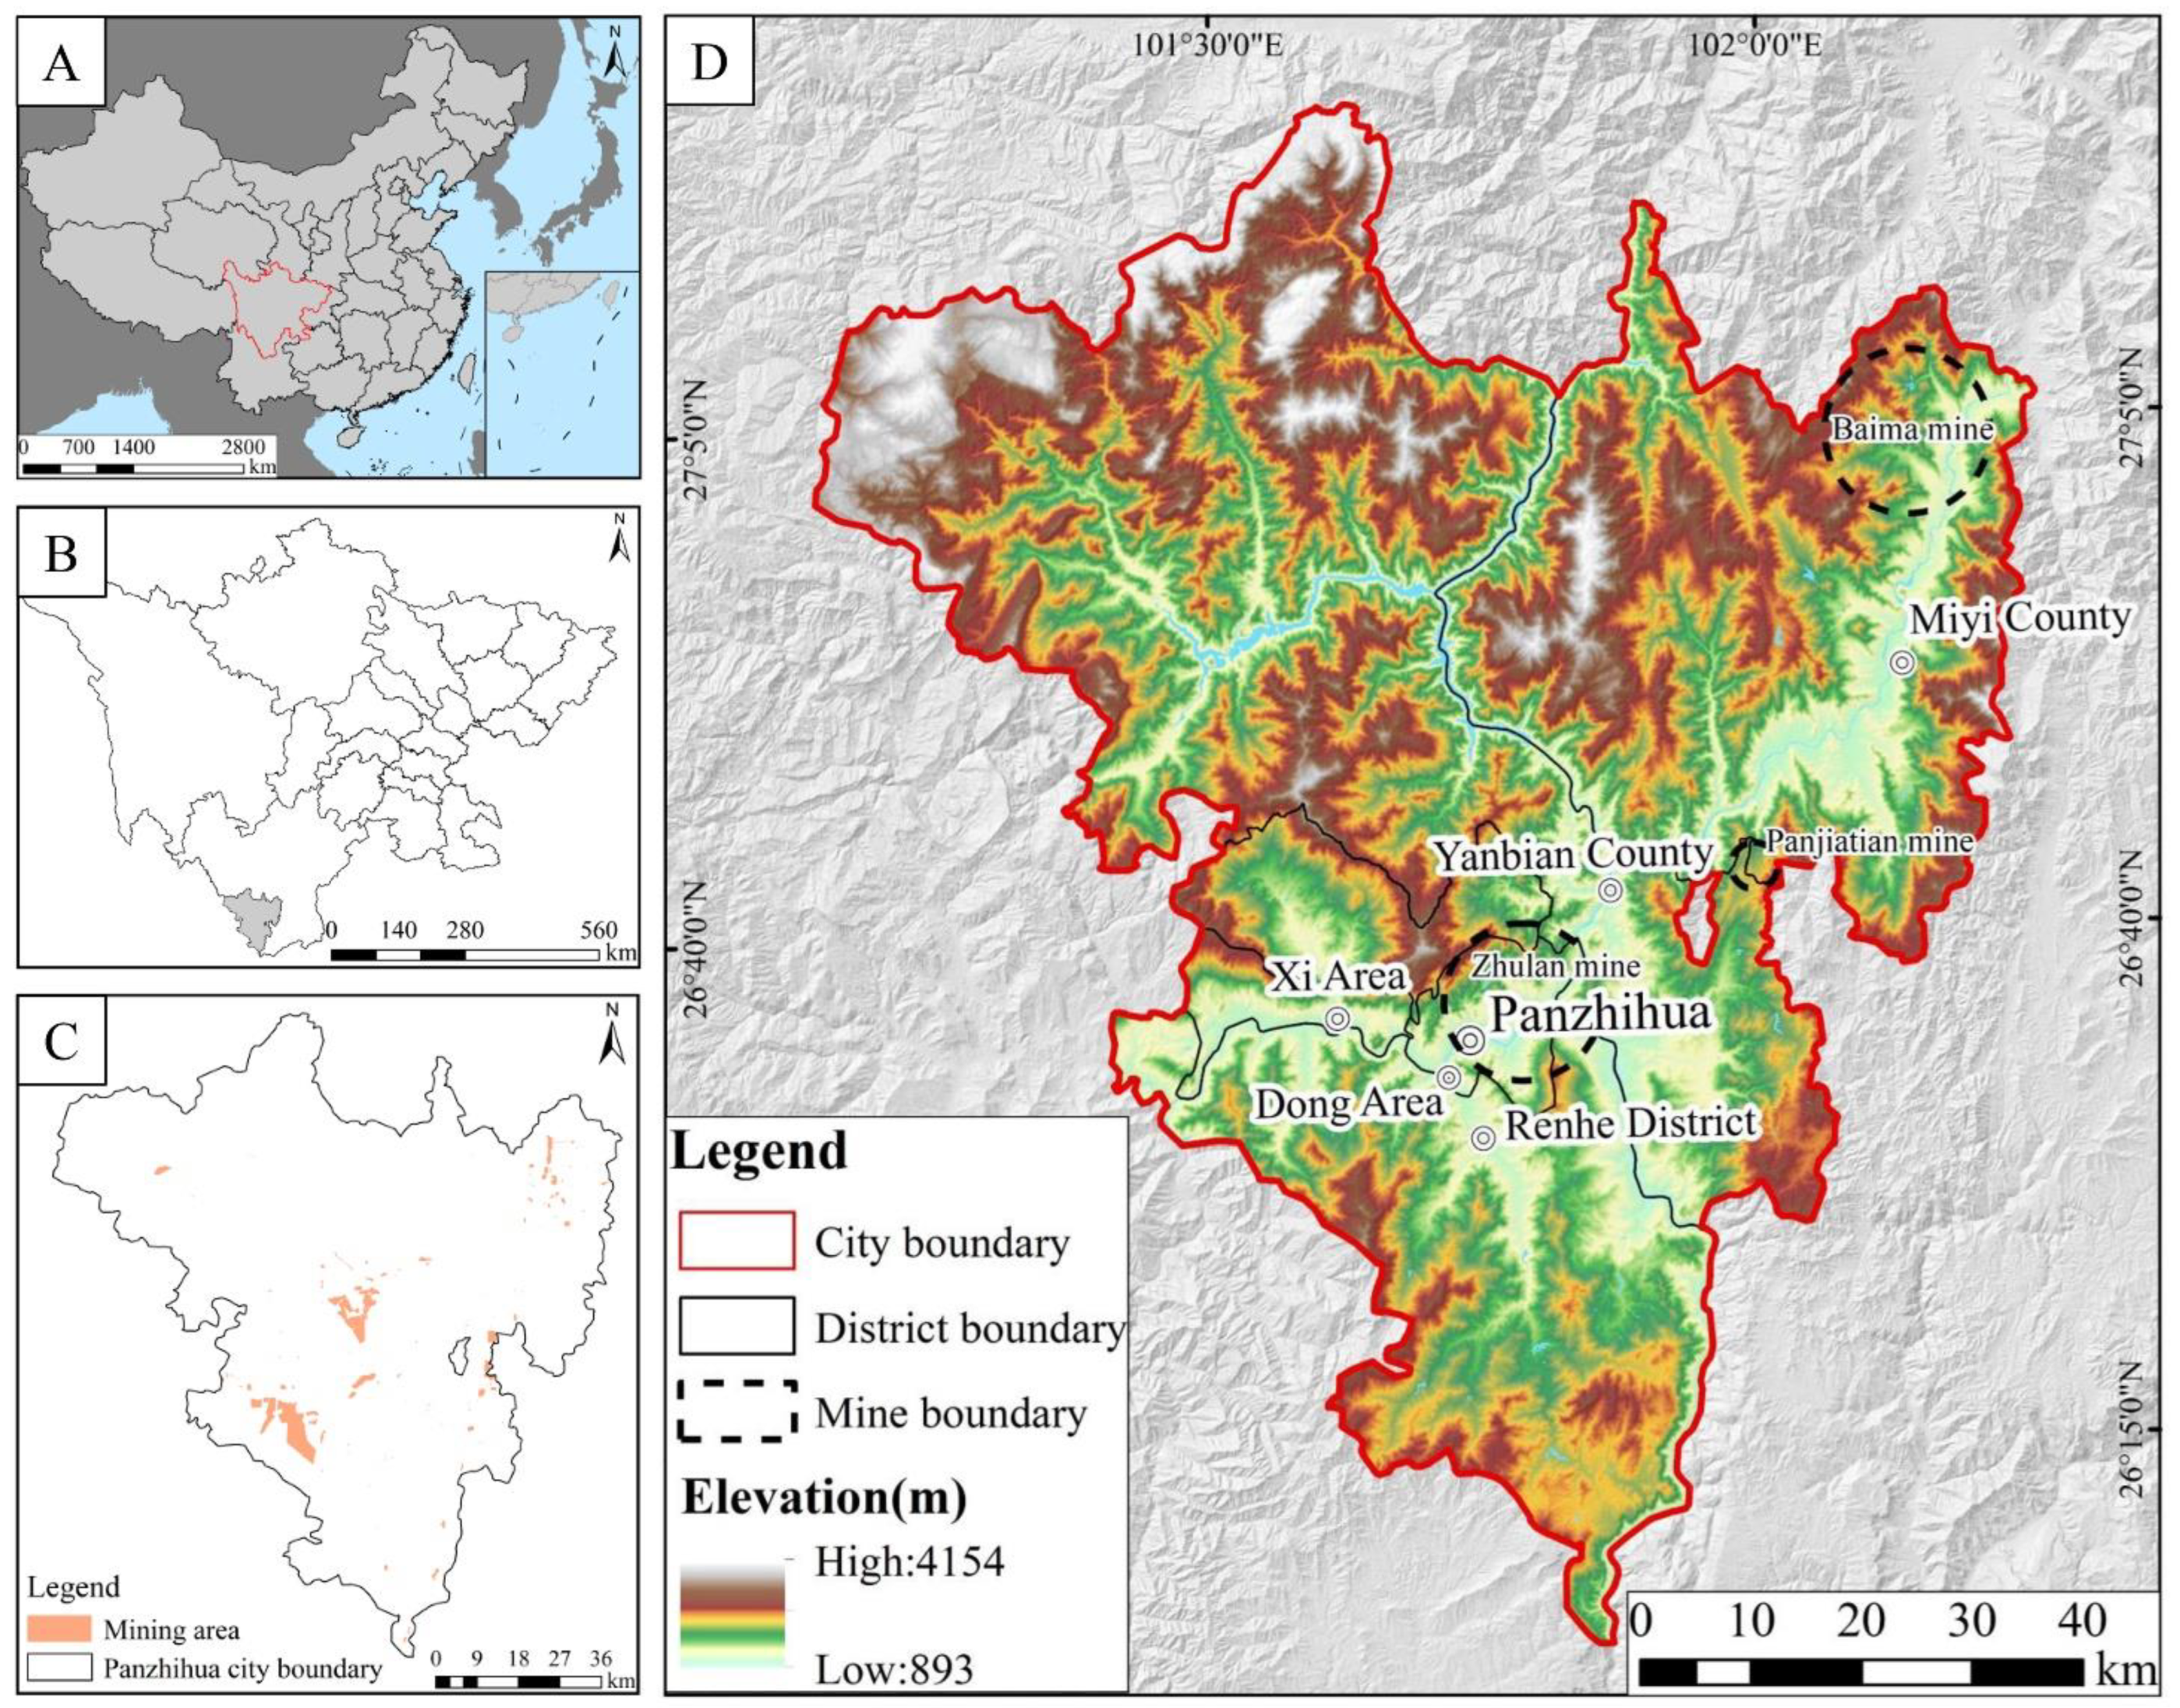
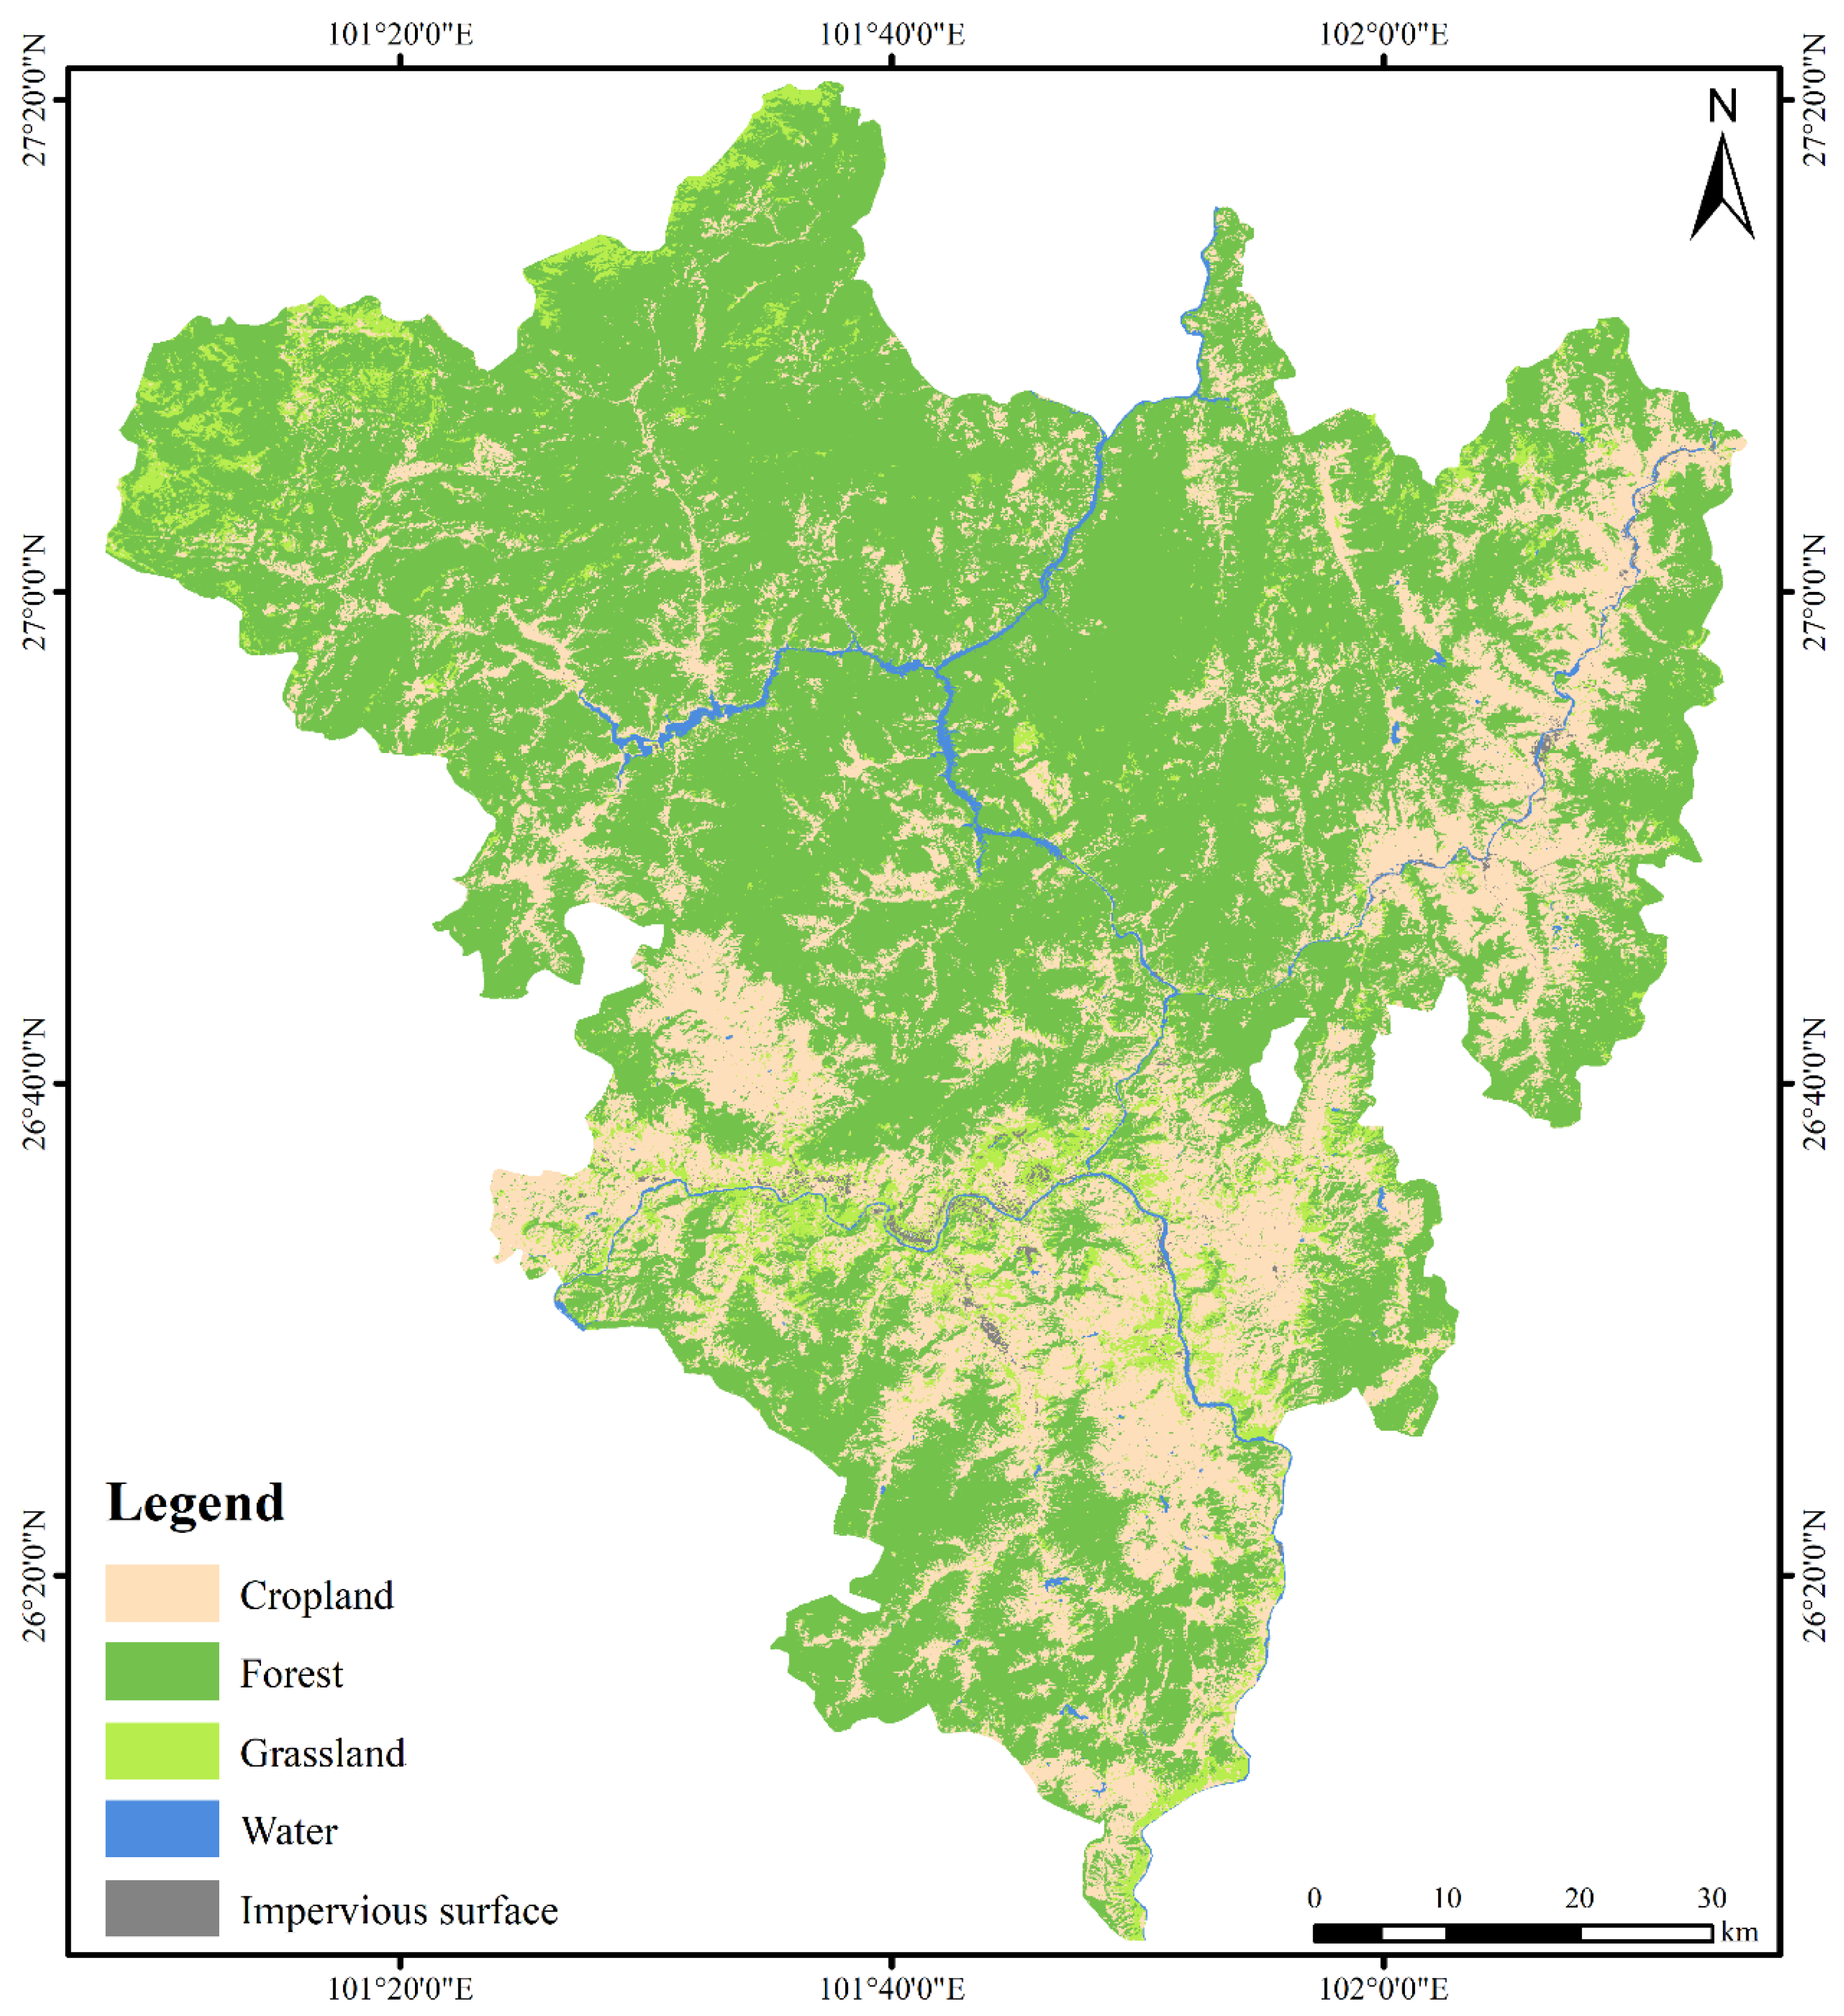
The process of this study is depicted in (Figure 1). Firstly, we use Landsat 8 OLI/TIRS and Landsat 5 TM images with the GEE platform to produce 30-m RSEI images of the 7 periods in 1990/1995/2000/2005/2010/2015/2020, respectively. Secondly, Moran’s I index (global Moran’s I) and hot spot analysis are used to perform spatial autocorrelation analysis on the seven RSEI images from 1990 to 2020. Finally, an ecological quality change detection was carried out for the period 1990–2020.

2.1. Study Area

Panzhihua City, the core of the Jinsha River’s dry-hot valley, has the most serious problem of soil erosion and the most fragile ecological environment in the Upper Yangtze River. Meanwhile, Panzhihua is a resource-based city and is renowned as the capital of vanadium and titanium in China. Its titanium, vanadium, and graphite reserves rank first in China and even the world. Covering an area of about 7414 km² in the southernmost part of Sichuan Province, Panzhihua is on the border of Sichuan Province and Yunnan Province in southwest China, where the Yalong River and Jinsha River meet. Two large mining areas in Panzhihua, Zhulan mine (mined in the 1970s, mined area: 10.46 km2) and Baima mine (mined in 2003, mined area: 11.62 km2), and one medium-sized mine, Panjiatian mine (mined in 1996, mined area: 2.87 km2), are studied in this paper (Figure 2).

2.2. Data and Pre-Processing

Five Landsat 5 TM images with a five-year time serial interval from 1990 to 2010 and two Landsat 8 OLI/TIRS images with the same time serial interval from 2015 to 2020 were selected in this study to visualize the space–time distribution of RSEI of Panzhihua City from 1990 to 2020. The research region is situated between the Worldwide Reference System 2 (WRS-2) paths 130/41, 131/41, and 130/42. The start of season (SOS) of the vegetation in Panzhihua is from March to May [39]. Considering the growth characteristics of the vegetation, the images with the least cloud volume collected during this period were chosen for this study to prevent uncertainty caused by seasonal differences in the images.
In this study, Landsat-TM/OLI/TIRS images from the United States Geological Survey (USGS) are collected and processed by the GEE platform. On this platform, processing and data collection for the Landsat 5/8 surface reflectance data products have already been completed. Therefore, there is no need to download it. With mask functions (CFMASK and WATERMASK), factors that affect the study results such as clouds, shadows, and water bodies in the images are removed. Furthermore, in the original Landsat 5 TM image, the thermal infrared (TIR) band (TM6) is originally acquired at a spatial resolution of 120 m and then resampled to 30 m by triple convolution. NDVI, WET, and NDBSI (Normalized Difference Bare Soil Index) are calculated using surface reflectance data from Landsat TM/OLI, and the LST is calculated with the single-channel algorithm.

2.3. Construct RSEI

2.3.1. Greenness

NDVI is the best indicator of greenness [40]. Therefore, it is chosen to represent the greenness indicator in this study:
N D V I = ( ρ N I R ρ R e d ) / ( ρ N I R + ρ R e d   )
In the formula, ρ N I R is the reflectance of the near-infrared band and ρ R e d is the reflectance of the red band.

2.3.2. Wetness

The Tasseled Cap transformation is an effective technique for de-redundancy and data compression [41]. Its brightness, greenness, and wetness components are directly autocorrelated with the land surface. Therefore, it has been widely used in ecological monitoring [42]. As the wetness component is closely related to the land surface moisture, the wetness index in this study is represented by the wetness component. The wetness calculation formulas of Landsat 5 TM and Landsat 8 OLI are:
W E T T M = 0.0315 ρ b l u e + 0.2021 ρ g r e e n + 0.3102 ρ R e d + 0.1594 ρ N I R 0.6806 ρ S W I R 1 0.6109 ρ S W I R 2
W E T O L I = 0.1511 ρ b l u e + 0.1972 ρ g r e e n + 0.3283 ρ R e d + 0.3407 ρ N I R 0.7117 ρ S W I R 1 0.4559 ρ S W I R 2
In the formulas, ρ b l u e is the reflectance of the corresponding blue band, ρ g r e e n is the reflectance of the green band, ρ R e d is the reflectance of the red band, ρ N I R is the reflectance of the near-infrared band, ρ S W I R 1 is the reflectance of the shortwave infrared 1 band, and ρ S W I R 2 is the reflectance of the shortwave infrared 2 band.

2.3.3. Dryness

The NDBSI analyzes the current state of land desertification and land degradation through the brightness of the soil [43]. The dryness index is obtained by averaging the Soil Index (SI) and the Index-based Build-up Index (IBI) with the formula:
I B I = ( 2 ρ S W I R 1 ρ S W I R 1 + ρ N I R ρ N I R ρ N I R + ρ R e d + ρ g r e e n ρ g r e e n + ρ S W I R 1 ) / ( 2 ρ S W I R 1 ρ S W I R 1 + ρ N I R + ρ N I R ρ N I R + ρ R e d + ρ g r e e n ρ g r e e n + ρ S W I R 1 )
S I = [ ( ρ S W I R 1 + ρ R e d ) ( ρ b l u e + ρ N I R ) ] / [ ( ρ S W I R 1 + ρ R e d ) + ( ρ b l u e + ρ N I R ) ]
N D B S I = ( I B I + S I ) / 2
In the formula, ρ R e d , ρ g r e e n , ρ b l u e , ρ N I R , and ρ S W I R 1 represent the reflectance of the red band, green band, blue band, near-infrared band, and shortwave infrared 1 band, respectively.

2.3.4. Heat

The land surface temperature, which represents the thermal index, can be calculated with the model from the Landsat user manual (https://www.usgs.gov/landsat-missions/landsat-8-data-users-handbook, accessed on 15 March 2022) and the latest revised calibration parameters from Jiménez-Muñoz et al. [44]:
T = K 2 / ln ( K 1 / L + 1 )
In the formula, L is the Top of Atmosphere (TOA) spectral radiance in the thermal infrared band; T is the brightness temperature at the sensor; K1 and K2 are the calibration constants in the thermal infrared band. For TM 6 band, K1 = 607.76 W/(m2 × sr × μm), K2 = 1260.56 K, and for OLI 10 band, K1 = 774.89 W/(m2 × sr × μm), K2 = 1321.08 K.
The temperature T calculated by Formula (7) must be corrected for land surface emissivity to become land surface temperature LST.
L S T = T 1 + λ T ρ ln ε
In the formula, λ is the central wavelength of the thermal infrared band. ρ = 1.438 × 10⁻² mK; ε is land surface emissivity.

2.3.5. RSEI and EEQ

Among the indicators that make up the RSEI, NDVI, and NDBSI indicators, how ecological quality responds to changes in land cover can be shown. The WET and LST indices show how ecological quality responds to variations in the surface environment. Four indicators of the RSEI were calculated based on Landsat series data [15]. The four indicators are inconsistent and need to be normalized before performing the principal component analysis (PCA). In addition, the RSEI was obtained by normalizing the first principal component of PCA (PC1), which can reflect the quality of the regional ecological environment. Calculation methods such as Formulas (9)–(11):
N I i = ( I i I m i n ) / ( I m a x I m i n )
R S E I 0 = P C 1 [ f ( Greenness , W e t n e s s , D r y n e s s , H e a t ) ]
R S E I = ( R S E I 0 R S E I 0 m i n ) / ( R S E I 0 max R S E I 0 m i n )
Greenness is represented by NDVI. NDBSI is used to calculate the dryness, which is the average value of SI and IBI. Wetness is determined via a Tasseled Cap Transformation’s wet component. Heat is represented by the LST.
The RSEI have values between 0 and 1, and the EEQ is better the closer the value is to 1. Similarly, a higher mean value of RSEI indicates a better EEQ. According to the classification of the RSEI by Hu and Xu [45], the RSEI was classified into five levels according to the equal interval classification method: Poor (Level 1, 0 < RSEI < 0.2), Fair (Level 2, 0.2 < RSEI < 0.4), Moderate (Level 3, 0.4 < RSEI < 0.6), Good (Level 4, 0.6 < RSEI < 0.8), and Excellent (Level 5, 0.8 < RSEI < 1). Therefore, the last RSEI rating reflects how the research area’s ecosystem is.

2.4. Spatial Autocorrelation Analysis

The association between the elemental EEQ and the neighboring spatial eco-environment can be determined by looking at the spatial autocorrelation [46]. One method for describing the spatial homogeneity of distribution of EEQ in the study region is through spatial correlation analysis of EEQ. In this work, the geographic correlation of RSEI is examined using global/local spatial autocorrelation (Global Moran’s I/Local Moran’s I) [47,48].
The correlation between the attribute values of nearby geographical units is reflected in the Global Moran’s I index. A stronger geographical autocorrelation is indicated by a Moran’s I absolute value that is closer to 1 [49]:
G l o b a l   M o r a n s   I = n × i = 1 n j = 1 n w i , j z i z j i = 1 n j = 1 n w i , j z i 2
n is the overall number of components. zi is the EEQ value’s divergence from the research area’s mean EEQ at site i. Wi,j determines how elements i and j are weighted spatially. The range of Moran’s I is −1 to 1. The EEQ is correlated positively with Moran’s I as it approaches +1, negatively with it as it approaches −1, and not at all with 0 (indicating no spatial autocorrelation) [50].
Optimized hot spot analysis effectively identifies spatial clusters of statistically significant high values and low values [51]. It automatically aggregates event data, identifies appropriate analysis ranges, and corrects for multiple testing and spatial dependencies. The calculation formula is as follows:
G i * = j = 1 n w i , j x j X ¯ j = 1 n w i , j S [ n j = 1 n w i , j 2 ( j = 1 n w i , j ) 2 ] n 1
X ¯ = j = 1 n x j n
S = j = 1 n x j 2 n ( X ¯ ) 2
G i * represents the statistically significant hot spots and cold spots. The calculation parameters are the same as in Formula (12).

3. Results

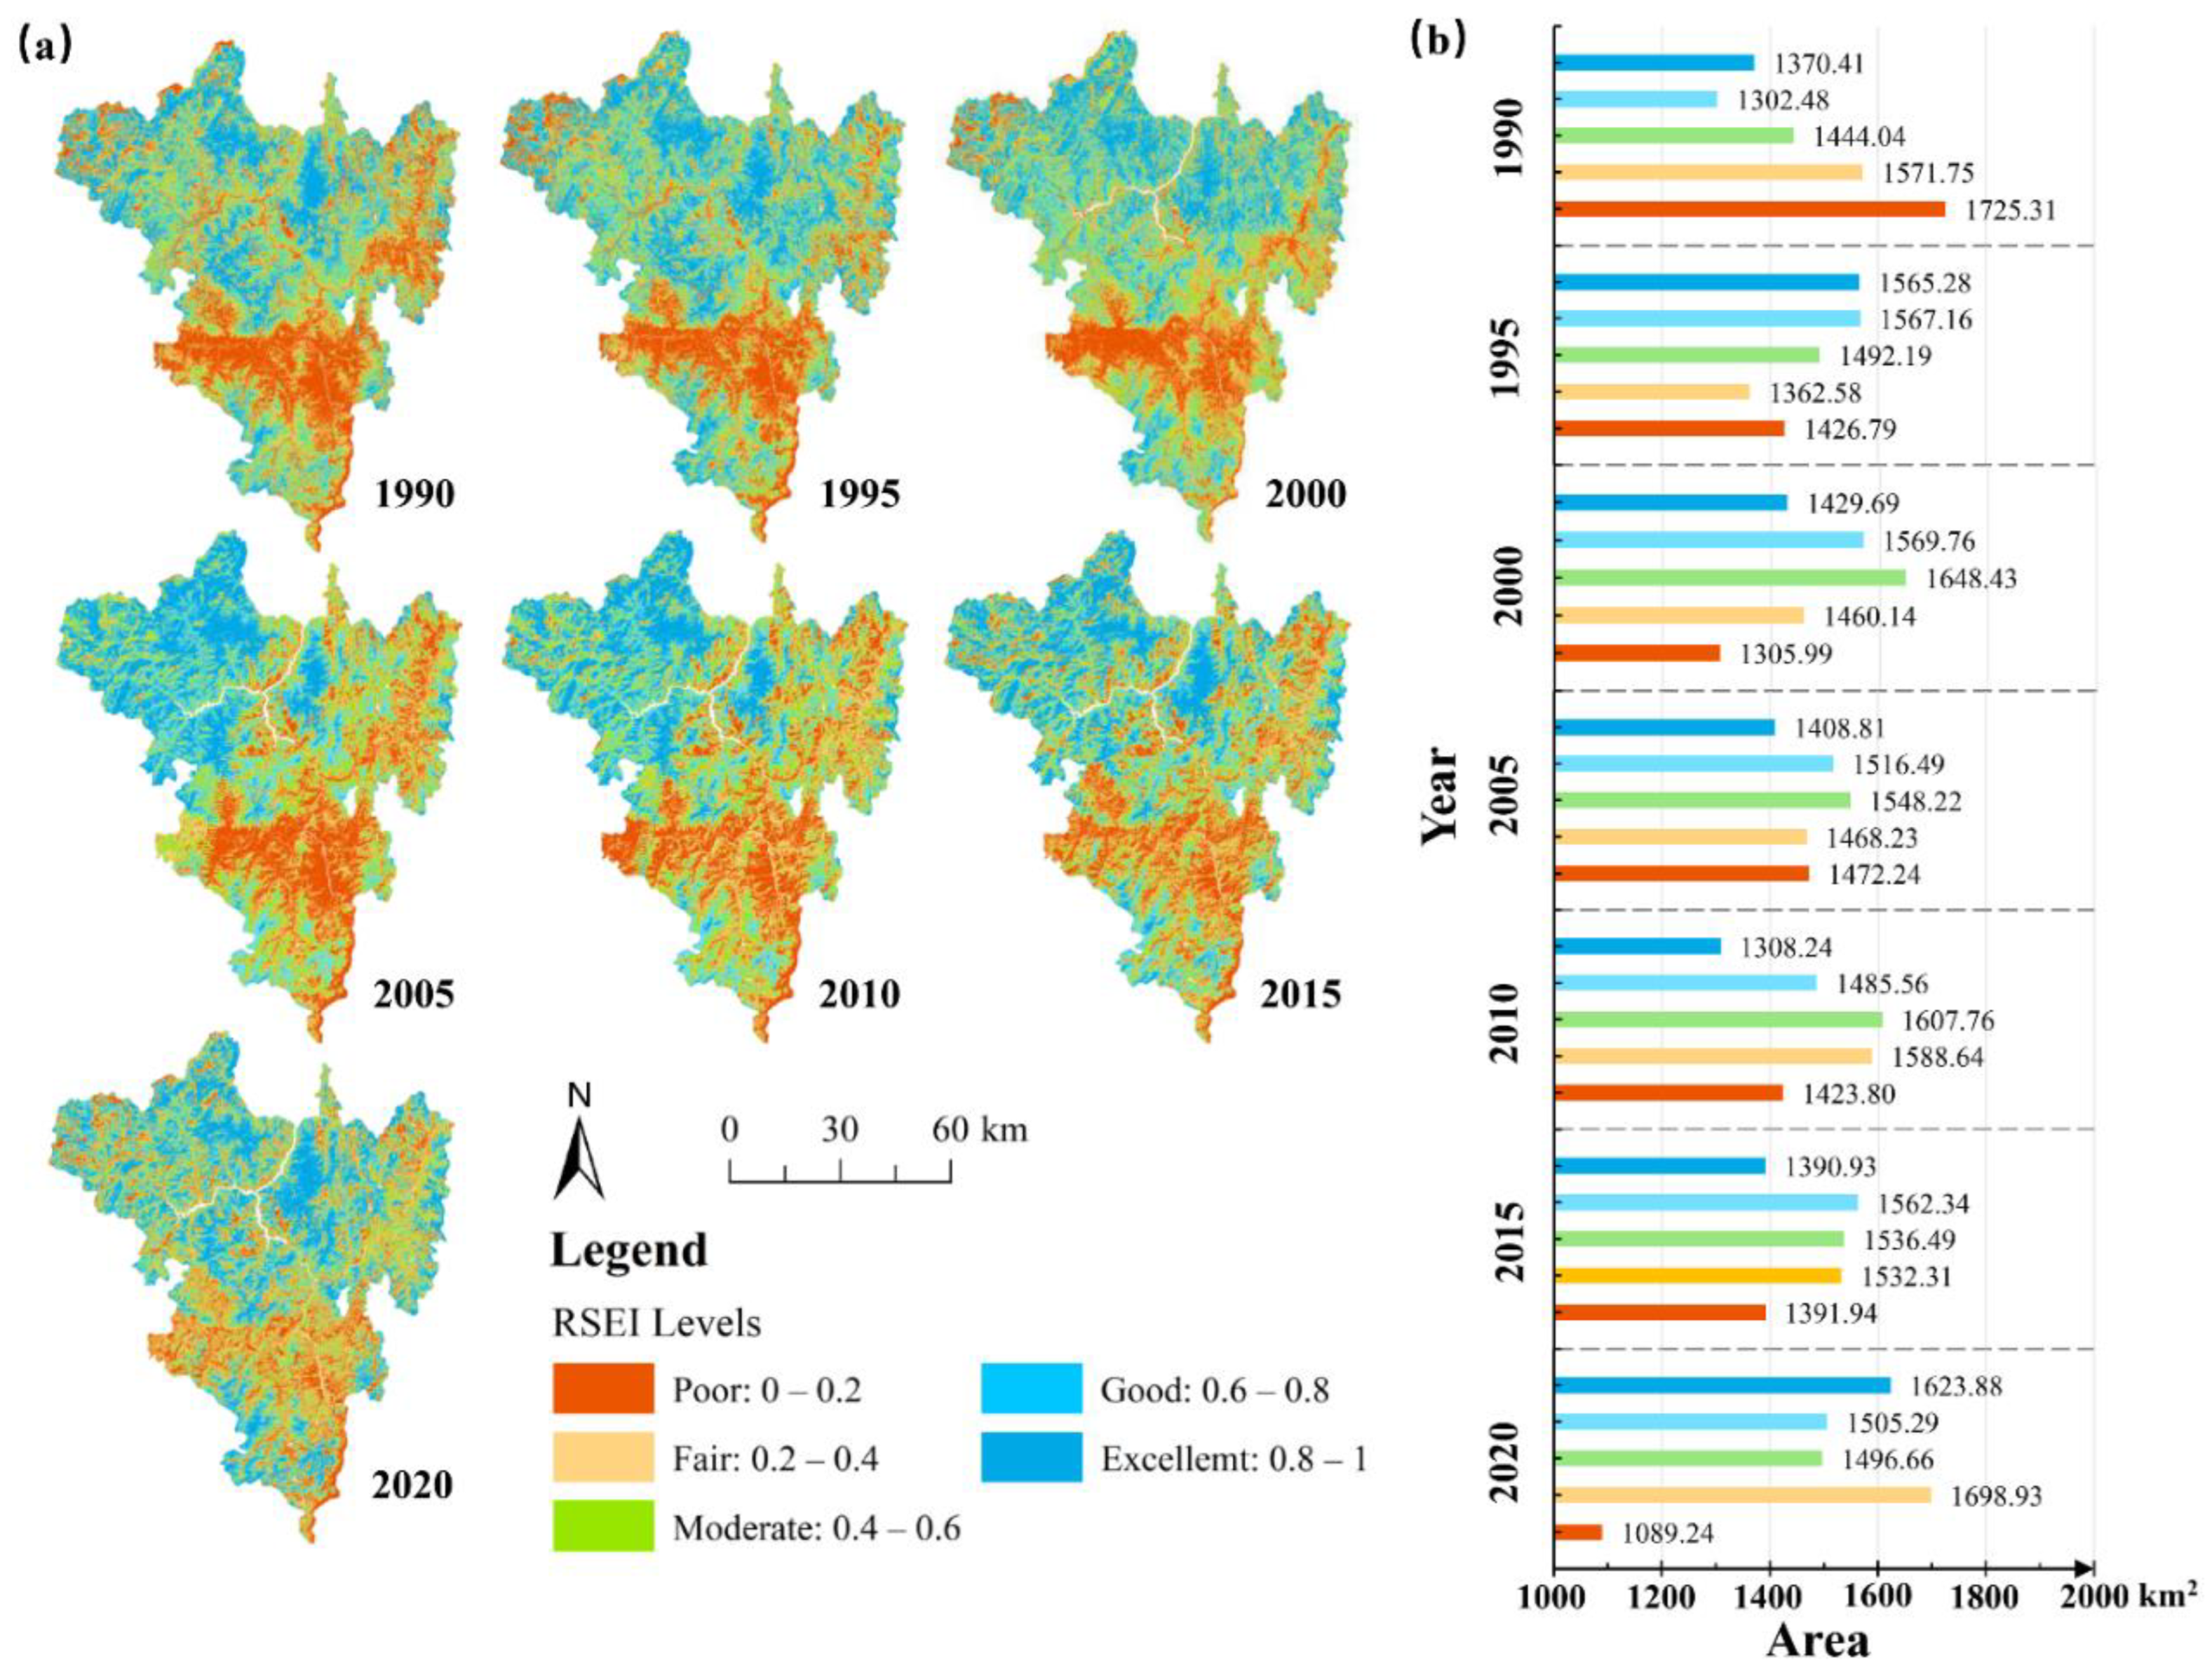
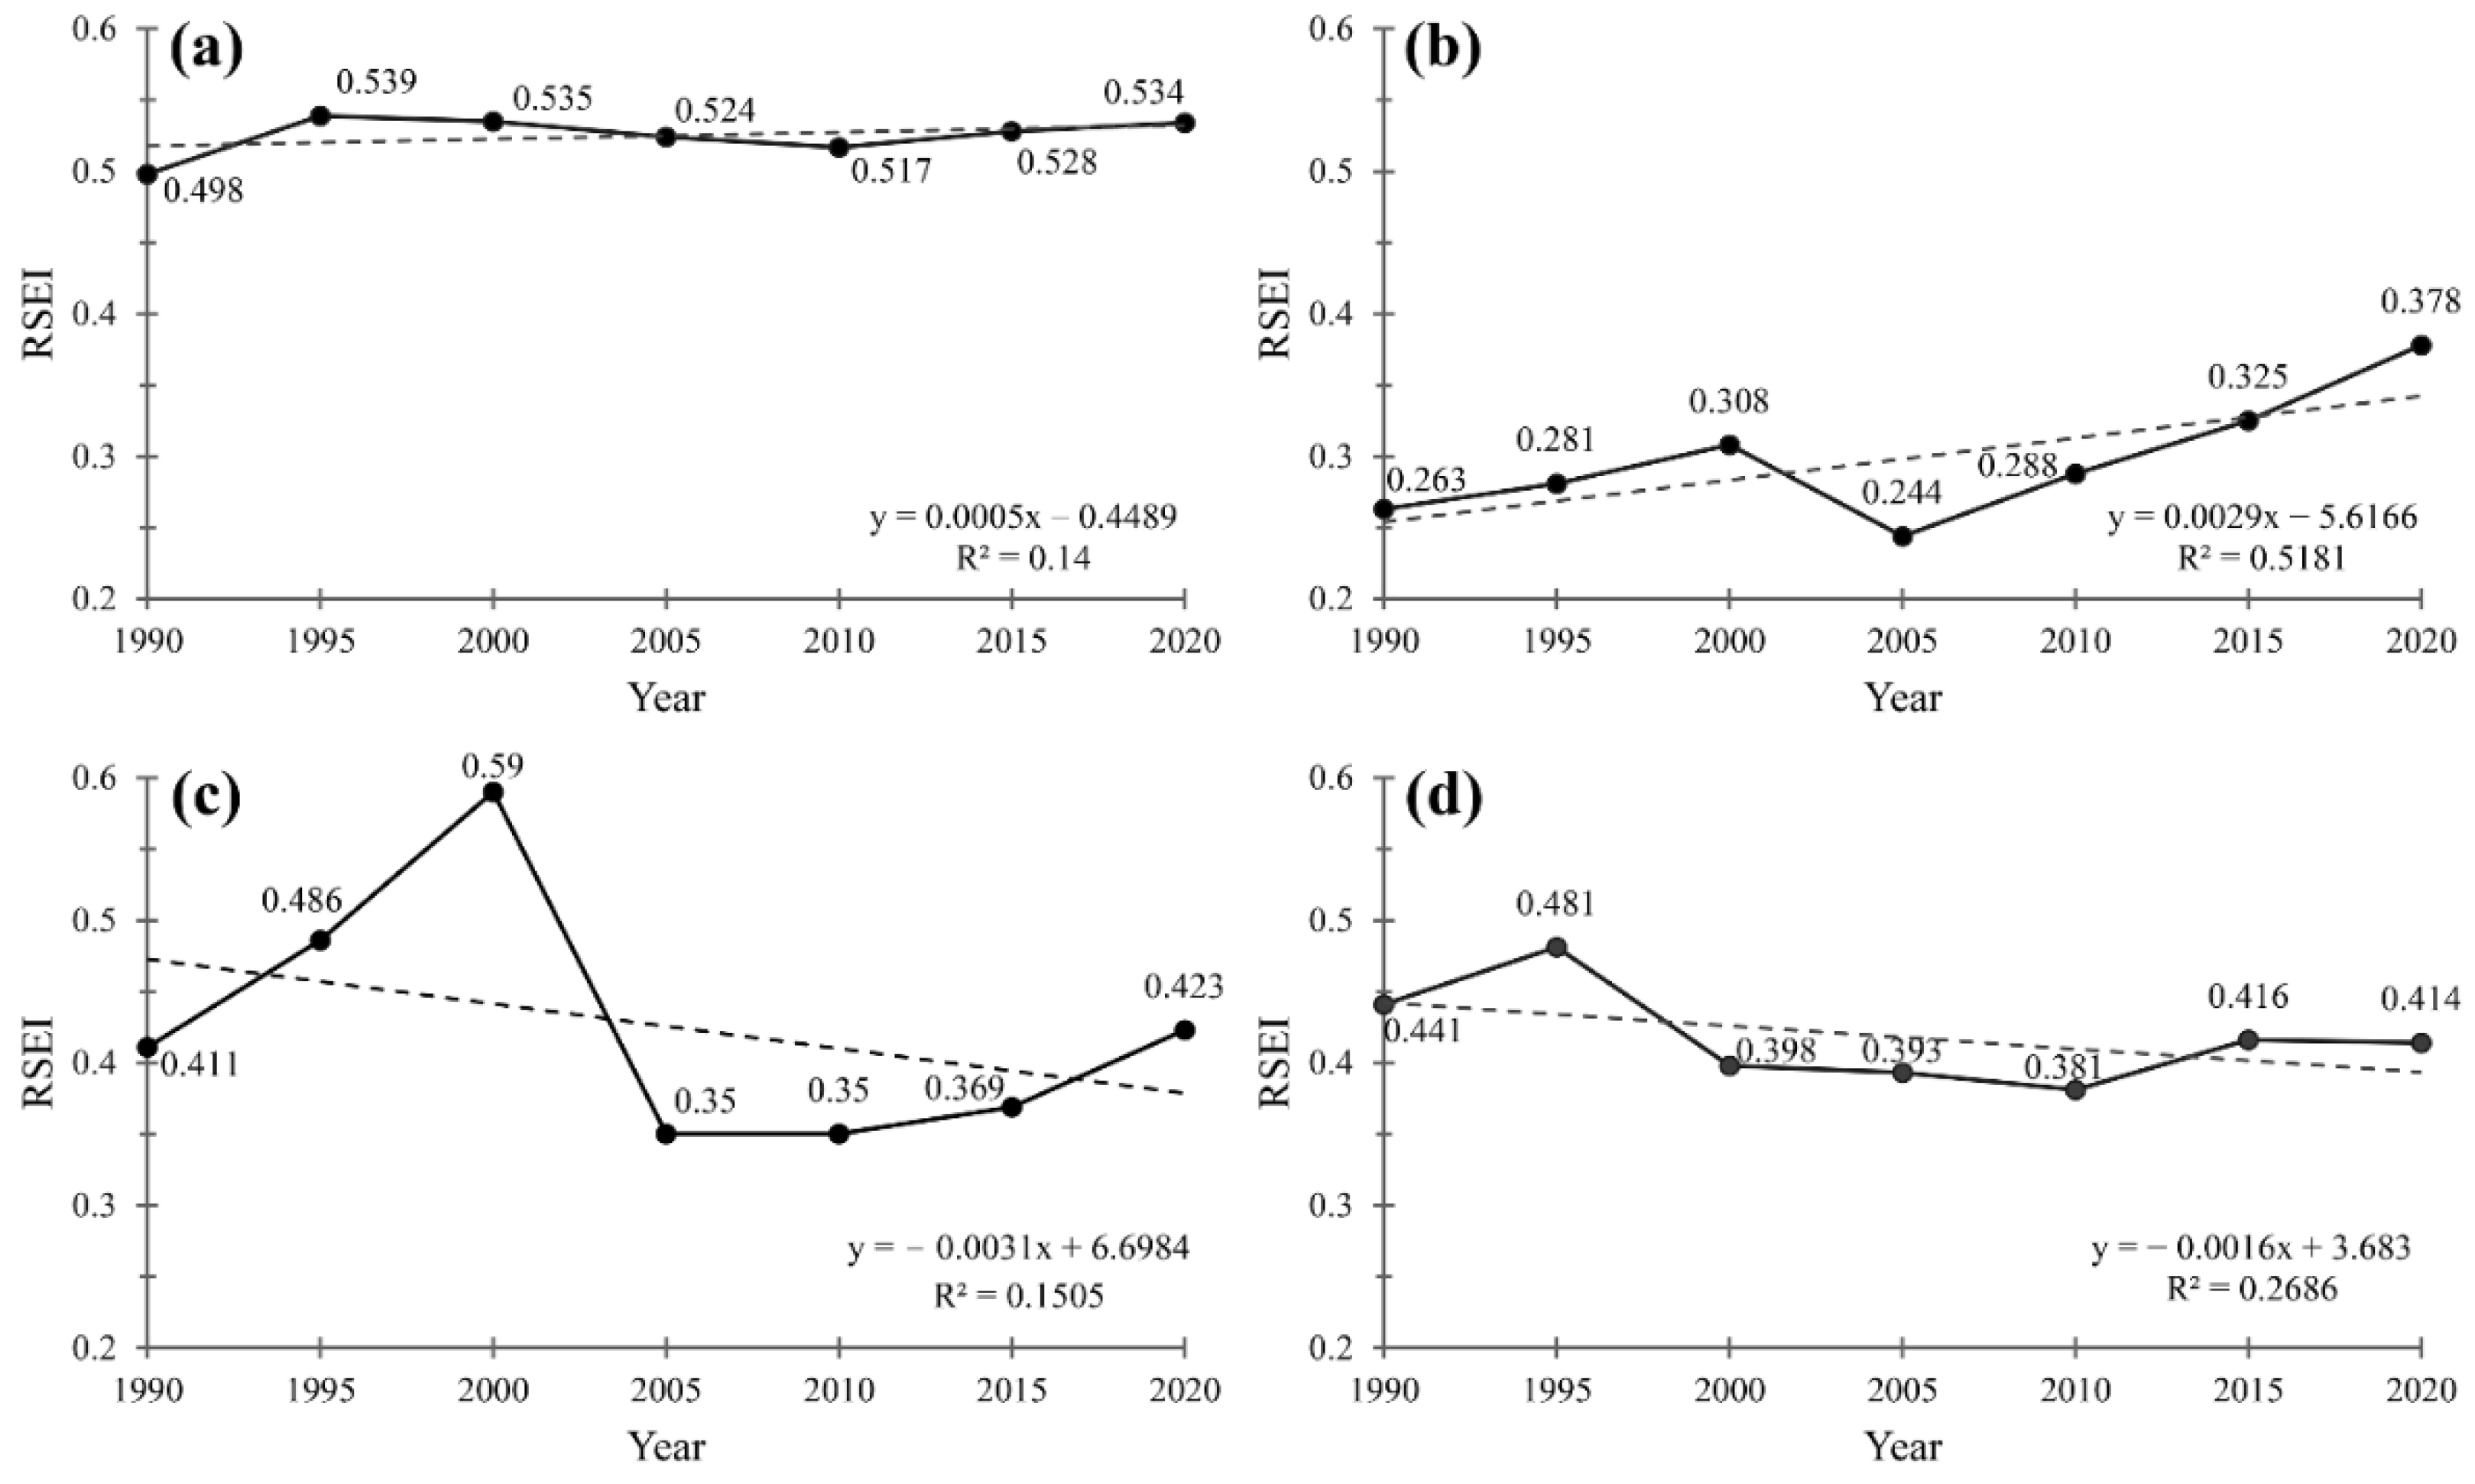
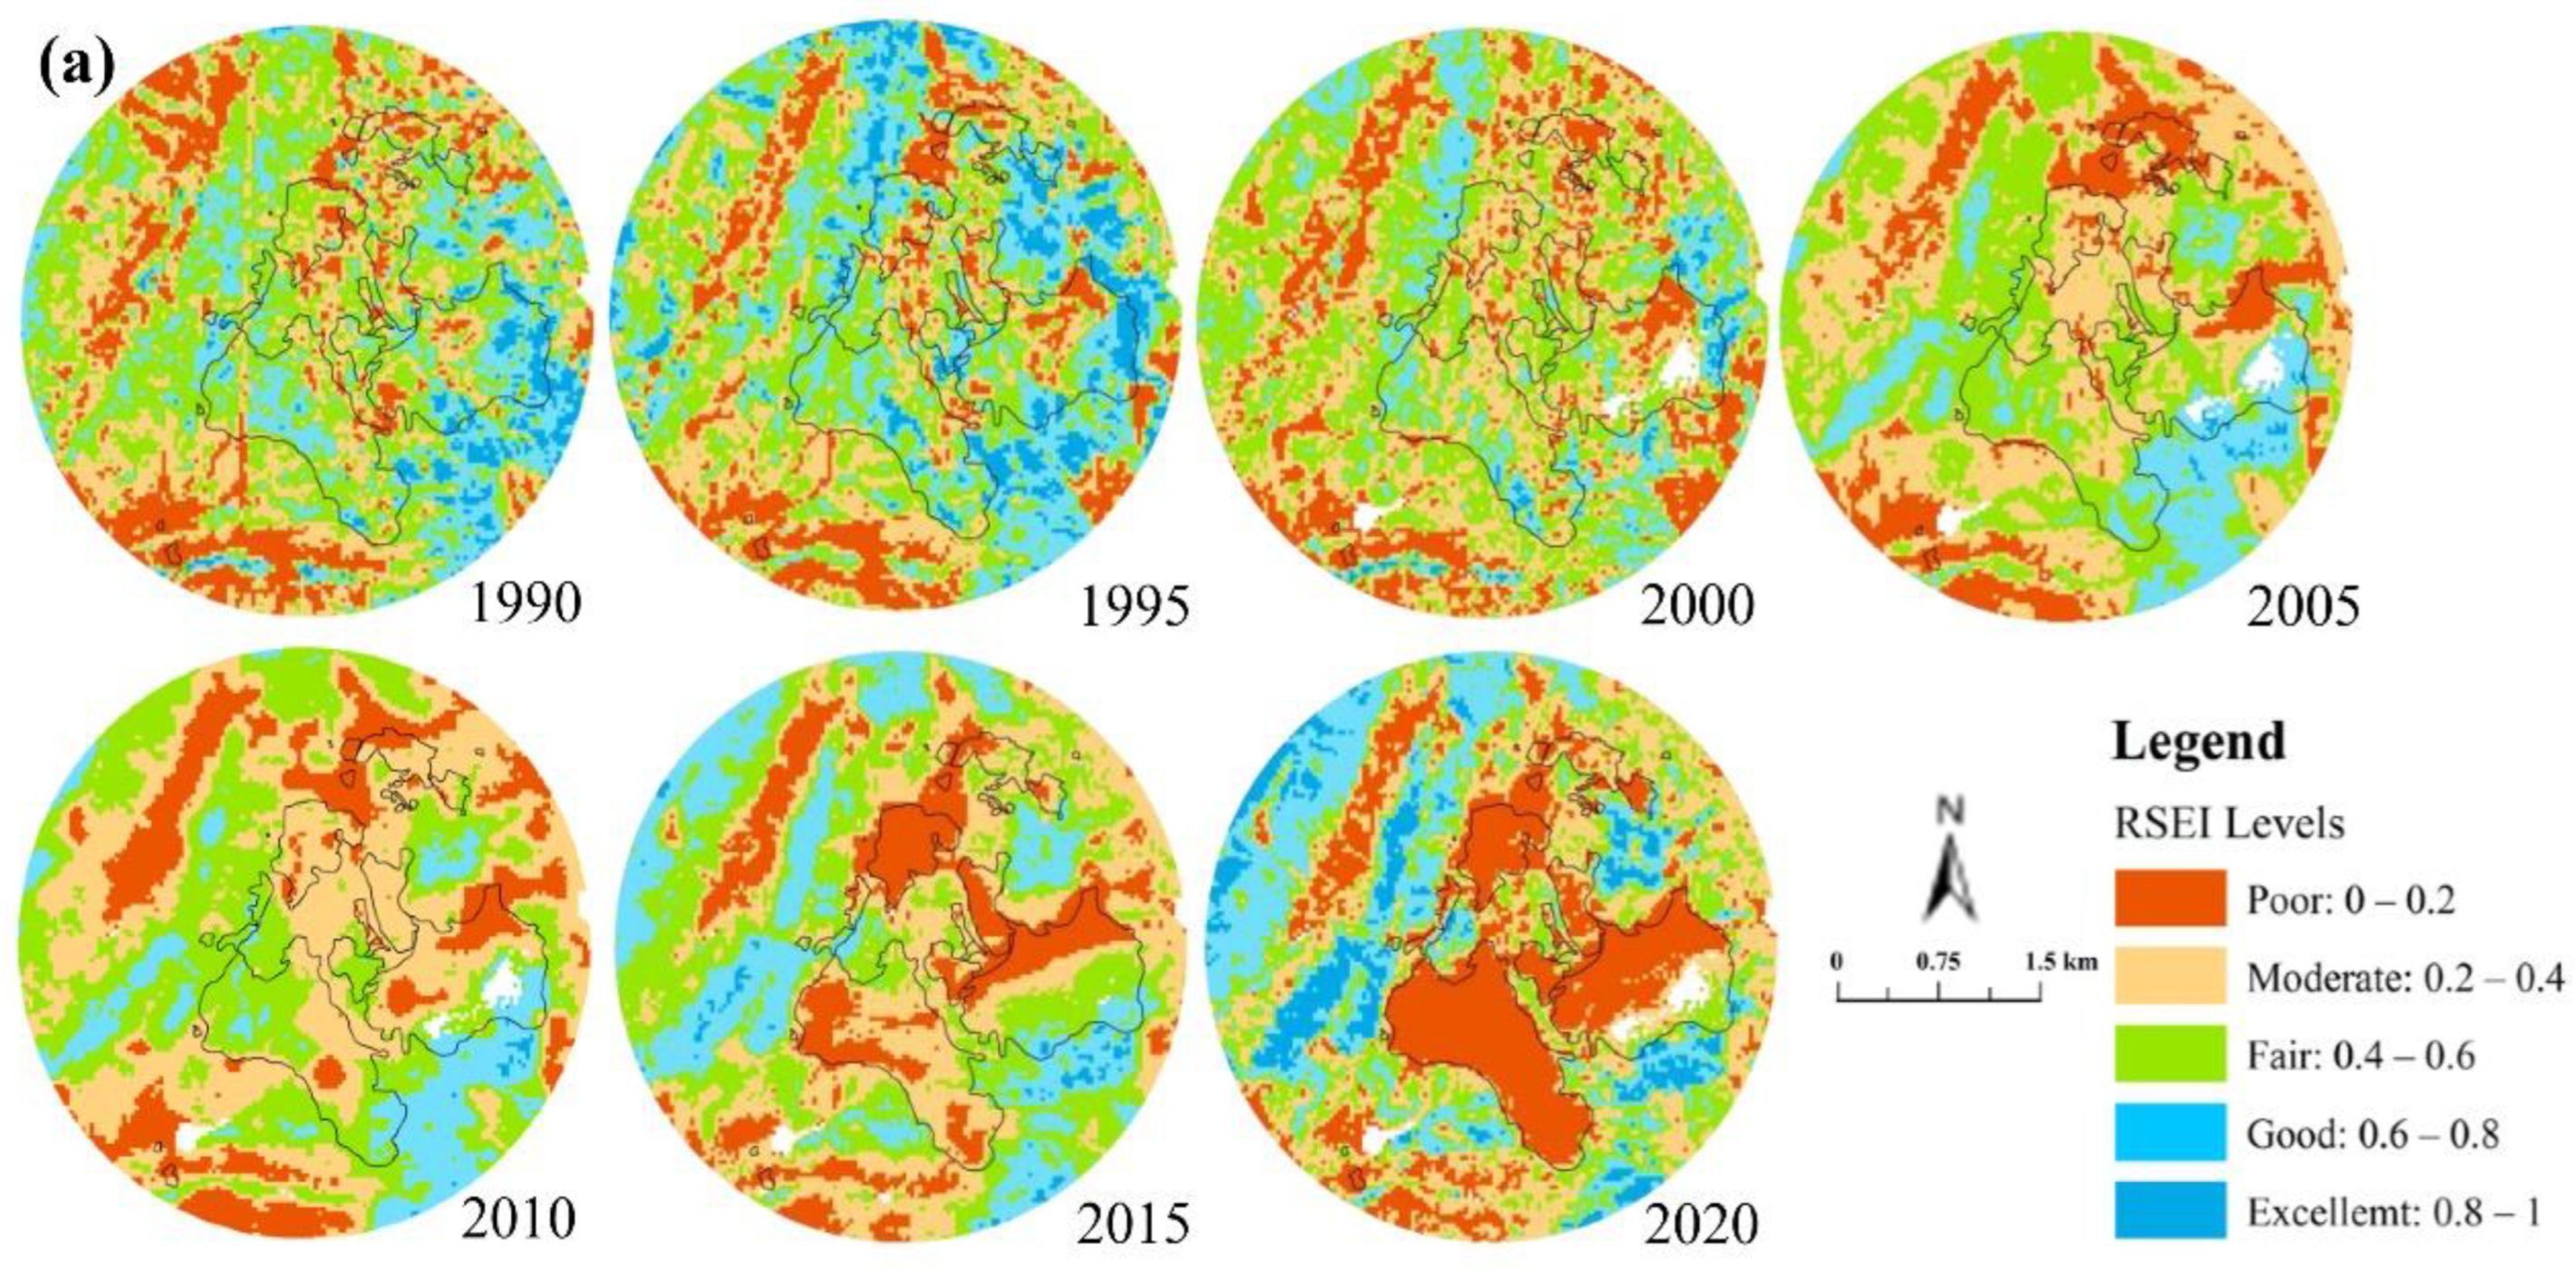
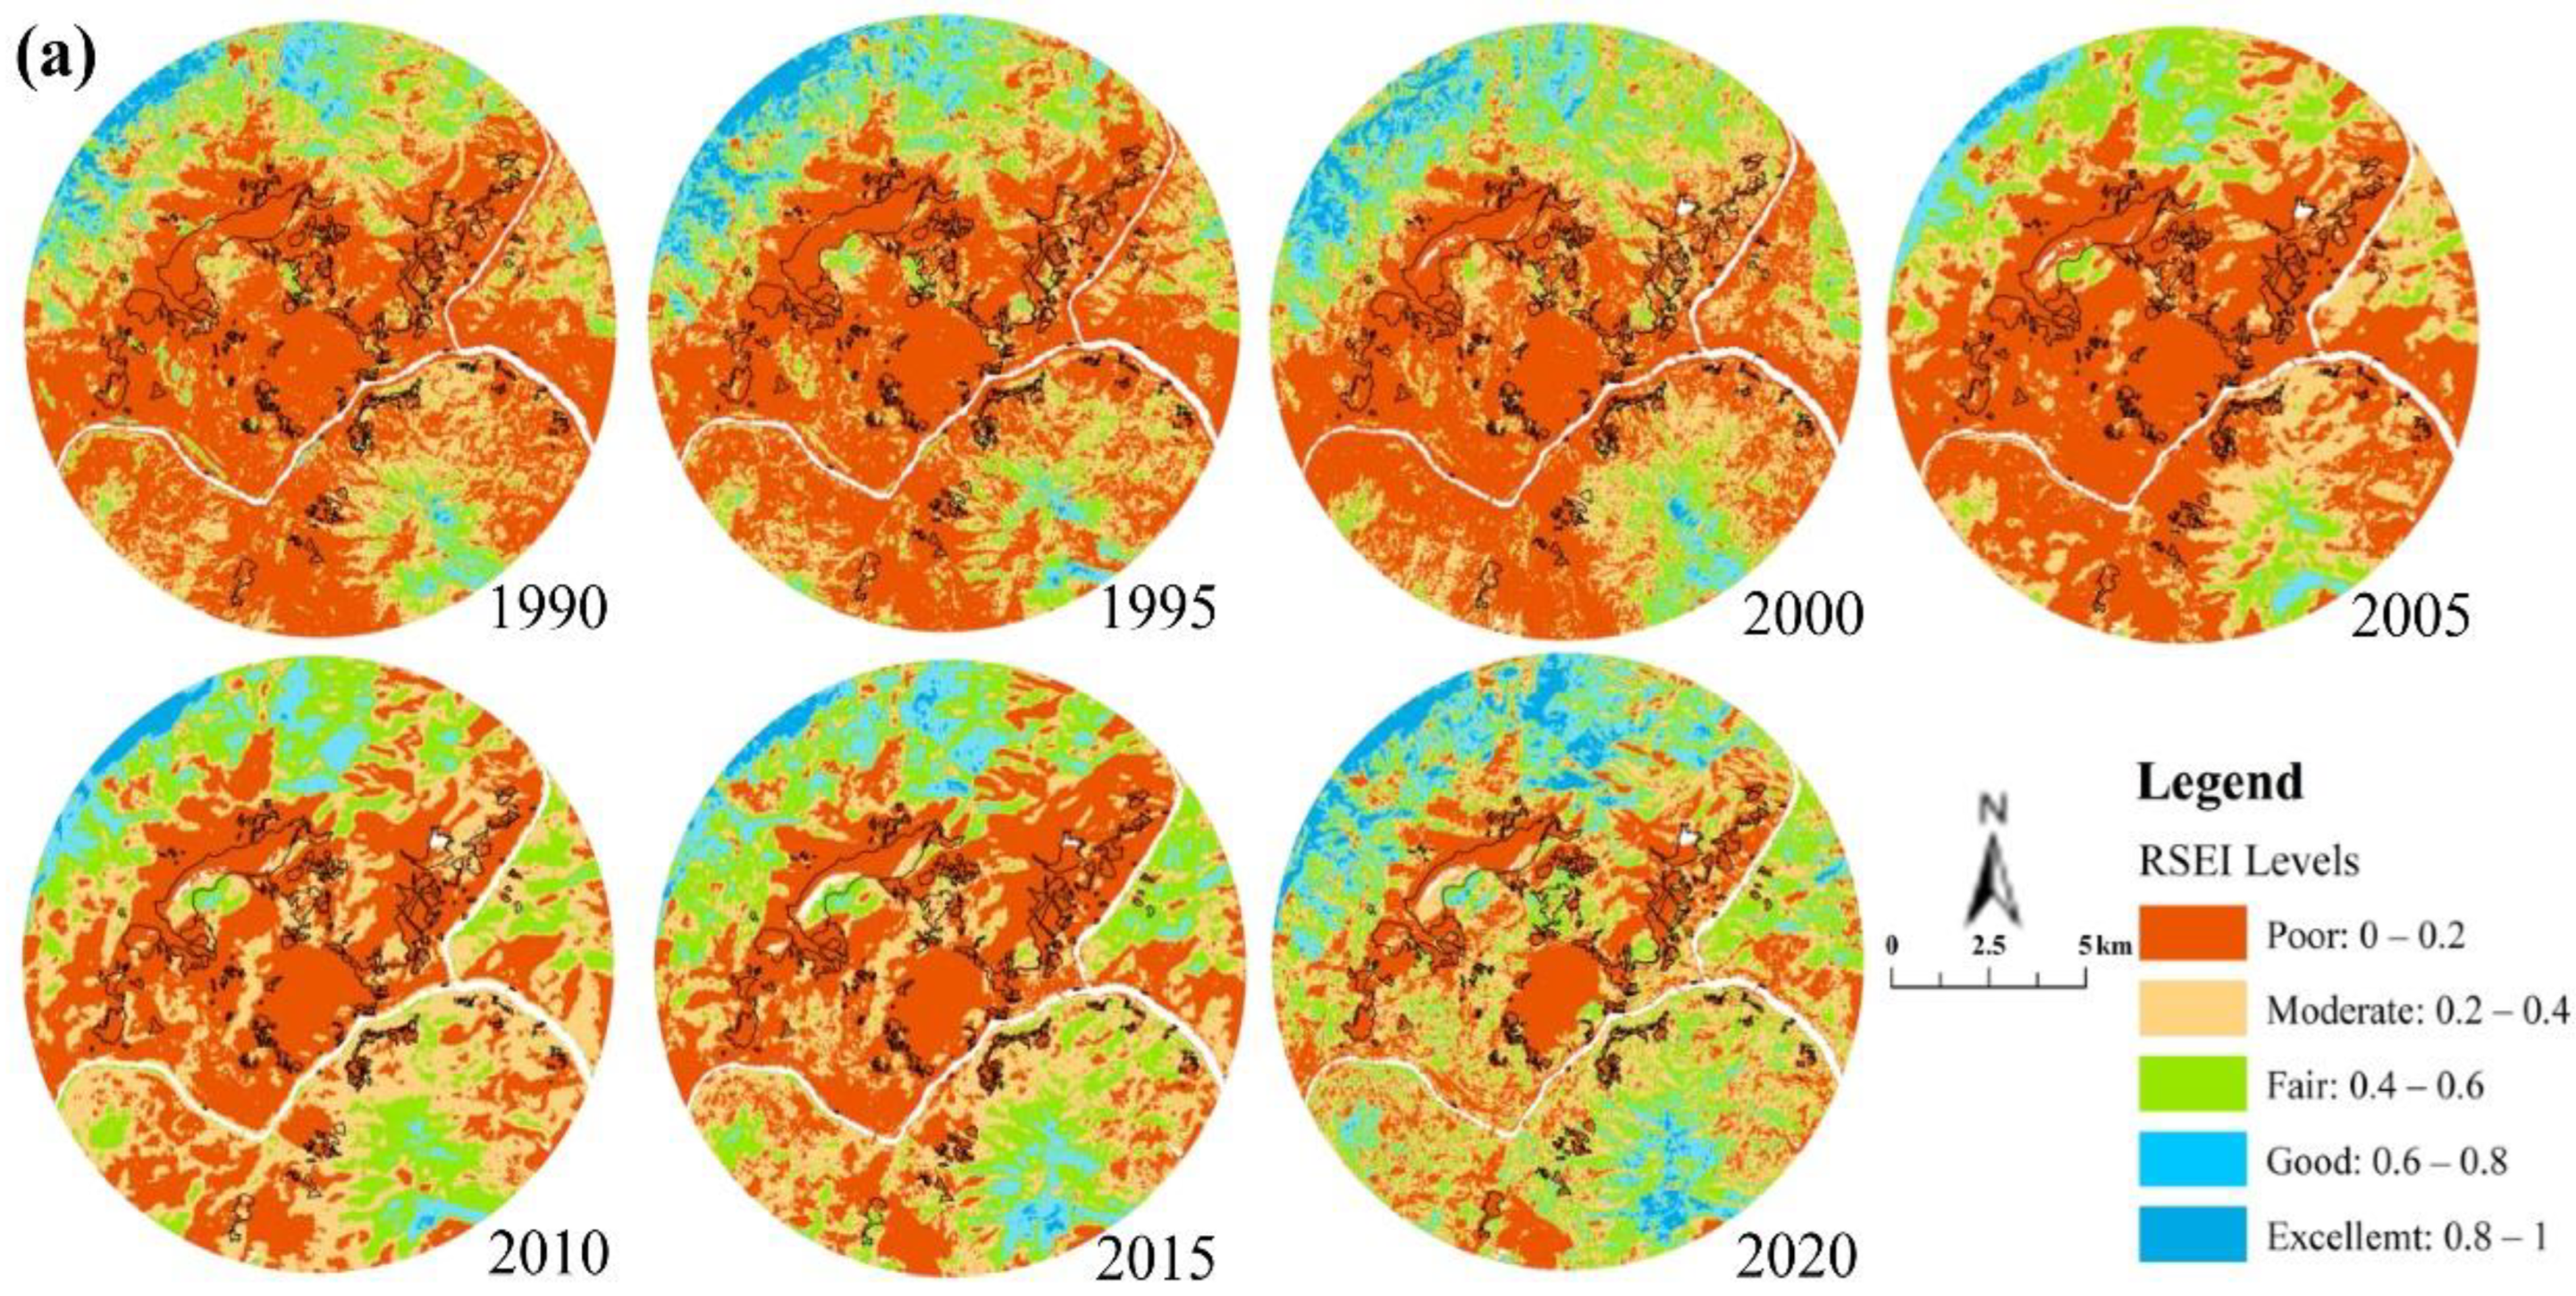
3.1. Comprehensive Evaluation of EEQ of Panzhihua City

Table 1 shows that the PC1 contributes more than 75% of the time in all seven historical images from 1990 to 2020, indicating that PC1 can express most of the characteristics of NDVI, WET, LST, and NDBSI [22]. The eigenvalues of PC2, PC3, and PC4 have positive and negative numbers, and are anomalous variable loadings. However, NDVI and WET have positive eigenvalues in PC1, but LST and NDBSI have negative eigenvalues, which is consistent with reality.
The poorer EEQ is mainly seen in towns and cities along the river in central Panzhihua and the farming areas in the northeast with a low elevation, high urbanization, and frequent human activities. Areas with better EEQ are mainly distributed in the north with a higher elevation, higher vegetation coverage, and lower urbanization (Figure 3a and Figure A4). From 1990 to 2020, the ecological environment in more than 50% of the area in Panzhihua is rated as moderate (level 3), good (level 4), and excellent (level 5), and the proportion of the area rated as poor (level 1) gradually decreases from 23% in 1990 to 15% in 2020, showing that the EEQ has been improved (Figure 3b).
The mean values of RSEI in Panzhihua are 0.498 (1990), 0.539 (1995), 0.535 (2000), 0.524 (2005), 0.517 (2010), 0.528 (2015), and 0.534 (2020) (Figure 4a). The three mining areas in Panzhihua show different trends in the proportion of areas with good and excellent (level 4 and level 5) ecological environmental quality: the total percentage of area at level 4 and level 5 in Baima mine first increased and then decreased, with 11.95% in 2005 being the bottom (1990: 24.36%, 1995: 34.53%, 2000: 48.45%, 2005: 11.95%, 2010: 12.78%, 2015: 16.73%, 2020: 25.07%). The total percentage of area at level 4 and level 5 in Panjiantian mine showed a sharp decrease from 1995 to 2000 (from 31.4% in 1995 to 13.70% in 2000), with the smallest percentage being 11.39% in 2010. Zhulan mine was mined before the study period in this paper, and its total percentage of area at level 4 and level 5 did not change much from 1990 to 2015. Its EEQ improved from 2015 to 2020, owing to the mine ecological restoration project carried out at that time (Table A1).
It can be found from the line graph of the mean value of RSEI in Panzhihua from 1990 to 2020 (Figure 4) that the mean value fluctuates around 0.5, and the EEQ of the three mining areas is much lower than that of Panzhihua. In Zhulan mine, mining activities started in the 1970s [52]. Its mining area did not change much after 1990. Its EEQ has improved slightly and its RSEI mean values maintain between 0.2 and 0.4, with the minimum value being 0.244 in 2005 and the maximum value being 0.318 in 2020. Baima mine showed a sharp drop in RSEI mean value from 2000 to 2005 (from 0.59 in 2000 to 0.35 in 2005 with a decrease of 41%), which resulted from the mining activities that started in 2003, when the mine was in the construction and production phase. It seriously damaged the surrounding ecological environment, resulting in a significant decrease in environmental quality. The RSEI mean value increased greatly and the EEQ was improved after 2015 because of the mine ecological restoration project carried out after 2017 [53]. Panjiatian mine also experienced a sudden decrease, which was 17%, in the mean value of RSEI from 1995 to 2000.

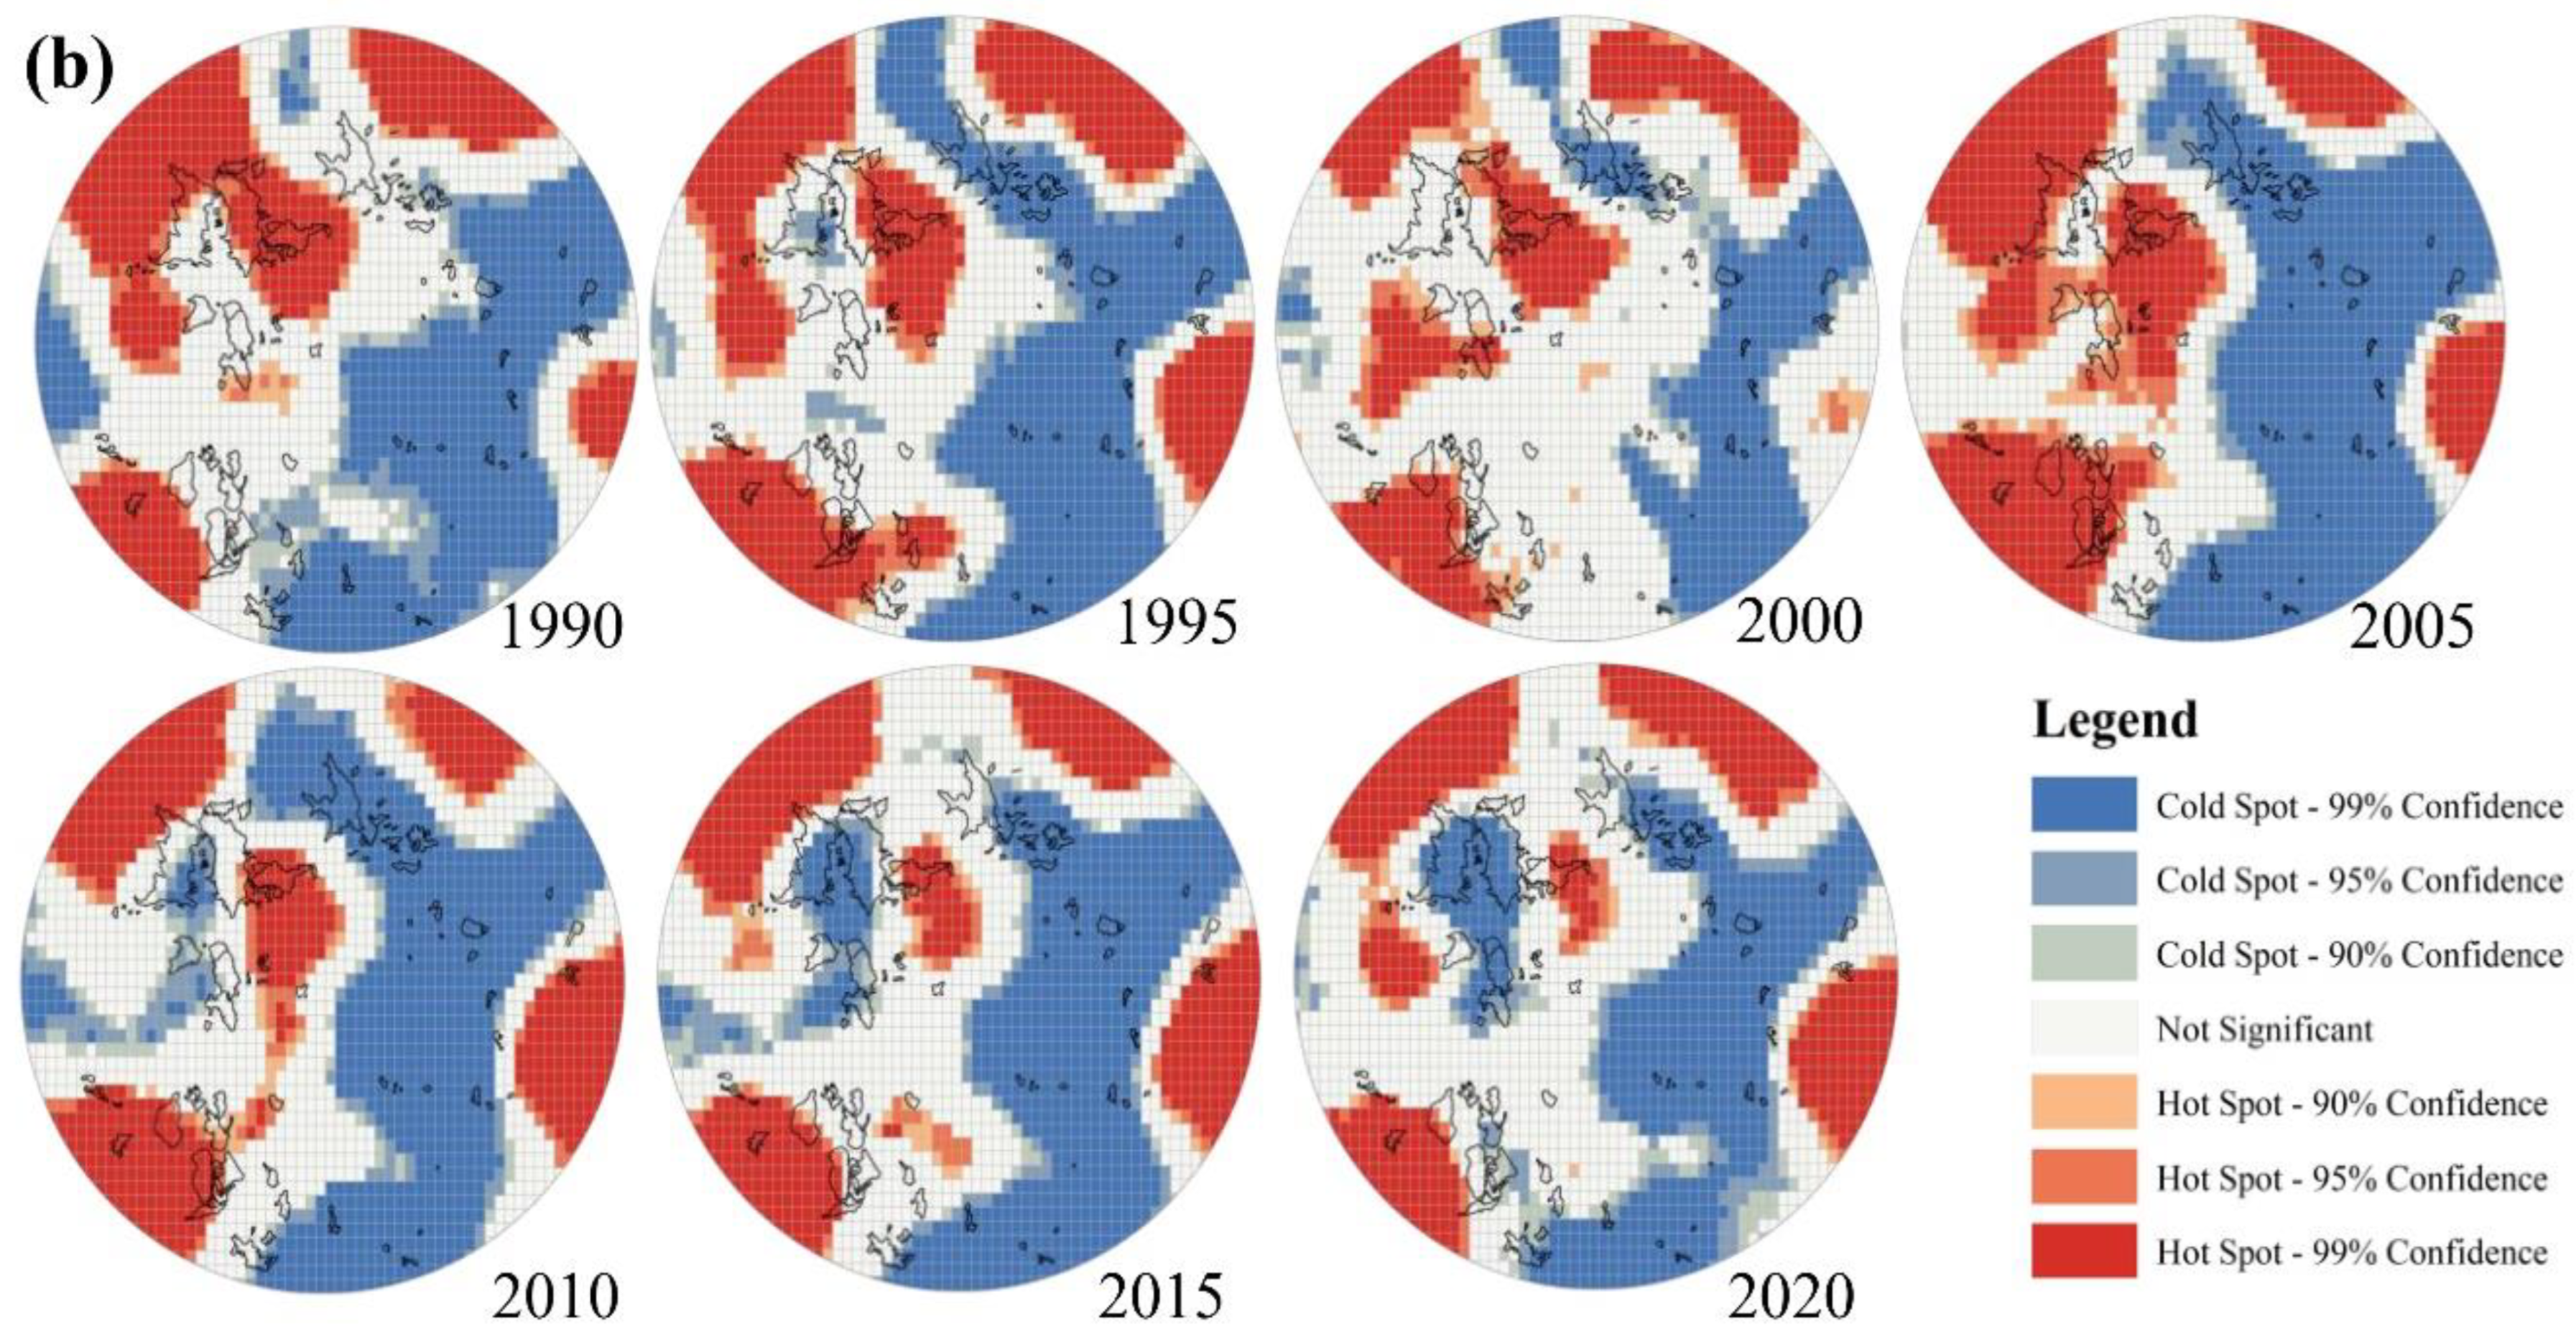
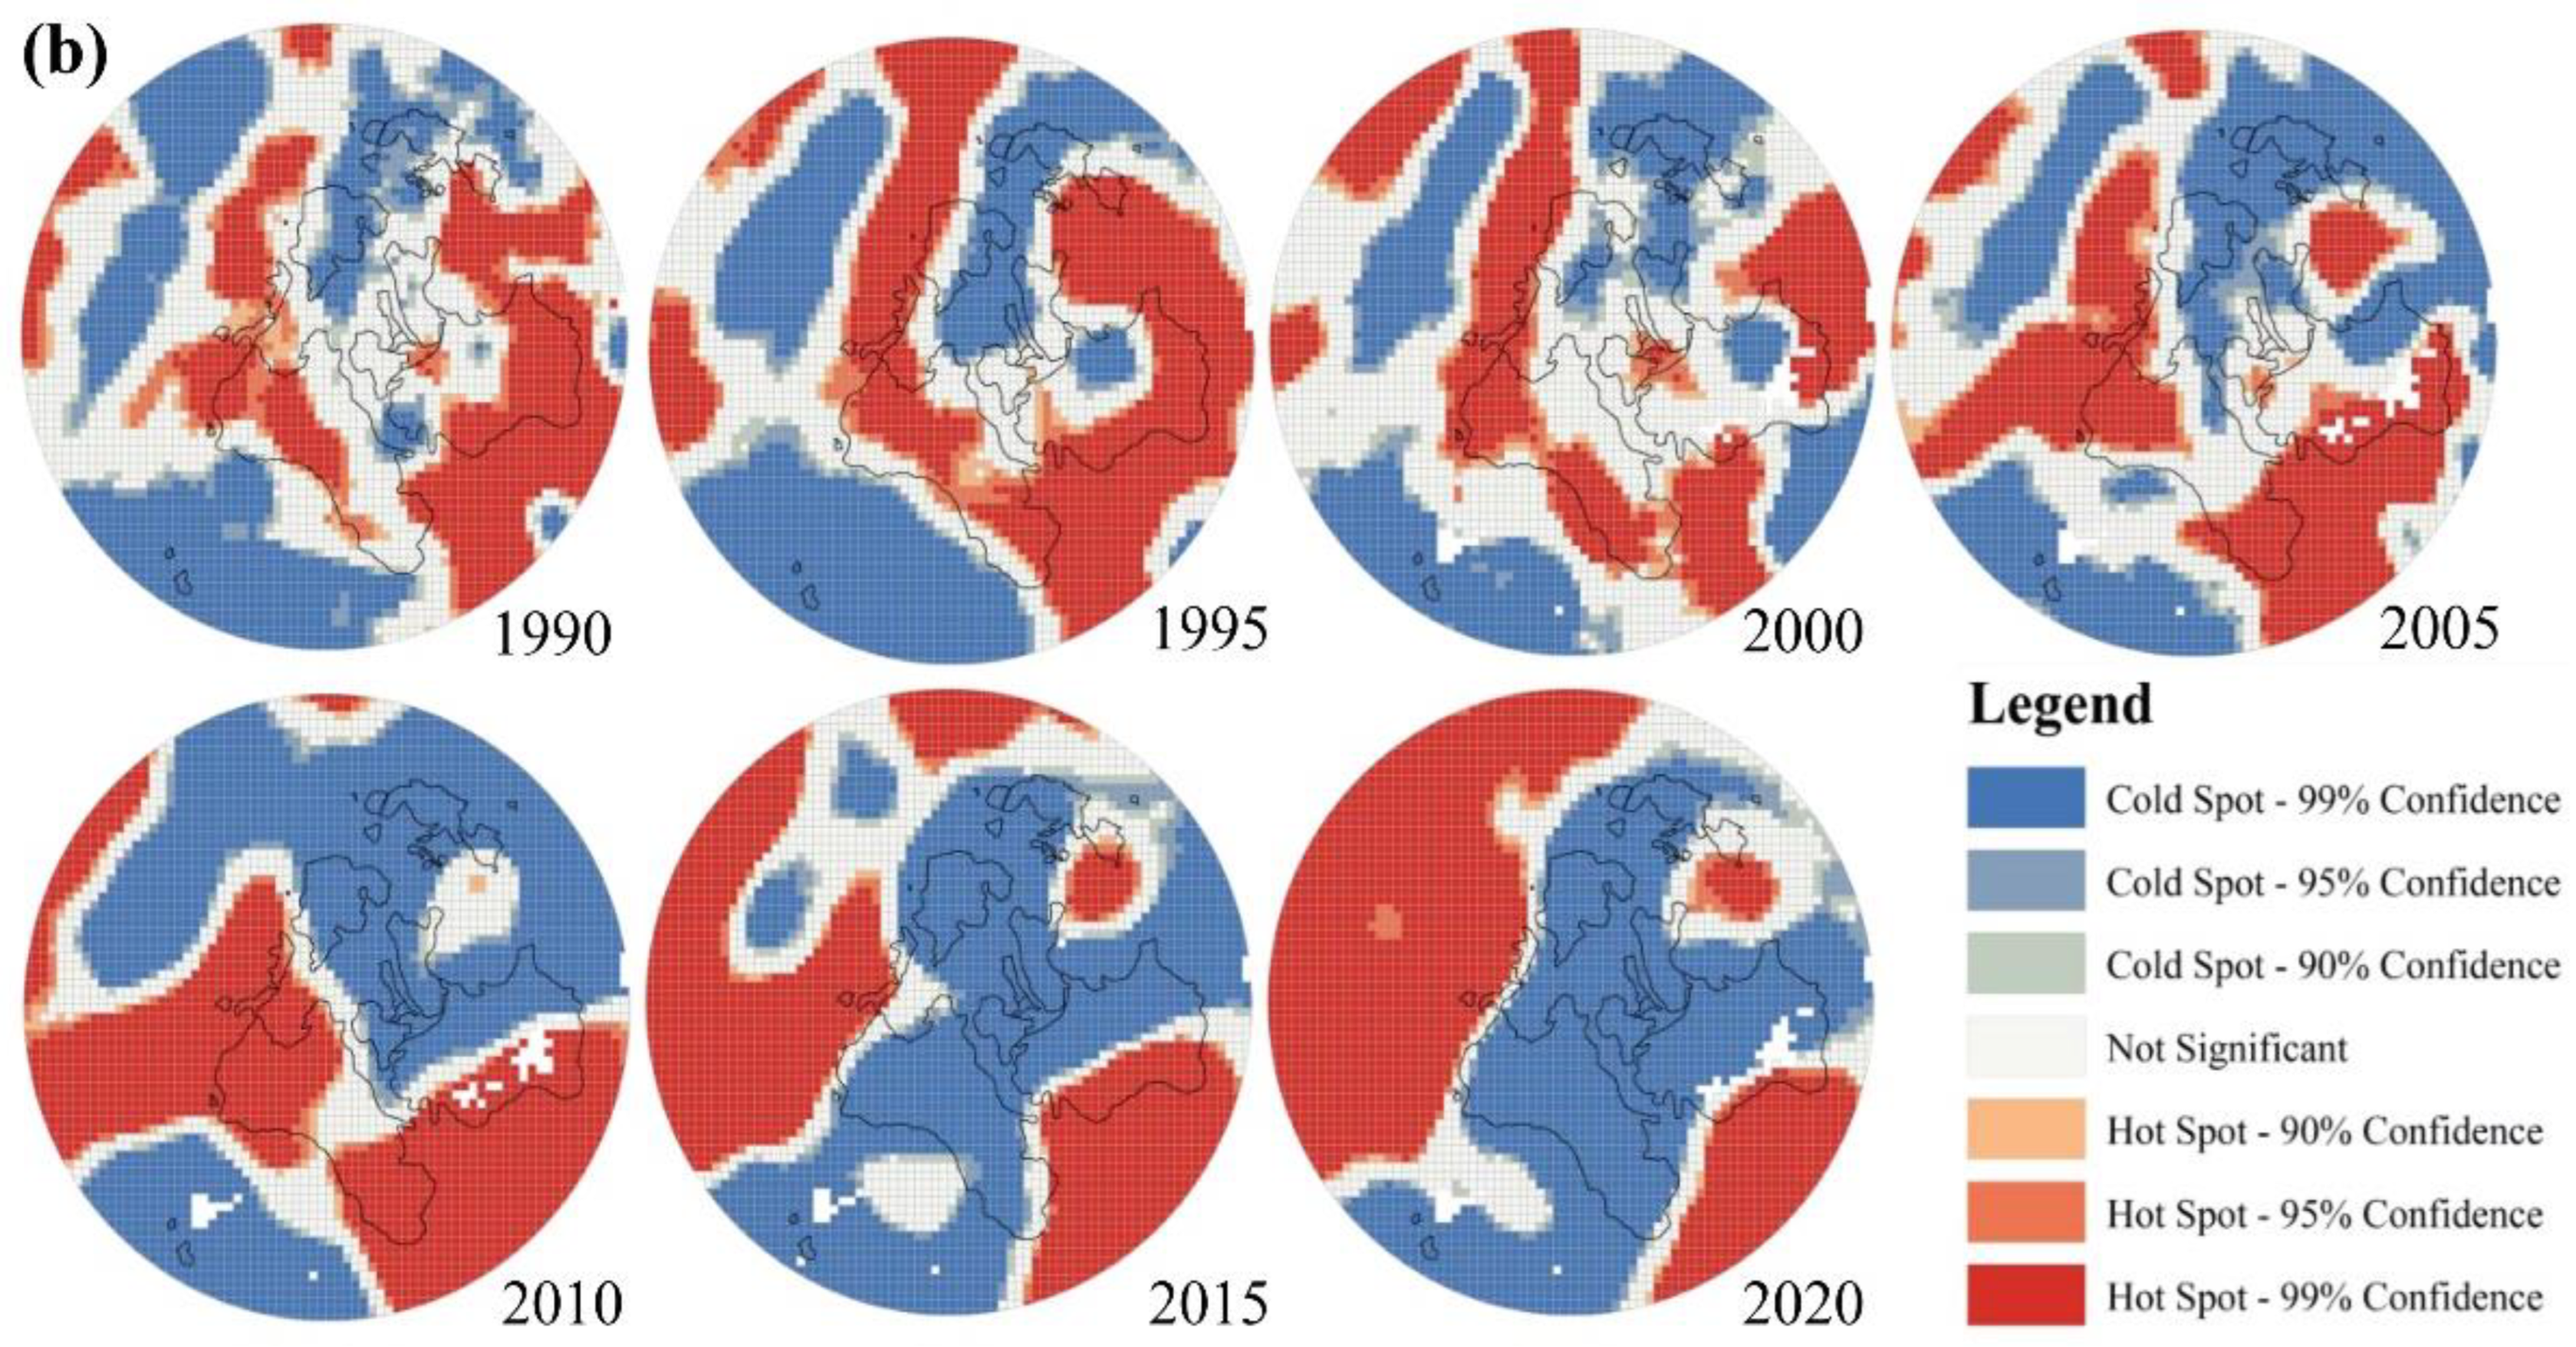
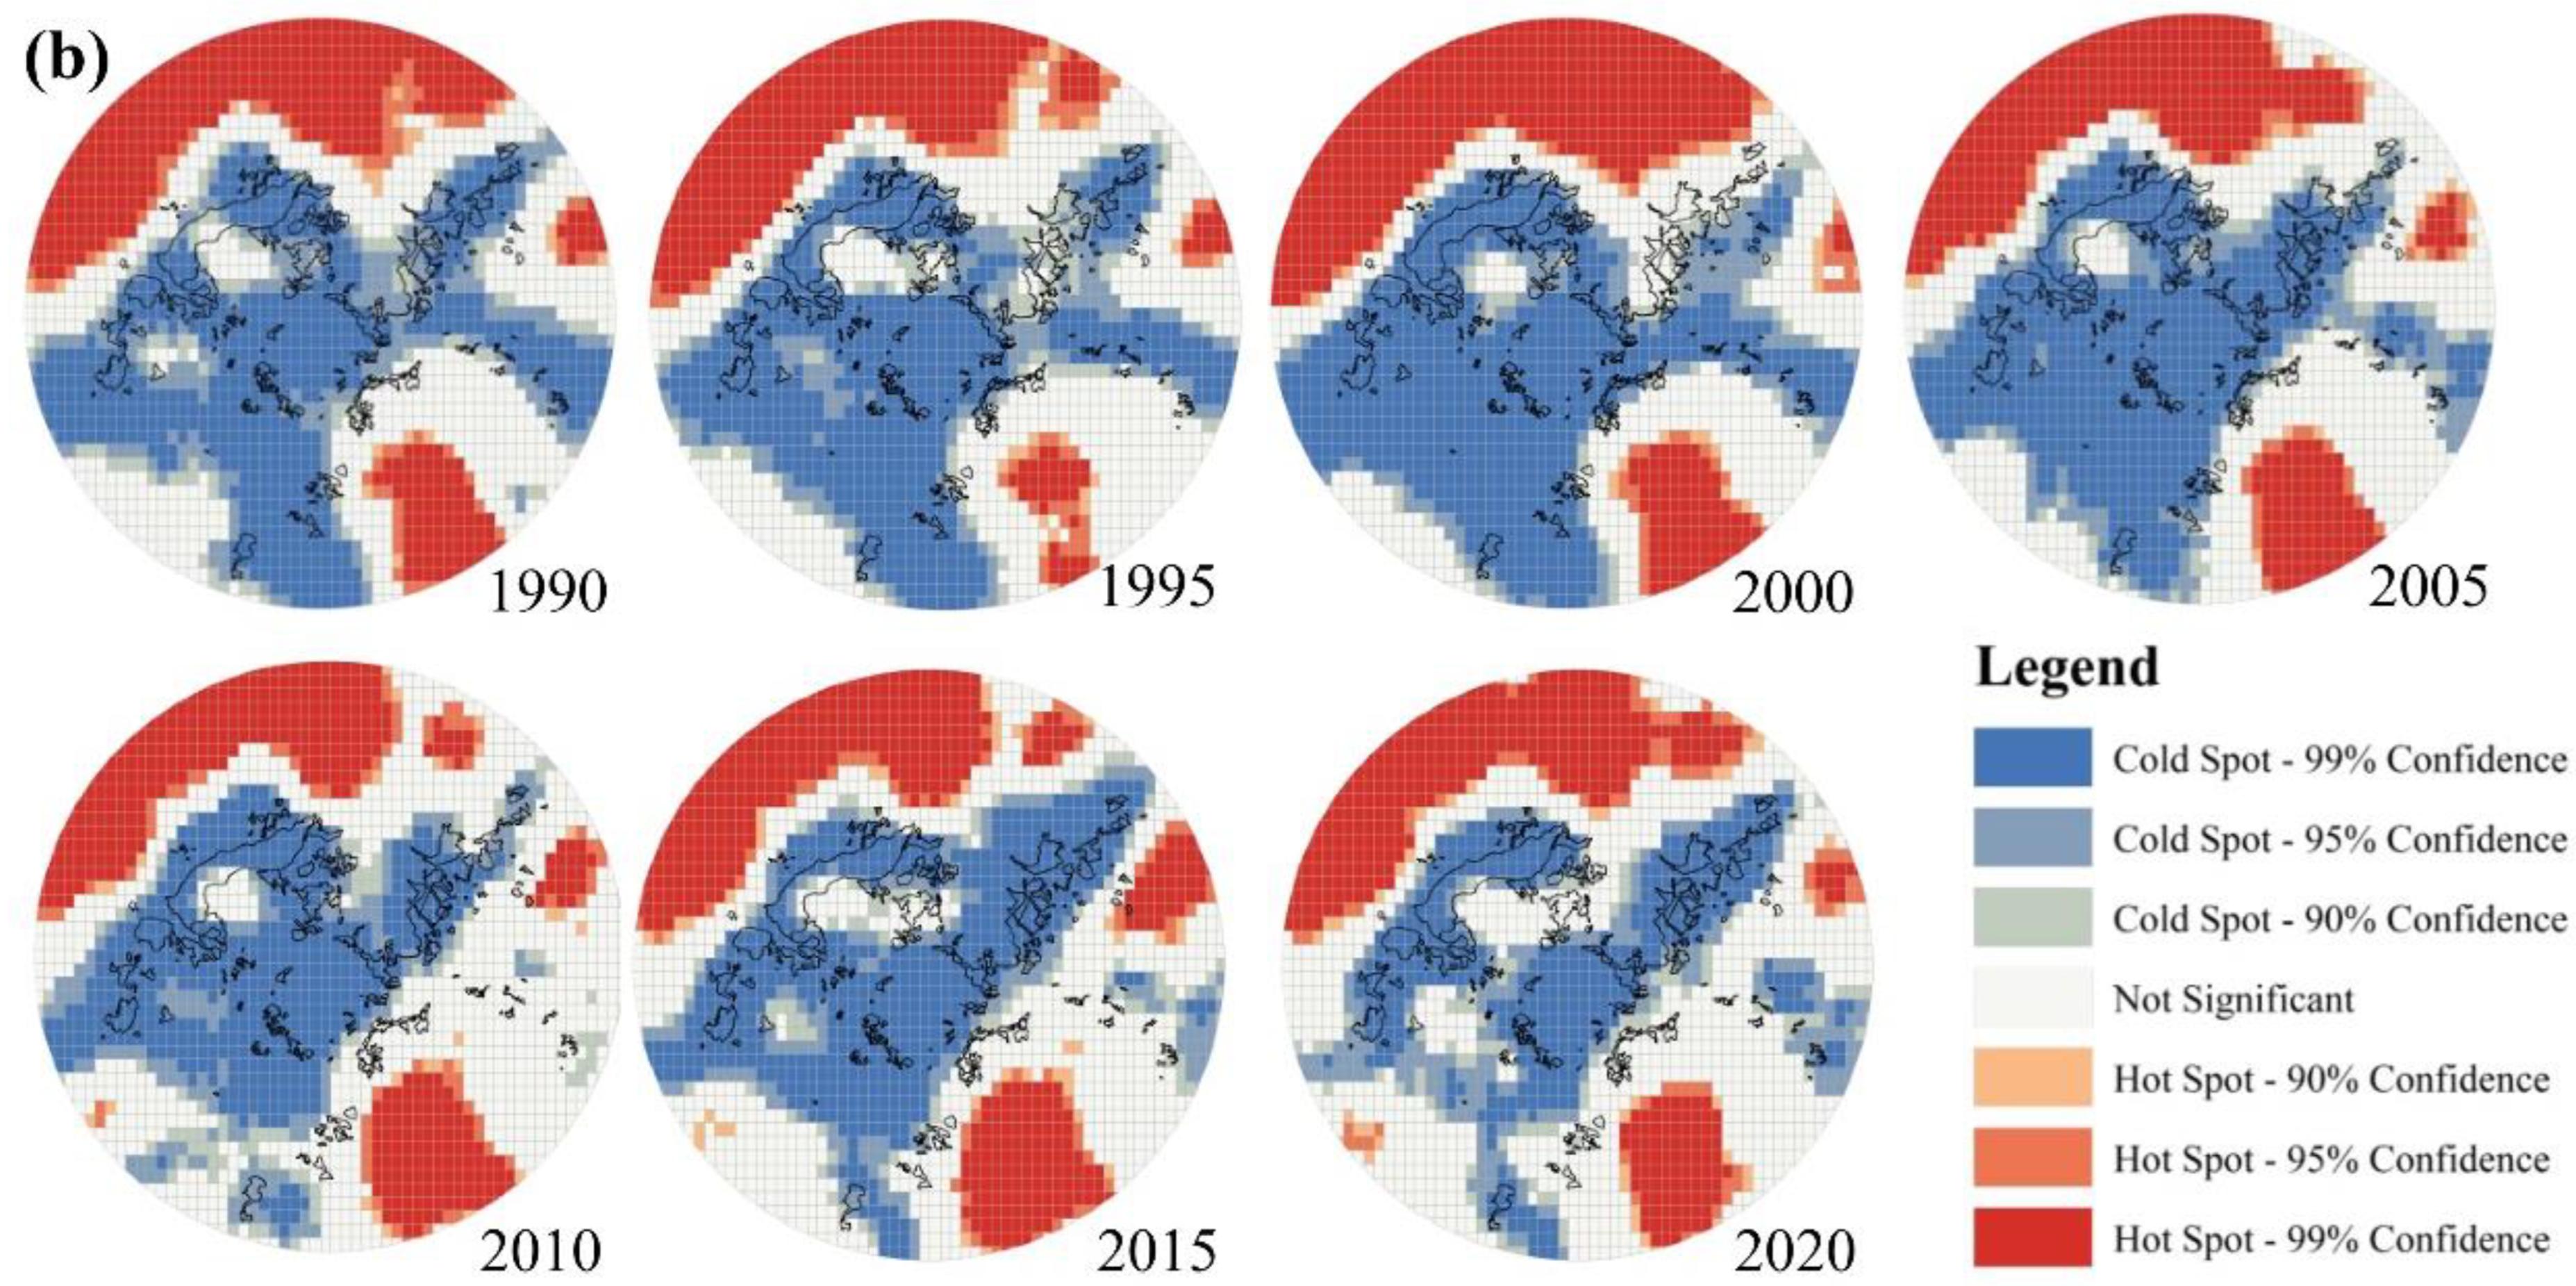
3.2. Autocorrelation Analysis

To guarantee the completeness of information and the precision of the quantitative analysis, the images were resampled into 1 km × 1 km grids according to the ecosystem and landscape pattern characteristics of the research area while taking the area’s internal characteristics into account. In this study, we randomly selected 10,000 samples from each RSEI image to explain the spatial dependence from the aspect of the spatial correlation and degree of the indicators. To find out the relationship between the indicators and RSEI, LST and NDBSI (the negative indicators), WET and NDVI (the positive indicators), and RSEI were projected into 3D space (Figure 5). RSEI values increase when NDVI and WET values increase, showing that wetness and greenness are associated positively with ecosystem quality (Figure 5a). RSEI values decrease when NDBSI and LST values increase, showing that dryness and heat are associated negatively with ecosystem quality (Figure 5b). This is consistent with the results of Yue et al. [54] and indicates that RSEI is appropriate for EEQ evaluation of resource-based city.
Based on the above 70,000 resampled points, we conducted a spatial autocorrelation analysis on the RSEI of Panzhihua City with optimized hot spot analysis and Moran’s I index. The Moran’s I scatter graph of RSEI is shown in Figure 6. Each year’s scatter points are primarily focused in the first and third quadrants, indicating a significant positive spatial correlation with the EEQ in Panzhihua City. In 1990, 1995, 2000, 2005, 2010, 2015, and 2020, the Moran’s I indexes are 0.523, 0.521, 0.505, 0.700, 0.644, and 0.555, respectively. These numbers convey that the spatial distribution of EEQ in these seven years is aggregated rather than random, and the strongest positive spatial correlation in Panzhihua is in 2005.
To comprehend the spatio-temporal distribution of EEQ, the optimized hot spot analysis is employed to obtain and analyze the spatial distribution of RSEI. As the cold and hot spot cluster map (Figure 7) shows, the insignificant regions are mainly distributed in rural areas, and the hot spots are mainly aggregated in the northeast corner of Panzhihua City. From 1990 to 2010, the area of hot spots increased, indicating the improvement of ecological environment. Low RSEI values are primarily found in urban areas along the river and mining areas (Figure 7). These places are highly urbanized with frequent human engineering activities [55], leading to poor EEQ. From 2010 to 2020, areas with low RSEI values and high RSEI values both decreased, while insignificant areas increased remarkably (Figure 7).
We adopted a smaller grid (250 m × 250 m) to conduct hot spot analysis for the three mining areas of Baima, Zhulan, and Panjiatian. Compared with the previous city-scale hot spot analysis (a grid size of 1 km × 1 km), the Not Significant Area significantly reduced (Table 2), which indicates that at smaller scales, the hot spot and cold spot regions increase and the spatial autocorrelation of EEQ is higher. The two scales of hot spot analysis also differ in spatial distribution: at the city scale, the mines are basically in the cold spots and insignificant areas, while at the mine scale, the hot spots are mostly found in the unmined parts of the mines, and the cold spots and insignificant areas are mostly in the mined parts of the mines (Figure 7, Figure A1b, Figure A2b and Figure A3b).

3.3. Detection of Changes of Ecological Environmental Quality

Detection is performed on the changes of Panzhihua and its three mines based on RSEI grading results between 1990 and 2020 (Figure 8 and Table 3). The results fall into five levels, which are: IO (Improvement Obvious, with a change level of “+4” or “+3”), IS (Improvement Slight, with a change level of “+2” or “+1”), IN (Invariability, with no change in level), DS (Deterioration Slight, with a change level of “−1” or “−2”), and DO (Deterioration Obvious, with a change level of “−3” or “−4”). The results show that Panzhihua’s EEQ has improved over the last 30 years (nearly 40% of the areas have remained stable, and the total area of IO and IS (2912.3 km2) is larger than that of DS and DO (1486.33 km2)). RSEI level lowers mainly in the farming and mining areas in northern Panzhihua, suggesting that human activities undermine the EEQ greatly. Compared with 1990, the EEQ of the three mines, namely Zhulan, Baima, and Panjiatian, has improved, with 50.67% of IS in Zhulan mine and more than 30% in Baima and Panjiatian mines. Large-scale open-pit mining activities have resulted in a dramatic rise in exposed land surface and a significant decrease in the EEQ of the mining areas. The mining areas in Baima and Panjiatian mines have a lower ecological environmental level, which is caused by the excavation during open-pit mining that destroys the vegetation and increases the exposed land surface. Zhulan was mined earlier than the period studied in this paper. The RSEI level of the mining area remains largely unchanged, while that of other areas slightly increased.

4. Discussion

4.1. Evaluation Method of EEQ

In recent decades, the continuous large-scale exploitation of mineral resources such as coal, iron ore, and rare earth mines has provided a significant amount of energy and materials required for China’s rapid economic and social development. However, surface subsidence, land destruction, vegetation degradation, water pollution, soil degradation, and air pollution have all resulted from the continuous and intensive mineral resource exploitation activities in a certain range of mining areas [56,57,58], which has drawn widespread attention from all walks of life. In this context, it is increasingly necessary to balance resource exploitation with environmental protection and management in future mining operations. This kind of protection and management cannot be reached without scientific monitoring of the ecological environment of mining areas.
There are numerous methods for assessing the natural ecological environment. Some commonly used ones are index method and integrated index method [59,60], Delphi method, landscape ecology method [61], score iteration method, multi-index weighting method [62,63], etc. In this study, PCA was employed to integrate all ecological indicators. The effect of each index on the RSEI is objectively defined by the contribution of the data to the main component, rather than by the weights assigned arbitrarily, thus avoiding the bias of results caused by weight settings that differ depending on the person and method.
We compared the calculated RSEI with the ecological vulnerability index (EVI) constructed by Dai et al. [37] and found that the spatial distribution and trends of RSEI and EVI were consistent. This means that the RSEI model, which is entirely based on remote sensing data, can be utilized to assess the EEQ of a resource-based city like Panzhihua. In addition, the results of the EEQ evaluation made by RSEI constructed based on the four indicators used in this study are consistent with the ecological environment vulnerability evaluation results based on 13 evaluation factors, which indicates that RSEI can not only evaluate EEQ quickly but also ensures the accuracy of the evaluation results.
In the analysis of the mining areas, RSEI is the only index we use to assess the quality of the eco-environment. In fact, mining activities not only damage the land vegetation, but also cause soil barrenness, soil heavy metal pollution, groundwater depression, biodiversity reduction, and atmospheric pollution. Therefore, the indicators for evaluating the EEQ of mining areas also include soil heavy metal content, soil nutrients, biodiversity, atmospheric dust, and so on. The above indicators can be tried in future studies on the assessment of eco-environmental quality in mining areas.
Future studies can refer to more EEQ evaluation indexes and thoroughly analyze the factors influencing EEQ changes in mining areas to discuss the causes of EEQ changes in Panzhihua mining areas at length and supply a basis for the ecological conservation and organization in Panzhihua mining areas.

4.2. Suitability of RSEI

Ministry of Environmental Protection of the People’s Republic of China launched the newly revised “Technical Criterion for Ecosystem Status Evaluation” (HJ 192-2015) (hereinafter referred to as the Criterion) in March 2015. Among these, the ecological index (EI) is primarily made up of data collected using remote sensing technology, and is calculated as the weighted sum of five evaluation indicators (biological diversity, vegetation coverage, land stress, pollution load, and water network density). The first three indexes can be gained using remote sensing technology, while the others are much harder to obtain. Subjective bias exists because the weight of each index is set artificially [15]. RSEI takes greenness, wetness, heat, and dryness as the four assessment indexes, and uses PCA to compute the weight of each indicator, which avoids subjective bias. Among them, the greenness index is similar to the vegetation coverage and biological richness indexes in the Criterion because they have similar calculation bases; the wetness index is similar to the water network denseness index in the Criterion, which represents not only open water bodies such as lakes or rivers, but also the wetness of soil and plants; the dryness index is associated with the land stress index in the Criterion and is represented by the bare soil index: a higher value indicates the more severe land stress; the land temperature, which represents heat, is affected by urban expansion and other environmental changes.
RSEI has been extensively used in monitoring the EEQ of mining areas. Some studies directly calculate the RSEI in mining areas and analyze the spatial-temporal changes of the RSEI values in mining areas to monitor the changes of EEQ, which proves that RSEI can be used to monitor the eco-environment in mining areas [64,65,66,67]. Although the RSEI method can objectively assess the eco-environment in mining areas, only the influences of vegetation greenness, surface environment, and climate on the ecological environment are considered in its index system. As an important ecologically sensitive zone and key management area in China, the EEQ of Panzhihua mining area is of great significance. Currently, the RSEI index is frequently used to study cities and counties [68,69], watersheds [20,22], natural heritages [70], and wetlands [19,71], while it is rarely applied to mining areas. Some studies have adopted the RSEI index in studying the EEQ changes in mining areas, but they did not put the spatial changes of EEQ into consideration, while this paper includes the study of the spatial changes of EEQ.
The traditional method of ecological survey and evaluation can only provide the mean ecological value in some regions (such as counties and towns), but RSEI can monitor the ecological changes from the microscopic perspective of pixels. It can also be visualized and mapped, which is an efficient and intuitional method to monitor the eco-environment. The average value of RSEI in Panzhihua City rises from 0.498 in 1990 to 0.534 in 2020. Although it is not a significant growth, there is an obvious spatial variation of RSEI, with the EEQ of the southern forest area improving and that of the mining and farming areas reducing. In the future, high-resolution images can be combined with Landsat satellite images to further monitor the ecological status and changes in mining areas.

4.3. Impact of the Policy on EEQ

EEQ is closely correlated with its ecological policy [72]. On 12 July 2010, Panzhihua City released Panzhihua’s Ecological City Construction Implementation Plan [53]. It set the construction goals of various counties throughout the city for building an ecological economic system, natural resources guarantee system, ecological environment system, ecological human settlement system, ecological culture system, and ecological capacity support system to improve the ecological environment and foster ecological culture. The implementation of this policy led to a gradual increase in EEQ in Panzhihua after 2010 (Figure 4a). In addition, in 2017, the mine ecological restoration project [53] was implemented for the mine site. This policy remediates mining waste land contamination to achieve the restoration of damaged ecosystems and the sustainable use of land resources. As a result, the EEQ of the Zhulan and Baima mines increased substantially after 2015 (Figure 4a,b). Overall, these policies have largely alleviated the impact of human activities on the environment and improved the overall ecological quality of Panzhihua City.

4.4. GEE Platform and Time Series Interval

The RSEI can indicate the trend of eco-environmental changes with a long period and noticeable geographical features but is limited by the time points in remote sensing data, it cannot be used to monitor the specific eco-environmental change process and eco-environmental changes with a short period [73]. The remote sensing cloud computing service platforms (such as PIE-Engine of Piesat and Google Earth Engine of Google Inc.) with very powerful computing capability can rapidly process decades of long time series of massive remote sensing image data, which greatly shortens the processing time of large-scale remote sensing images and makes it possible for users to process decades of remote sensing images of mining areas within a short time. With the support of these new remote sensing technologies and platforms, the quantitative remote sensing monitoring of the ecological environment in mining areas at home and abroad has been further developed, and a series of excellent results have been achieved [74,75,76]. This study uses the GEE platform to monitor s the EEQ of Panzhihua in the past thirty years, draws 7 spatial distribution maps of RSEI from 1990 to 2020, and selects three mines in Panzhihua to explore the effects of mining activities on the EEQ.
We have found an anomaly revealed in Figure 4b: Zhulan was mined in the 1970s, but the EEQ decreased significantly from 2000 to 2005. This anomaly may be caused by the soaring demand for steel resources for industrial construction in the early 21st century [77]. The RSEI images mapped every five years cannot well-reflect the ecological environmental status of Zhulan mine in every single year from 2000 to 2005, and the changes of EEQ between two adjacent years cannot be observed. Therefore, the quantitative inversion of ecological and environmental parameters in the mining area and remote sensing products with medium-and-high spatial resolution, long time series, and high frequency remain urgent problems to be solved.
In addition, when assessing the EEQ in mountainous areas with the RSEI model, the remote sensing images will distort in some as there are many ups and downs in mountainous areas, so it is necessary to carry out topographic correction during pre-processing to avoid any changes of image values caused by topographic relief. Landsat series satellites are more suitable for small-scale EEQ monitoring. However, influenced by cloud volume and imaging quality, this paper studies 7 sets of data, which are selected from every five years within a 30-year time series. Landsat 9 is officially in operation and the revisit period is 16 days, with a deviation of 8 days from Landsat 8. Its combination with Landsat 8 can shorten the original 16-day revisit period to 8 days (https://landsat.gsfc.nasa.gov/satellites/landsat-9, accessed on 12 June 2022), and it is possible to achieve the continuity of time in future studies.

5. Conclusions

In this study, we used the RSEI to evaluate the EEQ of Panzhihua City, a typical resource-based city, based on the GEE platform and Landsat remote sensing images. The spatial autocorrelation analysis and comparison with previous research helped reveal that the RSEI is appropriate for evaluating the EEQ of resource-based city. Hot spot analysis revealed the spatial heterogeneity and ecological clustering of ecological environmental quality in Panzhihua. Next, we used change detection of the RSEI to study the spatio-temporal changes in the dynamic of the EEQ in Panzhihua in the past three decades. In addition, we have studied three mining areas in Panzhihua to probe into the effects of mining operations on EEQ.
The study results show that: (1) the mean values of RSEI from 1990 to 2020 (1990, 1995, 2000, 2005, 2010, 2015, and 2020) range from 0.4 to 0.6 (0.498, 0.539, 0.535, 0.524, 0.517, 0.528, and 0.534), indicating that the EEQ of Panzhihua has improved slightly from 1990 to 2020. (2) The Moran’s I values of RSEI in 1990, 1995, 2000, 2005, 2010, 2015, and 2020, respectively, are 0.523, 0.521, 0.505, 0.700, 0.644, 0.555, and 0.436, indicating a positive correlation between the spatial distribution of EEQ in Panzhihua City, and that the space distribution is in an aggregated pattern rather than a random one. The RSEI hot spots are primarily situated in the northwestern and central mountainous areas of Panzhihua City. The cold spots are primarily found in the urban areas along the river and mining areas with a high population density and a high frequency of human engineering activities, which bring much harm to the eco-environment. (3) The detection of the change in the RSEI level demonstrates the improvement of Panzhihua City’s ecological environment during the past 30 years, but the farming and mining areas still see ecological environmental deterioration. (4) Mining activities significantly undermine the EEQ. In the past 30 years, they have led to a 20–40% decrease in average RSEI in mining areas. (5) The ecological policy of Panzhihua was able to improve the regional ecological quality. Despite the negative impact of mining activities on the ecological quality, there was still a slight improvement in the ecological quality under the influence of the policy.
Our evaluation study is entirely based on Landsat images, and RSEI is constructed on the GEE platform. This study provides a practical method to evaluate the spatial-temporal changes of EEQ. Socioeconomic data (e.g., GDP, population, social welfare) can be included in future studies to research the interactions between the ecological environment and human activities. Data on rainfall, temperature, and elevation, which have an impact on the eco-environment, can also be studied. Further studies will offer workable policy-making instruments for the management of natural resources to assure that ecological knowledge, conservation, and environmental processes of governance are effectively taken into account in the preservation and restoration of the Panzhihua ecosystem.

Author Contributions

Y.S. and X.D. drafted the manuscript and were responsible for the research design, experiment, and analysis. W.L. (Weile Li) and Z.Y. reviewed and edited the manuscript. Y.W., G.Q., W.L. (Wenxin Liu), J.R., C.L., S.L. and B.Z. supported the data preparation and the interpretation of the results. All of the authors contributed to editing and reviewing the manuscript. All authors have read and agreed to the published version of the manuscript.

Funding

This work was supported by the National Key Research and Development Program of China (Grant No. 2021YFC3000401), the National Natural Science Foundation of China (Grant No. 41941019), Sichuan Mineral Resources Research Center (Grant No. SCKCZY2021-ZC003), and Open Foundation of Sichuan Center for Disaster Economic Research (Grant No. ZHJJ2021-ZD001).

Data Availability Statement

The data that support the findings of this study are available from the corresponding author upon reasonable request.

Conflicts of Interest

The authors declare no conflict of interest.

Appendix A

Figure A1. Spatial Distribution of RSEI and Hotspots and Coldspots in Baima Mine ((a): Spatial Distribution of RSEI, (b): Spatial Distribution of Hotspots and Coldspots).
Remotesensing 14 04137 g0a1aRemotesensing 14 04137 g0a1b
Figure A2. Spatial Distribution of RSEI and Hotspots and Coldspots in Panjiatian Mine ((a): Spatial Distribution of RSEI, (b): Spatial Distribution of Hotspots and Coldspots).
Remotesensing 14 04137 g0a2aRemotesensing 14 04137 g0a2b
Figure A3. Spatial Distribution of RSEI and Hotspots and Coldspots in Zhulan Mine ((a): Spatial Distribution of RSEI, (b): Spatial Distribution of Hotspots and Coldspots).
Remotesensing 14 04137 g0a3aRemotesensing 14 04137 g0a3b
Figure A4. Land-use map of Panzhihua City.
Remotesensing 14 04137 g0a4
Table A1. RSEI Classification Results for Three Mines.
RegionYear Level 1Level 2Level 3Level 4Level 5
Baima mine1990Area (km2)53.9445.3733.2125.4717.20
Pct./%30.7925.9018.9614.549.82
1995Area (km2)33.8241.2139.6735.6324.86
Pct./%19.3123.5222.6420.3414.19
2000Area (km2)17.4131.3941.5242.0142.87
Pct./%9.9417.9123.7023.9824.47
2005Area (km2)61.5052.0640.7118.042.90
Pct./%35.1029.7123.2310.301.65
2010Area (km2)61.7554.9636.1018.374.03
Pct./%35.2531.3720.6010.482.30
2015Area (km2)59.6651.4034.8223.176.14
Pct./%34.0529.3419.8713.233.50
2020Area (km2)42.9352.4235.9326.1917.72
Pct./%24.5029.9220.5114.9510.12
Panjiatian mine1990Area (km2)2.133.864.872.530.55
Pct./%15.2527.7034.9318.163.95
1995Area (km2)1.963.334.283.221.16
Pct./%14.0823.8630.6623.128.29
2000Area (km2)2.384.724.941.740.17
Pct./%17.0733.8235.4112.471.23
2005Area (km2)2.165.154.791.800.06
Pct./%15.4636.9034.3612.880.40
2010Area (km2)2.315.464.591.560.03
Pct./%16.5639.1332.9111.170.22
2015Area (km2)2.554.384.072.820.12
Pct./%18.3131.4129.1520.240.89
2020Area (km2)3.723.762.642.751.08
Pct./%26.6926.9218.9219.737.75
Zhulan mine1990Area (km2)89.2040.5718.628.282.77
Pct./%55.9525.4411.685.191.74
1995Area (km2)87.9937.8519.0210.114.46
Pct./%55.1923.7411.936.342.80
2000Area (km2)79.0641.8722.9311.863.72
Pct./%49.5926.2614.387.442.33
2005Area (km2)92.7141.2119.025.610.88
Pct./%58.1525.8511.933.520.55
2010Area (km2)68.8154.8326.247.781.79
Pct./%43.1534.3916.464.881.12
2015Area (km2)67.2947.0730.6612.511.91
Pct./%42.2029.5219.237.851.20
2020Area (km2)46.4451.5935.3218.497.61
Pct./%29.1232.3622.1511.604.77

References

  1. Zhang, W.; Gao, J. Problems of Ecological Environment in Western China. Chin. Educ. Soc. 2004, 37, 15–20. [Google Scholar] [CrossRef]
  2. Gao, Q.; Li, Y.; Wan, Y.; Qin, X.; Jiangcun, W.; Liu, Y. Dynamics of alpine grassland NPP and its response to climate change in Northern Tibet. Clim. Chang. 2009, 97, 515–528. [Google Scholar] [CrossRef]
  3. Taylor, P.G.; Cleveland, C.C.; Wieder, W.R.; Sullivan, B.W.; Doughty, C.E.; Dobrowski, S.Z.; Townsend, A.R. Temperature and rainfall interact to control carbon cycling in tropical forests. Ecol. Lett. 2017, 20, 779–788. [Google Scholar] [CrossRef]
  4. Rouse, J.W. Monitoring Vegetation System in the Great Plains with ERTS; NASA: Washington, DC, USA, 1974.
  5. Eckert, S.; Hüsler, F.; Liniger, H.; Hodel, E. Trend analysis of MODIS NDVI time series for detecting land degradation and regeneration in Mongolia. J. Arid Environ. 2015, 113, 16–28. [Google Scholar] [CrossRef]
  6. Fensholt, R.; Rasmussen, K.; Nielsen, T.T.; Mbow, C. Evaluation of earth observation based long term vegetation trends—Intercomparing NDVI time series trend analysis consistency of Sahel from AVHRR GIMMS, Terra MODIS and SPOT VGT data. Remote Sens. Environ. 2009, 113, 1886–1898. [Google Scholar] [CrossRef]
  7. Jiang, L.; Liu, Y.; Wu, S.; Yang, C. Analyzing ecological environment change and associated driving factors in China based on NDVI time series data. Ecol. Indic. 2021, 129, 107933. [Google Scholar] [CrossRef]
  8. Pang, G.; Wang, X.; Yang, M. Using the NDVI to identify variations in, and responses of, vegetation to climate change on the Tibetan Plateau from 1982 to 2012. Quat. Int. 2017, 444, 87–96. [Google Scholar] [CrossRef]
  9. Xu, H. Analysis of Impervious Surface and its Impact on Urban Heat Environment using the Normalized Difference Impervious Surface Index (NDISI). Photogramm. Eng. Remote Sens. 2010, 76, 557–565. [Google Scholar] [CrossRef]
  10. Bokaie, M.; Zarkesh, M.K.; Arasteh, P.D.; Hosseini, A. Assessment of Urban Heat Island based on the relationship between land surface temperature and Land Use/Land Cover in Tehran. Sustain. Cities Soc. 2016, 23, 94–104. [Google Scholar] [CrossRef]
  11. Majasalmi, T.; Stenberg, P.; Rautiainen, M. Comparison of ground and satellite-based methods for estimating stand-level fPAR in a boreal forest. Agric. For. Meteorol. 2017, 232, 422–432. [Google Scholar] [CrossRef]
  12. Xu, H.Q.; Wang, Y.F.; Guan, H.D.; Shi, T.T.; Hu, X.S. Detecting Ecological Changes with a Remote Sensing Based Ecological Index (RSEI) Produced Time Series and Change Vector Analysis. Remote Sens. 2019, 11, 2345. [Google Scholar] [CrossRef]
  13. Yuan, B.; Fu, L.; Zou, Y.; Zhang, S.; Chen, X.; Li, F.; Deng, Z.; Xie, Y. Spatiotemporal change detection of ecological quality and the associated affecting factors in Dongting Lake Basin, based on RSEI. J. Clean. Prod. 2021, 302, 126995. [Google Scholar] [CrossRef]
  14. Wen, X.L.; Ming, Y.L.; Gao, Y.G.; Hu, X.Y. Dynamic Monitoring and Analysis of Ecological Quality of Pingtan Comprehensive Experimental Zone, a New Type of Sea Island City, Based on RSEI. Sustainability 2020, 12, 21. [Google Scholar] [CrossRef]
  15. Xu, H. A remote sensing index for assessment of regional ecological changes. China Environ. Sci. 2013, 33, 889–897. [Google Scholar]
  16. Xu, H.; Wang, M.; Shi, T.; Guan, H.; Fang, C.; Lin, Z. Prediction of ecological effects of potential population and impervious surface increases using a remote sensing based ecological index (RSEI). Ecol. Indic. 2018, 93, 730–740. [Google Scholar] [CrossRef]
  17. Zhu, D.; Chen, T.; Wang, Z.; Niu, R. Detecting ecological spatial-temporal changes by Remote Sensing Ecological Index with local adaptability. J. Environ. Manag. 2021, 299, 113655. [Google Scholar] [CrossRef]
  18. Shan, W.; Jin, X.; Ren, J.; Wang, Y.; Xu, Z.; Fan, Y.; Gu, Z.; Hong, C.; Lin, J.; Zhou, Y. Ecological environment quality assessment based on remote sensing data for land consolidation. J. Clean. Prod. 2019, 239, 118126. [Google Scholar] [CrossRef]
  19. Jing, Y.; Zhang, F.; He, Y.; Kung, H.-T.; Johnson, V.C.; Arikena, M. Assessment of spatial and temporal variation of ecological environment quality in Ebinur Lake Wetland National Nature Reserve, Xinjiang, China. Ecol. Indic. 2020, 110, 105874. [Google Scholar] [CrossRef]
  20. Guo, B.; Fang, Y.; Jin, X.; Zhou, Y. Monitoring the effects of land consolidation on the ecological environmental quality based on remote sensing: A case study of Chaohu Lake Basin, China. Land Use Policy 2020, 95, 104569. [Google Scholar] [CrossRef]
  21. Xiong, Y.; Xu, W.; Lu, N.; Huang, S.; Wu, C.; Wang, L.; Dai, F.; Kou, W. Assessment of spatial–temporal changes of ecological environment quality based on RSEI and GEE: A case study in Erhai Lake Basin, Yunnan province, China. Ecol. Indic. 2021, 125, 107518. [Google Scholar] [CrossRef]
  22. Yang, X.; Meng, F.; Fu, P.; Zhang, Y.; Liu, Y. Spatiotemporal change and driving factors of the Eco-Environment quality in the Yangtze River Basin from 2001 to 2019. Ecol. Indic. 2021, 131, 108214. [Google Scholar] [CrossRef]
  23. Wang, C.; Jiang, Q.; Shao, Y.; Sun, S.; Xiao, L.; Guo, J. Ecological environment assessment based on land use simulation: A case study in the Heihe River Basin. Sci. Total Environ. 2019, 697, 133928. [Google Scholar] [CrossRef] [PubMed]
  24. Ariken, M.; Zhang, F.; Liu, K.; Fang, C.; Kung, H.-T. Coupling coordination analysis of urbanization and eco-environment in Yanqi Basin based on multi-source remote sensing data. Ecol. Indic. 2020, 114, 106331. [Google Scholar] [CrossRef]
  25. Mu, H.; Li, X.; Ma, H.; Du, X.; Huang, J.; Su, W.; Yu, Z.; Xu, C.; Liu, H.; Yin, D.; et al. Evaluation of the policy-driven ecological network in the Three-North Shelterbelt region of China. Landsc. Urban Plan. 2022, 218, 104305. [Google Scholar] [CrossRef]
  26. Yan, Y.; Zhuang, Q.; Zan, C.; Ren, J.; Yang, L.; Wen, Y.; Zeng, S.; Zhang, Q.; Kong, L. Using the Google Earth Engine to rapidly monitor impacts of geohazards on ecological quality in highly susceptible areas. Ecol. Indic. 2021, 132, 108258. [Google Scholar] [CrossRef]
  27. Gorelick, N.; Hancher, M.; Dixon, M.; Ilyushchenko, S.; Thau, D.; Moore, R. Google Earth Engine: Planetary-scale geospatial analysis for everyone. Remote Sens. Environ. 2017, 202, 18–27. [Google Scholar] [CrossRef]
  28. Liu, X.; Hu, G.; Chen, Y.; Li, X.; Xu, X.; Li, S.; Pei, F.; Wang, S. High-resolution multi-temporal mapping of global urban land using Landsat images based on the Google Earth Engine Platform. Remote Sens. Environ. 2018, 209, 227–239. [Google Scholar] [CrossRef]
  29. Johansen, K.; Phinn, S.; Taylor, M. Mapping woody vegetation clearing in Queensland, Australia from Landsat imagery using the Google Earth Engine. Remote Sens. Appl. Soc. Environ. 2015, 1, 36–49. [Google Scholar] [CrossRef]
  30. Xing, M.; Luo, F.; Fang, Y. Research on the sustainability promotion mechanisms of industries in China’s resource-based cities—from an ecological perspective. J. Clean. Prod. 2021, 315, 128114. [Google Scholar] [CrossRef]
  31. Fan, F.; Zhang, X. Transformation effect of resource-based cities based on PSM-DID model: An empirical analysis from China. Environ. Impact Assess. Rev. 2021, 91, 106648. [Google Scholar] [CrossRef]
  32. Wan, L.; Ye, X.; Lee, J.; Lu, X.; Zheng, L.; Wu, K. Effects of urbanization on ecosystem service values in a mineral resource-based city. Habitat Int. 2015, 46, 54–63. [Google Scholar] [CrossRef]
  33. Yang, H.; Zhai, G.; Zhang, Y. Ecological vulnerability assessment and spatial pattern optimization of resource-based cities: A case study of Huaibei City, China. Hum. Ecol. Risk Assess. Int. J. 2021, 27, 606–625. [Google Scholar] [CrossRef]
  34. Wang, Y. GIS-Based Research of Carrying Capacity of Eco-Environment of Resource-Based City—Taking Panzhihua for Example. Master’s Thesis, Chengdu University of Technology, Chengdu, China, 2009. [Google Scholar]
  35. Shao, H.; Xian, W.; Yang, W. A study on eco-environmental vulnerability of mining cities: A case study of Panzhihua city of Sichuan province in China. In Proceedings of the International Conference on Photonics and Image in Agriculture Engineering (PIAGENG 2009), Zhangjiajie, China, 11–12 July 2009; p. 74910Y. [Google Scholar]
  36. Zhang, S.; Li, F.; Zhou, Y.; Hu, Z.; Zhang, R.; Xiang, X.; Zhang, Y. Using Net Primary Productivity to Characterize the Spatio-Temporal Dynamics of Ecological Footprint for a Resource-Based City, Panzhihua in China. Sustainability 2022, 14, 3067. [Google Scholar] [CrossRef]
  37. Dai, X.; Gao, Y.; He, X.; Liu, T.; Jiang, B.; Shao, H.; Yao, Y. Spatial-temporal pattern evolution and driving force analysis of ecological environment vulnerability in Panzhihua City. Environ. Sci. Pollut. Res. Int. 2021, 28, 7151–7166. [Google Scholar] [CrossRef] [PubMed]
  38. Wang, J.; Huang, Y.; Li, T.; He, M.; Cheng, X.; Su, T.; Ni, S.; Zhang, C. Contamination, morphological status and sources of atmospheric dust in different land-using areas of a steel-industry city, China. Atmos. Pollut. Res. 2020, 11, 283–289. [Google Scholar] [CrossRef]
  39. Sun, X.; Yuan, L.; Liu, M.; Liang, S.; Li, D.; Liu, L. Quantitative estimation for the impact of mining activities on vegetation phenology and identifying its controlling factors from Sentinel-2 time series. Int. J. Appl. Earth Obs. Geoinf. 2022, 111, 102814. [Google Scholar] [CrossRef]
  40. Gascon, M.; Cirach, M.; Martínez, D.; Dadvand, P.; Valentín, A.; Plasència, A.; Nieuwenhuijsen, M.J. Normalized difference vegetation index (NDVI) as a marker of surrounding greenness in epidemiological studies: The case of Barcelona city. Urban For. Urban Green. 2016, 19, 88–94. [Google Scholar] [CrossRef]
  41. Baig, M.H.A.; Zhang, L.; Shuai, T.; Tong, Q. Derivation of a tasselled cap transformation based on Landsat 8 at-satellite reflectance. Remote Sens. Lett. 2014, 5, 423–431. [Google Scholar] [CrossRef]
  42. Mostafiz, C.; Chang, N.-B. Tasseled cap transformation for assessing hurricane landfall impact on a coastal watershed. Int. J. Appl. Earth Obs. Geoinf. 2018, 73, 736–745. [Google Scholar] [CrossRef]
  43. Liu, Y.; Meng, Q.; Zhang, L.; Wu, C. NDBSI: A normalized difference bare soil index for remote sensing to improve bare soil mapping accuracy in urban and rural areas. CATENA 2022, 214, 106265. [Google Scholar] [CrossRef]
  44. Jiménez-Muñoz, J.C.; Sobrino, J.A.; Skoković, D.; Mattar, C.; Cristóbal, J. Land Surface Temperature Retrieval Methods From Landsat-8 Thermal Infrared Sensor Data. IEEE Geosci. Remote Sens. Lett. 2014, 11, 1840–1843. [Google Scholar] [CrossRef]
  45. Hu, X.; Xu, H. A new remote sensing index for assessing the spatial heterogeneity in urban ecological quality: A case from Fuzhou City, China. Ecol. Indic. 2018, 89, 11–21. [Google Scholar] [CrossRef]
  46. Martin, D. An assessment of surface and zonal models of population. Int. J. Geogr. Inf. Syst. 1996, 10, 973–989. [Google Scholar] [CrossRef]
  47. Xia, Q.-Q.; Chen, Y.-N.; Zhang, X.-Q.; Ding, J.-L. Spatiotemporal Changes in Ecological Quality and Its Associated Driving Factors in Central Asia. Remote Sens. 2022, 14, 3500. [Google Scholar] [CrossRef]
  48. Boori, M.S.; Choudhary, K.; Paringer, R.; Kupriyanov, A. Spatiotemporal ecological vulnerability analysis with statistical correlation based on satellite remote sensing in Samara, Russia. J. Environ. Manag. 2021, 285, 112138. [Google Scholar] [CrossRef] [PubMed]
  49. Dubin, R.A. Spatial Autocorrelation: A Primer. J. Hous. Econ. 1998, 7, 304–327. [Google Scholar] [CrossRef]
  50. Wan, L.; Wang, S.; Chen, X. GeoDA-based spatial correlation analysis of GDP in Hadaqi industrial corridor. Geogr. Res. 2011, 30, 977–984. [Google Scholar] [CrossRef]
  51. Freeland, T.; Heung, B.; Burley, D.V.; Clark, G.; Knudby, A. Automated feature extraction for prospection and analysis of monumental earthworks from aerial LiDAR in the Kingdom of Tonga. J. Archaeol. Sci. 2016, 69, 64–74. [Google Scholar] [CrossRef]
  52. Song, X.; Qi, H.; Hu, R.; Chen, L.; Yu, S.; Zhang, J. Formation of thick stratiform Fe-Ti oxide layers in layered intrusion and frequent replenishment of fractionated mafic magma: Evidence from the Panzhihua intrusion, SW China. Geochem. Geophys. Geosyst. 2013, 14, 712–732. [Google Scholar] [CrossRef]
  53. Yang, Y.; Fang, Y.-P.; Xu, Y.; Zhang, Y. Assessment of urban resilience based on the transformation of resource-based cities: A case study of Panzhihua, China. Ecol. Soc. 2021, 26, 20. [Google Scholar] [CrossRef]
  54. Yue, H.; Liu, Y.; Li, Y.; Lu, Y. Eco-Environmental Quality Assessment in China’s 35 Major Cities Based on Remote Sensing Ecological Index. IEEE Access 2019, 7, 51295–51311. [Google Scholar] [CrossRef]
  55. Teng, Y.; Yang, J.; Zuo, R.; Wang, J. Impact of urbanization and industrialization upon surface water quality: A pilot study of Panzhihua mining town. J. Earth Sci. 2011, 22, 658. [Google Scholar] [CrossRef]
  56. Chen, G.; Wang, X.; Wang, R.; Liu, G. Health risk assessment of potentially harmful elements in subsidence water bodies using a Monte Carlo approach: An example from the Huainan coal mining area, China. Ecotoxicol. Environ. Saf. 2019, 171, 737–745. [Google Scholar] [CrossRef]
  57. Long, Z.; Zhu, H.; Bing, H.; Tian, X.; Wang, Z.; Wang, X.; Wu, Y. Contamination, sources and health risk of heavy metals in soil and dust from different functional areas in an industrial city of Panzhihua City, Southwest China. J. Hazard. Mater. 2021, 420, 126638. [Google Scholar] [CrossRef] [PubMed]
  58. Xu, C.; Zhou, K.; Xiong, X.; Gao, F. Assessment of coal mining land subsidence by using an innovative comprehensive weighted cloud model combined with a PSR conceptual model. Environ. Sci. Pollut. Res. Int. 2022, 29, 18665–18679. [Google Scholar] [CrossRef]
  59. Xie, Y.; Gong, J.; Qi, S.; Hu, B.; Wang, K. Assessment and spatial variation of biodiversity in the Bailong River Watershed of the Gansu Province. Acta Ecol. Sin. 2017, 37, 6448–6456. [Google Scholar]
  60. Fu, J.; Zheng, M. Evaluation of Rural Eco-Environmental Development Level in Shandong Province Based on Comprehensive Index Method. Ecol. Econ. 2020, 36. [Google Scholar]
  61. Singh, J.S.; Roy, P.S.; Murthy, M.S.R.; Jha, C.S. Application of Landscape Ecology and Remote Sensing for Assessment, Monitoring and Conservation of Biodiversity. J. Indian Soc. Remote Sens. 2010, 38, 365–385. [Google Scholar] [CrossRef]
  62. Hou, K.; Tao, W.; Wang, L.; Li, X. Study on hierarchical transformation mechanisms of regional ecological vulnerability and its applicability. Ecol. Indic. 2020, 114, 106343. [Google Scholar] [CrossRef]
  63. Boori, M.S.; Choudhary, K.; Paringer, R.; Kupriyanov, A. Eco-environmental quality assessment based on pressure-state-response framework by remote sensing and GIS. Remote Sens. Appl. Soc. Environ. 2021, 23, 100530. [Google Scholar] [CrossRef]
  64. Wei, L.; Wan, D.; Bi, J.; Xie, J. Dynamic Monitoring and Assessment of Ecologic Environment in Xikuangshan Antimony Mining Area Based on Remote Sensing. Environ. Sci. Technol. 2020, 43, 230–236. [Google Scholar] [CrossRef]
  65. Li, R.; Chen, G.; Li, W.; Meng, R.; Wang, M.; Guo, Y. Spatiotemporal Analysis of Eco-environmental Benefits in Shenfu-Dongsheng Mining Area During 1995–2020 Based on RSEI. Bull. Soil Water Conserv. 2021, 41, 012029. [Google Scholar]
  66. Hu, S.; Yao, Y.; Fu, J.; Zhao, J.; Hao, D. Evaluation of ecological quality variation in mining area of Northeast China based on RSEI Index: A case of Gongchangling District, Liaoning Province. Chin. J. Ecol. 2021, 40, 4053–4060. [Google Scholar]
  67. Li, J.; Hao, Y.; Sun, J.; Zhuo, Y.; Qin, J.; Yin, F. Evaluation of Ecological Environment’ Spatio-Temporal Variation in Urban Mine Based on Rsei. Urban Dev. Stud. 2021, 27. [Google Scholar]
  68. Zhao, W.; Yan, T.; Ding, X.; Peng, S.; Chen, H.; Fu, Y.; Zhou, Z. Response of ecological quality to the evolution of land use structure in Taiyuan during 2003 to 2018. Alex. Eng. J. 2021, 60, 1777–1785. [Google Scholar] [CrossRef]
  69. Zhang, J.; Zhou, Q.; Cao, M.; Liu, H. Spatiotemporal Change of Eco-Environmental Quality in the Oasis City and Its Correlation with Urbanization Based on RSEI: A Case Study of Urumqi, China. Sustainability 2022, 14, 9227. [Google Scholar] [CrossRef]
  70. Li, Y.; Wu, L.; Han, Q.; Wang, X.; Zou, T.; Fan, C. Estimation of remote sensing based ecological index along the Grand Canal based on PCA-AHP-TOPSIS methodology. Ecol. Indic. 2021, 122, 107214. [Google Scholar] [CrossRef]
  71. Wang, L.; Li, J.; Fengbing, L.; Naiming, Z. Evaluation of ecological changes based on a remote sensing ecological index in a Manas Lake wetland, Xinjiang. Acta Ecol. Sin. 2019, 39, 2963–2972. [Google Scholar]
  72. Liu, C.; Yang, M.; Hou, Y.; Zhao, Y.; Xue, X. Spatiotemporal evolution of island ecological quality under different urban densities: A comparative analysis of Xiamen and Kinmen Islands, southeast China. Ecol. Indic. 2021, 124, 107438. [Google Scholar] [CrossRef]
  73. Zheng, Z.; Wu, Z.; Chen, Y.; Yang, Z.; Marinello, F. Exploration of eco-environment and urbanization changes in coastal zones: A case study in China over the past 20 years. Ecol. Indic. 2020, 119, 106847. [Google Scholar] [CrossRef]
  74. Fuentes, M.; Millard, K.; Laurin, E. Big geospatial data analysis for Canada’s Air Pollutant Emissions Inventory (APEI): Using google earth engine to estimate particulate matter from exposed mine disturbance areas. GISci. Remote Sens. 2019, 57, 245–257. [Google Scholar] [CrossRef]
  75. Li, J.; Yan, X.; Yan, X.; Guo, W.; Wang, K.; Qiao, J. Temporal and spatial variation characteristic of vegetation coverage in the Yellow River Basin based on GEE cloud platform. J. China Coal Soc. 2021, 46, 1439–1450. [Google Scholar]
  76. Mishra, M.; Santos, C.A.G.; Nascimento, T.V.M.D.; Dash, M.K.; Silva, R.M.D.; Kar, D.; Acharyya, T. Mining impacts on forest cover change in a tropical forest using remote sensing and spatial information from 2001–2019: A case study of Odisha (India). J. Environ. Manag. 2022, 302, 114067. [Google Scholar] [CrossRef] [PubMed]
  77. Dong, H.; Liu, Y.; Wang, L.; Li, X.; Tian, Z.; Huang, Y.; McDonald, C. Roadmap of China steel industry in the past 70 years. Ironmak. Steelmak. 2019, 46, 922–927. [Google Scholar] [CrossRef]
Figure 1. Workflow of this study.
Remotesensing 14 04137 g001
Figure 2. The Situation of the Study Area (A): Location of Sichuan Province, (B): Location of Panzhihua, (C): Distribution of Mining Areas in Panzhihua, (D): Distribution of the Three Mining Area Sites in Panzhihua City).
Remotesensing 14 04137 g002
Figure 3. The RSEI Classification Results of Panzhihua City in 1990, 1995, 2000, 2005, 2010, 2015, and 2020. (a) Spatial Distribution Map of RSEI. (b) Area of RSEI Classification Results.
Remotesensing 14 04137 g003
Figure 4. 1990–2020 RSEI Mean Line Graph (a): Panzhihua, (b): Zhulan Mine, (c): Baima Mine, (d): Panjiatian Mine).
Remotesensing 14 04137 g004
Figure 5. 3-D Scatterplot illustrate the relationships between WET, NDVI, LST, NDBSI, and RSEI. (a) The relationship among RSEI, NDVI and WET; (b) The relationship among RSEI, NDBSI, and LST.
Remotesensing 14 04137 g005
Figure 6. Scatterplot of RSEI Moran’s I in Panzhihua in 1990, 1995, 2000, 2005, 2010, 2015, and 2020.
Remotesensing 14 04137 g006
Figure 7. Spatial Distribution of Hotspots and Coldspots in Panzhihua City, 1990–2020. Note: Cold Spot-99% Confidence and Hot Spot-99% Confidence mean that the samples have a statistical significance with 99% confidence, while Not Significant shows that the samples are not statistically significant.
Remotesensing 14 04137 g007
Figure 8. RSEI Detection Change in Panzhihua from 1990 to 2020.
Remotesensing 14 04137 g008
Table 1. PCA Results of RSEI from 1990 to 2020.
YearIndicatorsPC1PC2PC3PC4
1990WET0.12 0.38 0.38 −0.84
NDVI0.91 −0.39 −0.10 −0.09
NDBSI−0.29 −0.37 −0.71 −0.53
LST−0.27 −0.75 0.59 −0.12
Eigenvalue0.01 0.00 0.00 0.00
Percent eigenvalue84.32%11.00%4.08%0.61%
1995WET0.17 0.43 0.87 −0.19
NDVI0.96 −0.29 −0.05 −0.04
NDBSI−0.07 −0.07 −0.16 −0.98
LST−0.23 −0.85 0.47 0.00
Eigenvalue0.01 0.00 0.00 0.00
Percent eigenvalue89.21%7.99%2.72%0.08%
2000WET0.14 −0.56 0.80 0.12
NDVI0.17 −0.58 −0.53 0.60
NDBSI−0.97 −0.22 0.00 0.07
LST−0.07 0.54 0.28 0.79
Eigenvalue0.01 0.00 0.00 0.00
Percent eigenvalue78.46%17.37%3.26%0.91%
2005WET0.09 −0.06 0.42 −0.90
NDVI0.79 0.60 −0.12 −0.02
NDBSI−0.13 −0.02 −0.90 −0.42
LST−0.59 0.80 0.10 −0.06
Eigenvalue0.01 0.00 0.00 0.00
Percent eigenvalue78.78%19.02%2.03%0.17%
2010WET0.13 −0.01 0.90 −0.41
NDVI0.48 0.87 −0.08 −0.07
NDBSI−0.07 −0.07 −0.40 −0.91
LST−0.86 0.49 0.12 −0.02
Eigenvalue0.02 0.00 0.000.00
Percent eigenvalue84.15%14.32%1.41%0.12%
2015WET0.23 0.04 0.97 −0.11
NDVI0.51 0.85 −0.15 0.00
NDBSI−0.03 −0.01 −0.11 −0.99
LST−0.83 0.53 0.18 0.00
Eigenvalue0.01 0.00 0.00 0.00
Percent eigenvalue76.92%18.87%4.18%0.03%
2020WET0.39 −0.07 −0.87 −0.30
NDVI0.53 0.82 0.20 −0.07
NDBSI−0.17 −0.03 0.26 −0.95
LST−0.73 0.56 −0.38 0.01
Eigenvalue0.02 0.00 0.00 0.00
Percent eigenvalue78.05%12.84%8.57%0.54%
PC1 is the first principal component of the principal component analysis. Similarly, PC2 is the second, PC3 is the third, and PC4 is the fourth.
Table 2. Not Significant Area of the Mine.
Region 1990199520002005201020152020Average
Baima MineMine Scale/%33.30%30.36%49.18%23.85%30.63%33.75%36.96%34.00%
City Scale/%68.44%52.00%41.78%11.56%11.56%24.00%39.11%35.49%
Zhulan MineMine Scale/%27.09%30.12%23.33%29.39%37.46%31.98%38.04%31.06%
City Scale/%16.34%12.87%15.35%6.44%10.40%12.87%21.29%13.65%
Panjiatian MineMine Scale/%33.22%23.98%34.88%28.73%15.70%18.36%13.44%24.05%
City Scale/%91.67%100.00%4.17%45.83%54.17%83.33%70.83%64.29%
Table 3. Detection of Changes in RSEI Levels 1990–2020.
Region Improvement ObviousImprovement SlightInvariabilityDeterioration SlightDeterioration Obvious
PanzhihuaArea/km2151.732760.573315.381371.91114.42
Pct./%1.9735.7942.9817.781.48
Zhulan mineArea/km21.7080.7968.158.640.16
Pct./%1.0750.6742.745.420.10
Baima mineArea/km22.6162.5565.3538.586.10
Pct./%1.4935.7037.3022.023.48
Panjiatian mineArea/km20.264.703.944.300.75
Pct./%1.8633.6828.2530.845.37
Publisher’s Note: MDPI stays neutral with regard to jurisdictional claims in published maps and institutional affiliations.

