
Ionospheric Kalman Filter Assimilation Based on Covariance Localization Technique


Abstract
:1. Introduction
1.1. Ionosphere Data Assimilation
1.2. Covariance Modeling
1.3. Innovation
2. Materials and Methods
2.1. Kalman Filtering Algorithm
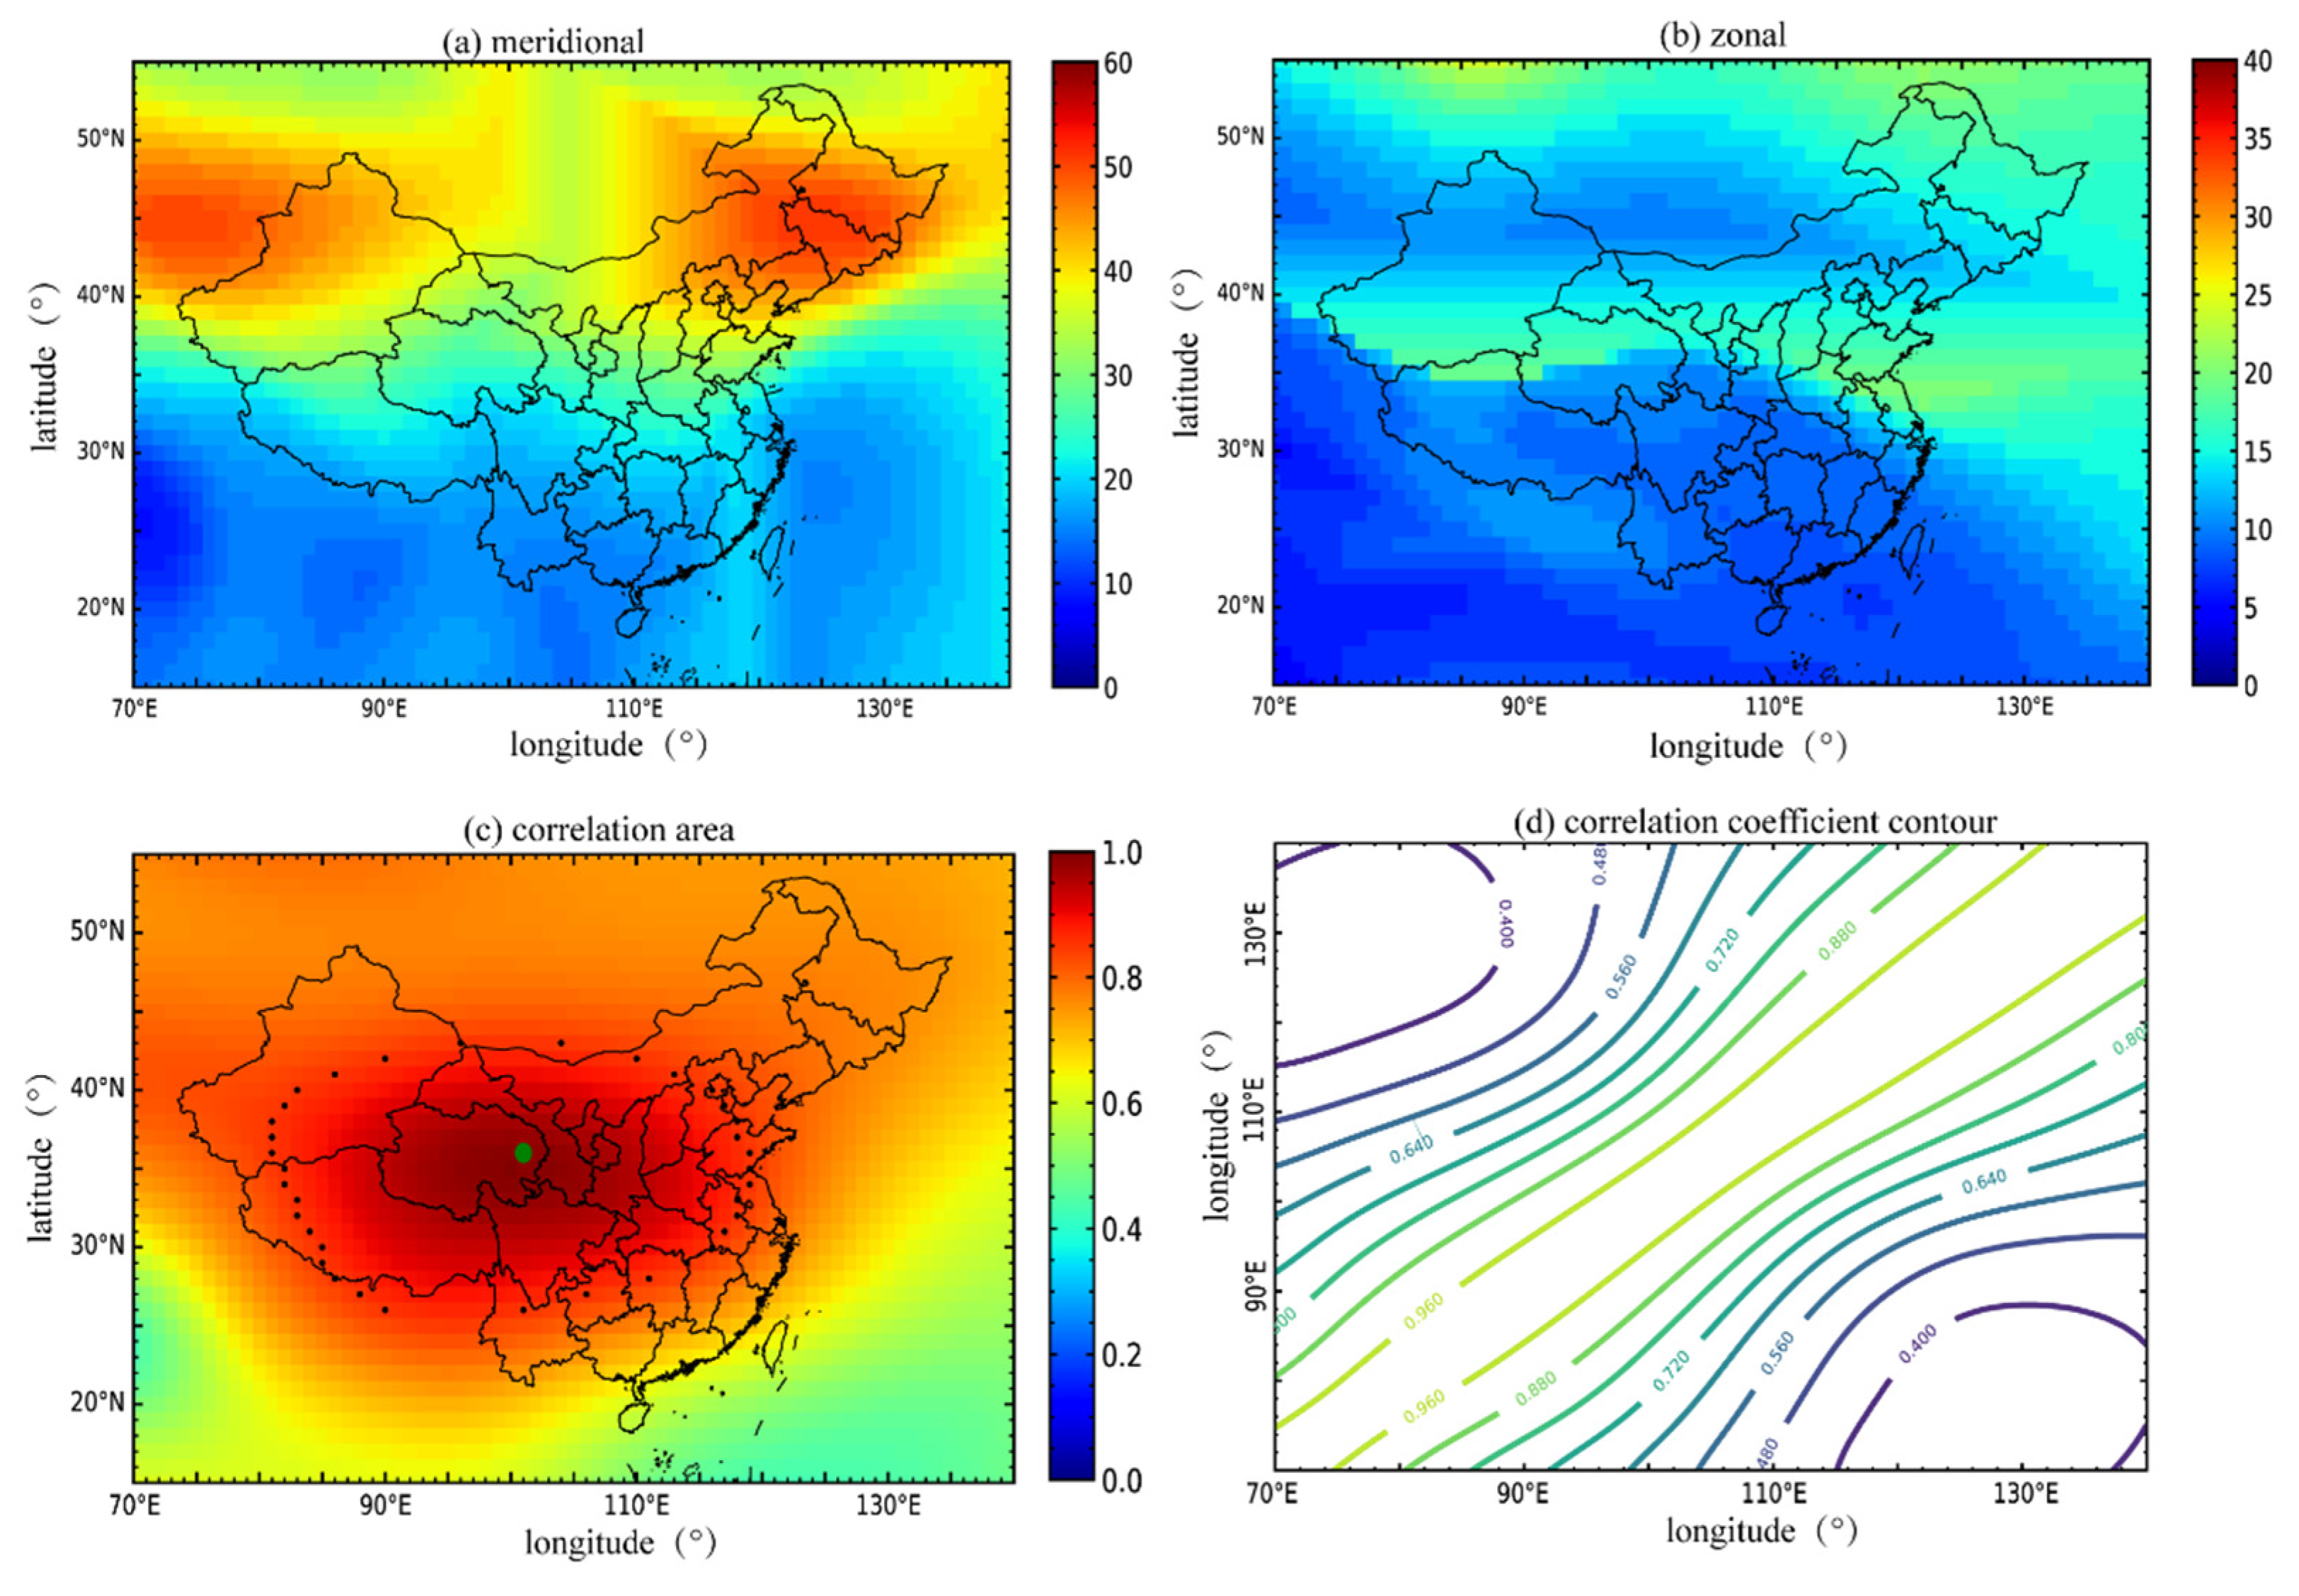
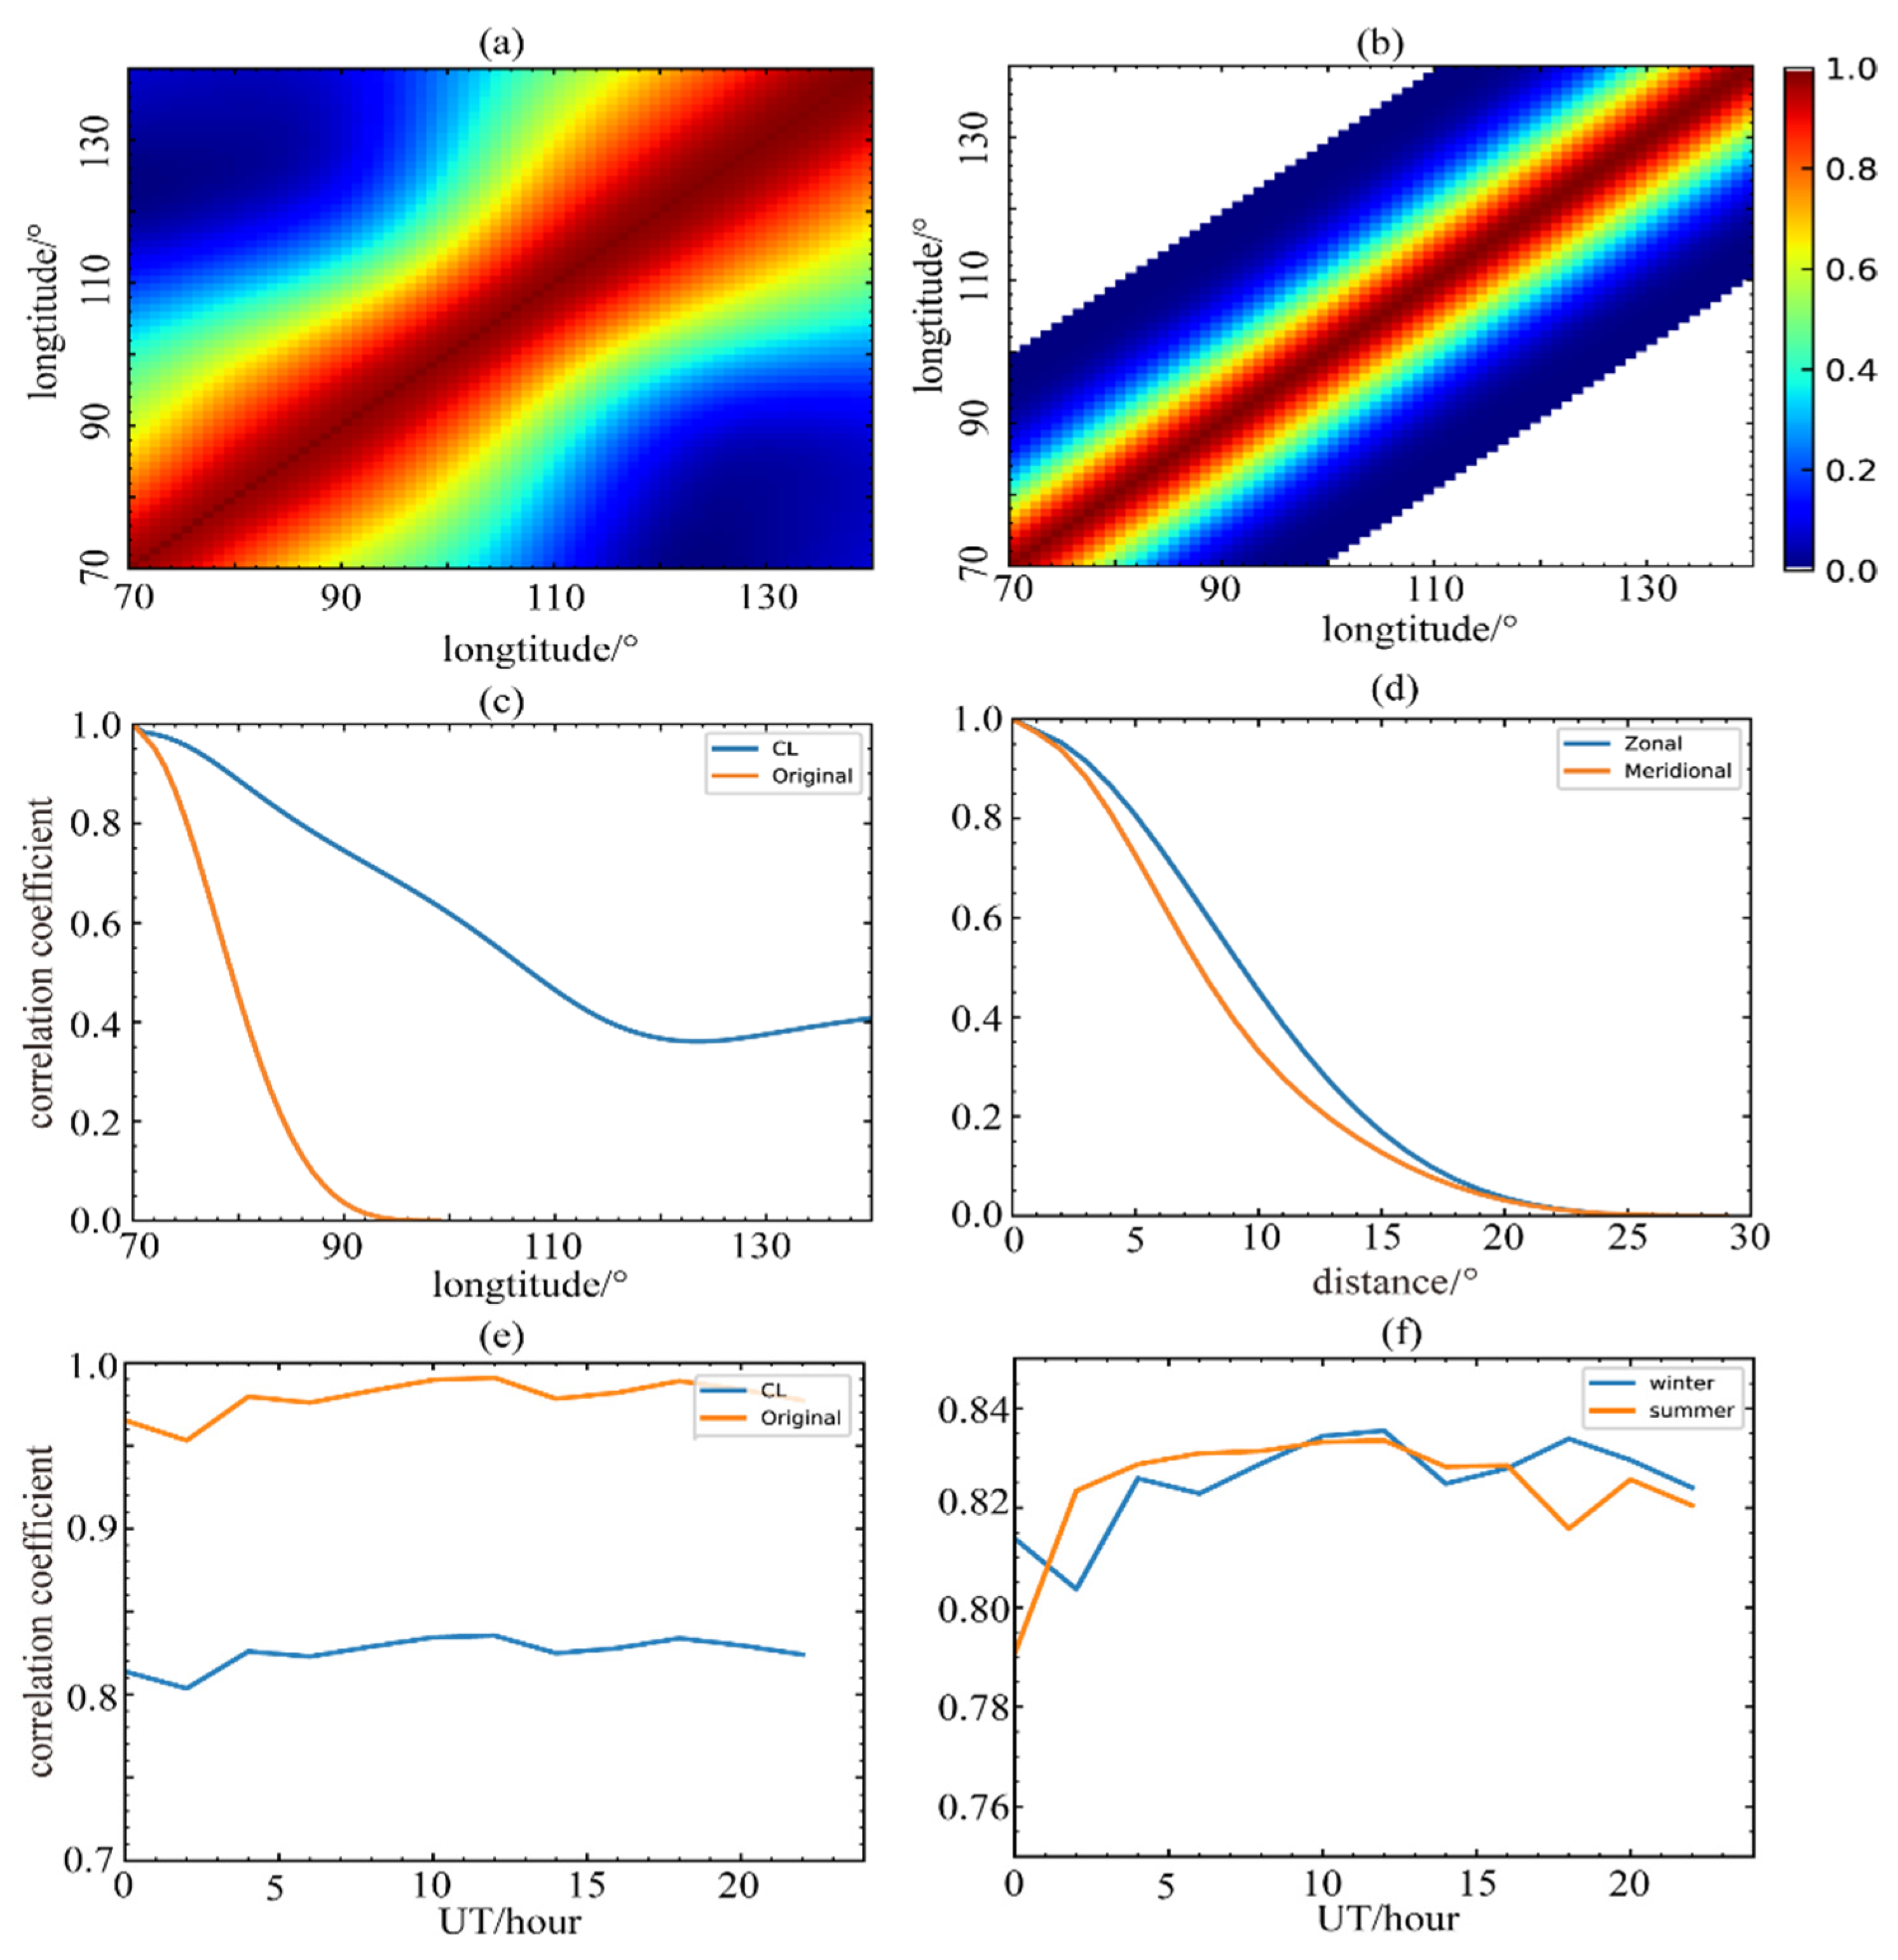
2.2. Covariance Localization (CL)
2.3. Sparse Matrix Compression Algorithm
3. Data
3.1. Background Data
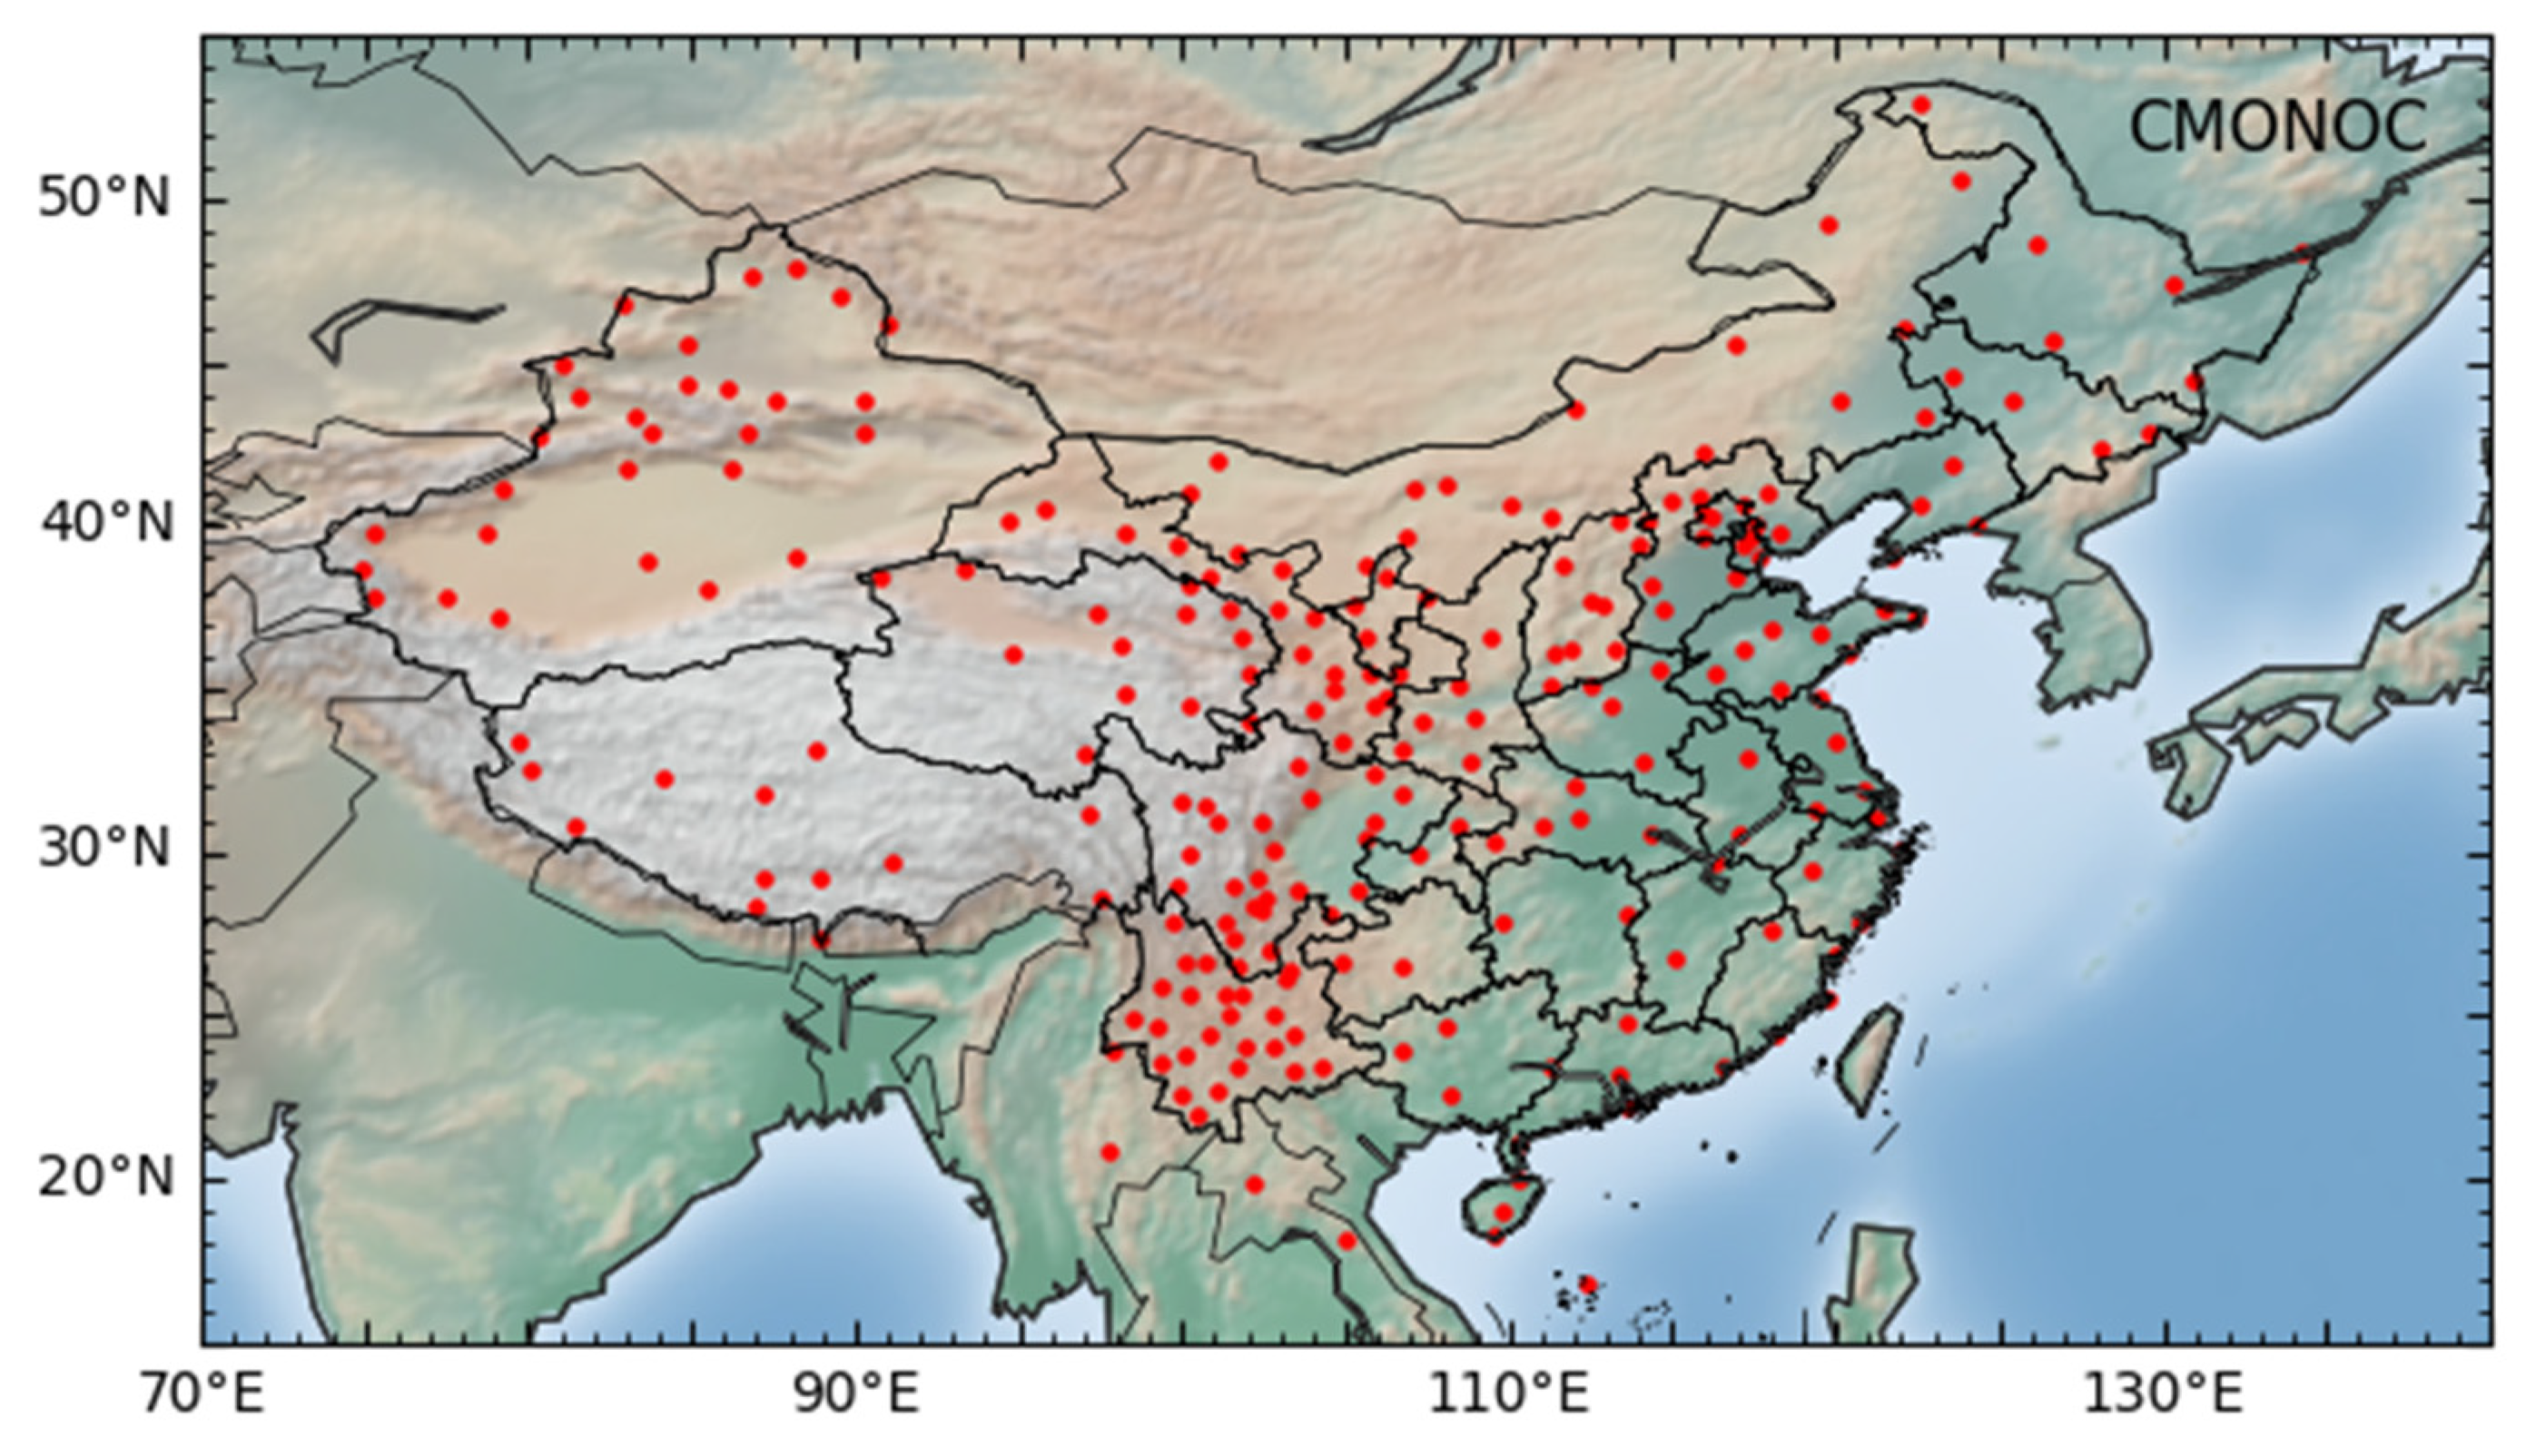
3.2. Observation Data
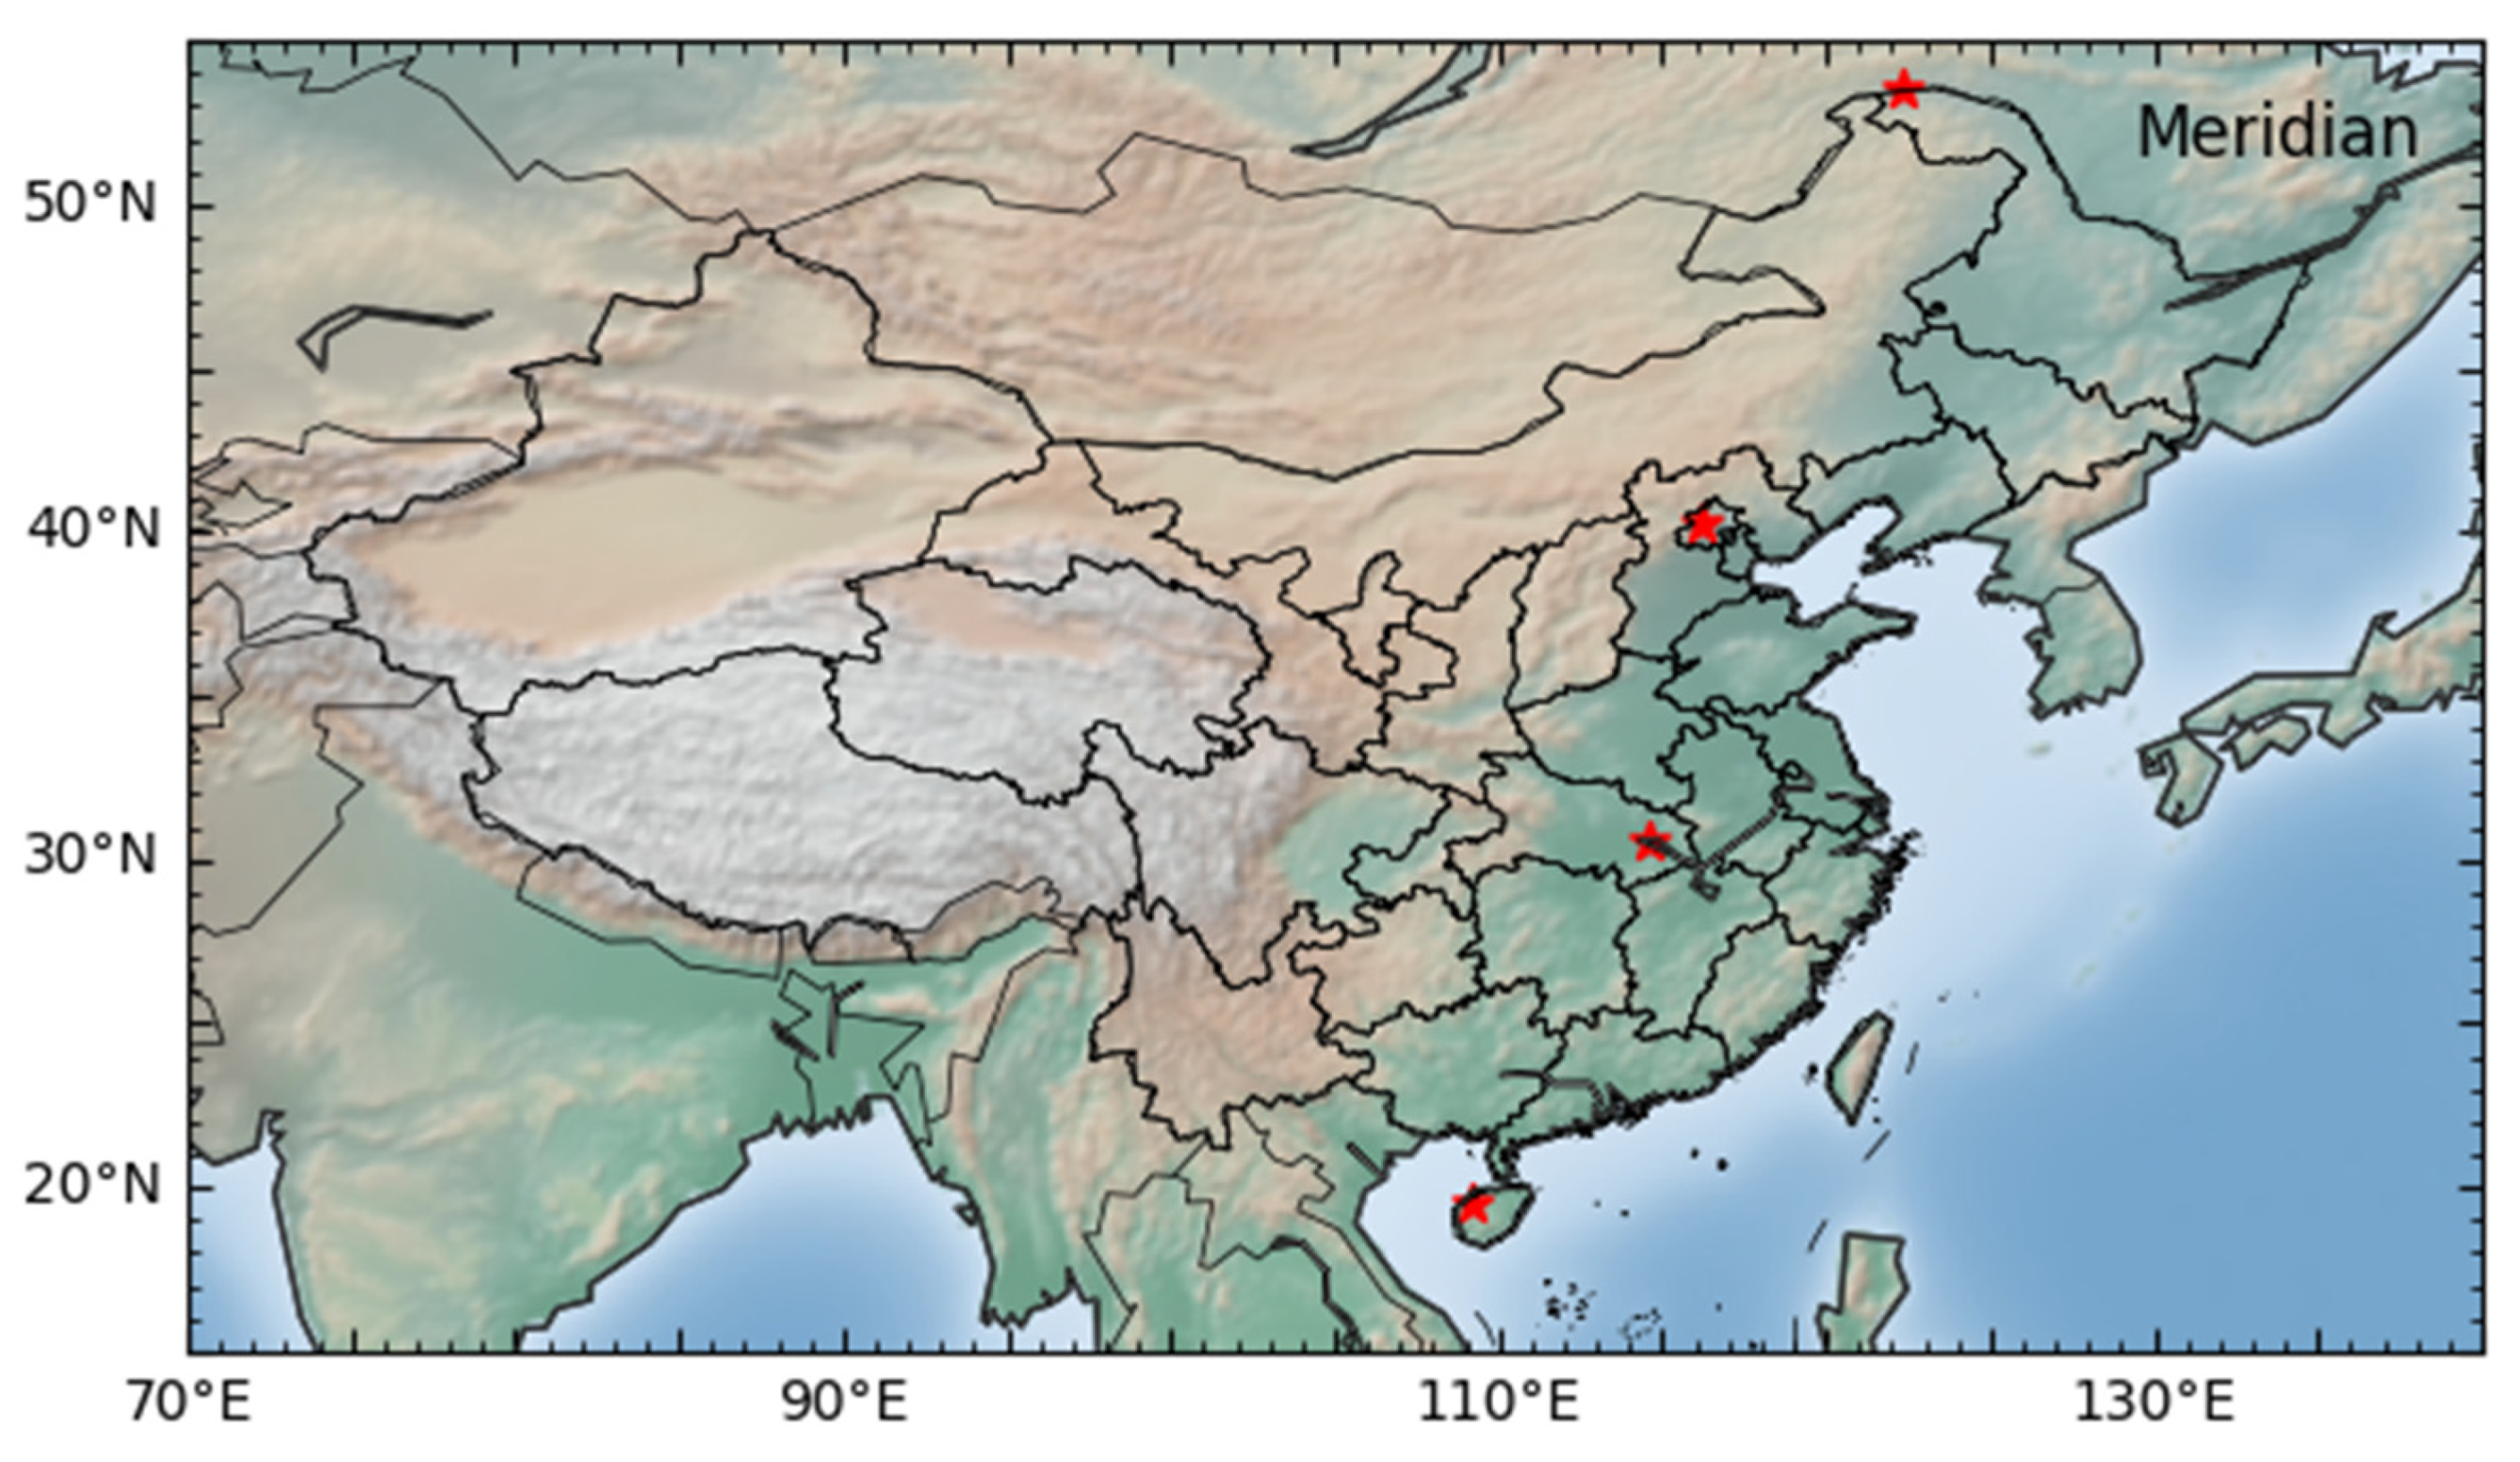
3.3. Digisonde Data
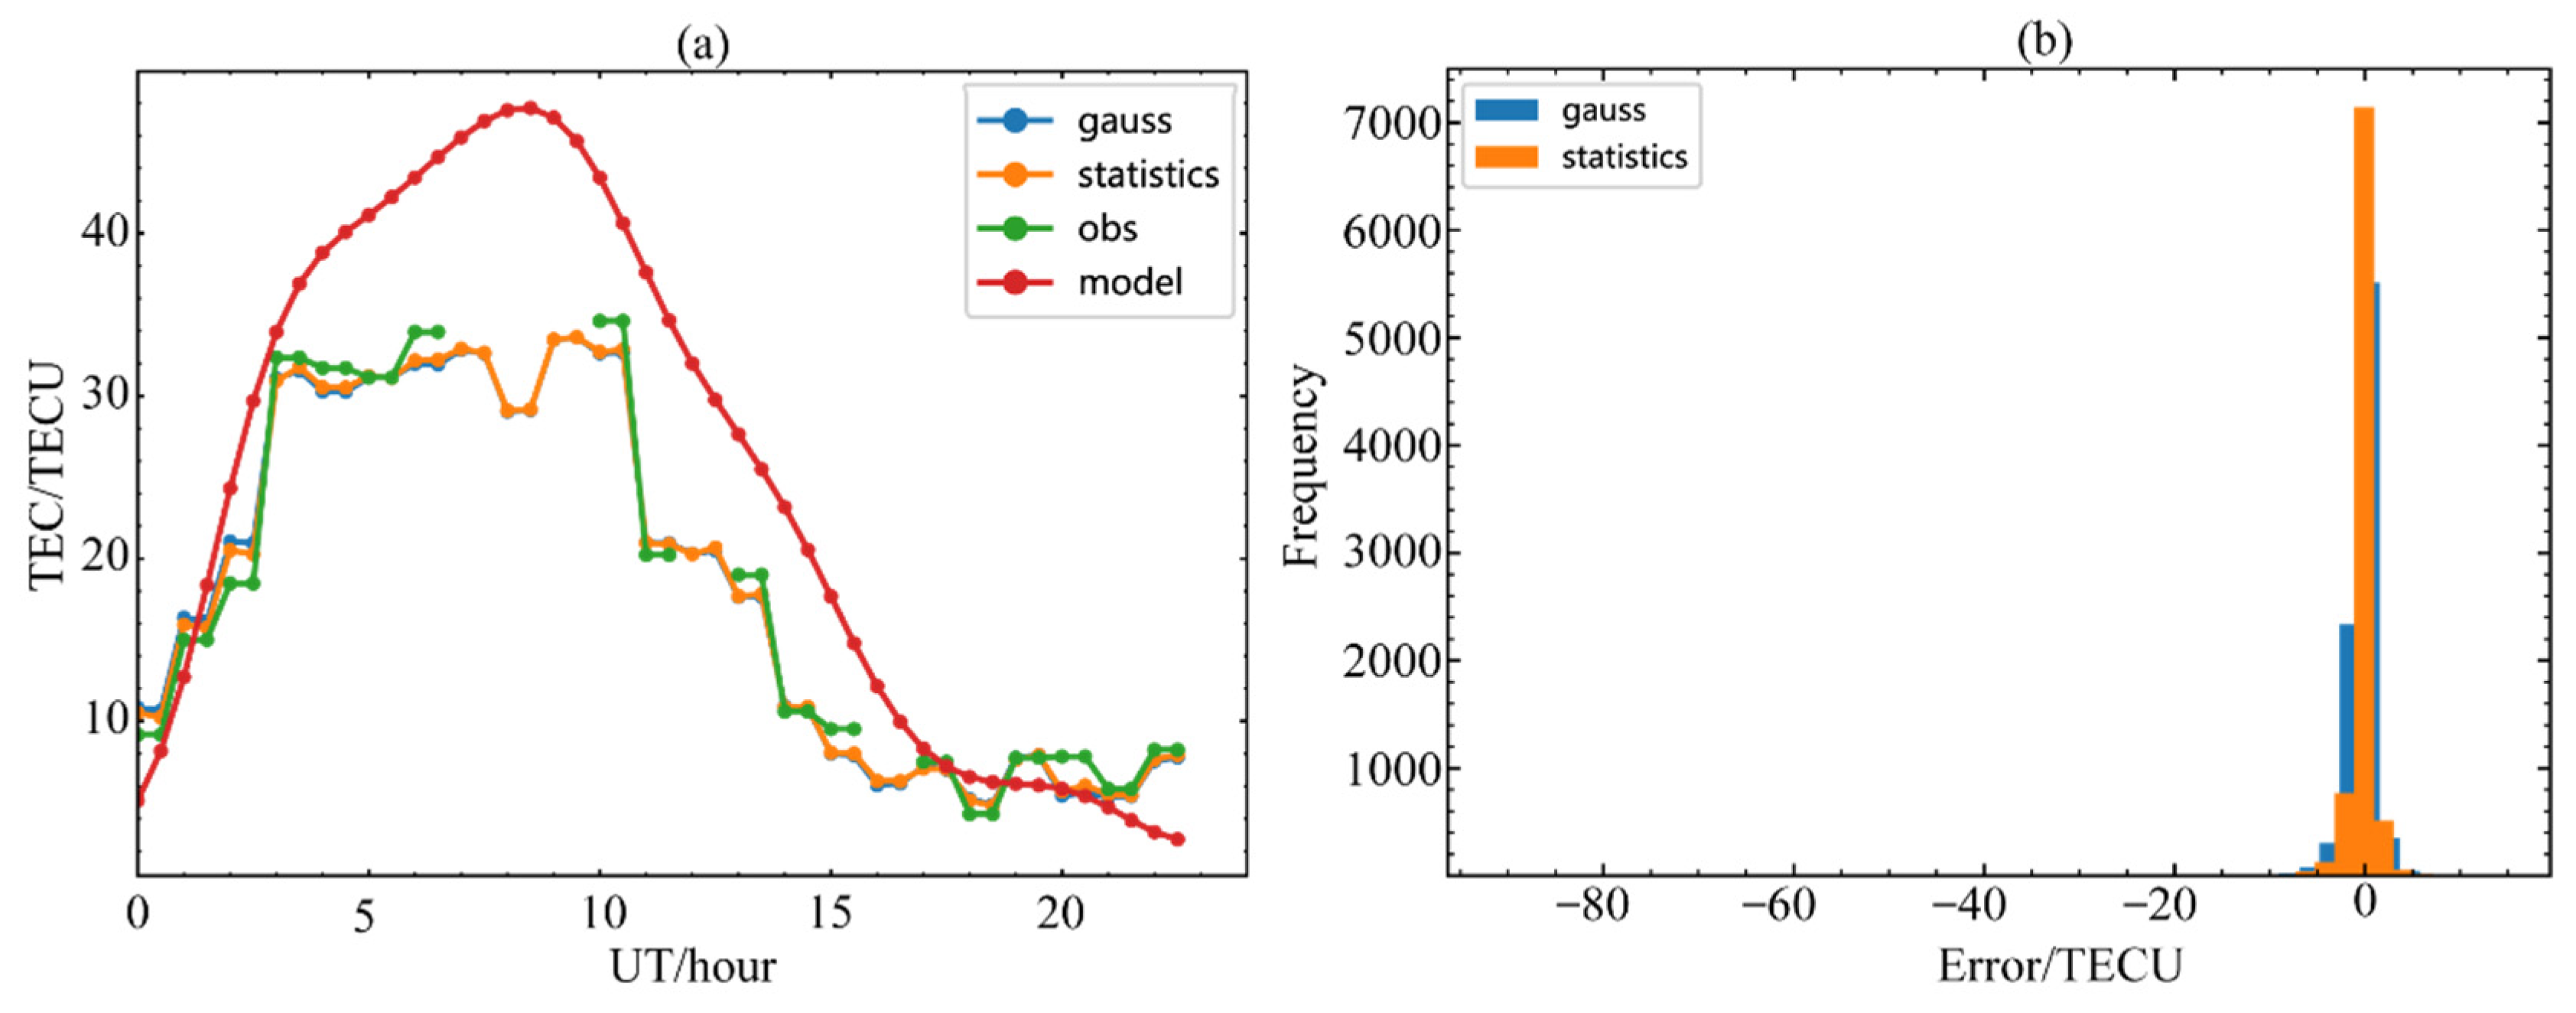
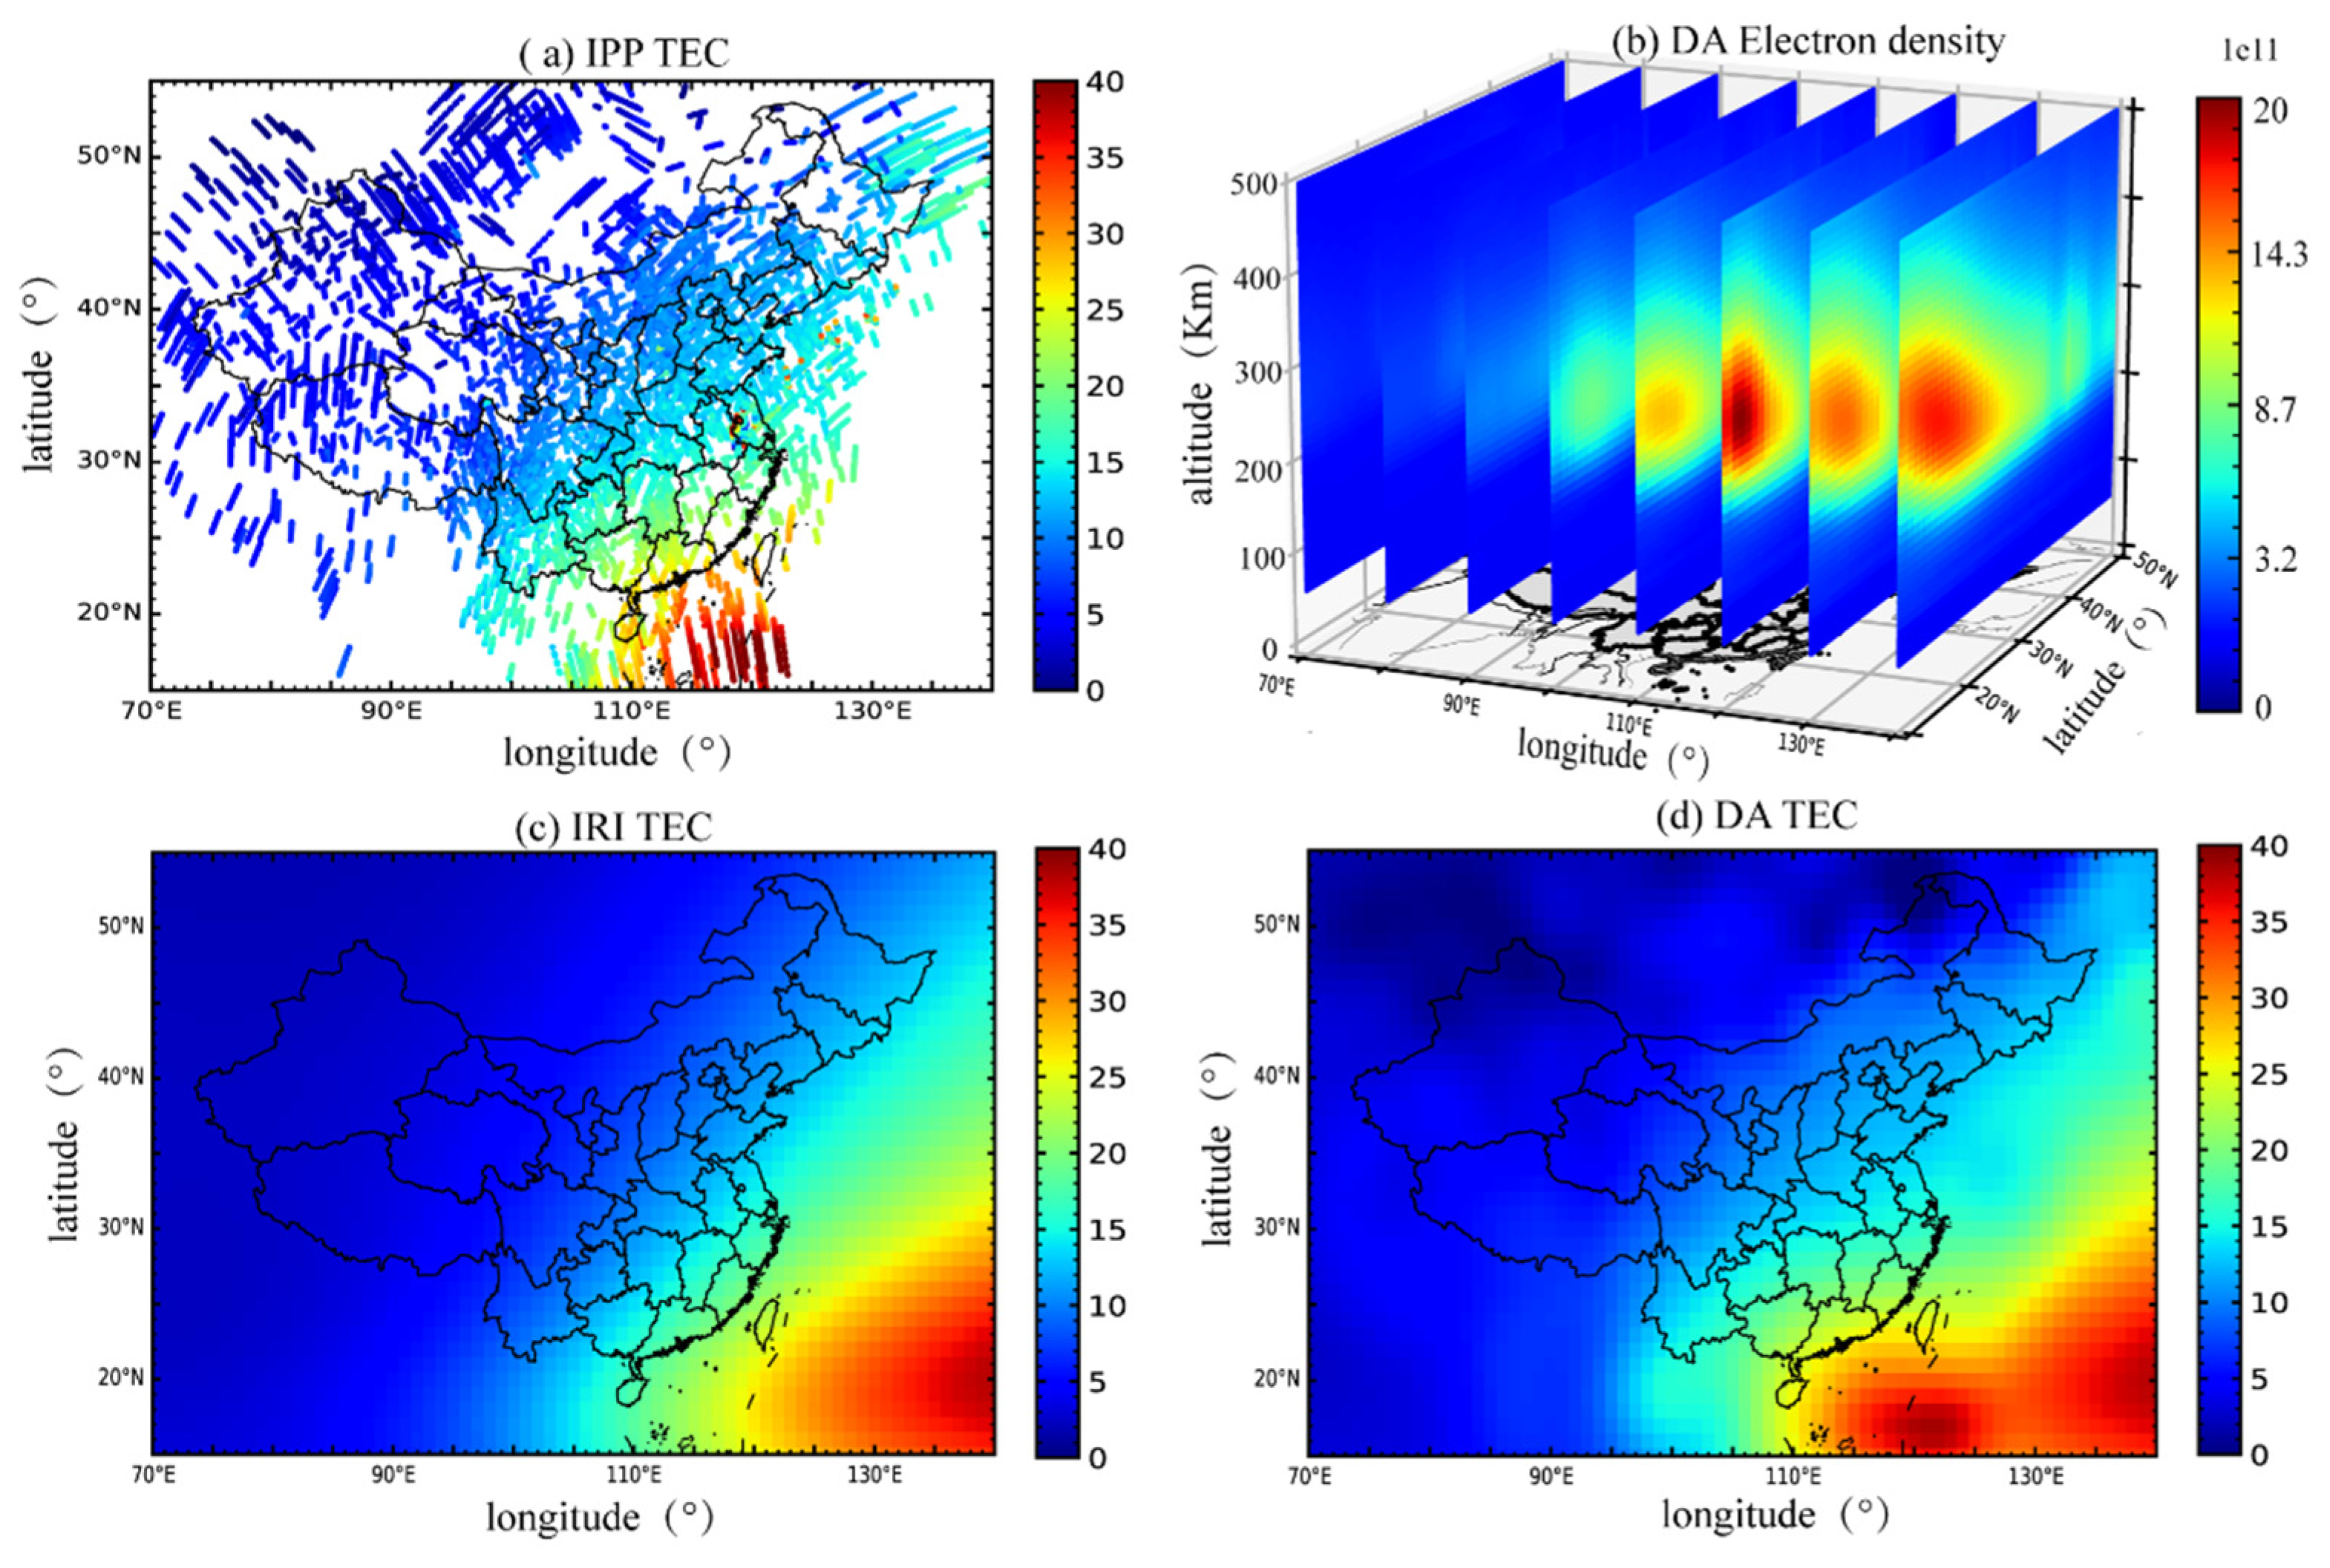
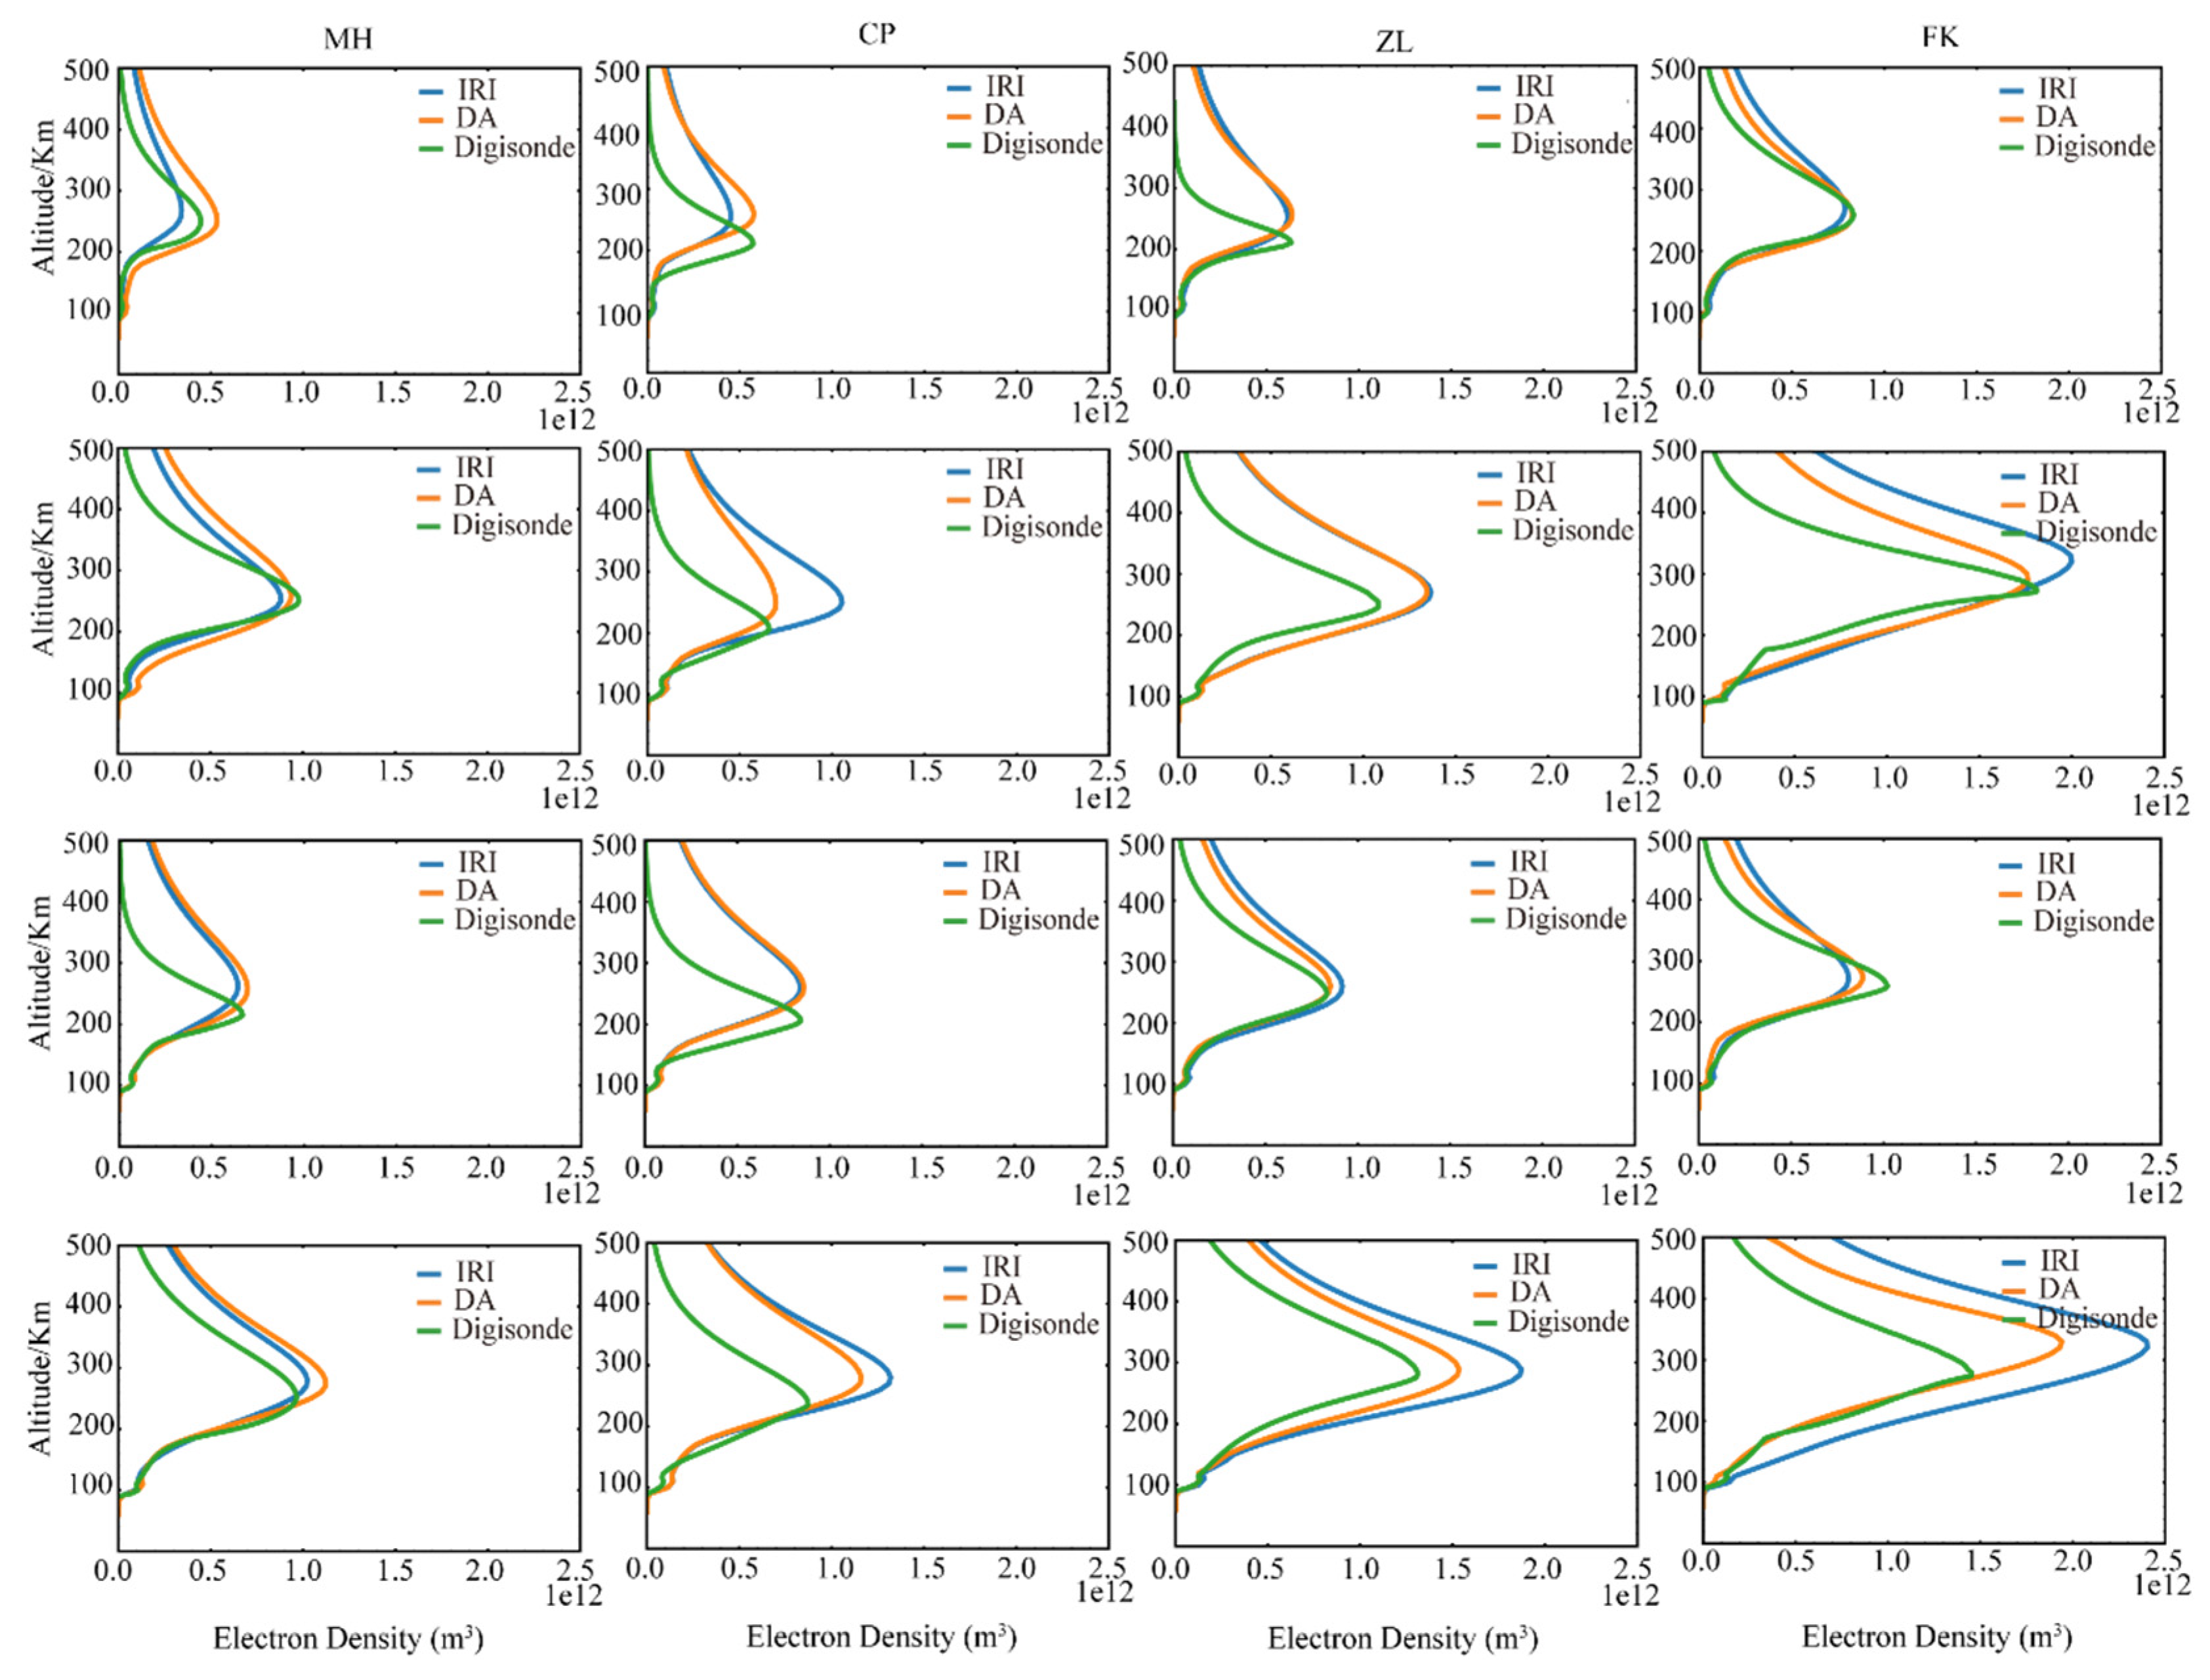
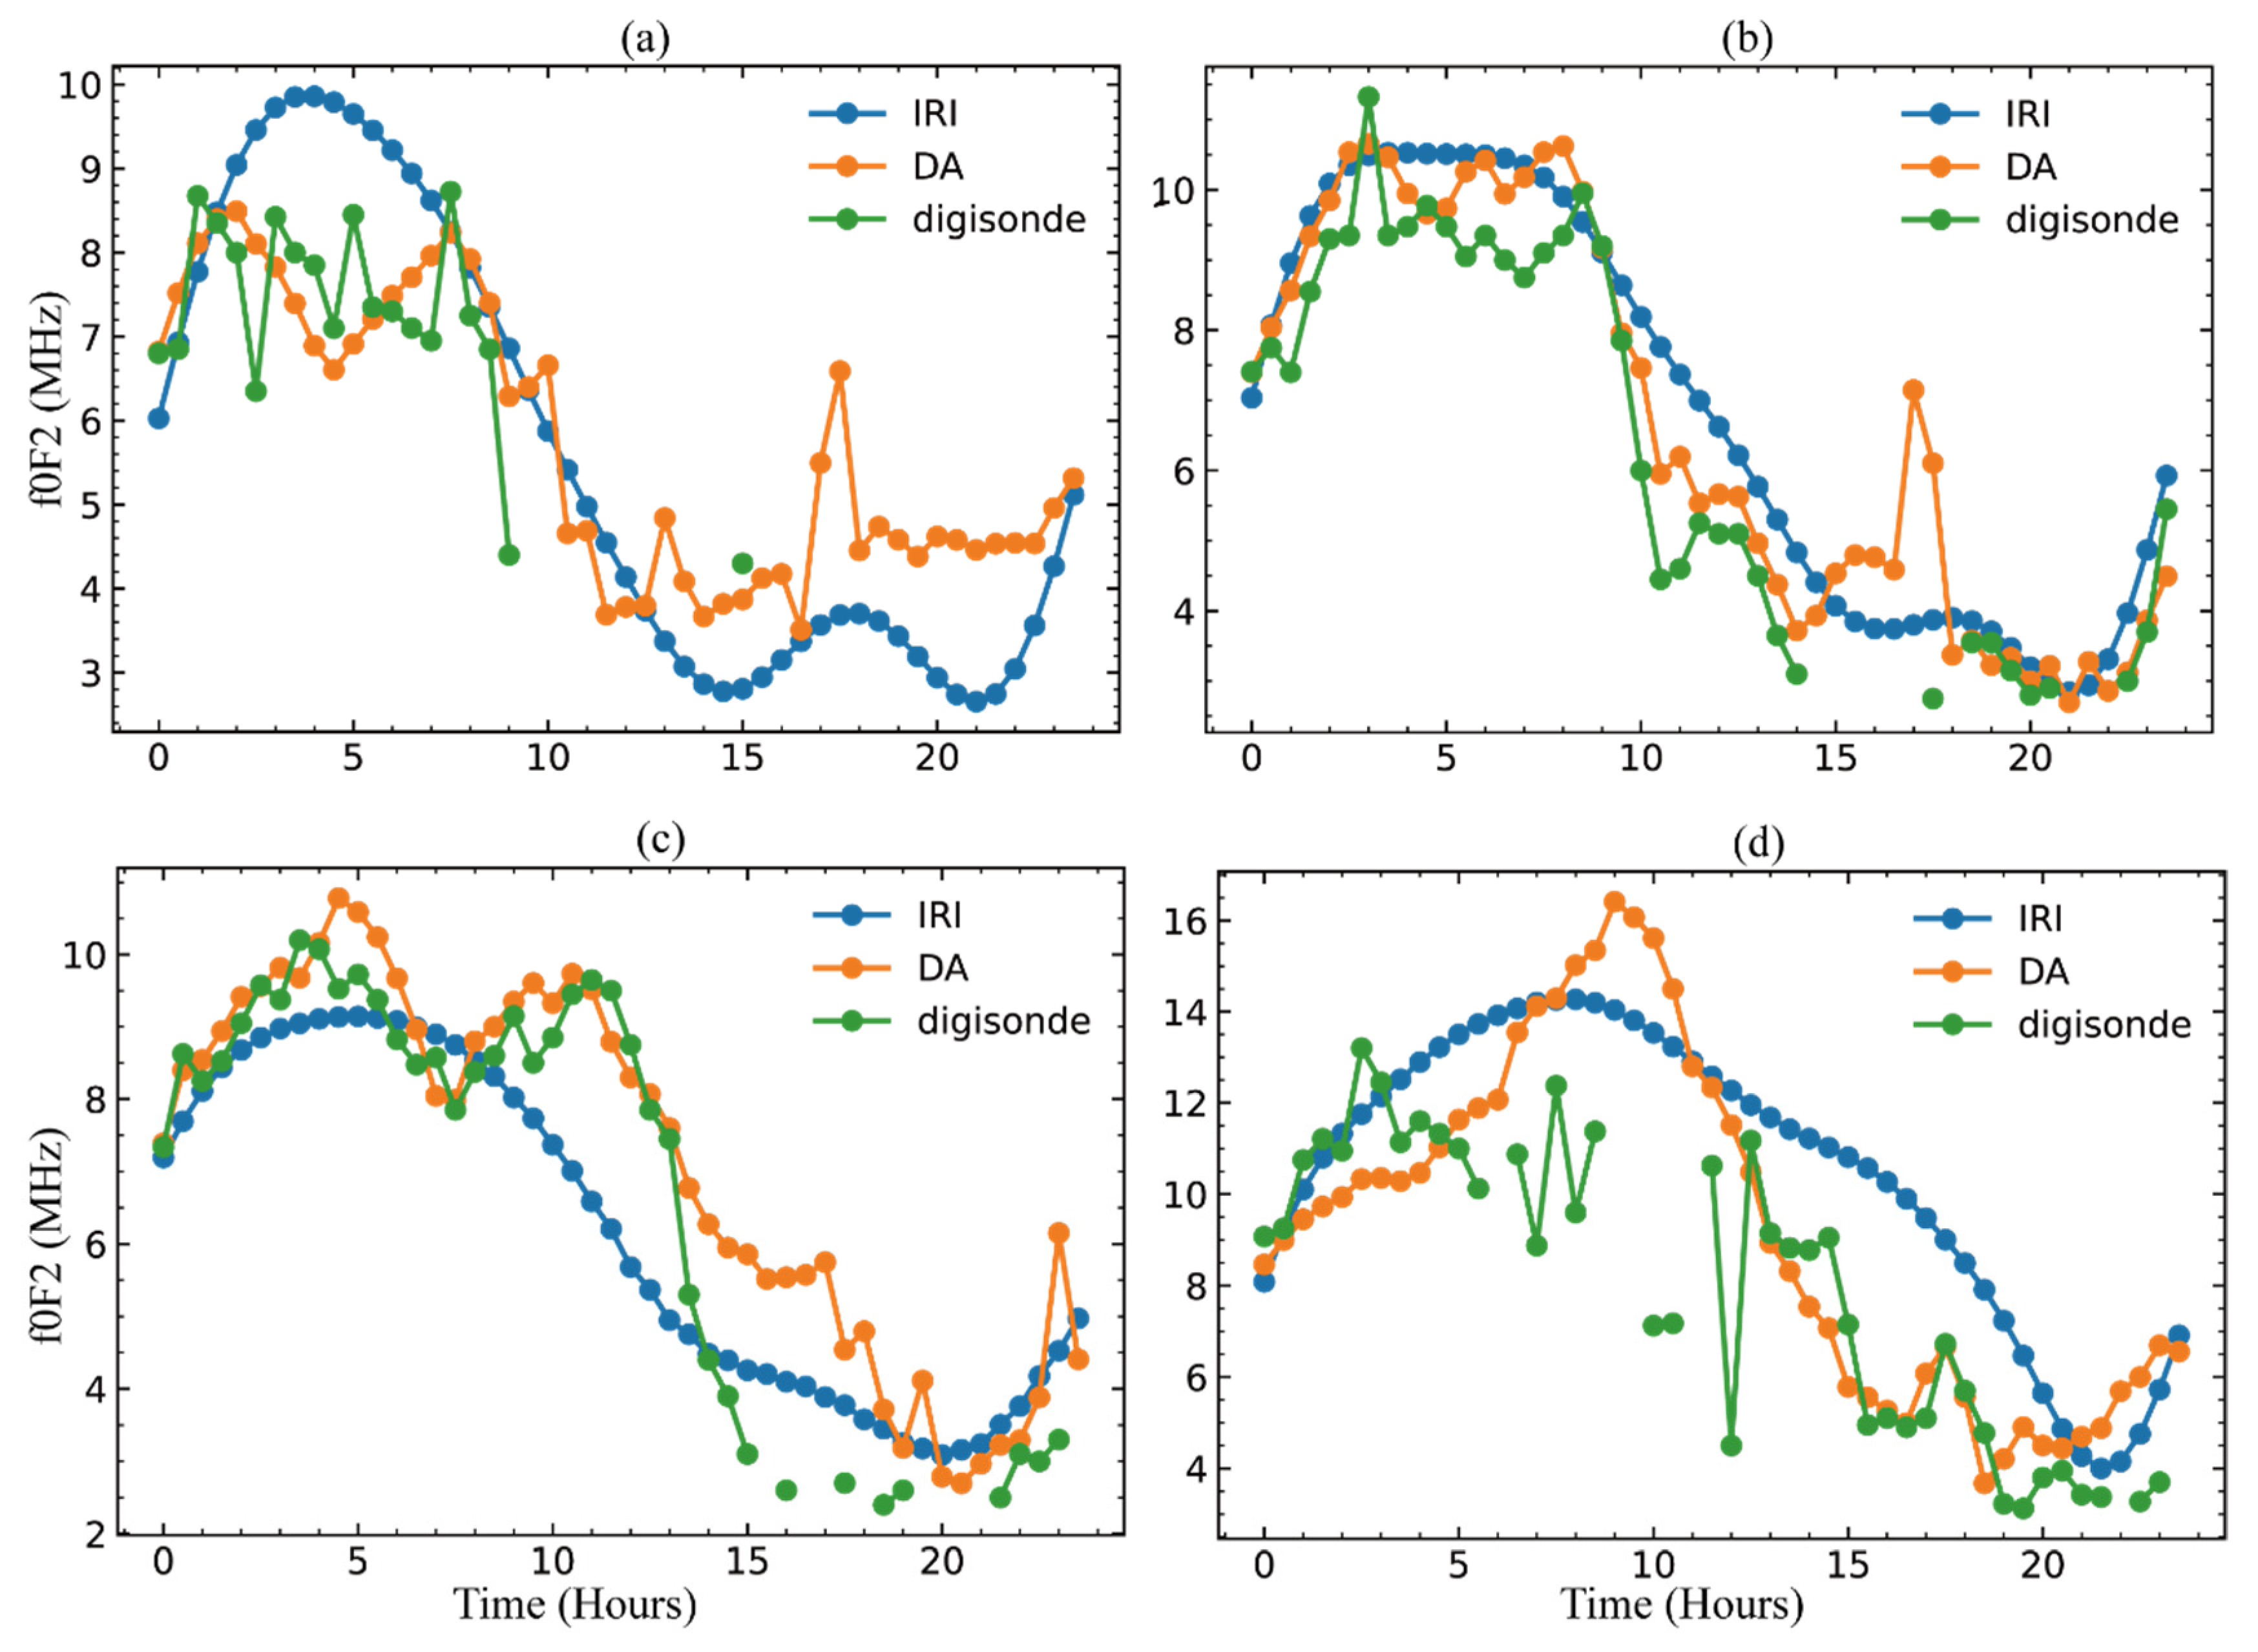
4. Results
5. Conclusions
Author Contributions
Funding
Data Availability Statement
Acknowledgments
Conflicts of Interest
References
- Scherliess, L.; Schunk, R.W.; Sojka, J.J.; Thompson, D.C.; Zhu, L. Utah State University Global Assimilation of Ionospheric Measurements Gauss-Markov Kalman filter model of the ionosphere: Model description and validation. J. Geophys. Res. Atmos. 2006, 111, A11315.1–A11315.12. [Google Scholar] [CrossRef]
- Yue, X.; Wan, W.; Liu, L.; Zheng, F.; Lei, J.; Zhao, B.; Xu, G.; Zhang, S.-R.; Zhu, J. Data assimilation of incoherent scatter radar observation into a one-dimensional midlatitude ionospheric model by applying ensemble Kalman filter. Radio Sci. 2007, 42, 1–20. [Google Scholar] [CrossRef]
- Bust, G.S.; Garner, T.W.; Gaussiran, T.L. Ionospheric Data Assimilation Three-Dimensional (IDA3D): A global, multisensor, electron density specification algorithm. J. Geophys. Res. Earth Surf. 2004, 109, A11312. [Google Scholar] [CrossRef]
- Hajj, G.A.; Wilson, B.D.; Wang, C.; Pi, X.; Rosen, I.G. Data assimilation of ground GPS total electron content into a physics-based ionospheric model by use of the Kalman filter. Radio Sci. 2004, 39, 1–17. [Google Scholar] [CrossRef]
- Schunk, R.W.; Scherliess, L.; Sojka, J.J.; Thompson, D.C.; Anderson, D.N.; Codrescu, M.; Minter, C.; Fuller-Rowell, T.J.; Heelis, R.; Hairston, M.; et al. Global Assimilation of Ionospheric Measurements (GAIM). Radio Sci. 2004, 39, RS1S02. [Google Scholar] [CrossRef]
- Yue, X.; Schreiner, W.S.; Kuo, Y.-H.; Hunt, D.C.; Wang, W.; Solomon, S.C.; Burns, A.G.; Bilitza, D.; Liu, J.-Y.; Wan, W.; et al. Global 3-D ionospheric electron density reanalysis based on multisource data assimilation. J. Geophys. Res. Earth Surf. 2012, 117, A09325. [Google Scholar] [CrossRef]
- Yue, X.; Schreiner, W.S.; Kuo, Y.-H.; Braun, J.J.; Lin, Y.-C.; Wan, W. Observing System Simulation Experiment Study on Imaging the Ionosphere by Assimilating Observations from Ground GNSS, LEO-Based Radio Occultation and Ocean Reflection, and Cross Link. IEEE Trans. Geosci. Remote Sens. 2014, 52, 3759–3773. [Google Scholar] [CrossRef]
- Lee, I.T.; Matsuo, T.; Richmond, A.; Liu, J.Y.; Wang, W.; Lin, C.C.H.; Anderson, J.L.; Chen, M.Q. Assimilation of FORMOSAT-3/COSMIC electron density profiles into a coupled thermosphere/ionosphere model using ensemble Kalman filtering. J. Geophys. Res. Space Phys. 2012, 117, 10318. [Google Scholar] [CrossRef]
- Hsu, C.; Matsuo, T.; Yue, X.; Fang, T.; Fuller-Rowell, T.; Ide, K.; Liu, J. Assessment of the Impact of FORMOSAT-7/COSMIC-2 GNSS RO Observations on Midlatitude and Low-Latitude Ionosphere Specification: Observing System Simulation Experiments Using Ensemble Square Root Filter. J. Geophys. Res. Space Phys. 2018, 123, 2296–2314. [Google Scholar] [CrossRef]
- He, J.; Yue, X.; Wang, W.; Wan, W. EnKF Ionosphere and Thermosphere Data Assimilation Algorithm Through a Sparse Matrix Method. J. Geophys. Res. Space Phys. 2019, 124, 7356–7365. [Google Scholar] [CrossRef]
- Jee, G.; Burns, A.G.; Wang, W.; Solomon, S.; Schunk, R.W.; Scherliess, L.; Thompson, D.C.; Sojka, J.J.; Zhu, L. Duration of an ionospheric data assimilation initialization of a coupled thermosphere-ionosphere model. Space Weather 2007, 5, S01004. [Google Scholar] [CrossRef]
- Hsu, C.-T.; Matsuo, T.; Wang, W.; Liu, J.-Y. Effects of inferring unobserved thermospheric and ionospheric state variables by using an Ensemble Kalman Filter on global ionospheric specification and forecasting. J. Geophys. Res. Space Phys. 2014, 119, 9256–9267. [Google Scholar] [CrossRef]
- Gardner, L.C.; Schunk, R.W.; Scherliess, L.; Sojka, J.J.; Zhu, L. Global Assimilation of Ionospheric Measurements-Gauss Markov model: Improved specifications with multiple data types. Space Weather 2014, 12, 675–688. [Google Scholar] [CrossRef]
- He, J.; Yue, X.; Le, H.; Ren, Z.; Wan, W. Evaluation on the Quasi-Realistic Ionospheric Prediction Using an Ensemble Kalman Filter Data Assimilation Algorithm. Space Weather 2020, 18, e2019SW002410. [Google Scholar] [CrossRef]
- Qiao, J.; Liu, Y.; Fan, Z.; Tang, Q.; Li, X.; Zhang, F.; Song, Y.; He, F.; Zhou, C.; Qing, H.; et al. Ionospheric TEC data assimilation based on Gauss–Markov Kalman filter. Adv. Space Res. 2021, 68, 4189–4204. [Google Scholar] [CrossRef]
- Galkin, I.A.; Reinisch, B.W.; Huang, X.; Bilitza, D. Assimilation of GIRO data into a real-time IRI. Radio Sci. 2012, 47, RS0L07. [Google Scholar] [CrossRef]
- Angling, M.J.; Shaw, J.; Shukla, A.K.; Cannon, P.S. Development of an HF selection tool based on the Electron Density Assimilative Model near-real-time ionosphere. Radio Sci. 2009, 44, RS0A13. [Google Scholar] [CrossRef]
- Yue, X.; Schreiner, W.S.; Lin, Y.-C.; Rocken, C.; Kuo, Y.-H.; Zhao, B. Data assimilation retrieval of electron density profiles from radio occultation measurements. J. Geophys. Res. Earth Surf. 2011, 116, 148–227. [Google Scholar] [CrossRef]
- Mengist, C.K.; Kim, Y.H.; Ssessanga, N.; Kim, J. A Data Assimilated Regional Ionosphere Model Using the Total Electron Content from the Korean GPS Network. J. Korean Phys. Soc. 2018, 72, 826–834. [Google Scholar] [CrossRef]
- Aa, E.; Huang, W.; Yu, S.; Liu, S.; Shi, L.; Gong, J.; Chen, Y.; Shen, H. A regional ionospheric TEC mapping technique over China and adjacent areas on the basis of data assimilation. J. Geophys. Res. Space Phys. 2015, 120, 5049–5061. [Google Scholar] [CrossRef]
- Forsythe, V.V.; Azeem, I.; Crowley, G. Ionospheric Horizontal Correlation Distances: Estimation, Analysis, and Implications for Ionospheric Data Assimilation. Radio Sci. 2020, 55, e2020RS007159. [Google Scholar] [CrossRef]
- Forsythe, V.V.; Azeem, I.; Crowley, G.; Themens, D.R. Ionospheric Vertical Correlation Distances: Estimation from ISR Data, Analysis, and Implications for Ionospheric Data Assimilation. Radio Sci. 2021, 56, e2020RS007177. [Google Scholar] [CrossRef]
- Wang, S.; Huang, S.; Fang, H. Estimating of the Global Ionosphere Maps Using Hybrid Data Assimilation Method and Their Background Influence Analysis. J. Geophys. Res. Space Phys. 2020, 125, e2020JA028047. [Google Scholar] [CrossRef]
- Kalman, R.E. A New Approach to Linear Filtering and Prediction Problems. J. Basic Eng. 1960, 82, 35–45. [Google Scholar] [CrossRef]
- Rosen, I.G.; Wang, C.; Hajj, G.; Pi, X.; Wilson, B. An Adjoint Method Based Approach to Data Assimilation for a Distributed Parameter Model for the Ionosphere. In Proceedings of the 40th IEEE Conference on Decision and Control, Orlando, FL, USA, 4–7 December 2001. [Google Scholar] [CrossRef]
- Aa, E.; Liu, S.; Huang, W.; Shi, L.; Gong, J.; Chen, Y.; Shen, H.; Li, J. Regional 3-D ionospheric electron density specification on the basis of data assimilation of ground-based GNSS and radio occultation data. Space Weather 2016, 14, 433–448. [Google Scholar] [CrossRef]
- Ledoit, O.; Wolf, M. A well-conditioned estimator for large-dimensional covariance matrices. J. Multivar. Anal. 2004, 88, 365–411. [Google Scholar] [CrossRef]
- Anderson, J.L.; Anderson, S.L. A monte carlo implementation of the nonlinear filtering problem to produce ensemble assimilations and forecasts. Mon. Weather Rev. 1999, 127, 2741–2758. [Google Scholar] [CrossRef]
- Gaspari, G.; Cohn, S.E. Construction of correlation functions in two and three dimensions. Q. J. R. Meteorol. Soc. 1999, 125, 723–757. [Google Scholar] [CrossRef]
- Houtekamer, P.L.; Mitchell, H.L. A sequential ensemble kalman filter for atmospheric data assimilation. Mon. Weather Rev. 2001, 129, 123–137. [Google Scholar] [CrossRef]
- Anderson, J.L. A Local Least Squares Framework for Ensemble Filtering. Mon. Weather Rev. 2003, 131, 634–642. [Google Scholar] [CrossRef]
- Moosavi, A.; Attia, A.; Sandu, A. A machine learning approach to adaptive covariance localization. arXiv 2018, arXiv:1801.00548. [Google Scholar]
- Furrer, R.; Genton, M.G.; Nychka, D. Covariance Tapering for Interpolation of Large Spatial Datasets. J. Comput. Graph. Stat. 2006, 15, 502–523. [Google Scholar] [CrossRef]
- Bilitza, D.; Reinisch, B. International Reference Ionosphere 2007: Improvements and new parameters. Adv. Space Res. 2008, 42, 599–609. [Google Scholar] [CrossRef]
- Bilitza, D.; Altadill, D.; Truhlik, V.; Shubin, V.; Galkin, I.; Reinisch, B.; Huang, X. International Reference Ionosphere 2016: From ionospheric climate to real-time weather predictions. Space Weather 2017, 15, 418–429. [Google Scholar] [CrossRef]


| Season | |||
|---|---|---|---|
| Spring (March to May) | Summer (June to August) | Autumn (September to November) | Winter (December to February) |
| F10.7 | |||
| Low (0–100) | Moderate (100–150) | High (>150) | |
| AP index | |||
| Low (0–30) | Moderate (30–50) | High (>50) | |
| Time | |||
| 0–24 h/2 h | |||
| Parameter | Longitude | Latitude | Height | Time |
|---|---|---|---|---|
| range | 70°E–140°E | 15°N–55°N | 60–500 km | 0–24 h |
| step | 1° | 1° | 10 km | 0.5 h |
Publisher’s Note: MDPI stays neutral with regard to jurisdictional claims in published maps and institutional affiliations. |
© 2022 by the authors. Licensee MDPI, Basel, Switzerland. This article is an open access article distributed under the terms and conditions of the Creative Commons Attribution (CC BY) license (https://creativecommons.org/licenses/by/4.0/).
Share and Cite
Qiao, J.; Zhou, C.; Liu, Y.; Zhao, J.; Zhao, Z. Ionospheric Kalman Filter Assimilation Based on Covariance Localization Technique. Remote Sens. 2022, 14, 4003. https://doi.org/10.3390/rs14164003
Qiao J, Zhou C, Liu Y, Zhao J, Zhao Z. Ionospheric Kalman Filter Assimilation Based on Covariance Localization Technique. Remote Sensing. 2022; 14(16):4003. https://doi.org/10.3390/rs14164003
Chicago/Turabian StyleQiao, Jiandong, Chen Zhou, Yi Liu, Jiaqi Zhao, and Zhengyu Zhao. 2022. "Ionospheric Kalman Filter Assimilation Based on Covariance Localization Technique" Remote Sensing 14, no. 16: 4003. https://doi.org/10.3390/rs14164003