Article

A New Spectral Transformation Approach and Quantitative Analysis for MarSCoDe Laser-Induced Breakdown Spectroscopy (LIBS) Data

1
Shandong Key Laboratory of Optical Astronomy and Solar-Terrestrial Environment, Institute of Space Sciences, School of Space Science and Physics, Shandong University, Weihai 264209, China
2
School of Mechanical, Electrical and Information Engineering, Shandong University, Weihai 264209, China
*
Author to whom correspondence should be addressed.
Remote Sens. 2022, 14(16), 3960; https://doi.org/10.3390/rs14163960
Submission received: 23 June 2022 / Revised: 4 August 2022 / Accepted: 11 August 2022 / Published: 15 August 2022

Abstract

:
Zhurong rover successfully landed on the southern of Utopia Planet of Mars on 15 May 2021. One laser-induced breakdown spectroscopy (LIBS) system, the main payload of the Mars Surface Composition Detector (MarSCoDe), was installed on the Zhurong rover aimed to measure the elements and their abundance in Martian regolith. Now, there are three sets of LIBS system (ChemCam, SuperCam and MarSCoDe) working on Mars at difference landing sites with diverse geologic features. For Mars exploration, cross-validation is necessary to expand the model compatibility, test data validity, and get more available data of the same type payloads. Spectral transformation approach is the first step and crucial for cross-validation of LIBS analysis model. Herein, a new 4-step spectral transformation approach was proposed to transform the LIBS spectra between three different LIBS systems (i.e., ChemCam, MarSCoDe, SDU-LIBS (recorded by self-built LIBS system)), whose data were partly different in spectral characteristics. Based on this approach, SDU-LIBS and MarSCoDe spectra data were transformed into ChemCam uniform and then the three kinds of LIBS data can have more similar spectral features and share one PLS (partial least squares) model for quantitative analysis. Our approach enables to make up the signal differences between different LIBS systems and gets acceptable quantitative analysis results of SDU-LIBS and MarSCoDe spectra using quantitative PLS model built by ChemCam calibration sample set. This work verified feasibility and availability of our approach for cross validation of different LIBS systems. Based on this method, MarSCoDe data were analyzed and got the preliminary satisfying results although no analysis model of laboratory replica payload was available under the existing conditions.

1. Introduction

Mars is by far the most understood terrestrial planet other than Earth. NASA and other space agencies have conducted multiple missions to Mars over the past 58 years, including orbital and in situ probes. As China’s first independent Mars mission, Tianwen-1 implemented orbital and in situ detection at one time [1,2,3,4]. The Zhurong rover successfully landed on the south of Utopia Planitia of Mars on 15 May 2021 where it is believed to have experienced mud volcano, water/ice, and other sulfate mineral formed by geologic activities associated with water [5,6,7,8]. The understanding of Martian geology will deepen by Zhurong rover exploration.
As one of the most important scientific instruments on Zhurong Rover, Mars Surface Composition Detector (MarSCoDe) adopted LIBS to obtain the elemental compositions and their abundance for surface materials on Mars [1,9]. LIBS can quickly and conveniently detect the elemental compositions of the target at sub-millimeter scale in a real time and remote way without sample preparation. Luminous plasma will be produced when LIBS focuses the laser on the target. The elements in the sample can be excited and their emission lines can be acquired and analyzed. LIBS is a powerful tool in planetary exploration [10,11,12,13,14,15,16] which has been applied for Mars explorations such as ChemCam aboard Curiosity rover at Gale Crate [17,18,19] and SuperCam on Perseverance rover at Jezero Crater (19 February 2021) [14,15]. ChemCam revealed the possible biohabitability in the past and has a systematic understanding of the geological history and geological features of the landing site of Curiosity in Gale crater by LIBS detection [20,21,22,23,24,25,26,27,28].
LIBS spectra can be interpreted by using a variety of multiple linear analysis (MLA) methods, for example, PLS is a popular method for modeling relations between sets of intuitive variables by means of latent variables and be used to construct a linear multivariate regression model [29,30]. It is an effective way which has been successfully applied to interpret in situ ChemCam LIBS spectra and obtained derived values similar as the actual values of elemental abundance [17,18,19].
Recently, Zhurong rover has traveled some distances from landing site to south and obtained 32 in situ LIBS spectra from dunes, soils, and rocks. It will continue to move southward to a regarded ancient geologically active area [31]. The LIBS data from Zhurong will continue to deepen our understanding of Mars geological evolution. However, the harsh environment, especially the various temperatures, will cause a certain degree of spectral variation. A PSO (particle swarm optimization) approach was used to alleviate the situation [32]. Temperature influences are still present in the LIBS data in a certain degree, and affect the further analysis. At present, MarSCoDe lacks an available prediction model because testing conditions of MarSCoDe replica is still lacking for model building.
However, for planetary exploration, it is important for data cross-validation, which is necessary to expand the model compatibility, test data validity, and get more available data for conjoint analysis. Therefore, spectral transformation approach as the first stage for cross-validation of LIBS analysis model is crucial for unifying the data format and getting ready for quantitative analysis.
Spectral analysis technology is a powerful tool for complex target analysis. Due to different spectral response and working parameters, the spectra data of different instruments are little difference in spectral response characteristics (such as spectral intensity, spectral resolution) which restrict the further analysis and need to compensate by data transformation approach. Similarly, “calibration transfer” [33,34,35] has been reported to treat near infrared (NIR) spectroscopy data aiming to build a quantitative analysis model to analyze the data of other NIR system. Large amounts of NIR data from two instruments, much training time, and several spectral processing methods were needed to train their models. However, a similar approach has not yet been reported on LIBS. Moreover, those approaches are hard to implement in the case of a small amount of data from MarSCoDe.
The LIBS system (SDU-LIBS) [11], similar to MarSCoDe with different paraments, and a Mars chamber [36] have been built at Shandong University. A Martian Analogues Library (MAL) [37] and the corresponding LIBS database recorded by SDU-LIBS have also been established aiming to interpret the Martian in situ spectra [11]. In this study, spectral data acquired by SDU-LIBS were used for analysis.
In this paper, a 4-step spectral transformation approach was proposed to transform MarSCoDe and SDU-LIBS [11,36]) spectra to ChemCam spectral format, regarded as standard data format, to make those three sources of data have the same spectral data format (step size (the distance between two adjacent pixels), spectral band range, spectral intensity unit, et al.). At same time, necessary spectral normalization was also performed to partly remove the spectral variations effect due to temperature variations of Martian external environment and laser power variation during target excitation. The 4-step approach was done to unify the spectral data formats of ChemCam, MarSCoDe, and SDU-LIBS without training. The small amount of MarSCoDe spectral data does not prevent the preformation of our 4-step approach. After data were transformed by our proposed 4-step approach, SDU-LIBS and MarSCoDe LIBS spectra can be quantitatively analyzed using the PLS model built by ChemCam calibration database. The elemental abundant analytical ability of our approach was verified by quantitative analysis of SDU-LIBS samples which have definite element abundance. Then the MarSCoDe spectra were quantitatively analyzed by the validated PLS model to interpret the regolith components detected by Zhurong rover.

2. Data and Methods

2.1. Samples and Data

At the beginning of this work, only 32 in situ spectra and 44 on-board calibration targets spectra from MarSCoDe are available. Every LIBS spectrum is the average of 60 shoots. A total of 45 high SNR (signal-to-noise ratio) spectra (26 in situ spectra and 19 on-board calibration target spectra) were analyzed in this work.
ChemCam calibration samples were excited with 250 consecutive laser pulse on the surface of each sample, and a total of five average spectra form five different locations were recorded on one target.
A total of 11 identical ChemCam calibration samples (listed in Table 1) were specially selected and recorded by SDU-LIBS system aiming to verify the effectiveness of our proposed approach in this work. Three spectra (the average of 10 shots, integration time of 10 ms per shot) were obtained from three different locations using SDU-LIBS system [11] under simulated Mars conditions (CO2, 700 Pa). Wavelength calibration and spectral radiance calibration of SDU-LIBS have been done before SDU-LIBS data recordation.
Routine data pre-processing was also performed in this work before the application of our approach. Wavelet transform was used to remove the white noise caused by dark currents [18,19]. The continuum background, was identified by the local minimum values and spline interpolation [18], and then removed from original spectra.
Because the LIBS spectral bands of MarSCoDe and ChemCam do not match well, only the same spectral bands of those two systems with a higher SNR (246.8 nm < λ < 388.5 nm in the UV, 387.9 nm < λ < 469.1 in the VIO and 515.6nm < λ < 849.1 nm in the VNIR) [18] were selected for further spectral procession. Because the instruments have different step size, the points recorded by the three systems are not aligned with each other. For example, the small difference in one selected Na(I) peak position of three systems also was demonstrated in Figure 1. The emission line of Na(I) in MarSCoDe spectra was located at ~588.6 nm to 588.8 nm, while at 589.1 nm in ChemCam spectra and 589.7 nm in SDU-LIBS. The differences were eliminated by our approach and are described in the next section.

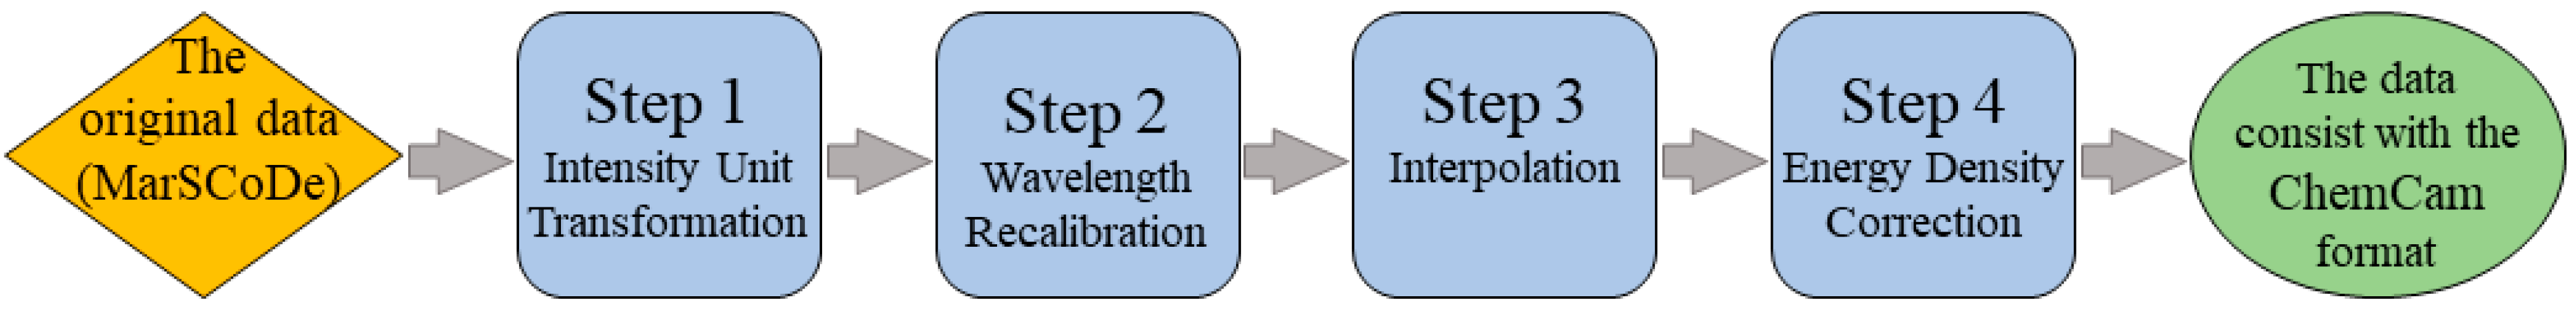
2.2. Spectral Transformation Approach

MarSCoDe shots the laser on the Martian regolith/rock in two directions and collected one set of LIBS spectra at every direction of every sampling site during Zhurong rover exploration respectively. At the same time, some important information such as the rover location, detector temperature were also recorded. All the wavelengths of LIBS data were calibrated by PSO method [32] during every LIBS data collection. However, wavelength drift [1] was still observed which should be corrected to get more stable LIBS data.
At present, an accessible way is worth trying to build a quantitative analysis model by using ChemCam data as calibration dataset instead of MarSCoDe calibration dataset which has not been built until now. All spectra must be consistent in one format which is the highest priority to perform before next analysis. To this end, our proposed spectral transformation approach, made up of 4 step (Figure 2), was carried out to accomplish this transformation as described briefly below.
(1)
Step 1 Intensity Unit Transformation
The physical unit of ChemCam LIBS spectra (photons per second [10]) and MarSCoDe LIBS spectra (Watt [1]) original intensity were different which must be unified first. Based on Equation (1), their intensity unit can be consistent with each other.
RIAfterTrans i = RIMarSCoDe i × λi / hc
RIAfterTrans i and RIMarSCoDe i are the intensity before and after transformation of the pixel i, h is the Planck constant, c is the lightspeed, and λi is the wavelength of the RIMarSCoDe i.
(2)
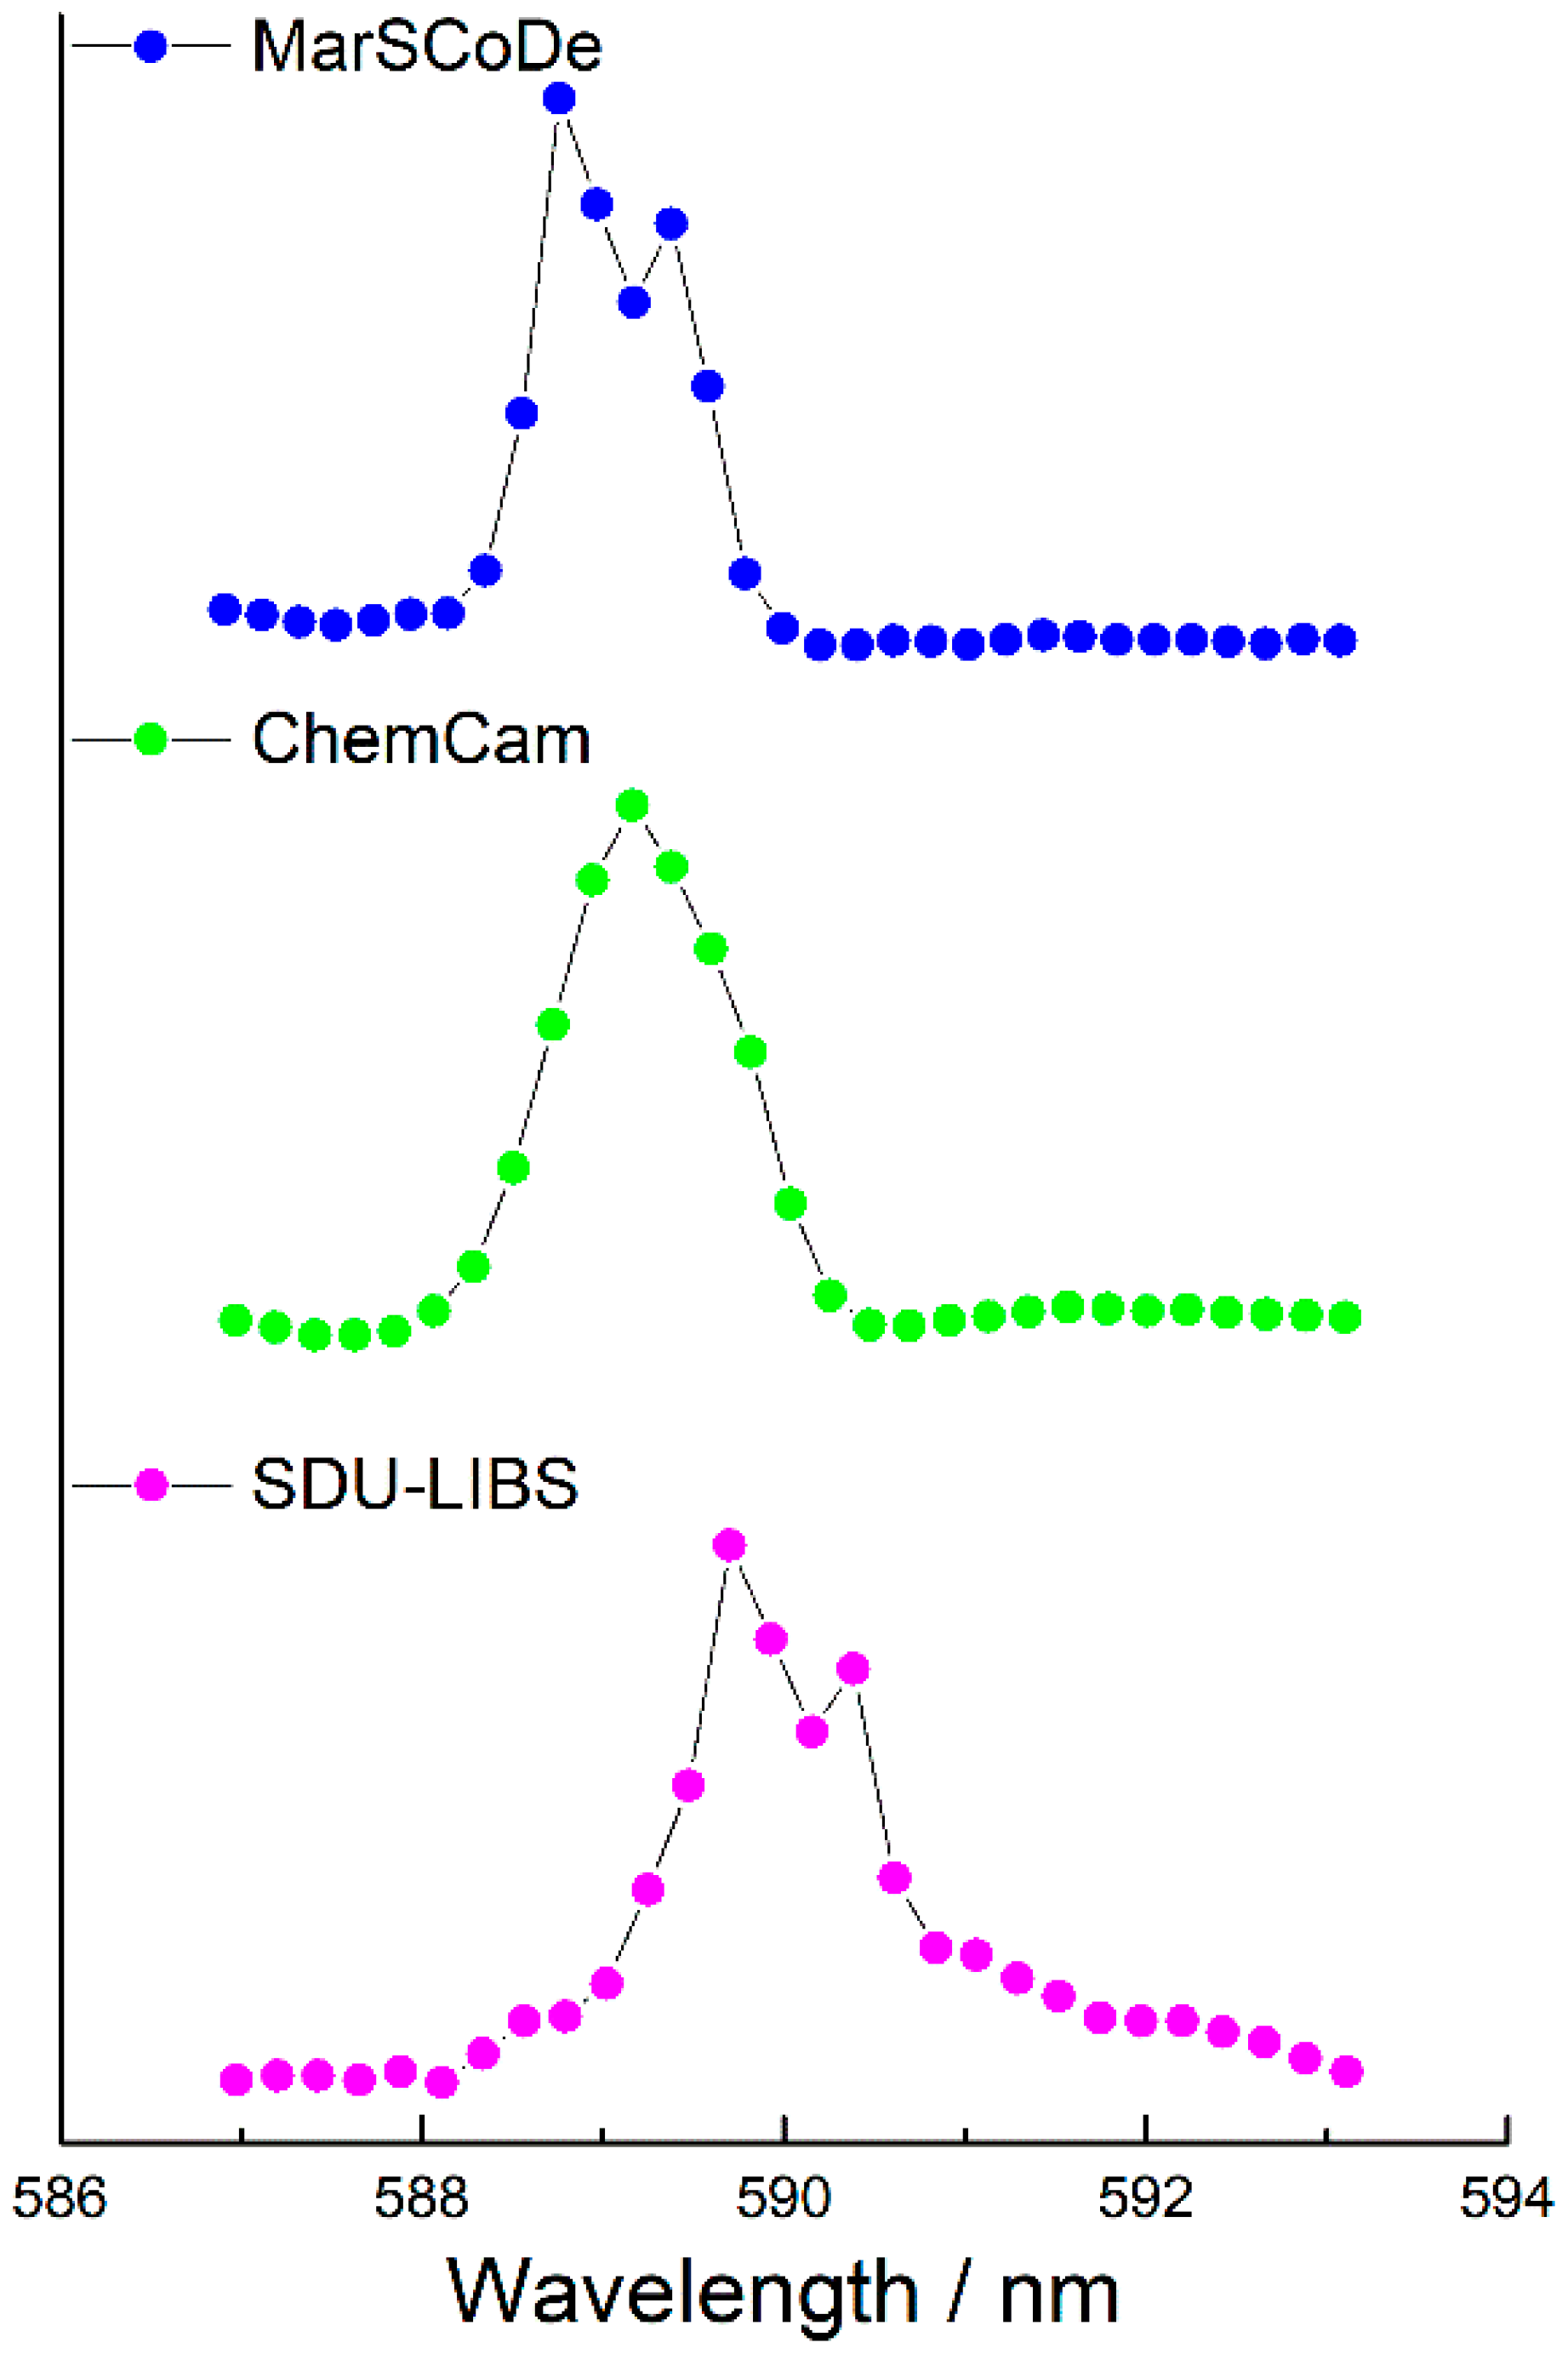
Step 2 Wavelength Recalibration
The wavelength recalibration aimed to calibrate/unify the peak position of MarSCoDe to ChemCam spectra. Some obvious peaks of major elements without the self-absorption (listed in Table 2) were selected to perform the wavelength recalibration. The wavelength recalibration functions of every spectrometer were fitted by using the wavelength position of ChemCam spectra and the pixel positions of the selected peaks in each MarSCoDe spectra, and then applied to each MarSCoDe spectra to accomplish the wavelength recalibration.
(3)
Step 3 Interpolation
After the intensity and wavelength of MarSCoDe were unified, the difference in spectral step size remained unsolved. As shown in Figure 3a, the wavelength of ChemCam spectra (the red verticals along the X axis) were added to the MarSCoDe spectra (the black verticals along the X axis), and then the peak intensity of ChemCam spectral wavelength (the red points) were linearly interpolated based on MarSCoDe peak profile. Then the wavelength and associated intensity which were not present in ChemCam spectra (the black verticals and the black points) were removed from the MarSCoDe spectra after interpolation. Then a new dataset retained most information of raw MarSCoDe spectra in the same data format as ChemCam spectra was obtained. The peak shapes have also been retained. However, as shown in Figure 3b, the peak top might be lost in some situation, named “peak top loss”, because the wavelength at peak top of two kinds of LIBS data occasionally mismatch, which was only observed in the narrower peaks after interpolation.
(4)
Step 4 Energy Density Correction
Laser focusing energy density on the surface of target is one of the main influencing factors for the variation of intensity and SNR of LIBS emission lines [39]. The energy density will change with various distances from target during MarSCoDe shooting. The laser energy of MarSCoDe and ChemCam is also different. Therefore, the energy density correction is necessary. Norite, the same LIBS flight calibration samples of MarSCoDe and ChemCam, is the best candidate for energy density correction between two instruments. To achieve the goal, the ratios of MarSCoDe (3 spectra, after above 3 steps processing) and ChemCam (41 spectra) in situ spectra of norite are calculated. Then, the average of these spectral ratios (a total of 123), a single vector containing pixel-by-pixel correction factors, was applied to the MarSCoDe data for energy correction [19].
After all the above four steps, the MarSCoDe spectra were transformed into ChemCam data format. Now, the most important question is how to evaluate the effectiveness of our method. MarSCoDe LIBS data recorded on Mars do not have the element abundance values to assess our approach which also need to be quantitatively analyzed. Under this situation, the SDU-LIBS spectra that have the definite main element abundance values were used to test the effectiveness of our proposed approach which were transformed into ChemCam data format using the same 4-step approach as the MarSCoDe.

2.3. Partial Least Squares (PLS) Regression Model

After the above transformation, the LIBS spectra of MarSCoDe can quantitatively analyze the major elements abundance (SiO2, TiO2, Al2O3, FeOT, MgO, CaO, Na2O, K2O) by ChemCam analysis model. All spectra of ChemCam calibration set were transformed by z-score normalization [40] before building the model. As shown in Table 3, among those data, 80 spectra were randomly selected from the dataset as test set and the rest were used to train this model. Earth-to-Mars correction has also been applied to ChemCam spectra before PLS modeling and testing because of the slight differences between the LIBS data which were recorded on Mars and in the laboratory (under simulated Mars conditions) due the unexpected impacts (such as variations of environmental or the working status) on Mars during LIBS shooting [18,19]. The RMSE (root mean squared error) was used as the criterion for PCs (PLS latent variable) selection to ensure the accuracy of the model [17,40]. In Section 3, the reliability was tested by comparing the derived values of the SDU-LIBS spectra from the PLS model with actual chemical composition value.

3. Reliability Validation of Spectral Transformation Approach

Before quantitively analyzing MarSCoDe data, the effectiveness of 4 step transformation approach (Figure 2) was tested by SDU-LIBS spectra.
The working spectral bands and their step size of ChemCam, MarSCoDe, and SDU-LIBS system are listed in Table 4. In UV and VIS bands, the step size of SDU-LIBS were similar as MarSCoDe and bigger than ChemCam. All of three instruments have similar step size in VNIR band. Therefore, the 4-step transformation approach can also be applied to the SDU-LIBS spectra. The SDU-LIBS spectra were treated as test set to verify the effectiveness of the transformation approach. As described above, more peak top loss will be observed in some narrow peaks after interpolation performance. Moreover, the degree of information loss before and after interpolation performance of MarSCoDe will be tested and discussed. The selected peaks listed in Table 2 rather than full spectrum were used to comparatively analyze the degree of information loss. Then, the PLS model described in Section 2.3 was used to derive the abundance of major elements of transformed SDU-LIBS data and compared with their actual values.

3.1. Effect of Spectral Transformation Approach

As an example, the original spectrum of sample NO.1 in Table 1 before transformation and the spectrum after transformation is shown in Figure 4 to demonstrate the effect of our proposed spectral transformation approach.
The peaks listed in Table 2 were used to recalibrate the wavelength of SDU-LIBS spectra. The result is shown in Table 5. As shown in Figure 4 and Table 5, most of the peaks have calibrated to the desired position.
The differences in intensity of LIBS data before and after the 4-step transformation were compared in Figure 4, which are derived from the step of interpolation because the peak shape and the spectral information will be lost (as mentioned in step 3) by interpolation. In this case, the above differences were assessed by the RMSE of original intensity and the relative intensity of O at 777 nm [41]. The RMSE results are shown in Table 6, the smaller RMSE values indicated the smaller information loss. The RMSE values are about 0.01 for original peak intensity and from 0.04 to 0.08 for relative intensity of O. The latter are a little bigger because of the greater peak top loss. Both RMSE of SDU-LIBS and ChemCam in Table 6 show that original SDU-LIBS spectra are little different in response to ChemCam calibration spectra as mentioned above.
Similar to MarSCoDe, SDU-LIBS data were corrected by using the energy correction parameter matrix which was calculated by randomly choosing one sample from 11 samples (listed in Table 1). As analyzed above, the energy density correction parameter matrix of SDU-LIBS has lower precision than MarSCoDe and ChemCam because of different response of various LIBS system. It will influence the quantitative analysis accuracy.
After Earth-to-Mars correction, SDU-LIBS data were used to PLS model for quantitative analysis.

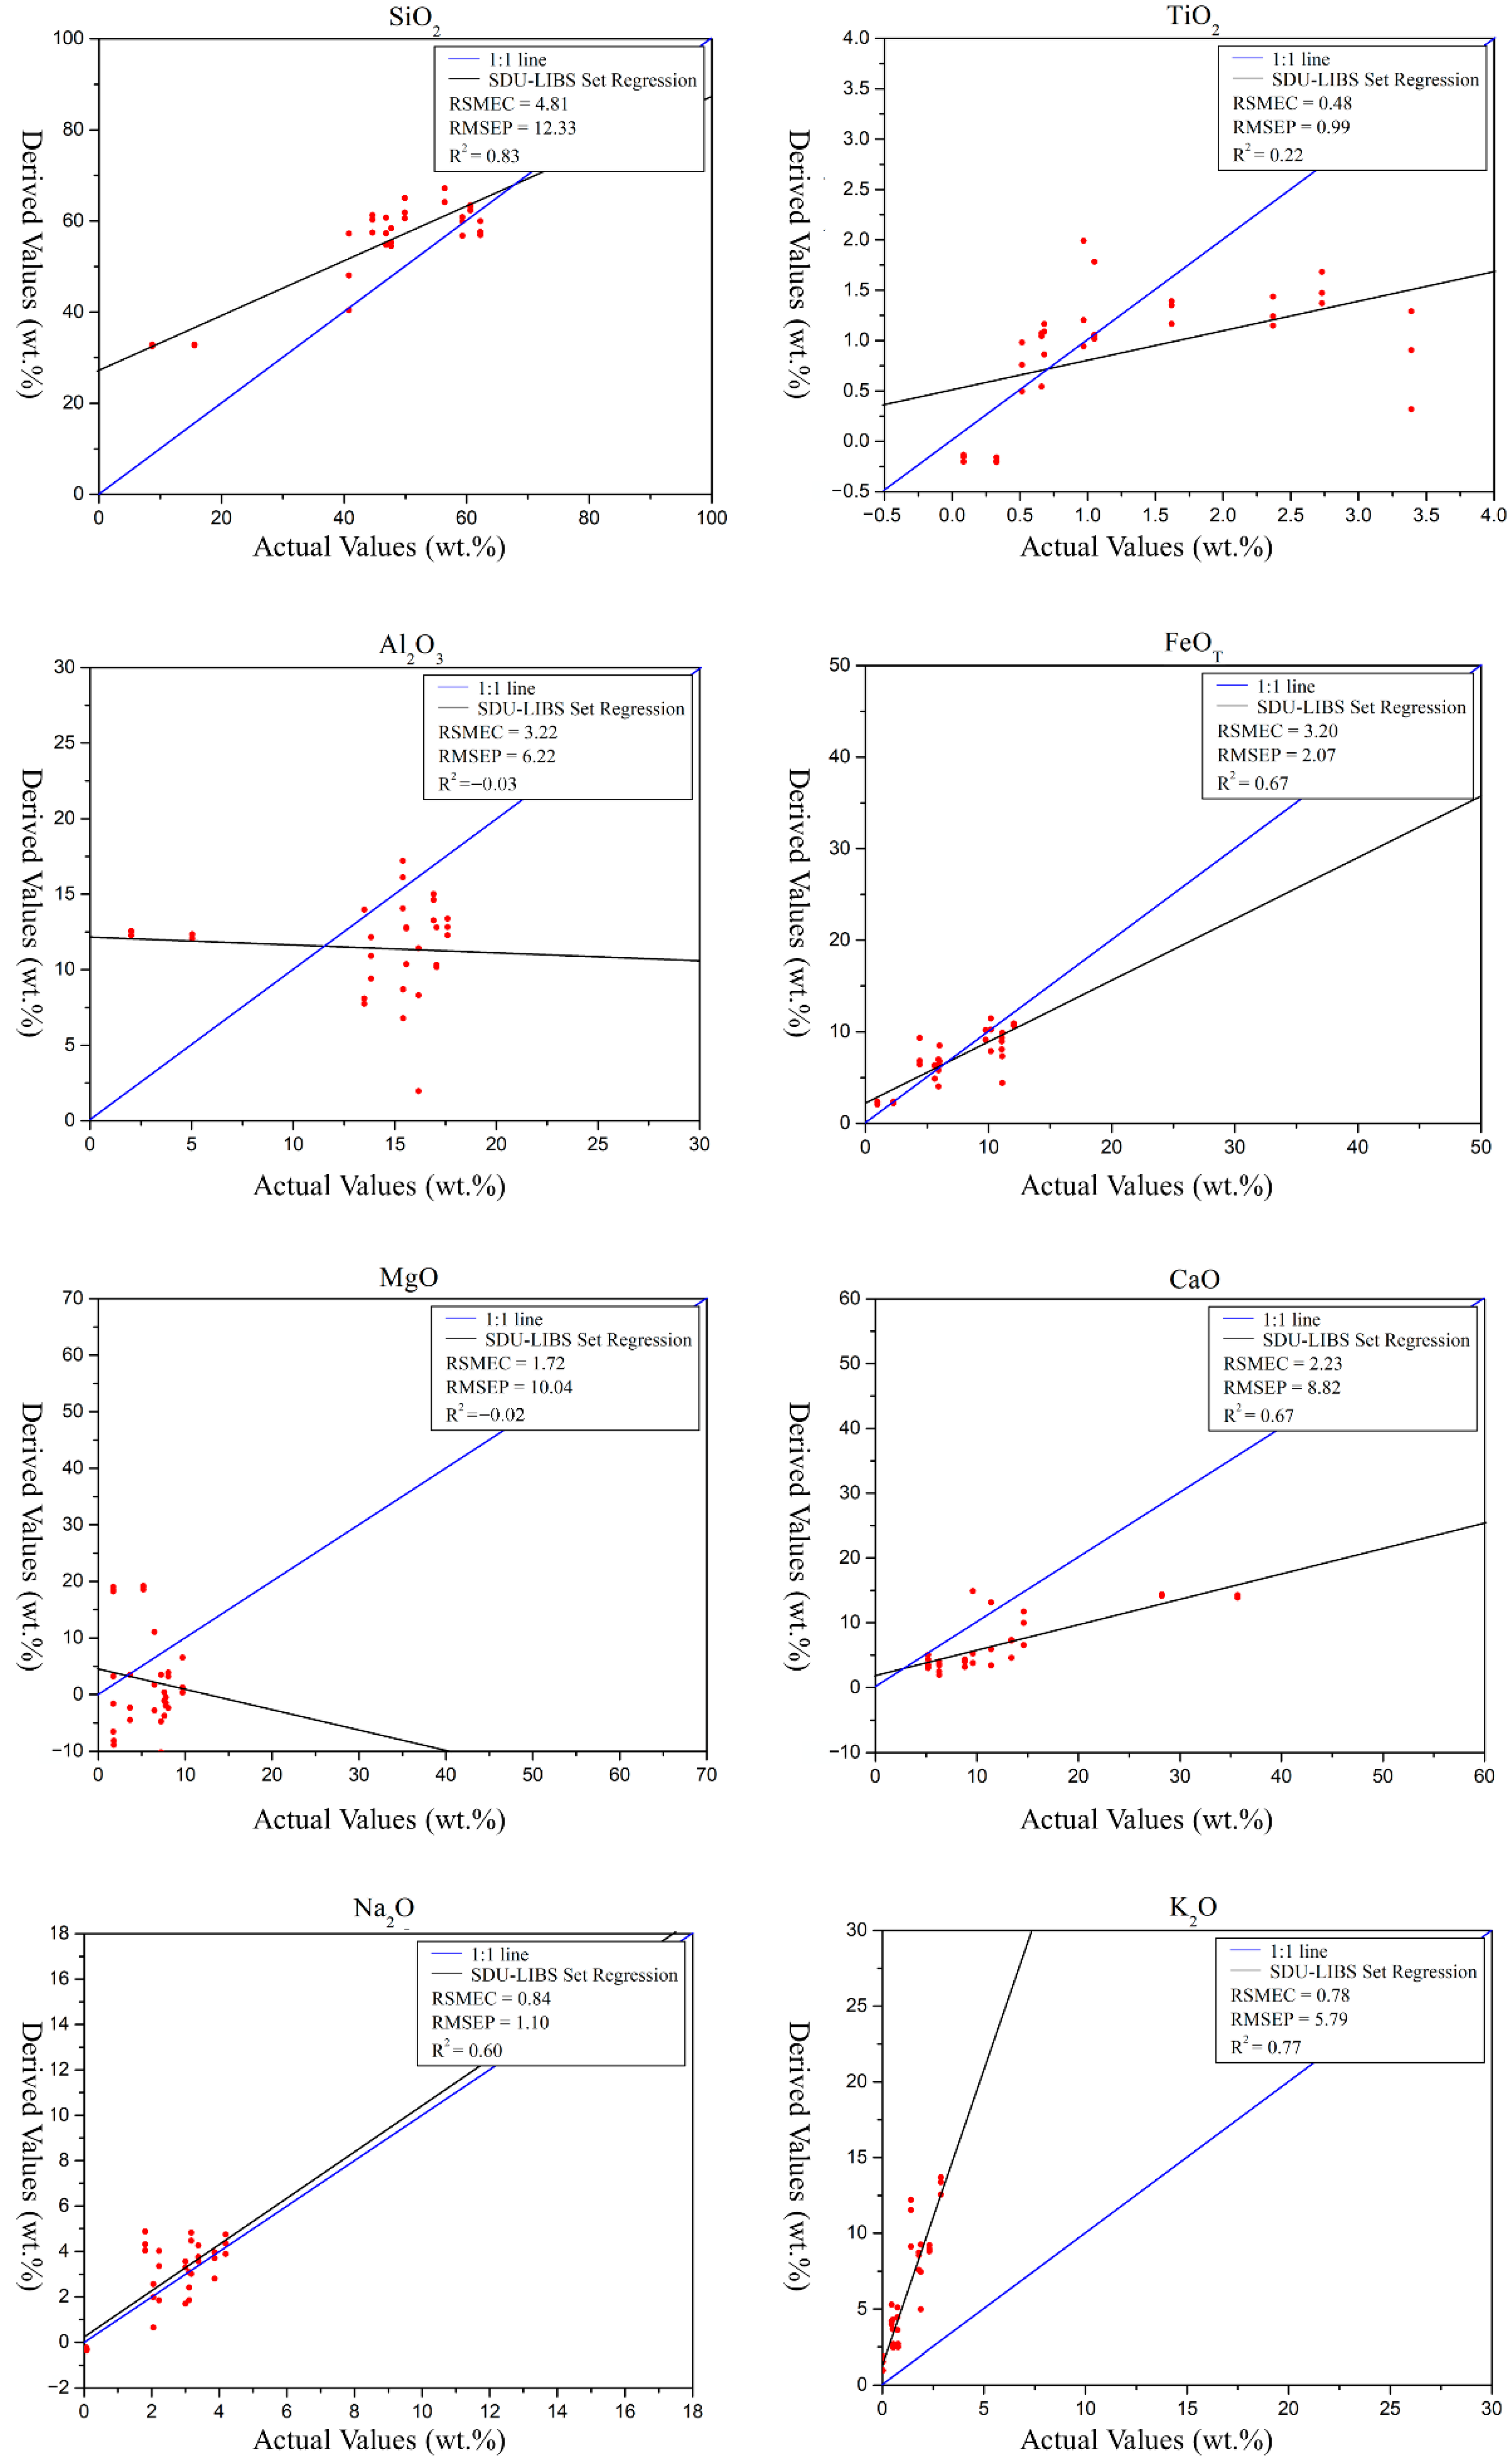
3.2. Effect of PLS Model Prediction

Figure 5 shows the derived values from PLS of the test set against their actual values. The R2 value, RMSEC (root mean square error of calibration) and RMSEP (root mean square error of prediction) were used to assess the derived values accuracy of train set and test set, respectively. The R2 values of the PLS model of training set are 0.78 (SiO2), 0.56 (TiO2), 0.75 (Al2O3), 0.54 (FeOT), 0.95 (MgO), 0.84 (CaO), 0.85 (Na2O), and 0.84 (K2O), respectively. All R2 values of training set except TiO2 (0.56) and FeOT (0.54) are greater than 0.75. Because of that the actual values of TiO2 in training set are mostly distributed in the smaller and narrower range of 0–1.5 wt.%, the calculated R2 and RMSE values will be much lower as long as the derived values of TiO2 are deviated from the actual values. This is the main reason for the lower R2 of TiO2. Similarly, the actual values of FeOT in ChemCam standard database are also mostly distributed in the smaller and narrower range of 0–10 wt.%, which causes an overfitted model and a lower R2 of FeOT. In addition, the RMSEC and RMSEP of these models in Figure 5 are similar, and mostly points are tightly distributed around the 1:1 line. Therefore, the PLS model built in this study is available.
For SDU-LIBS spectra after 4-step transformation, their derived values of PLS model are shown in Figure 6. As analyzed above, the elements abundance derived values are influenced by the low precision energy density correction parameter matrix (detailed in Section 3.1), especially the elements whose emission lines local at narrow range such as SiO2 (RMSEP 12.33), MgO (RMSEP 10.44), and Al2O3 (RMSEP 6.22), the R2 of the latter two elements is even negative. The reason is that the less and narrow located emission lines reduced the energy density correction effect. As shown in Equation (1), the intensity of emission line in near infrared band will be enlarged after the intensity unit transformation. The emission lines of K in spectra of SDU-LIBS are mainly located in VNIR band, respectively, whose peak intensity had inevitably been influenced by intensity unit transformation. Therefore, the derived values of K2O are higher than actual values. The emission lines of Ti, Fe, Ca, Na are distributed in a wider range which has little influence on the information loss due to interpolation and the energy density correction. The RMSEP of SiO2, TiO2, CaO, Na2O, K2O are within the acceptable range and the R2 values of those are stable in Figure 5 and Figure 6. So the derived values of SiO2, TiO2, CaO, Na2O, K2O are reasonable.
The derived values from PLS model for SDU-LIBS spectra after 4-step spectral transformation approach is acceptable, which implied that most information is retained after the transformation. The quantitative analysis results of MarSCoDe data should be much better than SDU-LIBS model because of the better energy density parameter and more information retention.

4. Analysis and Discussion of MarSCoDe LIBS Data

4.1. Application of Our Approach to MarSCoDe LIBS Data

After the effect of this 4-step approach was tested by SDU-LIBS data, this approach was applied to the MarSCoDe spectra. Similarly, RMSE was used to contrastively analyze the MarSCoDe spectra data after and before interpolation (shown in Table 7). Expect for a few outliers, the RMSE of intensity and relative intensity is stable in the range of 0.01 to 1.5 which is reasonable for MarSCoDe data.
For energy density correction of MarSCoDe data, one on-board calibration target of Zhurong rover, norite, was used to get correction parameter. The norite spectra recorded by MarSCoDe and ChemCam are much similar, so the energy density correction parameter is more effective. The spectral transformation effect of MarSCoDe spectra is better than that of SDU-LIBS spectra.

4.2. Discussion

Table 8 shows the derived value average of norite against its actual value, which is reasonable within the error except a lower FeOT and a higher K2O abundant. This can be explained that the emission lines of Fe and K in the in situ spectra of MarSCoDe are mainly located in UV band and VNIR band, respectively, and their peak intensity had been more influenced by intensity unit transformation. The CaO-derived value average of the gypsum and olivine on-board calibration target are higher than other on-board calibration targets. The situation corresponds to the actual situation. Table 9 is the elemental abundance-derived values (average derived values of 26 in situ spectra) at Tianwen-1 landing site acquired by MarSCoDe and GRS (Gamma Ray Spectrometer) on board the 2001 Mars Odyssey Mission [42]. The SiO2-derived values of MarSCoDe are consistent with GRS and the difference of derived values FeOT and K2O due to the change of influence of intensity unit transformation. Another explanation is that GRS probes the average of a wide range of regions and MarSCoDe detects the value of a point in situ, thus the existence of difference is inevitable. The elemental abundance derived values of MarSCoDe spectra using our transformation approach is relatively accurate and reasonable except FeOT.
Figure 7 is the total alkali-silica plot of the MarSCoDe in situ spectra derived values. Because of the higher derived value of K2O, the truly total alkali axis coordinates might be lower ~1 unit than that shown in Figure 7. Silica derived value lied between Martian soil average and Martian upper crust, and tends to the SiO2 abundance of Martian upper crust. The silica-derived value average is 49.09 which indicated that Tianwen-1 landing is a kind of basic rock which fill in the in situ detection gap from basic rock to intermediate rock, and may account for the transition component from the Mars upper crust to fine-grained components. As mentioned above, the range of alkali derived values from 1 to 4 and in fact the average is about from 2 to 3. It suggests that alkali of Tianwen-1 landing site is similar as other landing sites in Figure 7 and indicates the near alkali level of the northern lowlands. The dataset of MarSCoDe distribute under the grey curve (the alkaline-subalkaline boundary) which implied MarSCoDe targets may be subalkaline composition different from results of Opportunity, Spirit, and Curiosity exploration.

5. Conclusions

A spectral transformation approach was proposed for data cross-calibration between different LIBS systems such as, ChemCam, MarSCoDe, and SDU-LIBS data which include 4-step transformation. Our method enables the spectra of MarSCoDe to be analyzed using the ChemCam PLS model. SDU-LIBS spectra were used to validate the reliability of this approach and training a PLS model based on ChemCam database. The final results of validation show our 4-step approach can retain the original spectral information to a large level and obtain reliable PLS quantitative analysis results.
Based on the results of the quantitative analysis from MarSCoDe data, our result shows that Tianwen-1 landing site was located in a region with basic rock. The alkali of Tianwen-1 landing site is similar to other landing sites. Analysis of Tianwen-1 landing site from MarSCoDe LIBS spectra will deepen our understanding of Martian geology. Further analysis in the future is required for obtaining more detailed information.
The effect of this 4-step approach can be optimized by compensating the emission lines of specific elements and adjusting the correction parameter matrix in the future. The derived values will be more robust with more accurate PLS model. The approach can transform LIBS spectra of different formats to similar ones. This approach can combine specified format LIBS spectra such as MarSCoDe spectra with other LIBS database to analyze and find out more information in the future.

Author Contributions

Conceptualization, Z.W.; methodology, G.J.; software, G.J., W.L., W.C.; validation, Z.W., Z.L. and L.Z.; formal analysis, G.J.; investigation, G.J.; writing—original draft preparation, G.J.; writing—review and editing, Z.W., Z.L., C.L. and L.Z.; visualization, G.J.; supervision, Z.W.; project administration, Z.W. All authors have read and agreed to the published version of the manuscript.

Funding

This research was funded by the National Natural Science Foundation of China (U1931211,42173045) and the Pre-research project on Civil Aerospace Technologies No. D020102 funded by China National Space Administration (CNSA).

Data Availability Statement

Please contact the corresponding author.

Acknowledgments

We thank the Tianwen-1 payload team for mission operations and China National Space Administration for providing the MarSCoDe data that made this study possible.

Conflicts of Interest

The authors declare no conflict of interest.

References

  1. Xu, W.; Liu, X.; Yan, Z.; Li, L.; Zhang, Z.; Kuang, Y.; Jiang, H.; Yu, H.; Yang, F.; Liu, C.; et al. The MarSCoDe Instrument Suite on the Mars Rover of China’s Tianwen-1 Mission. Space Sci. Rev. 2021, 217, 64. [Google Scholar] [CrossRef]
  2. Geng, Y.; Zhou, J.; Li, S.; Fu, Z.; Meng, L.; Liu, J.; Wang, H. A brief introduction of the first Mars exploration mission in China. J. Deep Space Explor. 2018, 5, 399. [Google Scholar] [CrossRef]
  3. Jia, Y.Z.; Fan, Y.; Zou, Y.L. Scientific objectives and payloads of Chinese first Mars exploration. Chin. J. Space Sci. 2018, 38, 650. [Google Scholar] [CrossRef]
  4. Li, C.; Liu, J.; Geng, Y.; Cao, J.; Zhang, T.; Fang, G.; Yang, J.; Shu, R.; Zou, Y.; Lin, Y.; et al. Scientific objectives and payload configuration of China’s first Mars exploration mission. J. Deep Space Explor. 2018, 5, 406. [Google Scholar] [CrossRef]
  5. Zhao, J.; Xiao, Z.; Huang, J.; Head, J.W.; Wang, J.; Shi, Y.; Wu, B.; Wang, L. Geological Characteristics and Targets of High Scientific Interest in the Zhurong Landing Region on Mars. Geophys. Res. Lett. 2021, 48, e2021GL094903. [Google Scholar] [CrossRef]
  6. Vanov, M.A.; Hiesinger, H.; Erkeling, G.; Reiss, D. Mud volcanism and morphology of impact craters in Utopia Planitia on Mars: Evidence for the ancient ocean. Icarus 2014, 228, 121–140. [Google Scholar] [CrossRef]
  7. Mills, M.M.; McEwen, A.S.; Okubo, C.H. A Preliminary Regional Geomorphologic Map in Utopia Planitia of the Tianwen-1 Zhurong Landing Region. Geophys. Res. Lett. 2021, 48, e2021GL094629. [Google Scholar] [CrossRef]
  8. Wu, X.; Liu, Y.; Zhang, C.; Wu, Y.; Zhang, F.; Du, J.; Liu, Z.; Xing, Y.; Xu, R.; He, Z.; et al. Geological characteristics of China’s Tianwen-1 landing site at Utopia Planitia, Mars. Icarus 2021, 370, 114657. [Google Scholar] [CrossRef]
  9. Ye, P.; Sun, Z.; Rao, W.; Meng, L. Mission overview and key technologies of the first Mars probe of China. Sci. China Technol. Sci. 2017, 60, 649–657. [Google Scholar] [CrossRef]
  10. Wiens, R.C.; Maurice, S.; Barraclough, B.; Saccoccio, M.; Barkley, W.C.; Bell, J.F.; Bender, S.; Bernardin, J.; Blaney, D.; Blank, J.; et al. The ChemCam Instrument Suite on the Mars Science Laboratory (MSL) Rover: Body Unit and Combined System Tests. Space Sci. Rev. 2012, 170, 167–227. [Google Scholar] [CrossRef]
  11. Liu, C.; Ling, Z.; Zhang, J.; Wu, Z.; Bai, H.; Liu, Y. A Stand-Off Laser-Induced Breakdown Spectroscopy (LIBS) System Applicable for Martian Rocks Studies. Remote Sens. 2021, 13, 4773. [Google Scholar] [CrossRef]
  12. Wiens, R.C.; Wan, X.; Lasue, J.; Maurice, S. Chapter 20—Laser-induced breakdown spectroscopy in planetary science. In Laser-Induced Breakdown Spectroscopy, 2nd ed.; Singh, J.P., Thakur, S.N., Eds.; Elsevier: Amsterdam, The Netherlands, 2020; pp. 441–471. [Google Scholar]
  13. Maurice, S.; Wiens, R.C.; Saccoccio, M.; Barraclough, B.; Gasnault, O.; Forni, O.; Mangold, N.; Baratoux, D.; Bender, S.; Berger, G.; et al. The ChemCam Instrument Suite on the Mars Science Laboratory (MSL) Rover: Science Objectives and Mast Unit Description. Space Sci. Rev. 2012, 170, 95–166. [Google Scholar] [CrossRef]
  14. Nelson, T.; Gasnault, O.; Reess, J.M.; Deleuze, M.; Rull, F.; Manrique, J.-A.; Abbaki, S.; Anderson, R.B.; André, Y.; Angel, S.M.; et al. The SuperCam Instrument Suite on the Mars 2020 Rover: Science Objectives and Mast-Unit Description. Space Sci. Rev. 2021, 217, 47. [Google Scholar] [CrossRef]
  15. Wiens, R.C.; Maurice, S.; Robinson, S.H.; Nelson, A.E.; Cais, P.; Bernardi, P.; Newell, R.T.; Clegg, S.; Sharma, S.K.; Storms, S.; et al. The SuperCam Instrument Suite on the NASA Mars 2020 Rover: Body Unit and Combined System Tests. Space Sci. Rev. 2020, 217, 4. [Google Scholar] [CrossRef]
  16. Xu, W.; Sun, C.; Tan, Y.; Gao, L.; Zhang, Y.; Yue, Z.; Shabbir, S.; Wu, M.; Zou, L.; Chen, F.; et al. Total alkali silica classification of rocks with LIBS: Influences of the chemical and physical matrix effects. J. Anal. At. Spectrom. 2020, 35, 1641–1653. [Google Scholar] [CrossRef]
  17. Anderson, R.B.; Clegg, S.M.; Frydenvang, J.; Wiens, R.C.; McLennan, S.; Morris, R.V.; Ehlmann, B.; Dyar, M.D. Improved accuracy in quantitative laser-induced breakdown spectroscopy using sub-models. Spectrochim. Acta Part B At. Spectrosc. 2017, 129, 49–57. [Google Scholar] [CrossRef]
  18. Wiens, R.C.; Maurice, S.; Lasue, J.; Forni, O.; Anderson, R.B.; Clegg, S.; Bender, S.; Blaney, D.; Barraclough, B.L.; Cousin, A.; et al. Pre-flight calibration and initial data processing for the ChemCam laser-induced breakdown spectroscopy instrument on the Mars Science Laboratory rover. Spectrochim. Acta Part B At. Spectrosc. 2013, 82, 1–27. [Google Scholar] [CrossRef]
  19. Clegg, S.M.; Wiens, R.C.; Anderson, R.; Forni, O.; Frydenvang, J.; Lasue, J.; Cousin, A.; Payré, V.; Boucher, T.; Dyar, M.D.; et al. Recalibration of the Mars Science Laboratory ChemCam instrument with an expanded geochemical database. Spectrochim. Acta Part B At. Spectrosc. 2017, 129, 64–85. [Google Scholar] [CrossRef]
  20. Clark Iii, B.C.; Arvidson, R.E.; Gellert, R.; Morris, R.V.; Ming, D.W.; Richter, L.; Ruff, S.W.; Michalski, J.R.; Farrand, W.H.; Yen, A.; et al. Evidence for montmorillonite or its compositional equivalent in Columbia Hills, Mars. J. Geophys. Res. Planets 2007, 112, E06S01. [Google Scholar] [CrossRef]
  21. Rapin, W.; Meslin, P.Y.; Maurice, S.; Vaniman, D.; Nachon, M.; Mangold, N.; Schröder, S.; Gasnault, O.; Forni, O.; Wiens, R.C.; et al. Hydration state of calcium sulfates in Gale crater, Mars: Identification of bassanite veins. Earth Planet. Sci. Lett. 2016, 452, 197–205. [Google Scholar] [CrossRef]
  22. Payré, V.; Fabre, C.; Cousin, A.; Sautter, V.; Wiens, R.C.; Forni, O.; Gasnault, O.; Mangold, N.; Meslin, P.Y.; Lasue, J.; et al. Alkali trace elements in Gale crater, Mars, with ChemCam: Calibration update and geological implications. J. Geophys. Res. Planets 2017, 122, 650–679. [Google Scholar] [CrossRef]
  23. Mangold, N.; Dehouck, E.; Fedo, C.; Forni, O.; Achilles, C.; Bristow, T.; Downs, R.T.; Frydenvang, J.; Gasnault, O.; L’Haridon, J.; et al. Chemical alteration of fine-grained sedimentary rocks at Gale crater. Icarus 2019, 321, 619–631. [Google Scholar] [CrossRef]
  24. Bedford, C.C.; Bridges, J.C.; Schwenzer, S.P.; Wiens, R.C.; Rampe, E.B.; Frydenvang, J.; Gasda, P.J. Alteration trends and geochemical source region characteristics preserved in the fluviolacustrine sedimentary record of Gale crater, Mars. Geochim. Cosmochim. Acta 2019, 246, 234–266. [Google Scholar] [CrossRef]
  25. Ollila, A.M.; Newsom, H.E.; Clark Iii, B.; Wiens, R.C.; Cousin, A.; Blank, J.G.; Mangold, N.; Sautter, V.; Maurice, S.; Clegg, S.M.; et al. Trace element geochemistry (Li, Ba, Sr, and Rb) using Curiosity’s ChemCam: Early results for Gale crater from Bradbury Landing Site to Rocknest. J. Geophys. Res. Planets 2014, 119, 255–285. [Google Scholar] [CrossRef]
  26. Mangold, N.; Forni, O.; Dromart, G.; Stack, K.; Wiens, R.C.; Gasnault, O.; Sumner, D.Y.; Nachon, M.; Meslin, P.Y.; Anderson, R.B.; et al. Chemical variations in Yellowknife Bay formation sedimentary rocks analyzed by ChemCam on board the Curiosity rover on Mars. J. Geophys. Res. Planets 2015, 120, 452–482. [Google Scholar] [CrossRef]
  27. Frydenvang, J.; Mangold, N.; Wiens, R.C.; Fraeman, A.A.; Edgar, L.A.; Fedo, C.M.; L’Haridon, J.; Bedford, C.C.; Gupta, S.; Grotzinger, J.P.; et al. The Chemostratigraphy of the Murray Formation and Role of Diagenesis at Vera Rubin Ridge in Gale Crater, Mars, as Observed by the ChemCam Instrument. J. Geophys. Res. Planets 2020, 125, e2019JE006320. [Google Scholar] [CrossRef]
  28. McLennan, S.M.; Anderson, R.B.; Bell, J.F.; Bridges, J.C.; Calef, F.; Campbell, J.L.; Clark, B.C.; Clegg, S.; Conrad, P.; Cousin, A.; et al. Elemental Geochemistry of Sedimentary Rocks at Yellowknife Bay, Gale Crater, Mars. Science 2014, 343, 1244734. [Google Scholar] [CrossRef]
  29. Rosipal, R.; Krämer, N. Overview and Recent Advances in Partial Least Squares. In Subspace, Latent Structure and Feature Selection, Proceedings of the International Statistical and Optimization Perspectives Workshop SLSFS 2005, Bohinj, Slovenia, 23–25 February 2005; Springer: Berlin/Heidelberg, Germany, 2006; pp. 34–51. [Google Scholar]
  30. Haaland, D.M.; Thomas, E.V. Partial least-squares methods for spectral analyses. 1. Relation to other quantitative calibration methods and the extraction of qualitative information. Anal. Chem. 1988, 60, 1193–1202. [Google Scholar] [CrossRef]
  31. Liu, J.; Li, C.; Zhang, R.; Rao, W.; Cui, X.; Geng, Y.; Jia, Y.; Huang, H.; Ren, X.; Yan, W.; et al. Geomorphic contexts and science focus of the Zhurong landing site on Mars. Nat. Astron. 2022, 6, 65–71. [Google Scholar] [CrossRef]
  32. Wan, X.; Yuan, R.; Wang, H.; Cheng, Y.; Jia, J.; Shu, R.; Xu, W.; Li, C.; Xin, Y.; Ma, H.; et al. Elastic Particle Swarm Optimization for MarSCoDe Spectral Calibration on Tianwen-1 Mars Rover. Anal. Chem. 2021, 93, 7970–7977. [Google Scholar] [CrossRef]
  33. Bin, J.; Li, X.; Fan, W.; Zhou, J.-H.; Wang, C.-W. Calibration transfer of near-infrared spectroscopy by canonical correlation analysis coupled with wavelet transform. Analyst 2017, 142, 2229–2238. [Google Scholar] [CrossRef]
  34. Workman, J.J. A Review of Calibration Transfer Practices and Instrument Differences in Spectroscopy. Appl. Spectrosc. 2017, 72, 340–365. [Google Scholar] [CrossRef] [PubMed]
  35. Chen, Y.-y.; Wang, Z.-b. Cross components calibration transfer of NIR spectroscopy model through PCA and weighted ELM-based TrAdaBoost algorithm. Chemom. Intell. Lab. Syst. 2019, 192, 103824. [Google Scholar] [CrossRef]
  36. Wu, Z.; Ling, Z.; Zhang, J.; Fu, X.; Liu, C.; Xin, Y.; Li, B.; Qiao, L. A Mars Environment Chamber Coupled with Multiple In Situ Spectral Sensors for Mars Exploration. Sensors 2021, 21, 2519. [Google Scholar] [CrossRef] [PubMed]
  37. Liu, C.; Wu, Z.; Fu, X.; Liu, P.; Xin, Y.; Xiao, A.; Bai, H.; Tian, S.; Wan, S.; Liu, Y.; et al. A Martian Analogues Library (MAL) Applicable for Tianwen-1 MarSCoDe-LIBS Data Interpretation. Remote Sens. 2022, 14, 2937. [Google Scholar] [CrossRef]
  38. Kramida, A.; Ralchenko, Y.; Reader, J.; NIST ASD Team. NIST Atomic Spectra Database (Ver. 5.8). 2021. Available online: https://www.nist.gov/pml/atomic-spectra-database (accessed on 1 October 2021).
  39. Wiens, R.C.; Blazon-Brown, A.J.; Melikechi, N.; Frydenvang, J.; Dehouck, E.; Clegg, S.M.; Delapp, D.; Anderson, R.B.; Cousin, A.; Maurice, S. Improving ChemCam LIBS long-distance elemental compositions using empirical abundance trends. Spectrochim. Acta Part B At. Spectrosc. 2021, 182, 106247. [Google Scholar] [CrossRef]
  40. Zhang, L.; Wu, Z.; Ling, Z. Particle Swarm Optimization (PSO) for improving the accuracy of ChemCam LIBS sub-model quantitative method. Earth Sci. Inform. 2020, 13, 1485–1497. [Google Scholar] [CrossRef]
  41. Schröder, S.; Rammelkamp, K.; Vogt, D.S.; Gasnault, O.; Hübers, H.W. Contribution of a martian atmosphere to laser-induced breakdown spectroscopy (LIBS) data and testing its emission characteristics for normalization applications. Icarus 2019, 325, 1–15. [Google Scholar] [CrossRef]
  42. Boynton, W.V.; Taylor, G.J.; Evans, L.G.; Reedy, R.C.; Starr, R.; Janes, D.M.; Kerry, K.E.; Drake, D.M.; Kim, K.J.; Williams, R.M.S.; et al. Concentration of H, Si, Cl, K, Fe, and Th in the low- and mid-latitude regions of Mars. J. Geophys. Res. Planets 2007, 112, E12S99. [Google Scholar] [CrossRef]
  43. Sautter, V.; Toplis, M.J.; Wiens, R.C.; Cousin, A.; Fabre, C.; Gasnault, O.; Maurice, S.; Forni, O.; Lasue, J.; Ollila, A.; et al. In situ evidence for continental crust on early Mars. Nat. Geosci. 2015, 8, 605–609. [Google Scholar] [CrossRef]
  44. Irvine, T.N.; Baragar, W.R.A. A Guide to the Chemical Classification of the Common Volcanic Rocks. Can. J. Earth Sci. 1971, 8, 523–548. [Google Scholar] [CrossRef]
  45. Taylor, S.R.; McLennan, S. Planetary Crusts: Their Composition, Origin and Evolution; Cambridge University Press: Cambridge, UK, 2008. [Google Scholar]
Figure 1. Comparison of the peak position in partial band (586–594 nm) of spectra from three LIBS systems (MarSCoDe, ChemCam, and SDU-LIBS).
Remotesensing 14 03960 g001
Figure 2. The flow chart of 4 step spectral transformation.
Remotesensing 14 03960 g002
Figure 3. The interpolation performance to unify spectral step size of ChemCam and MarSCoDe. (a) Ideal situation. (b) Peak top loss. The black verticals and points are MarSCoDe data; the red verticals and points are ChemCam data after interpolate.
Remotesensing 14 03960 g003
Figure 4. Data comparison of one SDU-LIBS data (sample NO.1) before and after 4-step approach (a) and the spectral feature of selected ten peaks (b).
Remotesensing 14 03960 g004
Figure 5. The plots of the derived values from PLS of the test set against their actual values. The accurate derived value is closer to blue line.
Remotesensing 14 03960 g005
Figure 6. The plots of the SDU-LIBS spectra derived values from PLS against their actual values. The accurate derived value is closer to blue line.
Remotesensing 14 03960 g006
Figure 7. Total alkali-silica plot of the results of the quantitative analysis from MarSCoDe in situ spectra (modified from [43]). The grey curve indicates the alkaline-subalkaline boundary [44]. The Martian soil average from [45]. The hexagon represents the Mars upper crust composition and composition averages of landing sites. Data from landers/rovers are used only as a reference to the composition of Martian regolith/rock from small-scale detection of the landing site.
Remotesensing 14 03960 g007
Table 1. The ChemCam standard samples used to verify the SDU-LIBS data [19].
No.Sample
Name
Reference
ID
Rock
Type
Abundance of Major Elements (wt.%)
SiO2TiO2Al2O3FeOTMgOCaONa2OK2O
01AndesiteAGV2Igneous44.642.3713.8312.067.778.813.382.32
02BasaltBHVO2Igneous60.620.5216.174.411.725.203.861.89
03BasaltBIR1Igneous46.851.6217.069.768.059.603.000.46
04AndesiteGBW07104Igneous56.420.6615.415.637.606.293.111.80
05BasaltGBW07105Igneous62.260.6815.575.933.656.283.171.41
06LimestoneGBW07108Sedimentary40.793.3917.6011.126.4614.622.050.75
07GypsumGYPDSedimentary49.902.7313.5011.077.2311.402.220.52
08AndesiteJA2Igneous47.700.9715.4010.199.7013.401.810.03
09AndesiteJA3Igneous59.301.0516.916.021.795.204.192.88
10Basalt (Olivine)MO14Igneous8.700.082.030.971.7328.200.070.54
11Sediments/shale
(kerogen, carbonate)
SGR1Sedimentary15.600.335.032.275.1935.670.080.78
FeOT refers to total iron, including both ferric and ferrous state [19].
Table 2. The selected peaks in MarSCoDe for wavelength recalibration.
ElementIonization DegreeWavelength (nm)
FeII275.013
AlII280.200
SiI288.242
AlI394.512
CaII396.959
KII422.686
NaI589.158
KI766.701
KI770.108
OI777.631
The spectral assignment based on NIST Atomic Spectra Database [38].
Table 3. Detailed information of PLS model built by ChemCam calibration data.
ElementLatent
Variables
Train Set
Samples
Train Set
Spectra
Test Set
Samples
Test Set
Spectra
SiO2530314592780
TiO2329514392380
Al2O3530314592780
FeOT430114442880
MgO1130314592780
CaO529814592280
Na2O430014442780
K2O729814392680
Table 4. The step size of 3 LIBS systems in various working spectral bands.
InstrumentStep Size (nm)
ChemCam~0.0488@ 240–335 nm
~0.0425@ 385–465 nm
~0.2112@ 510–800 nm
MarSCoDe~0.0667@ 240–340 nm
~0.1324@ 340–540 nm
~0.2033@ 540–850 nm
SDU-LIBS~0.0494@ 230–339 nm
~0.1040@ 330–549 nm
~0.2141@ 539–1000 nm
Table 5. The SDU-LIBS spectra wavelength recalibration results V.S. the ChemCam spectra calibration wavelength.
ChannelPeak Wavelength
(nm)
SDU-LIBS Wavelength before
Recalibration (nm)
SDU-LIBS Wavelength after
Recalibration (nm)
ChemCam Calibration
Wavelength (nm)
UV275.013 (Fe II)274.8712275.0100275.0100
280.200 (Al II)280.2208280.3450280.3450
288.242 (Si I)288.0923288.2490288.2000
VIS394.512 (Al I)394.3501394.4910394.4910
396.959 (Ca II)396.7482396.9580396.9580
422.686 (K II)422.5475422.8070422.8070
VNIR589.158 (Na I)588.7606589.1616589.1616
766.701 (K I)766.1542766.6873766.6567
770.108 (K I)769.5841770.1238770.1676
777.631 (O I)777.0451777.5995777.5863
Table 6. The RMSE comparison of before and after interpolation (column A is intensity RMSE between after and before interpolation; column B is relative intensity RMSE between after and before interpolation; column C is intensity RMSE between SDU-LIBS before interpolation and ChemCam; column D is relative intensity RMSE between SDU-LIBS before interpolation and ChemCam).
No.ABCD
010.01590.08670.86411.7147
020.01370.06501.26291.8941
030.00710.06830.91731.9199
040.01480.08210.57501.5815
050.01600.05370.40821.1852
060.01210.07190.75851.3531
070.01100.07371.11011.3807
080.00540.07060.76331.3905
090.01890.05080.71031.2233
100.00820.05350.40711.0961
110.00950.04060.39191.1575
RMSE
Average
0.01210.06520.74261.4451
Table 7. The RMSE of MarSCoDe before and after interpolation. (a) The RMSE of in situ Martian spectra. (b) The RMSE of on-board calibration target spectra (column A is intensity RMSE between the MarSCoDe spectra of before and after interpolation; column B is relative intensity RMSE between the MarSCoDe spectra of before and after interpolation; column C is intensity RMSE between the MarSCoDe spectra of before and after interpolation; column D is relative intensity RMSE between the MarSCoDe spectra of before and after interpolation).
(a)
No.Spectra No.AB
01010.00770.0203
02020.01390.0228
03030.00480.0304
04040.01640.0980
05050.03590.1726
06080.00870.0132
07090.00470.0313
08100.13410.2221
09110.00320.0030
10120.04980.0182
11130.00520.0289
12140.02410.1304
13150.07650.1637
14160.03450.1146
15170.04720.0150
16190.15750.1953
17200.01300.0272
18210.10950.2040
19220.14530.1355
20230.05440.2241
21240.08600.1266
22260.00220.0296
23290.09270.1599
24300.07260.6494
25311.02051.9738
26320.93403.7820
Average RMSE0.12130.3305
(b)
No.Sample Name and
Spectral No.
CD
01Andesite 010.03760.2439
02Andesite 020.07040.4348
03Apatite 010.00960.0180
04Basalt 010.02890.0242
05Basalt 030.07720.3990
06Dolomite 010.90891.4927
07Dolomite 020.90185.6519
08Gypsum 020.12350.7212
09Gypsum 030.18061.2417
10Gypsum 050.18880.7820
11Hypersthene 010.56445.2427
12Montmorillonite 010.15510.2618
13Montmorillonite 022.18442.1405
14Nontronite 013.99966.0067
15Nontronite 061.27302.3232
16Norite 020.04780.0277
17Norite 040.09142.9192
18Norite 050.37813.6824
19Olivine 010.09430.2231
Average RMSE0.59551.7809
Table 8. The derived average value of norite against the actual values.
SiO2TiO2Al2O3FeOTMgOCaONa2OK2O
Actual Values47.880.7014.6615.709.6212.771.530.06
Norite0247.250.6317.755.377.5111.312.841.33
Norite0450.040.4714.442.5411.8010.842.190.67
Norite0541.330.4024.282.5312.5711.313.712.44
RMSE4.000.225.8312.292.441.631.521.60
The actual compositions of norite were cited from S.M. Clegg et al. [19].
Table 9. The comparison of derived element value at Tianwen-1 landing site acquired by MarSCoDe and GRS.
Database MarSCoDeGRS
Element
SiO249.1 ± 4.342.9
FeOT5.4 ± 1.417.8
K2O1.6 ± 0.50.6
Na2O *1.6 ± 0.60.6
Na2O/K2O *1.01.0
GRS data from [42]. * = average of MarSCoDe results.
Publisher’s Note: MDPI stays neutral with regard to jurisdictional claims in published maps and institutional affiliations.

