Article

Detection of Aircraft Emissions Using Long-Path Differential Optical Absorption Spectroscopy at Hefei Xinqiao International Airport

1
Key Laboratory of Environmental Optics and Technology, Anhui Institute of Optics and Fine Mechanics, HFIPS, Chinese Academy of Sciences, Hefei 230031, China
2
CAS Center for Excellence in Regional Atmospheric Environment, Institute of Urban Environment, Chinese Academy of Sciences, Xiamen 361021, China
3
China Eastern Airlines Co., Ltd., Anhui Branch, Hefei 230088, China
4
Anhui Civil Aviation Airport Group Co., Ltd., Hefei 230088, China
5
School of Environmental Science and Optoelectronic Technology, University of Science and Technology of China, Hefei 230026, China
*
Author to whom correspondence should be addressed.
Remote Sens. 2022, 14(16), 3927; https://doi.org/10.3390/rs14163927
Submission received: 13 June 2022 / Revised: 1 August 2022 / Accepted: 9 August 2022 / Published: 12 August 2022
(This article belongs to the Special Issue Optical and Laser Remote Sensing of Atmospheric Composition)

Abstract

:
Airport emissions have received increased attention because of their impact on atmospheric chemical processes, the microphysical properties of aerosols, and human health. At present, the assessment methods for airport pollution emission mainly involve the use of the aircraft emission database established by the International Civil Aviation Organization, but the emission behavior of an engine installed on an aircraft may differ from that of an engine operated in a testbed. In this study, we describe the development of a long-path differential optical absorption spectroscopy (LP-DOAS) instrument for measuring aircraft emissions at an airport. From 15 October to 23 October 2019, a measurement campaign using the LP-DOAS instrument was conducted at Hefei Xinqiao International Airport to investigate the regional concentrations of various trace gases in the airport’s northern area and the variation characteristics of the gas concentrations during an aircraft’s taxiing and take-off phases. The measured light path of the LP-DOAS passed through the aircraft taxiway and the take-off runway concurrently. The aircraft’s take-off produced the maximum peak in NO2 average concentrations of approximately 25 ppbV and SO2 average concentrations of approximately 8 ppbV in measured area. Owing to the airport’s open space, the pollution concentrations decreased rapidly, the overall levels of NO2 and SO2 concentrations in the airport area were very low, and the maximum hourly average NO2 and SO2 concentrations during the observation period were better than the Class 1 ambient air quality standards in China. Additionally, we discovered that the NO2 and SO2 emissions from the Boeing 737–800 aircraft monitored in this experiment were weakly and positively related to the age of the aircraft. This measurement established the security, feasibility, fast and non-contact of the developed LP-DOAS instrument for monitoring airport regional concentrations as well as NO2 and SO2 aircraft emissions during routine airport operations without interfering with the normal operation of the airport.

1. Introduction

With the rapid growth of the aviation industry, the number of commercial aircraft and aircraft movements, and the amount of passenger throughput at airports are constantly increasing. Around 2500 airports worldwide processed more than 4 billion passengers in 2018, and the growing volume of commercial air traffic has raised concerns about the impact of aircraft emissions on local and regional air quality near airports. Aircraft emit a variety of emissions during take-off, climb out, cruise, approach, and taxi, including nitrogen oxides, carbon oxides, sulfur oxides, hydrocarbons, and particulate matter, all of which can have a detrimental effect on human health and air quality [1]. For example, nitrogen oxides (NOx = NO + NO2) are primarily emitted in urban environments by fossil fuel combustion, biomass combustion, and soil emissions. NO contributes significantly to atmospheric chemistry by rapidly reacting with ambient ozone or radicals to form NO2 on a minute scale, and NO2 is a key molecule in the formation of O3, acid deposition, and secondary particulate pollution, with extensive effects on human health [2,3,4,5]. Sulfur dioxide (SO2) is emitted into the atmosphere by both human and natural sources. It plays a critical role in the aerosol system as a sulfate precursor and has an indirect effect on acid deposition, and exposure to SO2 is associated with an increased risk of mortality and morbidity [6,7]. Although the COVID-19 pandemic has reduced air traffic, air traffic is expected to rebound in the coming years and continue to grow [8]. Therefore, aircraft emissions of NOx, SO2, and other substances will have an effect on atmospheric chemical processes, aerosol microphysical properties, and human health. Airport emissions have received increased attention in recent years.
Numerous studies have focused on the ground-level effects of aircraft emissions because these emissions contribute significantly to air pollution near airports and residential areas [9,10,11,12,13,14,15]. Currently, methods for assessing airport pollution emissions depend primarily on the International Civil Aviation Organization’s aircraft emission database and benchmark emission model [16,17,18,19]. The engine manufacturer provides emission indices (EIs) for carbon monoxide (CO), nitrogen oxides (NO and NO2), unburned hydrocarbons (UHC), and particulate matter (PM) for engines operating at four different thrust levels (idle, approach, cruise, and take-off) in this database. These emission indices are based on well-defined measurement procedures and conditions during aircraft engine certification. Additionally, during the certification process, the International Civil Aviation Organization (ICAO) obtains emission indices from a very limited number of newly manufactured engines. However, the emission behavior of an engine installed on an aircraft may differ from that of an engine operating on a testbed due to the fact that real-world operating conditions vary. Furthermore, deviations from the certificated emission indices may occur as a result of the impact of factors, such as the aircraft’s life expectancy, the engine type (specific modifications, such as different combustion chambers) installed on the aircraft, and meteorological conditions (temperature, humidity, and pressure of ambient air, which can be different for certification conditions) [10,20]. According to a study by Carslaw et al. (2008), NOx concentrations can vary by up to 41% between aircraft with the same airframe and engine type [9]. Turgut and Rosen discovered significant differences in the emissions of certain pollutants for aircraft with varying characteristics during a study conducted at eight major busy airports [21].
Comparing these ICAO emissions indices to actual measurements is indeed critical for evaluating the accuracy of airport air quality models. Masiol and Harrison summarized the most meaningful studies on the characterization of aircraft emissions in both tests and real operations [22]. Clearly, normal aircraft operations must be maintained throughout the measurements, and passenger safety must be ensured in all circumstances. For this reason, any approach to an aircraft is strictly prohibited. As a result, determining the true emission characteristics of aircraft and other sources of pollution under actual operating conditions is difficult, and accurately simulating and forecasting airport air quality is also difficult. To overcome the limitations of the ICAO database, several measurement campaigns at various airports have been conducted. We discovered that several studies have been published on aircraft emissions during real operations. These studies used non-invasive instruments or mobile laboratories located downwind of active runways. For instance, Popp et al. (1999) measured the NO/CO2 emission ratios of commercial aircraft in use at Heathrow Airport using the open path infrared and ultraviolet sensors developed for measuring on-road motor vehicle emissions [23]. Schäfer et al. (2003) measured idling aircraft exhaust at major European airports using non-intrusive spectroscopic methods, such as Fourier transform infrared spectrometry (FT-IR) and differential optical absorption spectroscopy (DOAS); parallel open paths ranging in length from 80 m to 150 m were installed directly behind the aircraft. The researchers discovered that the emission indices for NOx determined in their work were lower than those in the ICAO’s emission database and that there was a high degree of variation in the emission indices across aircraft families and engines with the same engine type [10]. Herndon et al. (2004) used a dual tunable infrared laser differential absorption spectroscopy instrument to measure NO and NO2 emissions from 30 individual aircraft during taxiing and take-off, and each of the taxiway plumes was lower than the ICAO certification value [11]. Schürmann et al. (2007) collected the data on NO, NO2, CO, and CO2 emissions from idling aircraft using open path devices, and their findings revealed discrepancies with the emission indices published in the ICAO database [24]. Carslaw et al. (2008) investigated the NOx emissions at London Heathrow and discovered statistically significant differences in the emissions from identical engine types installed on identical aircraft frames. Additionally, they noted that the values of the EIs (emission indices) might have been significantly impacted by a lack of knowledge regarding certain critical aircraft operational factors, such as the aircraft’s weight and thrust setting at take-off [9]. Xia et al. (2009) quantified the compounds in engine exhaust gases using Fourier transform infrared emission spectroscopy [25]. Han et al. (2019) monitored the VOCs emissions in Beijing Capital Airport using solar occultation flux-Fourier transform infrared spectroscopy [26]. However, the number of aircraft studied remains insufficient, and numerous unanswered questions persist as a result of the diverse measurement strategies, technologies and methods, compounds analyzed, and environments studied.
We conducted air observation experiments at Hefei Xinqiao International Airport to further our understanding of aircraft emissions. In this study, we describe the development of a long-path differential optical absorption spectroscopy (LP-DOAS) instrument for measuring aircraft emissions at an airport, as well as the results of an experiment conducted in October 2019 to measure commercial aircraft NO2 and SO2 emissions using optical remote sensing. Plumes were measured from a variety of aircraft, including jets and turboprops. To the author’s knowledge, this is the first time that the light path of LP-DOAS passing through the aircraft taxiway and the take-off runway concurrently has been measured.

2. Materials and Methods

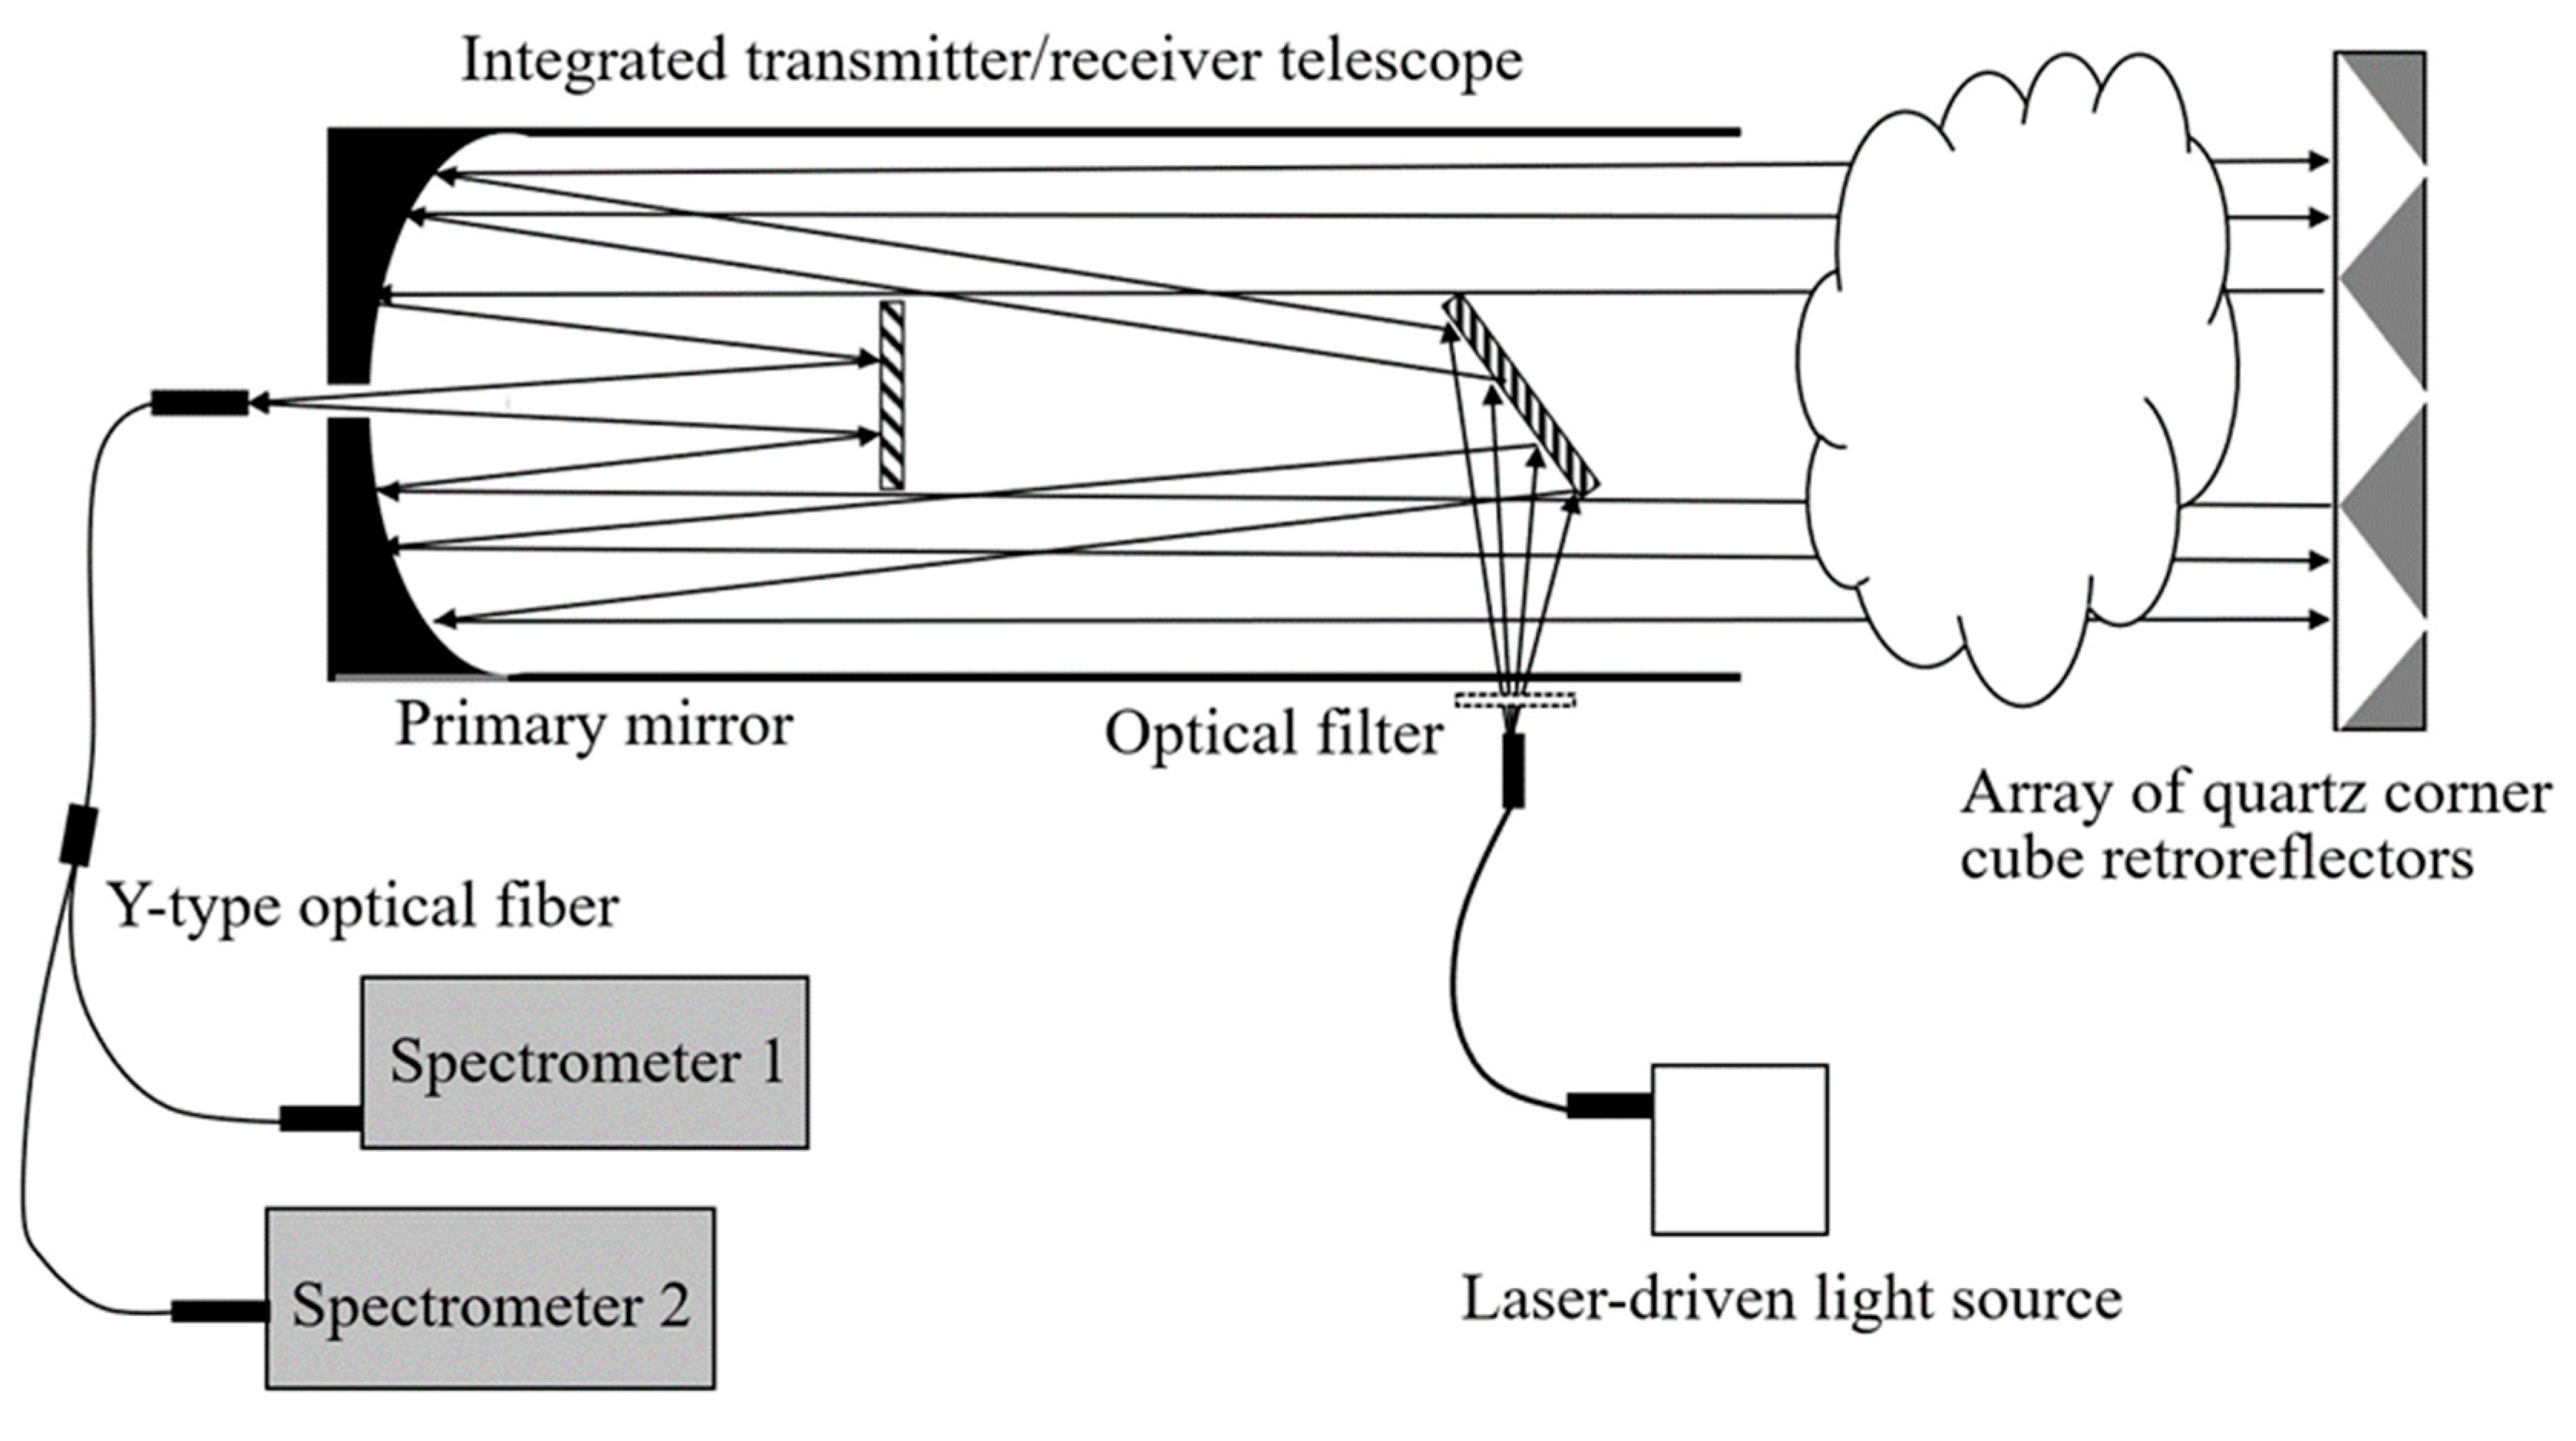
2.1. DOAS Instrument

Among the numerous available spectroscopic techniques, differential optical absorption spectroscopy (DOAS) has emerged as a popular method for measuring a wide variety of trace gases. The elegance of active DOAS is that it enables the direct application of the expanded Lambert Beer’s law to the calculation of trace gas concentrations using only the absorption cross-section, without the need for field calibration. Active DOAS is thus non-intrusive, highly accurate, and extremely sensitive when long light paths are used [27]. Additionally, an important benefit of open-path DOAS is that no installations are required near or behind the aircraft, and airport operations are unaffected during measurement times.
The principles and typical experimental setups of the DOAS technique have been described in detail by Platt and Stutz [27], and this paper focuses on the developments of the LP-DOAS instrument for aircraft emissions. The DOAS instrument used in this study was based on previous work by our research group [28,29] and the instrument was designed and improved with the intent of monitoring aircraft emissions at airports. Airports are well-known for their stringent requirements and controls aimed at ensuring the safety of civil aircraft and passengers, which is one of the primary reasons for the scarcity of studies that measure actual aircraft emissions in real operational conditions. As a result, the telescope and retroreflectors in this study had to be positioned in a few locations around the perimeter of the Hefei Xinqiao International Airport, requiring the measurement light path to be set outside or crossing the runway, and we were unable to position our equipment directly behind the takeoff runway or between the taxiway and the runway. In comparison to the light path outside the runway, the light path across the runway theoretically enabled the rapid acquisition of aircraft emission data with little influence from meteorological factors. In our study, the optimal light path for LP-DOAS at Hefei Xinqiao International Airport had to pass through the aircraft taxiway and take-off runway concurrently. Moreover, we wanted to take a clear observation of the changing process of the average concentration of pollutants at the airport. As a result, the long path (1000 m), sensitive (ppbV level), rapid (seconds level), and accurate measurements of the pollutant concentrations emitted by aircraft engines were required at Hefei Xinqiao International Airport.
The LP-DOAS system was comprised of the following components: a light source, an integrated transmitter/receiver telescope, an array of quartz corner cube retroreflectors, an optical filter, a Y-type optical fiber, two spectrometer detectors, and a system control and processing unit. A schematic of the LP-DOAS instrument is shown in Figure 1. The light from the light source passed through a reflecting mirror to the telescope system’s primary mirror, where it was collimated into parallel light for transmission to the distant array of quartz corner cube retroreflectors. The light reflected back from the retroreflectors was converged again by the primary mirror, reflected by another reflecting mirror, and finally collected in the Y-shaped optical fiber. The light was transmitted via the Y-shaped optical fiber to two spectrometer detectors that converted the light signals to electrical signals and sent them to the computer for processing. Finally, the DOAS algorithm was used to invert the absorption spectra. Spectrometer 1 (QE65 pro, Ocean Optics) had a spectral range of 200–310 nm and was primarily used to measure gases, such as SO2, O3, NO, C6H6, C7H8, and C8H10. Spectrometer 2 (QE65 pro, Ocean Optics) had a spectral range of 400–500 nm and was primarily used to measure NO2.
A light source is a critical component of an LP-DOAS instrument because it determines the instrument’s spectral range, which is directly related to the composition being measured, and it has a significant impact on the instrument’s performance. The long-path DOAS configuration is most frequently used in conjunction with broadband light sources, such as xenon-arc lamps to determine trace gases, such as NO2, SO2, and O3. However, xenon arc lamps frequently suffer from insufficient arc stability, affecting the optical coupling in the fiber, the effective intensity, and the shape of the lamp’s spectral structures. Nasse et al. (2019) compared various light sources for LP-DOAS and discovered that the use of novel laser-driven light sources (LDLS) as light sources enabled improved light coupling with increased light throughput, increased transmission homogeneity, and improved suppression of light in disturbed wavelength regions [30]. To achieve high temporal resolution in the order of several seconds over long distances, it is critical to optimize the signal-to-noise ratio and temporal resolution of the LP-DOAS system. As a result, we chose the novel laser-driven light source (EQ-99X-FC, Energetiq, Wilmington, MA, USA) for our LP-DOAS instrument’s light source. This light source combined the advantages of a high-power xenon lamp with the long lifetime, high stability, and extremely small and stable plasma spot of an infrared laser by supplying energy to the xenon plasma via an infrared laser. Islam et al. (2013) provide additional details on the LDLS [31].
The primary mirror of the telescope was a parabolic aspheric design that eliminated spherical aberrations and increased optical efficiency (diameter = 200 mm, focal length = 950 mm). It was designed to match the fiber-optic output angle of the light source, allowing the divergence angle of the light source to be controlled and the emitted light to be collimated more precisely (better than 10 mrad). The reflecting mirrors were manufactured using K9 glass and had enhanced aluminum surfaces to improve reflectivity. Also, we integrated an array of retroreflectors by combining nineteen 60 mm diameter quartz corner cube retroreflectors to increase the surface area and reflectivity efficiency of the retroreflectors, allowing for increased light reflection back into the telescope system.
Additionally, a slot was designed for the installation of the optical filters at the light source’s outgoing end, with the goal of eliminating excess visible light from the light source and minimizing the LP-DOAS instrument’s impact on other items, especially at night. It is worth noting that the telescope benefited from a smaller emission diffusion angle, which made observing the light extremely difficult during the daytime unless the observer was directly adjacent to the reflectors. However, to ensure additional safety, the experiments were conducted only during daylight hours, between 10:00 and 17:00 local time. As a result, the optical filter was not required in this experiment.

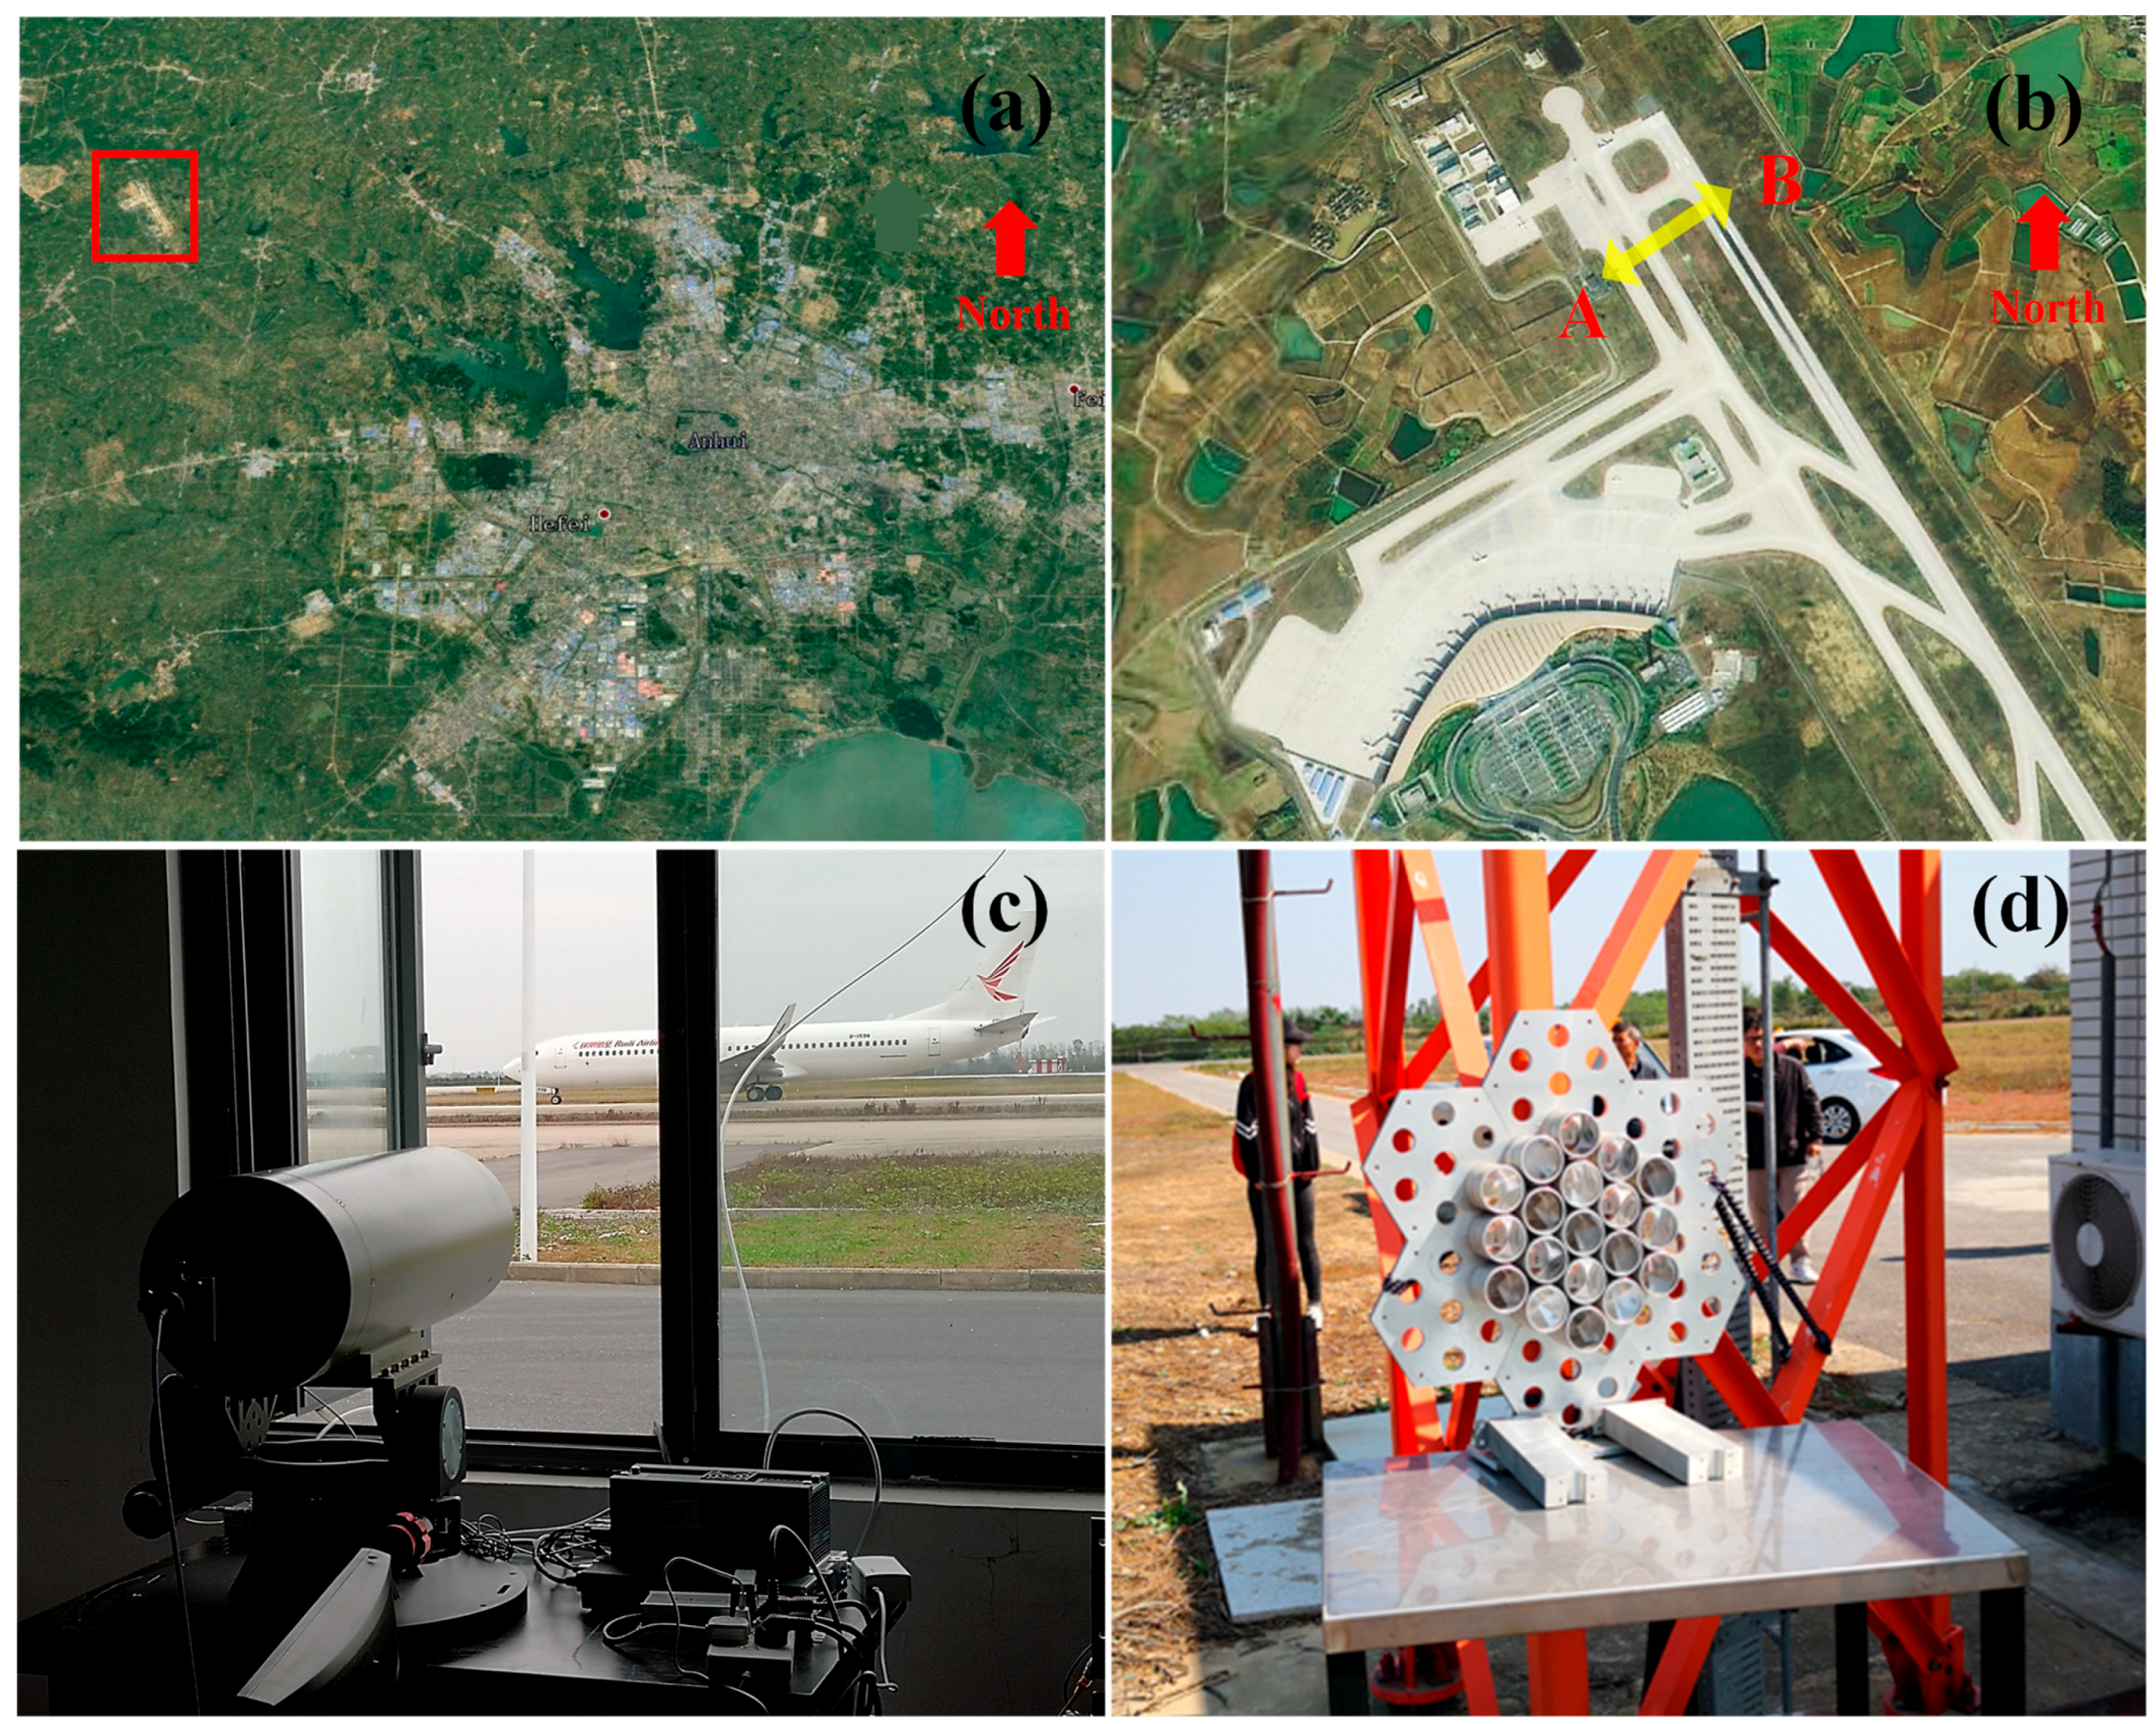
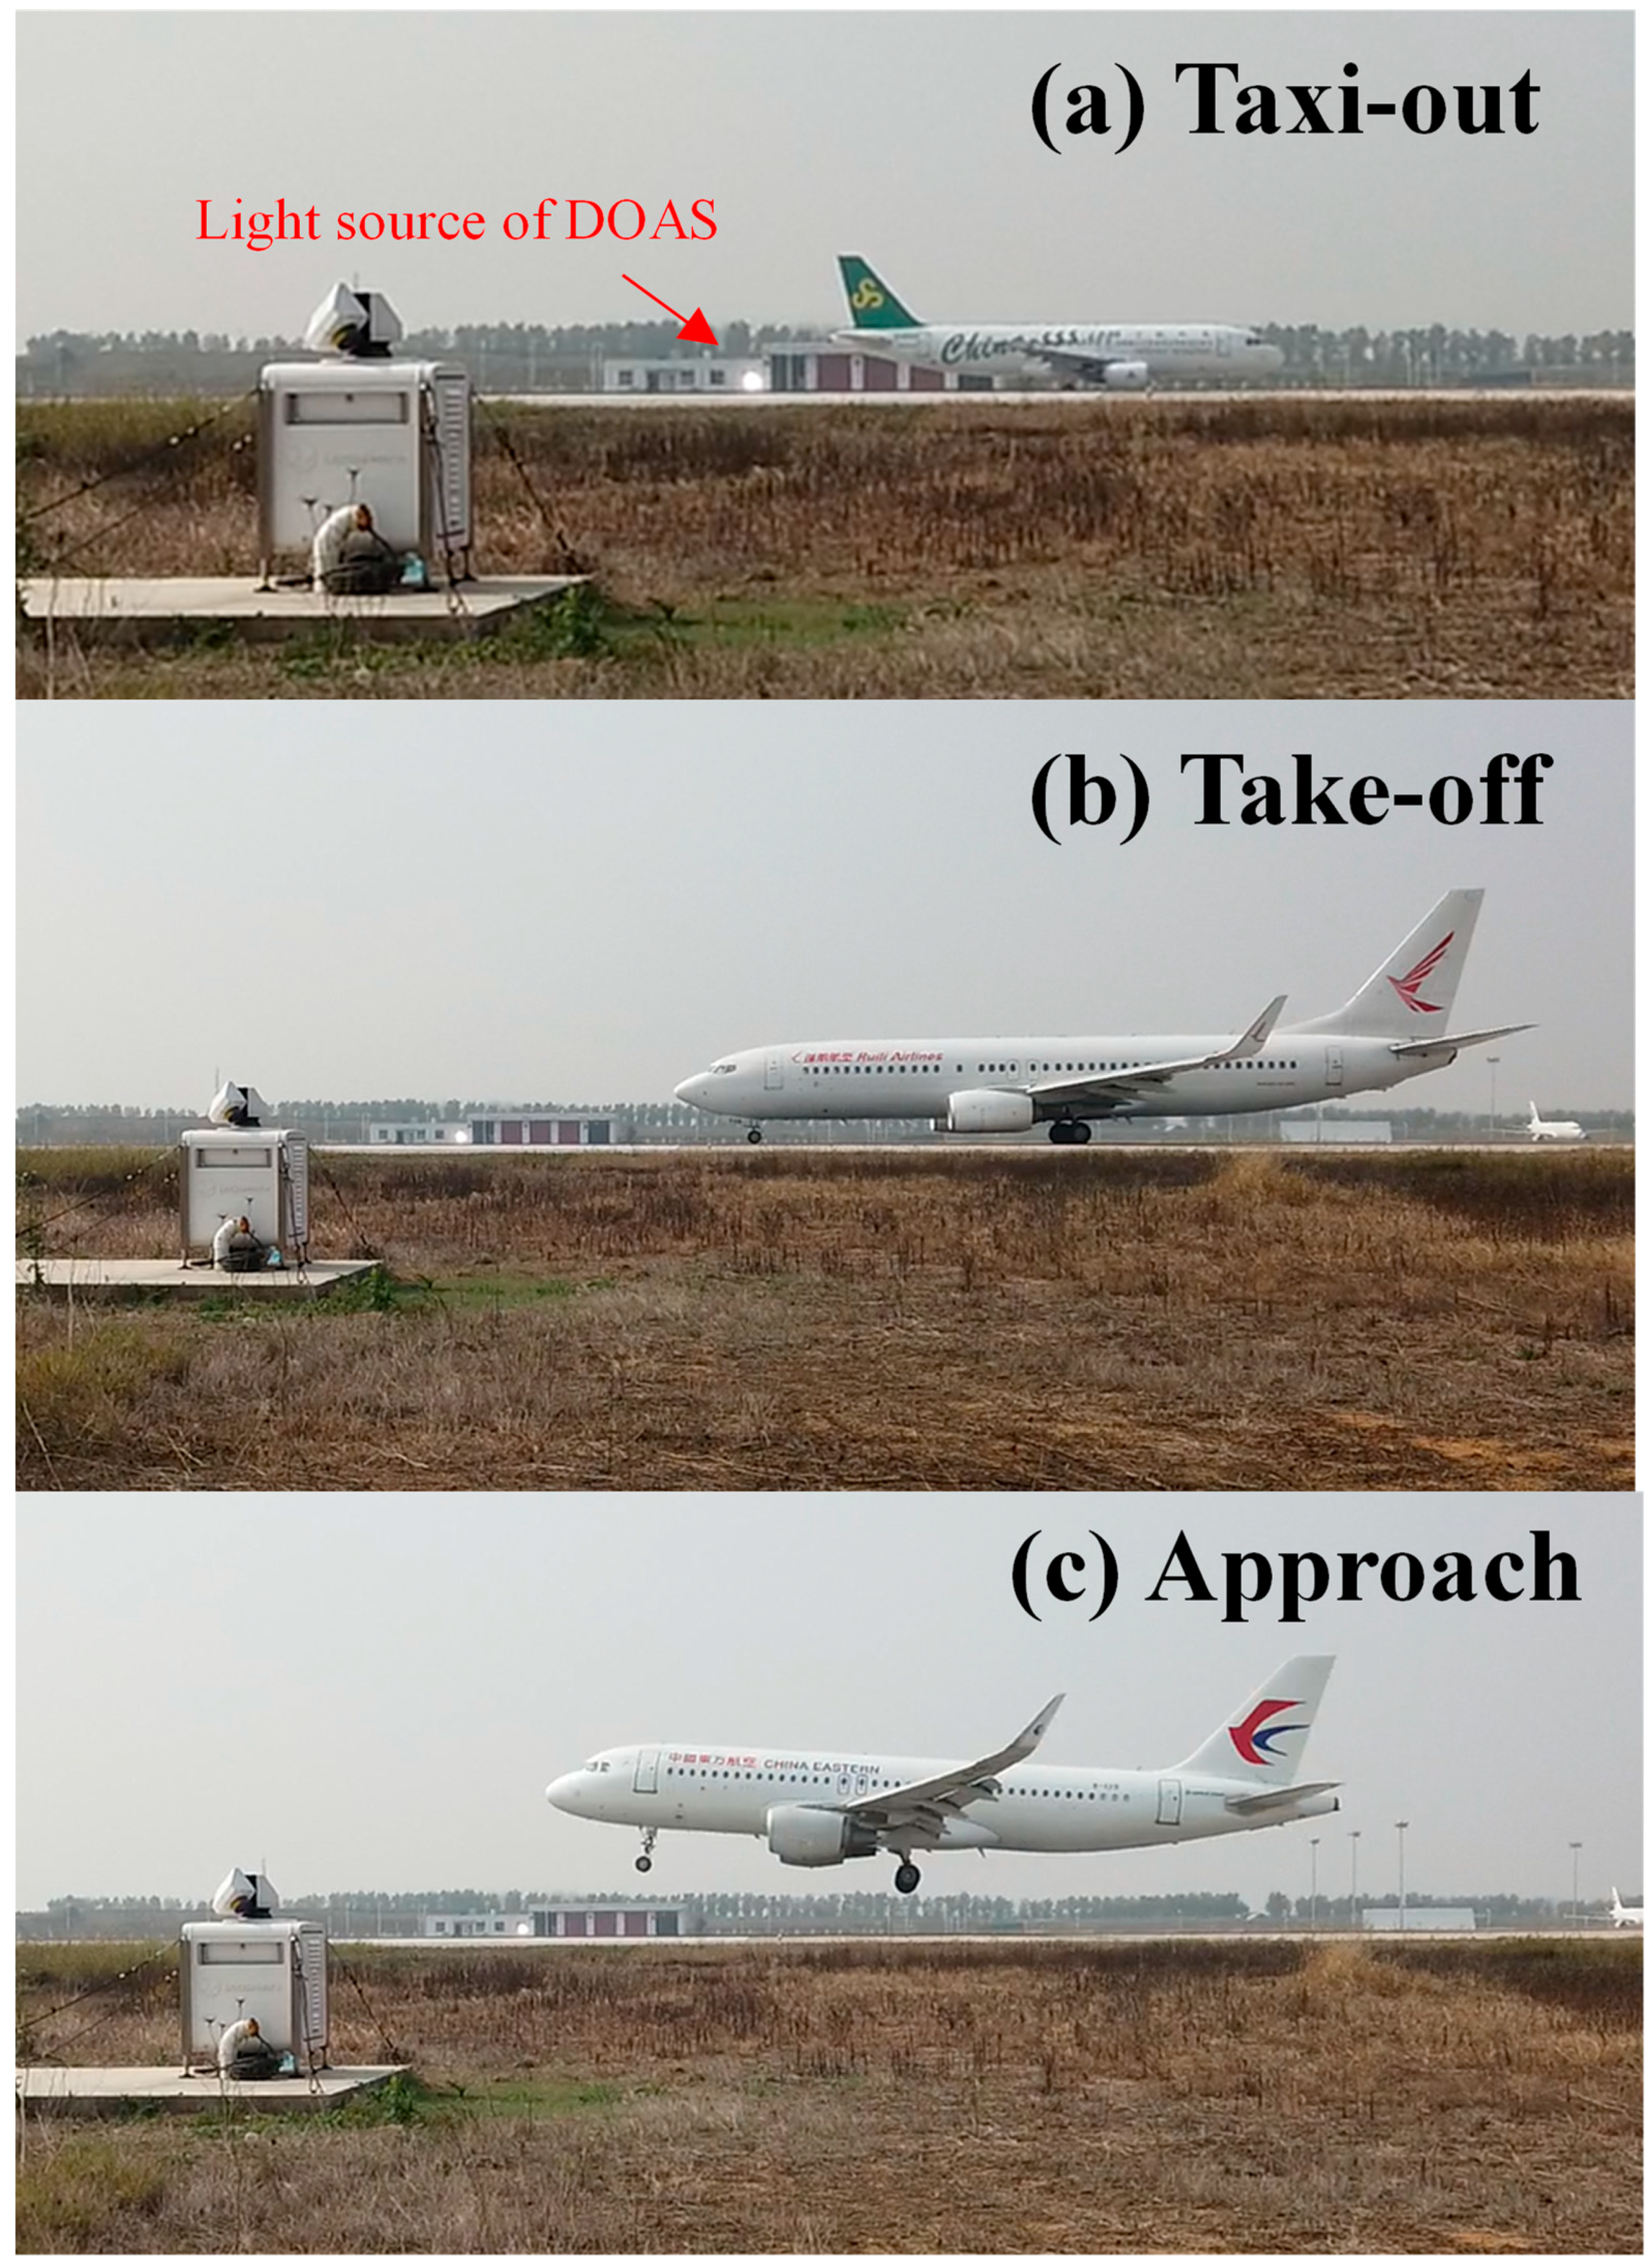
2.2. Equipment Installation

Hefei Xinqiao International Airport (IATA: HFE, ICAO: ZSOF) is located in the northwestern area of Hefei, Anhui Province, China. The airport’s location is depicted schematically in Figure 2a. The airport is located at 31°59′42″E, 116°58′34″N, and it is surrounded by mostly green areas with no significant sources of pollution (Figure 2b). Hefei Xinqiao International Airport opened in 2013 and is equipped with a 3400 m long and 45 m wide runway as well as a parallel taxiway.
The aircraft emission experiments were approved in accordance with applicable regulations following extensive consultations and exchanges with the airports and airlines involved. As we knew, it was strictly prohibited for the atmospheric monitoring equipment and experimentalists to get close to aircraft and airport runways. As a result, non-intrusive optical remote sensing devices were used to meet this exacting standard. After stringent safety certifications and multiple safety checks, the LP-DOAS instrument and the experiment personnel were allowed to enter Hefei Xinqiao international airport. The LP-DOAS telescope (Figure 2c) was installed in a room at the airport’s fire station (Point A in Figure 2b), and the retroreflectors (Figure 2d) were mounted outside near the airport’s meteorological stations (Point B in Figure 2b). Both the telescope and the retroreflectors were placed on a stable steel table at a 1.5 m height. The distance between the telescope and the reflectors was 482 m which was measured by the laser range finder; i.e., the total light path of the LP-DOAS system was about 964 m. The measurement light path crossed the aircraft taxiway and the take-off and landing runway, as indicated by the yellow line in Figure 2b, allowing for the direct capture of the aircraft’s emission characteristics under real circumstances.
The Hefei Xinqiao International Airport Company provided flight departure times and other pertinent aircraft parameters (including the aircraft flight number, airline name, aircraft type, and age of the aircraft). We recorded the precise time each aircraft taxied out, took off, or approached through the measurement light path, identified the aircraft as belonging to the airline based on the airline logo on the tail of the aircraft, and matched the relevant aircraft parameters to the airport’s information for subsequent data analysis. Figure 3 depicts photographs of the measurement field. Additionally, the Hefei Xinqiao International Airport Company provided meteorological data for the site, including the wind speed, wind direction, and rainfall, all of which were measured near point B in Figure 2b. In particular, the majority of the ground service equipment at Hefei Airport (e.g., passenger buses, baggage and food carriers, container loader, and cleaning vehicles) was powered by electricity and thus had no effect on the air quality.

3. Results and Discussion

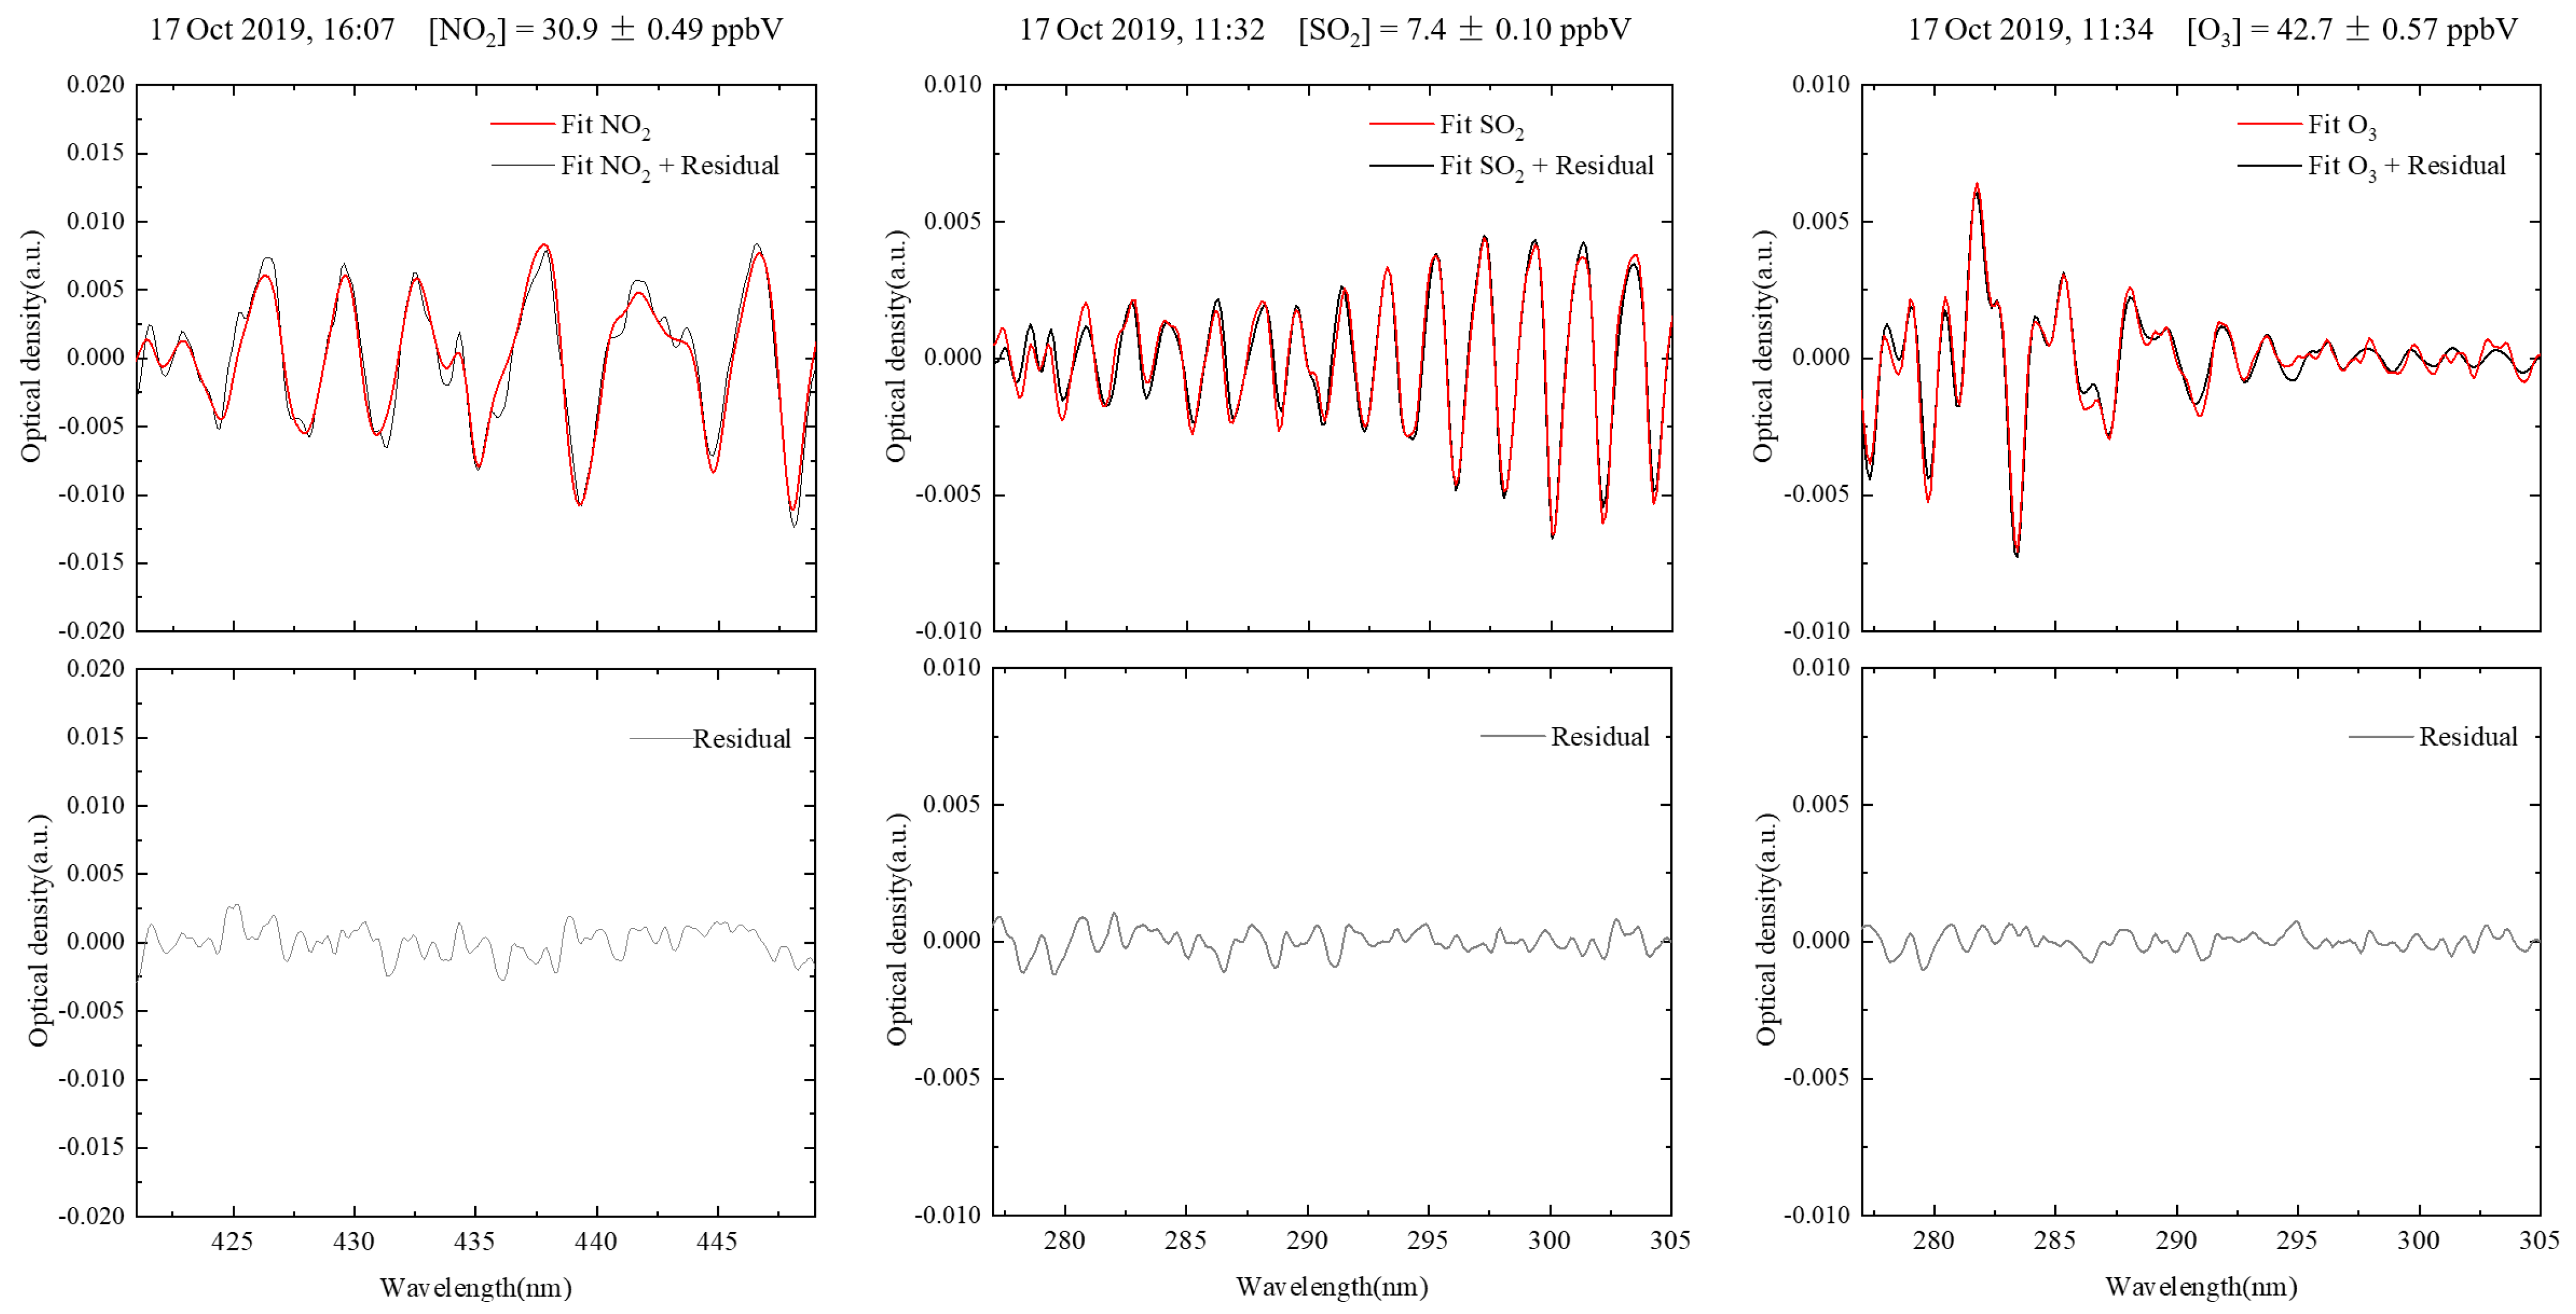
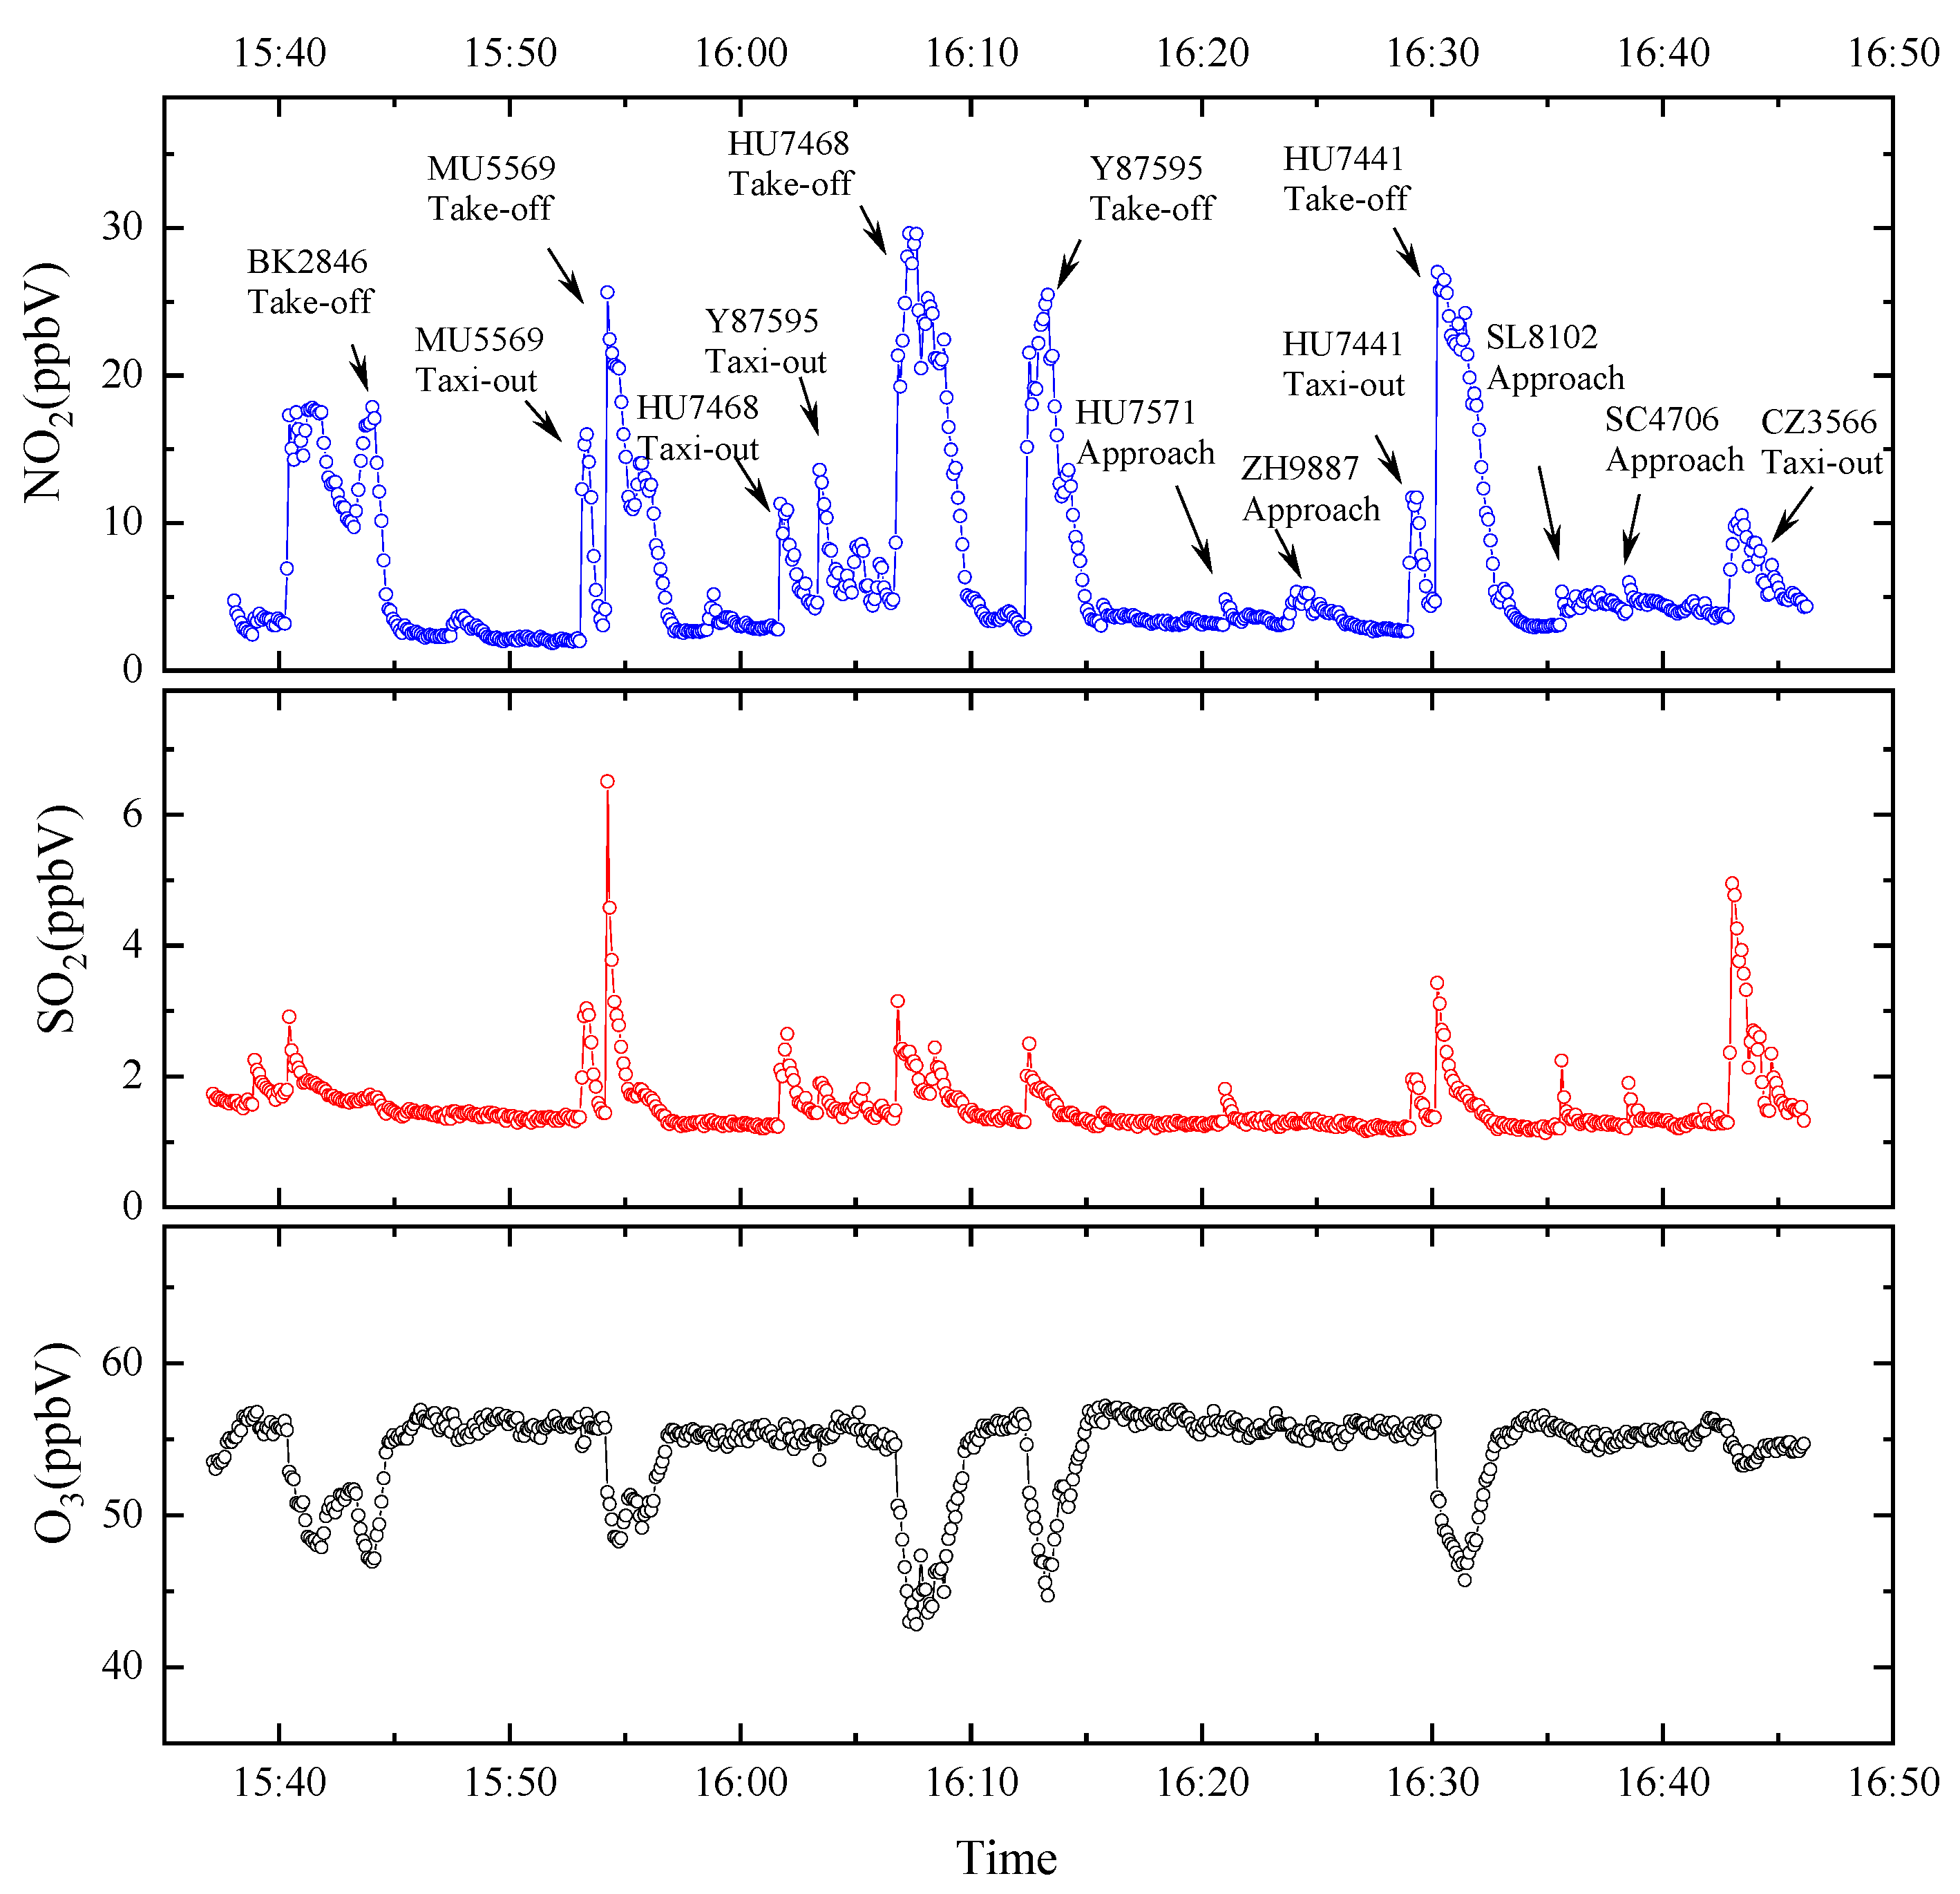
3.1. Spectral Inversions and Time Series of Pollutants
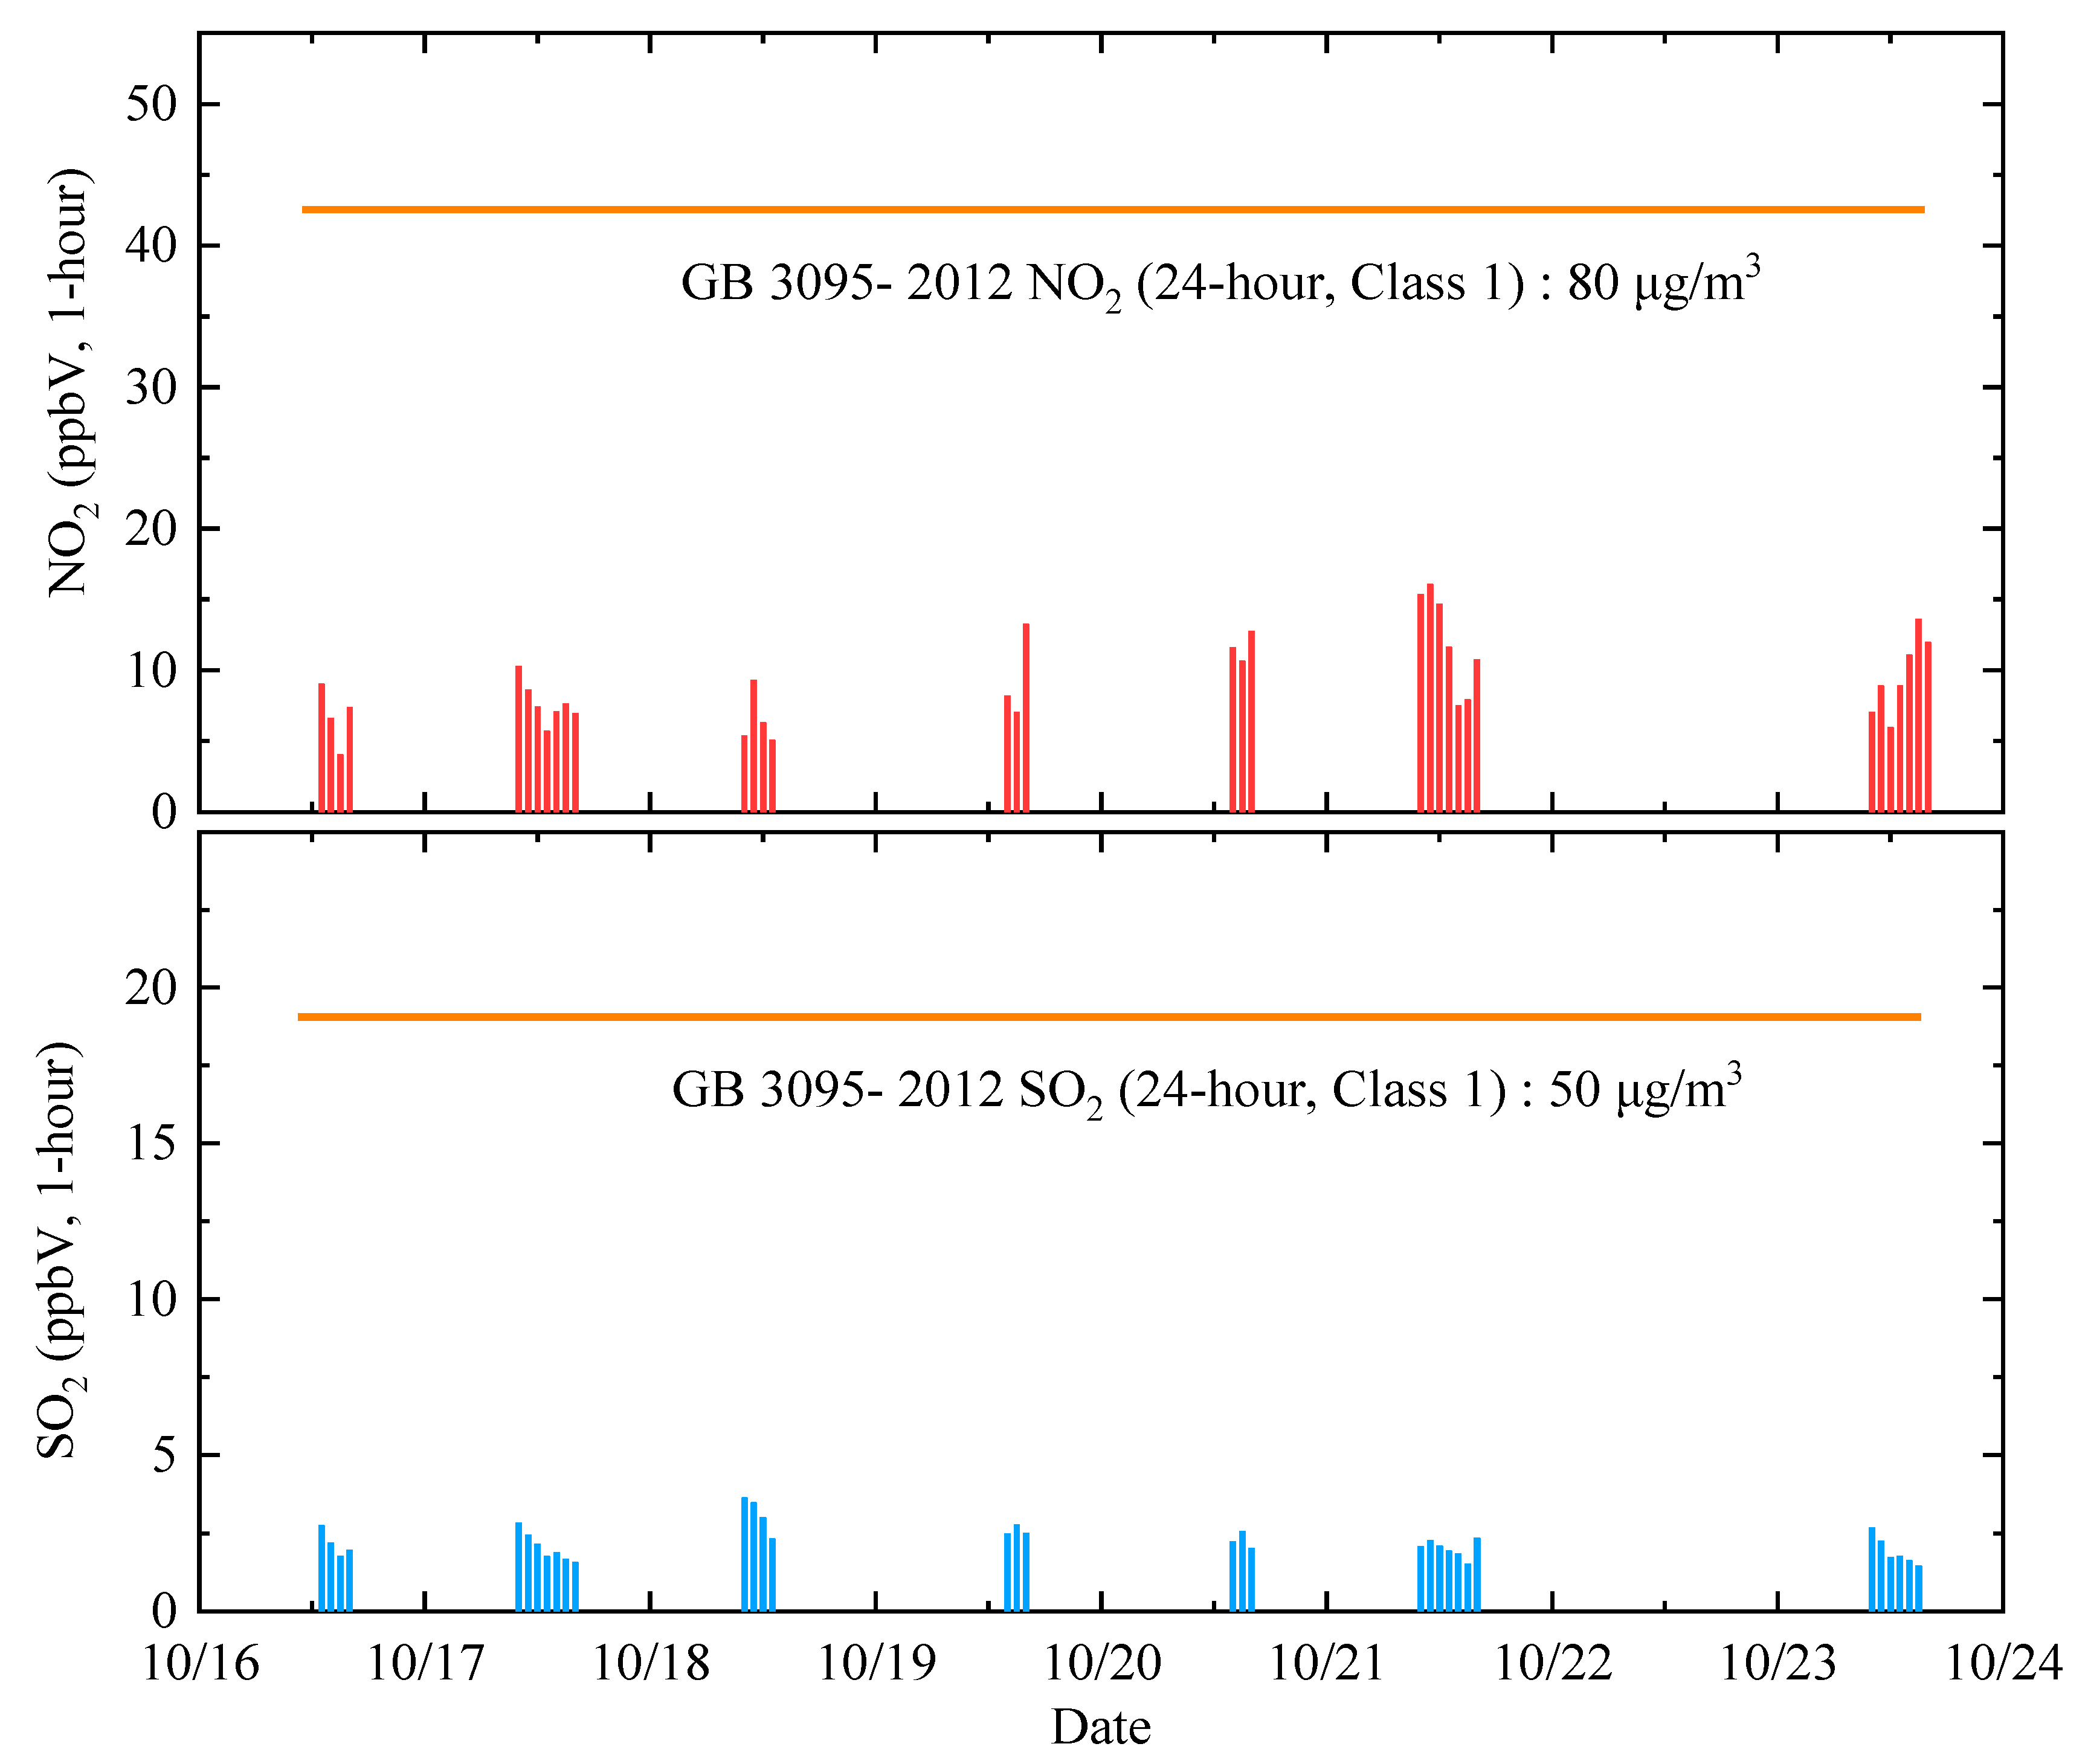
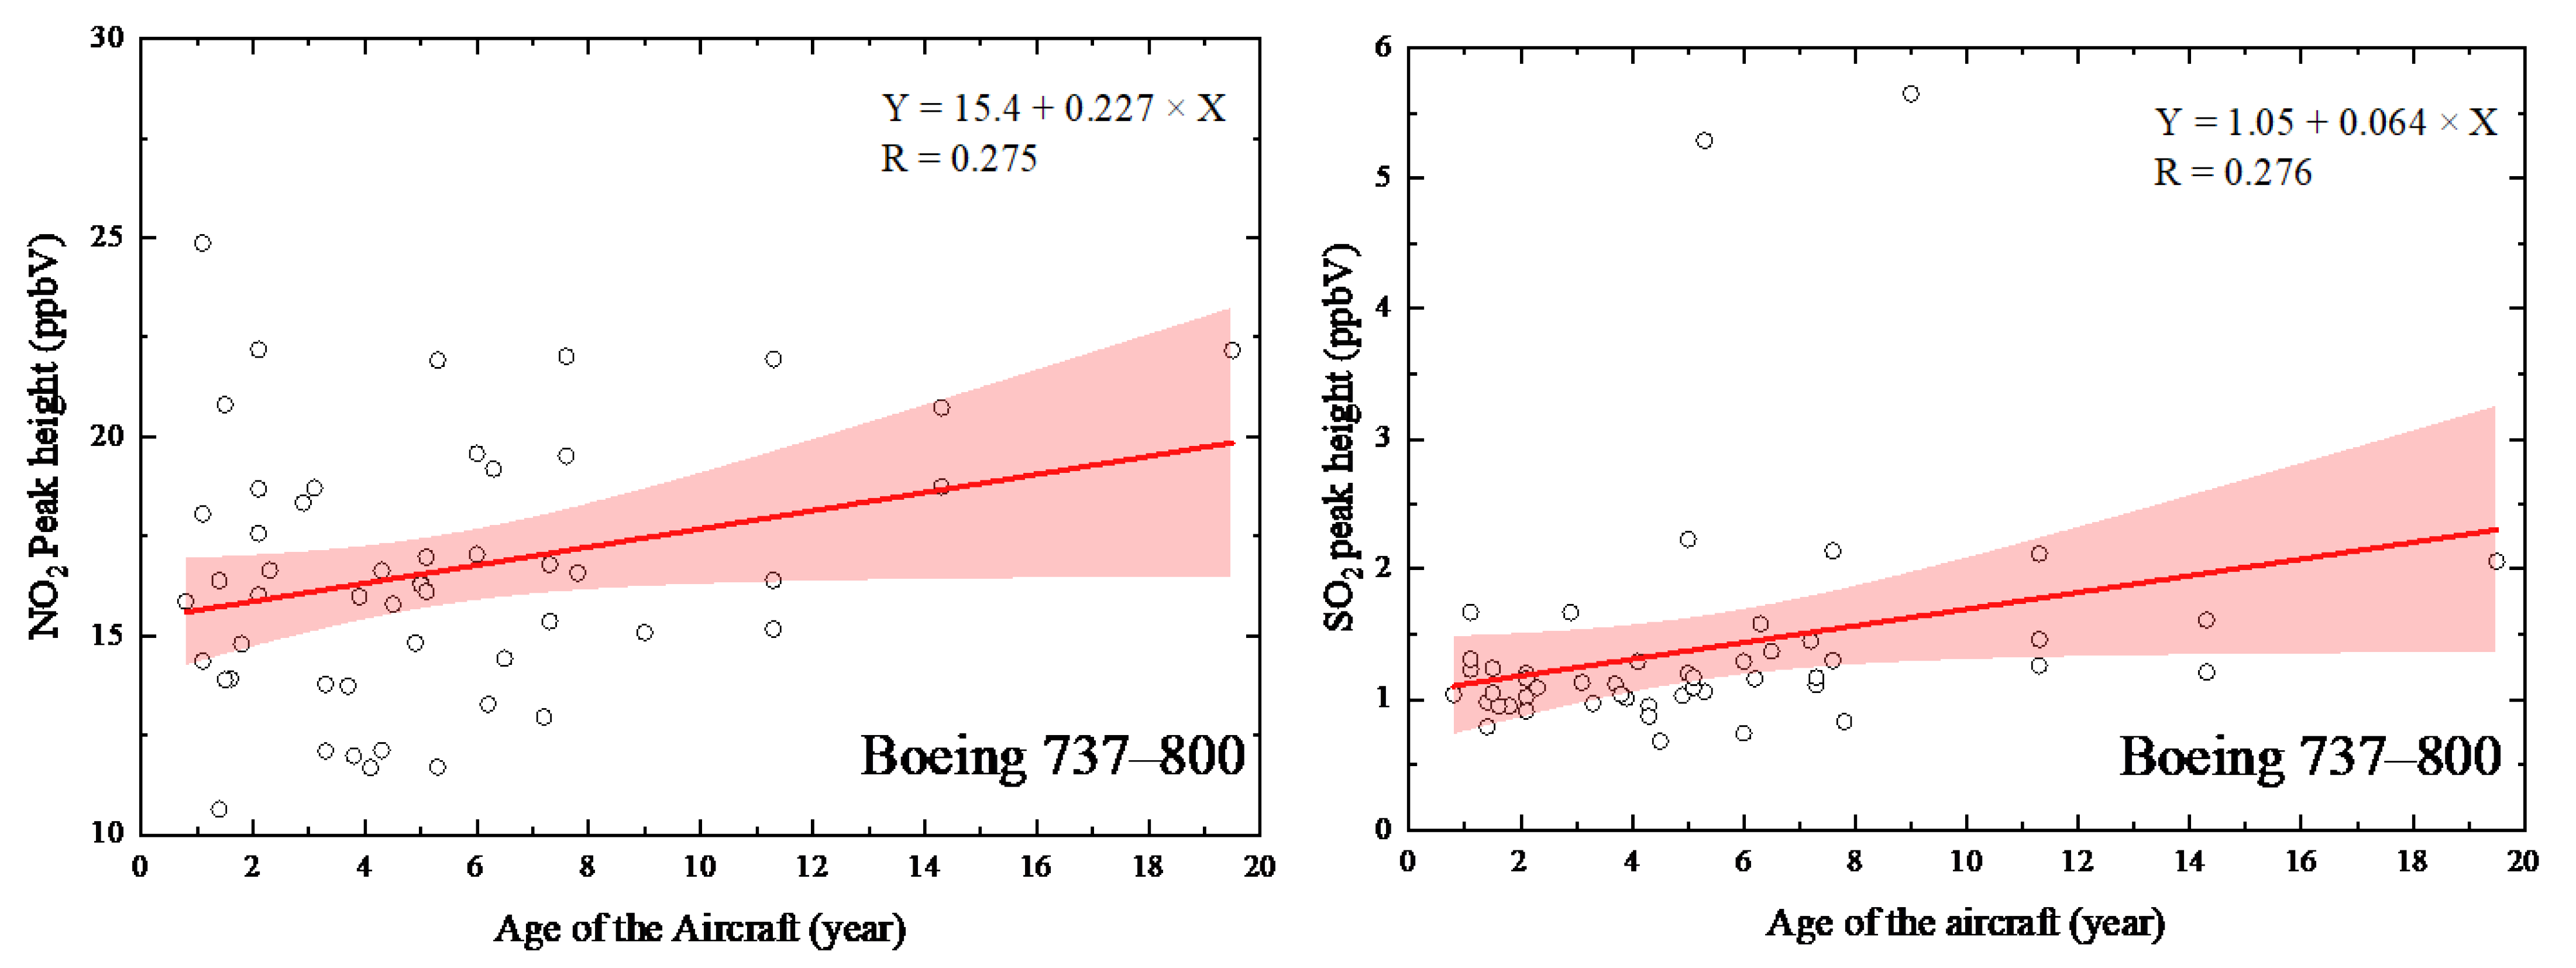
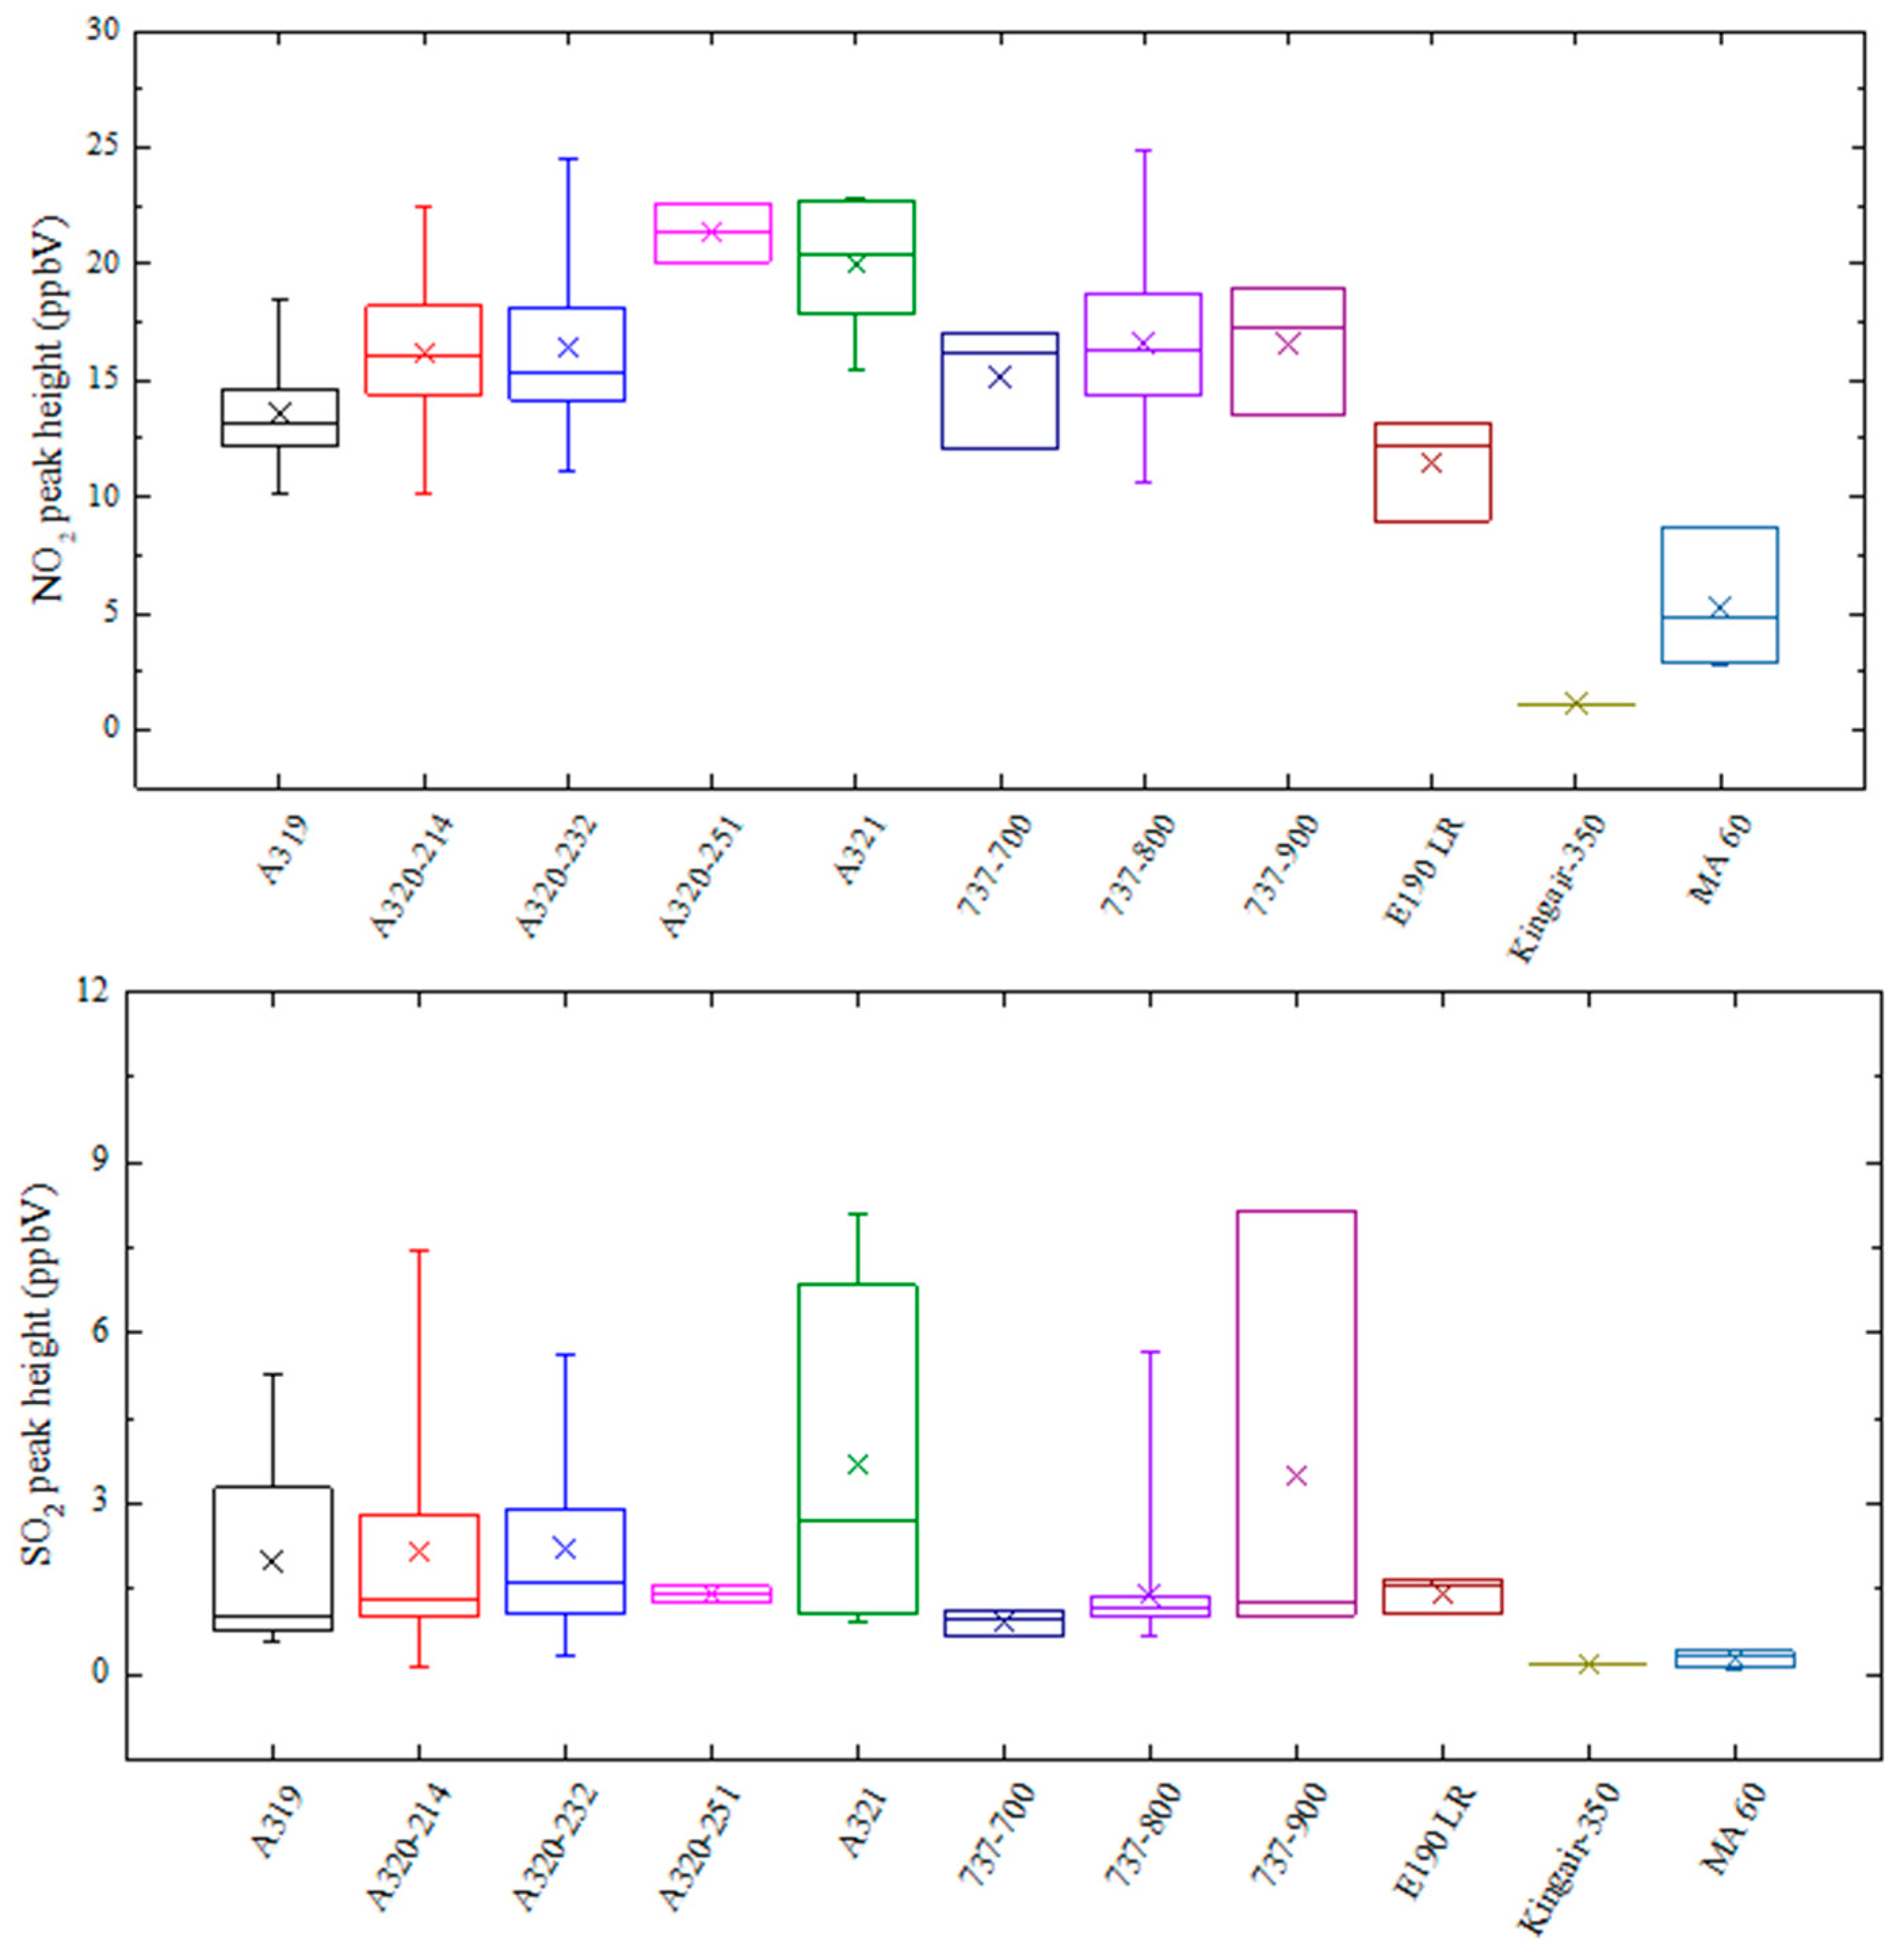
The experiment took place between 15 October and 23 October 2019. The weather conditions were ideal throughout the measurement period, with no inclement weather, such as rain or strong winds. However, our equipment was installed in the northern portion of the airport, and because the control tower directed the aircraft’s take-off or landing position (north or south of the runway) based on the prevailing weather, the aircraft emission process was missed for a portion of the time.
The LP-DOAS absorption spectra were analyzed using the nonlinear least squares fit, as previously described in detail by Platt and Stutz [27]. The absorption cross-sections of NO2 [32], SO2 [33], O3 [34], and other gases adapted to the instrument resolution and a polynomial of degree 5 were fitted to the atmospheric spectrum. The SO2 and O3 were analyzed in the wavelength range from 277 nm to 305 nm, while the NO2 was analyzed in the wavelength range from 421 nm to 449 nm. The time resolution of the LP-DOAS instrument was approximately 10 s. The actual spectral measurements at the airport indicated that the mean detection limits for the NO2, SO2, O3, C6H6, and C7H8 were approximately 0.3 ppbV, 0.08 ppbV, 0.06 ppbV, 0.4 ppbV, and 1.0 ppbV with a 964 m light path. However, owing to the significant extinction of light in the deep UV region, the optical absorption signals in the NO absorption range (210–230 nm) are extremely weak, resulting in a mean detection limit for NO of over 8 ppbV.
For the duration of the experiment, differential absorptions of NO2, SO2, and O3 were observed. In particular, the absorptions of NO2 and SO2 were clearly identified when the aircraft passed through the light path (refer to Figure 4 for an example). It should be noted that the LP-DOAS instrument produced results in terms of the average concentrations along the measuring light path.
Moreover, we attempted the inversion of additional gases within the measuring spectral range, such as nitric oxide, benzene, toluene, ethylbenzene, and ortho-xylenes, meta-xylenes, and para-xylenes, but the average results along the measuring light path were below the LP-DOAS instrument’s detection limits. The mechanism of action of nitric oxide is well understood. As previously demonstrated, aircraft emissions contain NO but are rapidly converted to NO2 in the few seconds between emission and detection [10,13,23]. As a consequence, our LP-DOAS instrument was incapable of detecting the relatively low levels of NO, and most NOx (NOx = NO + NO2) emission measured behind the aircraft was NO2. Additionally, for benzene series gases measurements, when Schürmann et al. (2007) observed benzene series gases at Zurich airport, they collected ambient air samples using electropolished stainless steel canisters and analyzed them for volatile organic compounds in the laboratory using gas chromatographic methods; the maximum value of any single volatile organic compound at the sampling sites was only a few tens of ppbV [24,35]. However, these values were averaged over the entire light path and the regional average concentrations of volatile organic compounds were very low. Until now, no measurements of benzene series gases at an airport have been reported using LP-DOAS, most likely due to the detection limits of the LP-DOAS system.
Figure 5 illustrates the temporal variation in the NO2, SO2, and O3 concentrations in typical plume observations. Benefiting from the moderate aircraft flows, pollution-free airport ground service equipment, and favorable diffusion conditions at Hefei Airport, the NO2, SO2, and O3 results for the entire observation period are similar to those shown in Figure 5, and we could obtain independent NO2 and SO2 peaks for almost every aircraft during the taxi-out and take-off phases. These peaks could be perfectly matched to the time when the aircraft crossed the light path of LP-DOAS. Once the aircraft passed through the measurement light path, the NO2 and SO2 concentrations immediately increased to their maximum levels and then rapidly decreased to atmospheric background levels within a few minutes. The NO2 and SO2 concentrations showed a strong positive correlation, indicating that both were emitted by aircraft. Additionally, the NO2 and O3 concentrations showed a negative correlation, indicating that the aircraft’s NO emissions were rapidly oxidized by O3 and converted to NO2 in the atmosphere, which also explained why we were unable to measure the NO. Among these results, the approach phase measurement results were not significant, most likely because the aircraft pollutants were very low during the approach phase. However, it is possible that the aircraft passed directly through the measurement light path during the take-off and taxiing phases, whereas the aircraft approach phase crossed above the measurement light path (as shown in Figure 3), and the pollutants emitted during the aircraft approach phase were not observed effectively in this measurement.
The experimental results demonstrated that the temporal resolution (~10 s) of the LP-DOAS instrument enabled a clear observation of the changing process of the average concentration of pollutants at the airport and the security of the developed LP-DOAS remote sensor for measuring aircraft emissions without interfering with normal aircraft operations, as well as measuring the NOx and SO2 emissions from taxi-out, take-off, and approach during routine airport operation.

3.2. Data Analysis

In previous studies, the measured concentrations of polluting gases were usually converted to the emission index (EI), i.e., grams of pollutant per kilogram of fuel burned, and compared with the ICAO database. Unfortunately, since the CO2 data were not collected concurrently in this experiment, the EIs for NO2 and SO2 could not be calculated. It should be noted that the emission index cannot provide a precise indication of the absolute contribution of aircraft emissions to ground-level concentrations, which is critical when assessing airport air quality [9]. As a result, our research was focused on the absolute contribution of various aircraft pollutants to ground-level concentrations, which is very important for local air quality concerns.
Because the LP-DOAS instrument produced average concentrations along the measured light path, the results could be representative of the regional concentrations in Hefei Xinqiao International Airport’s northern area. The one-hour mean NO2, SO2, O3, and Ox (Ox = O3 + NO2) concentration ranges in the northern area of the airport during the observation period were 4.0–16.1 ppbV (Median: 8.2 ppbV), 1.4–3.6 ppbV (Median: 2.1 ppbV), 31.4–80.1 ppbV (Median: 55.6 ppbV), and 41.7–93.4 (Median: 62.7 ppbV). It was found that the O3 rapidly reacted with the NO emitted from the aircraft when the aircraft passed through the measurement light path and the O3 concentration rapidly decreased, and the aircraft emissions were not the source of the O3. Therefore, we do not discuss O3 in the following analysis of aircraft emissions.
The one-hour mean NO2 and SO2 concentrations during the observation period are depicted in Figure 6, and we have marked the Class 1 24-h mean concentration limit of the current ambient air quality standards in China (80 μg/m3 for NO2, 50 μg/m3 for SO2) in the figure, as specified in GB 3095-2012. The maximum hourly average NO2 and SO2 concentrations during the observation period were significantly lower than the Class 1 24-h mean concentration limit specified in GB 3095-2012, and the maximum hourly average was far below the Class 1 1-h concentration limit specified in GB 3095-2012 (200 μg/m3 for NO2, 150 μg/m3 for SO2). As a result of removing additional sources of pollution within or near the airport, the NO2 and SO2 concentrations in the northern area of Hefei Xinqiao International Airport were very low and far below China’s Class 1 ambient air quality standards throughout the observation period. In comparison, the observations by Schürmann et al. (2007) were conducted at the Zurich airport [24], including two in-situ measurements and two open-path measurements, and the median NO2 concentrations during the observations were about 10.6 ppbV, 9.5 ppbV, 12.2 ppbV, and 16.0 ppbV, which were generally consistent with the measurements results of NO2 at the Hefei Xinqiao Airport. Additionally, the hourly NOx atmospheric concentrations near the Venice International Airport observations showed that although the aircraft source was statistically significant, the relative impact of aircraft emissions on ambient NOx concentrations was limited and road traffic was the likely dominant source near the sampling point [36]. Naturally, the measurement results were related to the monitoring site, weather conditions, airport traffic, configurations, and other factors.
For future analysis, we will refer to the methods used by Carslaw et al. for selecting and processing the measured data. Carslaw et al. identified discrete “pollution events” associated with nearby departing aircraft by comparing the peaks in the NOx time series to the aircraft movements [9]. Numerous criteria were applied in this study to reduce the interferences of measurement results: (a) The NO2 or SO2 peak height for each aircraft was the highest value within two minutes after the aircraft had passed through the light path minus the ambient background value prior to that aircraft’s arrival. (b) Only individual NO2 or SO2 peaks were retained, and data were excluded if the aircraft taxied and took off simultaneously through the light path or if two aircraft were in close proximity, resulting in multiple NO2 or SO2 peaks overlapping. (c) Only data for conditions with low wind speeds (<4 m/s) were retained. (d) If the aircraft departed from the runway’s southern end, we were unable to obtain valid aircraft emission data.
In this experiment, we obtained approximately 140 groups of NO2 and SO2 peak heights for the aircraft emissions in total, covering a wide variety of common aircraft types, including the Boeing 737–800, Boeing 737–900, Airbus A319, Airbus A320–214, Airbus A320–232, Airbus A321, Embraer E190LR, Modern Ark 60 (MA 60), and Beechcraft King Air 350. Table 1 summarizes the results for the Boeing 737–800 aircraft, which had the largest amount of observed data of any aircraft type in this experiment. The observation experiment established that the LP-DOAS system was capable of capturing both NO2 and SO2 emissions from aircraft operating in real conditions. The aircraft’s take-off resulted in a maximum peak height of approximately 25 ppbV for NO2 and approximately 8 ppbV for SO2 in the measured area average concentrations. Owing to the airport’s open space, the pollution concentrations decreased rapidly, and the overall pollution level in the airport area was relatively low.
The method of linear regression was used to analyze the measured NO2 peak height, SO2 peak height and age of the aircraft. Figure 7 illustrates the linear dependence of the measured NO2 and SO2 peak heights on the aircraft’s age for 737–800 aircraft, which was fitted within the 0.95 prediction interval (the red areas). Interestingly, we discovered that the aging Boeing 737–800 aircraft exhibit a weak positive correlation with the NO2 and SO2 peak heights in this measurement. However, owing to the limited number of observations and the lack of information about the aircraft’s engine type, this discrepancy could be explained by the fact that the 737–800 family of aircraft used a variety of engine types or by other uncertainties, such as aircraft maintenance and environmental conditions. Additionally, we attempted to analyze other types of aircraft, but strangely, we did not discover this phenomenon. In the study of Zaporozhets and Synylo, the relationship between emissions indices of NOx and the engine age exhibited a similar phenomenon [20]. It was unsurprising that the engine age was a significant factor affecting emission formation, since the conditions of the combustion chamber, cooling systems, and required cooling air were not identical to those of a new engine [21]. Additionally, the modeled estimate of the aging effects on the NOx emission ratio was in the range of -1% to 4% (Solutions, B.A. Back Fleet Database. 2001). In the future, long-term observations can be conducted to elucidate the relationship between aircraft emissions and aircraft ages in greater detail.
Figure 8 summarizes the NO2 and SO2 peak heights of the aircraft emissions data for various aircraft types. The figure shows that there was no significant variance in emissions between the different types of jet aircraft and that the small propeller aircraft emitted significantly fewer pollutants than turbojet aircraft. However, the small propeller aircraft had a lower passenger capacity than conventional jets.
Finally, we attempted to discuss the relationships between the observations results and the meteorological conditions. We first examined the relationship between aircraft emissions and wind speed or direction for each of the same aircraft types, but we found no significant correlations. Naturally, there were some differences between aircraft with the same model (engine type, age, operation, etc.). As a result, we selected the same aircraft from the observation period’s results to compare emissions under various meteorological conditions. Because we only had limited information, such as the flight number and age, we assumed that if two aircraft on different dates during the observation period both had the same model and age, they were likely to be identical. Certainly, sharing a flight number and age did not guarantee that the aircraft were identical, and the aircraft could have been purchased concurrently by the airline. While various certain critical aircraft operational factors, such as the aircraft’s weight and thrust setting at take-off, varied for identical aircraft on different flight dates, they might still be used to analyse the relationship between aircraft emissions and meteorological conditions. Several ‘identical’ aircraft were chosen from the entire measurement data set, and the aircraft emissions data for different dates are shown in Table 2, along with the wind direction and wind speed at the airport. It could be found that the time interval between a rapid increase in pollutant concentration and complete reduction to a stable background value was shorter for the identical aircraft at higher wind speeds due to the pollutant’s faster dispersion at higher wind speeds. Additionally, we discovered that the NO2 peak heights measured at higher wind speeds were slightly higher, which was likely due to the pollutants spread over a larger area of the measured light path at higher wind speeds, resulting in higher mean LP-DOAS measurements. However, analyzing the relationships between the results of the observations and the wind direction was difficult due to the limited amount of data available. This can be explored in greater detail in future work.

4. Conclusions

From 15 October to 23 October 2019, we conducted aircraft emission observation experiments at Hefei Xinqiao International Airport using the developed LP-DOAS system to study the regional concentrations in the northern area of Hefei Xinqiao International Airport and the pollutant variation characteristics of various trace gases during the aircraft’s taxiing and take-off phases. The experiment indicated the following: 1. The LP-DOAS system could be safely deployed inside an airport to conduct pollutant emission experiments, and the measurement light path of the LP-DOAS system could cross both the taxiway and runway concurrently without affecting aircraft operations. 2. The nitrogen dioxide and sulfur dioxide pollution peaks were clearly found, and their timing was well matched to the time the aircraft crossed the light path. 3. While the aircraft take-offs increased the regional average NO2 concentrations by 10–20 ppbV and also increased the regional average SO2 concentrations by 1–5 ppbV, the overall pollution levels in the airport area were low due to the airport’s openness and rapid dispersion of pollutants. 4. The NO2 and SO2 emissions from the Boeing 737–800 aircraft in this experiment were weakly and positively related to the aircraft’s age. 5. Small propeller aircraft, such as the Modern Ark 60 emitted significantly less NO2 and SO2 than jet aircraft.
In future work, the LP-DOAS system could be further upgraded and improved by adding a video system to record aircraft registration and match more parameters, such as the exact time the aircraft passed through the light path, as well as the aircraft type, aircraft age, engine type, operating time, fuel consumption, and even the number of passengers carried or payload of the aircraft. The ideal remote sensing equipment would be capable of capturing pollutant data from aircraft emissions without interfering with normal airport operations and automatically matching the data to flight parameters. Additional equipment, such as FITR could also be used to collect CO2 data and to calculate pollution factors for aircraft emissions, which could then be compared to those in the ICAO database. We wish to be able to conduct automated long-term observations of aircraft pollution emissions and generate sufficient data for further analysis and exploration.
Additionally, an attempt could be made to determine engine operations via characteristic gas emission aberrations, which could be used to ensure flight safety by establishing a measurement light path on the taxiway and detecting pollutant emissions prior to the aircraft taking off or after the aircraft landing without disturbing the normal operation of the aircraft, to quickly determine the aircraft’s engine operating status. Once some gas concentration of the aircraft emissions or ratio of different gas concentrations exceeds the reasonable scope, an early warning on the aircraft safety will be provided before the aircraft take off, thus ensuring aircraft safety. Clearly, this would require us to conduct additional in-depth research.

Author Contributions

Conceptualization, J.D., M.Q. and H.G.; methodology, J.D., M.Q., W.F., P.X. and W.L.; software, J.D. and Z.L.; validation, M.Q. and H.G.; formal analysis, J.D.; investigation, J.D., M.Q., W.F., Z.L., H.G., Z.S., H.Y., F.M., D.S., J.H. and B.H.; writing—original draft preparation, J.D.; writing—review and editing, J.D. and M.Q.; visualization, J.D.; supervision, M.Q.; funding acquisition, M.Q., H.G. and J.D. All authors have read and agreed to the published version of the manuscript.

Funding

This research was funded by the National Natural Science Foundation of China (No. U2133212, No. 42175155), the Anhui Provincial Key R&D Program, China (No. 202104i07020010), and the Youth Science and Technology Talents Support Program (2020) by Anhui Association for Science and Technology (No. RCTJ202002).

Data Availability Statement

The data presented in this study are available on request from the corresponding author.

Conflicts of Interest

The authors declare no conflict of interest.

References

  1. Pison, I.; Menut, L. Quantification of the impact of aircraft traffic emissions on tropospheric ozone over Paris area. Atmos. Environ. 2004, 38, 971–983. [Google Scholar] [CrossRef]
  2. Crutzen, P.J. The role of NO and NO2 in the chemistry of the troposphere and stratosphere. Annu. Rev. Earth Planet. Sci. 1979, 7, 443. [Google Scholar] [CrossRef]
  3. Atkinson, R. Atmospheric chemistry of VOCs and NOx. Atmos. Environ. 2000, 34, 2063. [Google Scholar] [CrossRef]
  4. Finlayson-Pitts, B.J.; Pitts, J.N. Chemistry of the Upper and Lower Atmosphere: Theory, Experiments, and Applications; Elsevier: Amsterdam, The Netherlands, 2000; p. 264. [Google Scholar]
  5. Chiusolo, M.; Cadum, E.; Stafoggia, M.; Galassi, C.; Berti, G.; Faustini, A.; Bisanti, L.; Vigotti, M.A.; Dessì, M.P.; Cernigliaro, A.; et al. Short-Term Effects of Nitrogen Dioxide on Mortality and Susceptibility Factors in 10 Italian Cities: The EpiAir Study. Environ. Health Perspect. 2011, 119, 1233–1238. [Google Scholar] [CrossRef] [PubMed]
  6. Vahedpour, M.; Goodarzi, M.; Hajari, N.; Nazari, F. Theoretical study on the atmospheric formation of sulfur trioxide as the primary agent for acid rain. Struct. Chem. 2011, 22, 817–822. [Google Scholar] [CrossRef]
  7. Orellano, P.; Reynoso, J.; Quaranta, N. Short-term exposure to sulphur dioxide (SO2) and all-cause and respiratory mortality: A systematic review and meta-analysis. Environ. Int. 2021, 150, 106434. [Google Scholar] [CrossRef]
  8. Gudmundsson, S.V.; Cattaneo, M.; Redondi, R. Forecasting temporal world recovery in air transport markets in the presence of large economic shocks: The case of COVID-19. J. Air Transp. Manag. 2021, 91, 102007. [Google Scholar] [CrossRef]
  9. Carslaw, D.C.; Ropkins, K.; Laxen, D.; Moorcroft, S.; Marner, B.; Williams, M.L. Near-Field Commercial Aircraft Contribution to Nitrogen Oxides by Engine, Aircraft Type, and Airline by Individual Plume Sampling. Environ. Sci. Technol. 2008, 42, 1871–1876. [Google Scholar] [CrossRef] [PubMed]
  10. Schafer, K.; Jahn, C.; Sturm, P.; Lechner, B.; Bacher, M. Aircraft emission measurements by remote sensing methodologies at airports. Atmos. Environ. 2003, 37, 5261–5271. [Google Scholar] [CrossRef]
  11. Herndon, S.C.; Shorter, J.H.; Zahniser, M.S.; Nelson, D.D.; Jayne, J.; Brown, R.C.; Miake-Lye, R.C.; Waitz, I.; Silva, P.; Lanni, T.; et al. NO and NO2 Emission Ratios Measured from In-Use Commercial Aircraft during Taxi and Takeoff. Environ. Sci. Technol. 2004, 38, 6078–6084. [Google Scholar] [CrossRef] [PubMed]
  12. Herndon, S.C.; Jayne, J.T.; Lobo, P.; Onasch, T.B.; Fleming, G.; Hagen, D.E.; Whitefield, P.D.; Miake-Lye, R.C. Commercial aircraft engine emissions characterization of in-use aircraft at Hartsfield-Jackson Atlanta International Airport. Environ. Sci. Technol. 2008, 42, 1877–1883. [Google Scholar] [CrossRef] [PubMed]
  13. Herndon, S.C.; Wood, E.C.; Northway, M.J.; Miake-Lye, R.; Thornhill, L.; Beyersdorf, A.; Anderson, B.E.; Dowlin, R.; Dodds, W.; Knighton, W.B. Aircraft Hydrocarbon Emissions at Oakland International Airport. Environ. Sci. Technol. 2009, 43, 1730–1736. [Google Scholar] [CrossRef]
  14. Hu, S.; Fruin, S.; Kozawa, K.; Mara, S.; Winer, A.M.; Paulson, S.E. Aircraft Emission Impacts in a Neighborhood Adjacent to a General Aviation Airport in Southern California. Environ. Sci. Technol. 2009, 43, 8039–8045. [Google Scholar] [CrossRef] [PubMed]
  15. Ionel, I.; Nicolae, D.; Popescu, F.; Talianu, C.; Belegante, L.; Apostol, G. Measuring air pollutants in an international Romania airport with point and open path instruments. Rom. J. Phys. 2011, 56, 507–519. [Google Scholar]
  16. Kesgin, U. Aircraft emissions at Turkish airports. Energy 2006, 31, 372–384. [Google Scholar] [CrossRef]
  17. Mazaheri, M.; Johnson, G.R.; Morawska, L. An inventory of particle and gaseous emissions from large aircraft thrust engine operations at an airport. Atmos. Environ. 2011, 45, 3500–3507. [Google Scholar] [CrossRef]
  18. Winther, M.; Kousgaard, U.; Ellermann, T.; Massling, A.; Nøjgaard, J.K.; Ketzel, M. Emissions of NOx, particle mass and particle numbers from aircraft main engines, APU’s and handling equipment at Copenhagen Airport. Atmos. Environ. 2015, 100, 218–229. [Google Scholar] [CrossRef]
  19. Zhou, Y.; Jiao, Y.; Lang, J.; Chen, D.; Huang, C.; Wei, P.; Li, S.; Cheng, S. Improved estimation of air pollutant emissions from landing and takeoff cycles of civil aircraft in China. Environ. Pollut. 2019, 249, 463–471. [Google Scholar] [CrossRef]
  20. Zaporozhets, O.; Synylo, K. Improvements on aircraft engine emission and emission inventory asesessment inside the airport area. Energy 2017, 140, 1350–1357. [Google Scholar] [CrossRef]
  21. Turgut, E.T.; Rosen, M.A. Assessment of emissions at busy airports. Int. J. Energy Res. 2010, 34, 800–814. [Google Scholar] [CrossRef]
  22. Masiol, M.; Harrison, R.M. Aircraft engine exhaust emissions and other airport-related contributions to ambient air pollution: A review. Atmos. Environ. 2014, 95, 409–455. [Google Scholar] [CrossRef]
  23. Popp, P.J.; Bishop, G.A.; Stedman, D.H. Method for Commercial Aircraft Nitric Oxide Emission Measurements. Environ. Sci. Technol. 1999, 33, 1542–1544. [Google Scholar] [CrossRef]
  24. Schürmann, G.; Schafer, K.; Jahn, C.; Hoffmann, H.; Bauerfeind, M.; Fleuti, E.; Rappengluck, B. The impact of NOx, CO and VOC emissions on the air quality of Zurich airport. Atmos. Environ. 2007, 41, 103–118. [Google Scholar] [CrossRef]
  25. Qing, X.; Hongfu, Z.; Juan, X. Remote Sensing of Aircraft Engine Exhausts Using FTIR-emission-spectroscopy. Acta Aeronaut. Astronaut. Sin. 2009, 30, 837–841. [Google Scholar]
  26. Xin, H.; Xiangxian, L.; Minguang, G.; Xiuli, W.; Jingjing, T.; Sheng, L.; Shubin, Y.; Yan, L. Monitoring and analyzing VOCs pollution emissions in airport with SOF-FTIR. Chin. J. Quantum Electron. 2019, 36, 101–107. [Google Scholar]
  27. Platt, U.; Stutz, J. Differential Optical Absorption Spectroscopy; Springer: Berlin/Heidelberg, Germany, 2008; pp. 2458–2462. [Google Scholar]
  28. Qin, M.; Xie, P.; Su, H.; Gu, J.; Peng, F.; Li, S.; Zeng, L.; Liu, J.; Liu, W.; Zhang, Y. An observational study of the HONO-NO2 coupling at an urban site in Guangzhou City, South China. Atmos. Environ. 2009, 43, 5731–5742. [Google Scholar] [CrossRef]
  29. Lu, X.; Qin, M.; Xie, P.; Shen, L.; Duan, J.; Liang, S.; Fang, W.; Liu, J.; Liu, W. Ambient BTX Observation nearby Main Roads in Hefei during Summer Time. Aerosol Air Qual. Res. 2017, 17, 933–943. [Google Scholar] [CrossRef]
  30. Nasse, J.M.; Eger, P.G.; Pohler, D.; Schmitt, S.; Friess, U.; Platt, U. Recent improvements of long-path DOAS measurements: Impact on accuracy and stability of short-term and automated long-term observations. Atmos. Meas. Tech. 2019, 12, 4149–4169. [Google Scholar] [CrossRef]
  31. Islam, M.; Ciaffoni, L.; Hancock, G.; Ritchie, G.A.D. Demonstration of a novel laser-driven light source for broadband spectroscopy between 170 nm and 2.1 μm. Analyst 2013, 138, 4741–4745. [Google Scholar] [CrossRef]
  32. Voigt, S.; Orphal, J.; Burrows, J.P. The temperature and pressure dependence of the absorption cross-sections of NO2 in the 250–800 nm region measured by Fourier-transform spectroscopy. J. Photochem. Photobiol. A Chem. 2002, 149, 1–7. [Google Scholar] [CrossRef]
  33. Vandaele, A.C.; Simon, P.C.; Guilmot, J.M.; Carleer, M.; Colin, R. SO2 absorption cross section measurement in the UV using a Fourier transform spectrometer. J. Geophys. Res. Atmos. 1994, 99, 25599–25605. [Google Scholar] [CrossRef]
  34. Voigt, S.; Orphal, J.; Bogumil, K.; Burrows, J.P. The temperature dependence (203–293 K) of the absorption cross sections of O3 in the 230-850 nm region measured by Fourier-transform spectroscopy. J. Photochem. Photobiol. A Chem. 2001, 143, 1–9. [Google Scholar] [CrossRef]
  35. Yang, X.; Cheng, S.; Wang, G.; Xu, R.; Wang, X.; Zhang, H.; Chen, G. Characterization of volatile organic compounds and the impacts on the regional ozone at an international airport. Environ. Pollut. 2018, 238, 491–499. [Google Scholar] [CrossRef] [PubMed]
  36. Valotto, G.; Varin, C. Characterization of hourly NOx atmospheric concentrations near the Venice International Airport with additive semi-parametric statistical models. Atmos. Res. 2016, 167, 216–223. [Google Scholar] [CrossRef]
Figure 1. Schematic of the LP-DOAS instrument.
Remotesensing 14 03927 g001
Figure 2. (a) The location of Hefei Xinqiao International Airport. (b) The measurement site. (c) Photograph of the integrated transmitter/receiver telescope. (d) Photograph of the array of quartz corner cube retroreflectors.
Remotesensing 14 03927 g002
Figure 3. Photographs of the measurement field. These photographs were captured in front of the retroreflectors array (the location was at point B in Figure 2b).
Remotesensing 14 03927 g003
Figure 4. Example of measured (grey line) and fitted absorption spectra (red line) of NO2, SO2, and O3 measured on 17 October 2019.
Remotesensing 14 03927 g004
Figure 5. Temporal variation in the concentrations of NO2, SO2, and O3 between 15:35 and 16:45 on 17 October 2019.
Remotesensing 14 03927 g005
Figure 6. One-hour mean concentrations of NO2 and SO2 measured by LP-DOAS instrument.
Remotesensing 14 03927 g006
Figure 7. Linear dependence of the measured NO2 and SO2 peak heights on the aircraft age for 737–800 aircraft.
Remotesensing 14 03927 g007
Figure 8. Boxplots of NO2 and SO2 peak heights for aircraft emissions data for various aircraft types.
Remotesensing 14 03927 g008
Table 1. Results for the Boeing 737–800 aircraft.
Flight NumberNO2 Peak Height Taxi Out (ppbV)NO2 Peak Height Take Off (ppbV)SO2 Peak Height Taxi Out (ppbV)SO2 Peak Height Take Off (ppbV)Age of Aircraft (Year)
ZH97106.813.90.741.051.5
HU74418.722.20.742.0619.5
CA12568.716.40.921.4611.3
CA12569.122.00.812.1211.3
Y875959.322.20.461.202.1
KN58787.715.12.995.659.0
HU769210.619.50.721.307.6
HU76929.016.60.691.092.3
SC887910.617.00.741.095.1
SC88797.616.00.551.013.9
SC887910.315.80.530.684.5
HU74687.916.31.082.235.0
HU74687.514.40.631.231.1
HU74686.414.80.671.034.9
HU74688.024.91.421.671.1
HU74419.720.70.611.6114.3
Y8759510.016.00.571.022.1
Y875958.918.70.480.912.1
Y8759510.416.80.581.117.3
Y875957.315.40.411.177.3
ZH971010.616.60.610.954.3
HU72098.618.70.531.2114.3
KN58787.821.92.515.295.3
DZ63439.615.90.531.040.8
DR659210.217.60.551.162.1
CZ36659.110.61.000.791.4
ZH971911.117.00.510.746.0
CA89337.016.40.470.981.4
HU720912.116.30.861.205.0
HU72098.112.00.811.043.8
ZH97107.213.30.941.166.2
HU74419.111.70.751.065.3
CA125612.814.41.191.376.5
SC87968.416.60.570.837.8
SC879613.015.20.951.2611.3
SC873511.419.20.841.586.3
SC87968.319.60.801.296.0
ZH97106.320.80.561.241.5
SC88796.612.10.600.973.3
8L98627.118.70.571.133.1
CA12568.618.30.651.672.9
HU744112.518.10.901.311.1
HU74739.811.70.931.294.1
SC887910.416.10.271.175.1
HU76929.913.90.550.951.6
HU75729.512.10.560.874.3
HU72098.913.80.420.973.3
Table 2. Identical aircraft emissions data with different meteorological conditions.
Flight NumberAircraft TypeAircraft’s AgeMeasurement TimeWind SpeedWind DirectionTime IntervalNO2 Peak Height
SC8879737–8005.1 years16 Oct 2019 16:152 m/s330°192 s16.1 ppbV
21 Oct 2019 15:533 m/s100°184 s17.0 ppbV
Y87595737–8007.3 years23 Oct 2019 15:471 m/s90°196 s15.4 ppbV
21 Oct 2019 16:062 m/s100°152 s16.8 ppbV
Y87595737–8002.1 years19 Oct 2019 15:532 m/s140°180 s16.0 ppbV
20 Oct 2019 15:503 m/s150°172 s18.7 ppbV
8L9862320–251N1.3 years23 Oct 2019 11:251 m/s192 s20.1 ppbV
17 Oct 2019 14:222 m/s330°160 s22.6 ppbV
Publisher’s Note: MDPI stays neutral with regard to jurisdictional claims in published maps and institutional affiliations.

