1. Introduction
Landslides are one of the most common natural disasters in mountainous areas, frequently resulting in significant property damage and casualties, particularly the thousands of landslide disasters caused by major earthquakes, which are more severe [
1,
2]. In Wenchuan County, Sichuan Province, China, on 12 May 2008, a powerful 8.0 magnitude earthquake devastated Yingxiu town. The epicenter of this strong earthquake was situated in the middle and high mountains of the western Sichuan basin, where the geological environment is quite fragile, resulting in the occurrence of numerous geological hazards, such as seismic landslides, mudslides, and hillside collapses [
1]. A large number of landslides were caused by the Wenchuan earthquake, and these landslides directly caused the deaths of nearly 20,000 people [
3]. Because of the serious threat posed by seismic landslides to people’s lives and properties, as well as public safety, the rapid and automatic extraction of sudden landslides has become a hot topic in landslide research around the world [
4,
5,
6]. The area, scale, and distribution of seismic landslides are determined by analyzing the morphology and characteristics of seismic landslide areas. It is crucial for disaster relief, mitigation, planning, and construction in the affected areas to quickly and accurately identify the location information of seismic landslides and implement targeted relevant measures in order to effectively reduce the damage caused by seismic landslides.
In early research, the majority of landslide detection and boundary extraction relied on the manual interpretation method [
7,
8,
9], which has high accuracy. However, when the treated area is large or the disaster is urgent, the manual interpretation of landslides has issues such as a large workload, a long time to complete, and low efficiency, which is not conducive to the rapid extraction of large-scale landslide hazards after the disaster [
10]. Additionally, because test results are subject to individual subjectivity, they will not be of the same standard if different persons interpret different areas [
11].
Numerous automatic picture recognition approaches have been used to automatically detect landslides in the context of the quick development of information extraction technology. Many researchers have begun to use machine learning and deep learning algorithms for landslide detection due to the rapid development of these techniques. These algorithms include support vector machines (SVM), random forests (RF), artificial neural networks (ANN), decision trees (DT), convolutional neural networks (CNN), region-CNN (R-CNN), faster R-CNN, and others [
12,
13,
14,
15]. Gaelle Danneels et al. [
16] used maximum likelihood classification and ANN classification methods to detect landslides from ASTER imagery automatically. Omid Ghorbanzadeh et al. [
17] combined the ResU-Net model and the Object-Based Image Analysis (OBIA) method for landslide detection and compared the classification results with ResU-Net alone, and the proposed method improved the average intersection-bonding of maps obtained by ResU-Net by more than 22%. Faster R-CNN and the U-Net algorithm were employed by HuajinLi et al. [
18] to locate landslides in large-scale satellite pictures, and they demonstrated that the suggested framework provided more precise segmentation of loess landslides than frameworks like Fully Convolutional Networks (FCN) and U-Net. ANN, SVM, RF, and CNN were utilized by Omid Ghorbanzadeh et al. [
19] to perform landslide detection using optical data from the Rapid Eye satellite, and the results of these algorithms were assessed.
Deep learning applied to landslide detection has the advantages of fast detection, high automation, and low cost [
20,
21]. However, this kind of technology needs a lot of image data, and obtaining high-resolution data for natural hazard studies is costly and inconvenient, which makes it difficult to detect earthquakes quickly after their occurrence [
15]. Transfer learning can help the learning process in new domains by using the “knowledge” gained from earlier tasks, such as data features and model parameters, which lowers the cost of gathering training data and boosts the effectiveness of model applications [
22].
In conclusion, this study employs an improved Mask R-CNN algorithm, transfer learning for model training, and approaches for data augmentation to increase the sample size and automatically detect landslides from a small sample of post-earthquake UAV footage. Then, using transfer learning, the trained model is used to identify the landslide caused by the Haiti earthquake.
The main objectives of this paper are as follows:
Develop an earthquake landslide remote sensing recognition model with some generalizability;
To test the generalizability of the model, the trained model is used to extract data on seismic landslide hazards in untrained areas.
The following are this paper’s significant innovations and contributions:
The Mask R-CNN technique is improved to increase model generalization on post-earthquake photos as well as the precision of landslide recognition;
The training model finished on Wenchuan UAV images is applied to seismic landslide recognition on post-earthquake satellite imagery of Haiti using transfer learning.
The remaining portions of the paper are structured as follows:
Section 2 provides details on the experimental process, the improved Mask R-CNN model’s framework, the experimental parameter settings, and the accuracy metrics.
Section 3 describes the experimental results, comparing and analyzing the recognition results, performance and transferability of the different models.
Section 4 compares the paper’s major works and innovations to other researchers’ discoveries. Finally,
Section 5 summarizes the work and main results of the study, analyses the shortcomings of the study, and provides an outlook for future work.
2. Methods
2.1. Data
2.1.1. Study Area
Because the Wenchuan earthquake caused a huge number of landslides, and we now have the results of the manual interpretation of the seismic landslides. The data sample is also rich and simple to collect. We chose UAV images of Wenchuan County taken after the 12 May 2008 Wenchuan earthquake to evaluate the efficacy of the proposed approach. These images include a large number of seismic landslides with a data resolution of 0.25 m. The location of the study area is shown in
Figure 1.
The study area has a total area of 4084 km
2 and is situated in Wenchuan County, Aba Tibetan and Qiang Autonomous Prefecture, Sichuan Province. It is located within 102°51′ E~103°44′ E and 30°45′ N~31°43′ N. This study area is situated in a valley between high and low mountains, with an overall undulating topography and an elevation trend that is high in the north and low in the south, as well as high in the west and low in the east, in which the highest elevation in the study area is 6100 m while the lowest elevation is only 786 m. The study area’s stratigraphic lithology is primarily composed of granite, syenite, and amphibolite. The environment and seismic hazards have an impact on the surface rocks, causing the structure to break down and a large number of collapses and landslides to occur one after another. This results in the formation of a lot of loose solid material in the study area, which creates an ideal environment for the development of geological hazards such as landslides. With an average annual rainfall of 826 mm to 1049 mm, the study area’s temperate monsoon climate and abundant rainfall during the rainy season create ideal conditions for the emergence of landslides and other geological hazards. Meanwhile, this region is situated in the Beichuan to Yingxiu fault zone, which has been proven to be the seismogenic fault of the Wenchuan earthquake, which is part of the Longmenshan active fault zone. The Wenchuan earthquake was caused by the sudden release of the accumulated energy in the Beichuan to Yingxiu zone of the Longmenshan thrust tectonic zone, which was brought on by the continuous Northeast compression of the Indian plate, the long-term accumulation of tectonic stresses on the eastern edge of the Tibetan Plateau, the East compression along the Longmenshan tectonic zone, and the blockage of the Sichuan Basin [
23].
2.1.2. Dataset Production
This study used data from an SF-300 UAV equipped with a Canon EOS 5D Mark II camera that was flown over Wenchuan County in Sichuan Province, China, on 15 August 2010 at an average altitude of 2000 m, three RGB channels, a spatial resolution of 0.25 m, and an image size of 5616 × 3744 pixels.
This study pre-processed the training data and developed a dataset of UAV seismic landslide photos in COCO format. First, to ensure that the training dataset is roughly balanced, images are filtered based on image sharpness and the number of landslides on the graph. Since there were not many images, they were chosen by hand. We made an effort to choose images that had a good balance of pixels from landslides and non-landslides (foreground and background), with an average pixel ratio of roughly 55:45. There were two more pre-processing stages carried out after the selection of the photographs:
- (1)
Resizing the image to reduce complexity: the resized image is 512 × 512 pixels;
- (2)
Data annotation: this paper uses the Labelme annotator (from the Python library) to define the seismic landslides in the image and add textual descriptions to these seismic landslides, as shown in
Figure 2.
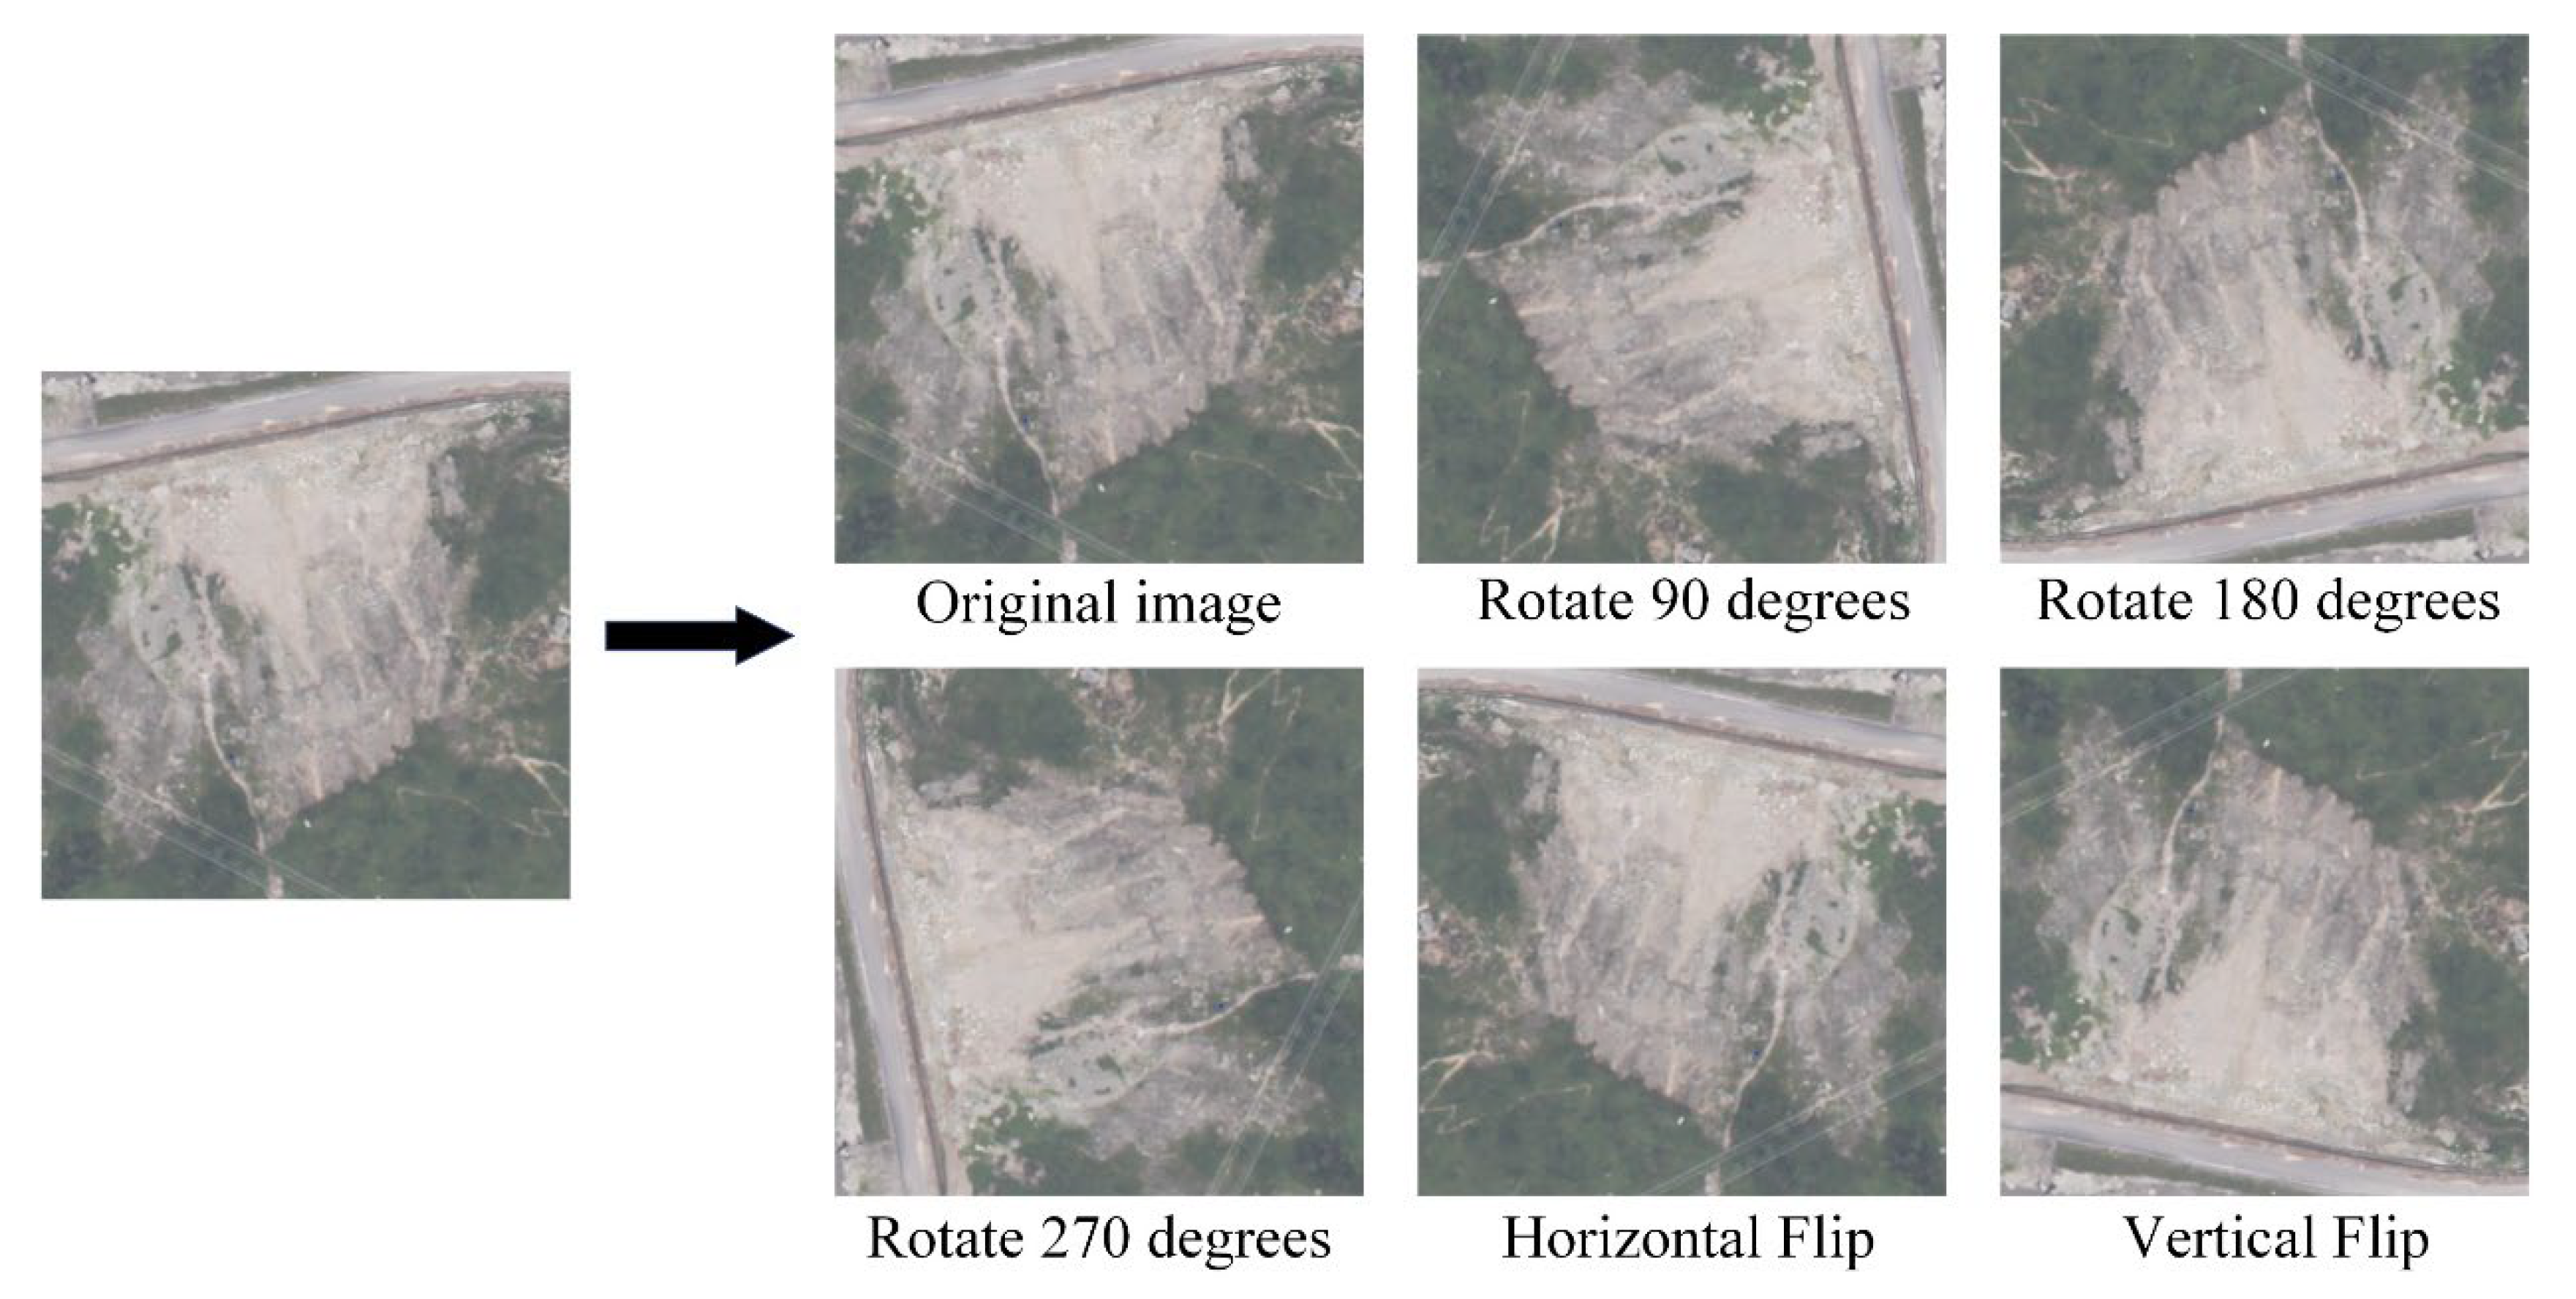
2.1.3. Dataset Augmentation
Due to the short number of image samples used in this experiment, image data augmentation was necessary to increase the number of training photos, avoid overfitting by changing the tiny dataset to include features from large data, and optimize the deep learning algorithm’s training adaption [
24]. For image data augmentation in this study, image rotation and image flip are used (as shown in
Figure 3). The three basic rotational processing techniques for images are 90, 180, and 270 degrees, whereas image flip involves flipping the images horizontally and up and down.
After data augmentation, 852 landslide-containing images were obtained and split into three sets: a training set, a validation set, and a test set, with the ratio being 7:2:1. The training set is used to train the model, the validation set is used to validate the model during training, and the test set is used to assess the model. The specific values of the dataset division are shown in
Table 1.
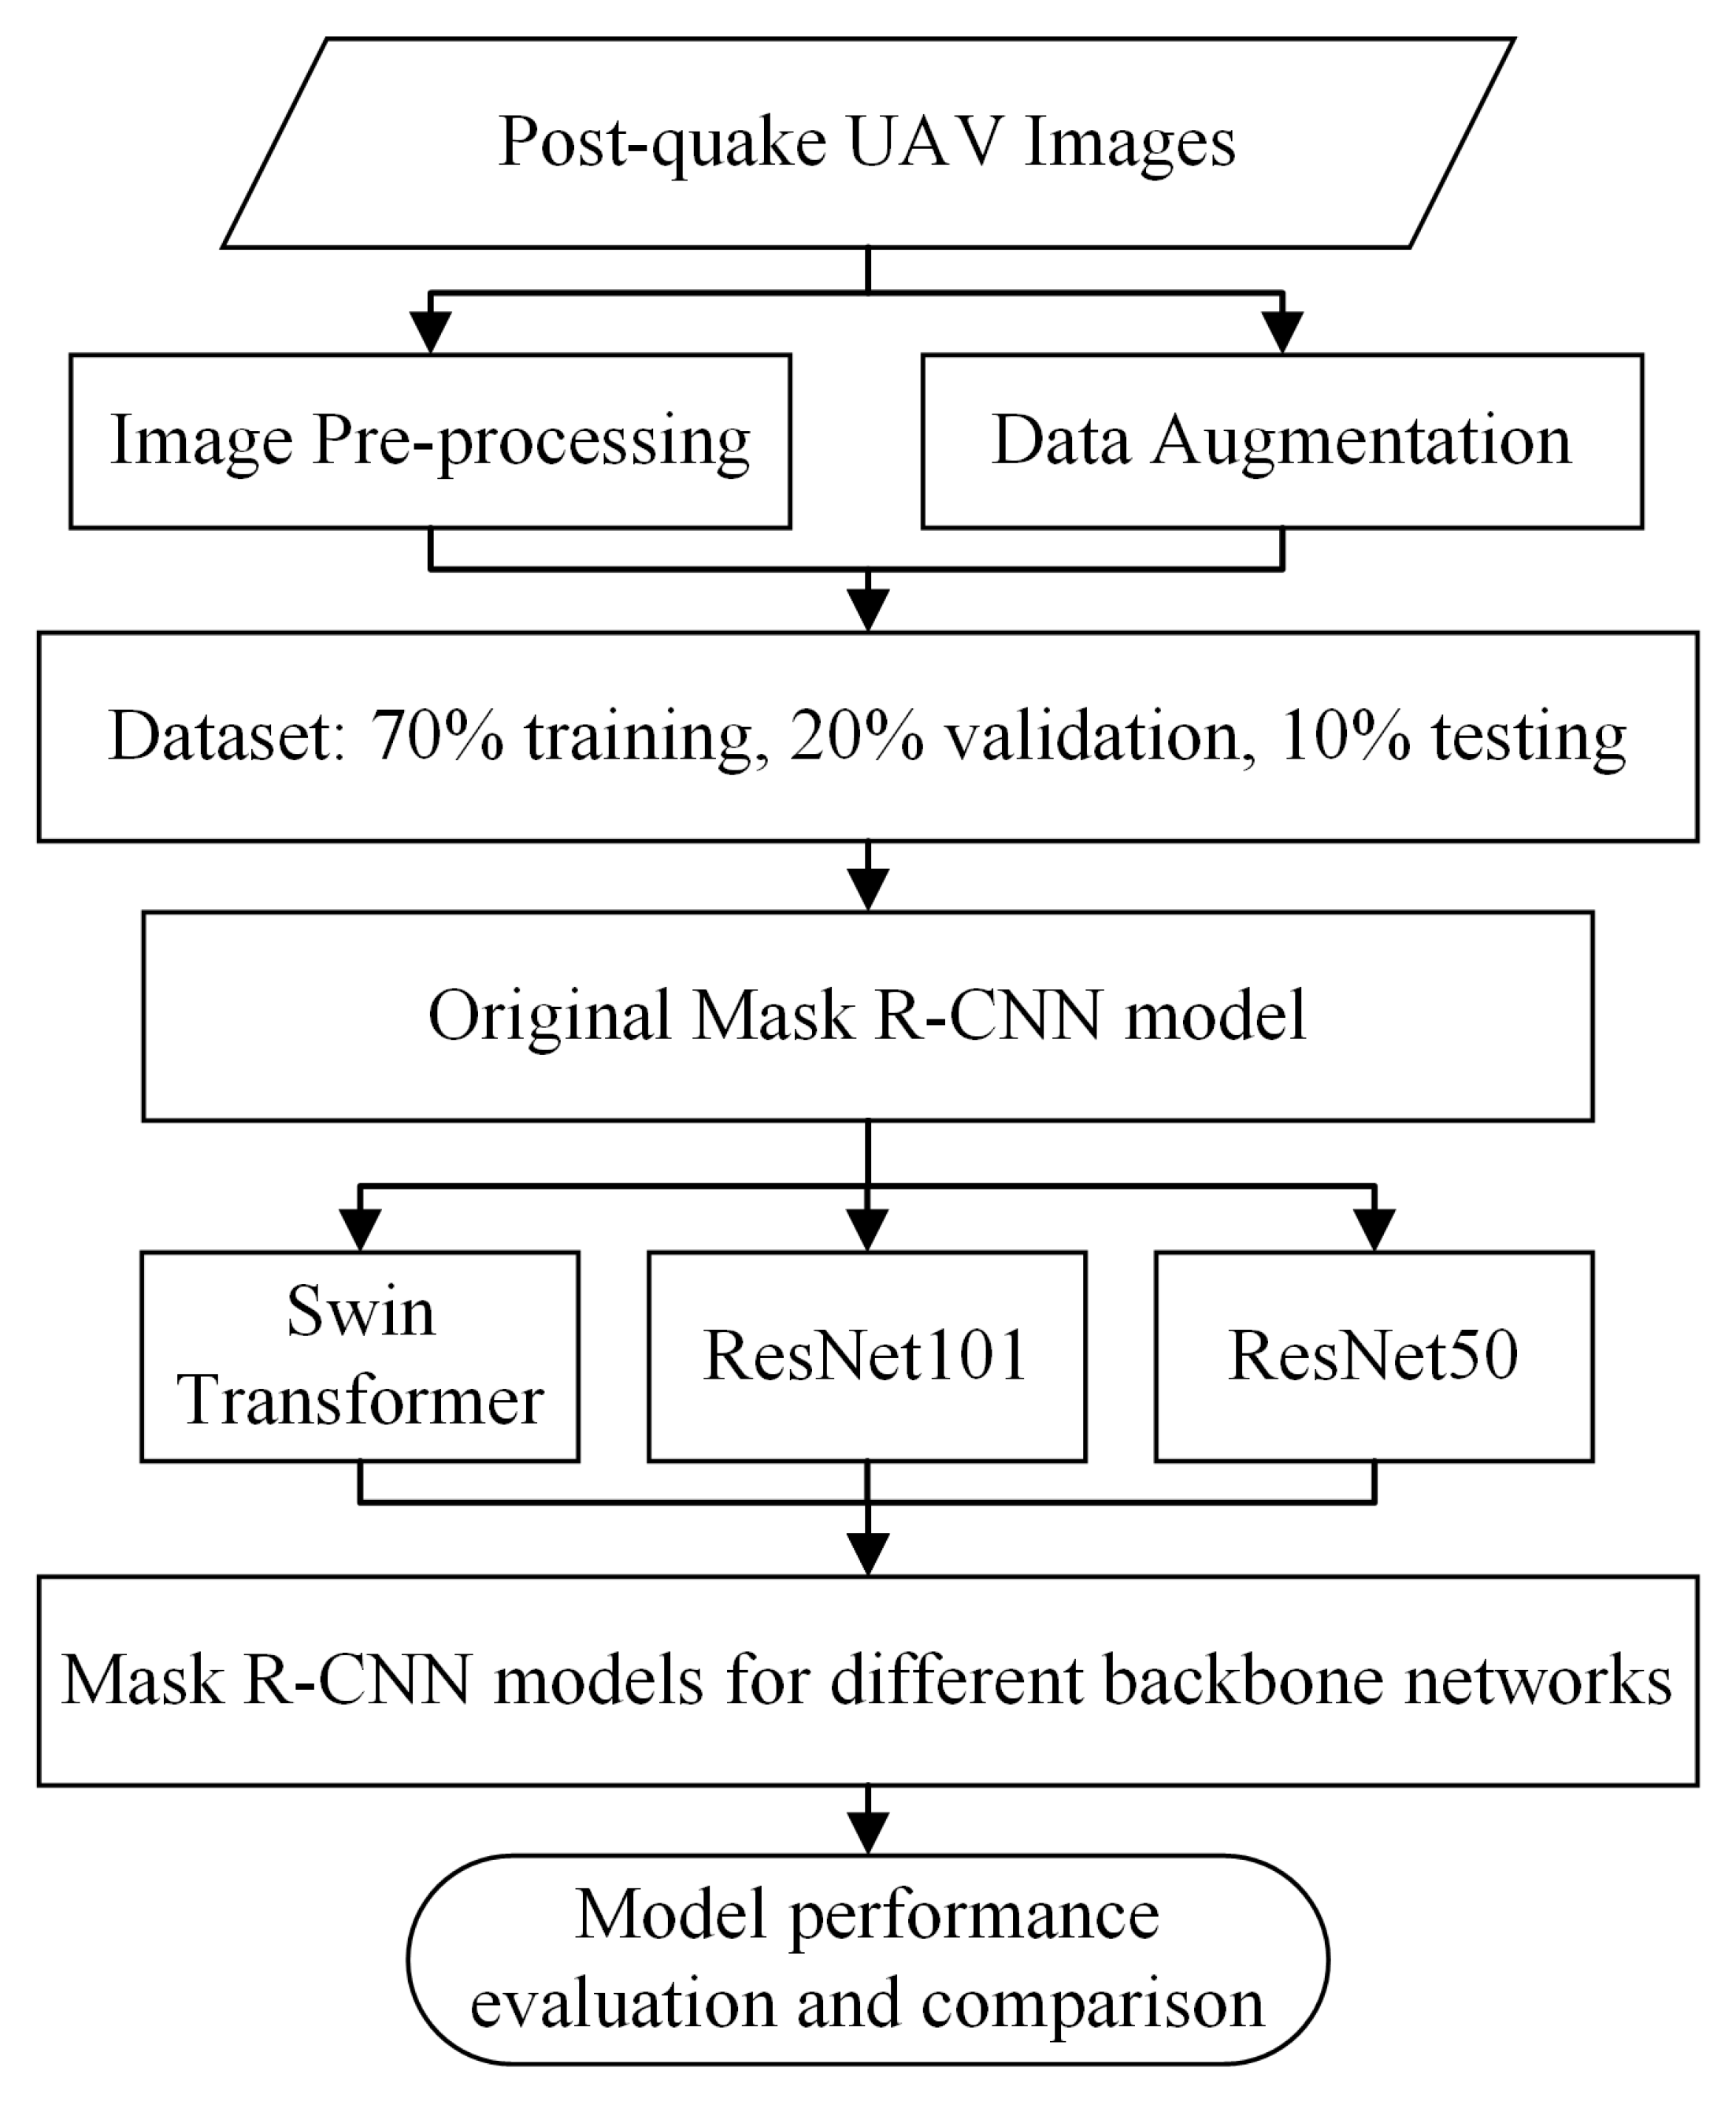
2.2. Methodology Flow
In this study, we employ transfer learning to enhance the generalization and robustness of the Mask R-CNN model, which is the principal model for landslide identification based on seismic landslide photos captured by UAVs.
The following steps are primarily involved in the seismic landslide detection process: data gathering and processing, dataset production and augmentation, landslide detection, and accuracy evaluation. In
Figure 4, the methodology flow is displayed.
2.3. Transfer Learning
Both landslide identification and landslide prediction have been successful when using deep learning. However, gathering the necessary training data is frequently challenging in real-world situations, and insufficient datasets frequently cause experimental results to be overfitting. The amount of training data required in such circumstances can be decreased by using transfer learning.
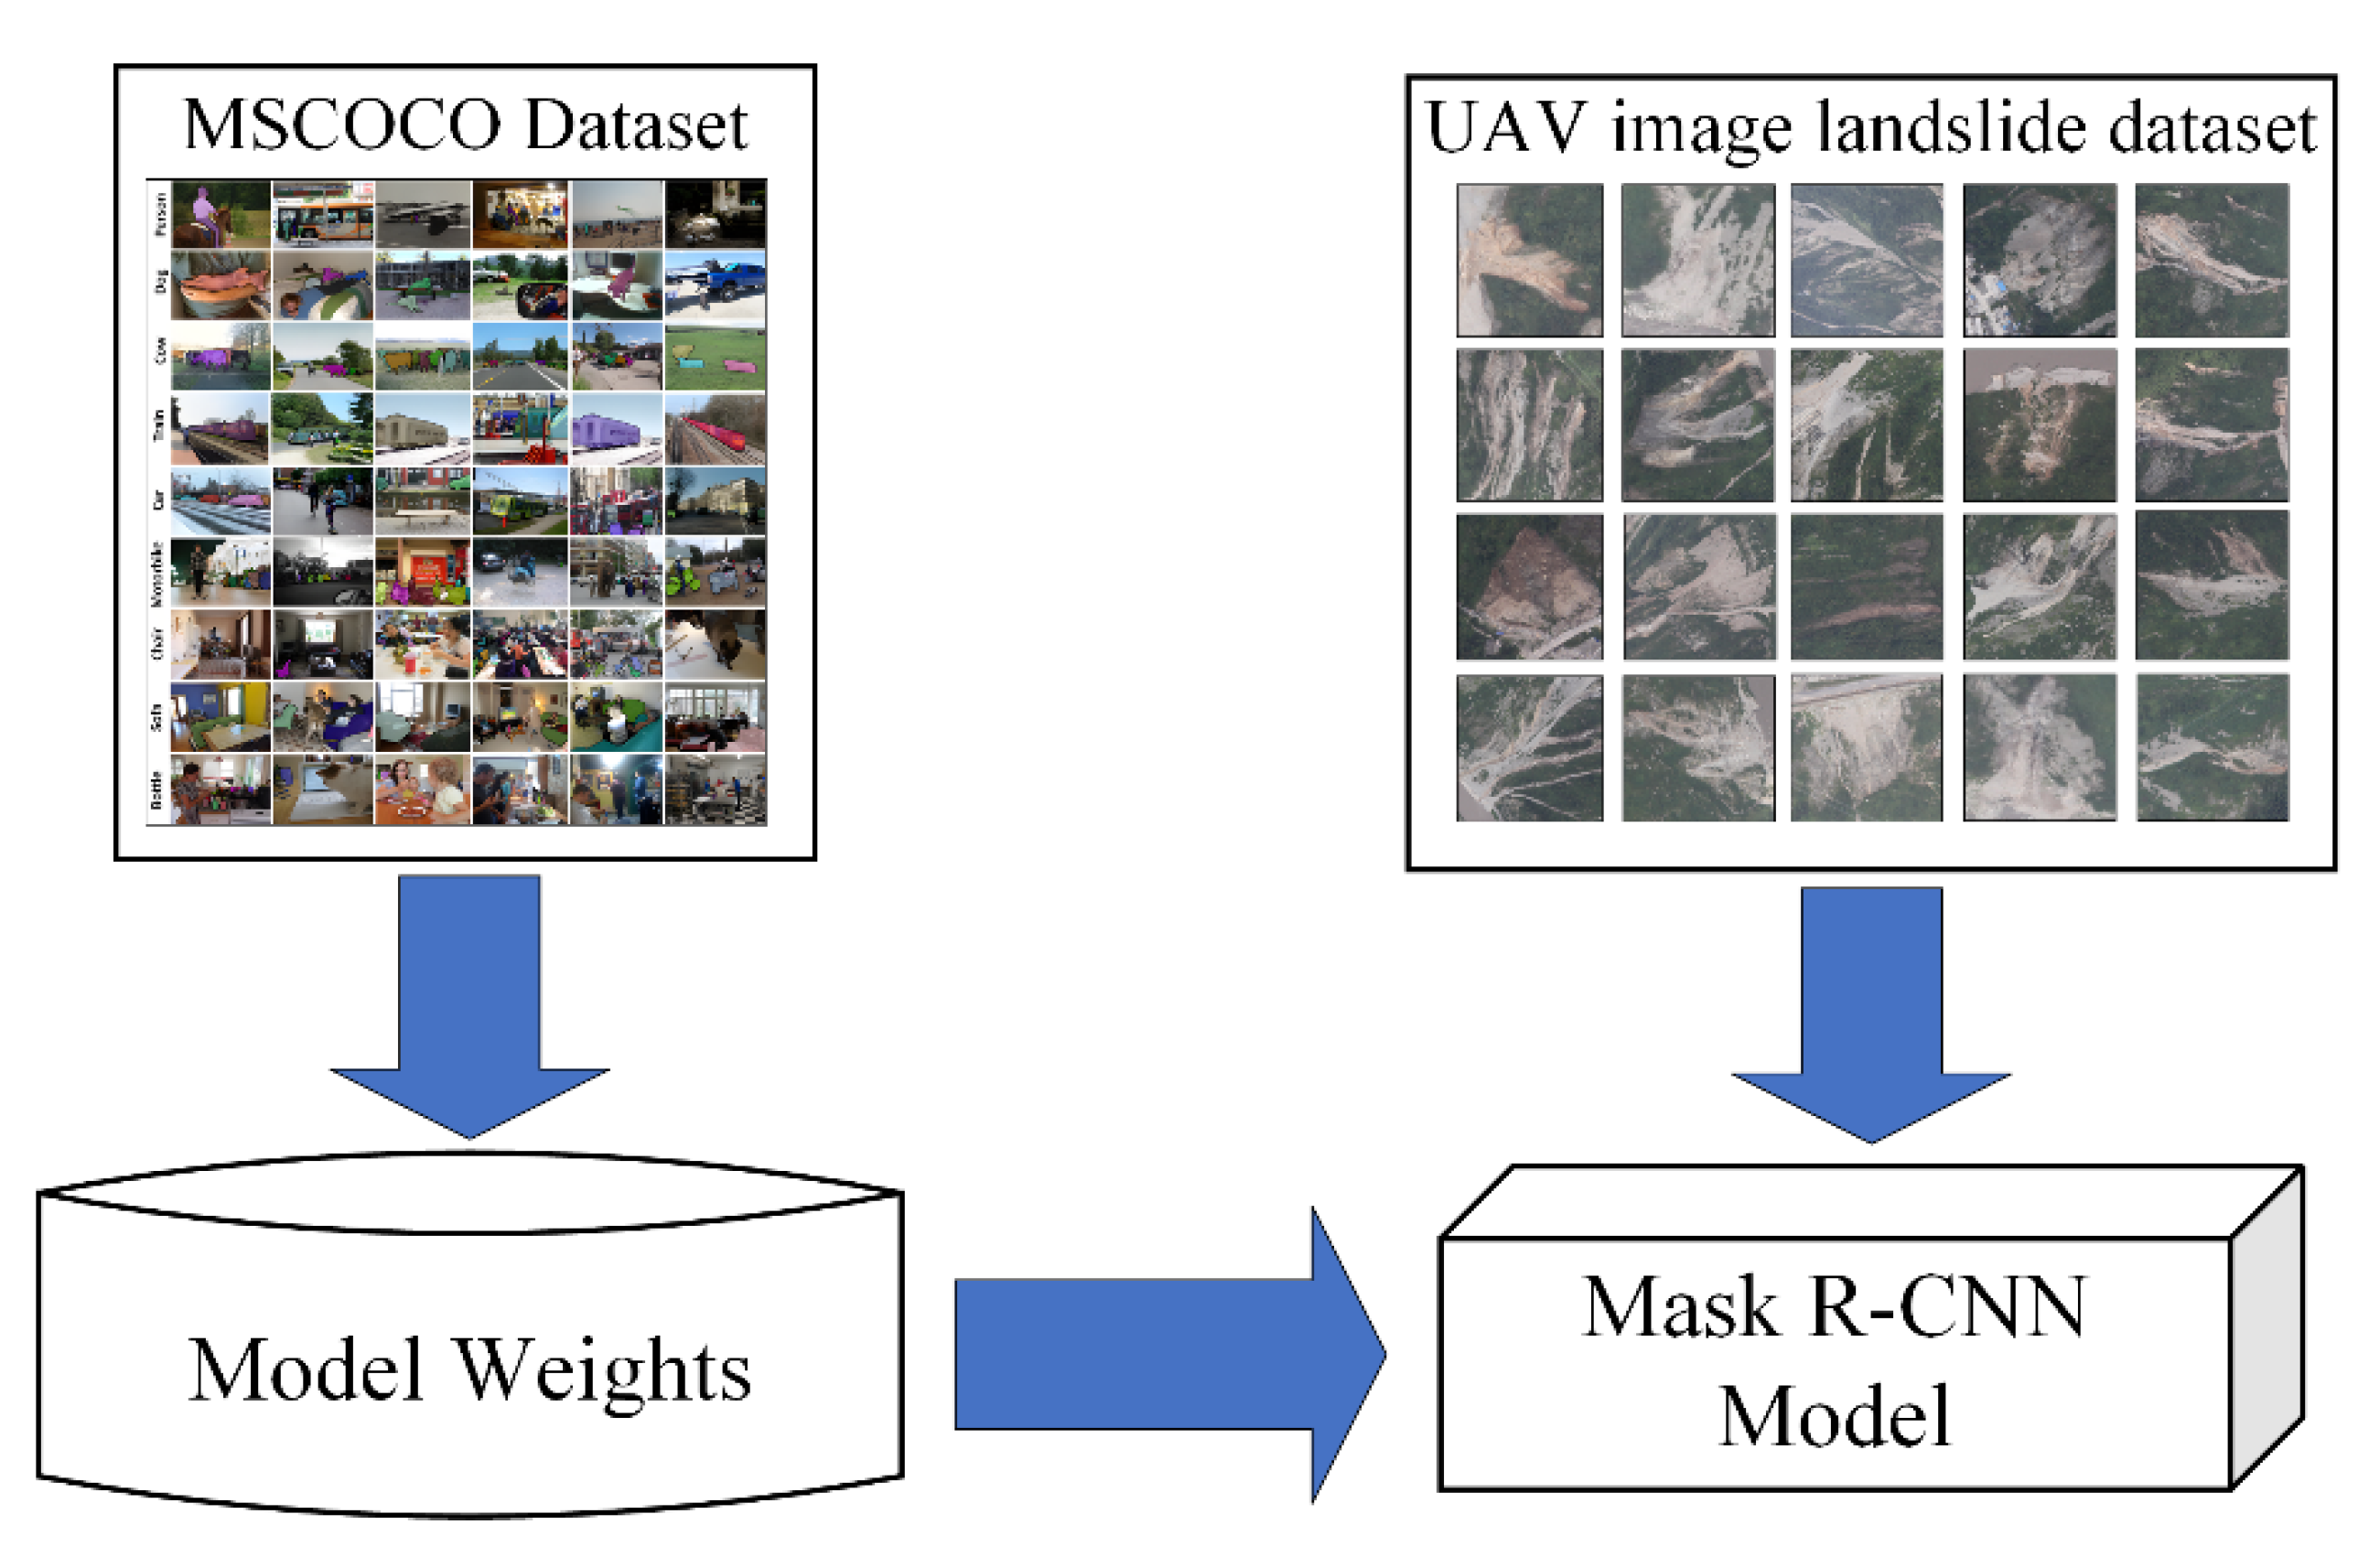
When there is a lack of training data for the target task, transfer learning approaches can transfer information from some prior tasks to the target task [
25]. As illustrated in
Figure 5, the primary goal of employing transfer learning in this research is to increase experiment accuracy by transferring information from the Microsoft Common Objects in Context (MS COCO) dataset [
26], which has a vast quantity of data, to a smaller landslide dataset. The model files for this experiment were pre-trained with the MSCOCO dataset and can be downloaded at this URL
https://github.com/facebookresearch/detectron2/blob/main/MODEL_ZOO.md (accessed on 4 July 2022) to further reduce training time.
2.4. ResNet
Kaiming He et al. [
27] from Microsoft Research introduced ResNet (Residual Neural Network), successfully training a 152-layer neural network by using the ResNet Unit and taking first place in the ILSVRC 2015 competition despite using fewer parameters than VGGNet [
28].
ResNet is made up of a residual structure, the basic concept of which is to expand the network by adding directly connected channels, or the Highway Network concept [
29]. The performance input was transformed nonlinearly in the prior network structure, whereas the Highway Network permitted some of the output from the earlier network layers to be kept.
ResNet can be built using a variety of layer counts; the most popular ones are 50, 101, and 152 layers. All of these layer counts are achieved by stacking the aforementioned residual modules together. For this experiment, ResNet50 and ResNet101 were employed. Convolutional neural networks in ResNet50 and ResNet101 feature 50 and 101 layers, respectively.
2.5. Swin Transformer
Han Hu et al. from Microsoft Research made the Swin Transformer network proposal in 2021 [
30], and their research got the best paper award at the 2021 ICCV. The Swin Transformer network has supplanted the traditional CNN architecture as the standard backbone in computer vision, outperforming backbone networks such as DeiT [
31], ViT [
32], and EfficientNet [
33]. Based on the concept of the ViT model, the Swin Transformer ingeniously offers a sliding window technique that enables the model to learn data across windows. The model can handle super-resolution images thanks to the down-sampling layer, which also reduces computing work and frees it up to concentrate on global and local information. A hierarchical feature structure and linear computational complexity to image size are two characteristics of the Swin Transformer. Due to these characteristics, the model can be applied to a wide range of vision tasks. In vision tasks including target detection and picture segmentation, the Swin Transformer has achieved SOTA (state-of-the-art) results.
2.6. Mask R-CNN
The Mask R-CNN [
34] framework consists of two stages: the first stage scans the image and produces proposals (regions that are likely to contain a target), and the second stage categorizes the proposals and produces bounding boxes and masks. The Mask R-CNN is expanded by the Faster R-CNN. The target detection framework Faster R-CNN is widely used [
35], and Mask R-CNN expands it to include instance segmentation. The Mask R-CNN network structure is shown in
Figure 6.
The Mask R-CNN extends the Faster R-CNN by adding a parallel branch to the existing boundary box recognition to predict the target’s mask. Using the FCN to combine segmentation and classification undermines the effectiveness of instance segmentation, according to the original Mask R-CNN paper. Therefore, Mask R-CNN uses the FCN to predict a Concrete Boundary for each category independently and relies on a different branch of the network to obtain the category and Boundary Box, as opposed to deriving the Boundary Box from the Concrete Boundary.
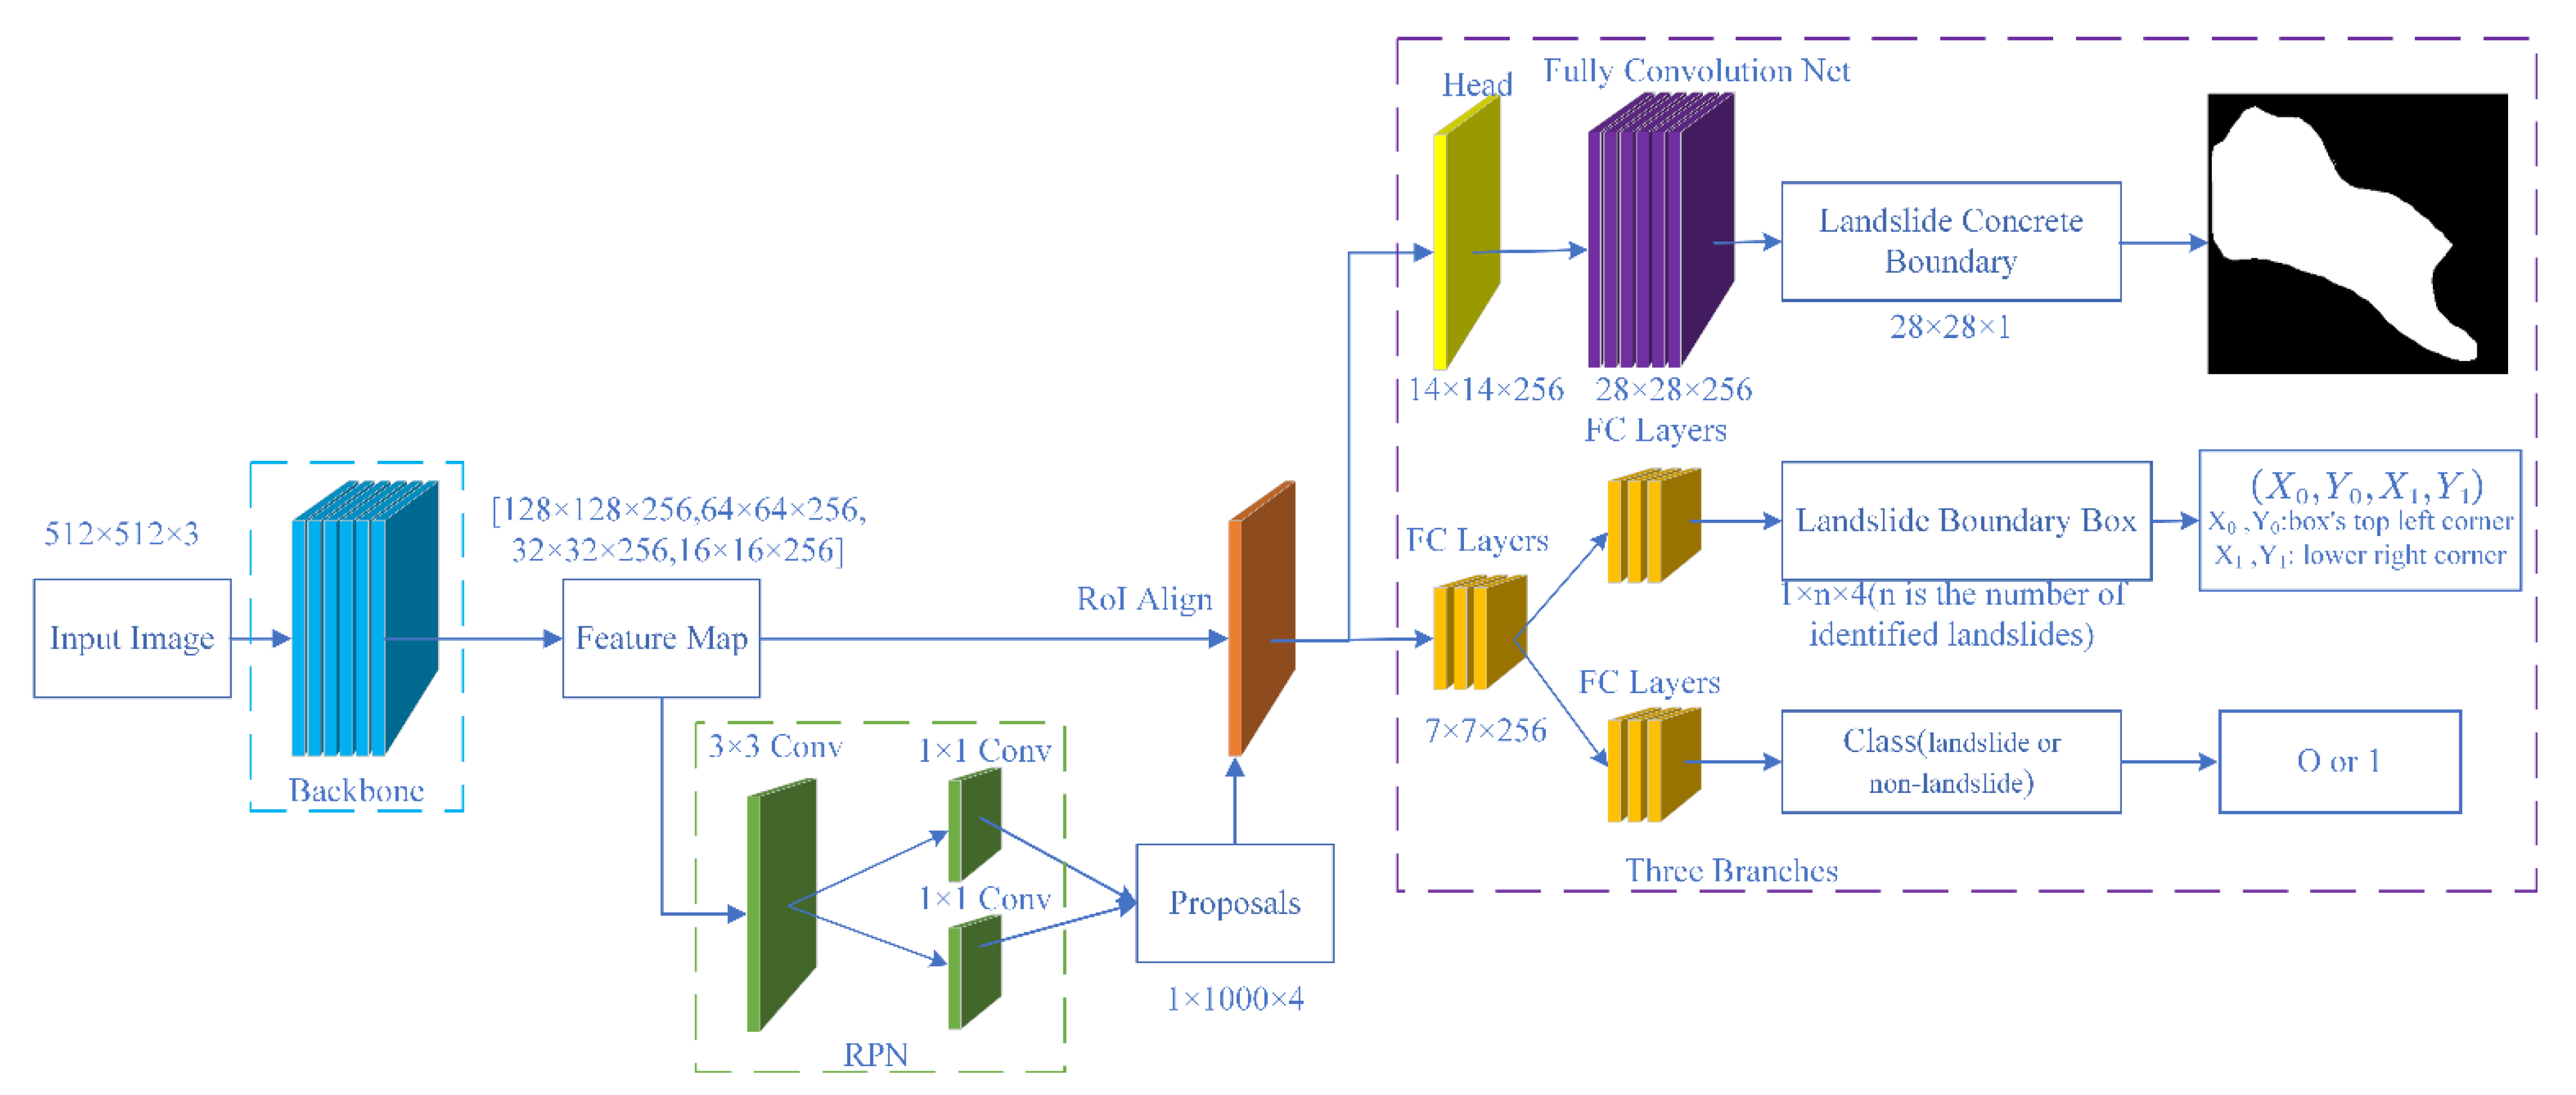
2.7. The Landslide Detection Method Used in This Paper
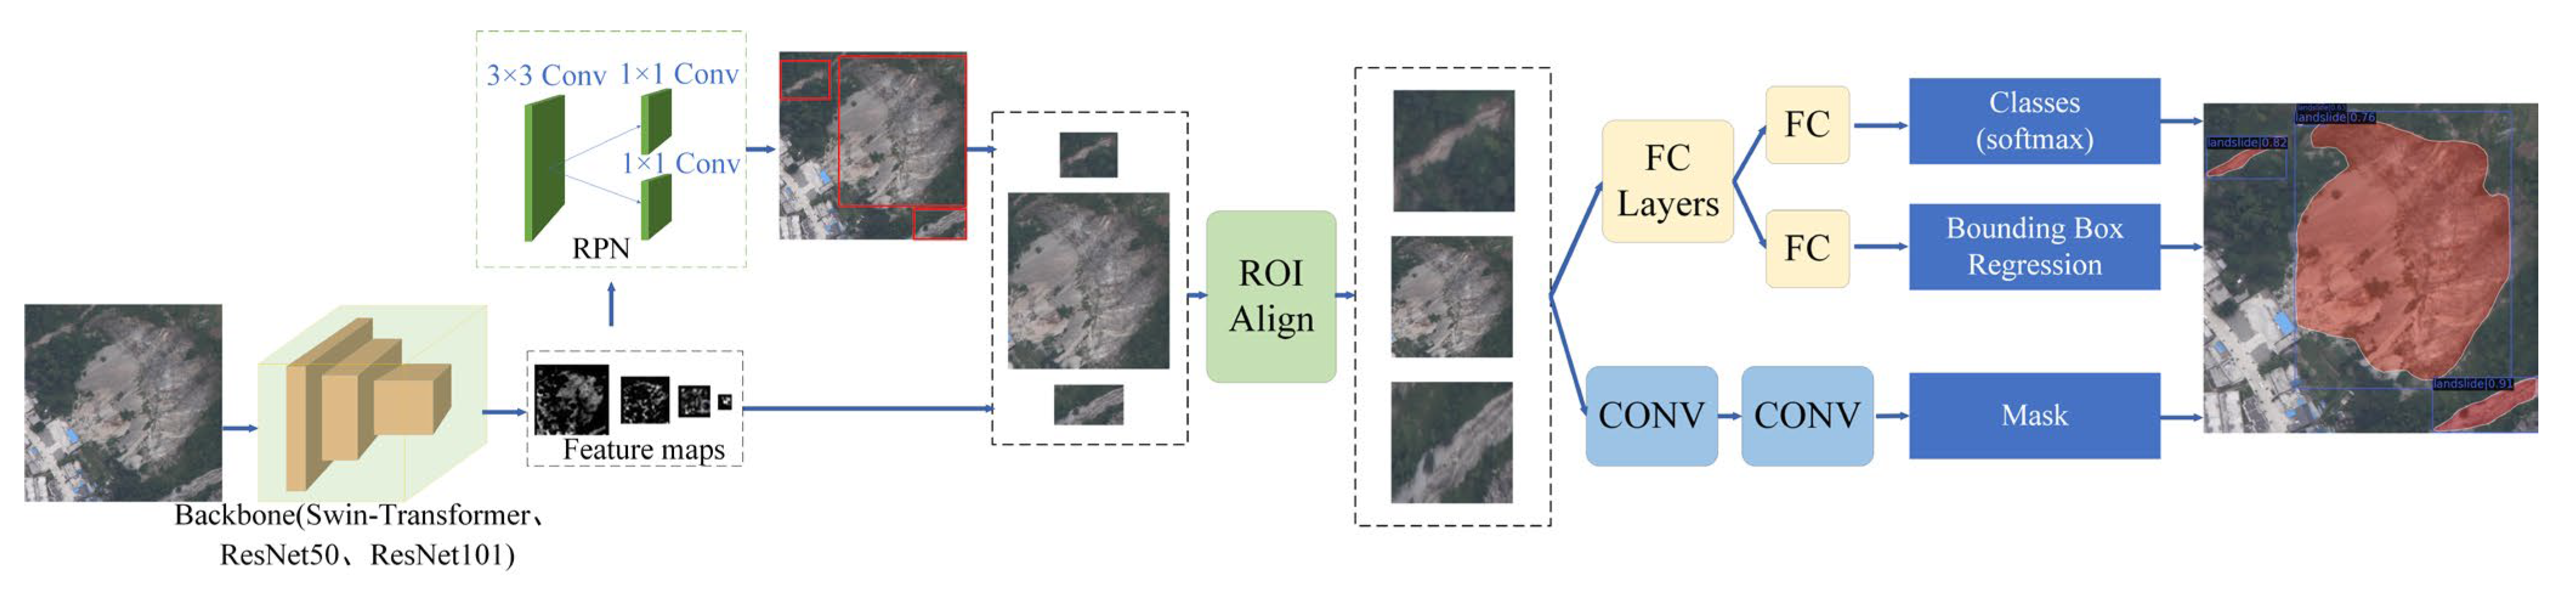
In this experiment, ResNet50, ResNet101, and Swin Transformer were employed as the backbone networks to extract image features, while Mask R-CNN was used as the primary landslide recognition model. Faster R-CNN with the semantic segmentation algorithm FCN [
36] makes up the Mask R-CNN algorithm. The main network structure is shown in
Figure 7.
Following the input of the seismic landslide picture into the network, the backbone first extracts the associated feature map, and then an ROI is set at each place in this feature map, yielding numerous candidate ROIs. After that, these candidate ROIs are sent into the Region Proposal Network (RPN) for regression and binary classification (slippery slope or non-slippery slope), with some of the non-slippery slope ROIs being passed off. For each anchor, RPN produces two outputs: a border accuracy to better fit the target and an anchor category to differentiate between landslides and background. The anchor that best contains the target can be chosen using RPN’s predictions, and its size and position can be adjusted. If numerous anchors overlap each other, the anchor with the greatest score is kept by non-maximal suppression. The ROI Align procedure is then applied to these remaining ROIs, which first maps the original picture to the pixel of the feature map before mapping the feature map to the fixed feature. Finally, classification, Bounding box regression, and mask generation (FCN operation in each ROI) are applied to these ROIs. The network’s primary modules are made up of and operate as follows.
- (1)
RPN
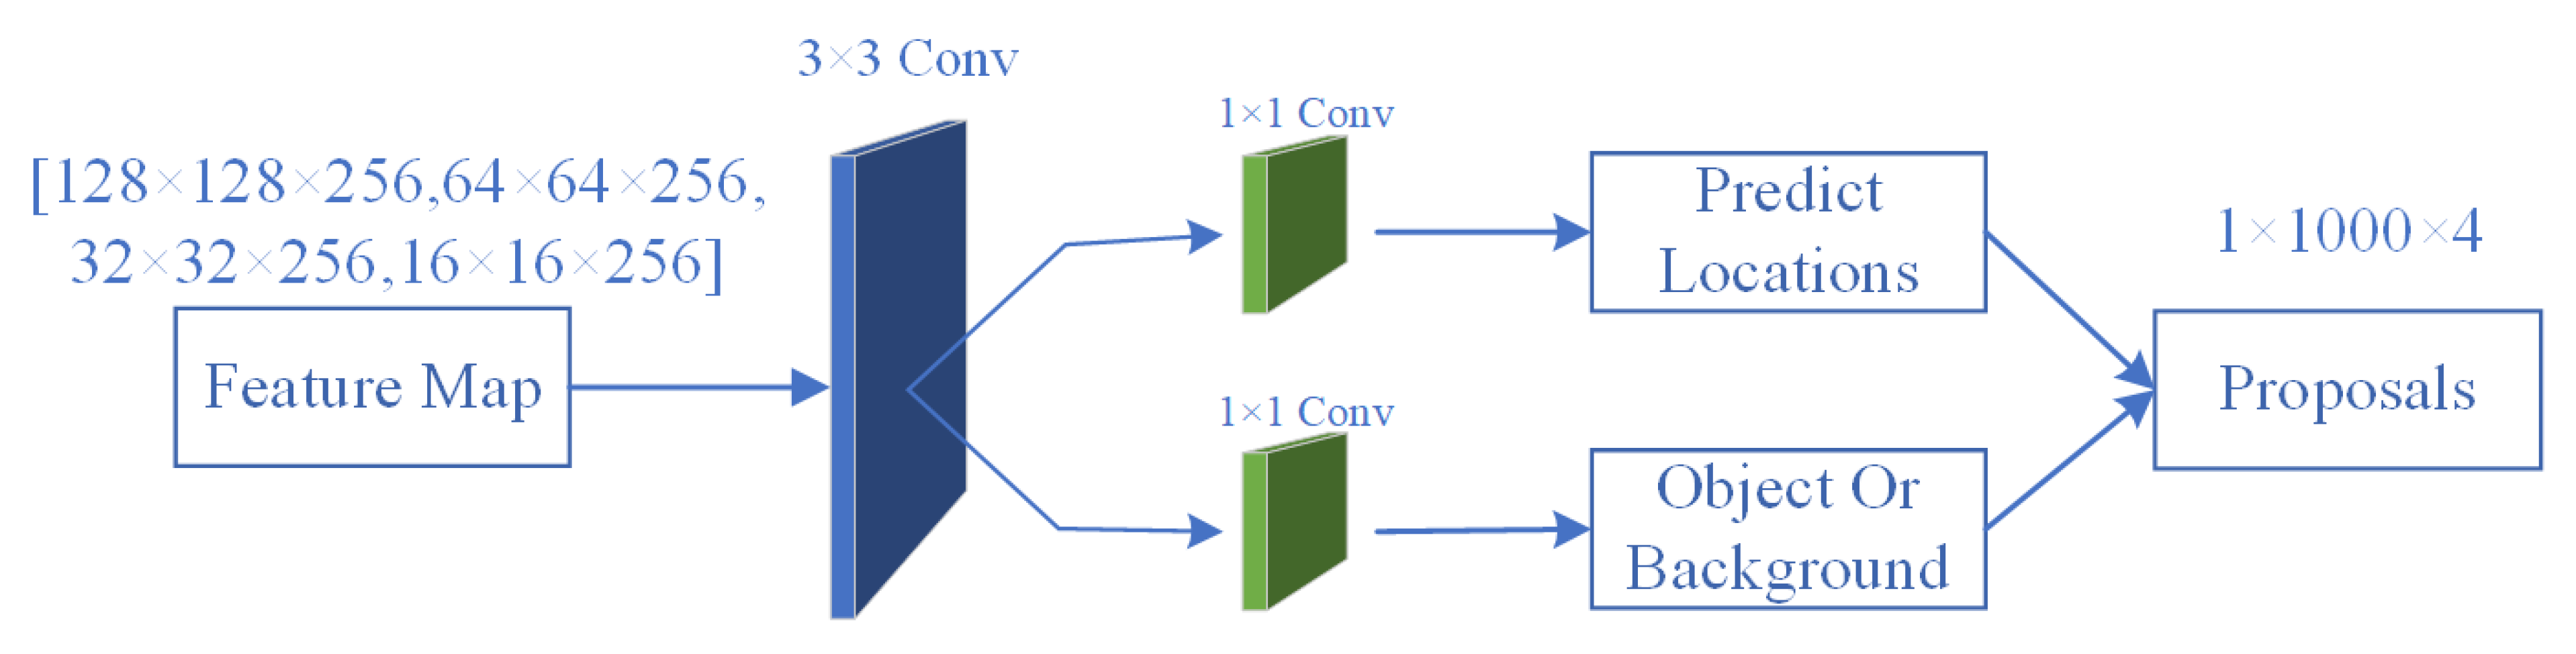
Mask R-CNN does away with the conventional sliding window in favor of directly using RPN to create detection frames.
Figure 8 depicts the precise organization of the RPN.
The original image is downsampled to produce feature maps. The final layer of the feature map is directly used by the general network because it has strong semantics. However, the last layer’s feature map’s positioning and resolution are quite poor, making it simple to miss relatively small objects. The backbone used in this paper uses multiple feature maps from the bottom to the top level for fusion, fully utilizing the extracted features at each stage in order to achieve better feature integration. Simply put, the higher-level features are transmitted to the lower-level semantics to complement them, resulting in high-resolution, strongly semantic features that make it easier to detect small targets.
With the use of sliding windows, the RPN, a lightweight neural network, scans the image and locates areas with targets. The anchors are the rectangular areas that the RPN scans, and they overlap one another to cover as much of the image as they can. The sliding window is implemented by the convolution process of RPN, which allows all regions to be scanned in parallel using the graphics processing unit (GPU). Furthermore, RPN does not scan the image directly; instead, it uses the backbone feature map, which enables RPN to utilize the extracted features effectively and prevent double counting. RPN generates two outputs for each anchor: an anchor class to distinguish foreground from background and a border to better fit the target. By using RPN’s predictions, the anchor that best contains the target can be selected and its position and size fine-tuned, and if multiple anchors are overlapping each other, the anchor with the highest foreground score is retained through non-maximal suppression.
The 1 × 1 convolutional layer is used to output a specified number of channels of feature maps. Proposals are areas where the algorithm finds possible objects after scanning the image through a sliding window. The top 1000 proposal boxes are kept after the Proposals Layer sorts the resulting proposal boxes in descending order of score. Four coordinates are contained in each box, resulting in the final matrix, which has the dimensions 1 × 1000 × 4. The 1 × 1000 × 4 dimension represents the 1000 areas of the image where the target is likely to be located. Here in the Proposals Layer, the network completes its equivalent of targeting.
- (2)
ROI Align
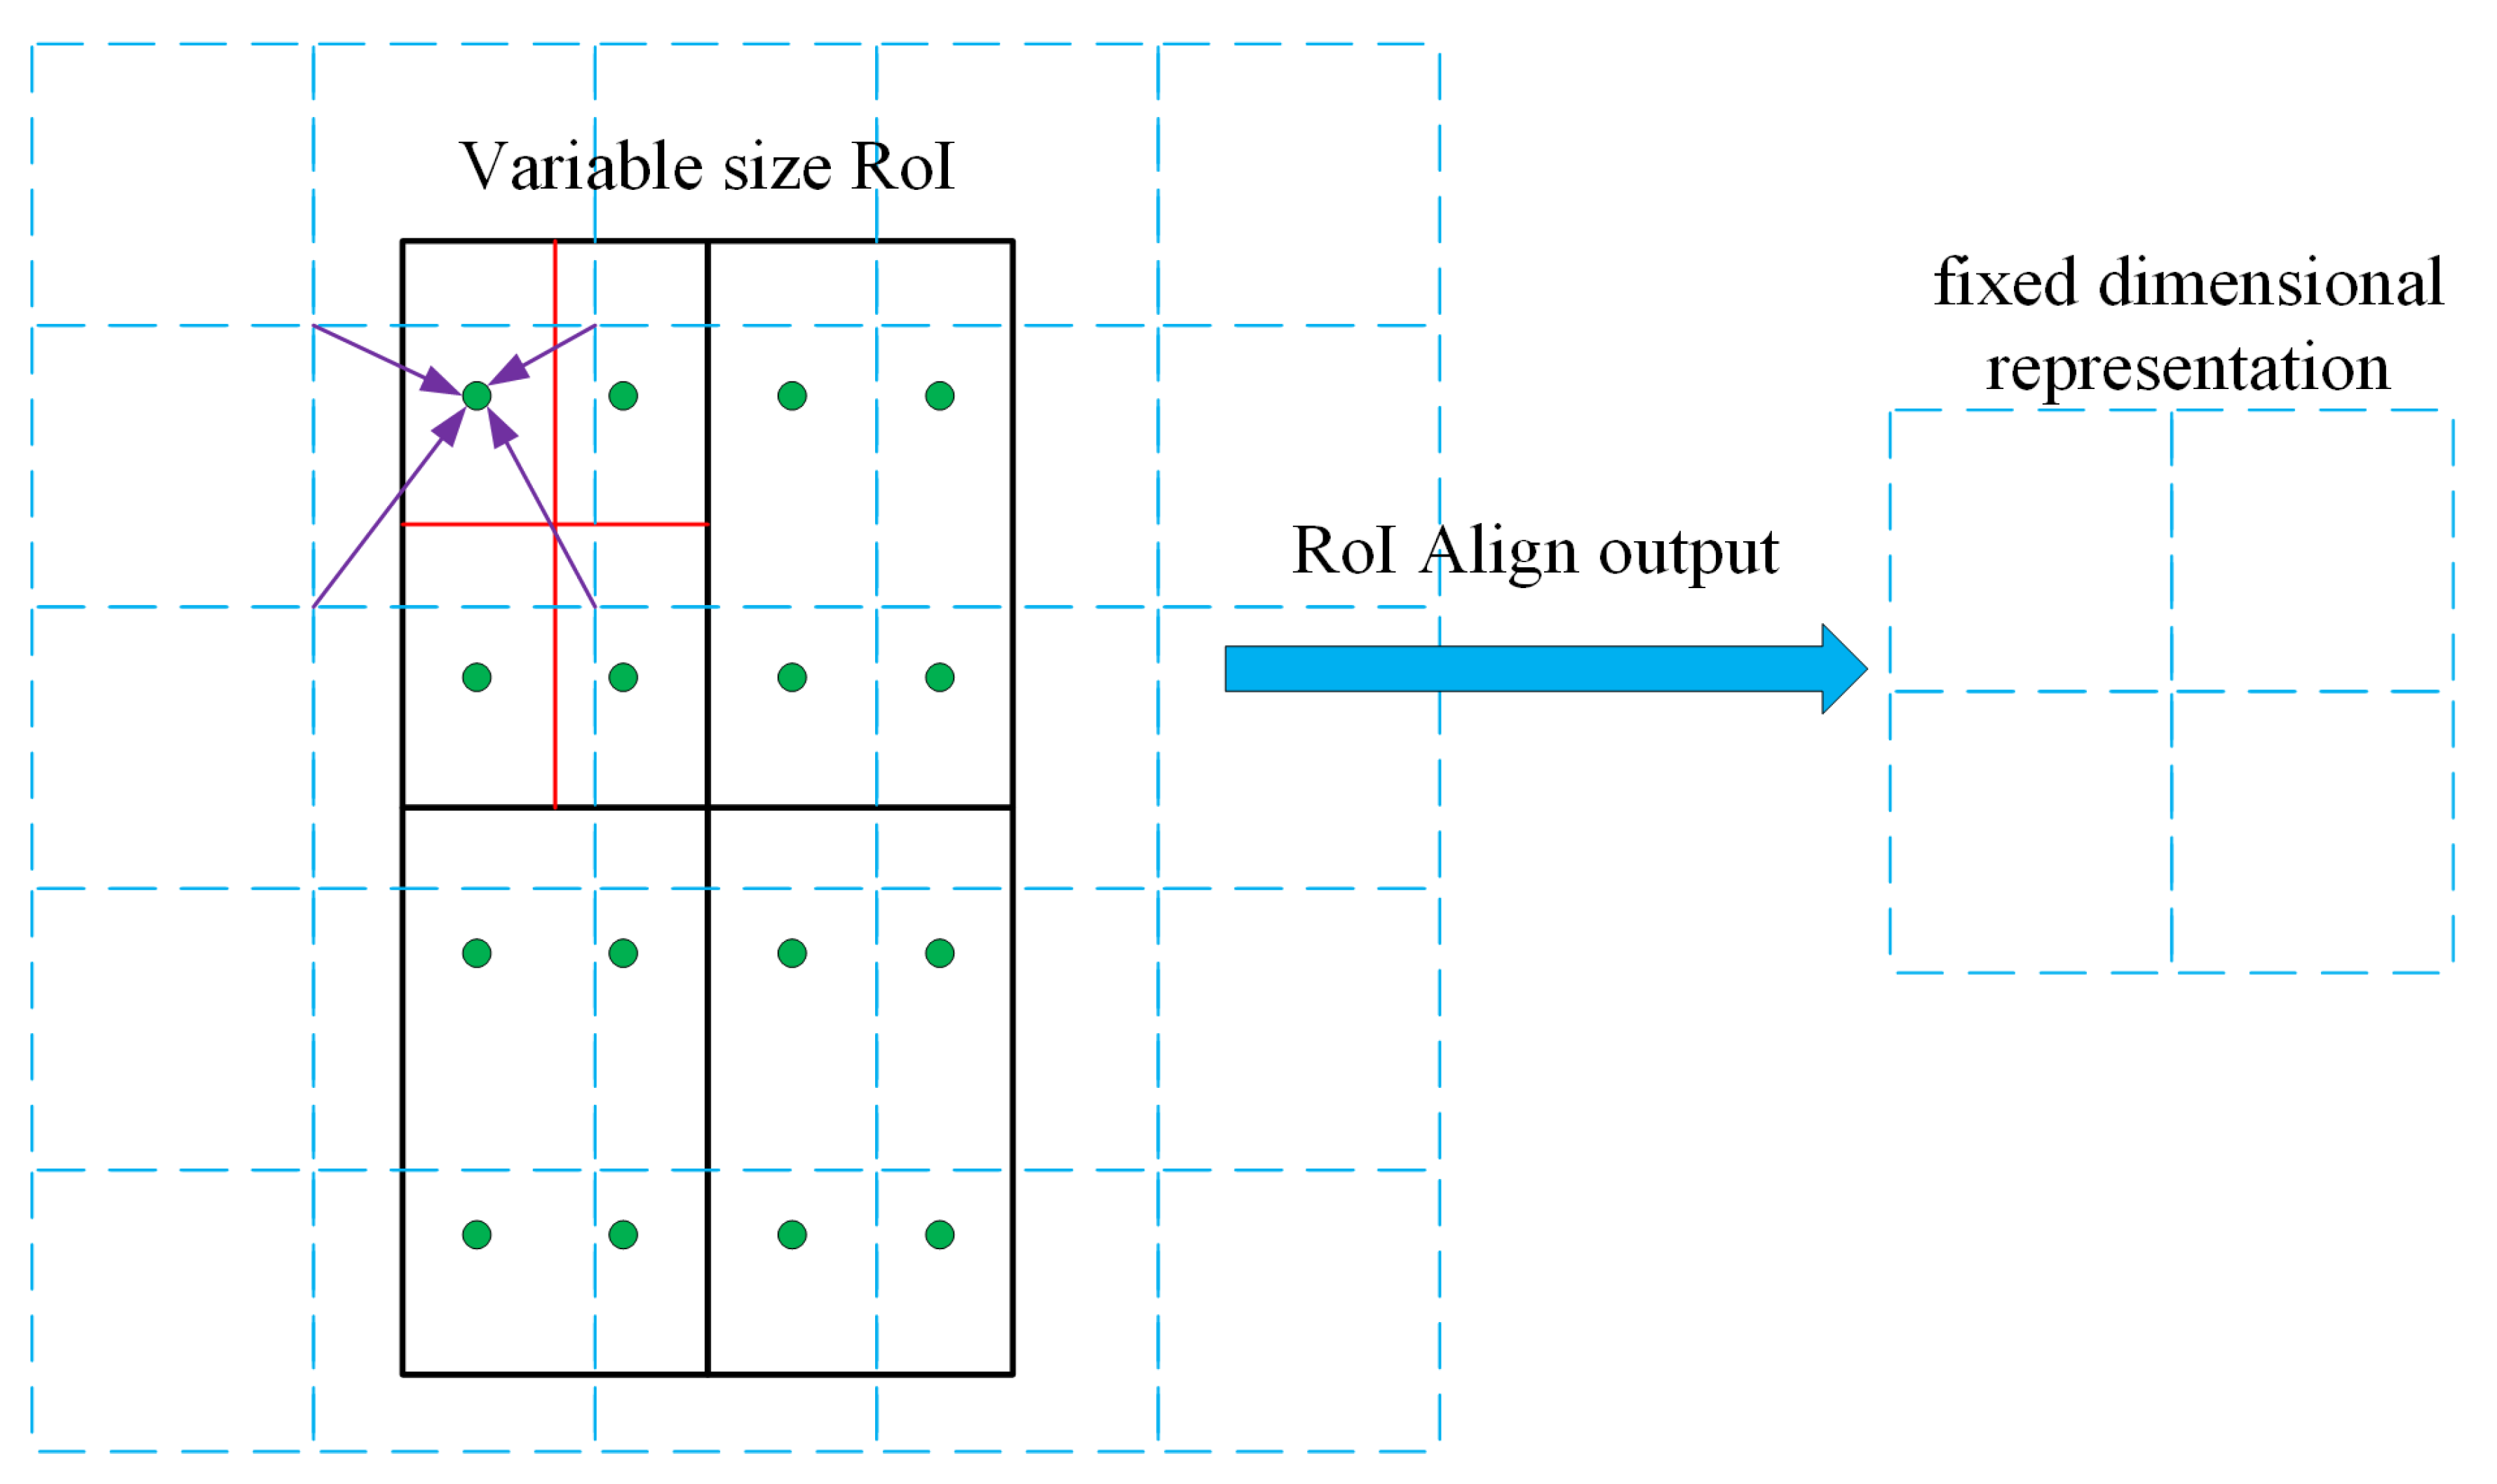
Mask R-CNN proposes the ROI Align approach in place of ROI Pooling to address the issue of region mismatch (misalignment) brought on by two quantization processes in Faster R-CNN. The ROI Align operation is shown in
Figure 9, with the dashed part representing the feature map and the solid line representing the ROI, where the ROI is sliced into 2 × 2 cells. If there are four points to be sampled, first, each cell is divided into four small squares (represented by red lines), with the center of each serving as the sampling point. The values of these sampled pixel points are then determined because the coordinates of these sample points are typically floating-point numbers, necessitating a bilinear interpolation of the sampled pixel (as indicated by the four arrows). The last step is to max pool the four sampled points inside each cell, which results in the ROI Align result. The purpose of ROI Align is to pool the corresponding areas in the feature map to a fixed size based on the position coordinates of the proposed boxes obtained from RPN for subsequent classification and boundary box regression operations.
- (3)
Fully Convolution Nets
The FCN convolves and pools the image, decreasing its feature map, then performs a deconvolution operation, which means an interpolation operation to increase its feature map, and finally classifies each pixel value. To generate the mask of the identified target in the input image, that is, the boundary of the identified target, the FCN operation is applied to each ROI of the image.
2.8. Experimental Setup
For our trials in this study, we employed an RTX3090 graphics processor, an Intel i9-10900k processor, and 64 GB of RAM. For the model software environment, both the original and improved Mask R-CNN models are implemented in PyTorch, the python version of Torch, a neural network framework open-sourced by Facebook, specifically for GPU-accelerated neural network programming. Torch is a traditional tensor library that is popular in machine learning and other applications that need a lot of arithmetic. It is used to manipulate multidimensional matrix data.
The AdamW algorithm [
37] was selected as the gradient decent optimizer algorithm for setting model parameters because it uses less memory, trains more quickly, converges more quickly, and reduces computational costs. The remaining hyperparameters are all those that perform better on the validation set after multiple iterations. The batch size was set to 8, the number of threads was set to 4, and the learning rate was set to 10
−3 as the model parameter settings. After that, 50 epochs of training were performed on all three models.
2.9. Indicators for Accuracy Evaluation
In this experiment, the performance of the three seismic landslide detection models was quantitatively assessed using Precision, Recall, F1 score, Accuracy, and intersection over union (IoU) metrics [
38]. Precision numbers primarily show how accurately landslides were detected on the image. The number of landslides in the image that have been successfully recognized is represented by the Recall metric. The F1 score is used to calculate the equilibrium between accuracy and recall. The F1 score is a combined indicator of the model’s accuracy and is the harmonic mean of precision and recall. The accuracy rate represents the proportion of accurately predicted data among all data. The confusion matrix in
Table 2 includes True-Positive (TP), False-Positive (FP), and False-Negative (FN), where TP is the number of samples that were correctly identified as landslides, FP is the number of samples that were incorrectly identified as non-landslides, and FN is the number of samples that were not identified as landslides. If the IoU is more than or equal to 0.5, a prediction for a landslide is deemed to be true, and if it is less than 0.5, it is deemed to be false.
False negatives play a crucial role in managing the risk of landslides. The small number of FNs guarantees that the model misses fewer landslides and identifies all affected structures and settlements, allowing for an accurate assessment of the extent and severity of damage to the landslide hazard area and prompt action to be taken to prevent and mitigate the disaster in the affected area.
IoU is a metric used to assess how accurately corresponding object boundaries are found in a set of data. IoU is a straightforward calculation criterion that may be applied to any task that produces an output with a predicted range (bounding boxes). The correlation between the true and predicted values is calculated by using this criterion, and the stronger the correlation, the higher the value. The IoU value measures how closely the system’s anticipated box and the image’s ground truth box overlap. The accuracy of a single detection is represented by the intersection of the detection result and the ground truth over their concatenation.
For this experiment, the test set was also labeled. After the test set’s images were recognized, the program counted and filtered the IoU for each identified landslide. A TP is defined as an IoU value greater than 0.5, and the total number of TP is calculated in this way. The number of FPs is equal to the number of detected landslides less the number of TP, whereas the number of FN is equal to the number of true landslides in the tag minus the number of TP.
3. Results
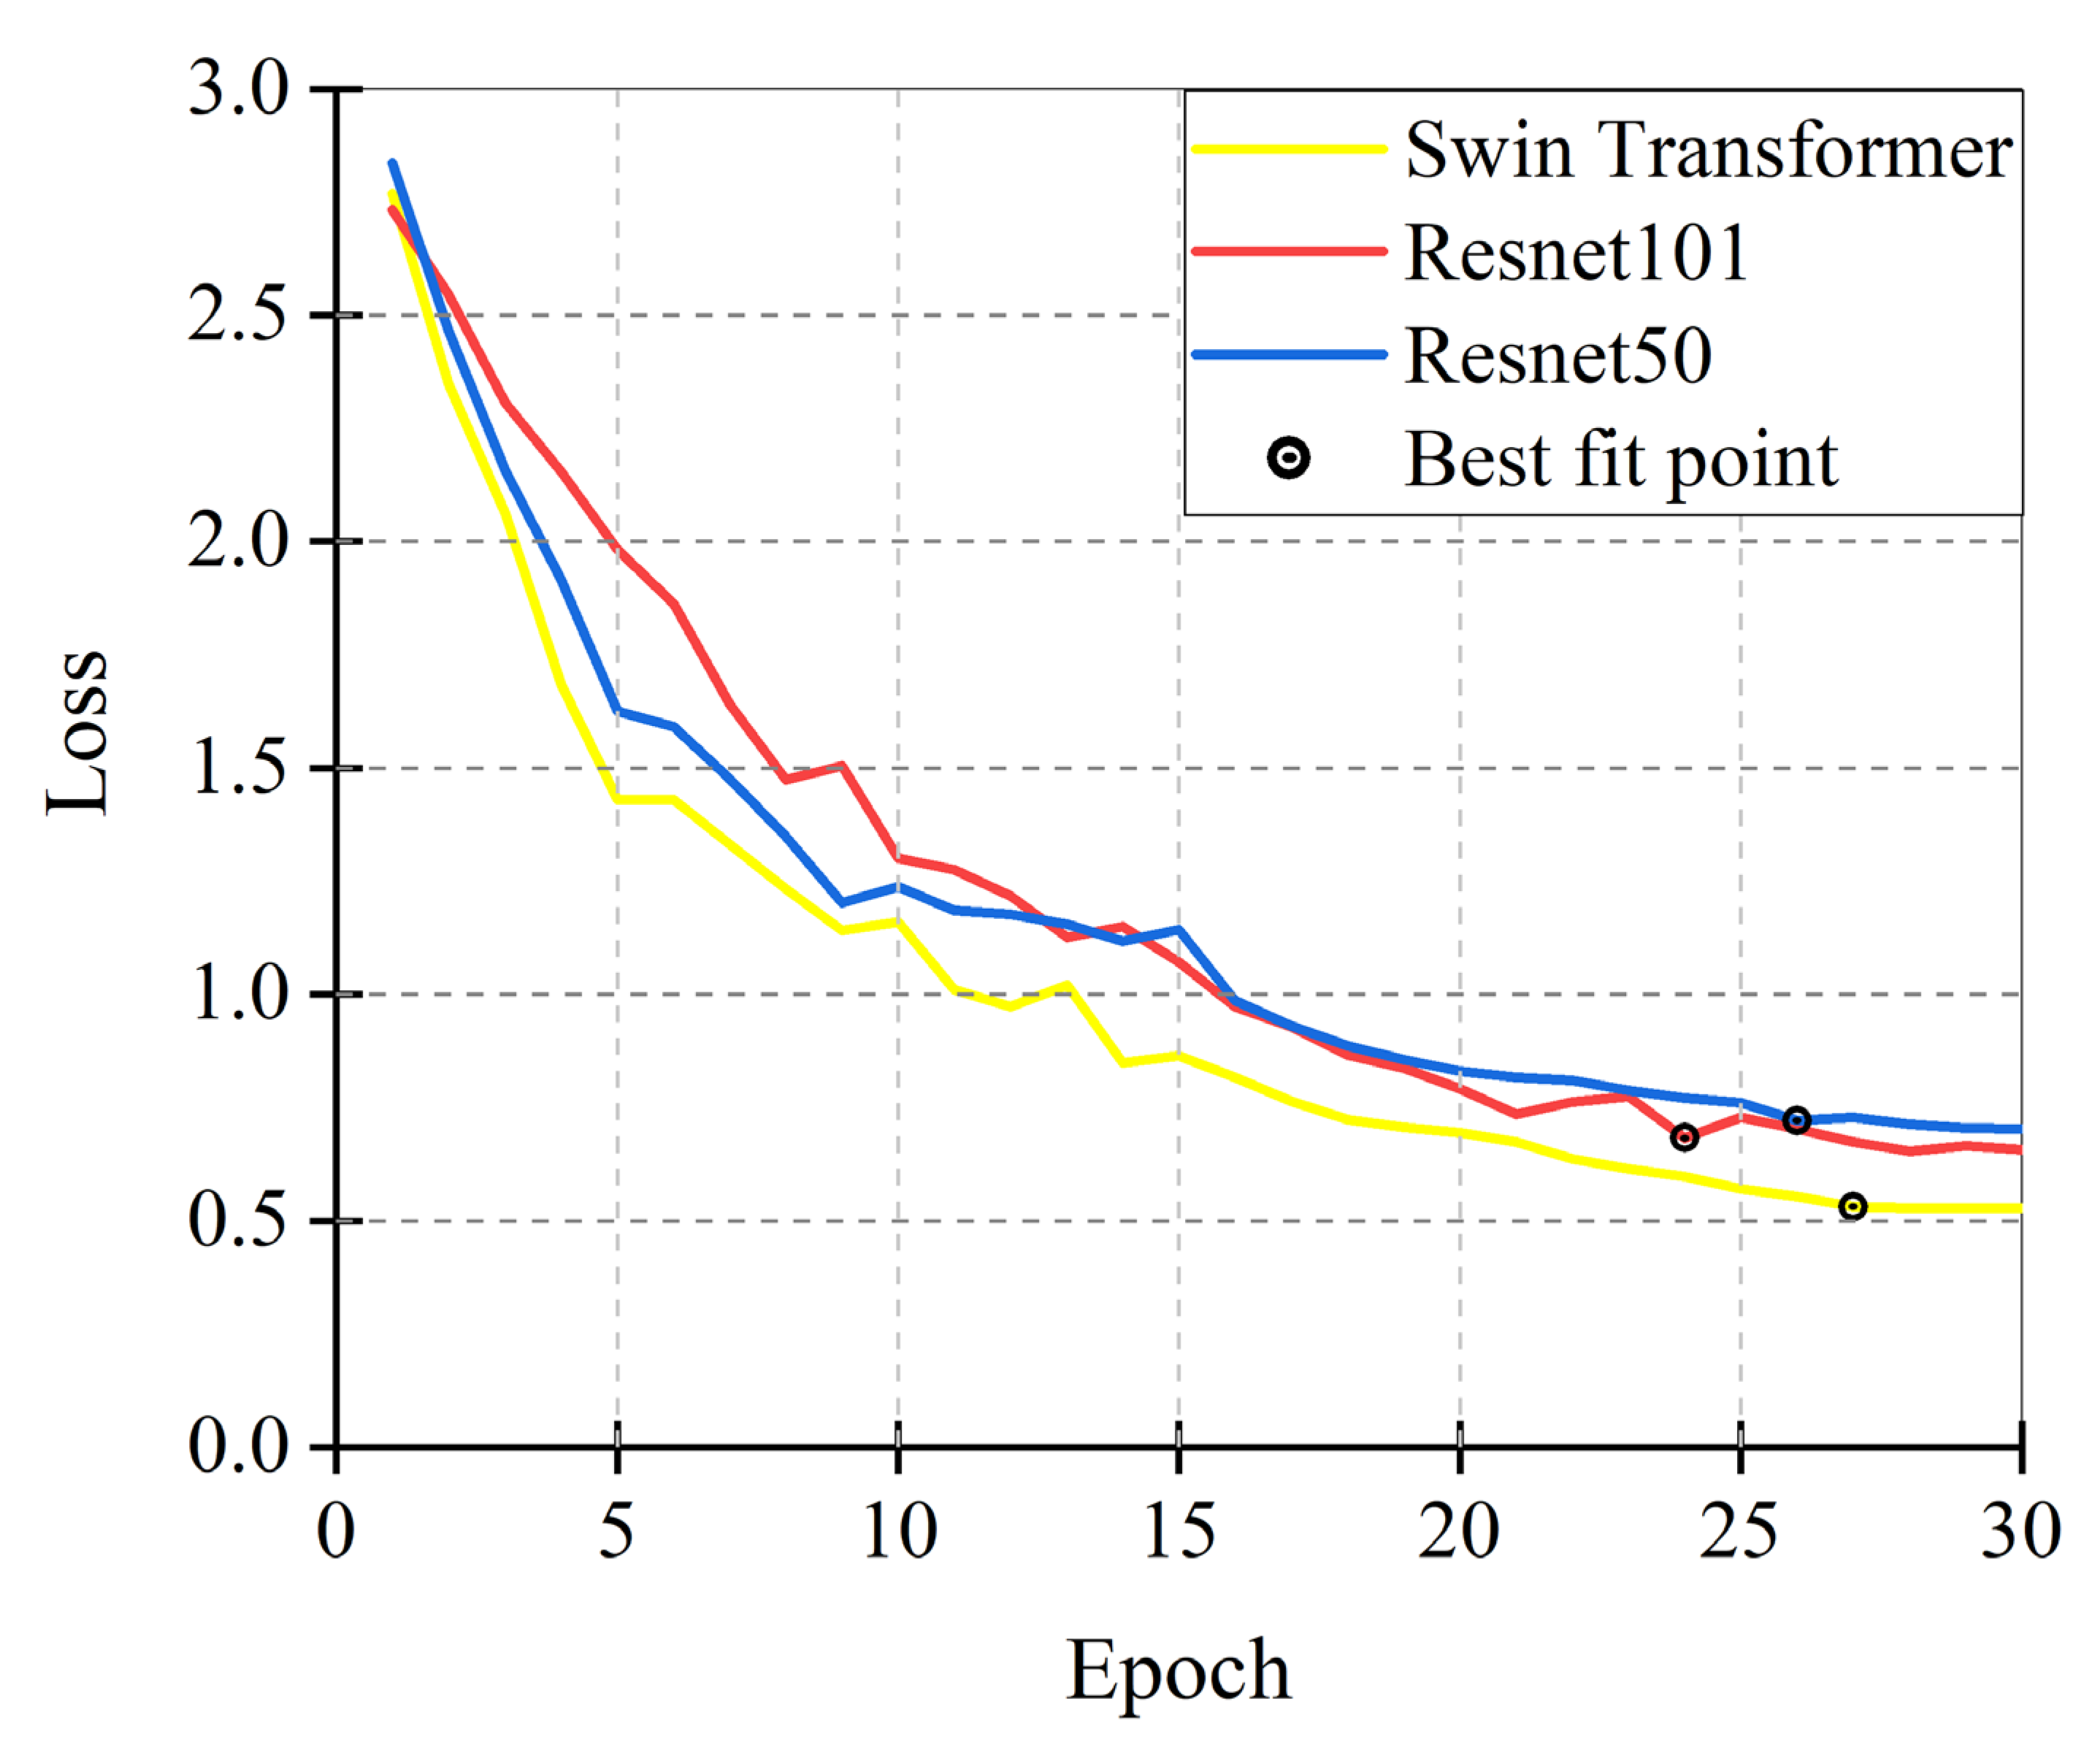
The three models in this experiment were trained using the same landslide dataset, and since all three models were fitted before the 30th epoch, only the first 30 epochs were chosen for illustration.
Figure 10 displays, following 30 training epochs, the overall validation loss curves generated by the various models. The three models’ loss curves generally follow a similar trend, with faster learning and a notable decline in loss values during the initial phases of training. The model gradually converges in the middle and later phases of training, with smaller changes in loss values and a sluggish rate of decrease. The accuracy of the model’s landslide detection keeps improving as the total loss value drops, and in this study, the epoch with the lowest total loss value is chosen for identification on the test set.
The same landslide dataset was also used to train the YOLOv5, Faster R-CNN. Following training, the three models’ recognition accuracies were compared to those of the classic YOLOv5 and Faster R-CNN models on the test set. The primary architect of the original YOLOv5 project methodology was Glenn Jocher of Ultralytics. YOLOv5 is a one-stage detection model that, after a single inspection, generates the class probability and position coordinate values of the object directly, without the aid of a region proposals stage. While being slower but typically more accurate, Mask R-CNN is a two-stage detection model. The results are given in
Table 3.
Table 3 shows that the model with the Swin Transformer performs well on the test set, with Precision values of 0.9328, Recall values of 0.8741, F1 scores of 0.9025, and Accuracy values of 0.822. The improved algorithm outperformed the previous algorithms in all indexes when compared to the original Mask R-CNN, YOLOv5, and Faster R-CNN. According to a study of the test results, the method described in this work for detecting seismic landslides has a greater detection accuracy than the original Mask R-CNN algorithm.
Figure 11 displays the outcomes of the UAV image recognition in the test set. In the diagram, the blue box represents the landslide boundary box determined by the model, and the red area represents the landslide boundary determined by model identification.
As seen in
Figure 11a–h, the improved model is capable of correctly identifying individual landslides when there is a significant area of individual landslides on the image. The resulting landslide boundaries are also more precise than those produced by ResNet50 and ResNet101.
While the recognition results of ResNet50 and ResNet101 suffer from serious under-detection when the natural environment is complex, as shown in
Figure 11i–p, the improved model can accurately detect them even if there are two or more landslides on the image at the same time. Although the landslide area below the image is only partially visible in the UAV image, the model correctly identifies it, demonstrating the improved model’s increased robustness. In this way, the model can maintain high recognition accuracy even in landslide regions on the image that is partially or completely hidden by surface structures, such as buildings or forests.
As seen in
Figure 11q–t, there is a river on the right side of the landslide area, and the visual characteristics of the river are very similar to those of the landslide. ResNet50 exhibits the phenomenon of mistaking the river for a landslide, but the improved model correctly ignores these occurrences and detects the landslide area on the left side, demonstrating its anti-interference ability.
The recognition results, however, demonstrate that the improved model continues to miss and misidentify locations on the map. The exposed rock above is mistakenly identified by the improved model in
Figure 11p as a landslide area due to the visual similarities between the two.
Figure 11t demonstrates how the improved model overlooked a minor landslide below. This suggests that there is still room for improvement in the improved model’s capacity to identify landslides in challenging environments, especially when it comes to distinguishing them from exposed rock and exposed soil. In the future, steps could be taken to lessen the influence of bare rock and bare soil on the model, such as increasing the number of landslide samples and adding satellite and drone imagery of various resolutions to the dataset.
This study put the seismic landslide photos from Haiti into three trained models for identification to examine the generalizability and transferability of the models. After image correction, fusion, and other pre-processing, the Haiti seismic landslide image, which is segmented into 512 × 512 pixels size for identification in this paper, is created with a 1 m resolution true-color image of the Haiti post-earthquake GF-2 satellite image from 2021.
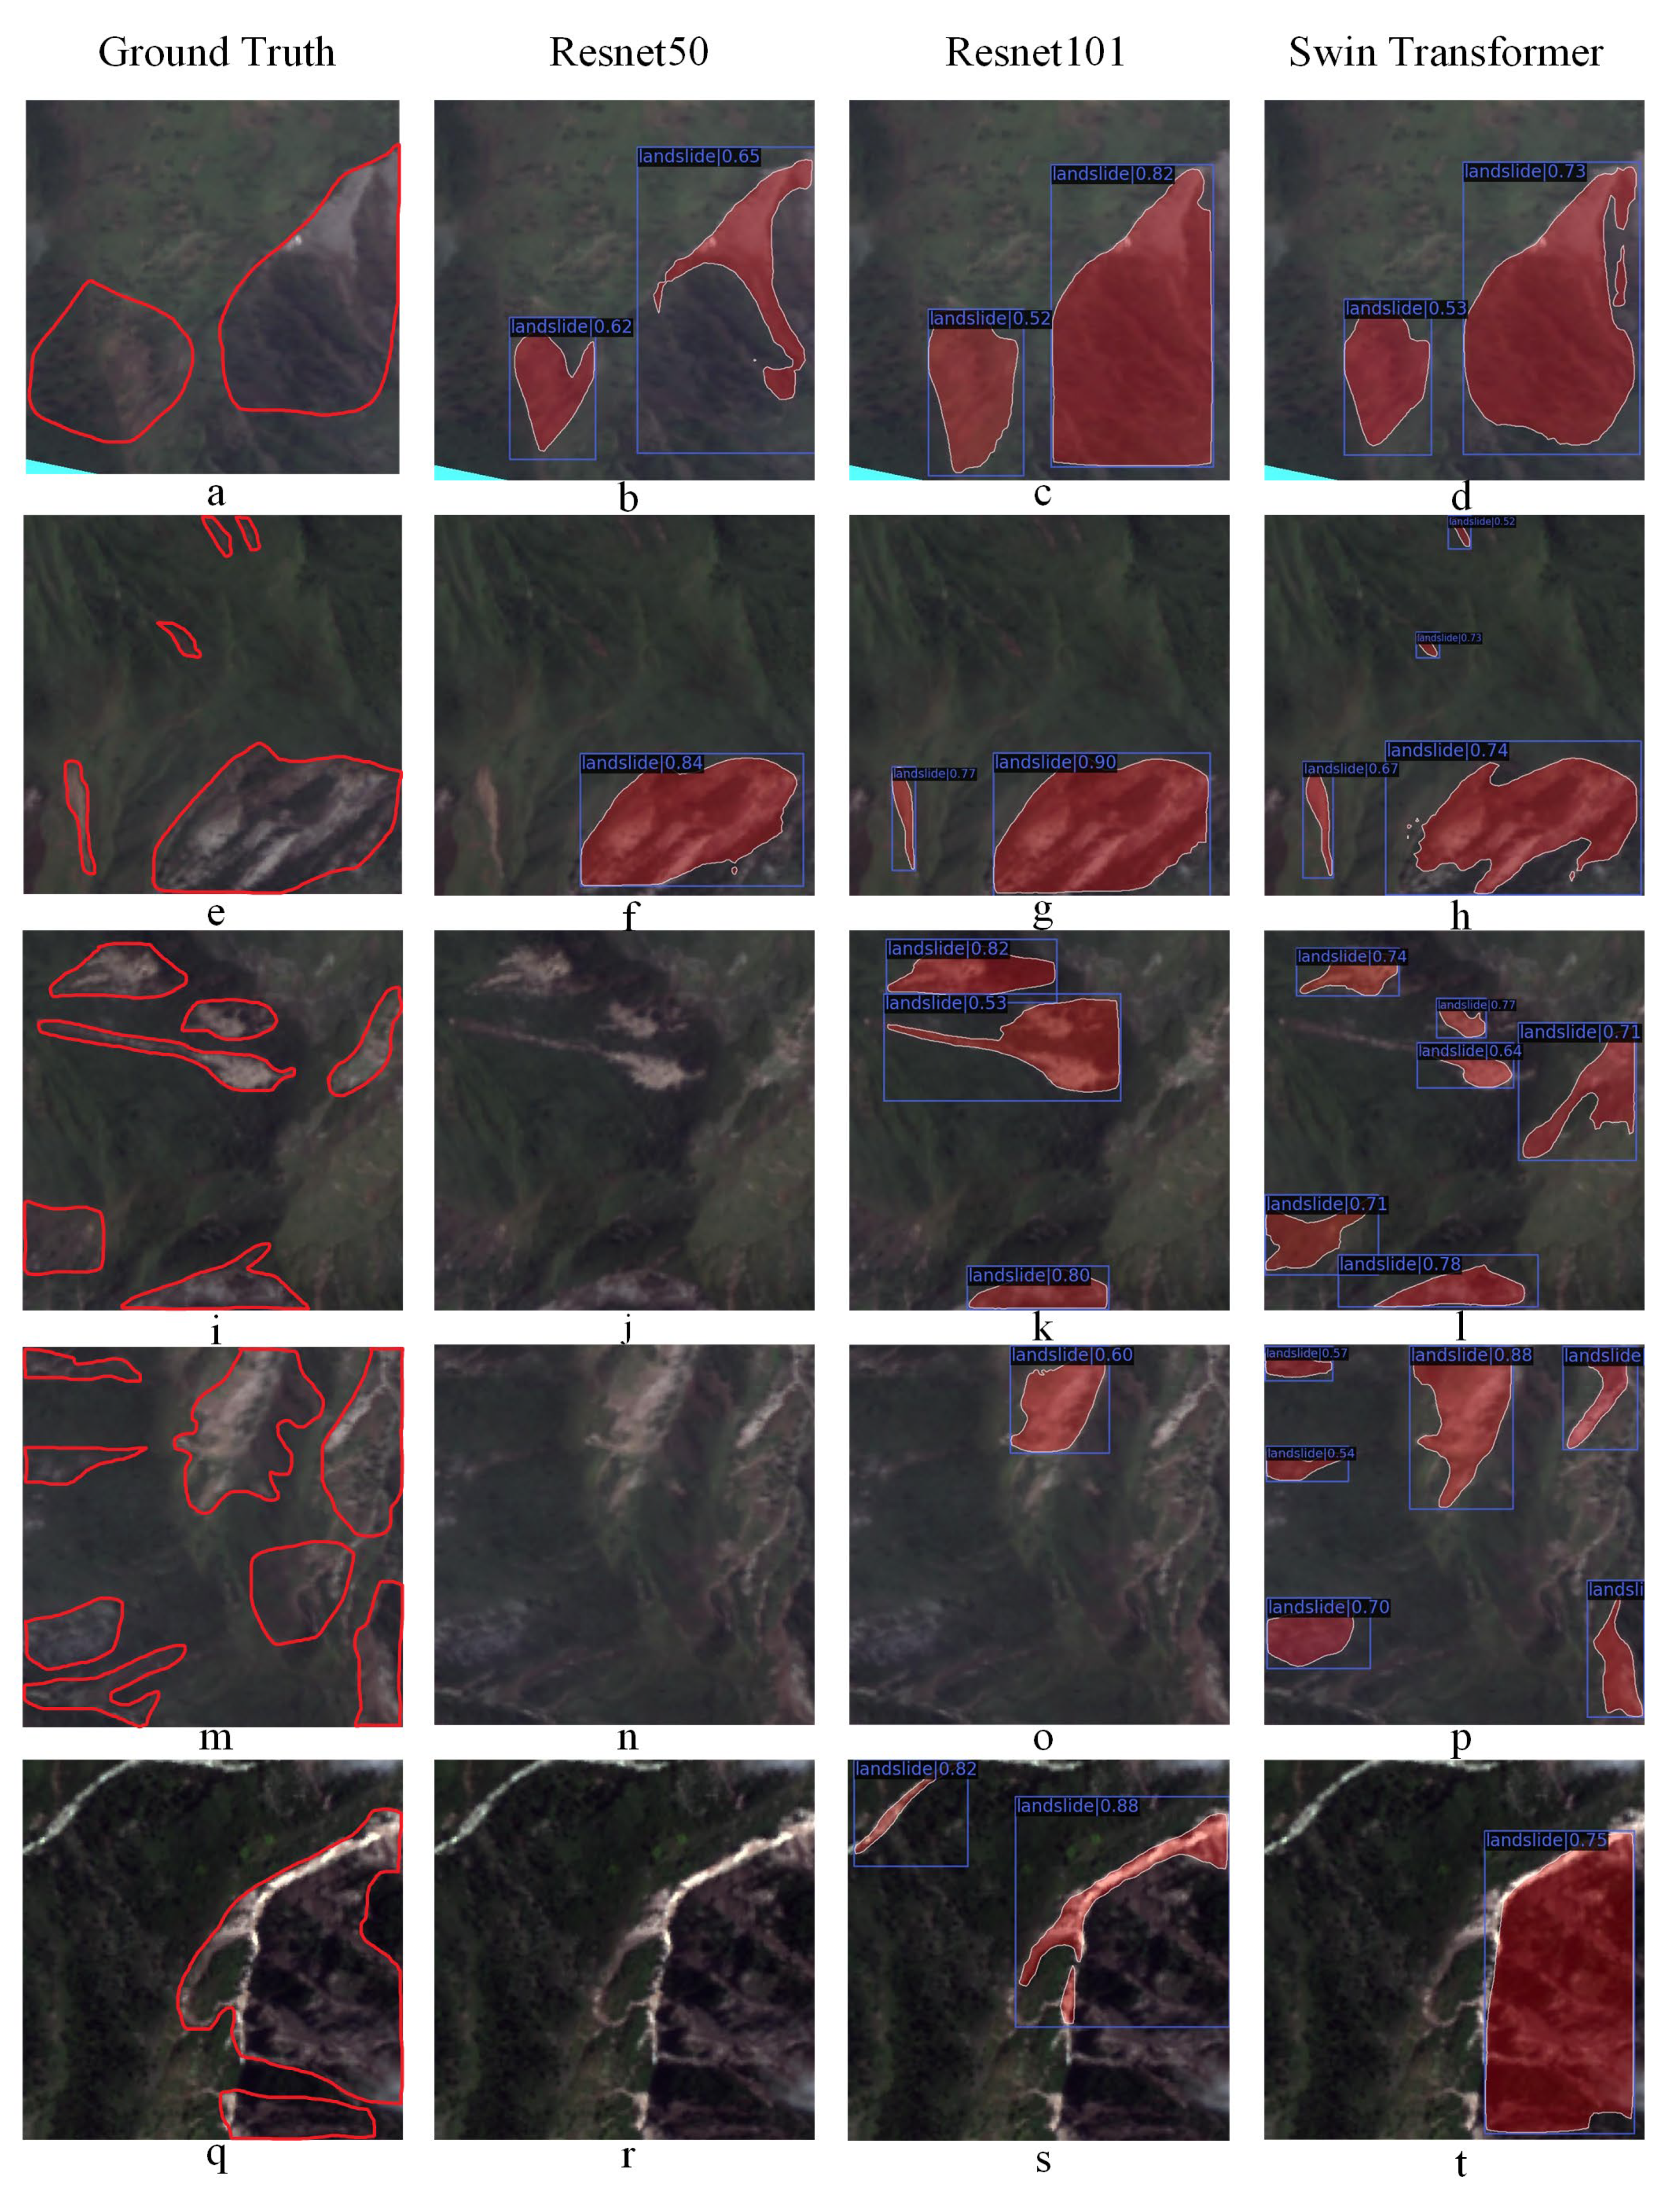
Figure 12 depicts the outcomes of the identification of the Haiti satellite imagery, with the Ground Truth being the landslide boundary determined by the geohazard interpreters based on the outcomes of surface changes between the Haiti satellite images taken prior to the earthquake and those taken following it. In the diagram, the blue box represents the landslide boundary box determined by the model, and the red area represents the landslide boundary determined by model identification.
Figure 12a–d,q–t demonstrate the improved model’s superior feature extraction capabilities for seismic landslides. ResNet50 and ResNet101 exhibit missed and false detections when identifying landslides, while the improved model can still recognize landslides that are untrained and have different colors. The improved model performs well in identifying small landslides, even when they are small, as shown in
Figure 12e–h.
ResNet50 and ResNet101 could only identify the larger, more noticeable landslides among them, and the detection results are shown in
Figure 12i–p. Despite the large number of landslides present on the image at the same time, the improved model was still able to identify the vast majority of them.
In conclusion, both ResNet-50 and ResNet-101 performed poorly in their recognition of the Haiti images, but the improved model’s detection results on those same images still maintained high accuracy, demonstrating the improved model’s superior robustness and transferability.
4. Discussion
In recent years, deep learning has been employed by many academics to identify landslides. A DLWC model for landslide detection in Hue–Saturation–Intensity (HSI) data was proposed by C. Ye et al. [
39] DLWC combines the extracted features and susceptibility factors for landslide detection after using deep confidence networks to extract spatial features and spectral characteristics of landslides at high levels on hyperspectral images. To determine if it was a landslide, a logistic regression classifier with constraints was finally employed. The experimental outcomes demonstrate that the detection accuracy of landslides on remote sensing images reaches 97.91 percent, which is more accurate than the conventional hyperspectral image classification method. Utilizing contour data and the vegetation index, Bo Yu et al. [
40] developed an end-to-end deep learning framework for landslide detection. The framework is divided into two sections: one for identifying areas at risk of landslides using vegetation indices and DEM and the other for accurately identifying those areas through the use of a semantic segmentation deep learning model. With a recall of 65% and an accuracy of 55.35%, the proposed methodology performed 44 percent more accurately than comparable published works when used to identify landslides in Nepal on images from Landsat 2015. In order to detect and map earthquake-induced landslides in single RapidEye satellite images, Yi Y et al. [
41] proposed a new end-to-end deep learning network, LandsNet, to learn various features of landslides. To address the lack of training samples, specific training samples were first generated and a data augmentation strategy was put into place. A cascaded end-to-end deep learning network called LandsNet was subsequently built. By using morphological processing, the identified landslide maps have finally been further optimized. In two spatially distinct earthquake-affected areas, LandsNet achieved the best F1 value of about 86.89 percent, which is almost 7 and 8 percentage points higher than those of ResUNet and DeepUNet, respectively. An improved U-Net model for seismically generated landslide extraction was developed by Liu, P. et al. [
42] using post-earthquake aerial remote sensing imagery to annotate a landslide dataset. The article increases the amount of feature parameters for the training samples by first adding three new bands with spatial information to the three RGB bands: DSM, slope, and aspect. In order to rebuild the U-Net model structure, a residual learning unit was then added to the conventional U-Net model. Finally, the new technique was used to identify seismic landslides in Jiuzhaigou County, Sichuan Province, China. According to the findings, the new method’s accuracy is 91.3 percent, which is 13.8 percent greater than that of the conventional U-Net model.
All of the aforementioned studies have produced positive results, but there are clear drawbacks in the quick identification of post-earthquake seismic landslides, such as the challenge of quickly obtaining hyperspectral image data after an earthquake, the low identification accuracy, and the poor transferability. Automatic seismic landslide extraction’s main goal is to take all necessary measures to meet seismic emergency needs and to offer technical assistance for disaster mitigation and relief efforts such as opening up lifelines and life rescue. The issue of applying a trained model to landslides in untrained areas has received less attention in recent research on landslide identification. The algorithm used in this paper can extract corresponding patterns using multi-layer learning in a neural network using spatial and spectral features of seismic landslides from remote sensing imagery. In the early stages of the study, numerous sets of labelled data are used as samples to train landslide identification models, which can be used to quickly extract data about disasters such as seismic landslides in the post-disaster period. In this study, data from the 2008 Wenchuan earthquake were used to train a recognition model with some generalizability to seismic landslides, and seismic landslide data from Haiti were used to validate the model. The method used in this study produced comparable F1 values and accuracy to the studies by Yi Y et al. [
41] and Liu, P et al. [
42], but the model can be used for identification immediately after an earthquake without collecting data, improving time efficiency, indicating that the model has better potential for use in emergency response to earthquake disasters.
With good results and an accuracy of 0.9328 and an F1 score of 0.9025, Resnet-50, Resnet-101, and Swin Transformer were utilized in this study as the backbone networks of Mask R-CNN for the extraction of seismic landslides in Wenchuan. On untrained post-earthquake satellite photos of Haiti, the improved model continues to produce good recognition results, and its accuracy and transferability have both increased. Compared to earlier examined methods, the one used in this study is more automated and necessitates fewer data.
This study employs some techniques to improve model accuracy and avoid overfitting while working with tiny samples of data. To obtain a larger dataset, data augmentation is first applied to the photos, rotating and flipping each image. Second, transfer learning is utilized to shorten the training time, improve the generalizability of the model, and reduce the amount of data gathering needed. Ultimately, the Swin Transformer was employed as the model’s backbone network to improve its adaptability and accuracy.
The findings of this study demonstrate that seismic landslides can be successfully identified in UAV imagery by using deep learning techniques. It is anticipated that satellite and UAV imagery data of various resolutions will be added to the dataset for the study’s next phase to increase data diversity and boost the precision of landslide identification. Other data, such as Digital Elevation Model (DEM) data, can also be incorporated into the model, in addition to remotely sensed imagery.


