
Trend in Satellite-Observed Vegetation Cover and Its Drivers in the Gannan Plateau, Upper Reaches of the Yellow River, from 2000 to 2020

 , ,
, ,
Abstract
:1. Introduction
2. Data and Method
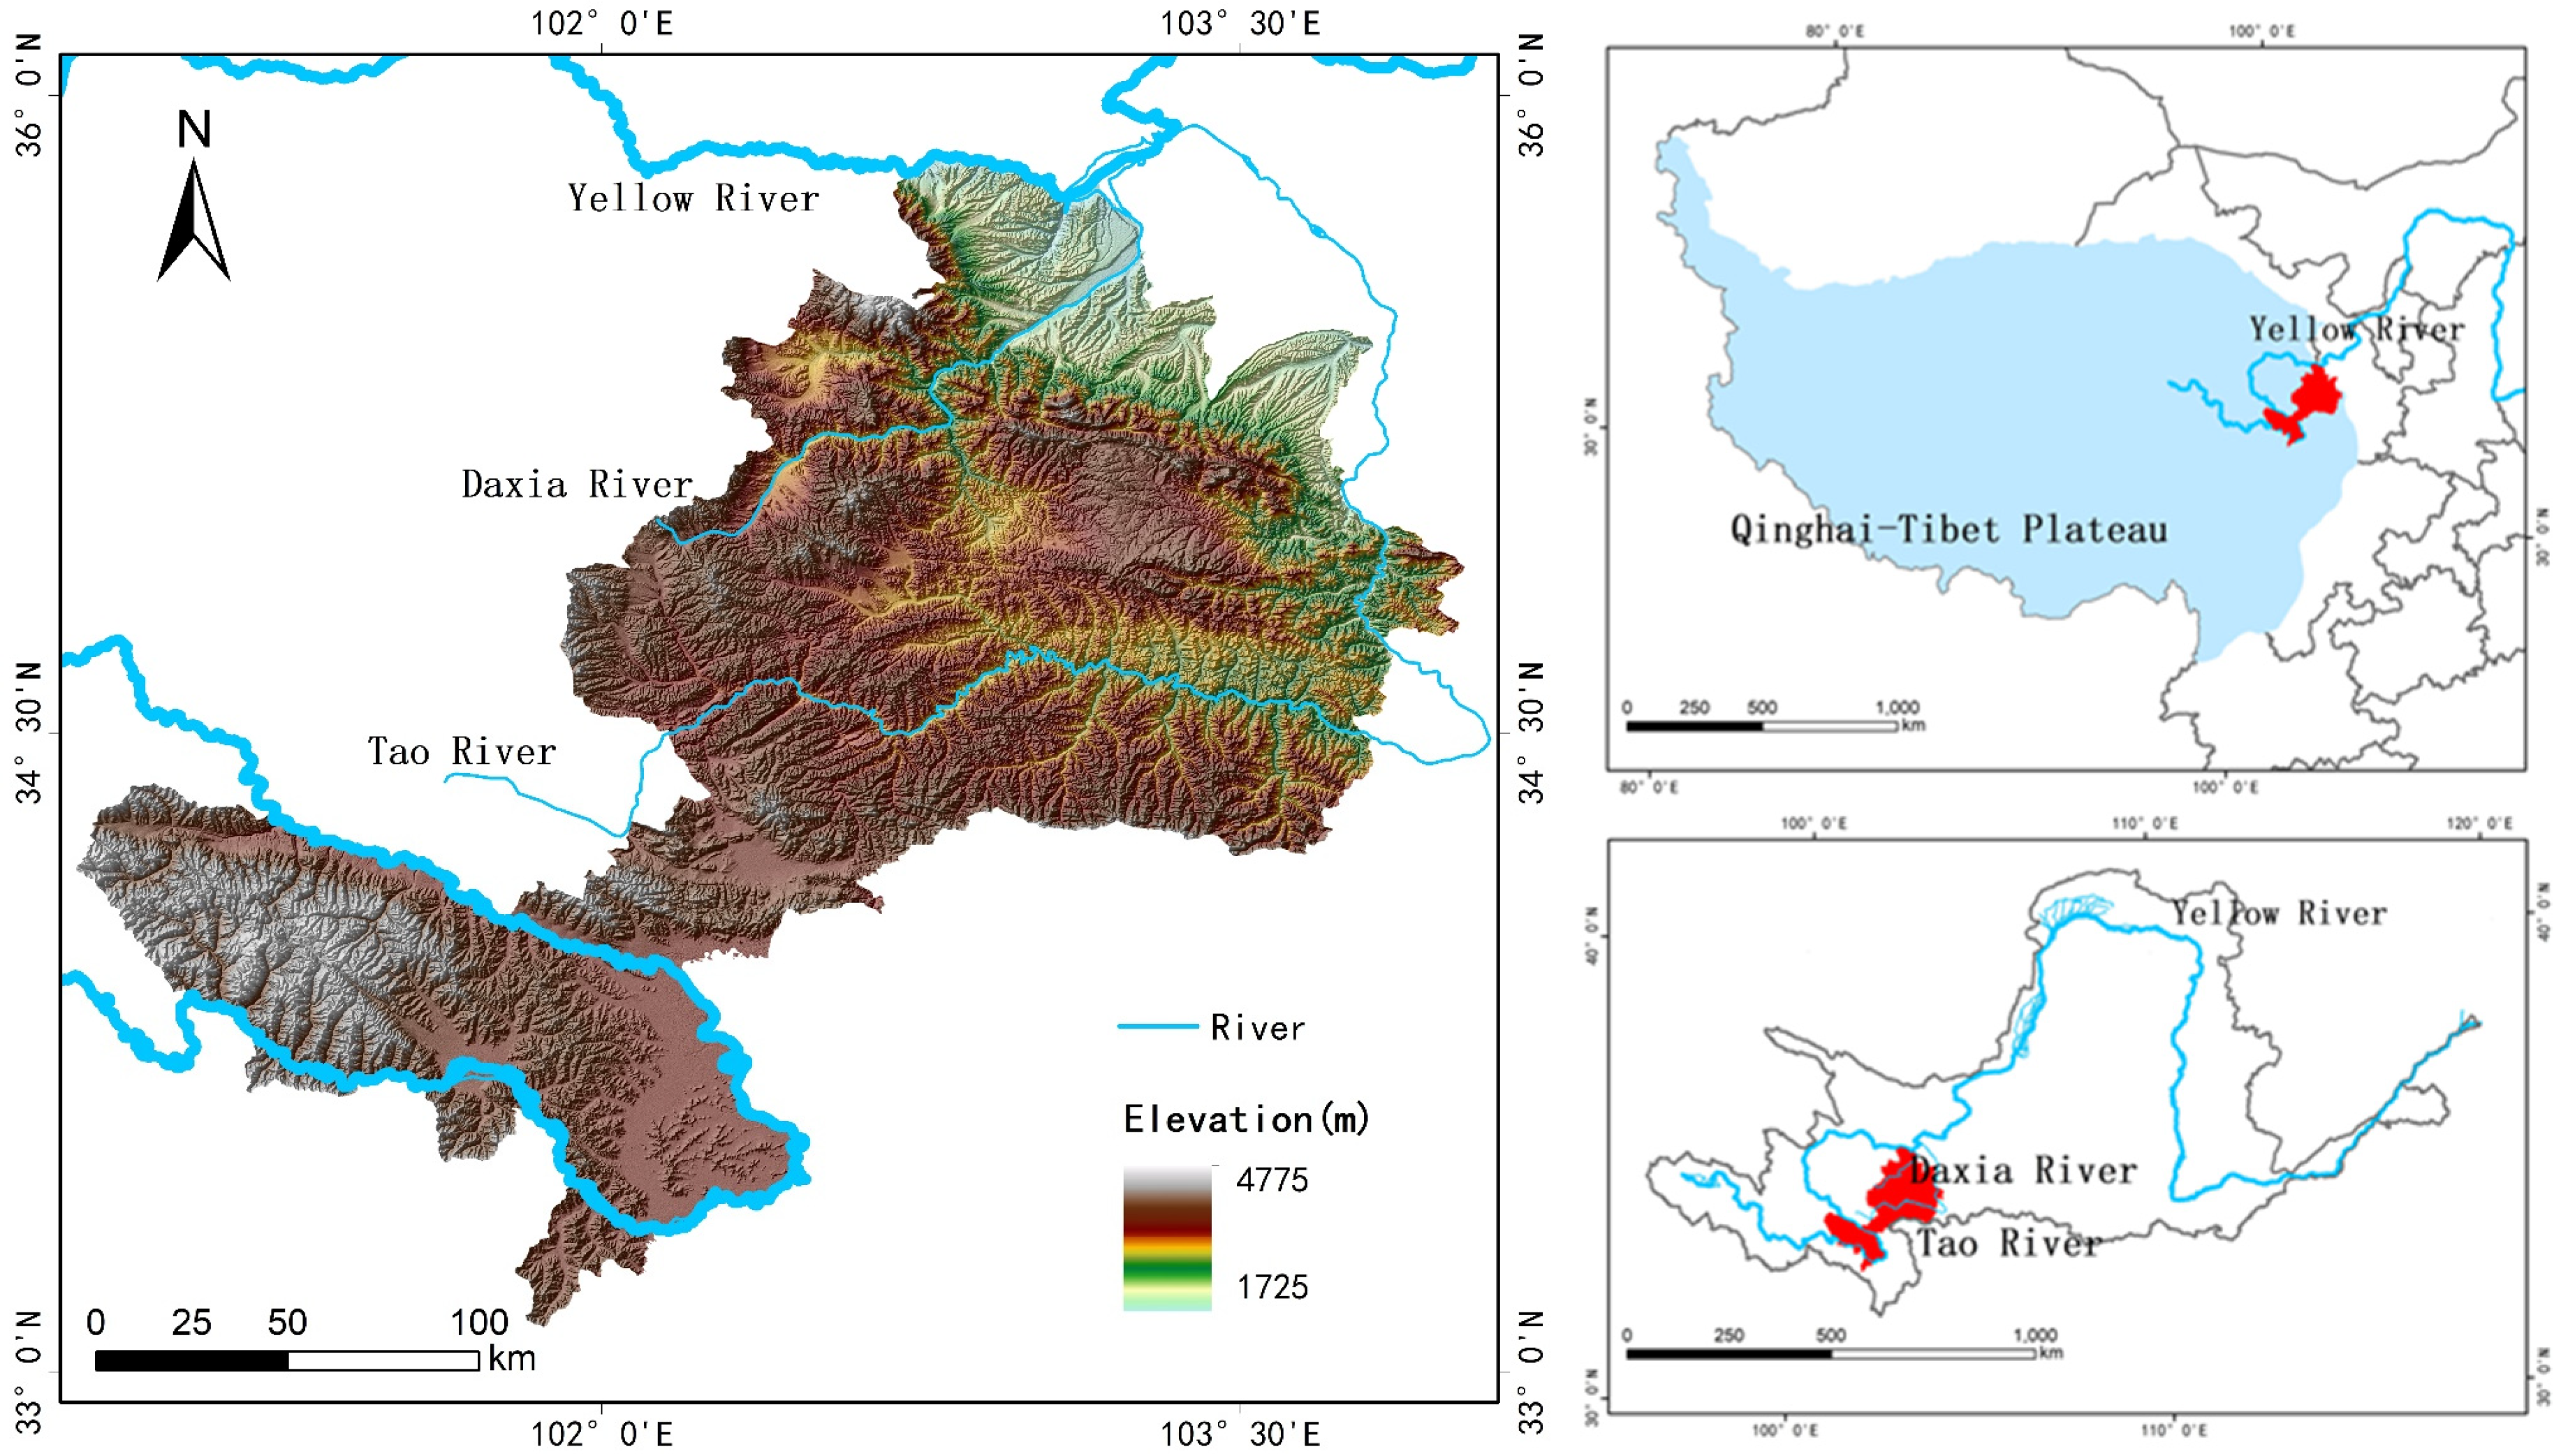
2.1. Study Area
2.2. Data
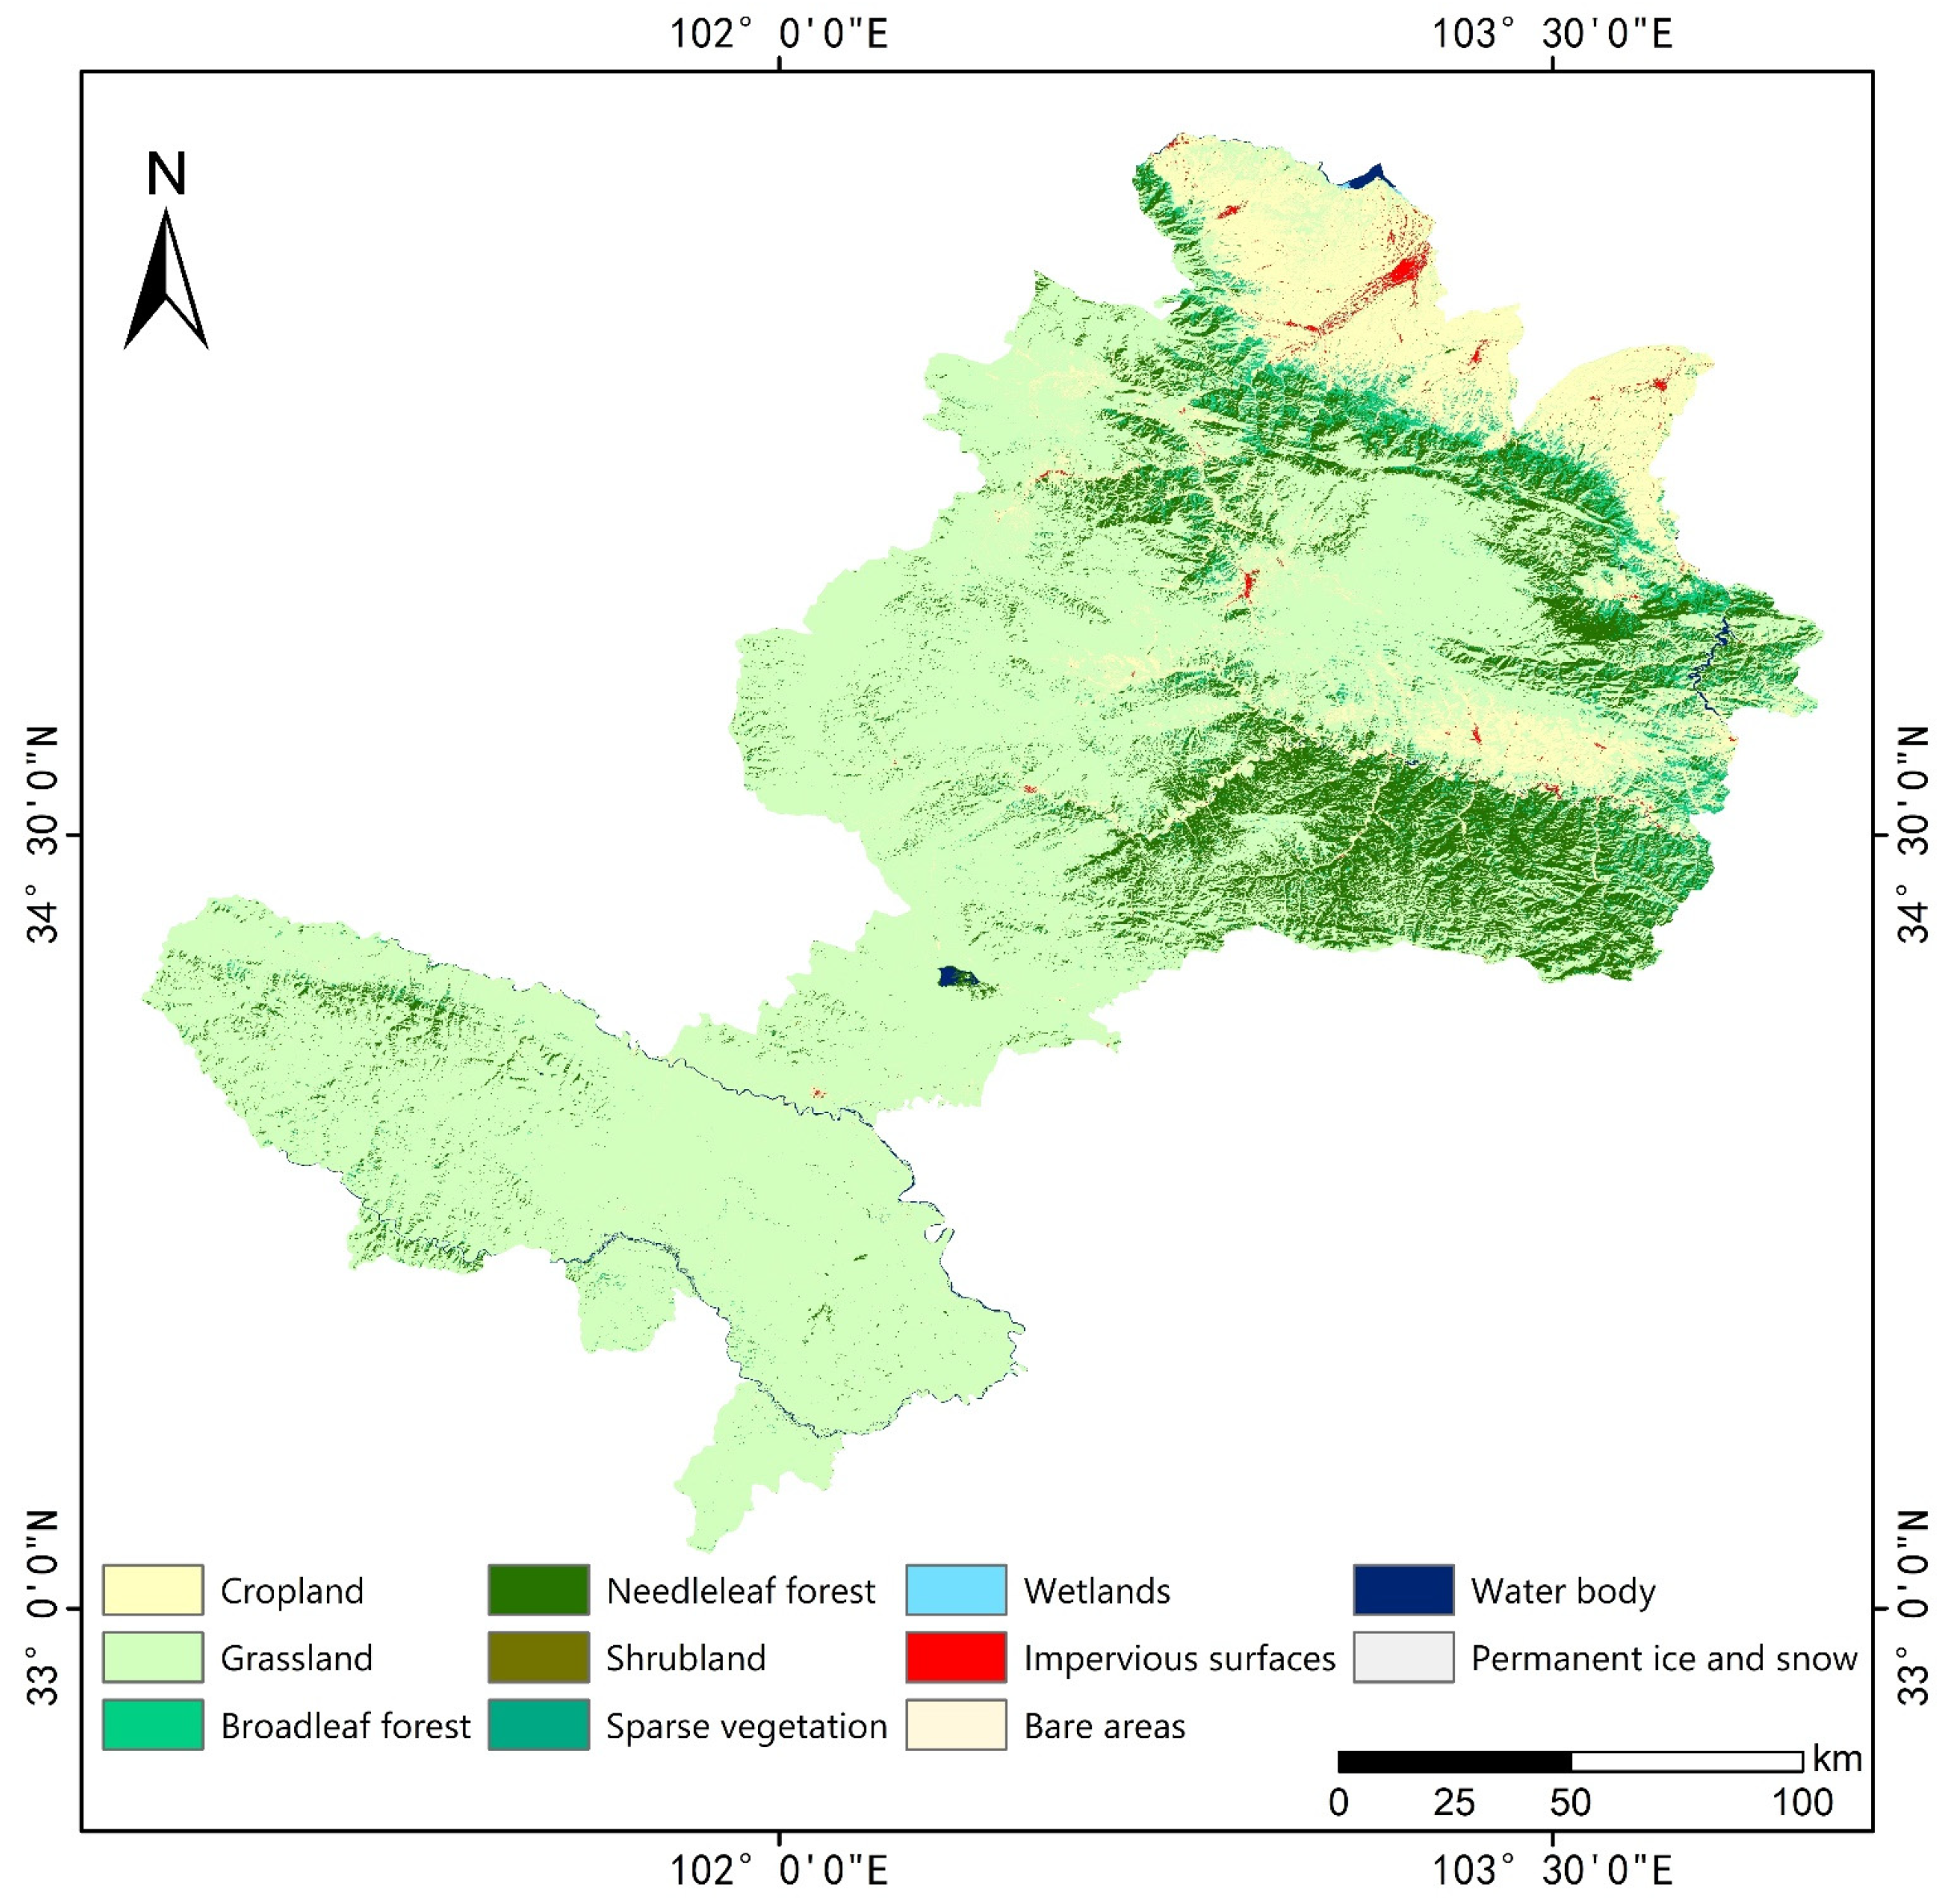
2.2.1. Ecosystem Types
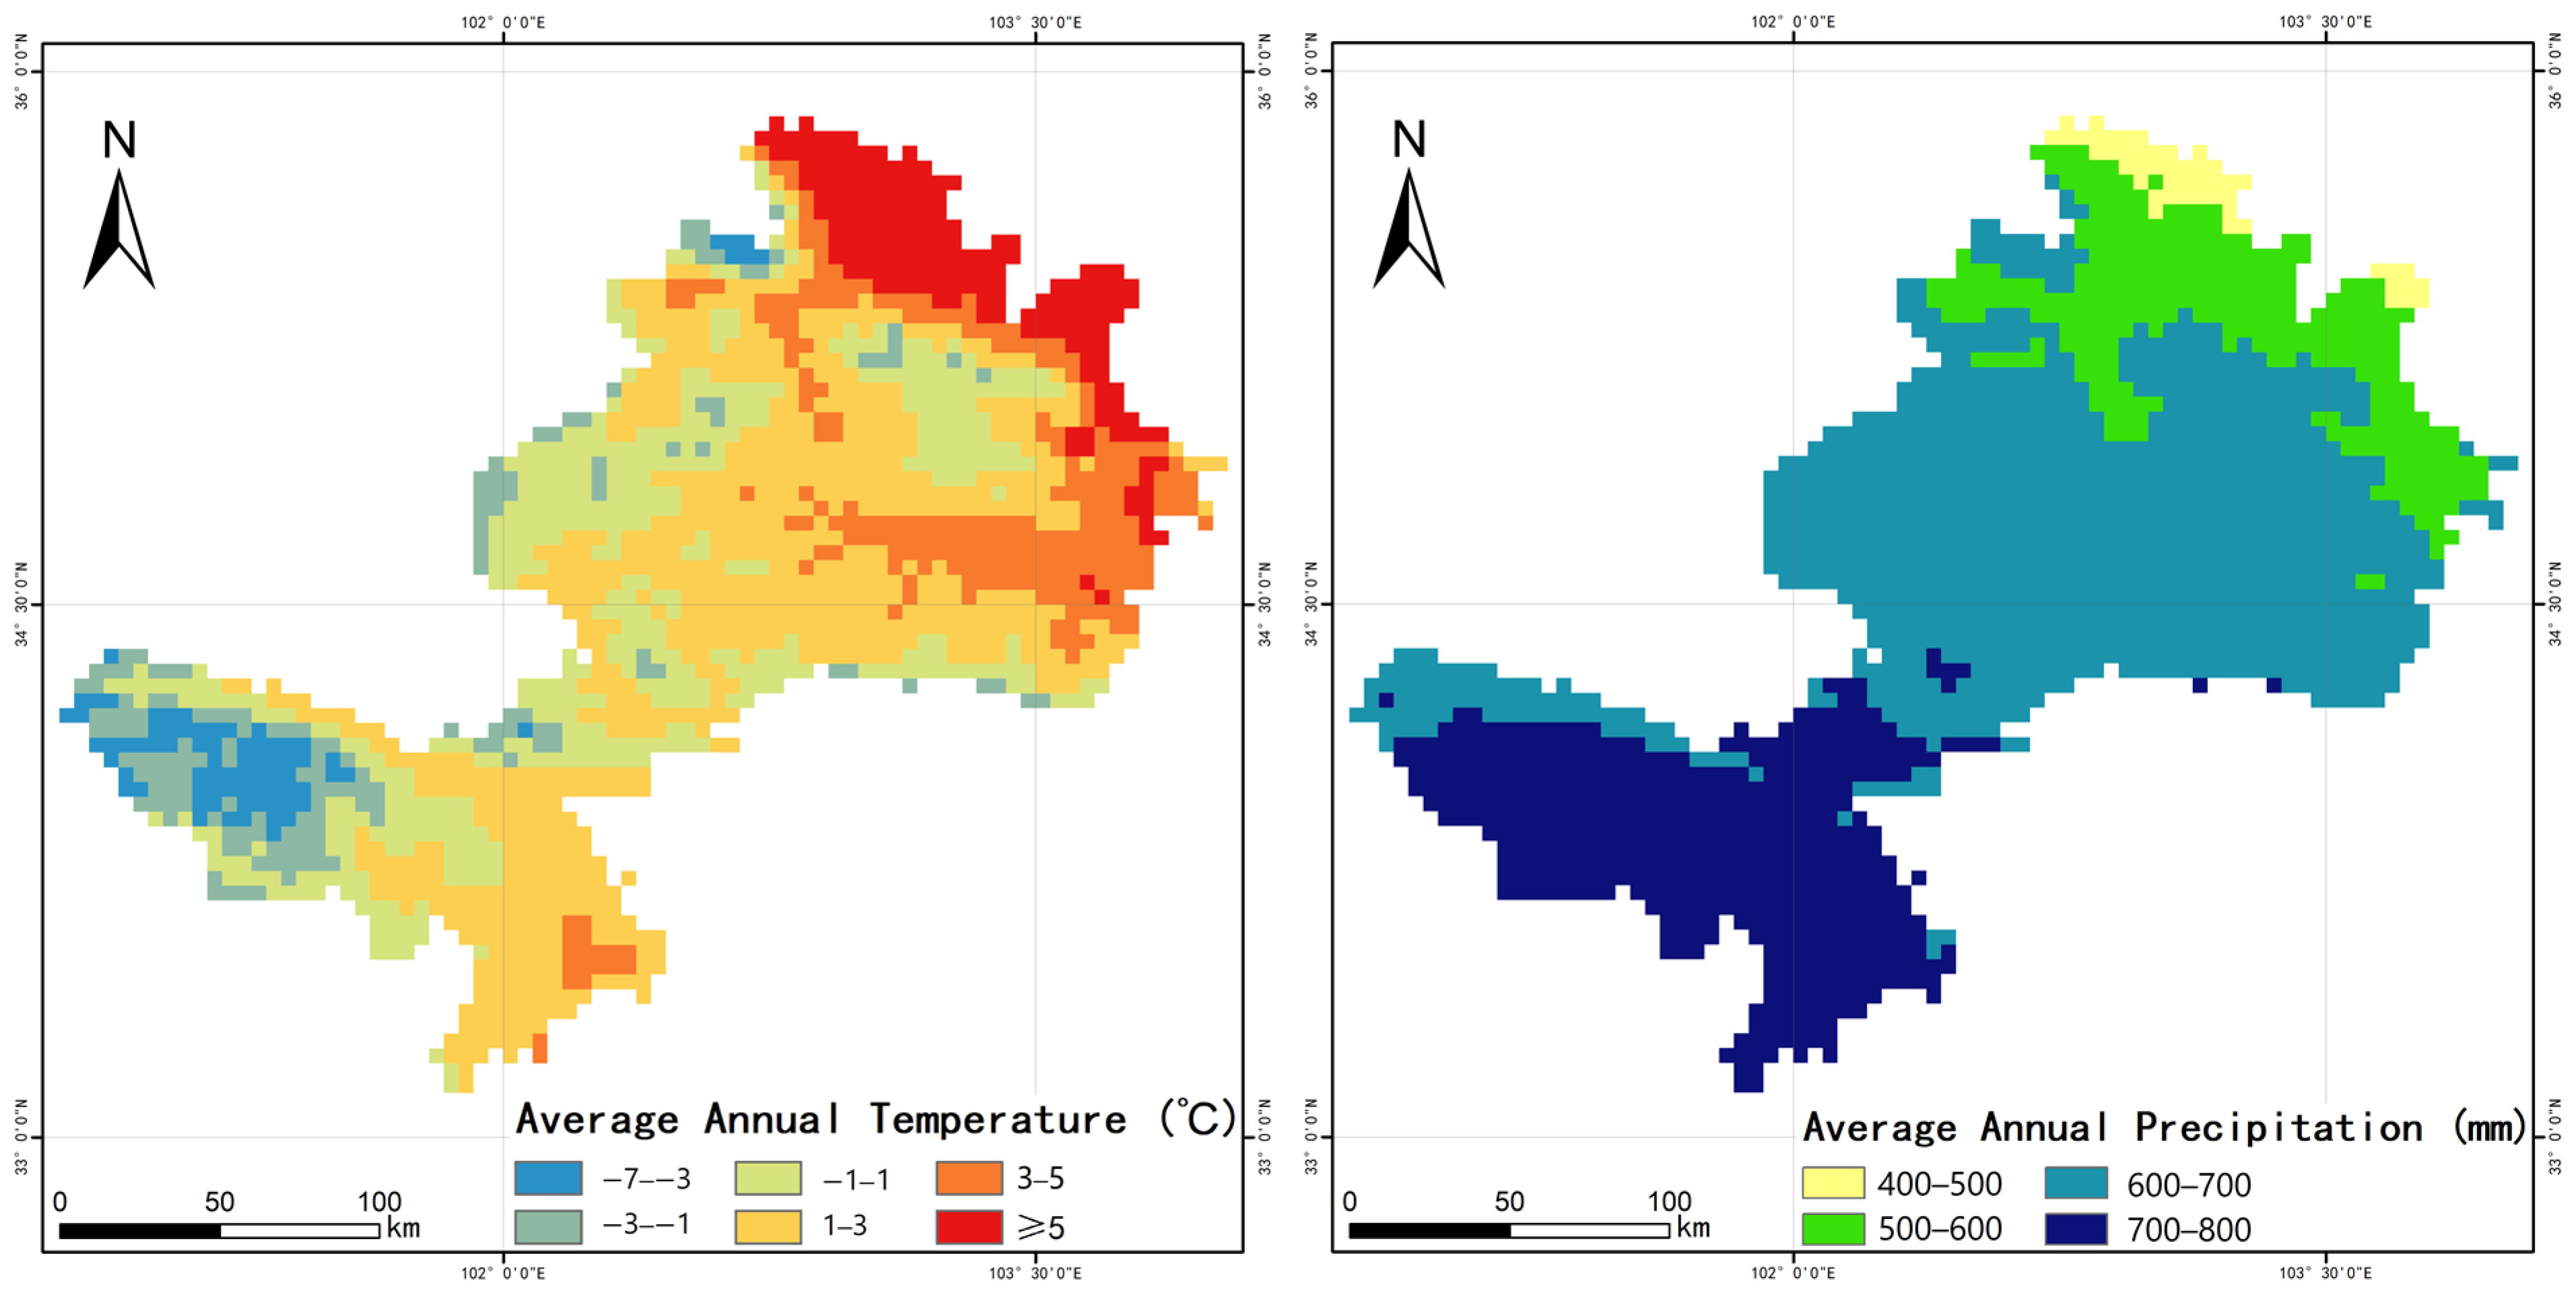
2.2.2. Precipitation and Temperature Data
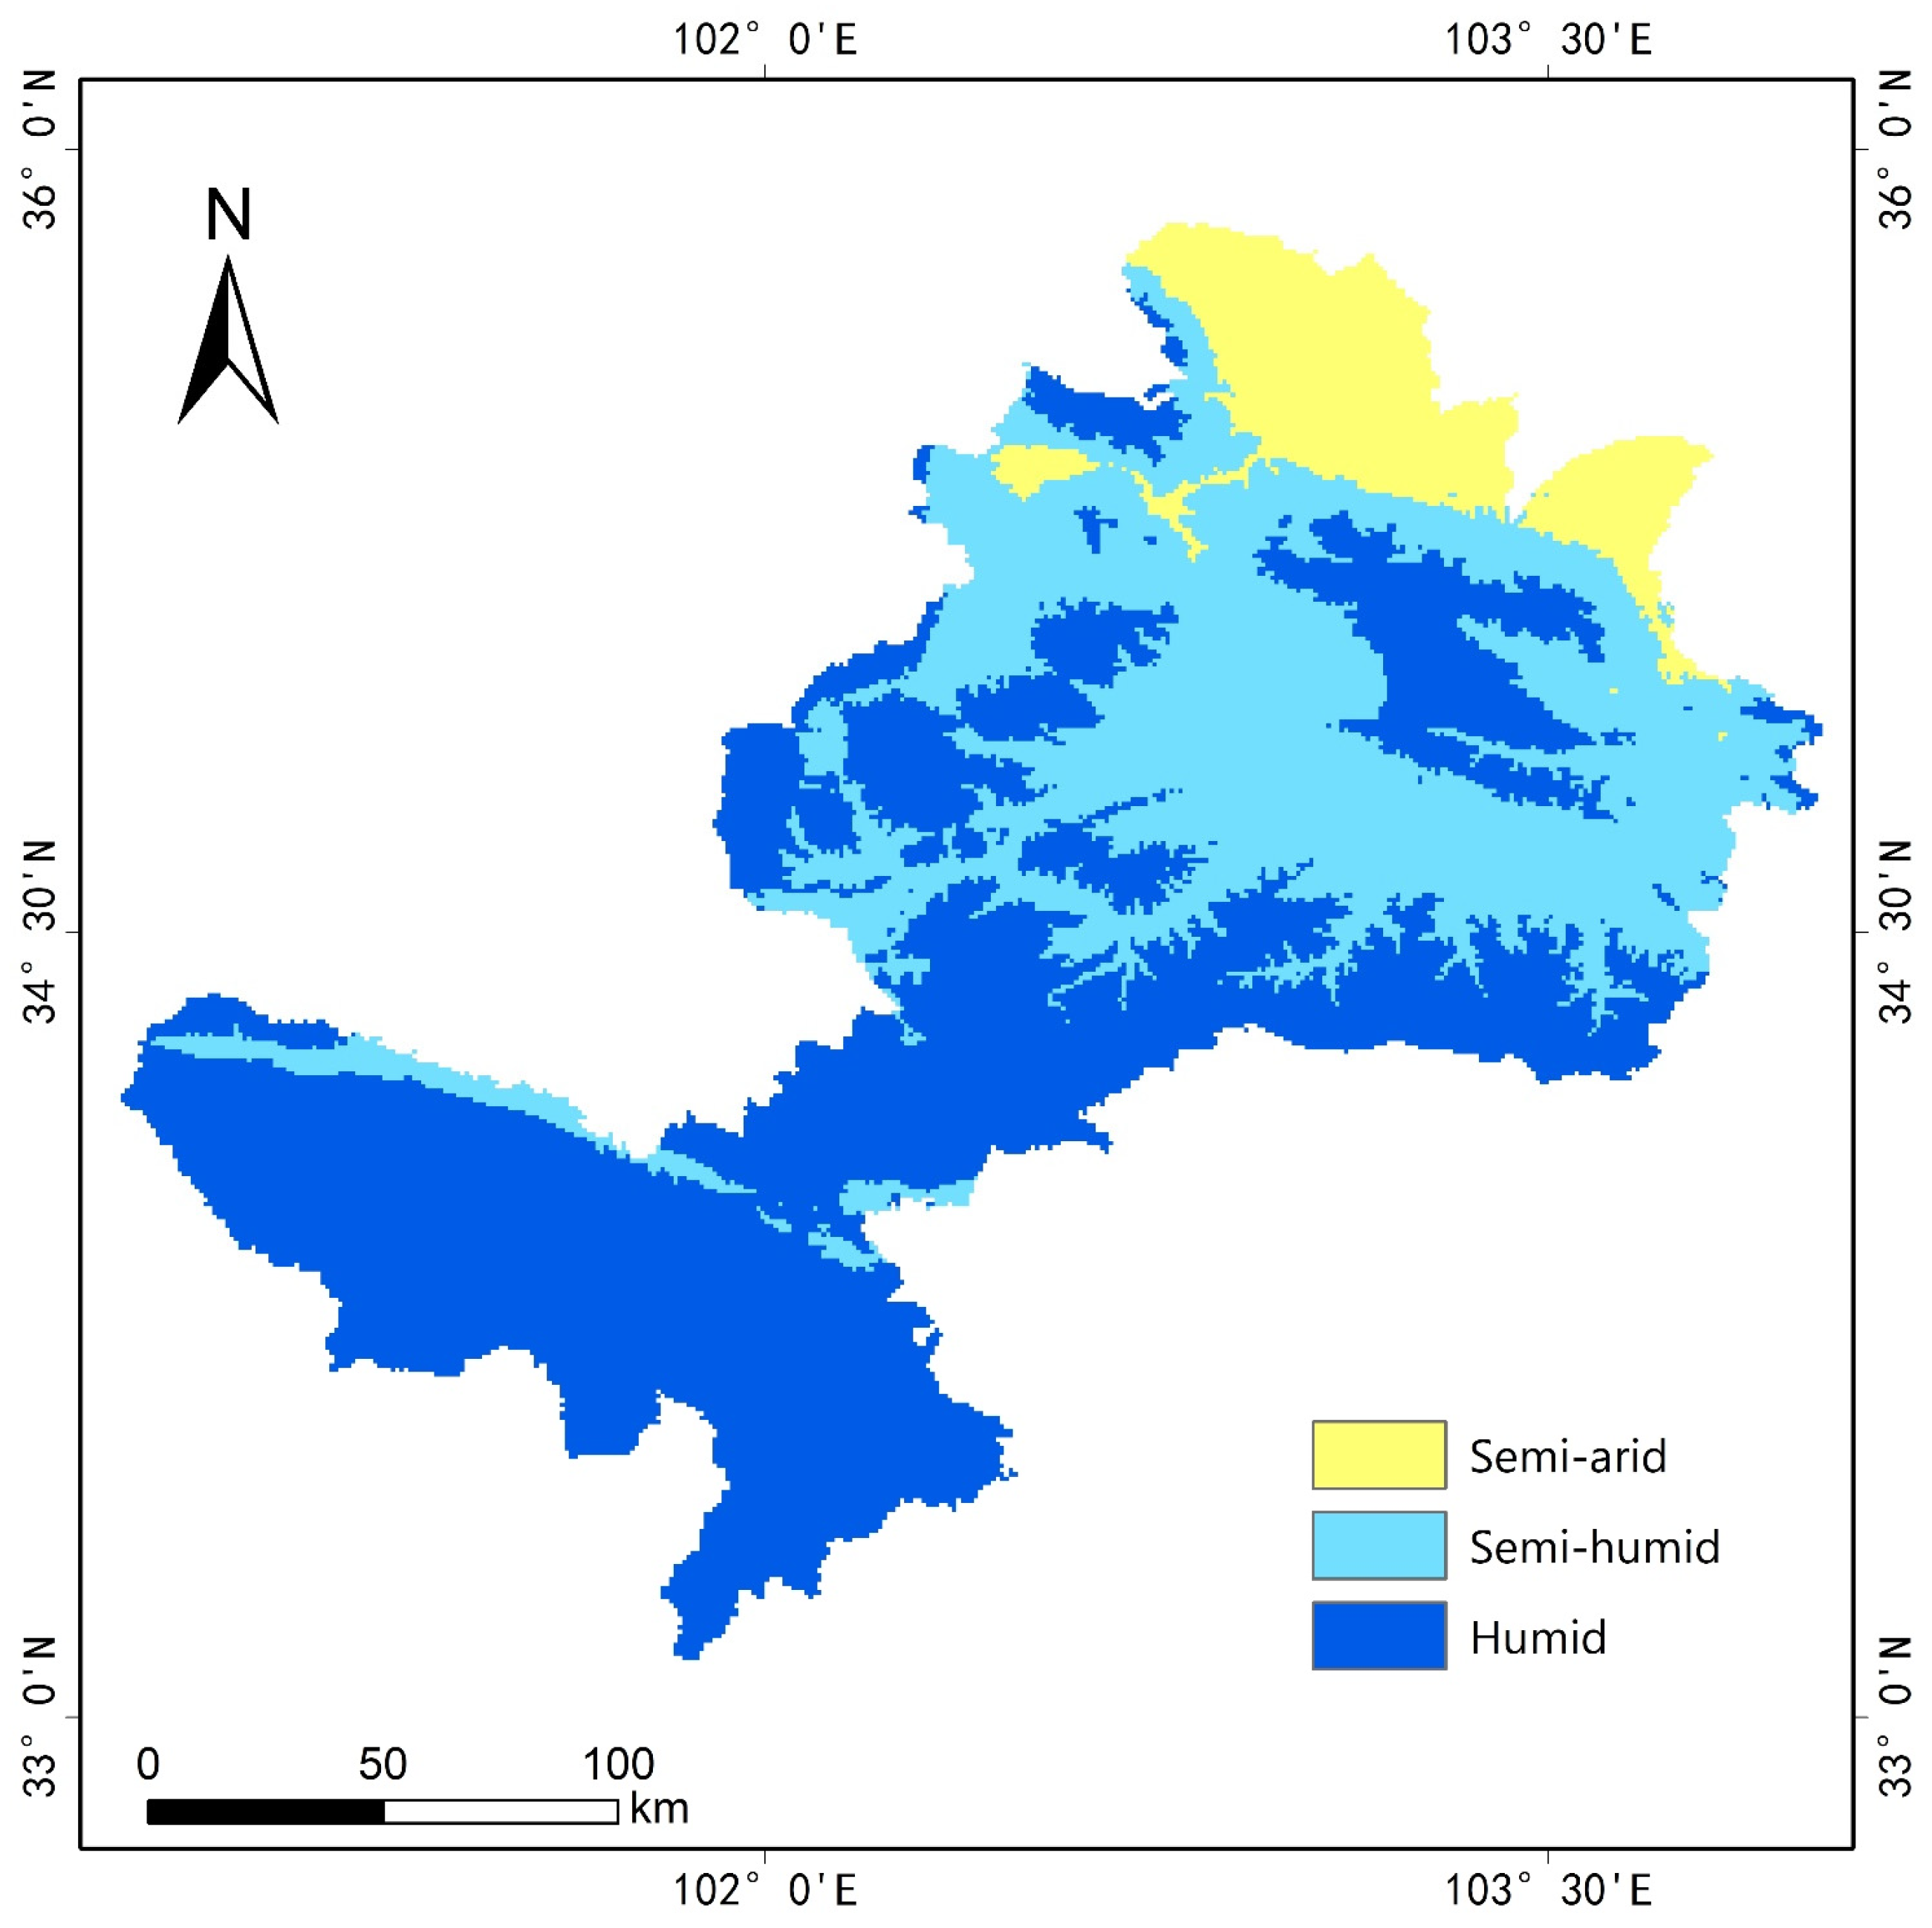
2.2.3. Aridity Index
2.2.4. Fractional Vegetation Cover
2.3. Method
2.3.1. Aridity Index
2.3.2. Partial Correlation Analysis
2.3.3. Residual Analysis
3. Results
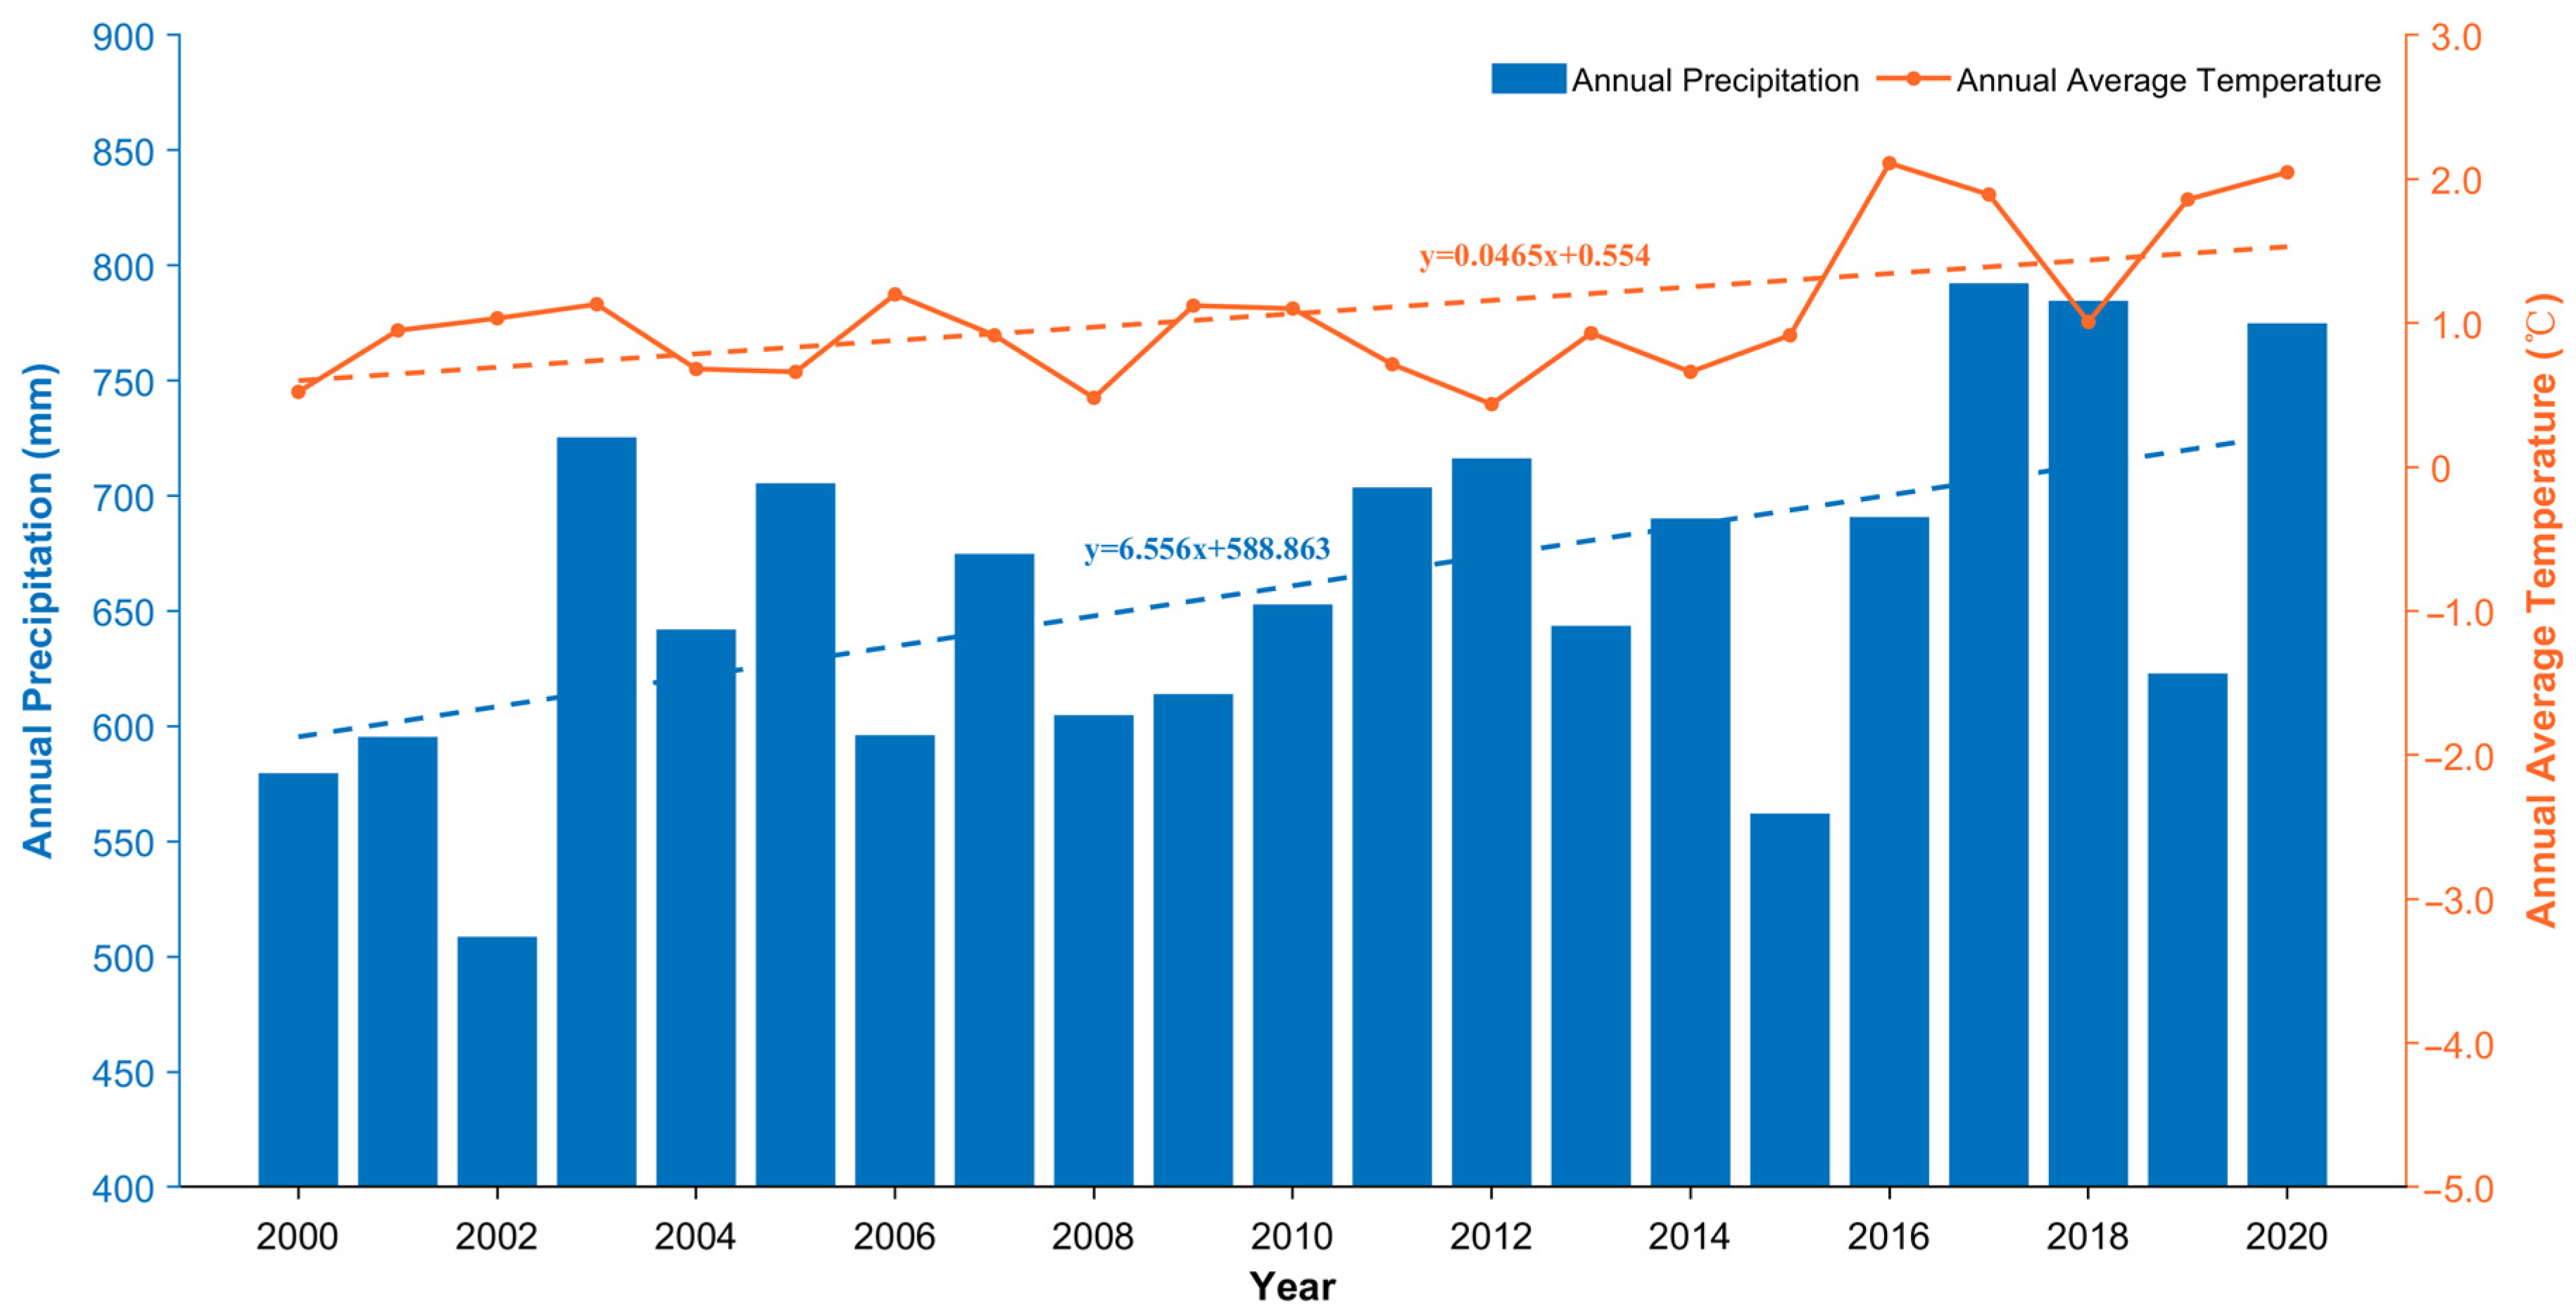
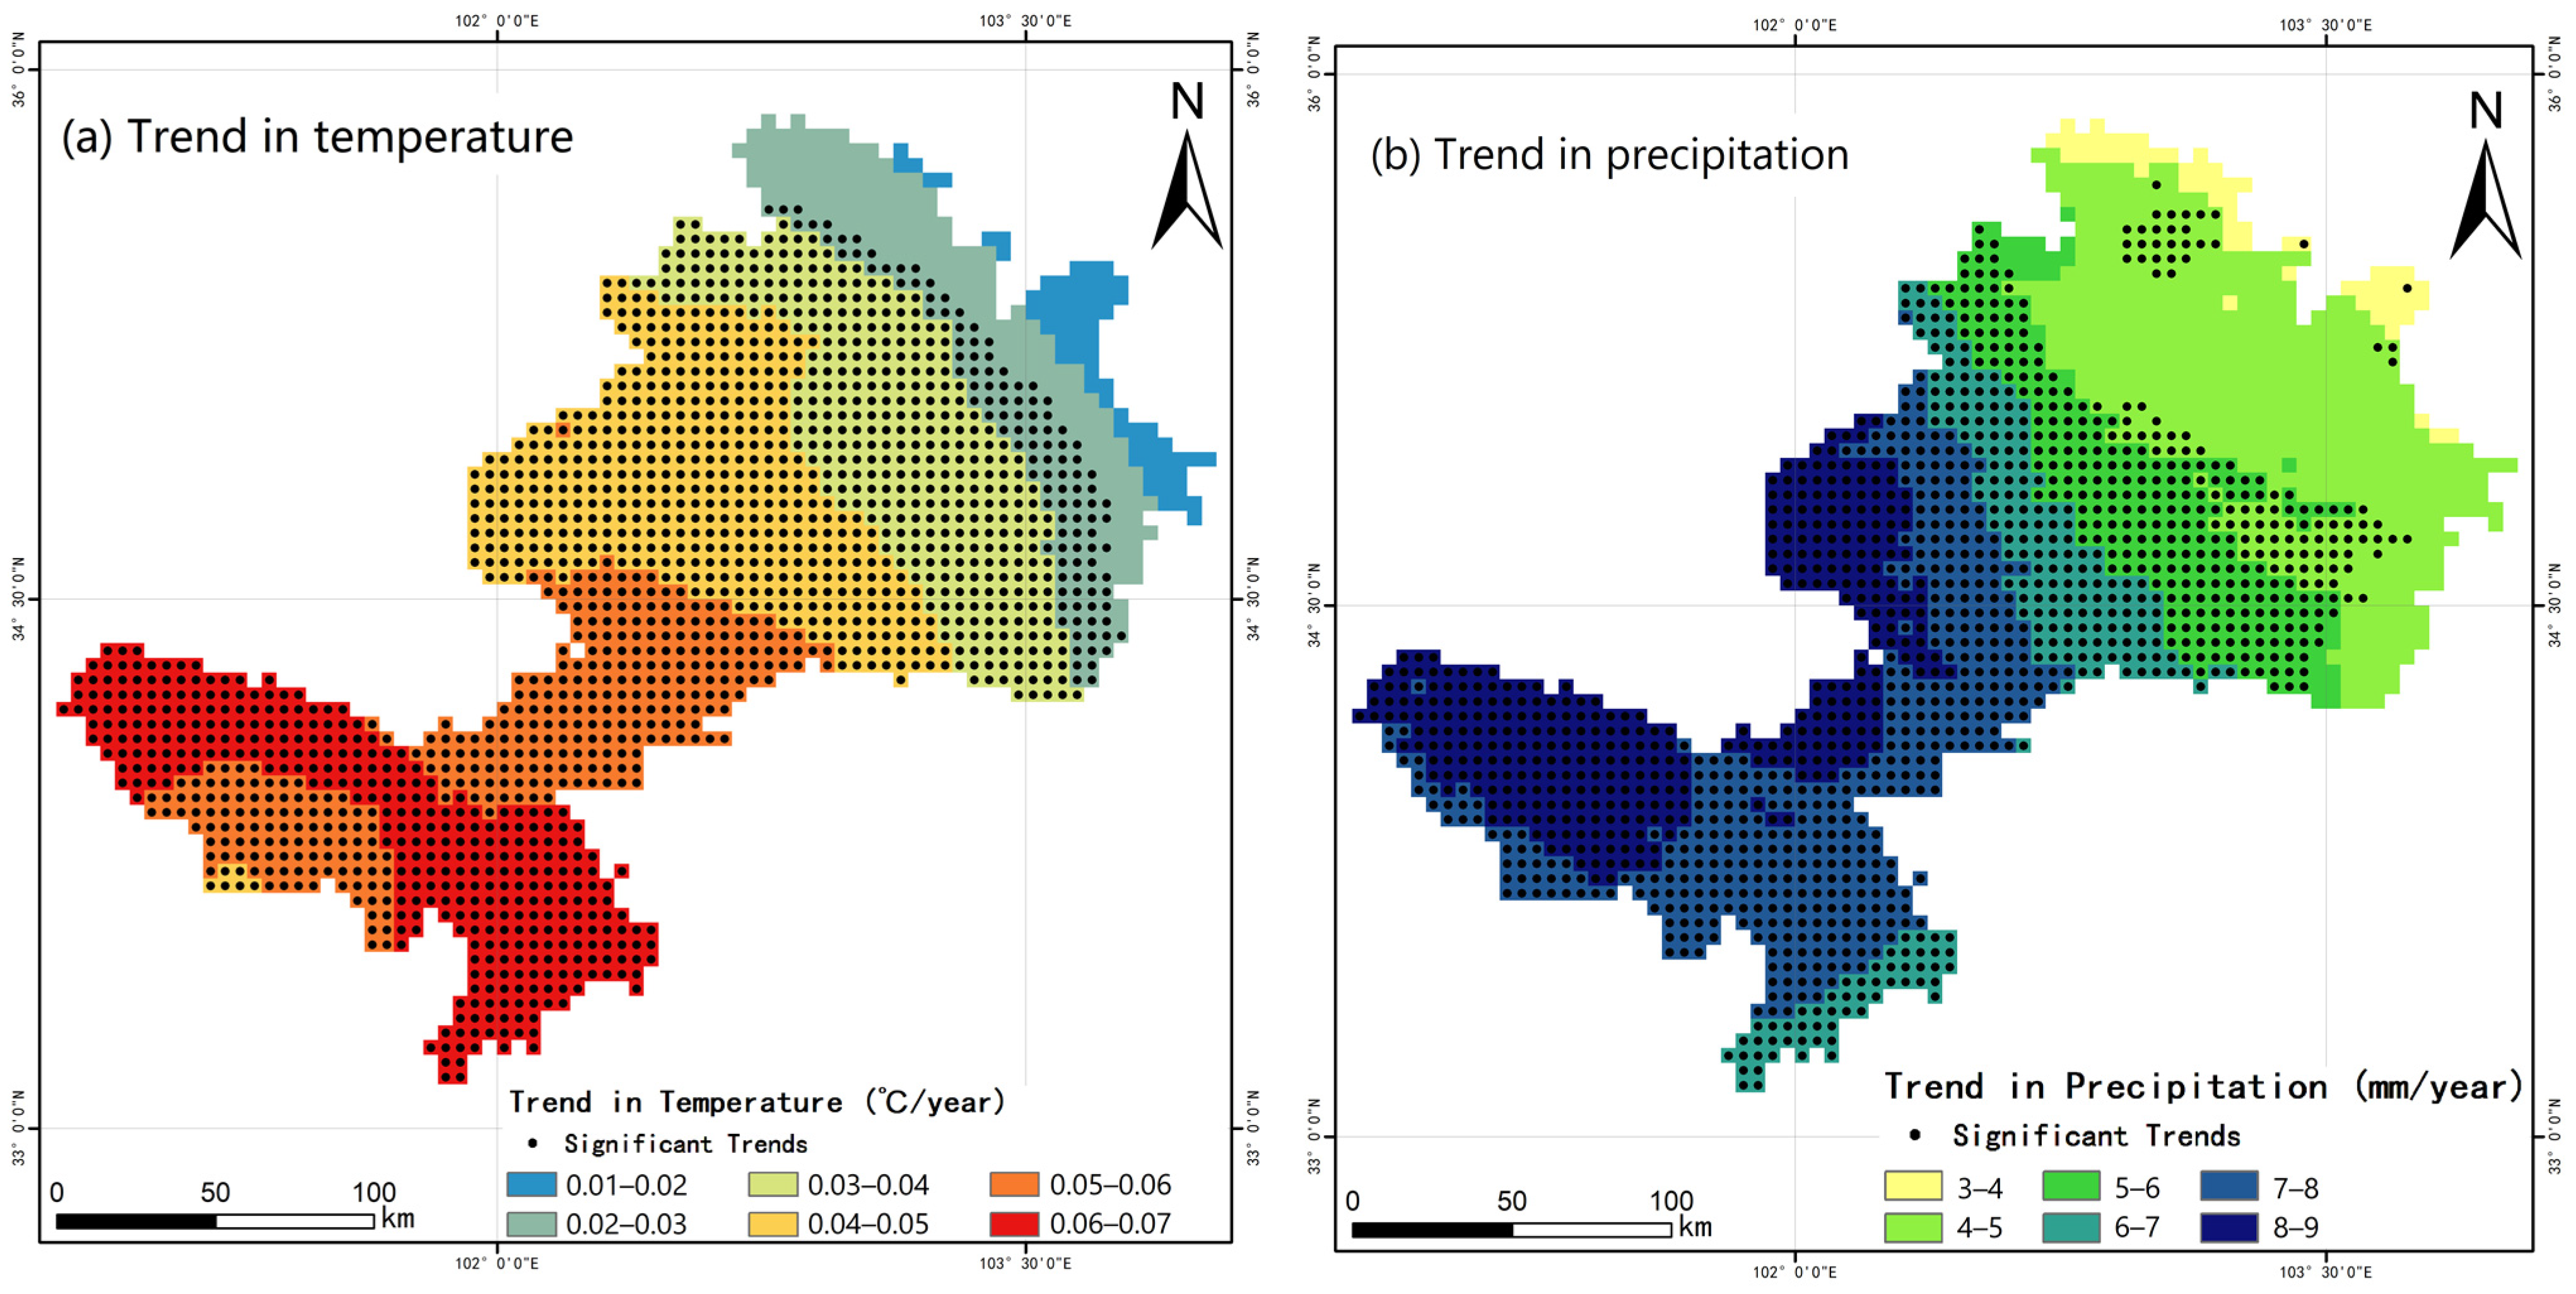
3.1. Significant Increase in Precipitation but Not Temperature from 2000 to 2020 over the Study Area
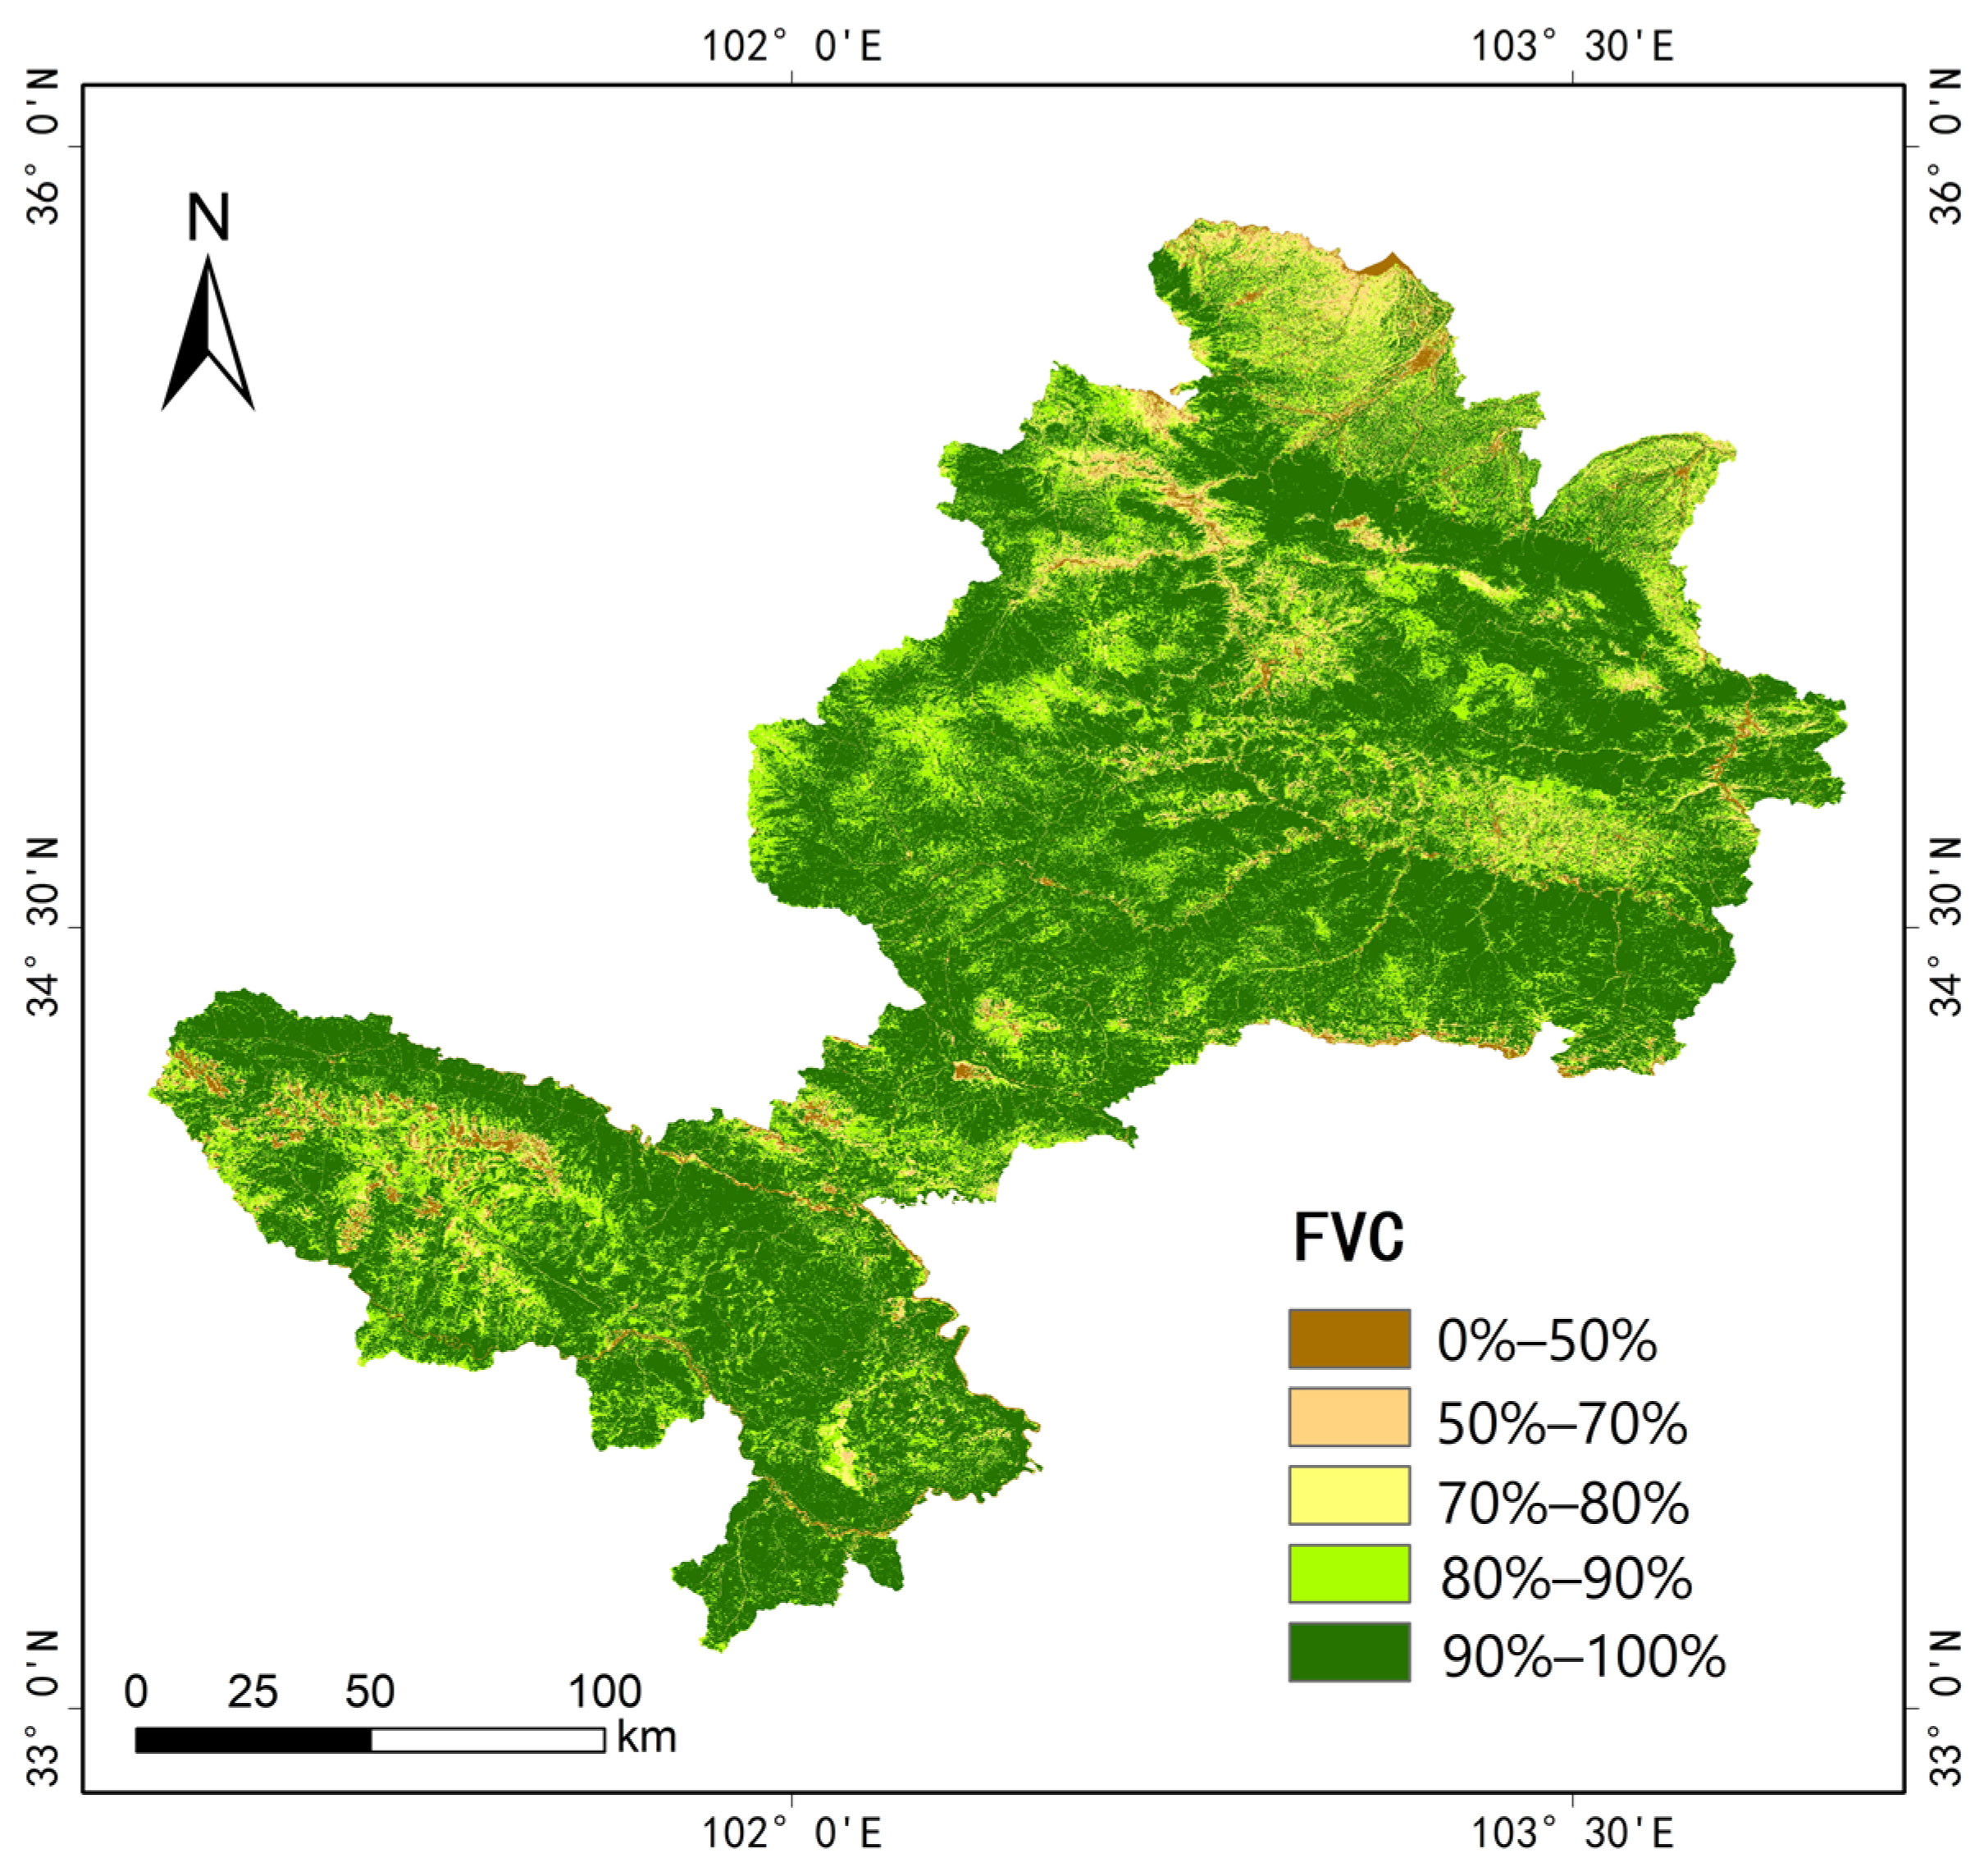
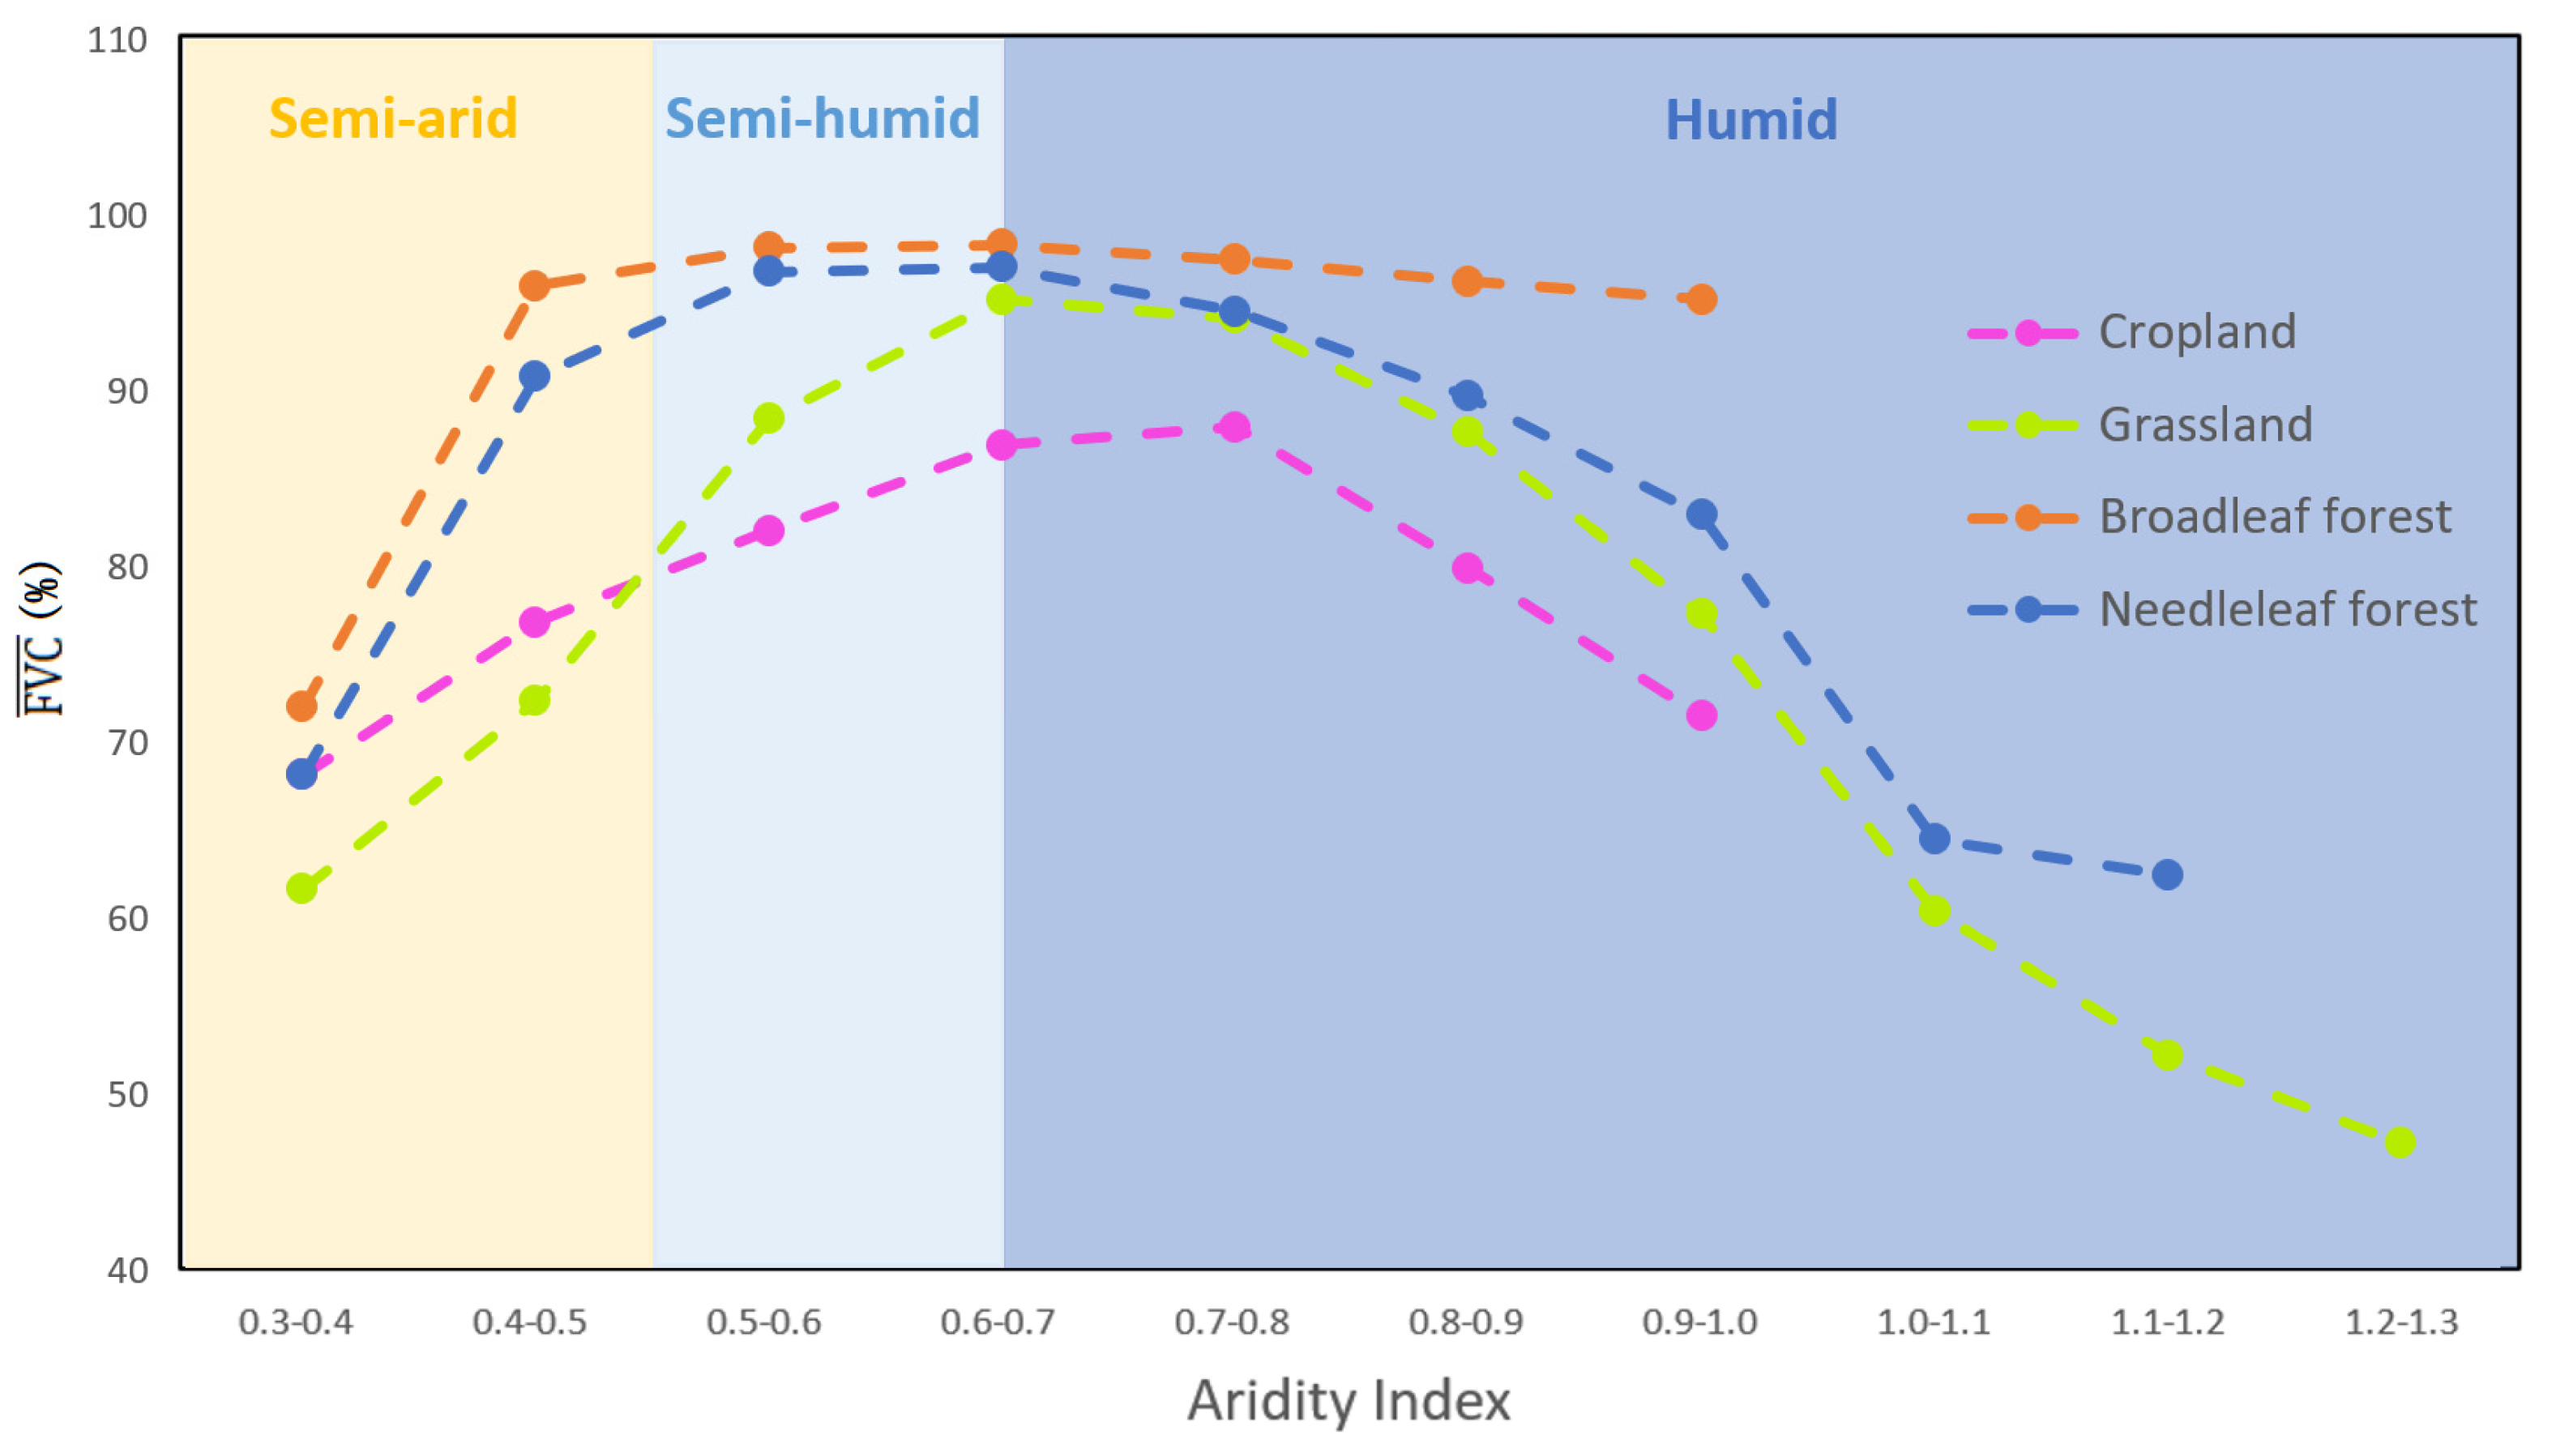
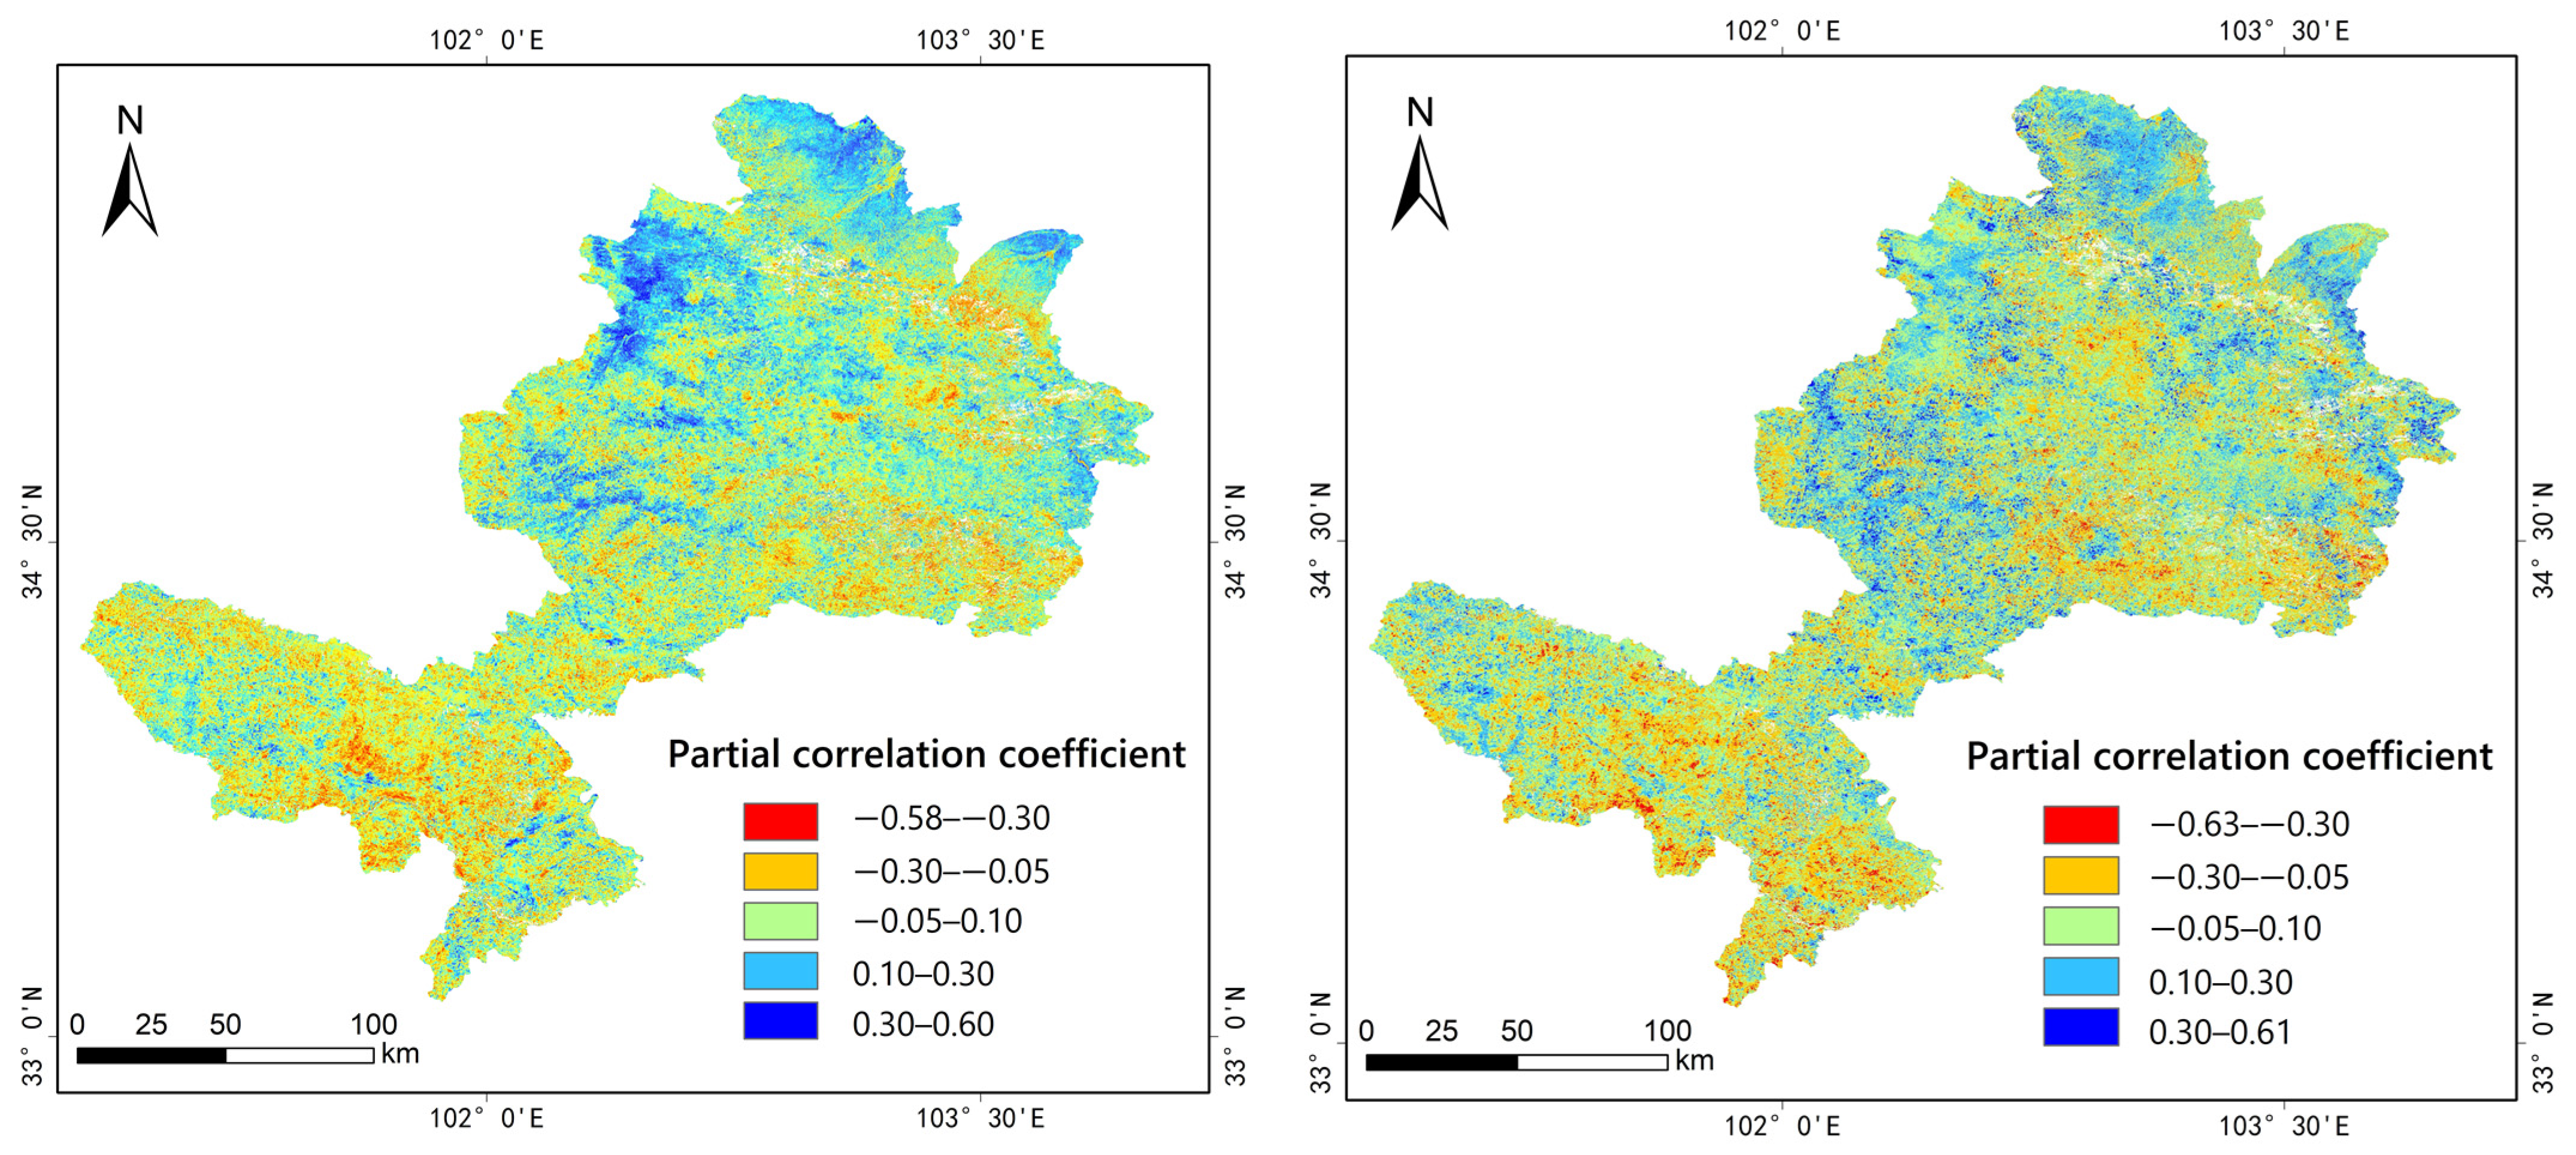
3.2. Aridity and Ecosystem Types Co-Determined the Spatial Pattern of FVC
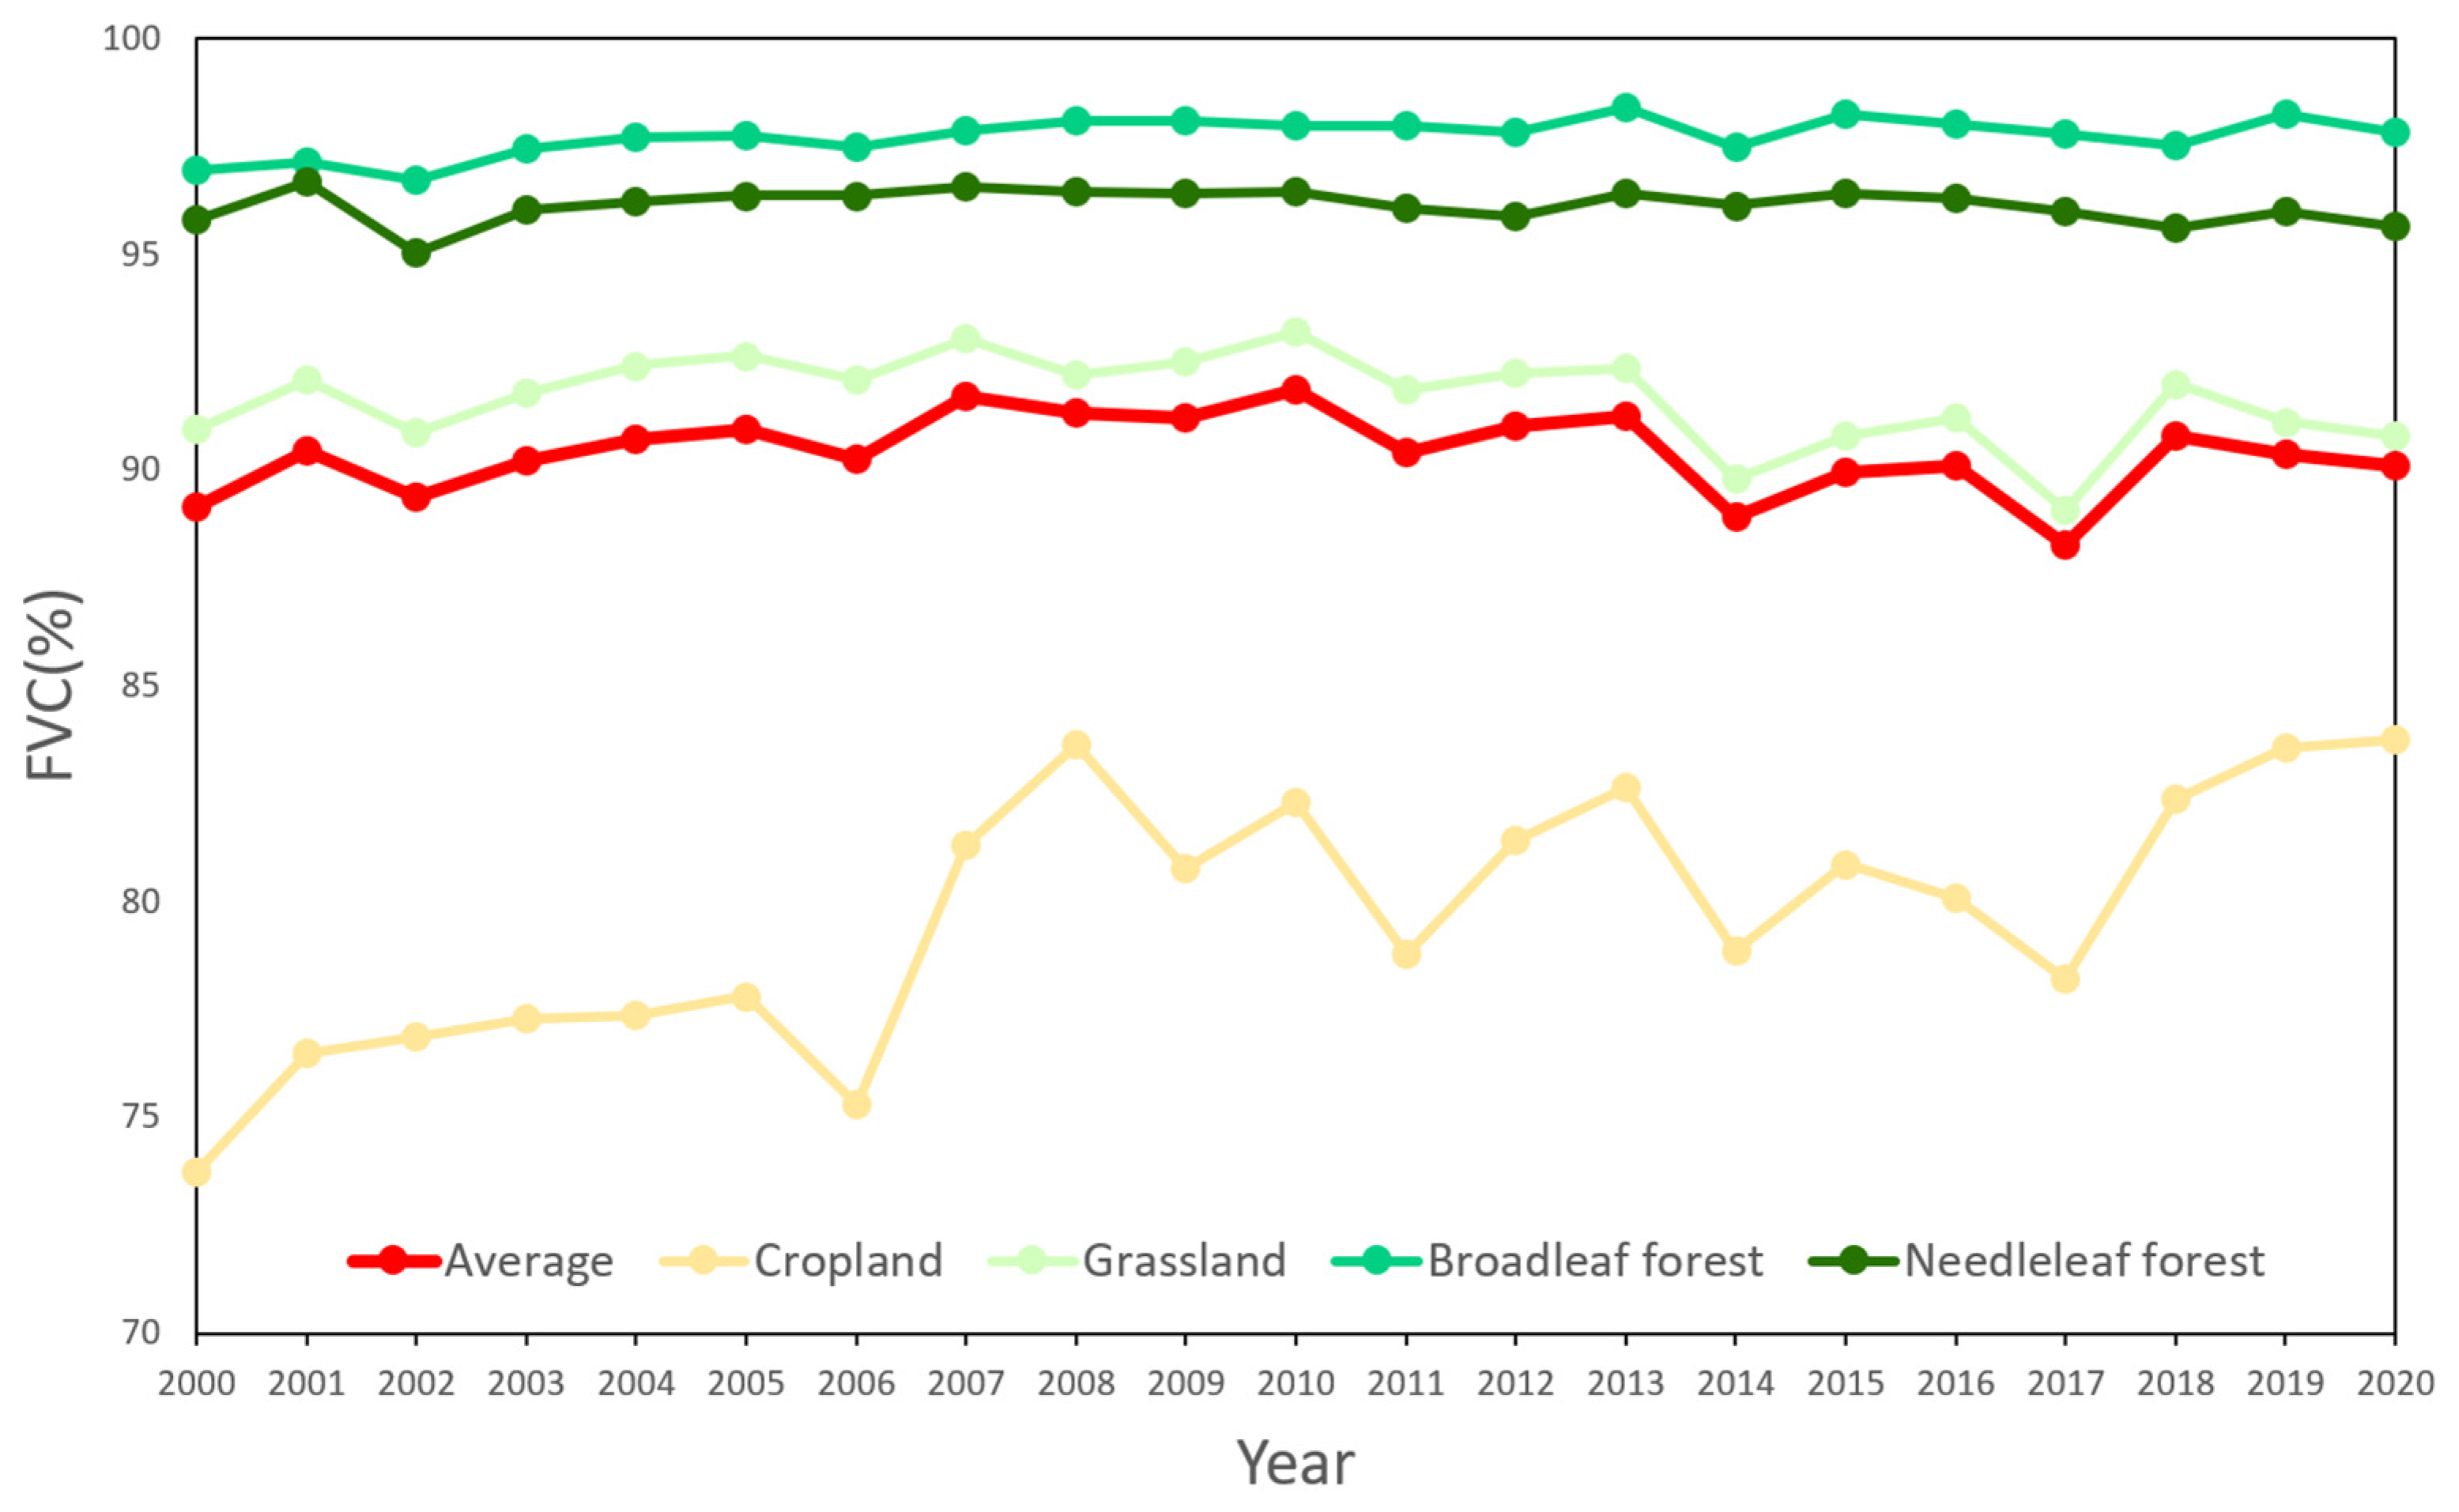
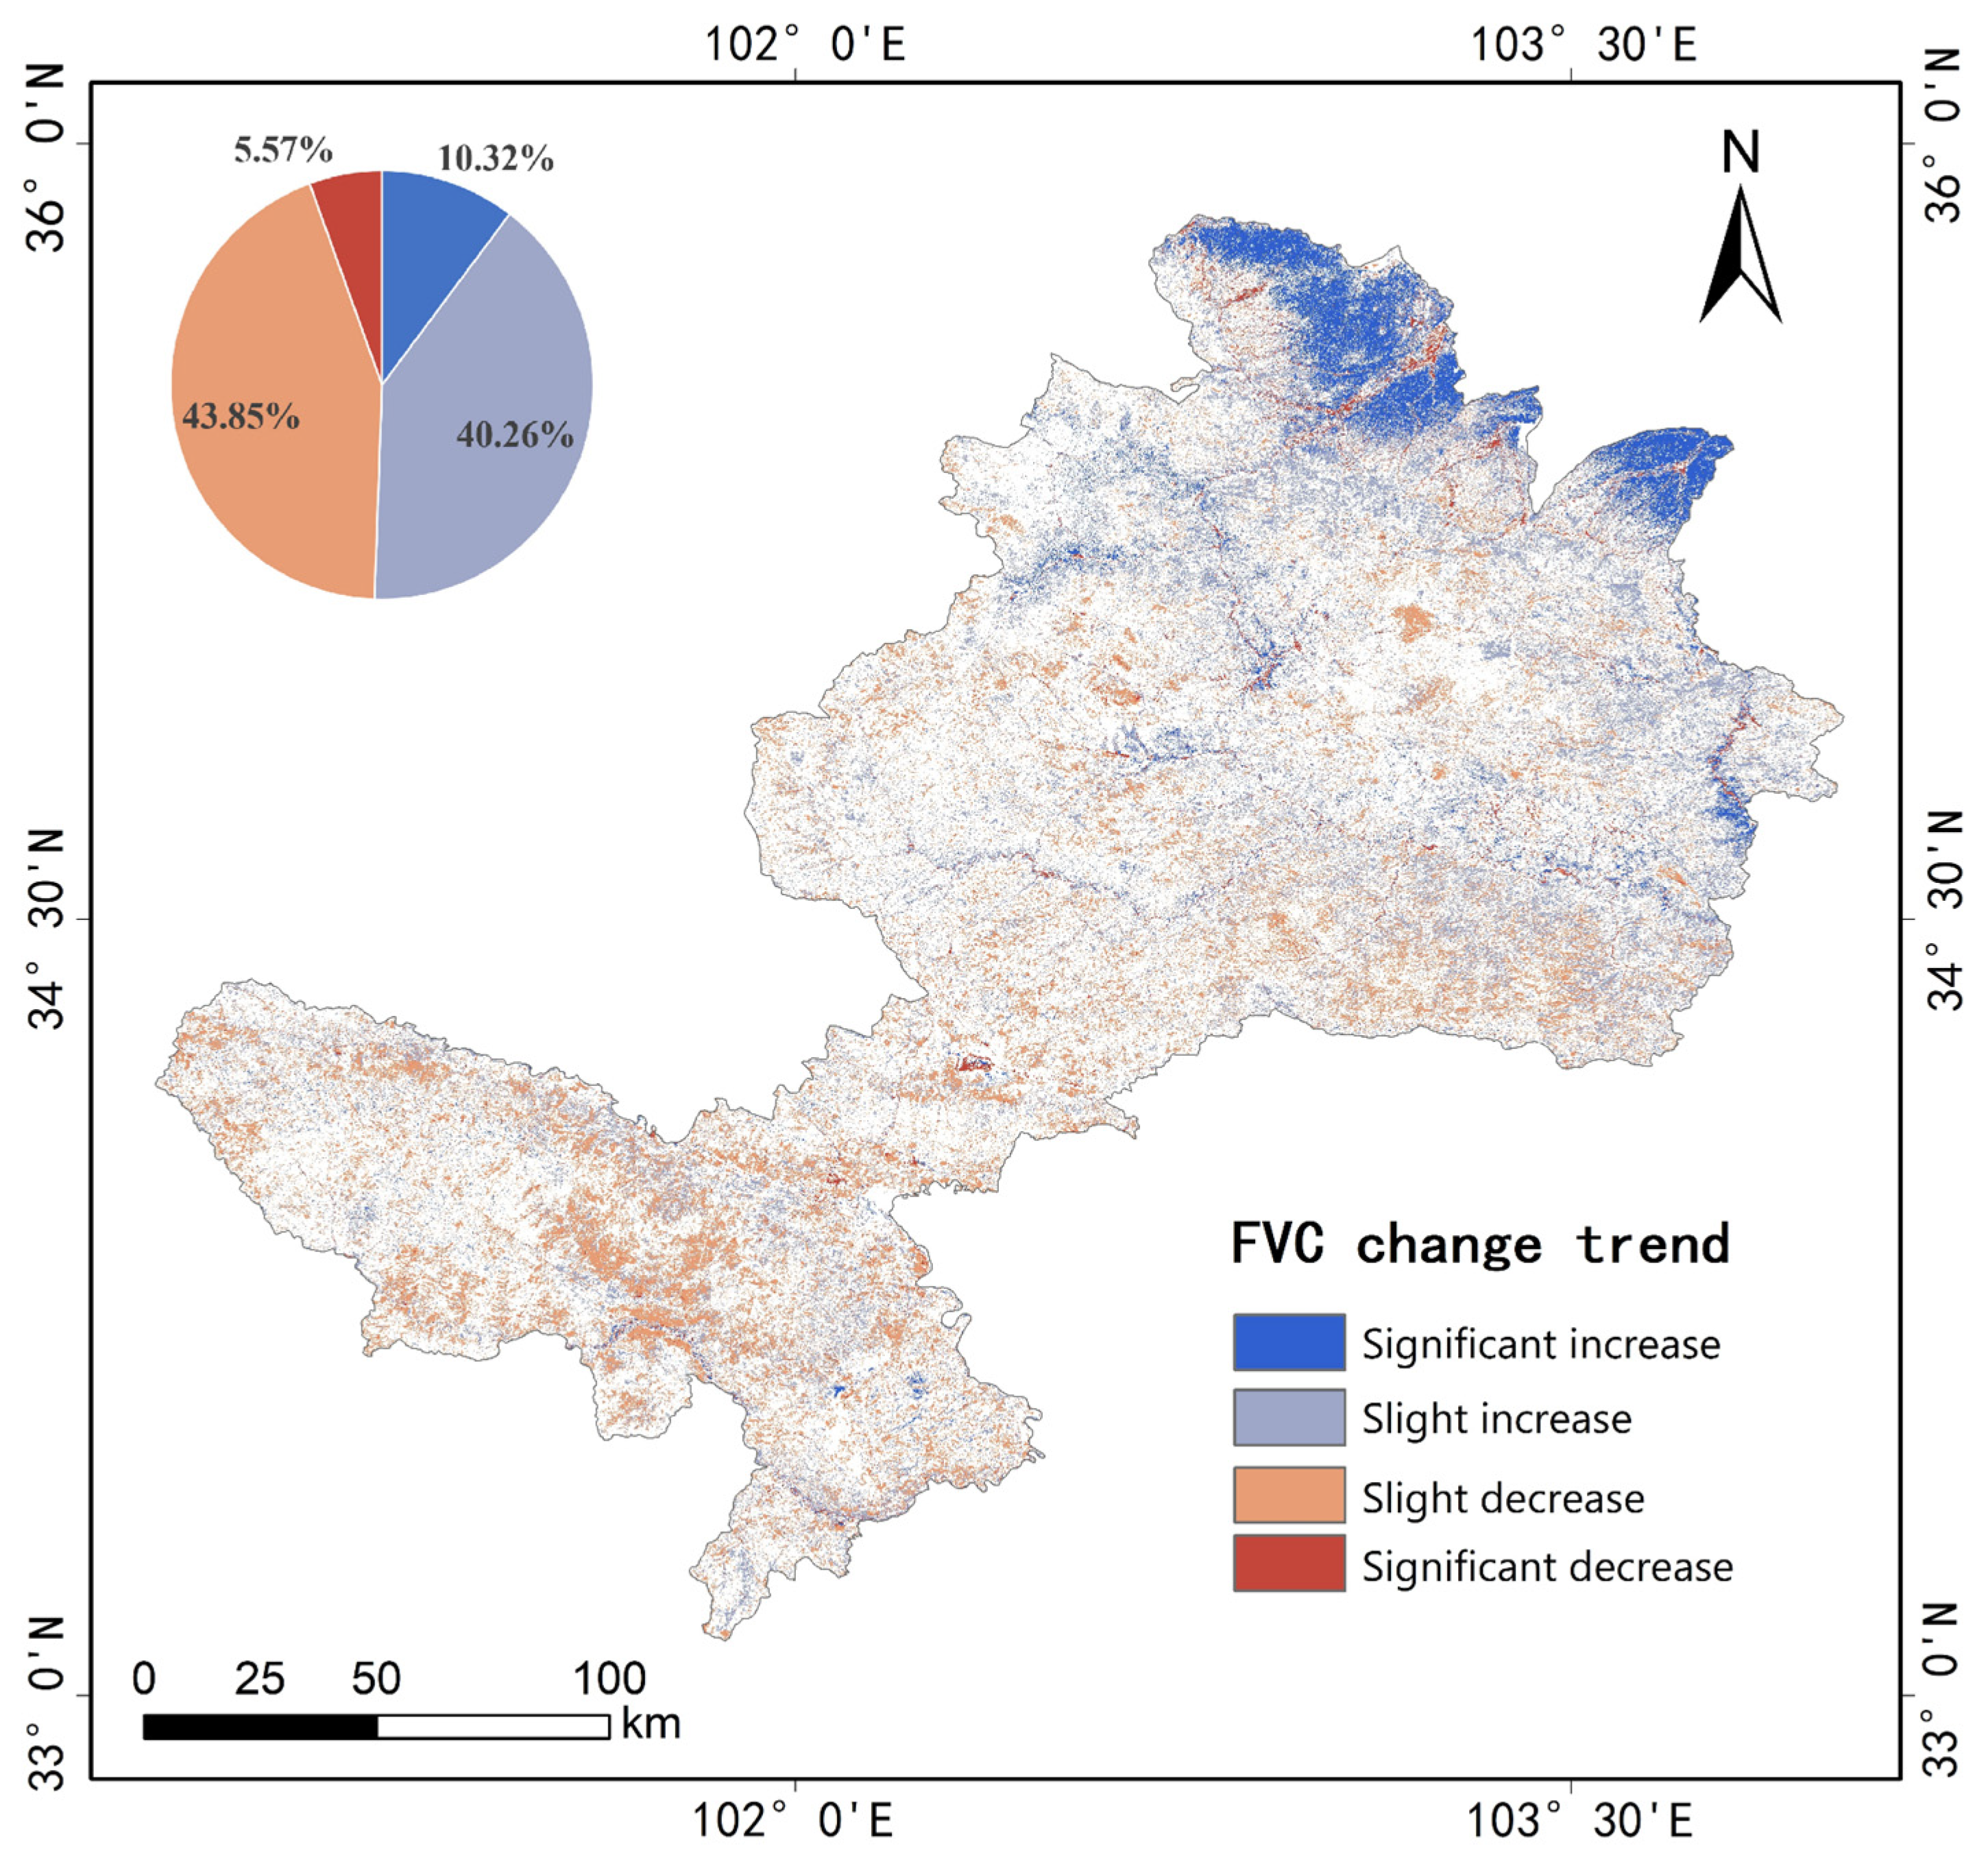
3.3. FVC Did Not Show a Significant Trend over the Majority of the GP from 2000 to 2020
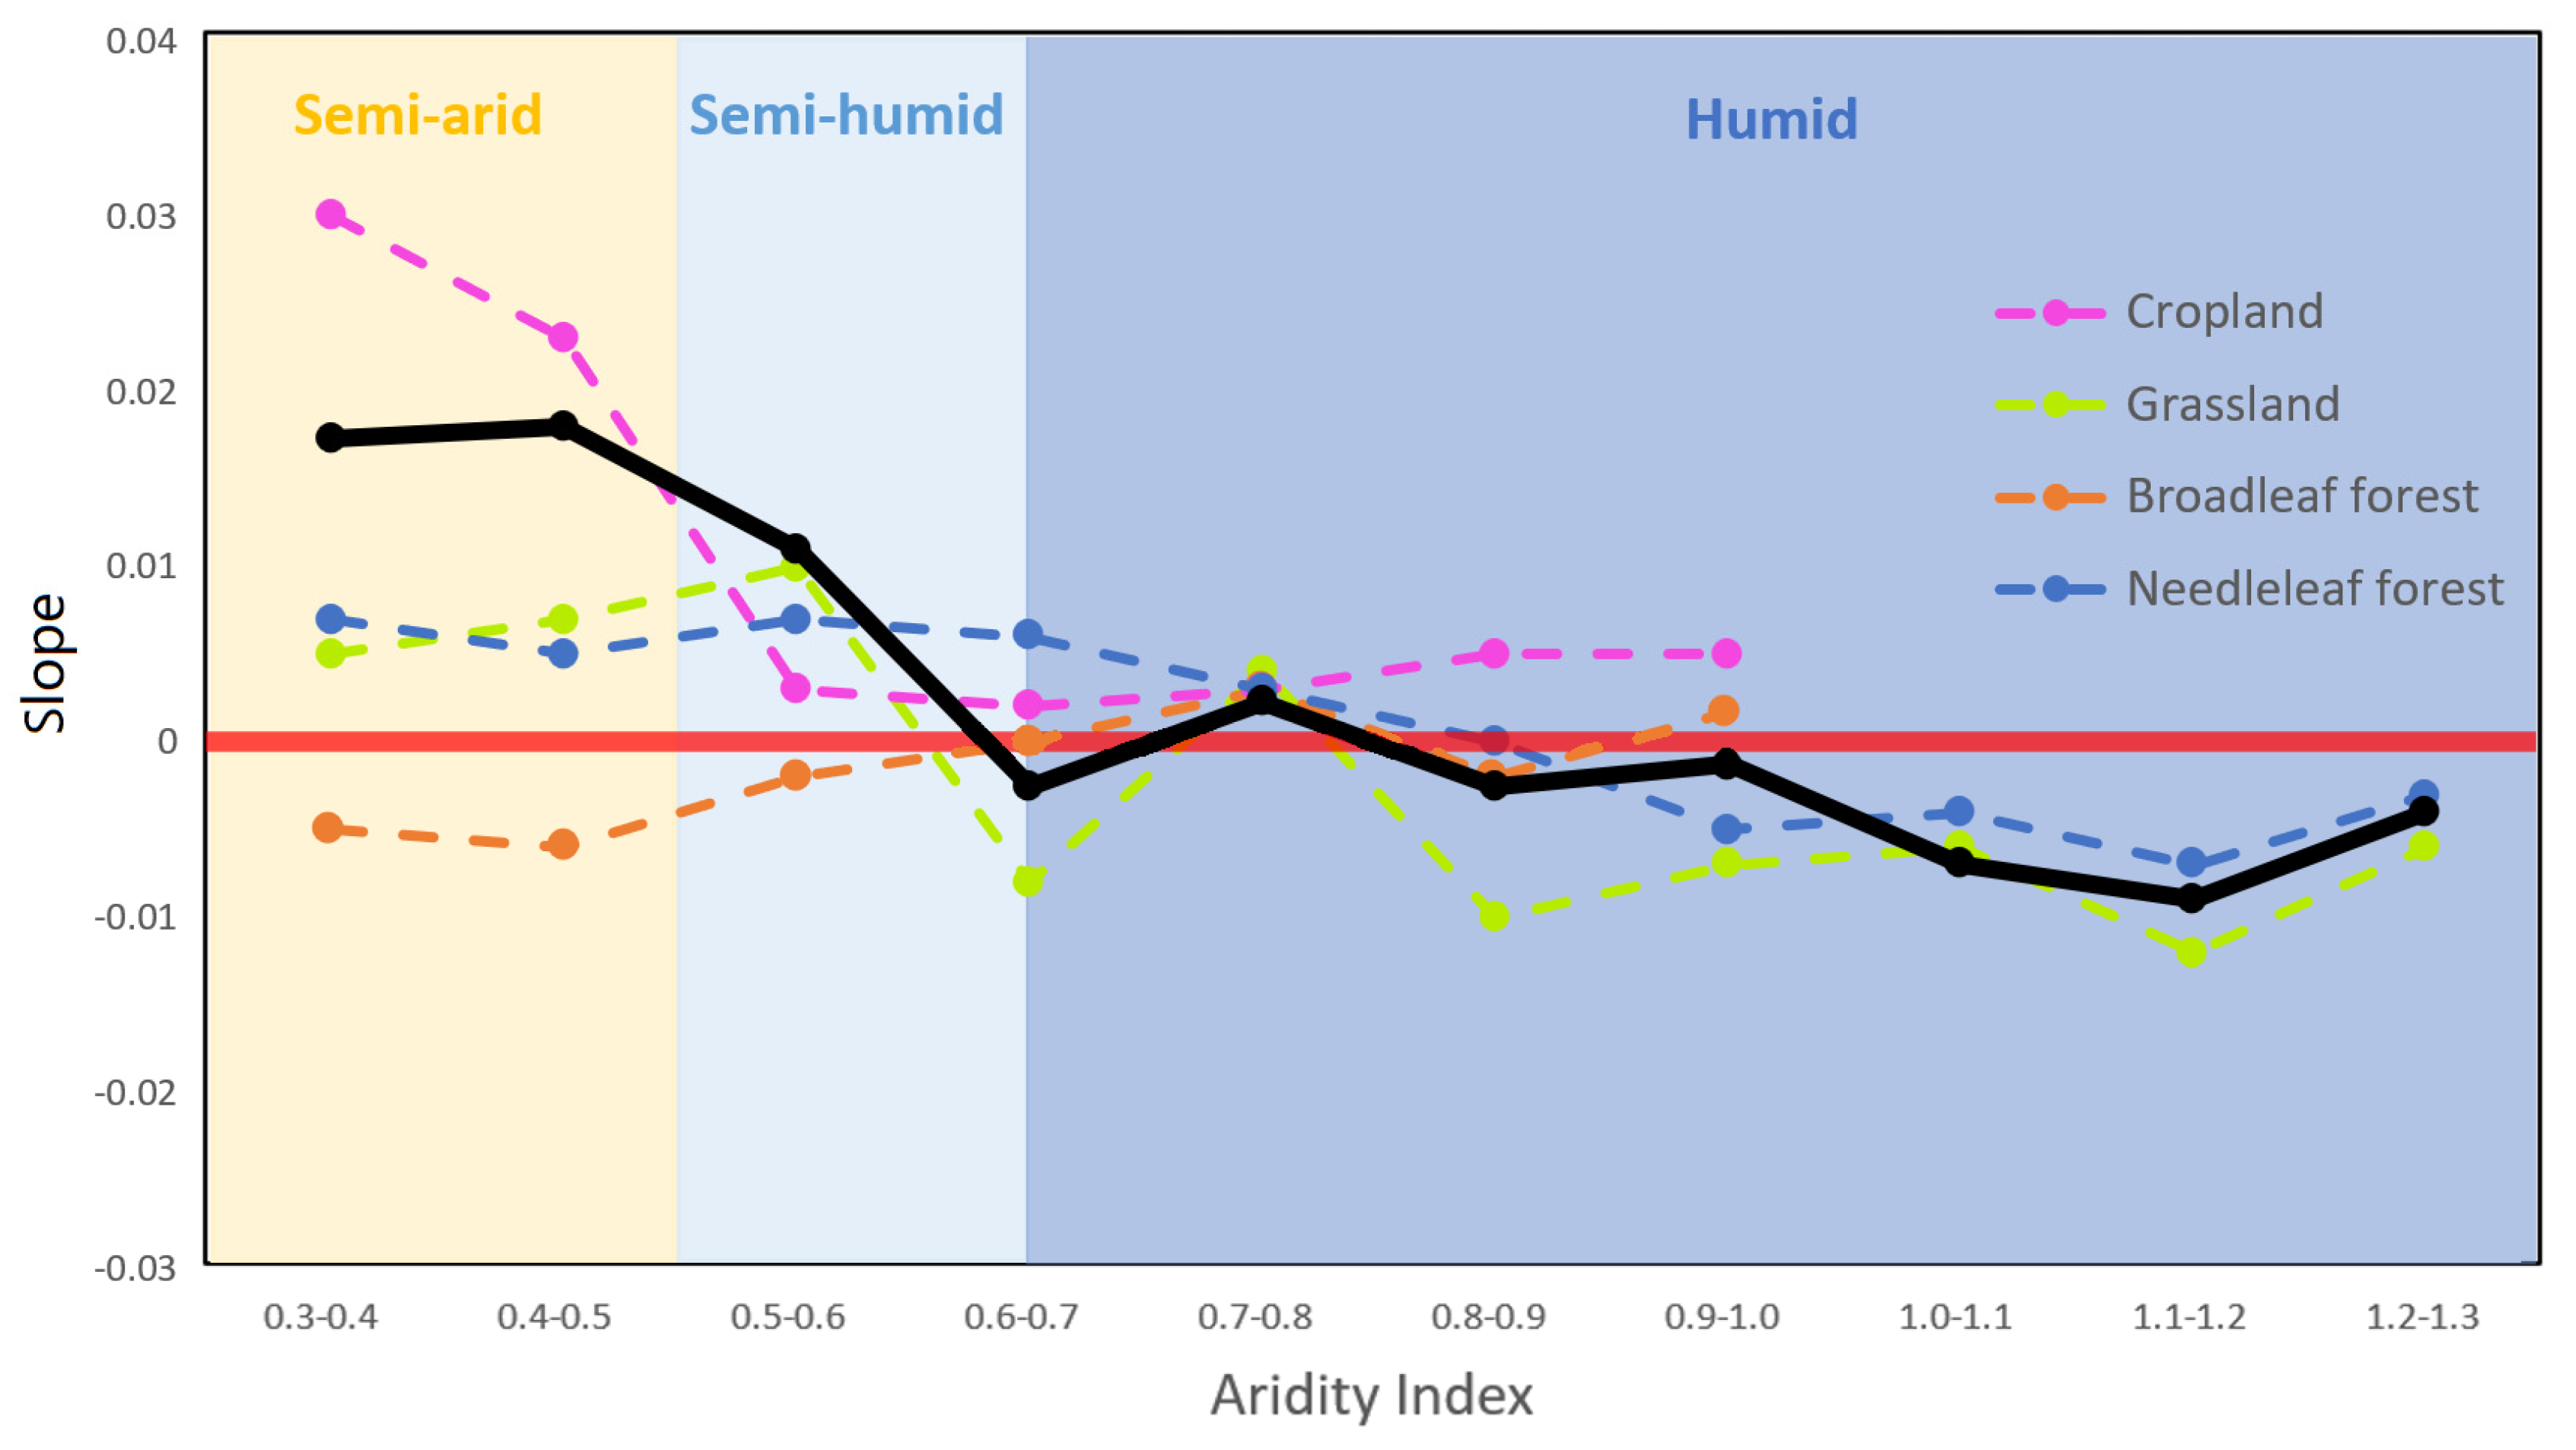
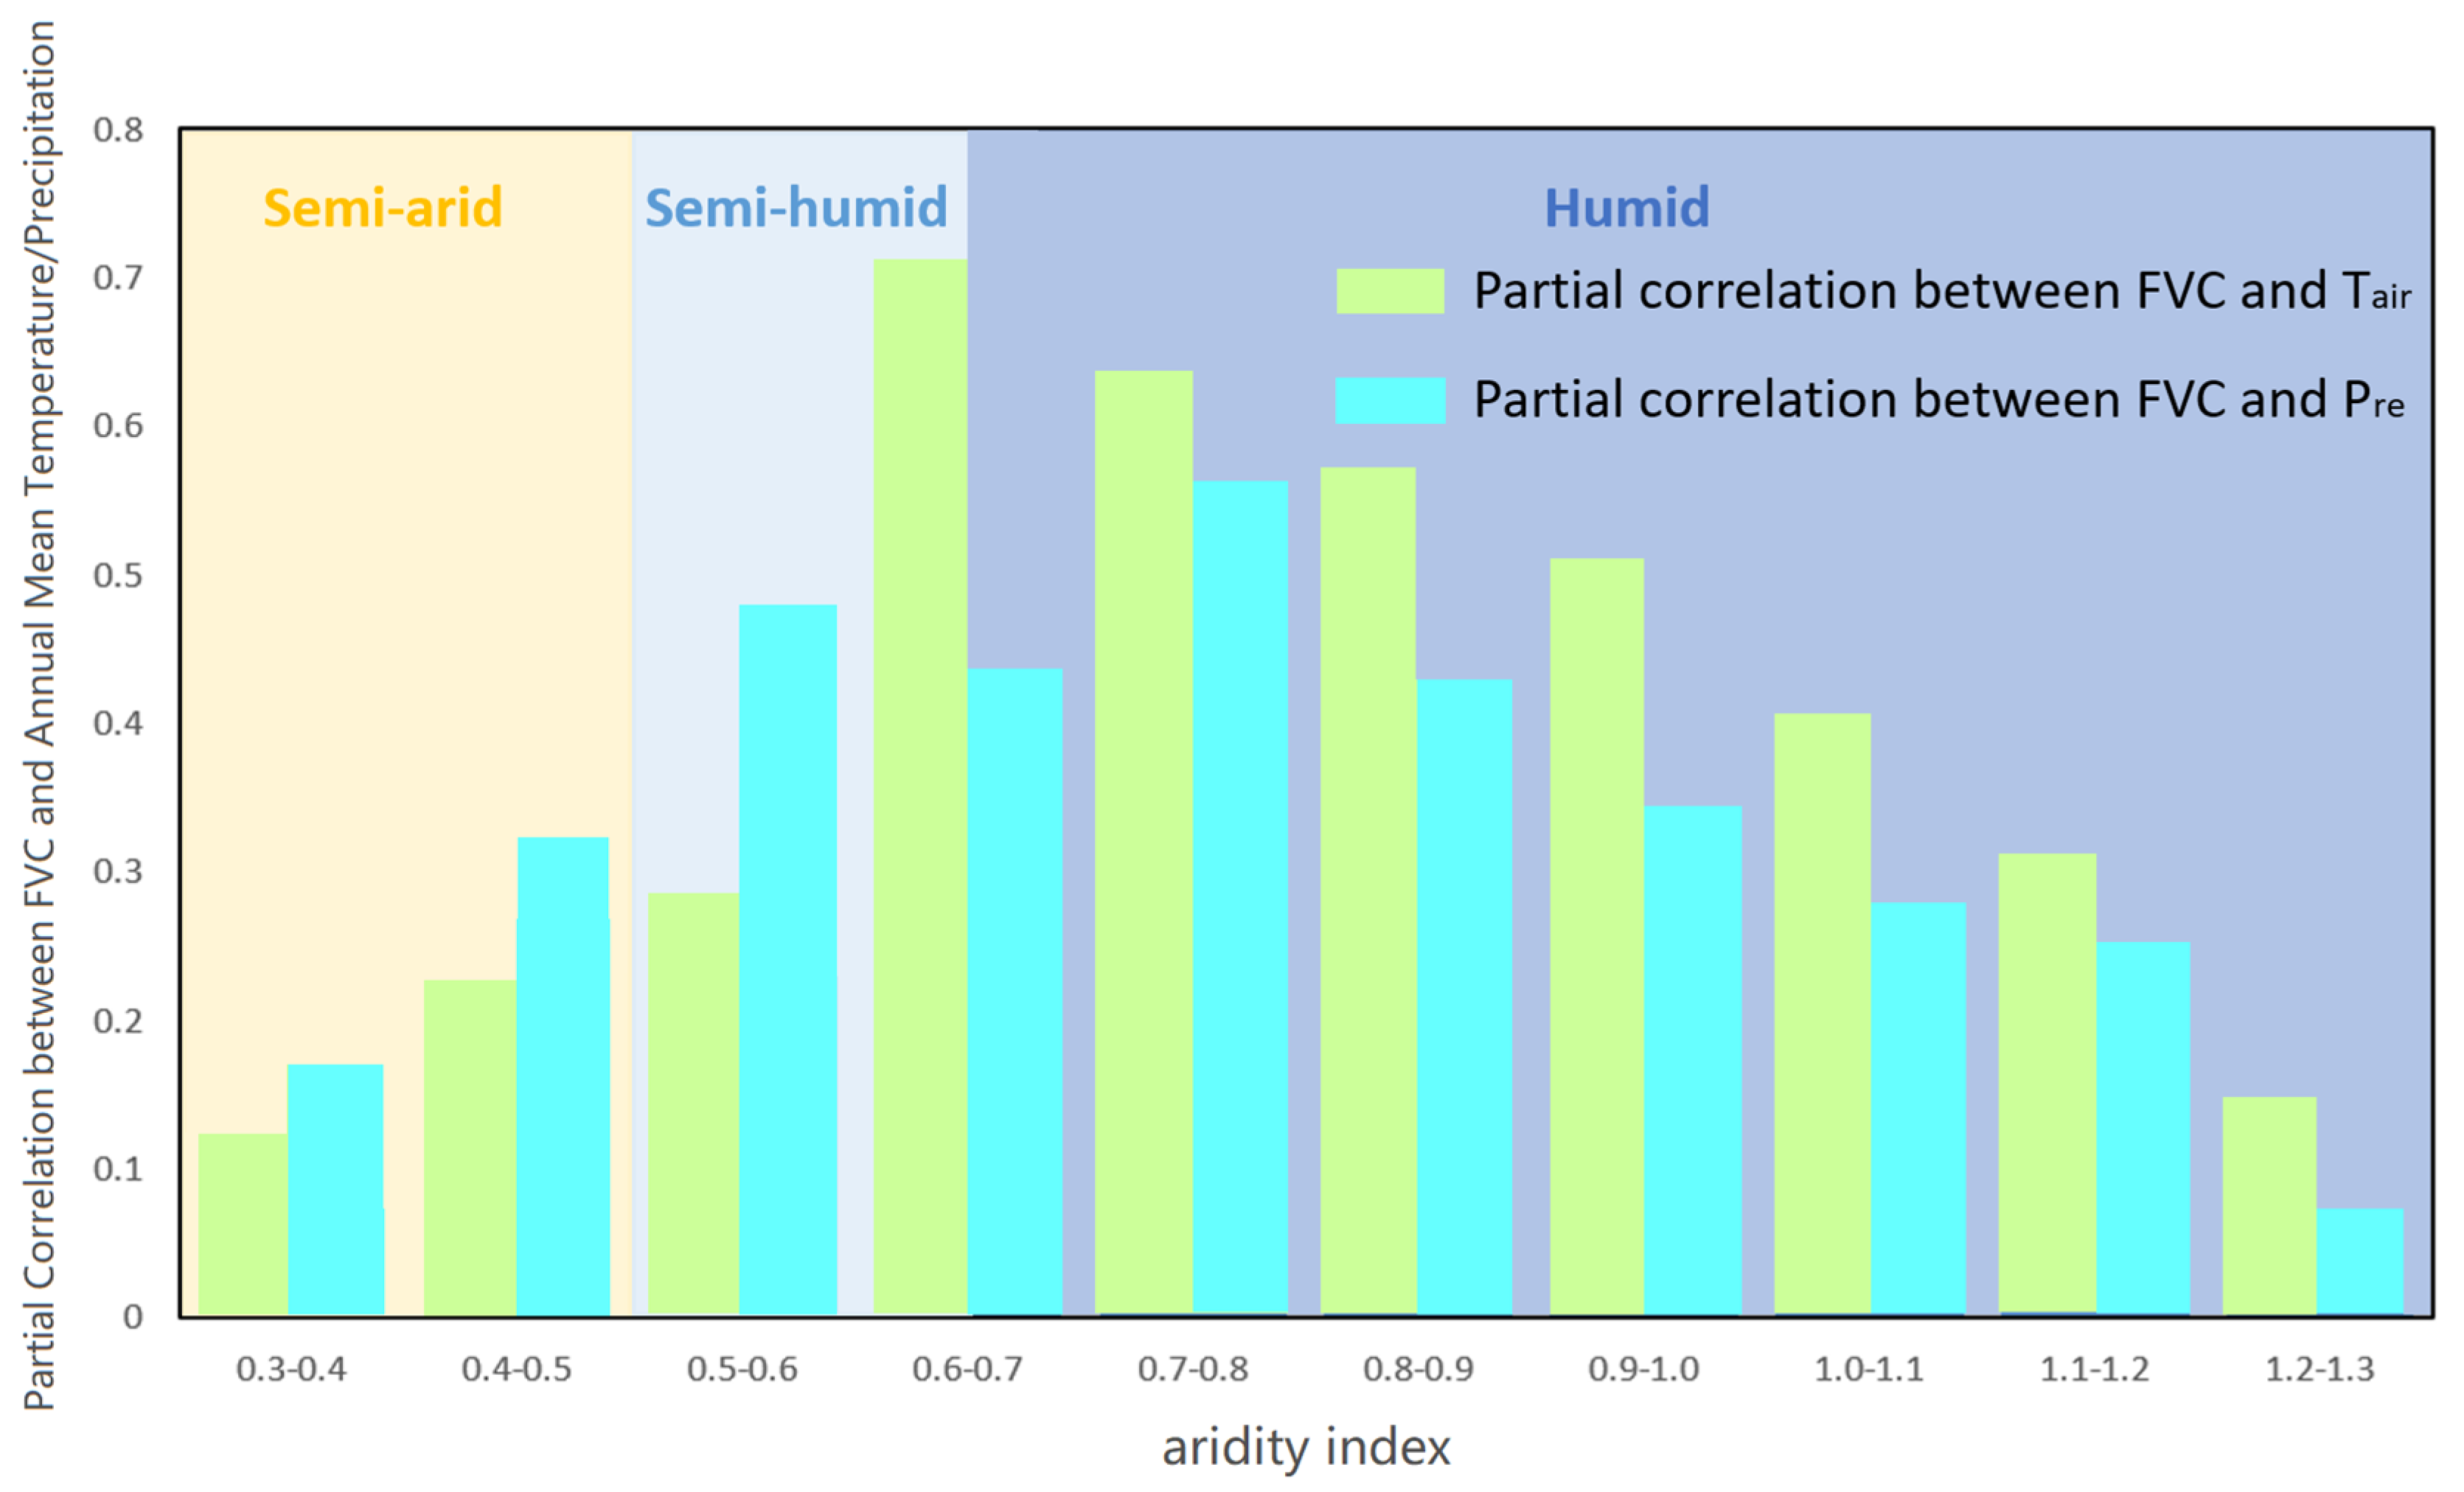
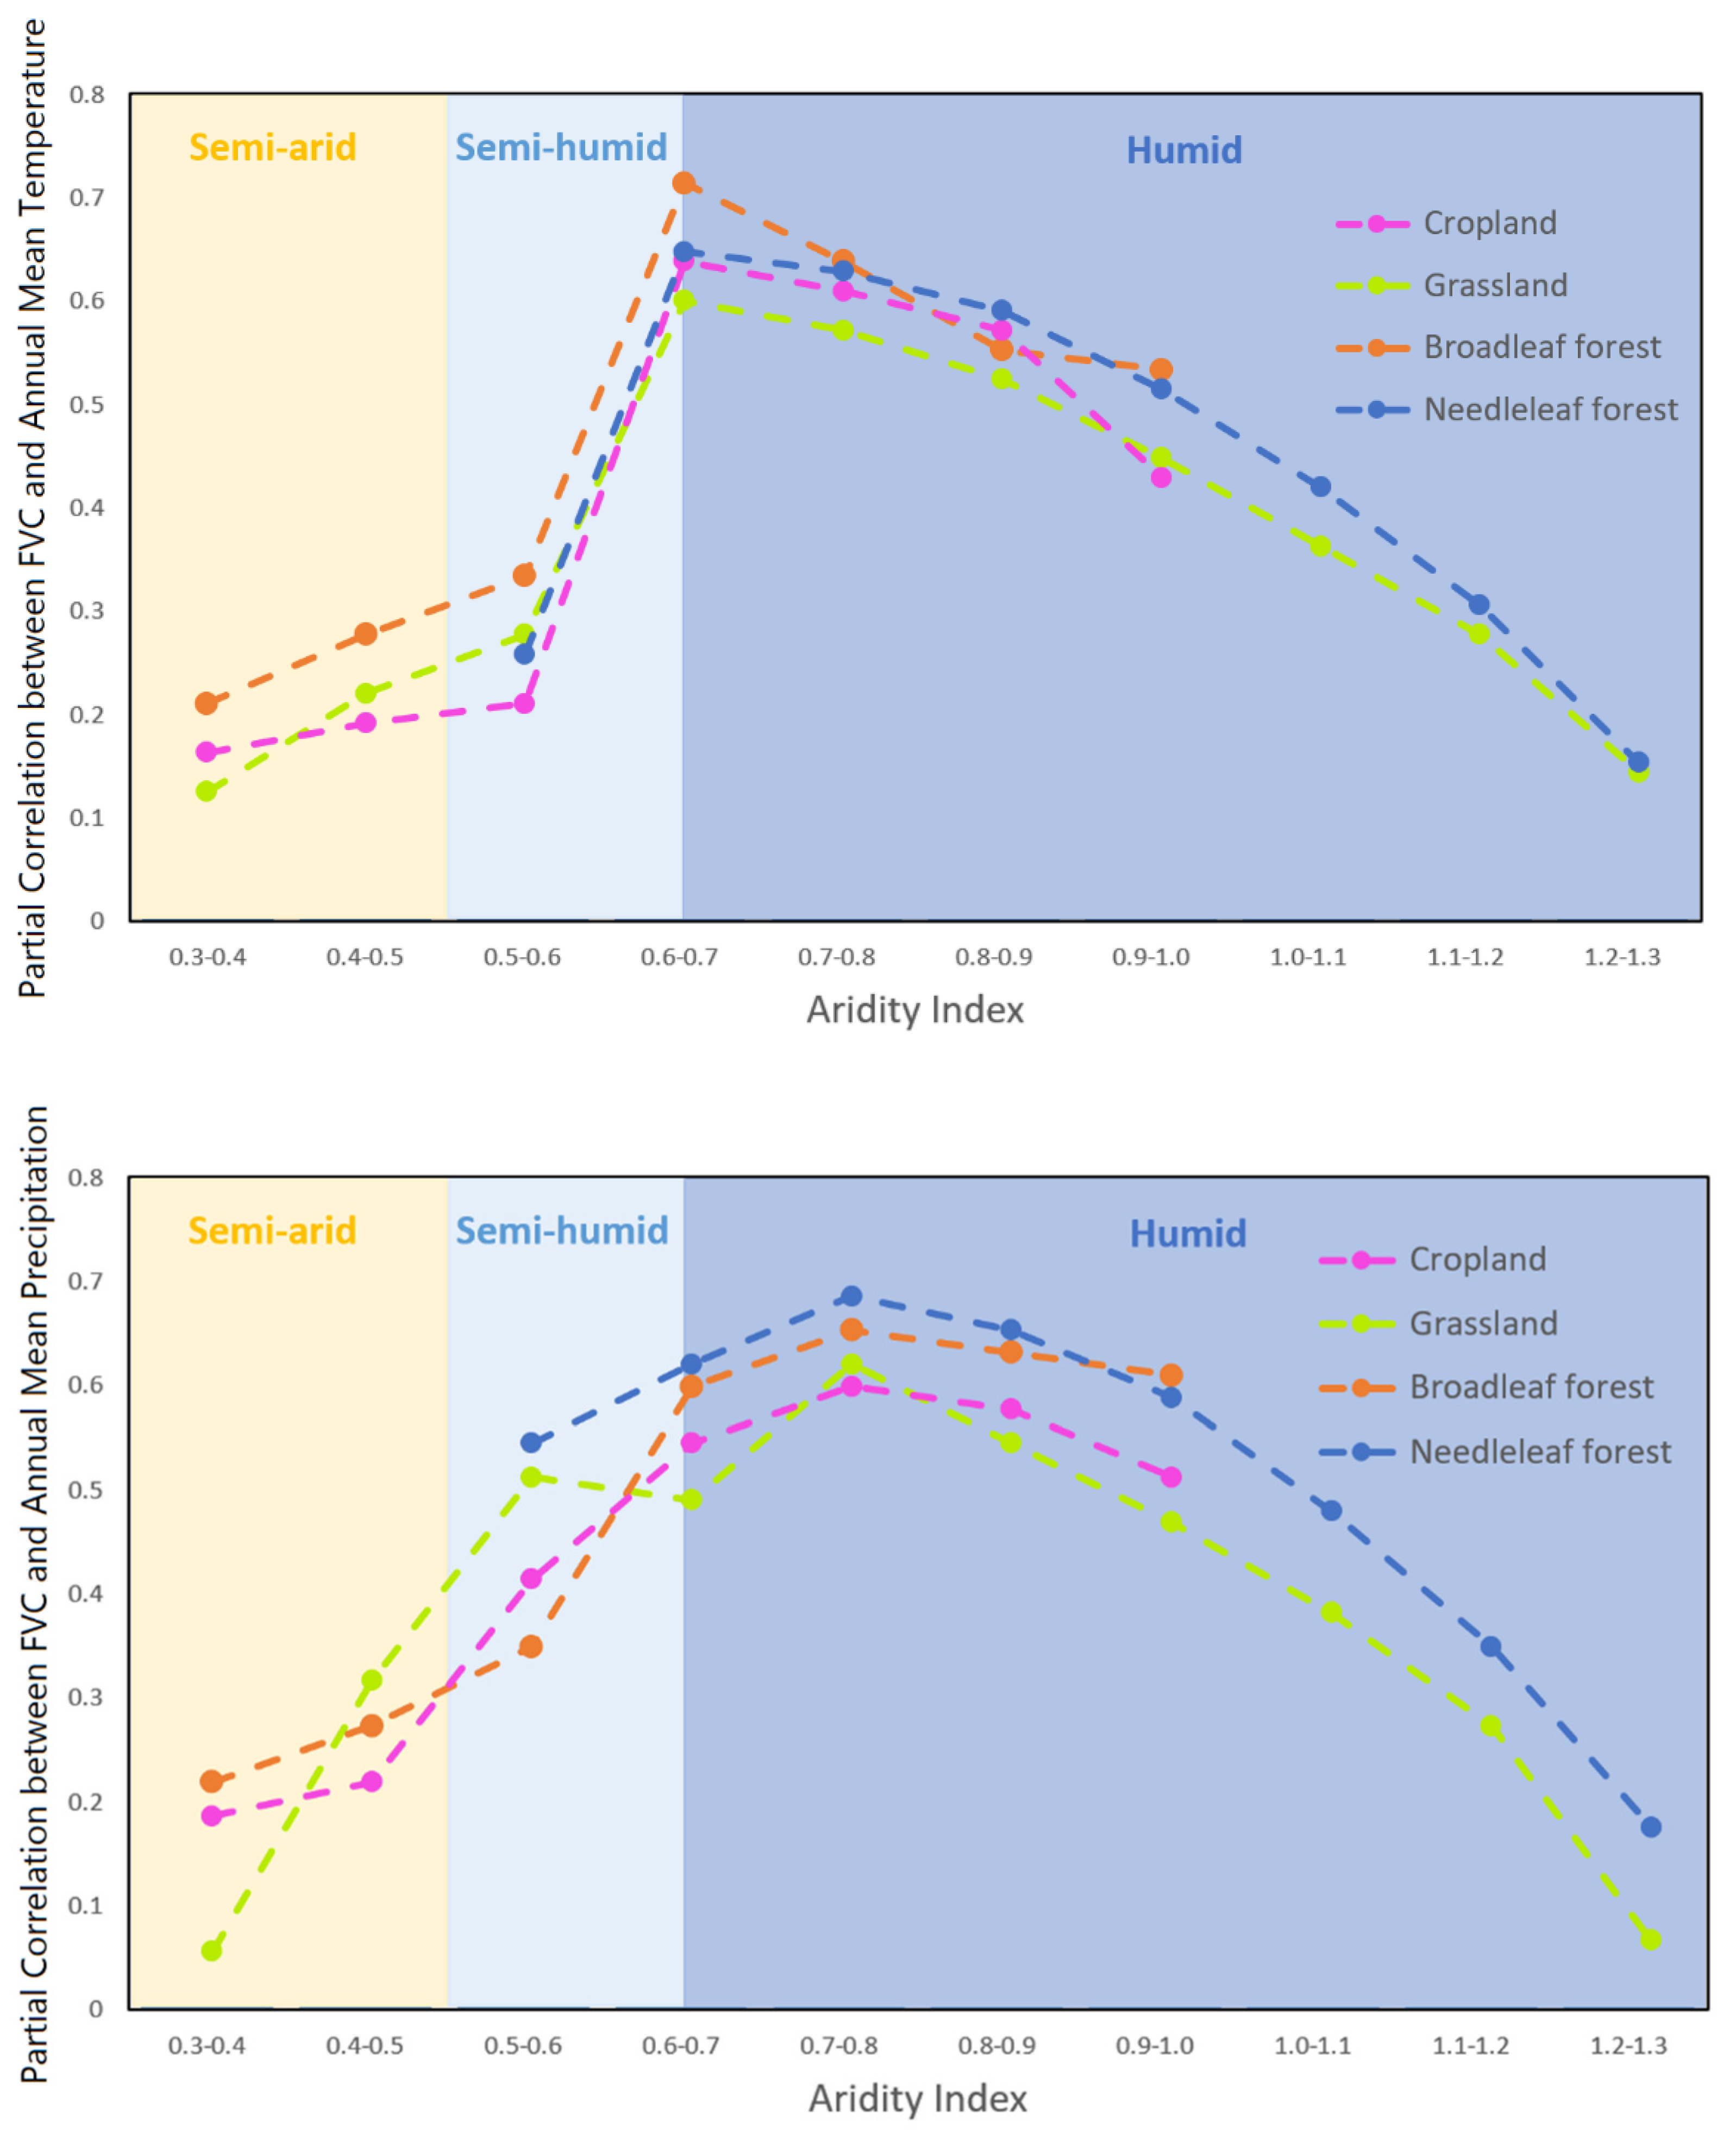
3.4. Response of FVC to Precipitation and Temperature Is Co-Determined by Aridity and Vegetation Types
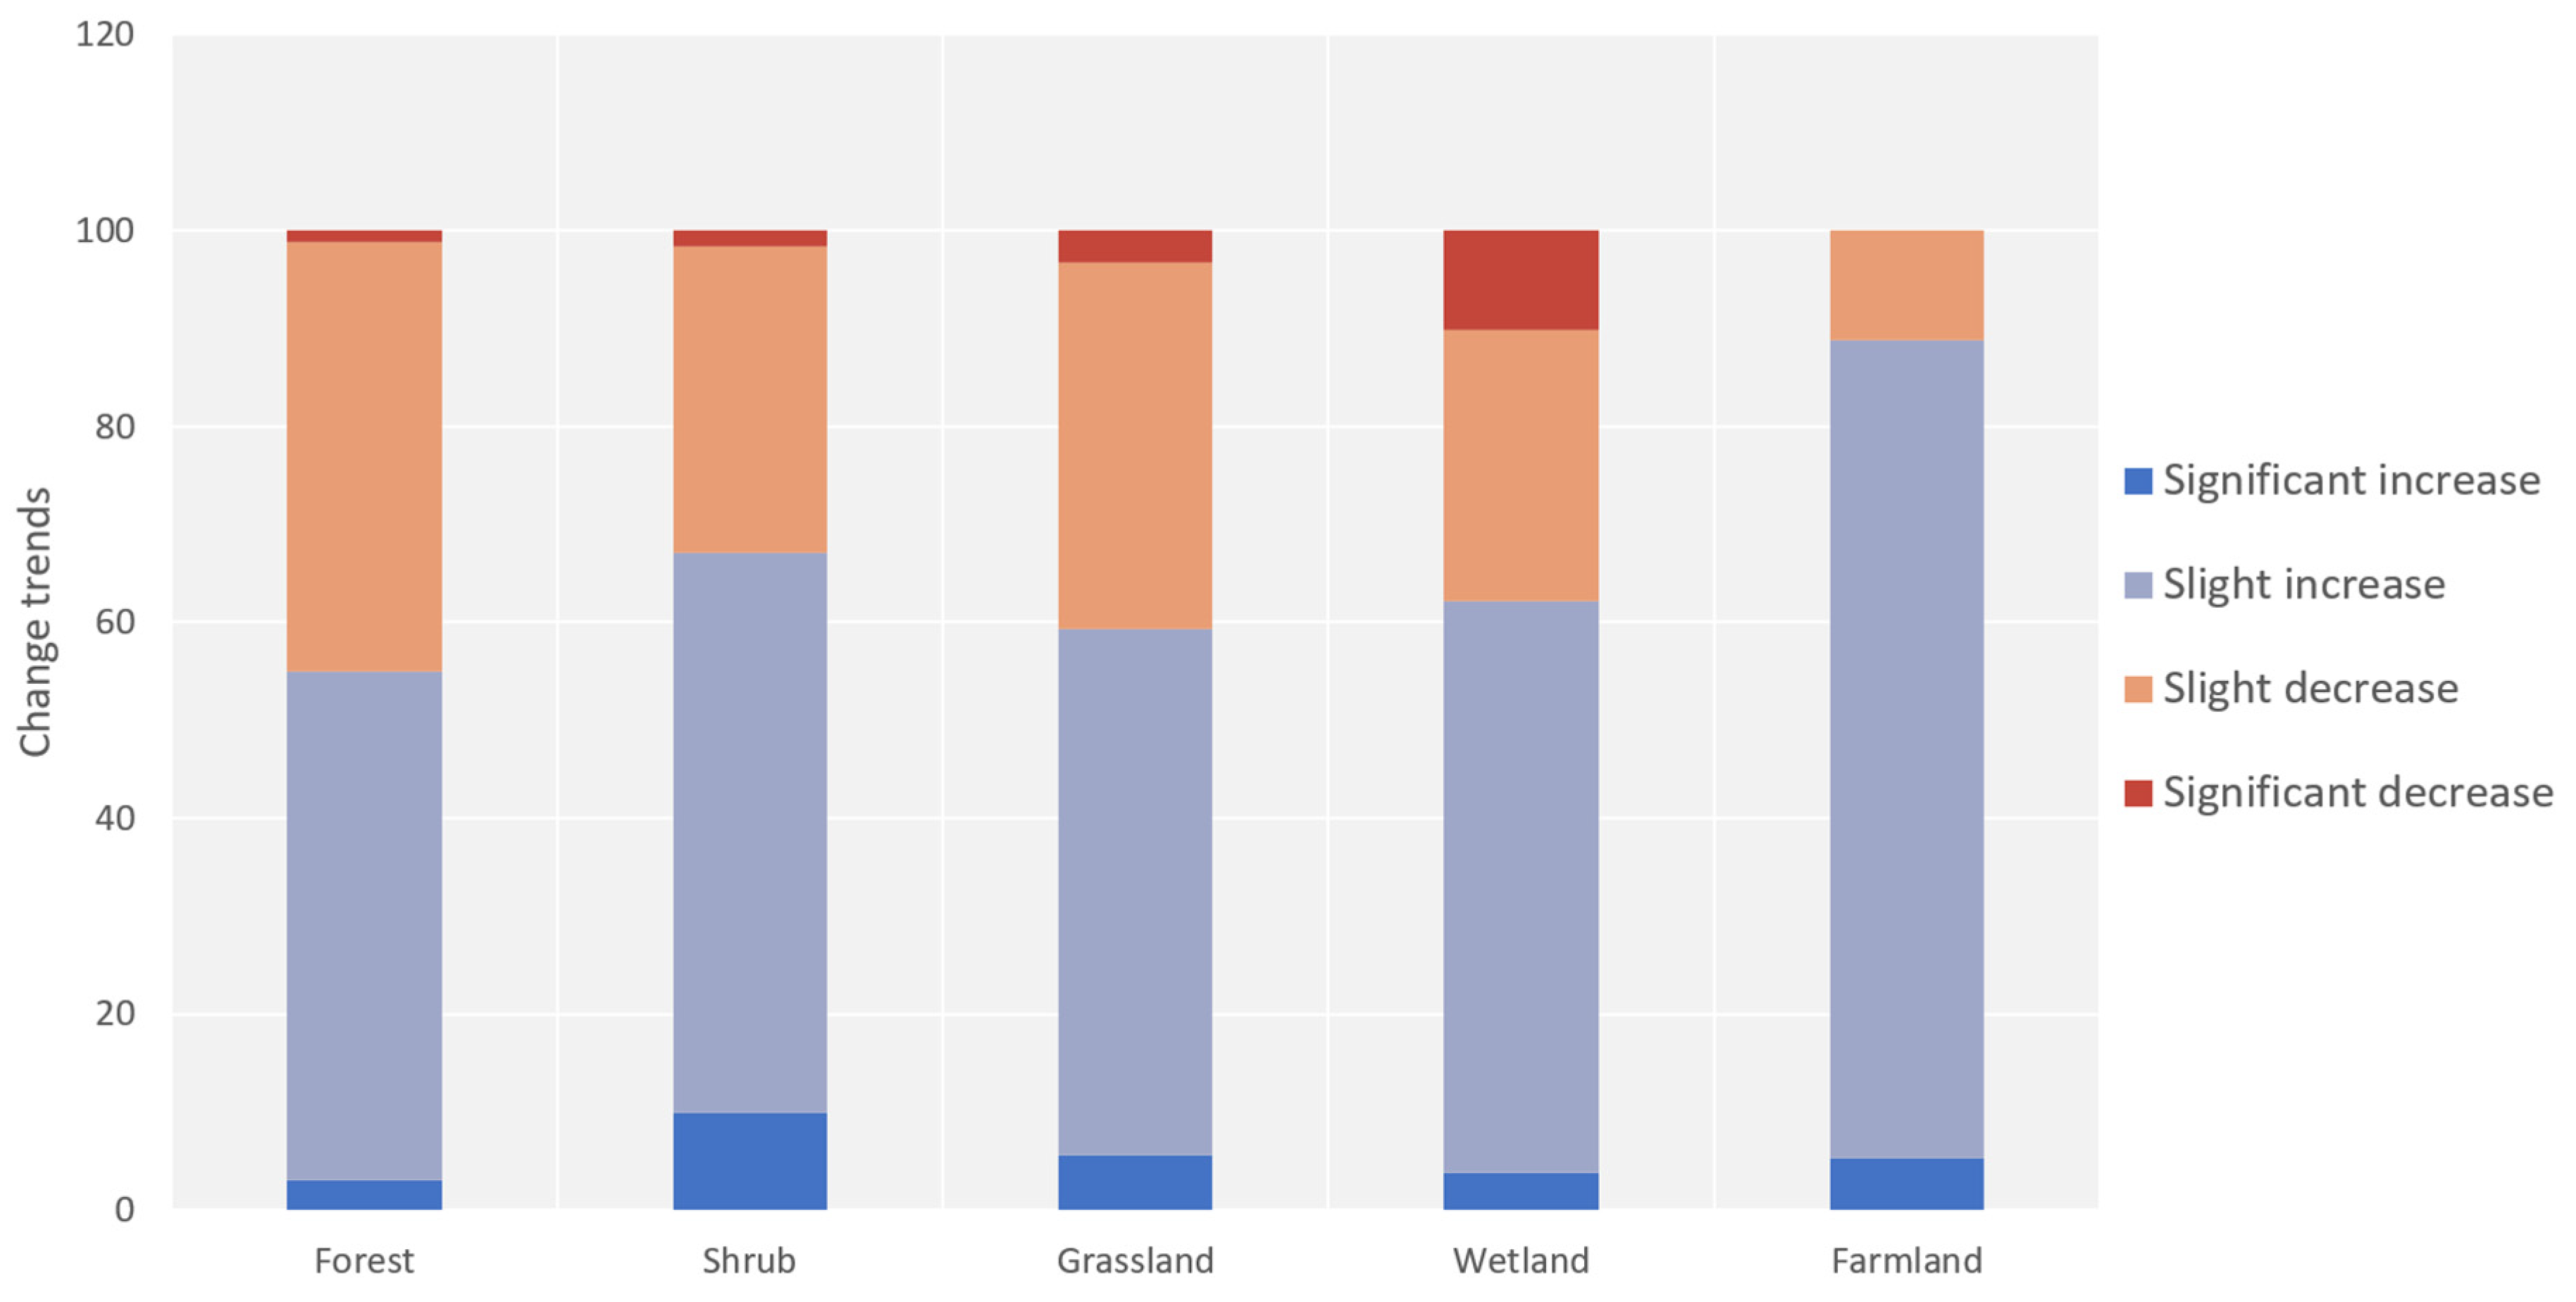
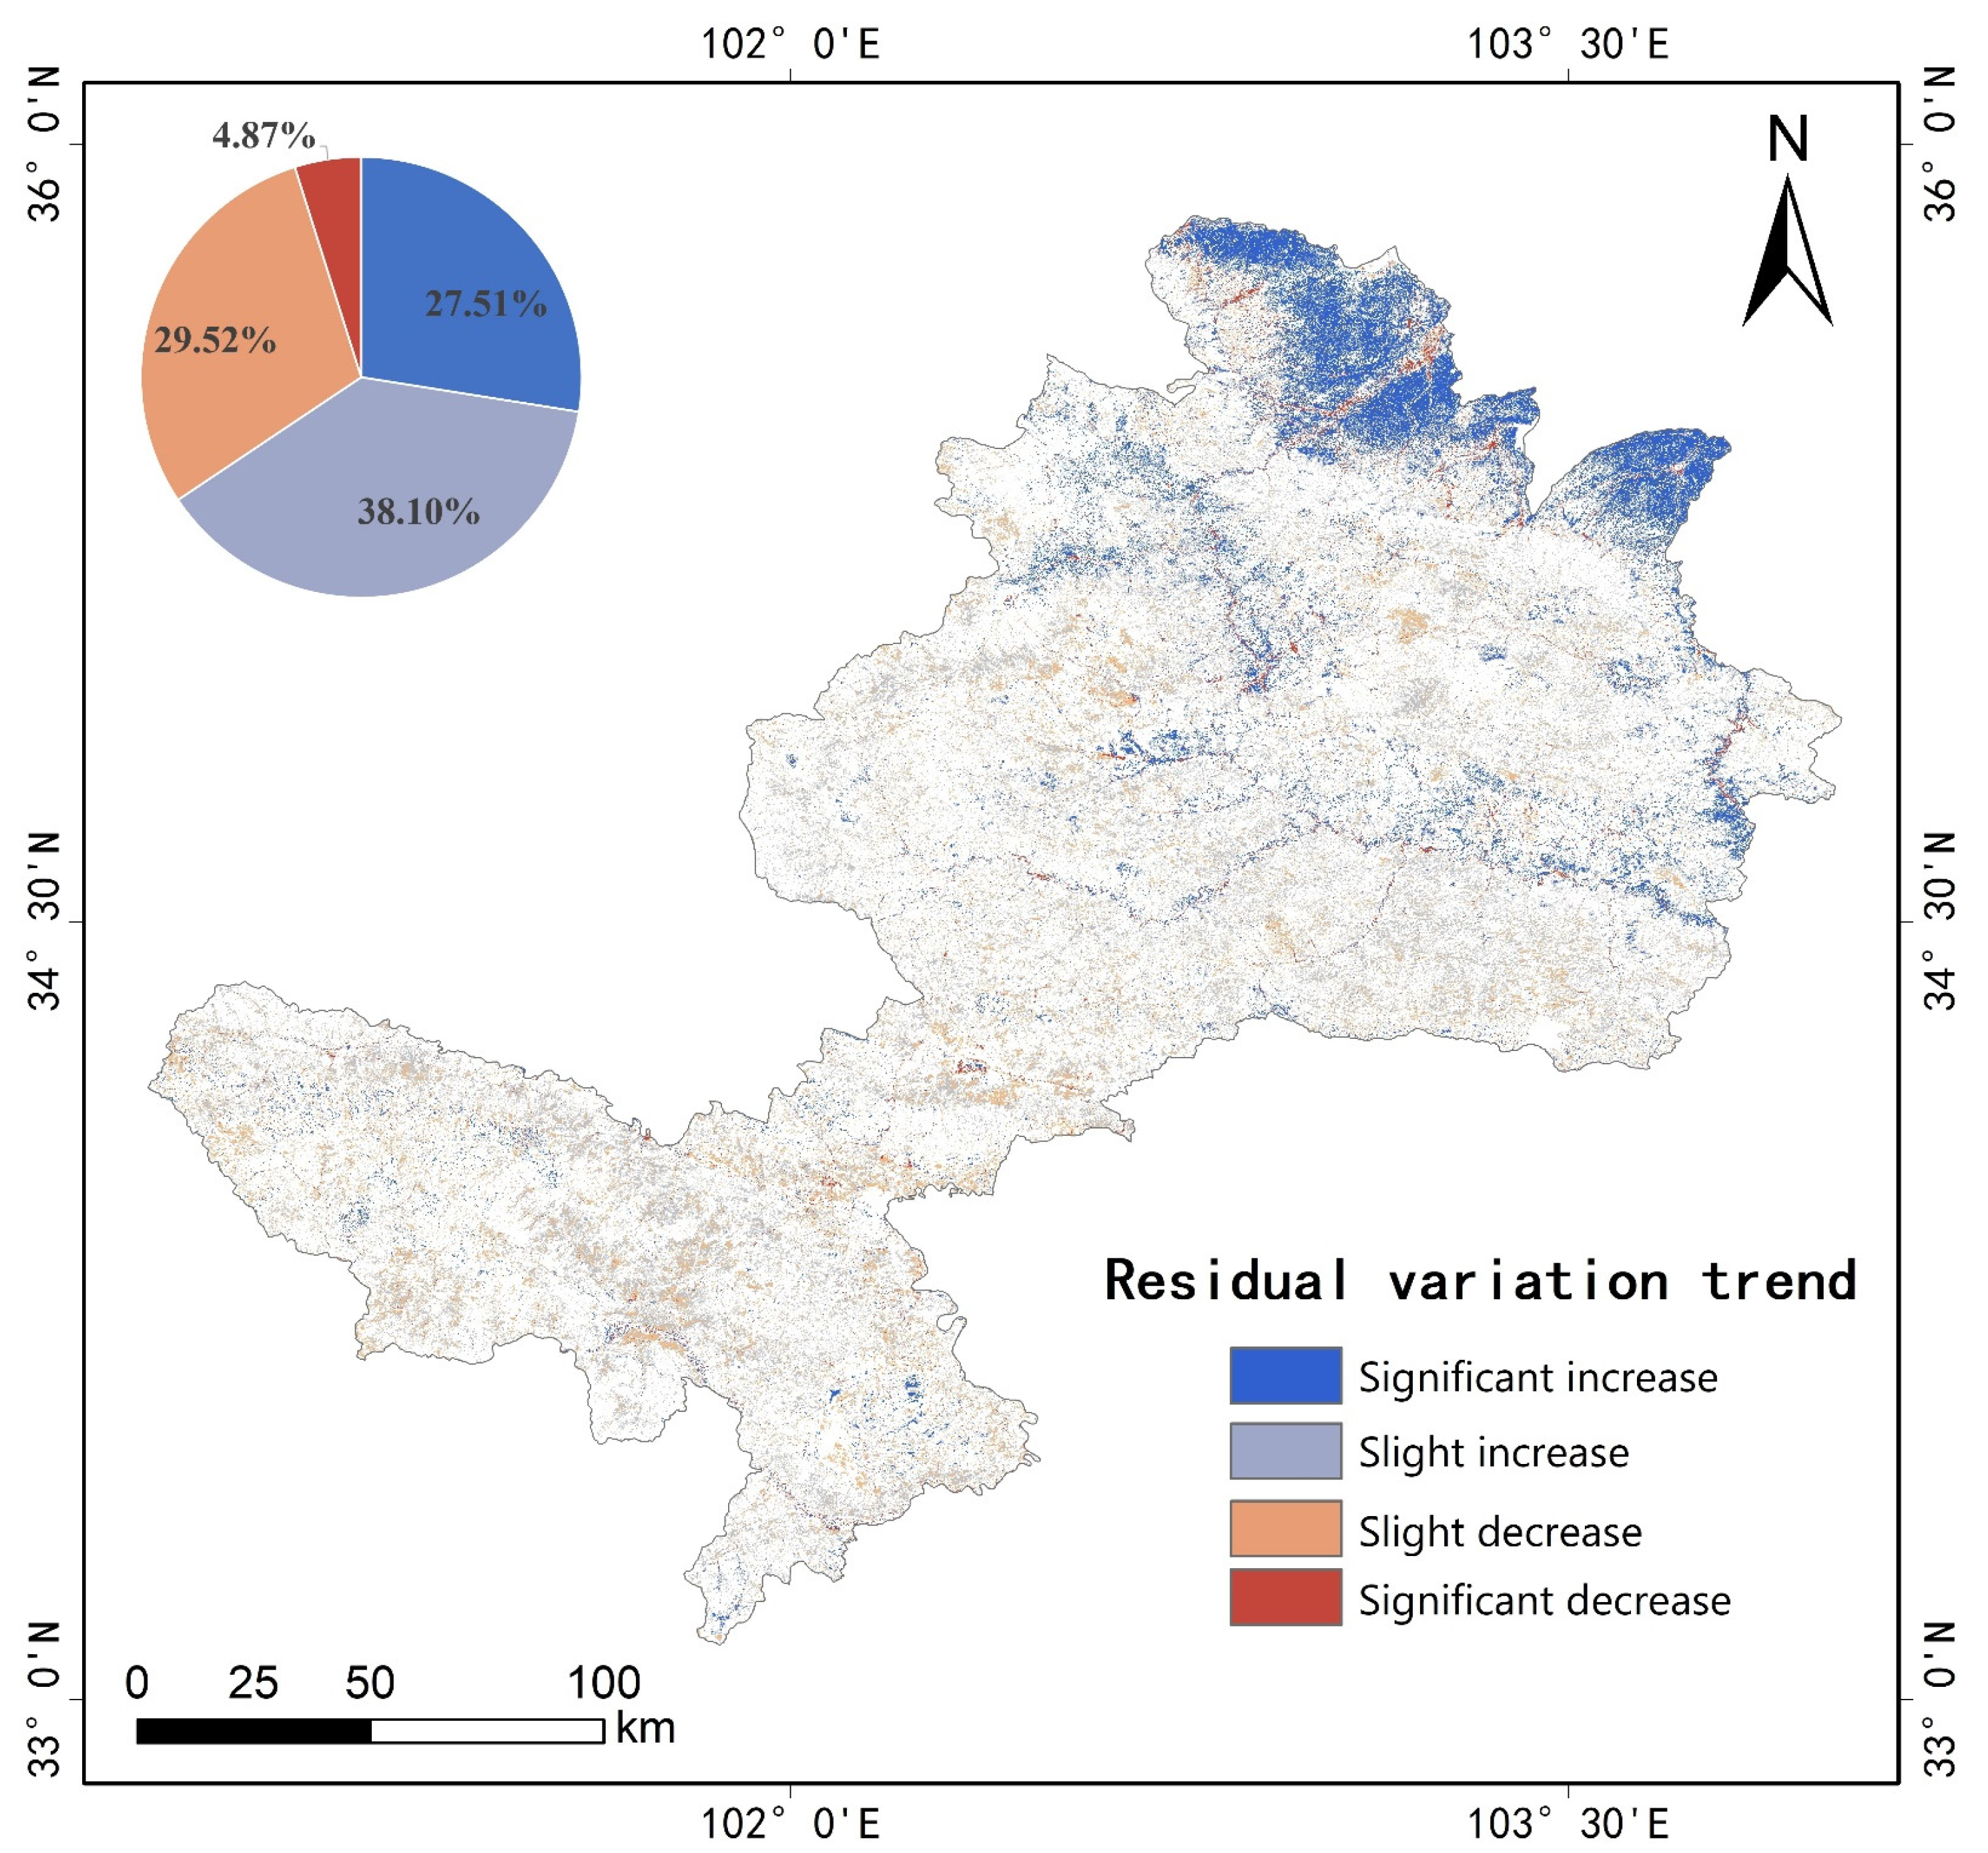
3.5. Impact of Human Activities on FVC Trends in the GP
4. Discussions
5. Conclusions
Author Contributions
Funding
Data Availability Statement
Acknowledgments
Conflicts of Interest
References
- Wang, X.; Ni, G.; Kai, Z.; Jing, W. Hyperspectral Remote Sensing Estimation Models of Aboveground Biomass in Gannan Rangelands. Procedia Environ. Sci. 2011, 10, 697–702. [Google Scholar] [CrossRef] [Green Version]
- Wang, H.; Yang, Z.; Saito, Y.; Liu, J.P.; Sun, X.; Wang, Y. Stepwise decreases of the Huanghe (Yellow River) sediment load (1950–2005): Impacts of climate change and human activities. Glob. Planet. Chang. 2007, 57, 331–354. [Google Scholar] [CrossRef]
- Li, L.J.; Zhang, L.; Wang, H.; Wang, J.; Yang, J.; Jiang, D. Assessing the impact of climate variability and human activities on streamflow from the Wuding River basin in China. Hydrol. Processes Int. J. 2007, 21, 3485–3491. [Google Scholar] [CrossRef]
- Ma, F.; Jiang, Q.; Xu, L.; Lv, K.; Chang, G. Processes, potential, and duration of vegetation restoration under different modes in the eastern margin ecotone of Qinghai-Tibet Plateau. Ecol. Indic. 2021, 132, 108267. [Google Scholar] [CrossRef]
- Meng, B.; Gao, J.; Liang, T.; Cui, X.; Ge, J.; Yin, J.; Feng, Q.; Xie, H. Modeling of Alpine Grassland Cover Based on Unmanned Aerial Vehicle Technology and Multi-Factor Methods: A Case Study in the East of Tibetan Plateau, China. Remote Sens. 2018, 10, 320. [Google Scholar] [CrossRef] [Green Version]
- Liu, C.; Li, W.; Zhu, G.; Zhou, H.; Yan, H.; Xue, P. Land Use/Land Cover Changes and Their Driving Factors in the Northeastern Tibetan Plateau Based on Geographical Detectors and Google Earth Engine: A Case Study in Gannan Prefecture. Remote Sens. 2020, 12, 3139. [Google Scholar] [CrossRef]
- Zhang, Y.; Zhang, C.; Wang, Z.; Chen, Y.; Gang, C.; An, R.; Li, J. Vegetation dynamics and its driving forces from climate change and human activities in the Three-River Source Region, China from 1982 to 2012. Sci. Total Environ. 2016, 563–564, 210–220. [Google Scholar] [CrossRef]
- Pei, H.; Liu, M.; Jia, Y.; Zhang, H.; Li, Y.; Xiao, Y. The trend of vegetation greening and its drivers in the Agro-pastoral ecotone of northern China, 2000–2020. Ecol. Indic. 2021, 129, 108004. [Google Scholar] [CrossRef]
- Piao, S.; Ciais, P.; Friedlingstein, P.; Peylin, P.; Reichstein, M.; Luyssaert, S.; Margolis, H.; Fang, J.; Barr, A.; Chen, A.; et al. Net carbon dioxide losses of northern ecosystems in response to autumn warming. Nature 2008, 451, 49–52. [Google Scholar] [CrossRef]
- Niemand, C.; Köstner, B.; Prasse, H.; Grünwald, T.; Bernhofer, C. Relating tree phenology with annual carbon fluxes at Tharandt forest. Meteorol. Z. 2005, 14, 197–202. [Google Scholar] [CrossRef] [Green Version]
- Jeong, S.-J.; Ho, C.-H.; Jeong, J.-H. Increase in vegetation greenness and decrease in springtime warming over east Asia. Geophys. Res. Lett. 2009, 36. [Google Scholar] [CrossRef]
- Lucht, W.; Prentice, I.C.; Myneni, R.B.; Sitch, S.; Friedlingstein, P.; Cramer, W.; Bousquet, P.; Buermann, W.; Smith, B. Climatic Control of the High-Latitude Vegetation Greening Trend and Pinatubo Effect. Science 2002, 296, 1687–1689. [Google Scholar] [CrossRef] [PubMed] [Green Version]
- Ho, C.H.; Lee, E.J.; Lee, I.; Jiang, S.J. Earlier spring in Seoul, Korea. Int. J. Climatol. A J. R. Meteorol. Soc. 2006, 26, 2117–2127. [Google Scholar] [CrossRef]
- Nemani, R.R.; Keeling, C.D.; Hashimoto, H.; Jolly, W.; Piper, S.; Tucker, C.J. Climate-driven increases in global terrestrial net primary production from 1982 to 1999. Science 2003, 300, 1560–1563. [Google Scholar] [CrossRef] [PubMed] [Green Version]
- Jiao, W.; Wang, L.; Smith, W.K.; Chang, Q.; Wang, H.; D’Odorico, P. Observed increasing water constraint on vegetation growth over the last three decades. Nat. Commun. 2021, 12, 3777. [Google Scholar] [CrossRef]
- Guo, B.; Zhang, J.; Meng, X.; Xu, T.; Song, Y. Long-term spatio-temporal precipitation variations in China with precipitation surface interpolated by ANUSPLIN. Sci. Rep. 2020, 10, 81. [Google Scholar] [CrossRef]
- Fensholt, R.; Langanke, T.; Rasmussen, K.; Reenberg, A.; Prince, S.D.; Tucker, C.; Scholes, R.J.; Le, Q.B.; Bondeau, A.; Eastman, R.; et al. Greenness in semi-arid areas across the globe 1981–2007—An Earth observing satellite based analysis of trends and drivers. Remote Sens. Environ. 2012, 121, 144–158. [Google Scholar] [CrossRef]
- Hua, W.; Chen, H.; Zhou, L.; Xie, Z.; Qin, M.; Li, X.; Ma, H.; Huang, Q.; Sun, S. Observational Quantification of Climatic and Human Influences on Vegetation Greening in China. Remote Sens. 2017, 9, 425. [Google Scholar] [CrossRef] [Green Version]
- Zhu, Z.; Piao, S.; Myneni, R.B.; Huang, M.; Zeng, Z.; Canadell, J.G.; Ciais, P.; Sitch, S.; Friedlingstein, P.; Arneth, A.; et al. Greening of the Earth and its drivers. Nat. Clim. Chang. 2016, 6, 791–795. [Google Scholar] [CrossRef]
- Piao, S.; Yin, G.; Tan, J.; Cheng, L.; Huang, M.; Li, Y.; Liu, R.; Mao, J.; Myneni, R.B.; Peng, S.; et al. Detection and attribution of vegetation greening trend in China over the last 30 years. Glob. Chang. Biol. 2015, 21, 1601–1609. [Google Scholar] [CrossRef]
- IPCC. Climate Change 2014: Impacts, Adaptation and Vulnearability Part A: Global and Sectoral Aspects; Cambridge University Press: New York, NY, USA, 2014. [Google Scholar]
- Yang, Y.H.; Piao, S.L. Variations in grassland vegetation cover in relation to climatic factors on the Tibetan Plateau. Chin. J. Plant Ecol. 2006, 30, 1–8. [Google Scholar]
- Fang, J.; Piao, S.; He, J.; Ma, W. Increasing terrestrial vegetation activity in China, 1982–1999. Sci. China Ser. C Life Sci. 2004, 47, 229–240. [Google Scholar] [CrossRef]
- Zhou, R.; Yang, Y.; Fang, J. Responses of vegetation activity to precipitation variation on the Tibetan Plateau. Acta Sci. Nat. Univ. Pekin. 2007, 43, 771. [Google Scholar]
- Cui, X.; Graf, H.F. Recent land cover changes on the Tibetan Plateau: A review. Clim. Chang. 2009, 94, 47–61. [Google Scholar] [CrossRef] [Green Version]
- Davidson, A.D.; Detling, J.K.; Brown, J.H. Ecological roles and conservation challenges of social, burrowing, herbivorous mammals in the world’s grasslands. Front. Ecol. Environ. 2012, 10, 477–486. [Google Scholar] [CrossRef] [Green Version]
- Harris, R.B. Rangeland degradation on the Qinghai-Tibetan plateau: A review of the evidence of its magnitude and causes. J. Arid Environ. 2010, 74, 1–12. [Google Scholar] [CrossRef]
- Wang, P.; Lassoie, J.P.; Morreale, S.J.; Dong, S. A critical review of socioeconomic and natural factors in ecological degradation on the Qinghai-Tibetan Plateau, China. Rangel. J. 2015, 37, 1–9. [Google Scholar] [CrossRef]
- Dong, Q.M.; Zhao, X.Q.; Wu, G.L.; Shi, J.-J.; Ren, G.-H. A review of formation mechanism and restoration measures of “black-soil-type” degraded grassland in the Qinghai-Tibetan Plateau. Environ. Earth Sci. 2013, 70, 2359–2370. [Google Scholar] [CrossRef]
- Cai, H.; Yang, X.; Xu, X. Human-induced grassland degradation/restoration in the central Tibetan Plateau: The effects of ecological protection and restoration projects. Ecol. Eng. 2015, 83, 112–119. [Google Scholar] [CrossRef]
- Xu, H.-J.; Wang, X.-P.; Zhang, X.-X. Alpine grasslands response to climatic factors and anthropogenic activities on the Tibetan Plateau from 2000 to 2012. Ecol. Eng. 2016, 92, 251–259. [Google Scholar] [CrossRef]
- Meng, B.; Liang, T.; Yi, S.; Yin, J.; Cui, X.; Ge, J.; Hou, M.; Lv, Y.; Sun, Y. Modeling alpine grassland above ground biomass based on remote sensing data and machine learning algorithm: A case study in east of the Tibetan Plateau, China. IEEE J. Sel. Top. Appl. Earth Obs. Remote Sens. 2020, 13, 2986–2995. [Google Scholar] [CrossRef]
- Mu, X.; Song, W.; Gao, Z.; McVicar, T.R.; Donohue, R.J.; Yan, G. Fractional vegetation cover estimation by using multi-angle vegetation index. Remote Sens. Environ. 2018, 216, 44–56. [Google Scholar] [CrossRef]
- Zhang, X.; Liao, C.; Li, J.; Sun, Q. Fractional vegetation cover estimation in arid and semi-arid environments using HJ-1 satellite hyperspectral data. Int. J. Appl. Earth Obs. Geoinf. ITC J. 2013, 21, 506–512. [Google Scholar] [CrossRef]
- Tu, Y.; Jia, K.; Wei, X.; Yao, Y.; Xia, M.; Zhang, X.; Jiang, B. A Time-Efficient Fractional Vegetation Cover Estimation Method Using the Dynamic Vegetation Growth Information From Time Series GLASS FVC Product. IEEE Geosci. Remote Sens. Lett. 2019, 17, 1672–1676. [Google Scholar] [CrossRef]
- Wu, D.; Wu, H.; Zhao, X.; Zhou, T.; Tang, B.; Zhao, W.; Jia, K. Evaluation of Spatiotemporal Variations of Global Fractional Vegetation Cover Based on GIMMS NDVI Data from 1982 to 2011. Remote Sens. 2014, 6, 4217–4239. [Google Scholar] [CrossRef] [Green Version]
- Xiao, J.; Moody, A. A comparison of methods for estimating fractional green vegetation cover within a desert-to-upland transition zone in central New Mexico, USA. Remote Sens. Environ. 2005, 98, 237–250. [Google Scholar] [CrossRef]
- Pearson, R.G.; Phillips, S.J.; Loranty, M.M.; Beck, P.S.A.; Damoulas, T.; Knight, S.J.; Goetz, S.J. Shifts in Arctic vegetation and associated feedbacks under climate change. Nat. Clim. Chang. 2013, 3, 673–677. [Google Scholar] [CrossRef]
- Peng, S.; Piao, S.; Ciais, P.; Myneni, R.B.; Chen, A.; Chevallier, F.; Dolman, A.J.; Janssens, I.A.; Peñuelas, J.; Zhang, G.; et al. Asymmetric effects of daytime and night-time warming on Northern Hemisphere vegetation. Nature 2013, 501, 88–92. [Google Scholar] [CrossRef]
- Wu, D.H.; Zhao, X.; Liang, S.L.; Zhou, T.; Huang, K.C.; Tang, B.J.; Zhao, W.Q. Time-lag effects of global vegetation responses to climate change. Glob. Chang. Biol. 2015, 21, 3520–3531. [Google Scholar] [CrossRef]
- Hilker, T.; Natsagdorj, E.; Waring, R.H.; Lyapustin, A.; Wang, Y. Satellite observed widespread decline in Mongolian grasslands largely due to overgrazing. Glob. Chang. Biol. 2014, 20, 418–428. [Google Scholar] [CrossRef] [PubMed] [Green Version]
- Yan, W.; Wang, H.; Jiang, C.; Jin, S.; Ai, J.; Sun, O.J. Satellite view of vegetation dynamics and drivers over southwestern China. Ecol. Indic. 2021, 130, 108074. [Google Scholar] [CrossRef]
- Liu, X.; Zhang, J.; Zhu, X.; Pan, Y.; Liu, Y.; Zhang, D.; Lin, Z. Spatiotemporal changes in vegetation coverage and its driving factors in the Three-River Headwaters Region during 2000–2011. J. Geogr. Sci. 2014, 24, 288–302. [Google Scholar] [CrossRef]
- John, R.; Chen, J.; Kim, Y.; Ou-Yang, Z.-T.; Xiao, J.; Park, H.; Shao, C.; Zhang, Y.; Amarjargal, A.; Batkhshig, O.; et al. Differentiating anthropogenic modification and precipitation-driven change on vegetation productivity on the Mongolian Plateau. Landsc. Ecol. 2016, 31, 547–566. [Google Scholar] [CrossRef]
- Li, A.; Wu, J.; Huang, J. Distinguishing between human-induced and climate-driven vegetation changes: A critical application of RESTREND in inner Mongolia. Landsc. Ecol. 2012, 27, 969–982. [Google Scholar] [CrossRef]
- Wessels, K.J.; Prince, S.D.; Frost, P.E.; van Zyl, D. Assessing the effects of human-induced land degradation in the former homelands of northern South Africa with a 1 km AVHRR NDVI time-series. Remote Sens. Environ. 2004, 91, 47–67. [Google Scholar] [CrossRef]
- Li, W.; Liu, C.; Su, W.; Ma, X.; Zhou, H.; Wang, W.; Zhu, G. Spatiotemporal evaluation of alpine pastoral ecosystem health by using the Basic-Pressure-State-Response Framework: A case study of the Gannan region, northwest China. Ecol. Indic. 2021, 129, 108000. [Google Scholar] [CrossRef]
- Zhang, X.; Liu, L.; Chen, X.; Gao, Y.; Xie, S.; Mi, J. GLC_FCS30: Global land-cover product with fine classification system at 30 m using time-series Landsat imagery. Earth Syst. Sci. Data 2021, 13, 2753–2776. [Google Scholar] [CrossRef]
- Liu, L.; Zhang, X.; Gao, Y.; Chen, X.; Shuai, X.; Mi, J. Finer-Resolution Mapping of Global Land Cover: Recent Developments, Consistency Analysis, and Prospects. J. Remote Sens. 2021, 2021, 5289697. [Google Scholar] [CrossRef]
- Zhang, C.; Ren, Y.; Cao, L.; Wu, J.; Zhang, S.; Hu, C.; Zhujie, S. Characteristics of dry-wet climate change in China during the past 60 years and its trends projection. Atmosphere 2022, 13, 275. [Google Scholar] [CrossRef]
- Abatzoglou, J.T.; Dobrowski, S.Z.; Parks, S.A.; Hegewisch, K. TerraClimate, a high-resolution global dataset of monthly climate and climatic water balance from 1958–2015. Sci. Data 2018, 5, 1–12. [Google Scholar] [CrossRef] [PubMed] [Green Version]
- Gu, Z.; Ju, W.; Li, L.; Li, D.; Liu, Y.; Fan, W. Using vegetation indices and texture measures to estimate vegetation fractional coverage (VFC) of planted and natural forests in Nanjing city, China. Adv. Space Res. 2013, 51, 1186–1194. [Google Scholar] [CrossRef]
- Zhang, M.; Wang, J.; Li, S. Tempo-spatial changes and main anthropogenic influence factors of vegetation fractional coverage in a large-scale opencast coal mine area from 1992 to 2015. J. Clean. Prod. 2019, 232, 940–952. [Google Scholar] [CrossRef]
- Stow, D.A.; Hope, A.; McGuire, D.; Verbyla, D.; Gamin, J.; Huemmrich, F. Remote sensing of vegetation and land-cover change in Arctic Tundra Ecosystems. Remote Sens. Environ. 2004, 89, 281–308. [Google Scholar] [CrossRef] [Green Version]
- Song, Y.; Ma, M.; Veroustraete, F. Comparison and conversion of AVHRR GIMMS and SPOT VEGETATION NDVI data in China. Int. J. Remote Sens. 2010, 31, 2377–2392. [Google Scholar] [CrossRef]
- Ge, J.; Meng, B.; Liang, T.; Feng, Q.; Gao, J.; Yang, S.; Huang, X.; Xie, H. Modeling alpine grassland cover based on MODIS data and support vector machine regression in the headwater region of the Huanghe River, China. Remote Sens. Environ. 2018, 218, 162–173. [Google Scholar] [CrossRef]
- Zhao, H.; Liu, S.; Dong, S.; Su, X.; Wang, X.; Wu, X.; Wu, L.; Zhang, X. Analysis of vegetation change associated with human disturbance using MODIS data on the rangelands of the Qinghai-Tibet Plateau. Rangel. J. 2015, 37, 77–87. [Google Scholar] [CrossRef]
- Du, J.; Quan, Z.; Fang, S.; Liu, C.; Wu, J.; Fu, Q. Spatiotemporal changes in vegetation coverage and its causes in China since the Chinese economic reform. Environ. Sci. Pollut. Res. 2020, 27, 1144–1159. [Google Scholar] [CrossRef]
- Cai, X.; Gu, Z.H.; Chen, J.; Liu, J.; Shi, P.J. Analysis of human-induced steppe degradation based on remote sensing in Xilin Gole, Inner Mongolia, China. J. Plant Ecol. 2006, 30, 268–277. [Google Scholar]
- Evans, J.; Geerken, R. Discrimination between climate and human-induced dryland degradation. J. Arid Environ. 2004, 57, 535–554. [Google Scholar] [CrossRef]
- Zhao, X.; Tan, K.; Zhao, S.; Fang, J. Changing climate affects vegetation growth in the arid region of the northwestern China. J. Arid Environ. 2011, 75, 946–952. [Google Scholar] [CrossRef]
- Alignier, A.; Le Cœur, D.; Lanoë, E.; Ferchaud, F.; Roche, B.; Thenail, C. Ecobordure: A flora-based indicator to assess vegetation patterns of field margins and infer its local drivers. Design in Brittany (France). Ecol. Indic. 2018, 85, 832–840. [Google Scholar] [CrossRef] [Green Version]
- Ma, X.; Huete, A.; Moran, S.; Ponce-Campos, G.; Eamus, D. Abrupt shifts in phenology and vegetation productivity under climate extremes. J. Geophys. Res. Biogeosci. 2015, 120, 2036–2052. [Google Scholar] [CrossRef]
- Zarei, A.; Asadi, E.; Ebrahimi, A.; Jafari, M.; Malekian, A.; Nasrabadi, H.M.; Chemura, A.; Maskell, G. Prediction of future grassland vegetation cover fluctuation under climate change scenarios. Ecol. Indic. 2020, 119, 106858. [Google Scholar] [CrossRef]
- Huang, K.; Zhang, Y.; Zhu, J.; Liu, Y.; Zu, J.; Zhang, J. The Influences of Climate Change and Human Activities on Vegetation Dynamics in the Qinghai-Tibet Plateau. Remote Sens. 2016, 8, 876. [Google Scholar] [CrossRef] [Green Version]
- Gao, Q.; Guo, Y.; Xu, H.; Ganjurjav, H.; Li, Y.; Wan, Y.; Qin, X.; Ma, X.; Liu, S. Climate change and its impacts on vegetation distribution and net primary productivity of the alpine ecosystem in the Qinghai-Tibetan Plateau. Sci. Total Environ. 2016, 554–555, 34–41. [Google Scholar] [CrossRef] [PubMed]
- Purevdorj, T.S.; Tateishi, R.; Ishiyama, T.; Honda, Y. Relationships between percent vegetation cover and vegetation indices. Int. J. Remote Sens. 1998, 19, 3519–3535. [Google Scholar] [CrossRef]
- Shobairi, S.O.R.; Usoltsev, V.A.; Chasovskikh, V.P. Dynamic estimation model of vegetation fractional coverage and drivers. Int. J. Adv. Appl. Sci. 2018, 5, 60–66. [Google Scholar] [CrossRef]
- Yue, J.; Guo, W.; Yang, G.; Zhou, C.; Feng, H.; Qiao, H. Method for accurate multi-growth-stage estimation of fractional vegetation cover using unmanned aerial vehicle remote sensing. Plant Methods 2021, 17, 1–16. [Google Scholar] [CrossRef] [PubMed]


| County/City Name | Area (km2) | Average Altitude (m) | Annual Average Temperature (°C) | Annual Average Precipitation (mm) | Total Population (10,000 People) |
|---|---|---|---|---|---|
| Maqu | 10,190.00 | 3700 | −0.23 | 611.9 | 5.49 |
| Xiahe | 6274.00 | 3500 | 1.31 | 516.0 | 8.63 |
| Zhuoni | 5419.68 | 3500 | 1.65 | 487.1 | 9.53 |
| Luqu | 5298.60 | 3500 | 1.00 | 633.0 | 3.80 |
| Hezuo | 2670.00 | 3000 | 1.48 | 545.0 | 11.21 |
| Lintan | 1557.68 | 2825 | 3.11 | 540.0 | 12.73 |
| Linxiaxian | 1212.40 | 2287 | 5.05 | 630.6 | 32.26 |
| Kangle | 1083.00 | 2000 | 4.85 | 550.0 | 25.59 |
| Hezheng | 960.00 | 3700 | 3.45 | 578.5 | 24.10 |
| Jishishan | 909.97 | 3000 | 4.76 | 660.2 | 23.93 |
| Linxiashi | 88.60 | 1917 | 6.46 | 484.0 | 35.59 |
| Total | 35,663.93 | 192.86 |
| Name | Area (km2) | Percentage (%) |
|---|---|---|
| Cropland | 3901.07 | 12.06 |
| Grassland | 22,940.03 | 70.92 |
| Broadleaf forest | 1140.77 | 3.53 |
| Needleleaf forest | 4084.68 | 12.63 |
| Shrubland | 2.05 | 0.01 |
| Sparse vegetation | 4.69 | 0.01 |
| Wetlands | 6.79 | 0.02 |
| Impervious surfaces | 125.42 | 0.39 |
| Bare areas | 12.34 | 0.04 |
| Water body | 129.60 | 0.40 |
| Permanent ice and snow | 0.54 | 0.00 |
| AI Value | Climate Class | Area (km2) | Percentage (%) |
|---|---|---|---|
| 0.2–0.5 | Semi-arid | 3685.58 | 11.17 |
| 0.5–0.65 | Semi-humid | 11,462.53 | 34.75 |
| >0.65 | Humid | 17,838.89 | 54.08 |
| FVC Grading Criteria | Grade |
|---|---|
| p-value < 0.05 AND | Significant increase |
| p-value > 0.05 AND | Slight increase |
| p-value > 0.05 AND | Slight decrease |
| p-value < 0.05 AND | Significant decrease |
Publisher’s Note: MDPI stays neutral with regard to jurisdictional claims in published maps and institutional affiliations. |
© 2022 by the authors. Licensee MDPI, Basel, Switzerland. This article is an open access article distributed under the terms and conditions of the Creative Commons Attribution (CC BY) license (https://creativecommons.org/licenses/by/4.0/).
Share and Cite
Liang, Y.; Zhang, Z.; Lu, L.; Cui, X.; Qian, J.; Zou, S.; Ma, X. Trend in Satellite-Observed Vegetation Cover and Its Drivers in the Gannan Plateau, Upper Reaches of the Yellow River, from 2000 to 2020. Remote Sens. 2022, 14, 3849. https://doi.org/10.3390/rs14163849
Liang Y, Zhang Z, Lu L, Cui X, Qian J, Zou S, Ma X. Trend in Satellite-Observed Vegetation Cover and Its Drivers in the Gannan Plateau, Upper Reaches of the Yellow River, from 2000 to 2020. Remote Sensing. 2022; 14(16):3849. https://doi.org/10.3390/rs14163849
Chicago/Turabian StyleLiang, Yu, Zhengyang Zhang, Lei Lu, Xia Cui, Jikun Qian, Songbing Zou, and Xuanlong Ma. 2022. "Trend in Satellite-Observed Vegetation Cover and Its Drivers in the Gannan Plateau, Upper Reaches of the Yellow River, from 2000 to 2020" Remote Sensing 14, no. 16: 3849. https://doi.org/10.3390/rs14163849