Article

Quantifying the Long-Term MODIS Cloud Regime Dependent Relationship between Aerosol Optical Depth and Cloud Properties over China

1
College of Global Change and Earth System Science, Beijing Normal University, Beijing 100875, China
2
Department of Atmospheric and Oceanic Sciences, School of Physics, Peking University, Beijing 100871, China
*
Author to whom correspondence should be addressed.
Remote Sens. 2022, 14(16), 3844; https://doi.org/10.3390/rs14163844
Submission received: 4 July 2022 / Revised: 1 August 2022 / Accepted: 3 August 2022 / Published: 9 August 2022
(This article belongs to the Special Issue Remote Sensing of Air Pollution)

Abstract

:
Aerosols modify cloud properties and influence the regional climate. The impacts of aerosols on clouds differ for various cloud types, but their long-term relationships have not been fully characterized on a cloud regime basis. In this study, we quantified the cloud regime-dependent relationship between aerosol optical depth (AOD) and cloud properties over China using Moderate-Resolution Imaging Spectroradiometer (MODIS) data from 2002 to 2019. Daily clouds in each 1° by 1° grid were categorized into seven cloud regimes based on the “k-means” clustering algorithm. Overall, the cloud height increased, the cloud thickness and liquid water path increased, and the total cloud cover decreased for all cloud regimes during the study period. Linear correlations between AOD and cloud properties were found within stratocumulus, deep convective, and high cloud regimes, showing consistency with the classic aerosol–cloud interaction paradigms. Using stepwise multivariable linear regression, we found that the meteorological factors dominated the variation of cloud top pressure, while AOD dominated the variation of total cloud cover for most cloud regimes. There are regional differences in the main meteorological factors affecting the cloud properties.

Graphical Abstract

1. Introduction

Aerosols can modify the microphysical, macrophysical, and optical characteristics of clouds by acting as cloud condensation nuclei or ice nuclei. The estimation of aerosol-mediated changes in cloud properties and radiative forcing is subject to great uncertainty and has been the frontier in the field of global climate change research [1,2,3].
The aerosol–cloud interactions (ACIs) depend on the cloud type, the aerosol type, and sometimes more importantly, the environmental conditions. A multitude of ACI mechanisms has been proposed for specific cloud types [2,4,5,6]. As a result, the relationship between aerosol loading and cloud properties shows various features. For low-level liquid clouds, which include shallow cumuli and stratocumuli, aerosols reduce cloud droplet sizes and increase cloud albedo (i.e., the Twomey effect, or the first indirect effect [7]) and suppress warm rain, which leads to elongated cloud lifetimes and increased cloud cover (i.e., the Albrecht effect, or the second indirect effect [8]). For mixed-phase stratiform clouds, riming indirect effects (i.e., smaller cloud droplets decrease the riming efficiency [9]) and glaciation indirect effects (i.e., more ice nuclei increase precipitation efficiency and reduce cloud cover and cloud optical depth [10,11]) have been identified. Studies on Arctic mixed-phase clouds show that increased cloud condensation nuclei may lead to prolonged cloud lifetimes [12,13,14,15]. For deep convective clouds (DCCs) with a deep warm cloud base and weak wind shear, aerosols suppress warm rain and cloud water is conveyed to higher levels, freezes into ice precipitation, and releases latent heat that invigorates convection (i.e., the “aerosol invigoration effect”) [16,17,18].
In the past 40 years, China has experienced sustained economic growth, which has been accompanied by increasing emissions of anthropogenic aerosols. Accumulating evidence has shown that aerosols can alter clouds and precipitation over China [19,20,21,22,23,24,25]. ACIs over China may show similar or different features to the classic ACI paradigms. Under highly polluted conditions, the aerosol effective radius increases with aerosol loading from satellite observations [26,27,28], which appears to be an “anti-Twomey” effect. The observed “anti-Twomey” effect is probably due to the neglect of the overlap between aerosol and cloud layers [29] or the aerosol hygroscopic growth [30]. Total cloud cover over eastern China is observed to be strongly correlated with aerosol loading [28], which agrees with the Albrecht effect. Multiple lines of evidence support the invigoration effect. Chen et al. [31] observed elevated cloud top heights and mass centers for DCCs in polluted conditions in eastern China. Based on field observations and model simulations over eastern China, Fan et al. [18] found that aerosols influence DCCs with a lower cloud base and higher cloud top. Long-term observations in northwestern China show ACI signals of the Twomey effect, Albrecht effect, and semidirect effect [32].
Conclusively interpreting all observations by one or more ACI mechanisms is an almost impossible task. However, based on cloud regime classification, it is possible to distinguish the dominant mechanisms for specified cloud types, as advocated by Stevens and Feingold [33]. Using cloud regime analysis, Gryspeerdt et al. [34,35] showed that the occurrence of marine stratiform increased with increased aerosols. Recently, Oreopoulos et al. [36] investigated the global apparent aerosol–cloud relationship signals using long-term (12 years) observations from the Moderate-Resolution Imaging Spectroradiometer (MODIS) based on cloud regime classification.
Observational investigations (e.g., Oreopoulos et al. [36]) are of great value because global estimates of aerosol indirect effects mostly rely on global climate models, which can only represent the Twomey effect and/or the Albrecht effect for the time being. Global climate models are subject to large uncertainties in representing ACIs partly due to the difficulties in applying global observational constraints. Moreover, the problem of the scale dependence of the ACI is addressed, and substantial interregional variations are noticed due to the different meteorological environments [36,37].
In this study, we carried out a regional investigation of the long-term (2002–2019) relationship of aerosol and cloud properties over China (70°~135°E, 10°~60°N) based on cloud regime classification. By focusing on the regional scale instead of the global scale, we attempt to amplify the ACIs specific to the meteorological conditions in China. Cloud regimes were objectively identified by the “k-means clustering” method with the observed joint histograms of cloud top pressure (CTP) and cloud optical thickness (COT) by MODIS. The cloud regime-dependent relationships between AOD and cloud properties were analyzed and compared against the classic ACI paradigms. Finally, stepwise multivariable linear regression was used to investigate the relative contributions of aerosols and meteorological variables to cloud properties. Section 2 describes the data and methods. The results are presented in Section 3. The discussion and conclusions are provided in Section 4.

2. Data and Methods

2.1. Data

The cloud and aerosol data used in this study are the satellite retrieval products from the MODIS-Aqua Collection 6 level 3 daily 1° × 1° dataset (MYD08_D3). We use MODIS data from 1 May 2002 to 3 July 2019 in China (10°~60°N, 70~135°E). For aerosol products, we use gridded daily mean AOD at 550 nm retrieved by the combined Dark Target and Deep Blue algorithm [38]. For the MODIS products, AODs are not retrieved over cloudy areas. An assumption in this study is that the pixels in the surroundings of cloud covered areas have similar AODs with the cloudy areas. This is a reasonable assumption considering that the aerosols spread more homogeneously than the clouds. To avoid the cloud contamination issue in the vicinity of clouds [39], only pixels with an AOD below 2.5 are used. For cloud products, we use the joint histograms of CTP and COT to derive the cloud regimes (hereafter CRs). In addition, the cloud data used here mainly include the daily gridded mean CTP, COT, liquid water path (LWP), and total cloud cover (TCC).
The meteorological data are obtained from ERA5 reanalysis at the European Center for Medium-Range Weather Forecasts (ECMWF). To match the overpass time at 13:30 (local time) of the Aqua satellite, we interpolate the variables at 5:00 and 6:00 UTC, which are 13:00 and 14:00 local time over China. The meteorological variables that we select in this study include temperature, relative humidity (RH), horizontal wind speed, vertical velocity (w), geopotential height (GPH) at 5 levels (200 hPa, 500 hPa, 700 hPa, 850 hPa, and 1000 hPa), low tropospheric stability (LTS) between 1000 and 700 hPa, and wind shear below 7 km from the ground. The LTS is a physical quantity representing the thermal state of the lower troposphere atmosphere and can be obtained by
LTS = θ 700 θ 1000 ,
θ = T ( P 0 P ) R c P T ( 1000 P ) 0.286 .
where T represents the temperature, P represents the atmospheric pressure, P 0 represents the reference surface pressure (i.e., 1000 hPa), cp represents constant pressure specific heat capacity, and R represents specific gas constant. A smaller LTS indicates a less stable atmosphere. The method of wind shear calculation is from Fan et al. [40]:
Wind   shear = max ( u ) min ( u ) ,
where max(u) and min(u) are the maximum and minimum wind speed within 7 km from the ground, respectively.

2.2. Methods

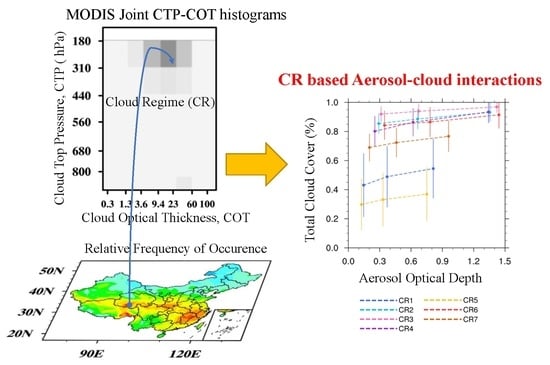
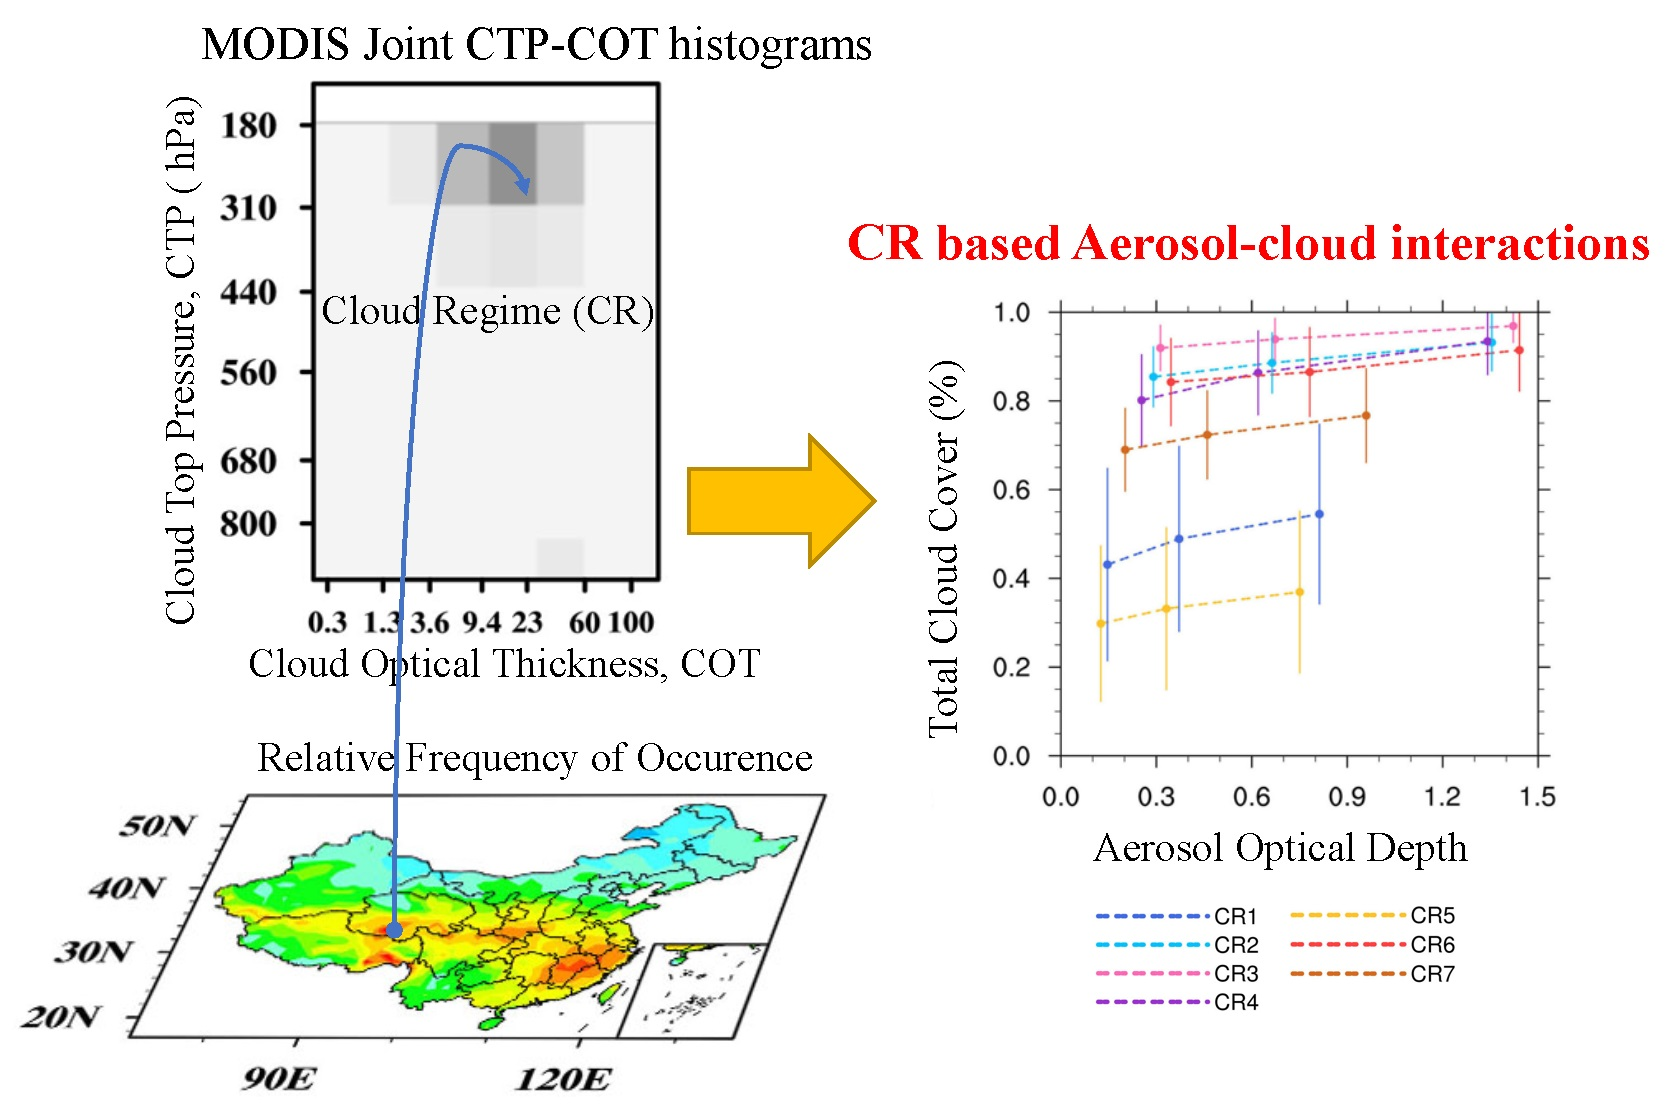
2.2.1. Determination of the Cloud Regimes

We classify the clouds into seven regimes using the k-means clustering algorithm [41]. The algorithm is objective except for the setting of the number of clusters, k. We started at four clusters. The initial cluster centroids are selected from the CTP-COT histograms of some random grids on 1 May 2002. The Euclidean distances between the daily COT-CTP histogram of each grid and the cluster centroids are calculated and each grid is assigned to the nearest cluster. Once the cluster is allocated, a new centroid is recalculated by averaging all the histograms within the cluster. The process of acquiring new centroids repeats until all data are examined. Ten iterations are performed to ensure the resultant centroids are converged.
Next, we increase the number of clusters and repeat the above analysis until the optimal number of clusters is found. Following Rossow et al. [42], the criteria of an optimal number of clusters are: (1) the resulting centroid histogram patterns must not change significantly (as judged by the pattern correlations among the centroids) when the random starting centroids are changed, (2) the resulting centroid patterns should differ from each other significantly (pattern correlations should be low), (3) the spatiotemporal correlations of the centroid histograms should also be low, and (4) the distance between cluster centroids should be larger than the dispersions of the cluster member distances from the centroid. According to Oreopoulos et al. [43], the pattern correlation coefficients between the centroids of all regimes and subregimes should be less than 0.6, and the relative frequency of occurrences (RFO) of geographic distribution of any cluster should be less than 0.8. This creates seven cloud regimes, which includes two subregimes split from an original regime that contains mixtures of mid- and high-clouds.
We then assign each pixel to the nearest regime by its mean values of CTP, COT, and TCC following Williams and Webb [44]. Compared to assigning by daily CTP-COT histograms, this is a more tolerant and simpler methodology and is beneficial in improving the speed of the assignment [45].

2.2.2. The Relationship between Cloud Properties and AOD

We applied anomaly values of AOD and cloud properties in the linear regression to eliminate the effect of covariation with the annual cycle. The anomalies are calculated by subtracting daily values from the multiyear averages of the daily values. In total, 16 years of full annual cycles from 2003–2018 are used to calculate the multiyear averages. The anomalies are defined as:
A n o m a l y ( m , n ) = O b s e r v a t i o n ( m , n ) n = 1 16 O b s e r v a t i i o n ( m , n ) 16 ,
where m represents the date, and n represents the year. Observation represents observational data of AOD and cloud properties.
We use Pearson linear regression coefficient (denoted as β ) to quantify the relationship between AOD and cloud properties. The linear correlation coefficient is defined as:
β = ( x m x ) ( y   m y )   ( x m x ) 2   ( y   m y ) 2 ,
where x represents AOD anomalies and mx is the mean of x. y represents cloud property anomalies and my is the mean of y.
We follow the method of Feingold et al. [46] to calculate the sensitivities of cloud properties to the perturbation of aerosol for each 1° grid. The sensitivities of CTP (bCTP) and TCC (bTCC) to AOD are given by
b CTP = d   ln   CTP   d ln AOD
and
b TCC = d ln TCC d ln AOD
where AOD represents AOD anomalies, CTP represents CTP anomalies and TCC represents TCC anomalies. The sensitivities are defined in terms of a derivative involving logarithmic quantities so that the variations are relative to the absolute values of AOD, TCC and CTP. A larger value of b indicates more sensitive.

2.2.3. Stepwise Multivariable Linear Regression

We adopt the stepwise multivariable linear regression analysis to distinguish the contributions of aerosols and meteorological factors to clouds. The anomalies of AOD, cloud properties, and meteorological factors are calculated by Equation (4) and are used in the regression. We introduce a forward selection approach that imports variables into the regression equation one by one according to their influence on clouds, which is measured by the square of their individual partial regression coefficients. The variables that are deemed statistically significant are kept. The process is repeated until the results are optimal. Since the units of each independent variable are different, we use the standardized partial regression coefficient ( β m ) to quantify the contribution of each independent variable. β m can reflect the importance of the corresponding independent variables. The multivariable stepwise regression to quantify the contribution of aerosol and meteorology to cloud properties is given by
Y = β 1 X 1 + β 2 X 2 + + β k X k ,
where Y is the anomaly of cloud properties, Xm (m = 1, 2, 3 … k) are the anomalies of AOD, temperature, horizontal wind, relative humidity, vertical velocity, geopotential height, wind shear and LTS, and β m   ( m = 1 , 2 , 3 , ,   k ) are their partial regression coefficients. All significance tests satisfied p < 0.05.

3. Results

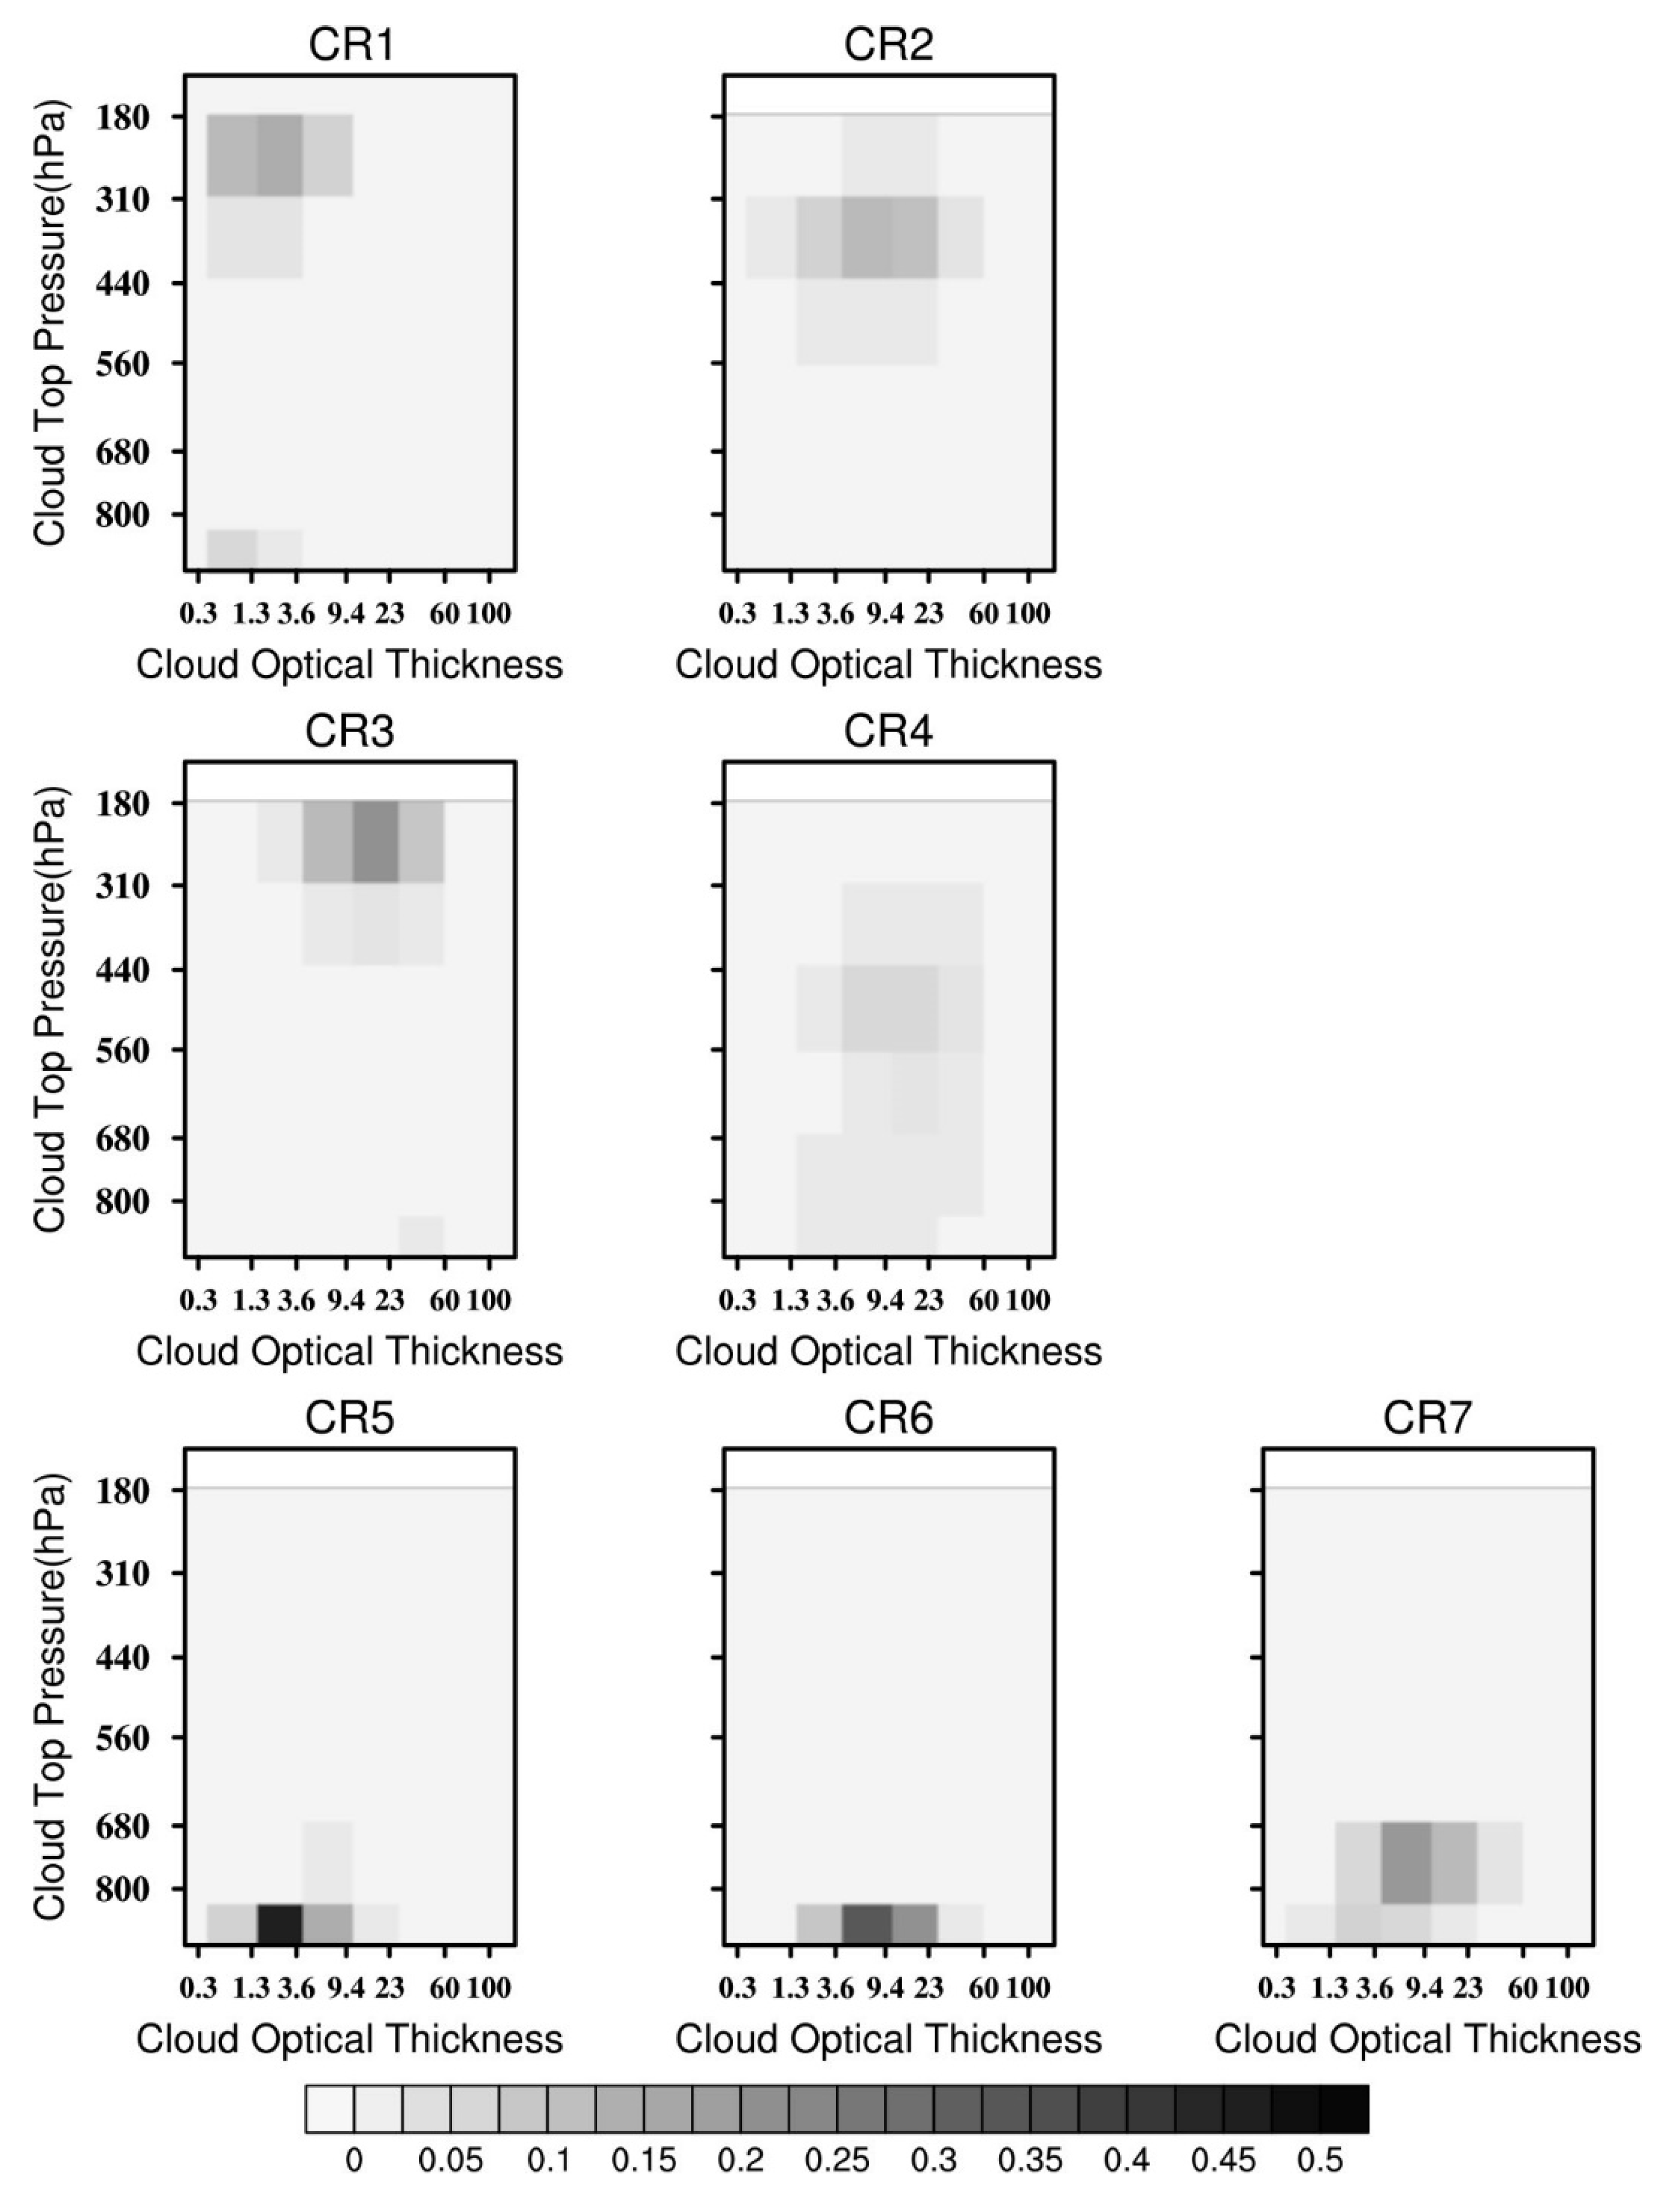
3.1. Cloud Classification over China from 2002 to 2019

Figure 1 shows the centroids of CTP and COT (i.e., the average joint histograms) for the seven clusters. We interpreted the clusters as different cloud regimes according to ISCCP cloud type definition [47] based on the cluster average of CTP and COT (Table 1). CR1 and CR2 were categorized as cirrostratus (CTP < 440 hPa, COT between 3.6 and 23). CR3 and CR4 were two “subregimes” split from one regime. The clouds in CR3 had the lowest average CTP (323.0 hPa), the largest COT (17.4), and the largest LWP (295.7 g/m2) among all regimes. Moreover, CR3 was the prevailing cloud regime during summer over most parts of China (see Figure S1 in the Supporting Materials) when DCCs occurred most frequently [48]. We thus inferred that CR3 contained the largest amount of DCCs among all cloud regimes. CR4 represented altostratus whose CTP spanned a wide range from the surface to approximately 400 hPa, and the COT (13.9) and TCC (87.8%) were relatively large. CR5 was categorized as stratocumulus (CTP < 680 hPa, COT between 3.6 and 23). It appeared to contain many scattered cumuli. CR6 had similar COT and CTP as CR5 but a larger TCC (91.1%). We inferred that CR6 was dominated by stratocumuli produced by large-scale subsidence due to weather systems. CR7 had a centroid pattern similar to those of CR5 and CR6 but developed higher and contained more liquid water. We inferred CR7 to be also dominated by stratocumuli. We should mention that an exception to the cloud type interpretation existed over the Tibetan Plateau (TP) and Qinghai Province due to the high surface elevation.
Figure 2 shows the geographic distributions of the multiannual average RFO for each regime. CR1 was dominated by optically thin and high-top clouds that seated over northwestern China and the TP. CR2 had a geographic distribution similar to that of CR1. The differences were that CR1 dominated the southwestern TP, while CR2 dominated the eastern TP and western Sichuan Basin. CR3 was mainly distributed along the Yangtze River Basin and southeastern China, with the highest RFO (22.1%) among all regimes. CR4 occurred most frequently in the Sichuan Basin and the Yunnan–Guizhou Plateau. The wide range of CTP in CR4 could also result from the complex topography of the Yun-Gui-Chuan region, whose altitude rises from 400 m in the southeast to 3500 m in the northwest. The geographic distributions of CR5, CR6 and CR7 were in Yunnan, Inner Mongolia and northeastern China. CR7 had the lowest RFO (3.9%) among all regimes.
Considering the similarities of the centroids and the collocation of the spatial distribution among regimes, we determined that some cloud regimes were related probably due to similar dynamic/thermodynamic environments and topography. CR1 and CR2 were high-level cirrostrati prevailing over the TP. CR3 and CR4 were high- and mid-level convective and altostrati mostly related to DCCs and other convective clouds. CR5, CR6, and CR7 were generally categorized as low-level stratocumuli.

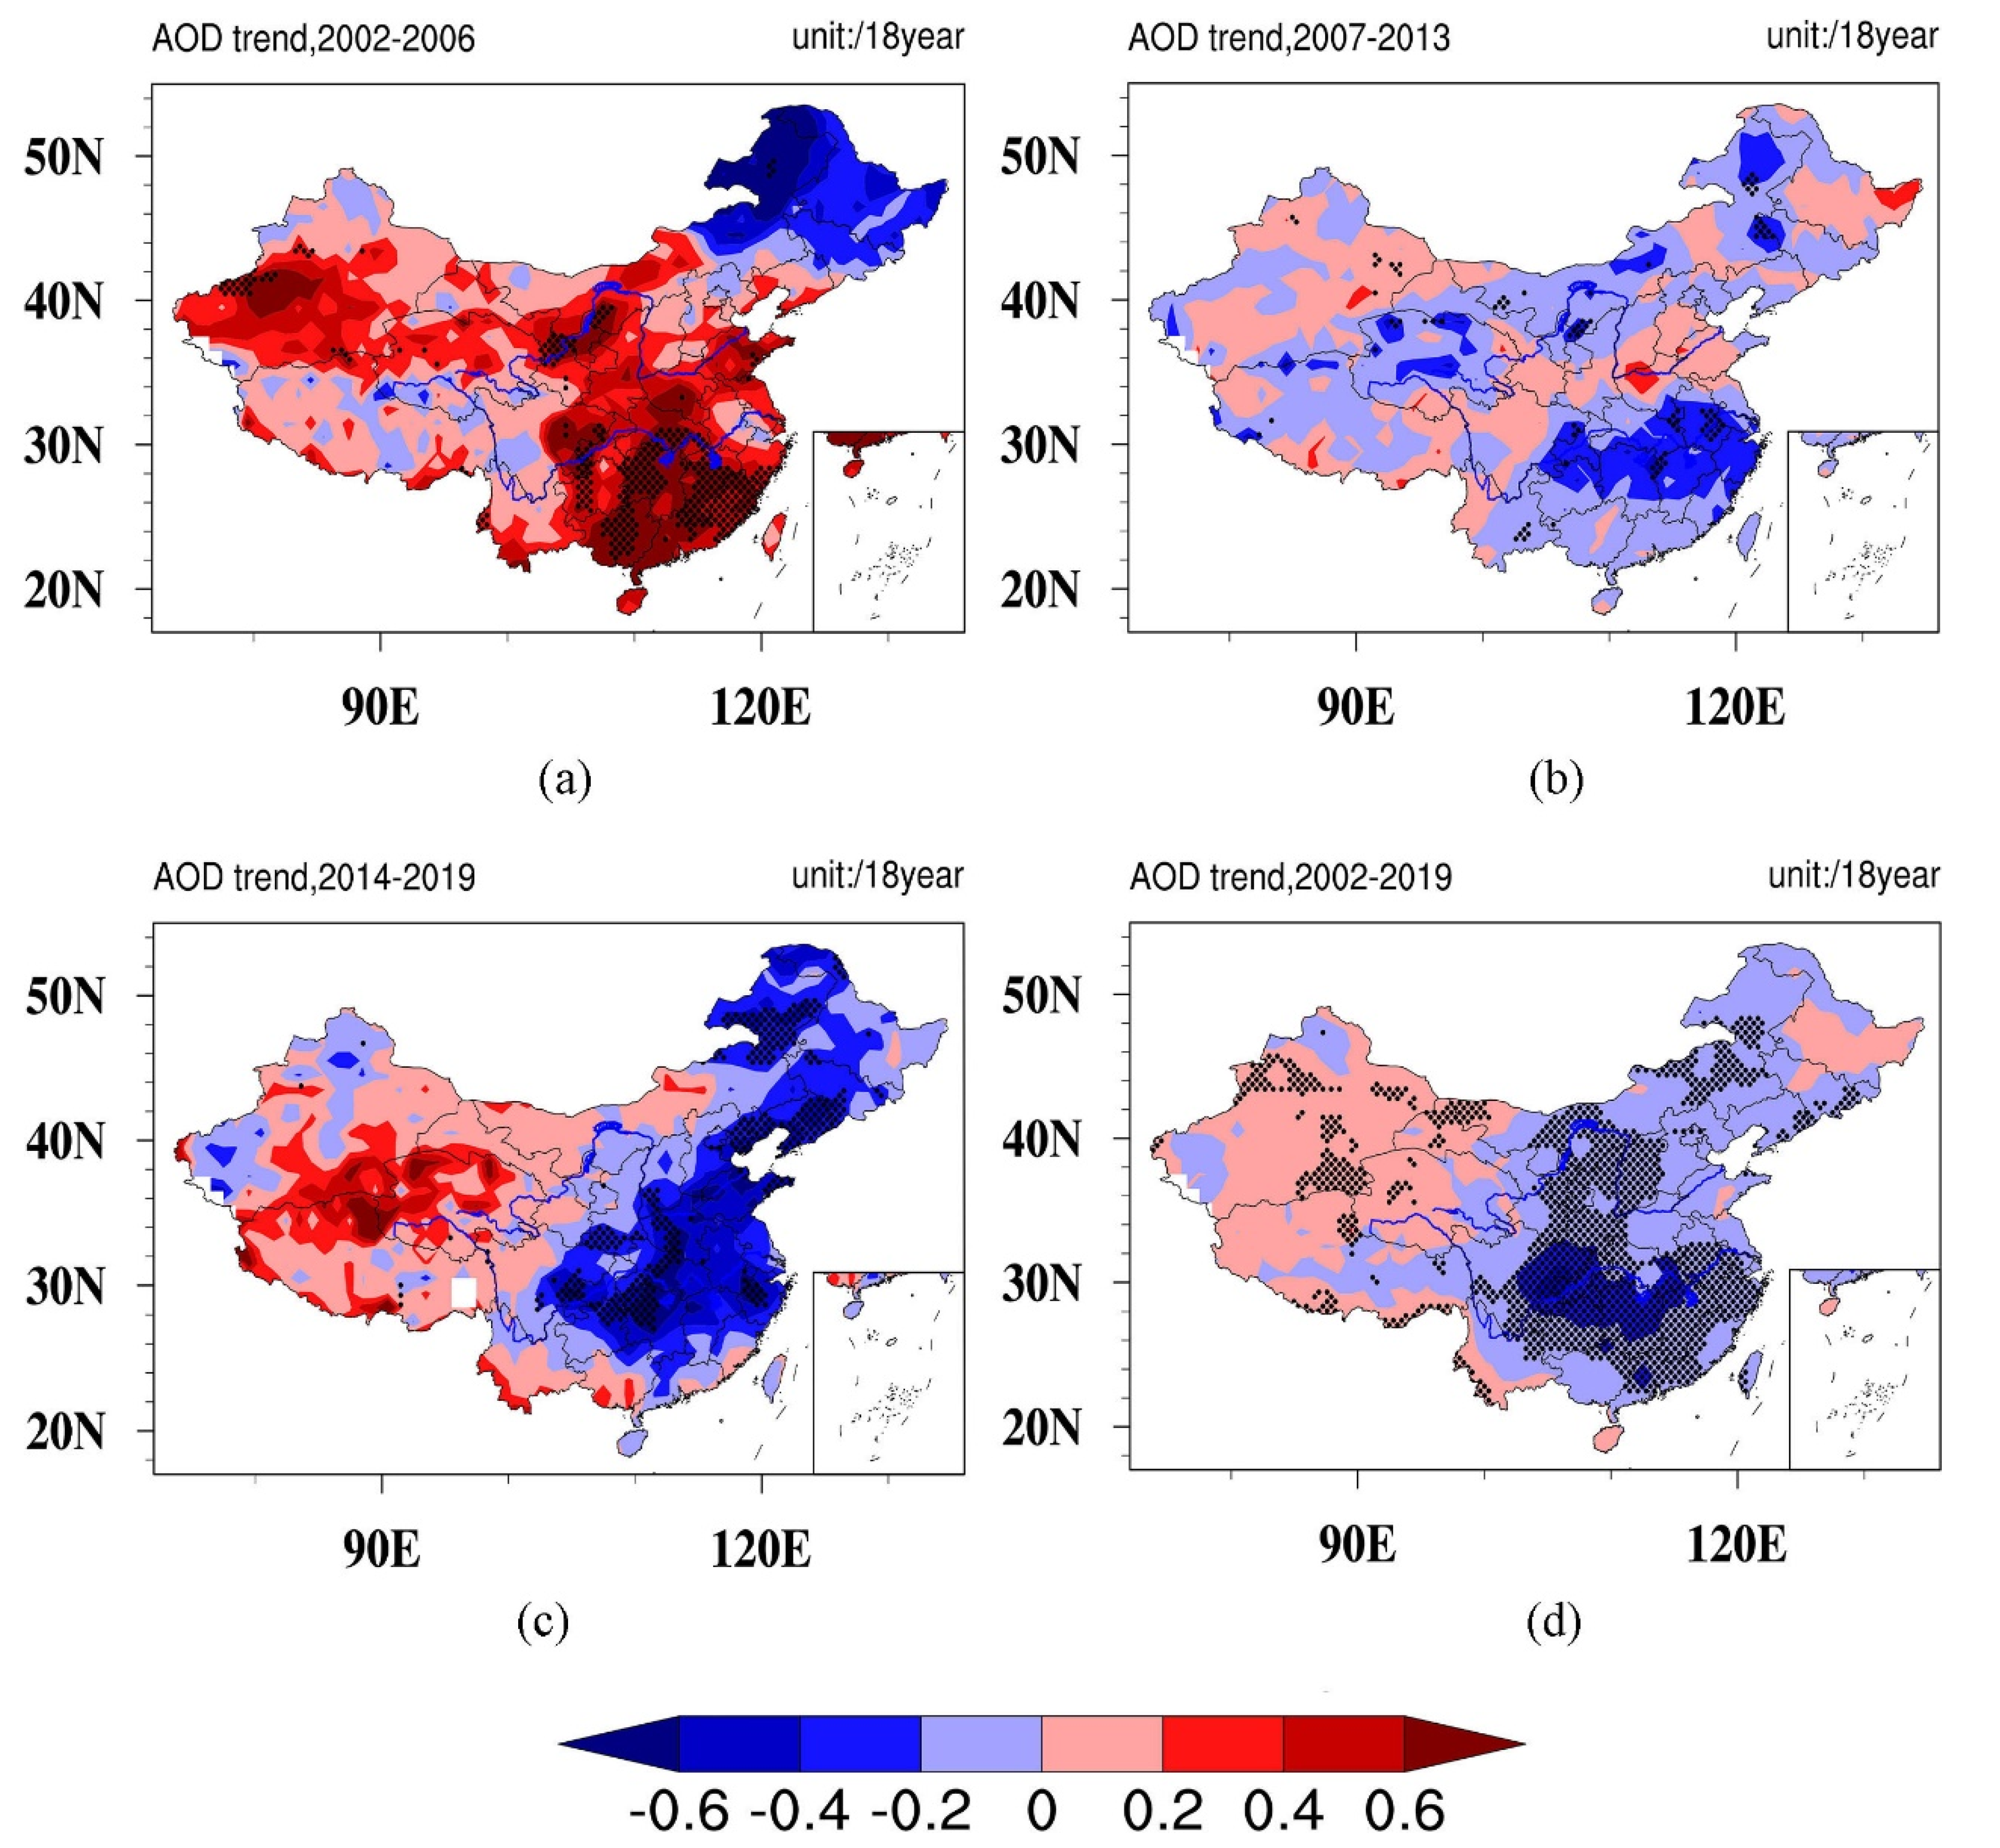
3.2. Temporal and Spatial Variation of AOD and Cloud Properties

The AOD over China has experienced stages of changes during 2002–2019 (Figure 3). During 2002–2006, the AOD increased significantly in most areas, especially in eastern China (Figure 3a). The increasing trend of AOD may be related to the high energy consumption in eastern China. The growth trends of the AOD in China slowed down after 2006 [49]. From 2007 to 2013, the AOD turned into a declining tendency in most areas (Figure 3b). The AOD trend in the eastern China turned negative, indicating that pollutant emissions from human activities have been effectively controlled through industrial and energy restructuring.
From 2014 to 2019, AOD showed a significant downward trend in most regions (Figure 3c). The reduction rate of AOD in the middle and lower reaches of the Yangtze River Delta and the Pearl River Delta was greater than 0.6 per 18 years. This could be caused by the action plan on the prevention and control of air pollution implemented in 2013. Instead, AOD increased in most parts of western China, especially in southern Xinjiang and the border between the Qinghai−Tibet Plateau and northwestern Qinghai, with an increase rate greater than 0.6 per 18 years. Overall AOD decreased in eastern China and increased in western China from 2002 to 2019 (Figure 3d).
Due to the obvious east–west differences in the AOD trends, we used the “Heihe–Tengchong Line” as the divide to examine the trends of cloud properties in eastern and western China (Figure 4). Most CTP shows a negative trend during 2002−2019 in both eastern and western China, i.e., clouds were higher (Figure 4a). The trend of higher clouds in the west was more obvious than in the east. The CTP of CR5 (stratocumulus) in the west declined by 51.68 hPa per 18 years. The variations in COT and LWP are in good consistency (Figure 4b,c). This may be related to the fact that MODIS obtained LWP data by the inversion of COT [50]. The COT and LWP increased significantly after 2007, indicating that clouds became thicker and cloud liquid water content became more abundant. For CR4 in the eastern region, the COT increased by 5.32 hPa per 18 years, and the LWP increased by 88.16 g/m2 per 18 years. Figure 4d shows a general decreasing trend of TCC in recent years, which is consistent with previous studies that a fluctuating decreasing trend of TCC were found over China in the last fifty years [51,52]. The decrease in TCC in eastern China coincided with the decrease in aerosol content from 2007 to 2019. Generally, CTPs decrease (i.e., higher clouds), COT and LWP increase (thicker cloud), and TCC decreases (fewer clouds) for the majority of the cloud regimes over China.

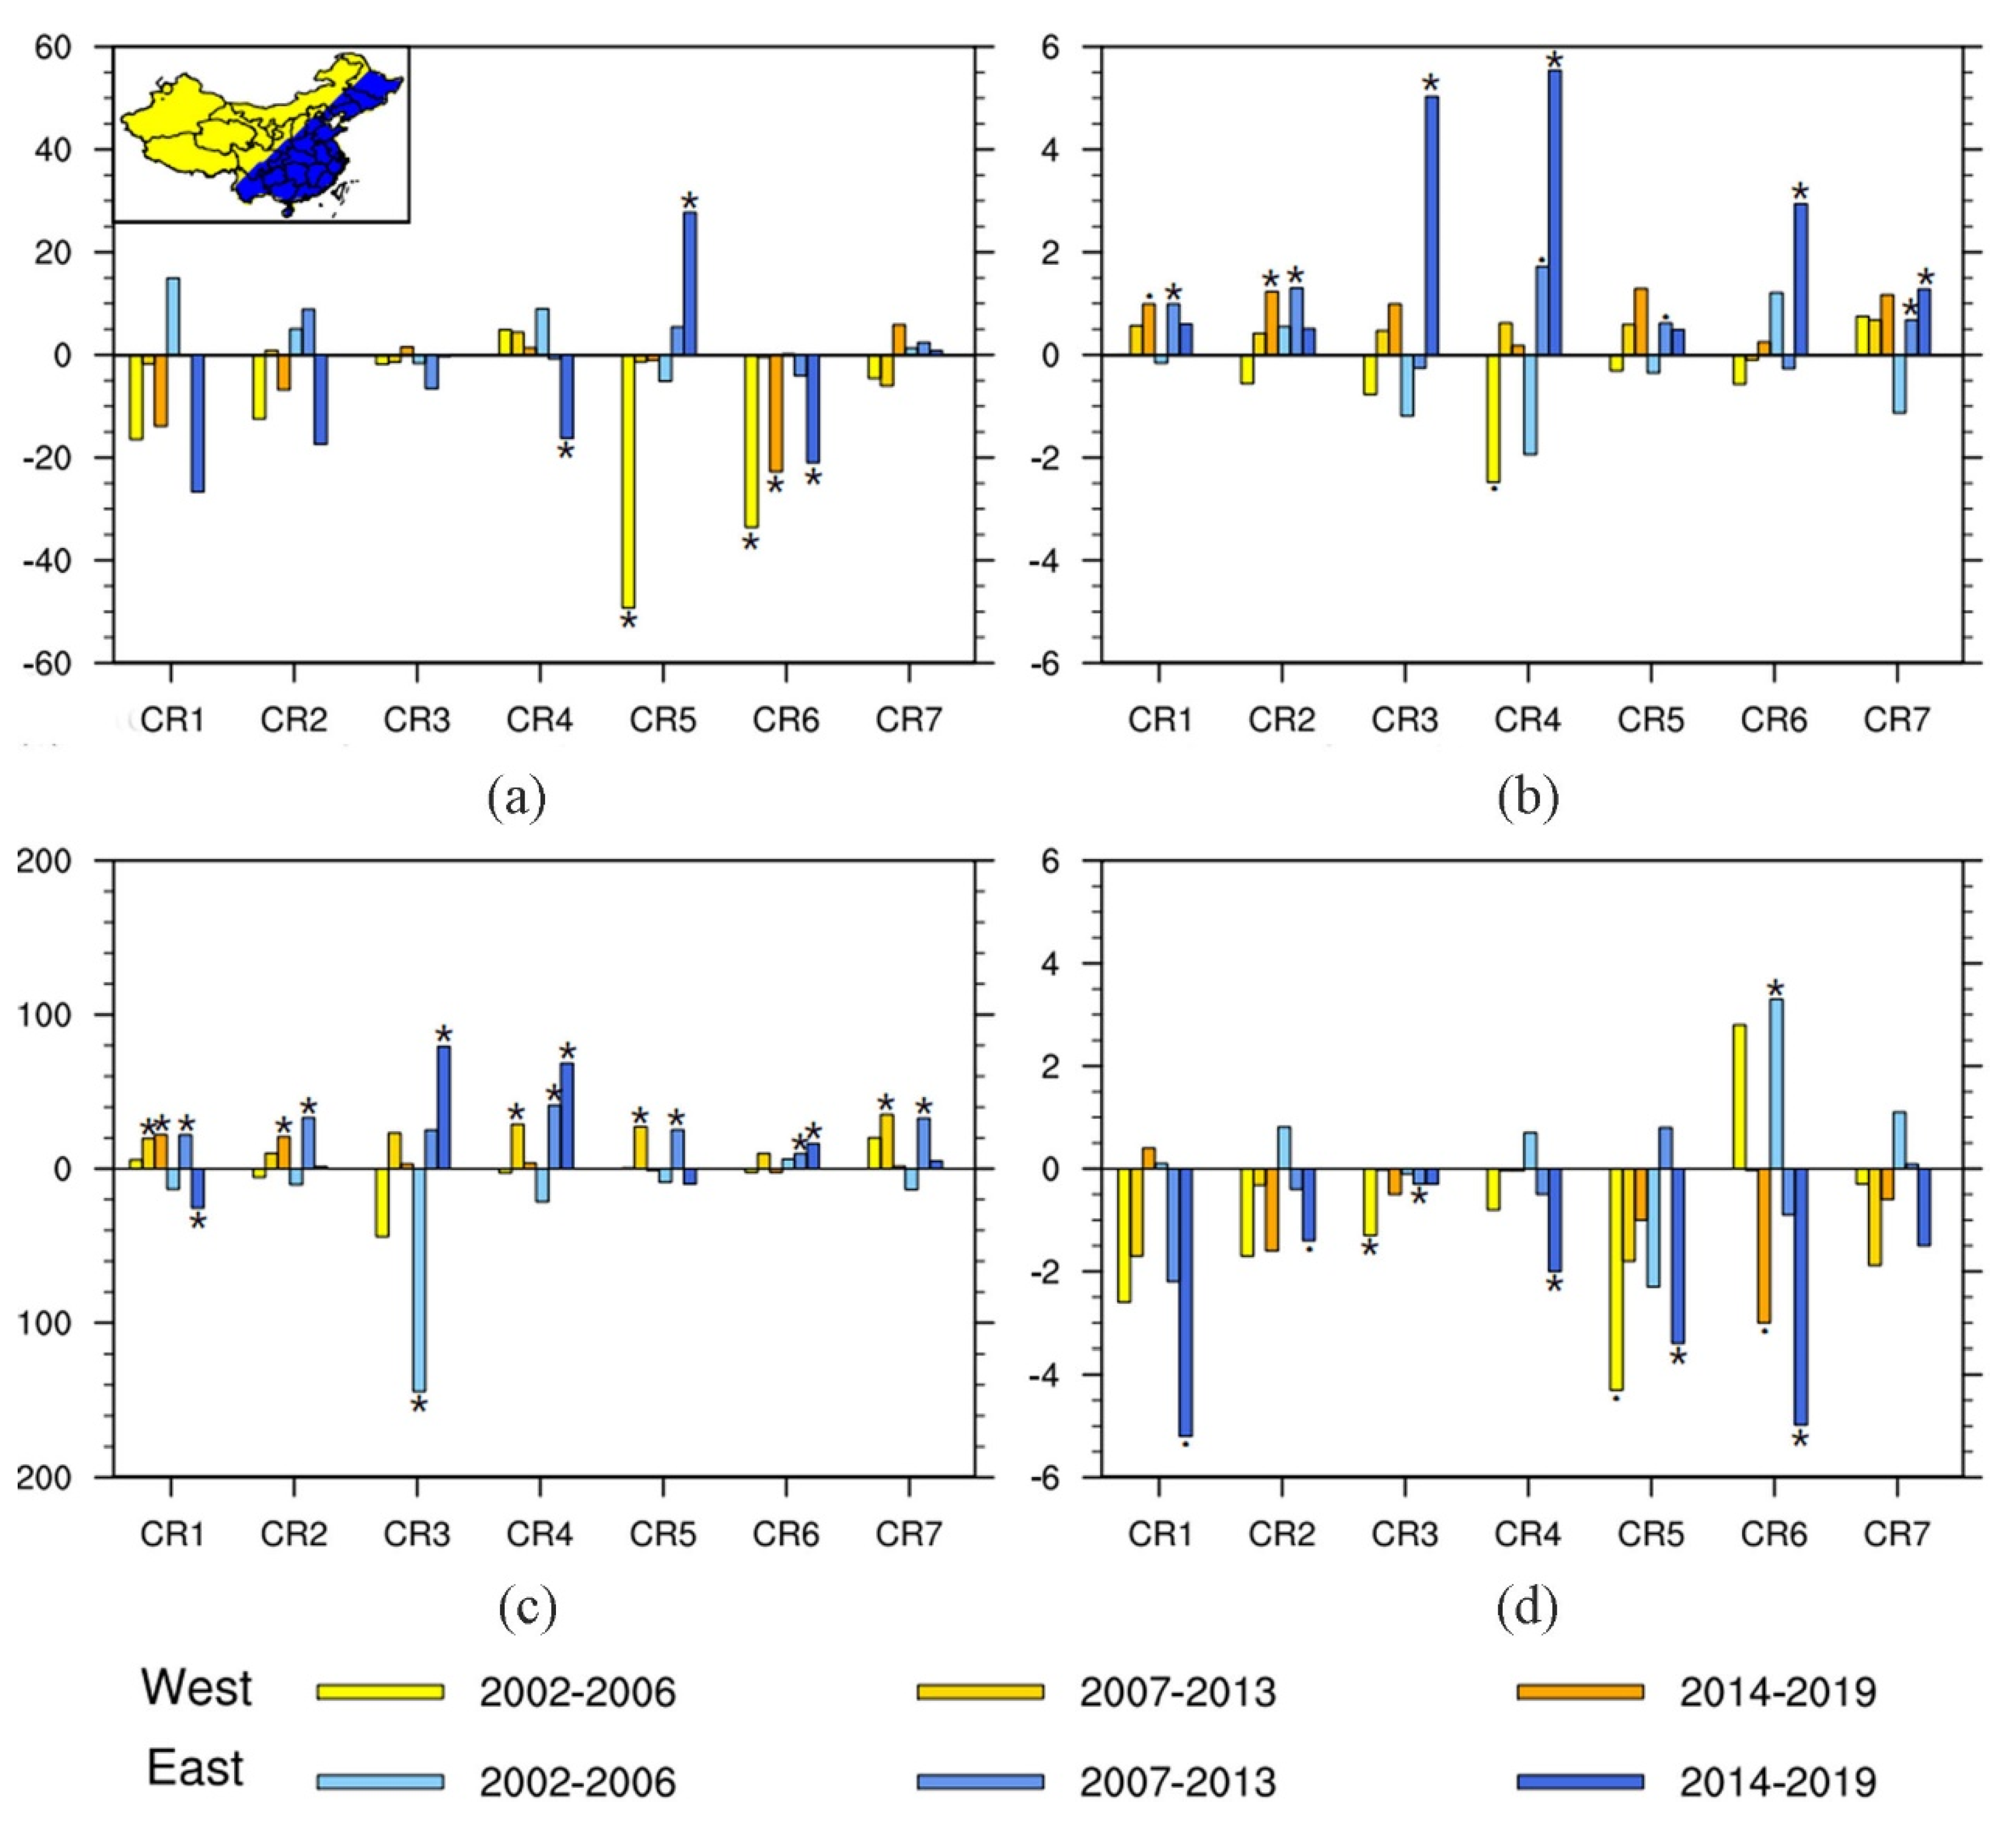
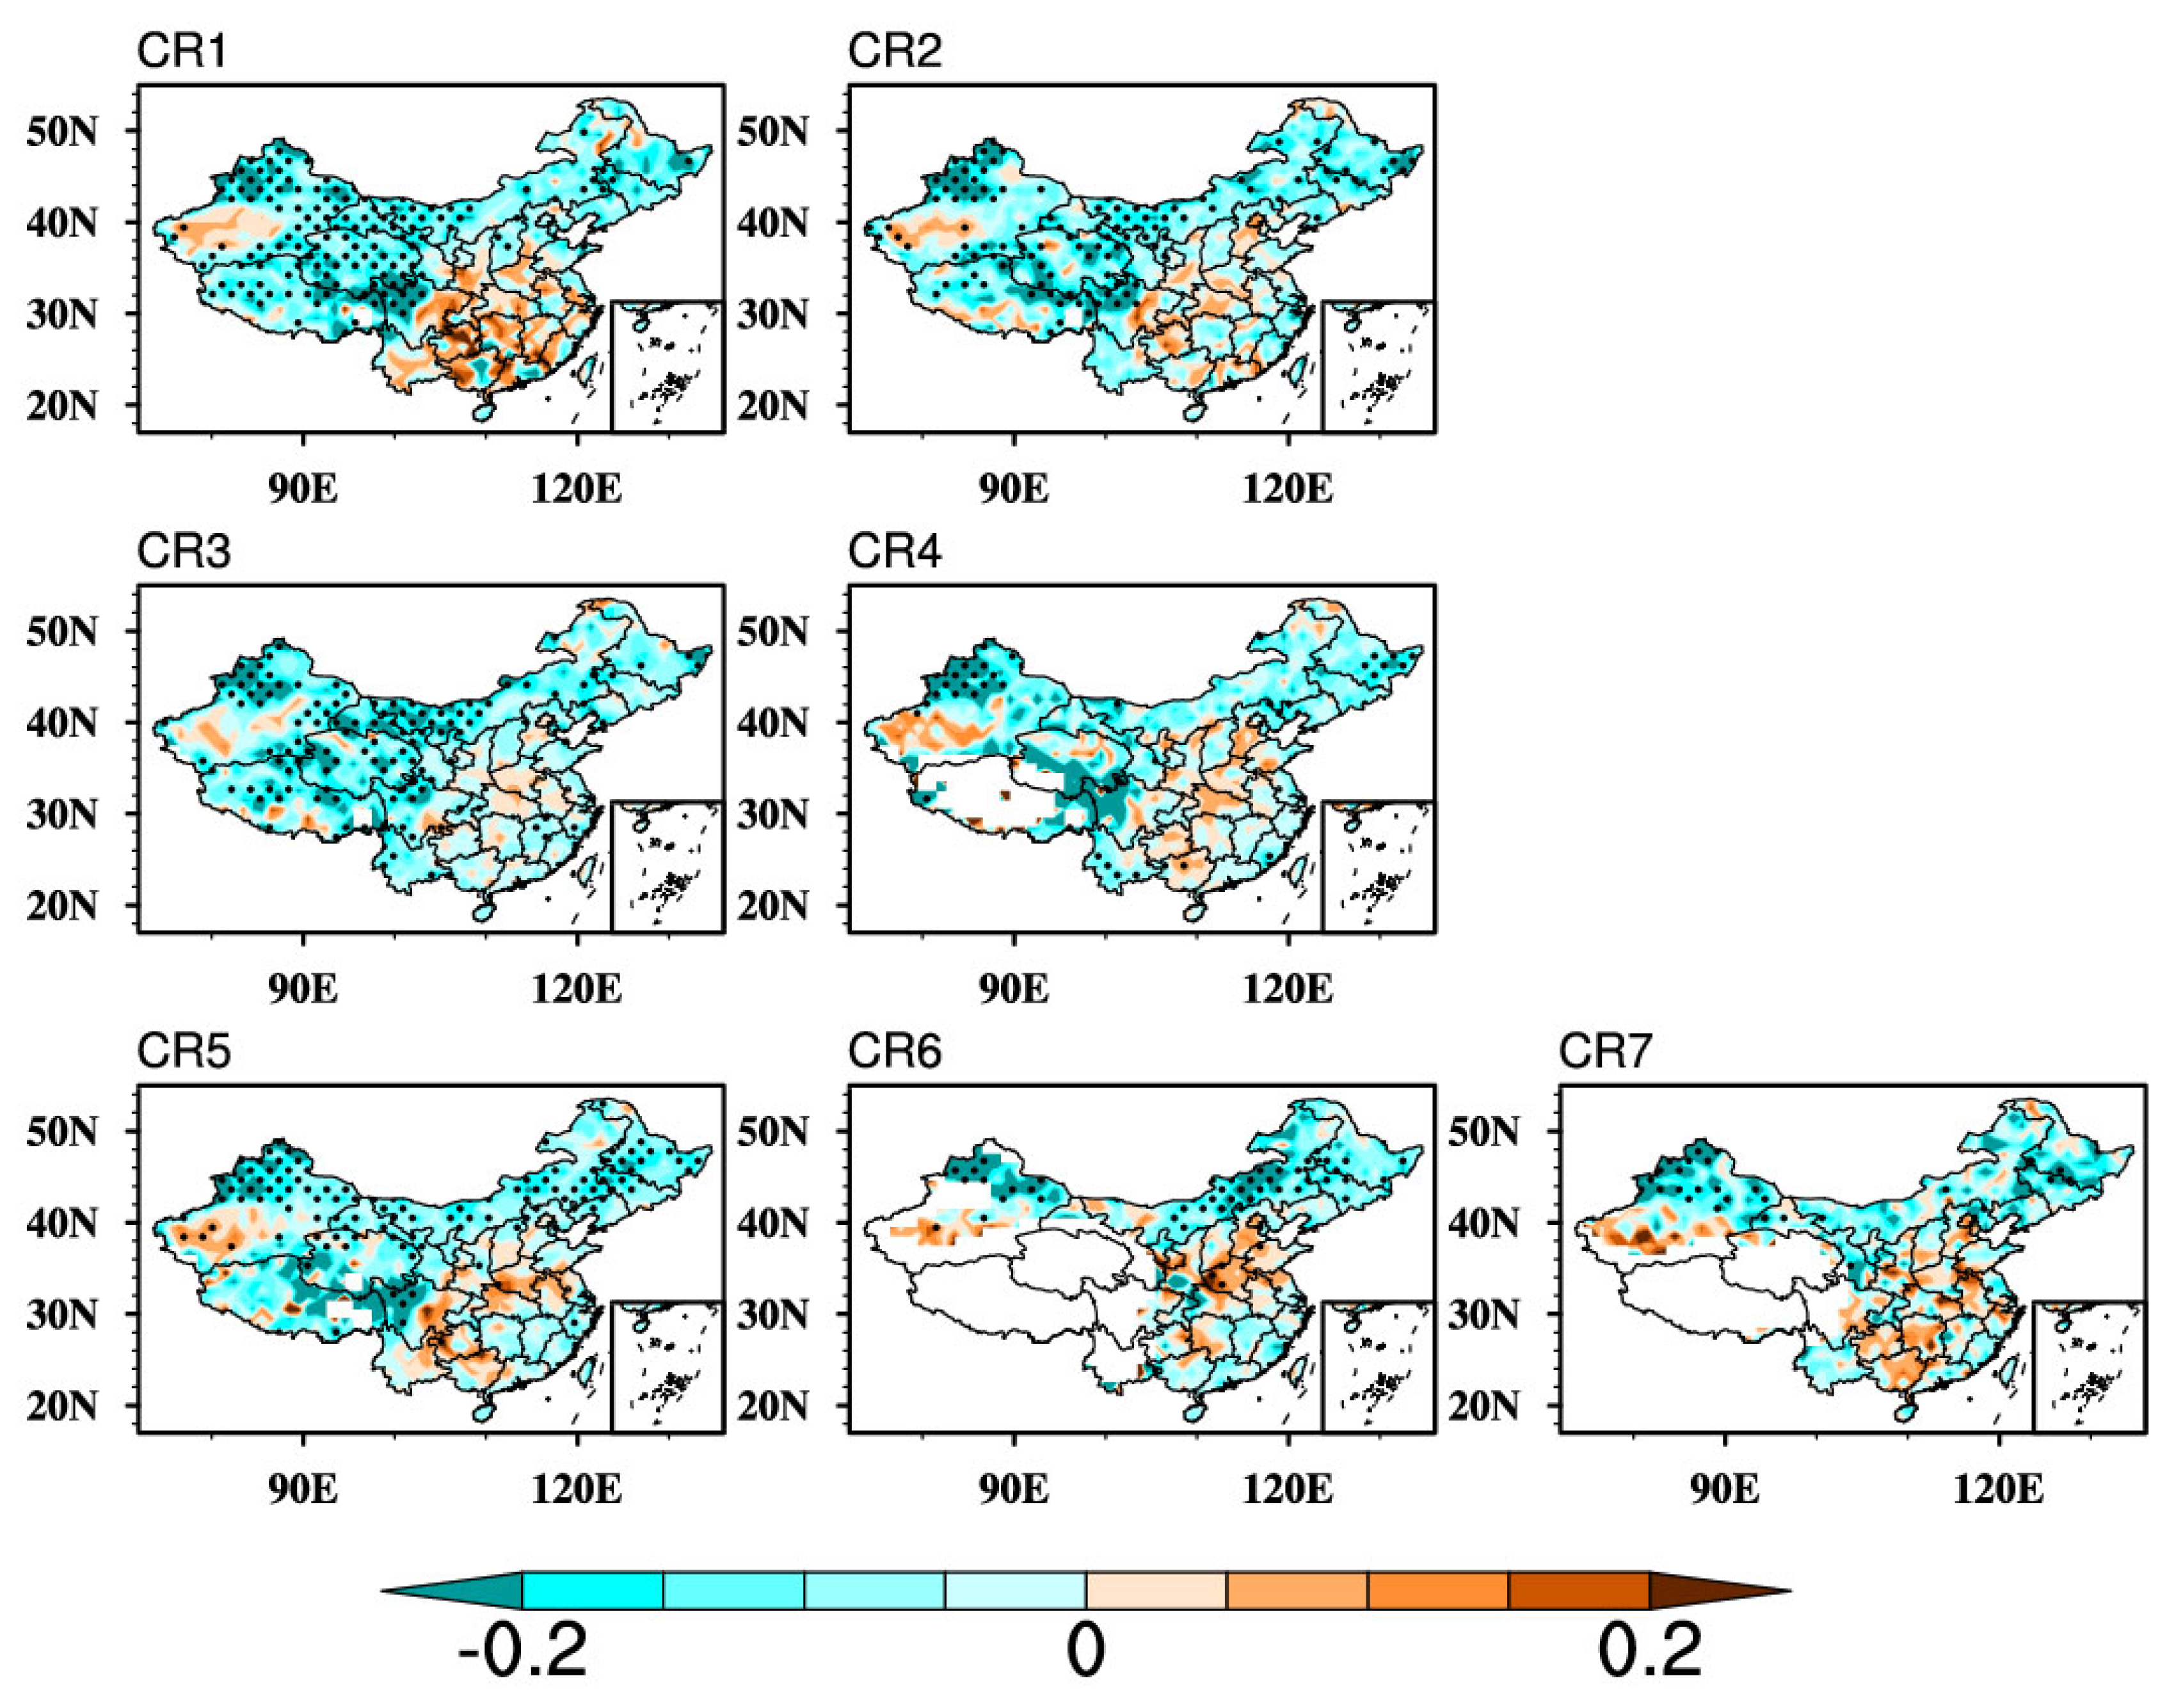
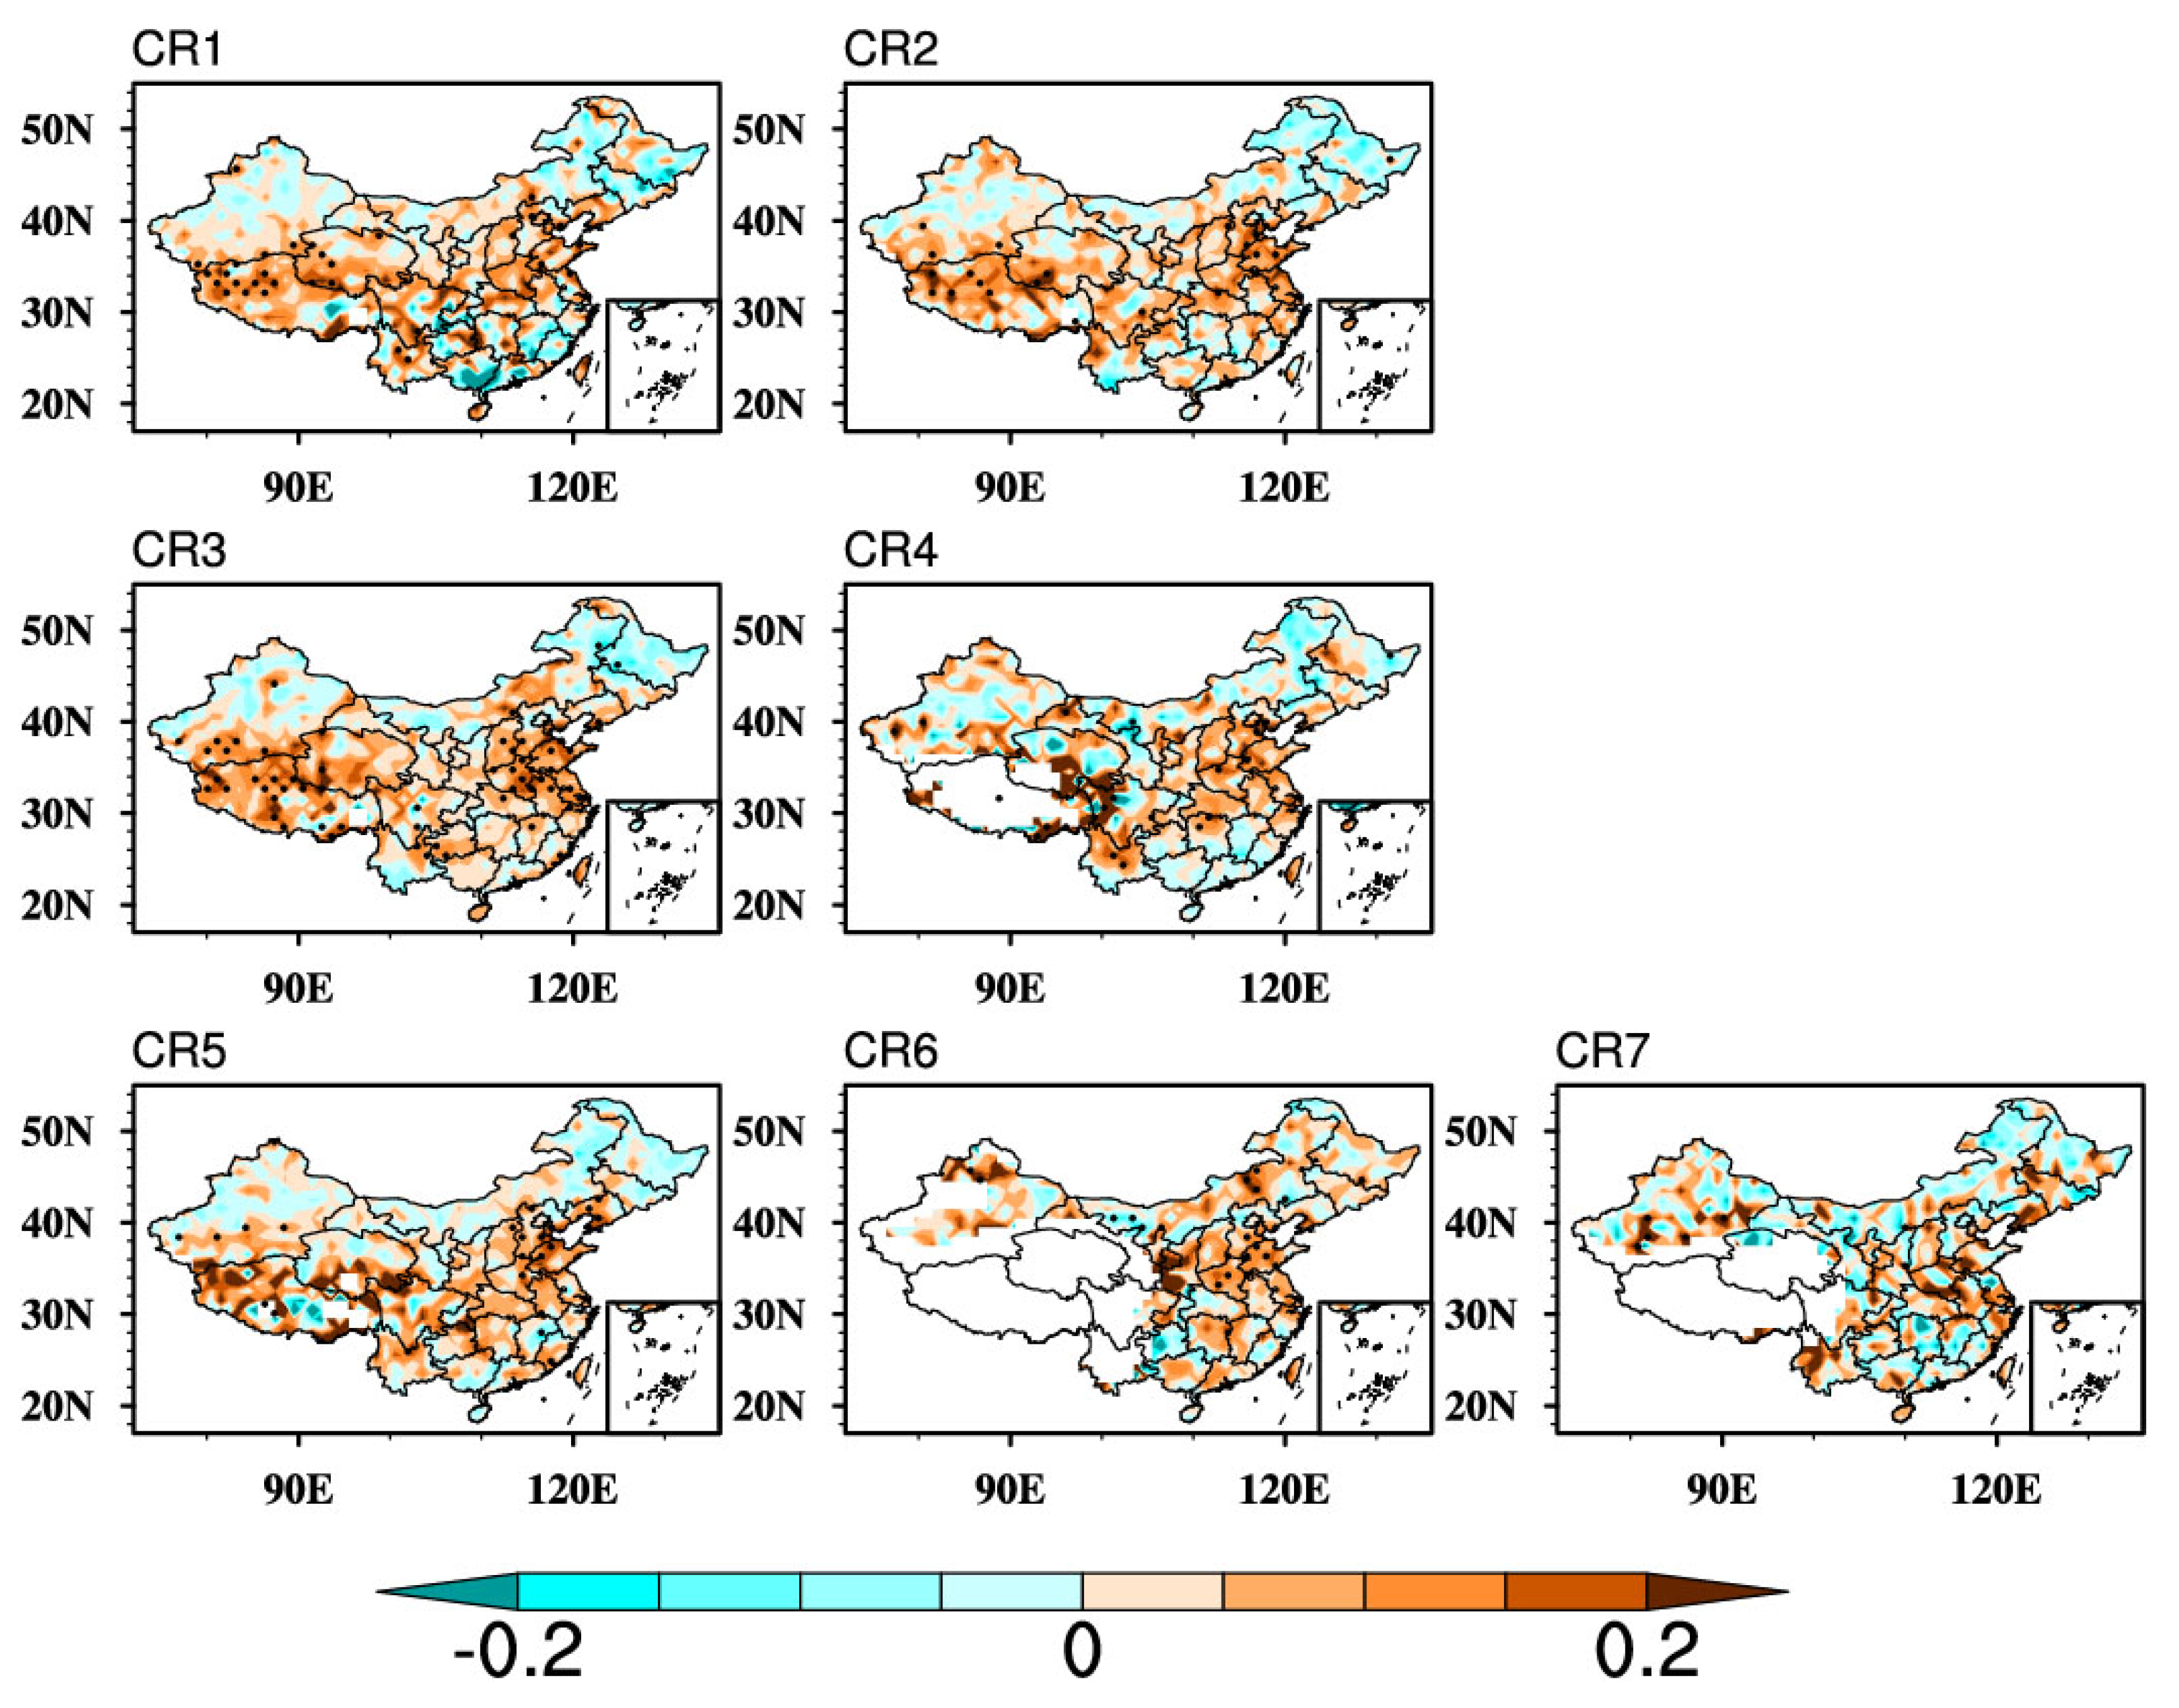
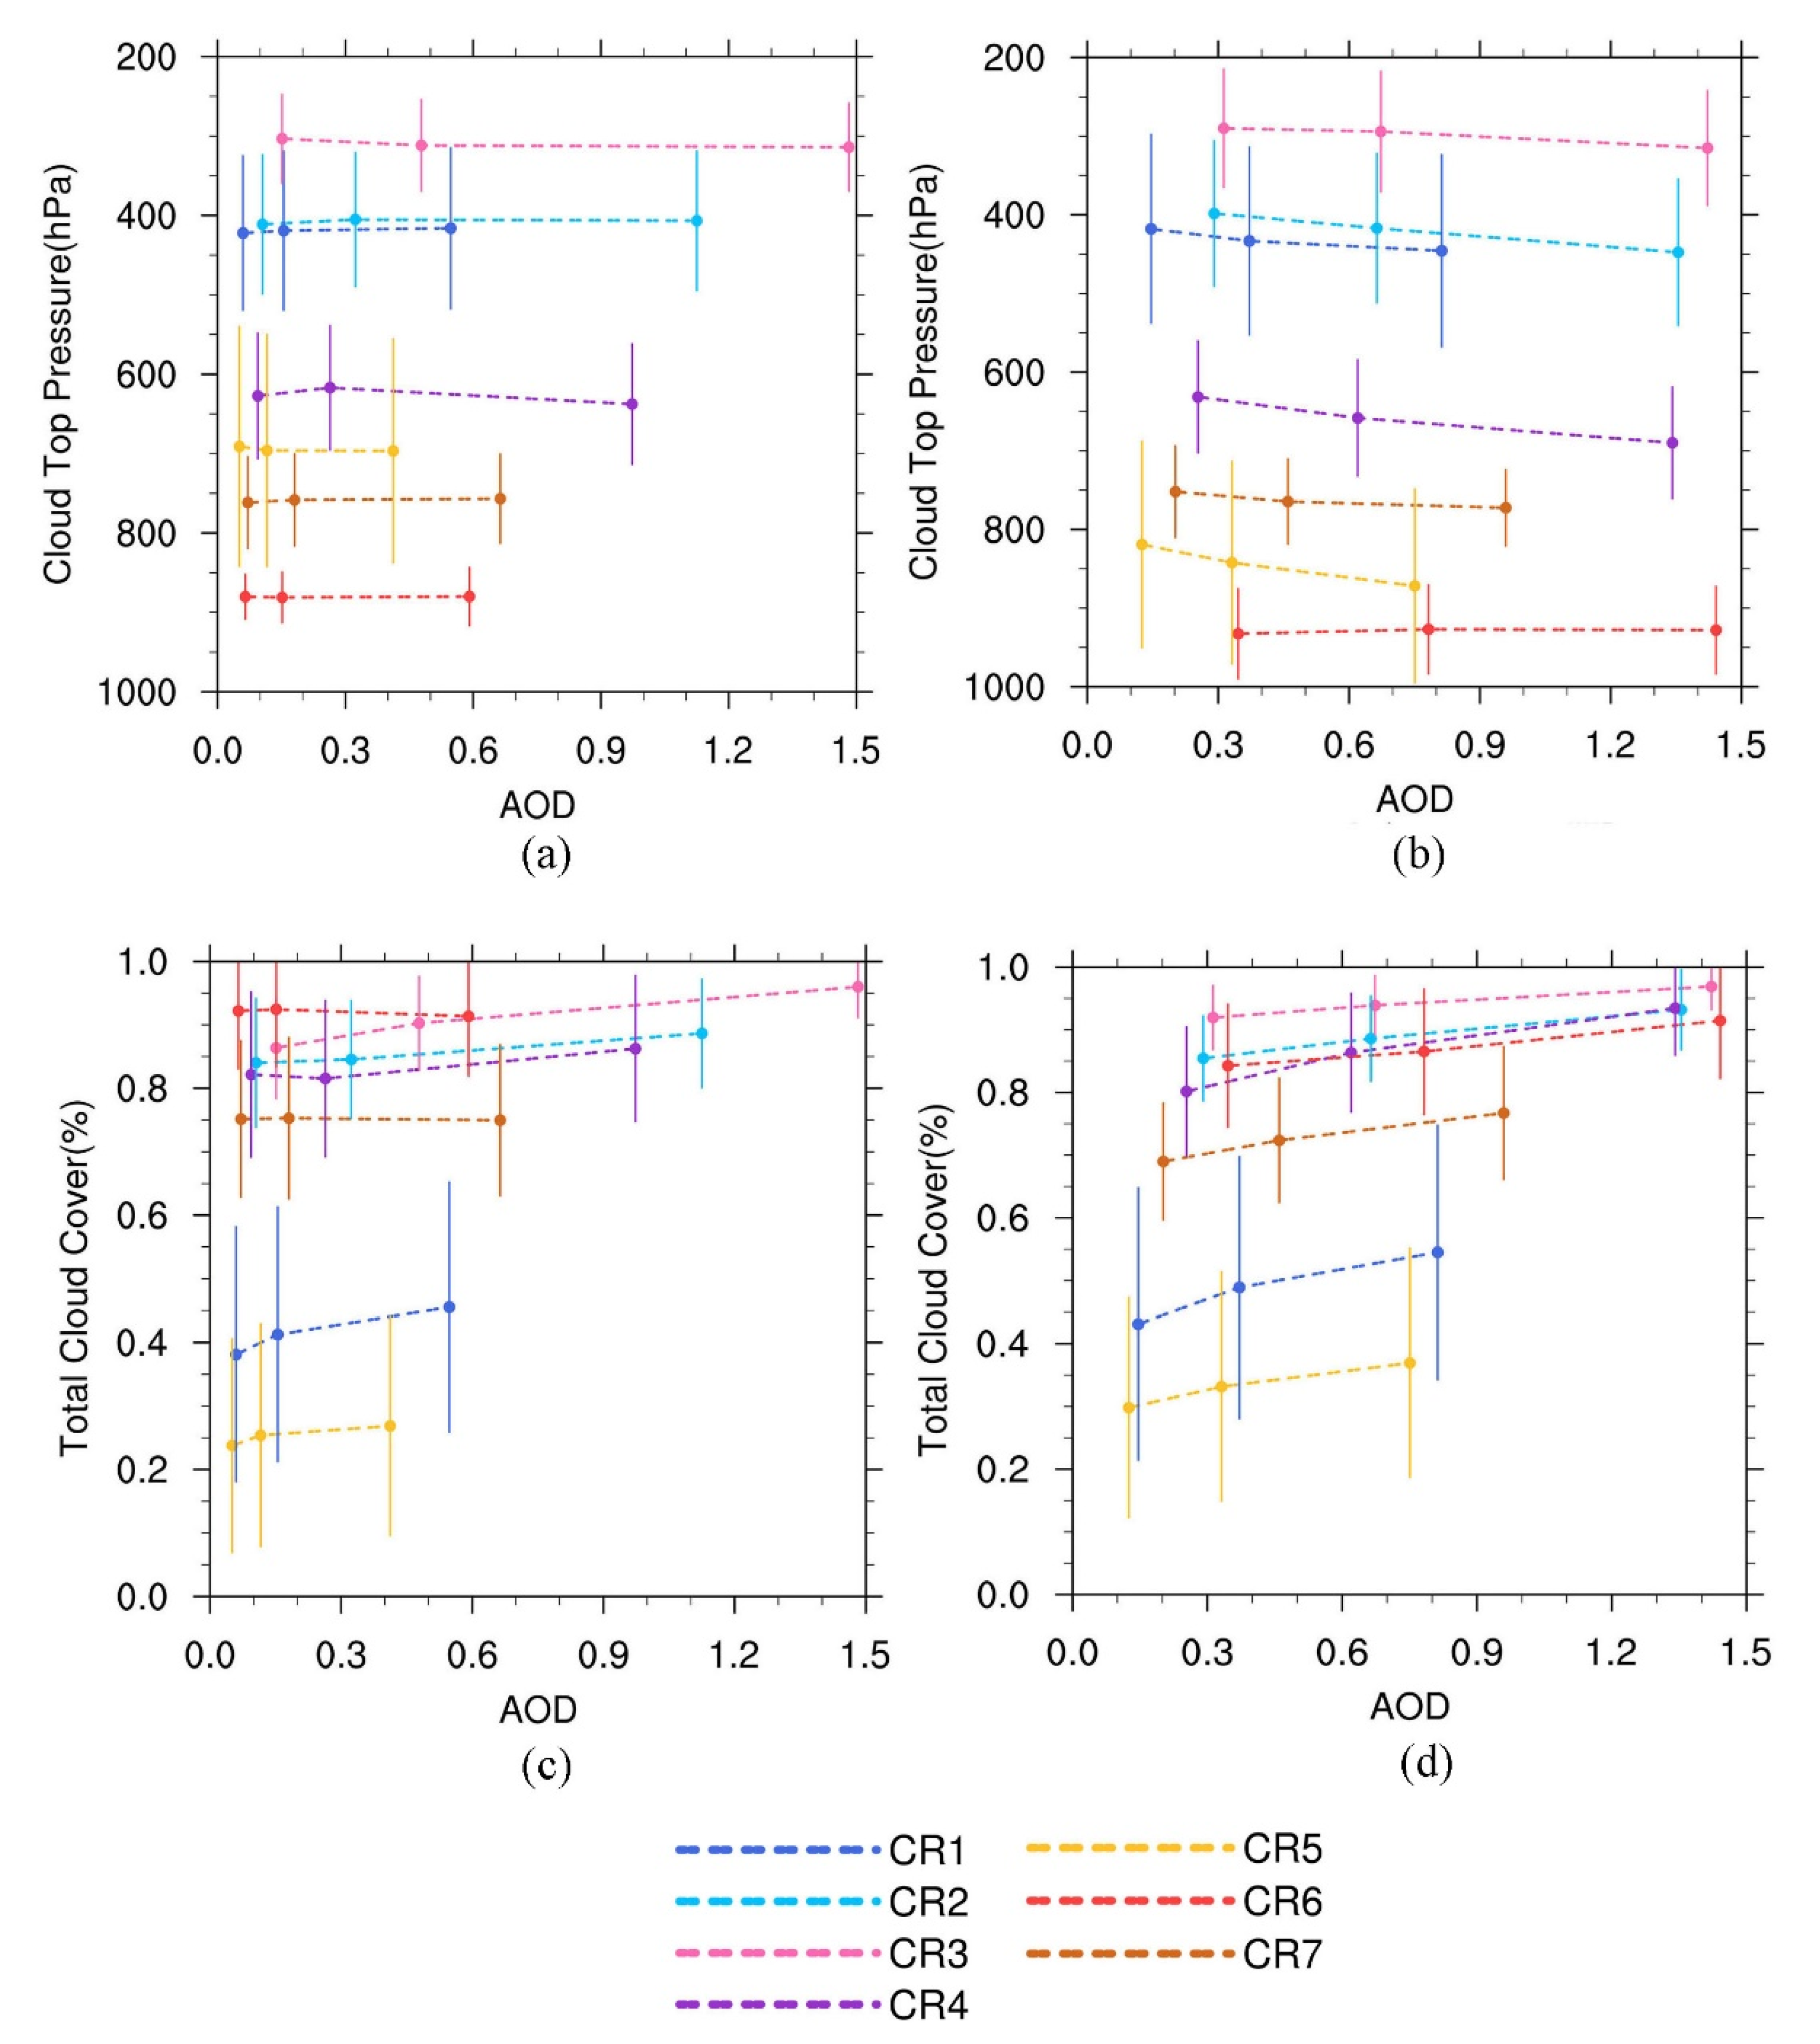
3.3. Apparent Relationship between AOD and Cloud Properties

There were significant negative correlations between AOD and CTP over most parts of China (Figure 5). This correlation has also been observed globally with many different cloud regimes [34,53,54]. For high clouds (CR1 and CR2), the significant negative correlation between AOD and CTP occurred in the arid and semiarid regions of northwestern China. Dust aerosols are the main components of aerosols in these regions. They heat the aerosol layer by absorbing solar radiation, leading to increased atmospheric instability and enhanced vertical motion [55]. Enhanced uplift flow leads to further development of cloud tops. For CR3, which is dominated by DCCs in the lower reach of the Yangtze River Basin and northwestern China, the strong negative correlation between AOD and CTP complies with the aerosol invigoration effect. However, there was no significant correlation over the middle and upper reaches of the Yangtze River Basin where DCCs prevail. For low-level clouds (CR5, CR6, and CR7), the negative relationship between the AOD and CTP agreed with the Albrecht effect, which indicates that aerosols suppress precipitation and promote the vertical development of clouds [56]. In some part of eastern China CTPs showed positive correlations with AOD, which contradicted the Albrecht effect or the invigoration effect. Similar relationships were also found on warm clouds over the Yangtze River Delta. However, most of the positive correlation did not pass the significant test.
Figure 6 indicates a positive correlation between AOD and COT over most parts of China for all cloud regimes. Under the influence of environmental humidity, the correlation was more significant near Bohai Bay. The positive correlations of high clouds (CR1 and CR2) were obvious over southern Xinjiang and the western Qinghai–Tibet Plateau. Some areas showed negative correlations, but the correlation coefficients did not pass the significance test at the 0.05 level.
Figure 7 shows the positive correlation between AOD and LWP, which is similar to the spatial distribution of the correlation between AOD and COT. The correlation coefficient was significantly positive in the vicinity of Bohai Bay but negative in some areas of northwestern China. This may be influenced by the type of aerosol and the RH [57]. It should be noted that the positive correlation may not reflect the non–linear relationship between AOD and LWP. Toll et al. [58] found that LWP showed both increases and decreases in all types of pollution track, which indicated that the responses of the LWP to aerosol–induced perturbations were more complex than the increase assumed from the suppression of rain. For CR1 and CR2, the negative correlation was significant in western Xinjiang. This result was consistent with previous findings that increased the evaporation of cloud water due to absorption of solar shortwave radiation by dust aerosols, resulting in reduced LWPs [55].
It is interesting to note that a clear positive correlation existed between AOD and TCC (Figure 8), which agreed with the Albrecht effect for low-level clouds (CR5, CR6, and CR7) and the invigoration effects for convective clouds (CR3). A positive correlation between the satellite–derived cloud fraction and aerosol loading have been noticed by many previous studies [59,60,61]. However, factors other than aerosol effects may also lead to a positive AOD–TCC relationship. These include AOD retrieval errors (e.g., cloud contamination [62]), 3-D light scattering by inhomogeneous clouds [63], covariation with meteorological variables (e.g., relative humidity, wind speed), and many others (see Grandey et al. [60] for a brief summary). An evaluation of the aerosol indirect effect on TCC needs to be carefully considered as given by examples in Grandey et al. [60]. We further discussed the covariation with meteorological variables in Section 3.4.
Due to the obvious relationships for AOD–CTP and AOD–TCC, we calculated the mean CTP and TCC for three equal sampling sized AOD subsets. The CTPs in the west (Figure 9a) and in the east (Figure 9b) decreased with the AOD for most cloud regimes. The TCC increased with AOD for all cloud regimes for both regions, especially in the east (Figure 9c,d). As Figure 9d shows, an increase in the TCC with AOD was evident in the east, especially for CR1 and CR5, for which the TCC was small (the mean TCC was 50% for CR1 and 29% for CR5). This obvious positive correlation between AOD and TCC has been seen in previous satellite retrievals [9]. Some studies have indicated that most of this strong correlation can be explained by aerosol humidification increasing the AOD in regions of high RH [64].
Table 2 shows the sensitivities of CTP and TCC to AOD for different regimes. The results presented are the means of all grid points that passed the significance test in the eastern and western region. The sensitivity of CTP to AOD (bCTP) was negative for all cloud regimes in both regions. The mean bCTP was −0.057 in the east and −0.074 in the west, indicating that the CTP of clouds in the west was more sensitive to the change in AOD. The calculated sensitivities were consistent with the variation of CTP with AOD (Figure 9a,b). The sensitivity of TCC to AOD (bTCC) was positive for all cloud regimes in the two regions. The mean bTCC was 0.77 in the east and 0.60 in the west, indicating that the TCC of clouds in the east was more sensitive to the change of AOD. The larger bTCC in the east may be affected by the larger relative humidity than that in the west.

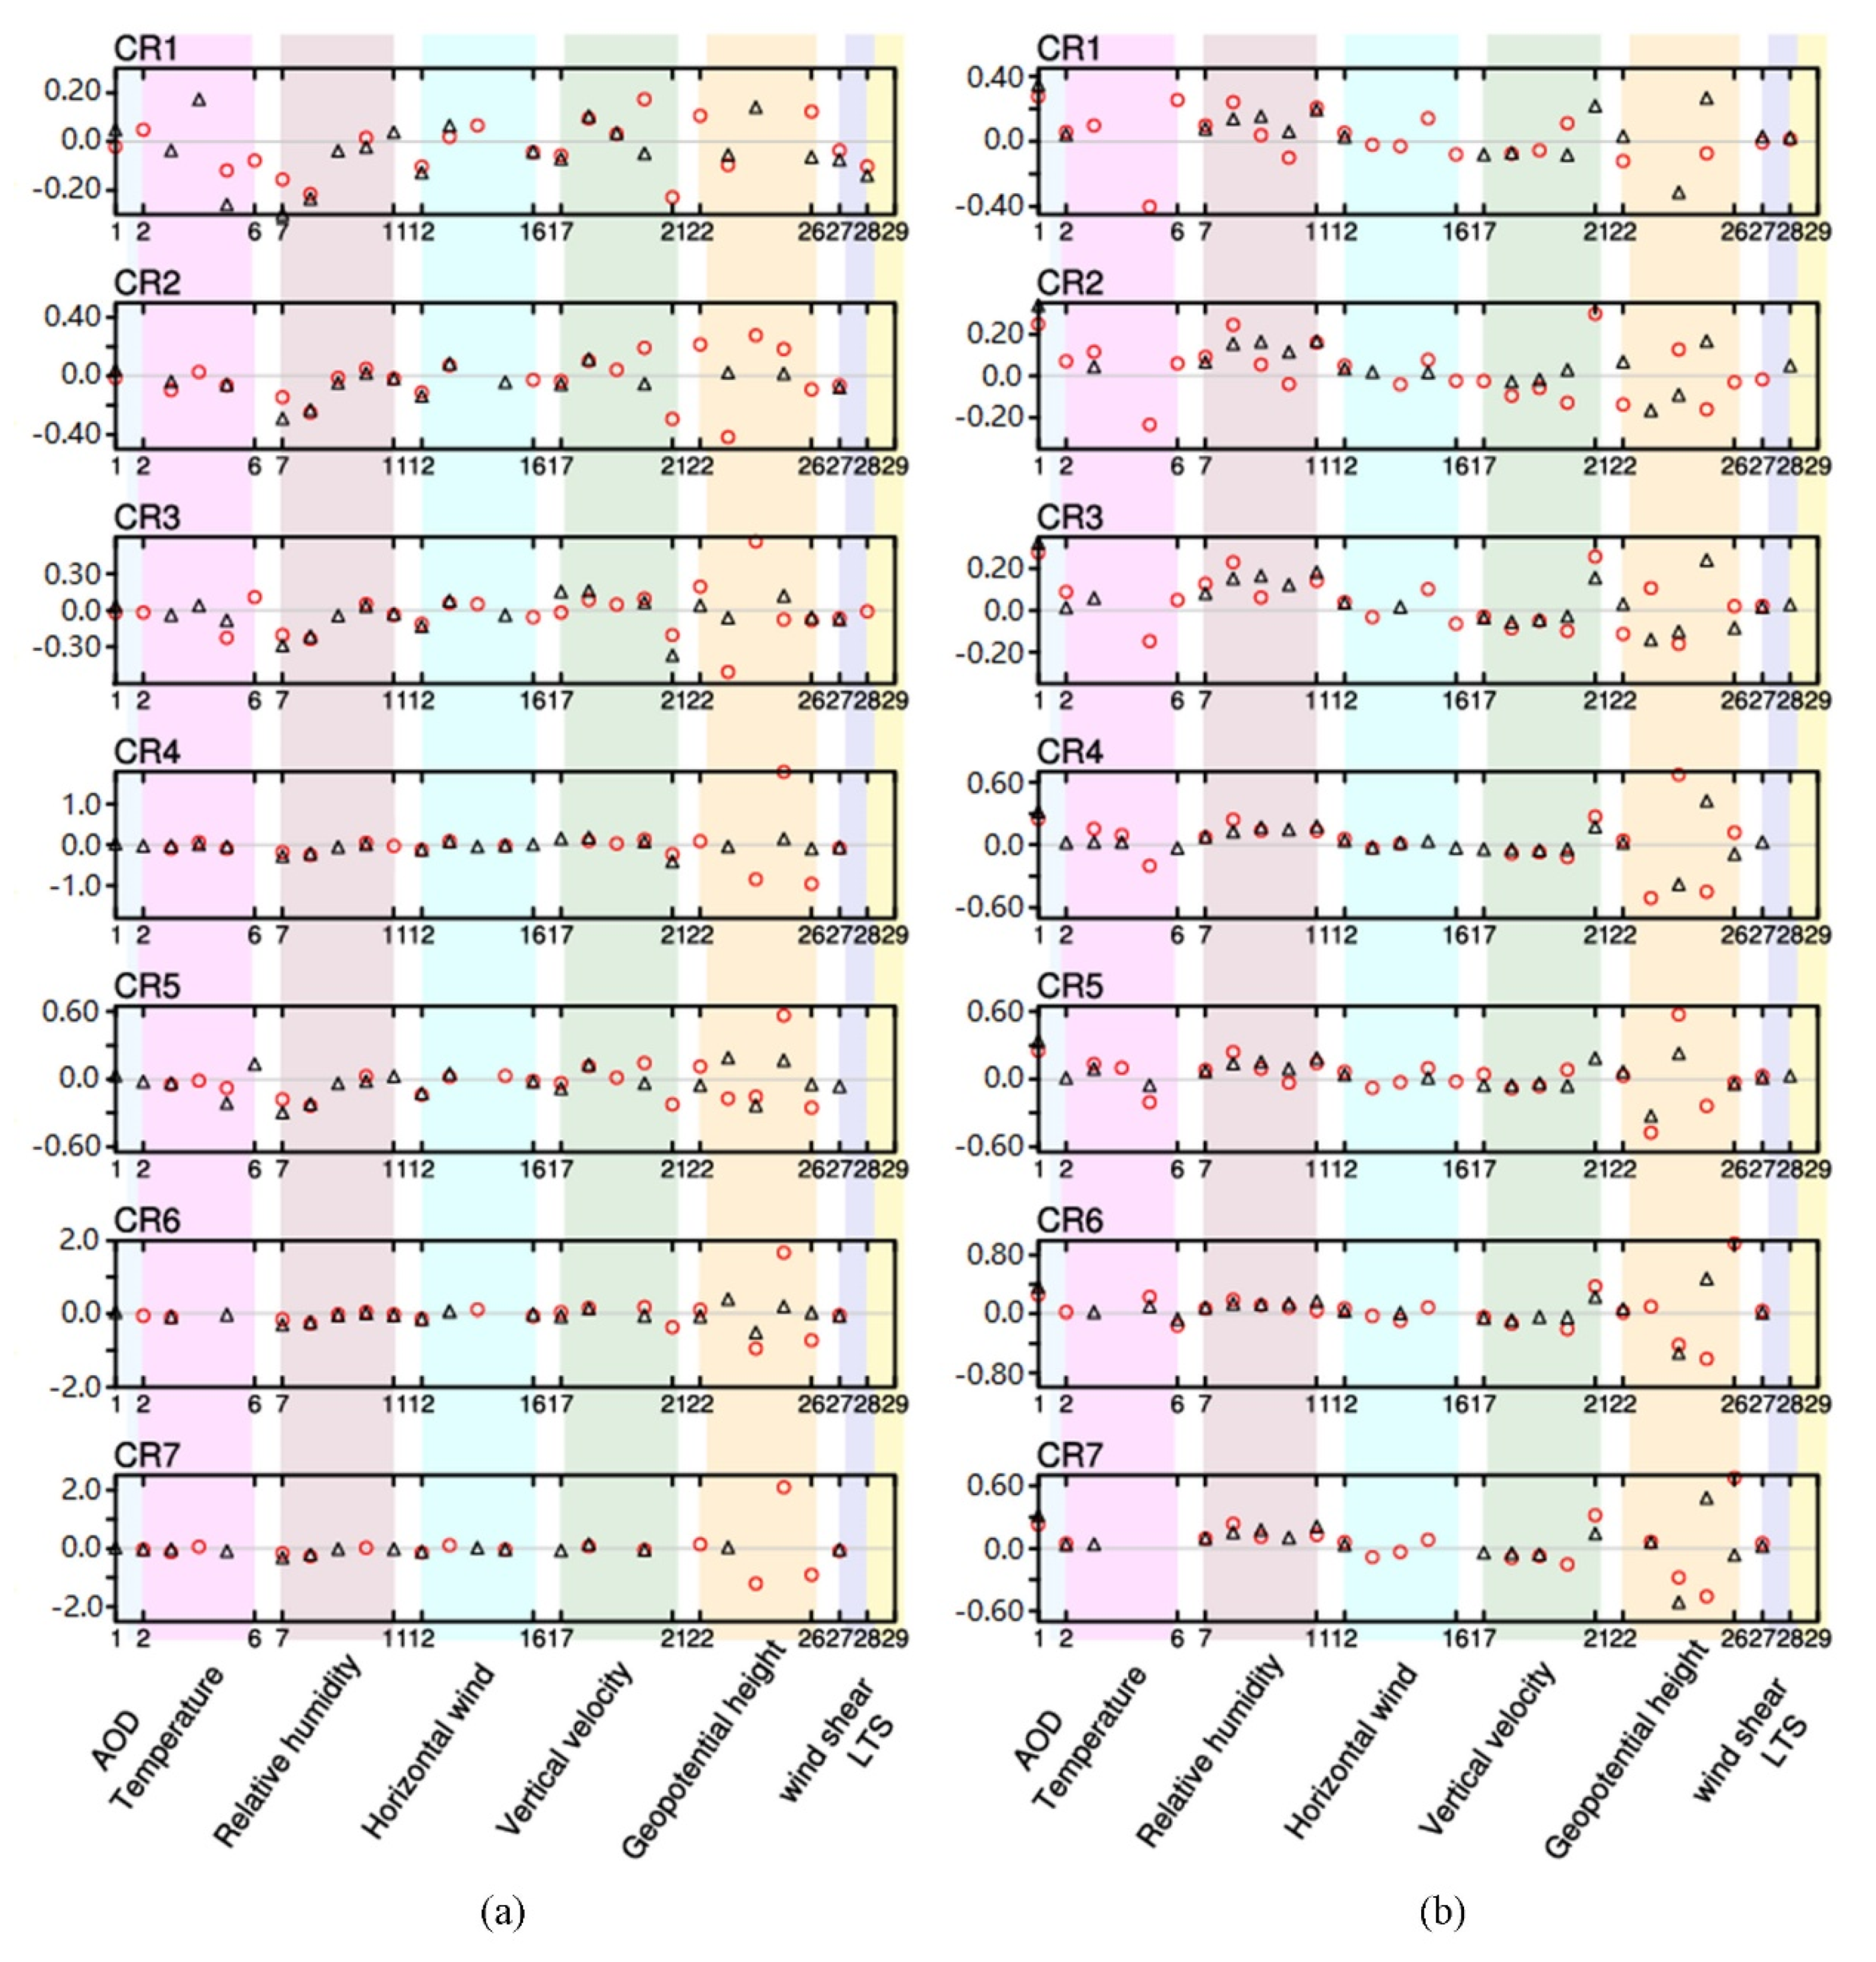
3.4. The Relative Contributions of Aerosol and Meteorological Variables to Cloud Variation

The apparent relationship between AOD and cloud properties may be the result of their covariation with meteorology [54,60,61]. We established a stepwise multivariable regression equation to explain the contribution of AOD and meteorological factors to the variation of cloud properties. The key meteorological factors that were investigated include temperature, RH, horizontal wind, vertical velocity, GPH, wind shear, and LTS. All meteorological factors were given at five pressure levels except for wind shear and LTS.
The contribution of AOD to CTP in the western region decreased after considering the meteorological factors compared with the linear regression coefficient (Table 3). The GPH and vertical velocity show remarkably high correlations with CTP for most cloud regimes in the west (Table 3 and Figure 10a). GPH at 850 hPa was positively correlated with CTPs and GPH at 1000 hPa showed negative correlation with CTP for mid− and low−level clouds (CR4-CR7, see discussion in Section 4). In the east, although the coefficient of AOD slightly increased compared with the linear regression coefficients, the meteorological factors are the major contributor. RH at 200 hPa showed a significant negative correlation with CTP in the east, which was consistent with previous studies [54]. In general, meteorological factors yielded a higher contribution to CTP than AOD in both regions.
The coefficient of AOD to TCC decreased after considering the meteorological factors (Table 3). The AOD was still among the main factors affecting TCC in both regions (Figure 10b). The influence of AOD on TCC was particularly significant in high− and mid−level clouds (CR1, CR2, and CR3). The standardized partial regression coefficient of AOD against TCC for CR1 for eastern China was 0.347. Among the meteorological variables, RH correlated well with TCC in the east. The standardized partial regression coefficients of RH (1000 hPa) against TCC for CR7 was 0.215. In western China, the GPH (700 hPa) and GPH (850 hPa) yielded the highest correlations with TCC for low−level clouds (CR6 and CR7).
The standardized partial regression of GPH at 1000 hPa and 850 hPa to CTPs showed opposite signs for mid- and low-level clouds (CR4−CR7) in the west (Figure 10a). The mechanism for GPH to affect CTPs can be understood by investigating the variation of vertical velocity with GPH at the corresponding pressure level.
The vertical velocity is an important dynamic condition to measure the vertical development of clouds. Here, the ERA5 values are averages over the 1° × 1° grid. A positive value indicates the grid is dominated by a downdraft and vice versa. Figure 11 shows the variation of GPH with w and their joint probability distribution functions (PDF). The vertical velocity is mostly positive since downdrafts occur over a wider area than updrafts. At 850 hPa, when w > 0 GPH increased with the strengthening of the downdraft that leads to the inhibition of the cloud top height. The result is that GPH was positively correlated with CTP at 850 hPa. In contrast, increased GPH at 1000 hPa is accompanied by strengthened updraft (or equivalently weakened downdraft) in the range of 0 < w < 0.6 near the surface, allowing cloud water to be transported to higher altitudes (i.e., lower CTP). Therefore, GPH is negatively correlated with CTP at 1000 hPa.

4. Conclusions

This study demonstrates the relationship between aerosol and clouds based on cloud regimes. Using the k-means clustering algorithm on satellite−retrieved CTP−COT histograms, we grouped 18 years (2002−2019) of MODIS Aqua cloud data over China into seven cloud regimes. The cloud regimes showed distinguished cloud properties (CTP, COT, TCC, and LWP) and spatial distributions. We attributed them to two high cloud regimes (mainly cirrostratus), two high and mid−level cloud regimes (mainly DCCs and altostratus), and three low cloud regimes (mainly stratocumulus) according to the ISCCP cloud type definition. Cirrostratus (CR1 and CR2) prevailed over the Tibetan Plateau and northern China. DCCs and altostratus (CR3 and CR4) occurred most frequently over the Yangtze River Basin, Sichuan Basin, Yungui Plateau, and eastern Tibetan Plateau. Stratocumulus (CR5, CR6 and CR7) prevailed in Inner Mongolia, northeastern and northwestern China.
Generally, MODIS-retrieved AOD showed decreasing trend in eastern China and increasing trend in western China from 2002 to 2019. During this period, the CTP decreased (higher clouds), the COT and LWP increased (thicker clouds), and the TCC decreased (fewer clouds) for the majority of the cloud regimes over China. However, diverse features of the cloud property trends were found for various cloud regimes, time periods, and geographical regions, manifesting the complexity of cloud evolution with time and space.
The apparent relationships between AOD and the cloud properties provide implications for the plausible aerosol−cloud interaction mechanisms in various cloud regimes. The high clouds (CR1 and CR2) showed negative relationships between AOD and CTP in arid and semiarid regions of northwestern China, which may be related to the instability due to atmospheric heating by dust aerosols. For DCCs and altostratus (CR3 and CR4), the positive correlation between AOD and COT, LWP and TCC comply with the aerosol invigoration effect. Boundary layer liquid clouds (CR5, CR6, and CR7) showed negative correlations between AOD and CTP and positive correlations between AOD and TCC, which were consistent with the Albrecht effect.
If meteorological variables were taken into account, the contribution of AOD to CTP decreased in the west and increased in the east compared with considering the impact of AOD alone. However, differences in the major factors that affected CTP variation existed in eastern and western China. Relative humidity was the main factor affecting CTP in eastern China, while dynamic factors (i.e., geopotential height and vertical velocity) were the key variables in the west. AOD was the key variable that affected TCC most, and its contribution tended to increase after adding meteorological conditions. Dynamic factors had a collaborative influence on TCC. The influence of near-surface relative humidity (1000 hPa) on TCC in the eastern China was not negligible.
This research highlights the discernable long-term impacts of aerosols on various cloud regimes over China. The results can be used as observational constraints for assessing the performance of global and regional climate models. It should be noted that passive remote sensing had difficulties to distinguish multilayer clouds from single layer clouds [65]. In addition, MODIS lacks nighttime cloud information and its temporal and spatial resolutions are relatively low. Satellite data with higher spatial and temporal resolutions should be used for similar analysis in the future. We did not analyze the correlation between cloud effective radius and AOD in this research because the Twomey effect has been widely studied over this region. As suggested by previous studies [30], the satellite−derived Twomey effect is contrary to that from surface retrievals and may be subject to uncertainties due to some inherent limitations.

Supplementary Materials

The following supporting information can be downloaded at: https://www.mdpi.com/article/10.3390/rs14163844/s1, Figure S1: The seasons with the maximum relative frequency of occurrence for CR1 to CR7.

Author Contributions

Conceptualization, T.F., C.Z. and X.Y.; Data curation, Y.L. and K.L.; Funding acquisition, C.Z.; Investigation, Y.L. and P.Z.; Methodology, Y.L., T.F., C.Z. and K.L.; Project administration, C.Z.; Software, Y.L.; Supervision, T.F. and C.Z.; Validation, X.Y. and K.L.; Visualization, Y.L.; Writing—original draft, Y.L.; Writing—review & editing, T.F. All authors have read and agreed to the published version of the manuscript.

Funding

This work is supported by the National Key Research and Development Program of China (Grant No. 2017YFC1501403). Tianyi Fan is supported by the National Natural Science Foundation of China (Grant No. 42030606, 41830966, 41705125).

Conflicts of Interest

The authors declare no conflict of interest.

Nomenclature

AcronymFull name
ACIsAerosol cloud interactions
AODAerosol optical depth
COTCloud optical thickness
CRsCloud regimes
CTPCloud top pressure
DCCsDeep convective clouds
ECMWFEuropean Center for Medium-Range Weather Forecasts
GPHGeopotentical height
ISCCP International Satellite Cloud Climatology Project
LTSLow tropospheric stability
LWPLiquid water path
MODISModerate-Resolution Imaging Spectroradiometer
RFORelative frequency of occurrences
RHRelative humidity
TCCTotal cloud cover
WVertical velocity

References

  1. Zhang, S.; Wang, M.; Ghan, S.J.; Ding, A.; Fu, C. On the characteristics of aerosol indirect effect based on dynamic regimes in global climate models. Atmos. Chem. Phys. 2016, 16, 23683–23729. [Google Scholar] [CrossRef] [Green Version]
  2. Li, Z.; Rosenfeld, D.; Fan, J. Aerosols and their Impact on Radiation, Clouds, Precipitation & Severe Weather Events. Oxf. Res. Encycl. Environ. Sci. 2017. [Google Scholar] [CrossRef] [Green Version]
  3. IPCC; Stocker, T.F.; Qin, D.; Plattner, G.K.; Midgley, P.M. The physical science basis. In Contribution of Working Group I to the Fifth Assessment Report of the Intergovernmental Panel on Climate Change; Cambridge University Press: Cambridge, UK; New York, NY, USA, 2013. [Google Scholar]
  4. Lohmann, U.; Feichter, J. Global indirect aerosol effects: A review. Atmos. Chem. Phys. 2005, 5, 715–737. [Google Scholar] [CrossRef] [Green Version]
  5. Rosenfeld, D.; Andreae, M.O.; Asmi, A.; Chin, M.; Quaas, J. Global observations of aerosol-cloud-precipitation-climate interactions. Rev. Geophys. 2014, 52, 750–808. [Google Scholar] [CrossRef] [Green Version]
  6. Fan, J.; Wang, Y.; Rosenfeld, D.; Liu, X. Review of Aerosol-Cloud Interactions: Mechanisms, Significance and Challenges. J. Atmos. Sci. 2016, 73, 4221–4252. [Google Scholar] [CrossRef]
  7. Twomey, S. Influence of Pollution on Shortwave Albedo of Clouds. J. Atmos. Sci. 1977, 34, 1149–1152. [Google Scholar] [CrossRef] [Green Version]
  8. Albrecht, B.A. Aerosols, cloud microphysics, and fractional cloudiness. Science 1989, 245, 1227–1230. [Google Scholar] [CrossRef] [PubMed]
  9. Borys, R.D.; Lowenthal, D.H.; Cohn, S.A.; Brown, W. Mountaintop and radar measurements of anthropogenic aerosol effects on snow growth and snowfall rate. Geophys. Res. Lett. 2003, 30, 41–45. [Google Scholar] [CrossRef]
  10. Ovchinnikov, M.; Korolev, A.; Fan, J. Effects of ice number concentration on dynamics of a shallow mixed-phase stratiform cloud. J. Geophys. Res. Atmos. 2011, 116, D00T06. [Google Scholar] [CrossRef] [Green Version]
  11. Lohmann, U. A glaciation indirect aerosol effect caused by soot aerosols. Geophys. Res. Lett. 2002, 29, 1052. [Google Scholar] [CrossRef]
  12. Garrett, T.J.; Maestas, M.M.; Krueger, S.K.; Schmidt, C.T. Acceleration by aerosol of a radiative-thermodynamic cloud feedback influencing Arctic surface warming. Geophys. Res. Lett. 2009, 36, 308. [Google Scholar] [CrossRef] [Green Version]
  13. Lance, S.; Shupe, M.; Feingold, G.; Brock, C.A.; Cozic, J.; Holloway, J.S.; Moore, R.H.; Nenes, A.; Schwarz, J.P.; Spackman, J.R. Cloud condensation nuclei as a modulator of ice processes in Arctic mixed-phase clouds. Atmos. Chem. Phys. 2011, 11, 8003–8015. [Google Scholar] [CrossRef] [Green Version]
  14. Garrett, T.J.; Zhao, C. Increased Arctic cloud longwave emissivity associated with pollution from mid-latitudes. Nature 2006, 440, 787–789. [Google Scholar] [CrossRef] [PubMed]
  15. Boer, G.D.; Feingold, G.; Harrington, J.; Shupe, M.; Morrison, H. Resilience of persistent Arctic mixed-phase clouds. Nat. Geosci. 2011, 5, 11–17. [Google Scholar]
  16. Rosenfeld, D.; Lohmann, U.; Raga, G.B.; O’Dowd, C.D.; Kulmala, M.; Fuzzi, S.; Reissell, A.; Andreae, M.O. Flood or Drought: How Do Aerosols Affect Precipitation? Science 2008, 321, 1309–1313. [Google Scholar] [CrossRef] [Green Version]
  17. Yuan, T.; Li, Z. General Macro- and Microphysical Properties of Deep Convective Clouds as Observed by MODIS. J. Clim. 2010, 23, 3457–3473. [Google Scholar] [CrossRef] [Green Version]
  18. Fan, J.; Rosenfeld, D.; Ding, Y.; Leung, L.R.; Li, Z. Potential aerosol indirect effects on atmospheric circulation and radiative forcing through deep convection. Geophys. Res. Lett. 2012, 39, L09806. [Google Scholar] [CrossRef]
  19. Guo, J.; Deng, M.; Lee, S.S.; Wang, F.; Li, Z.; Zhai, P.; Liu, H.; Lv, W.; Yao, W.; Li, X. Delaying precipitation and lightning by air pollution over the Pearl River Delta. Part I: Observational analyses. J. Geophys. Res. Atmos. 2016, 121, 6472–6488. [Google Scholar] [CrossRef]
  20. Li, Z.; Wang, Y.; Guo, J.; Zhao, C.; Cribb, M.C.; Dong, X.; Fan, J.; Gong, D.; Huang, J.; Jiang, M.; et al. East Asian Study of Tropospheric Aerosols and their Impact on Regional Clouds, Precipitation, and Climate (EAST-AIRCPC). J. Geophys. Res. Atmos. 2019, 124, 13026–13054. [Google Scholar] [CrossRef] [Green Version]
  21. Fan, J.; Rosenfeld, D.; Yang, Y.; Zhao, C.; Leung, L.R.; Li, Z. Substantial contribution of anthropogenic air pollution to catastrophic floods in Southwest China. Geophys. Res. Lett. 2015, 42, 6066–6075. [Google Scholar] [CrossRef]
  22. Niu, F.; Li, Z. Systematic variations of cloud top temperature and precipitation rate with aerosols over the global tropics. Atmos. Chem. Phys. 2012, 12, 8491–8498. [Google Scholar] [CrossRef] [Green Version]
  23. Qian, Y.; Gong, D.; Fan, J.; Leung, L.R.; Bennartz, R.; Chen, D.; Wang, W. Heavy pollution suppresses light rain in China: Observations and modeling. J. Geophys. Res. 2009, 114, D00K02. [Google Scholar] [CrossRef]
  24. Li, Z.; Lau, W.; Ramanathan, V.; Wu, G.; Ding, Y.; Manoj, M.; Liu, J.; Qian, Y.; Li, J.; Zhou, T. Aerosol and monsoon climate interactions over Asia. Rev. Geophys. 2016, 54, 866–929. [Google Scholar] [CrossRef]
  25. Yang, X.; Zhao, C.; Zhou, L.; Wang, Y.; Liu, X. Distinct impact of different types of aerosols on surface solar radiation in China. J. Geophys. Res. Atmos. 2016, 121, 6459–6471. [Google Scholar] [CrossRef]
  26. Liu, Y.; de Leeuw, G.; Kerminen, V.M.; Zhang, J.; Zhou, P.; Nie, W.; Qi, X.; Hong, J.; Wang, Y.; Ding, A.; et al. Analysis of aerosol effects on warm clouds over the Yangtze River Delta from multi-sensor satellite observations. Atmos. Chem. Phys. 2017, 17, 5623–5641. [Google Scholar] [CrossRef]
  27. Tang, J.; Wang, P.; Mickley, L.J.; Xia, X.; Liao, H.; Yue, X.; Sun, L.; Xia, J. Positive relationship between liquid cloud droplet effective radius and aerosol optical depth over Eastern China from satellite data. Atmos. Environ. 2014, 84, 244–253. [Google Scholar] [CrossRef]
  28. Fu, W.; Guo, J.; Wu, Y.; Zhang, X.; Deng, M.; Li, X.; Zhang, J.; Jing, Z. Satellite observed aerosol-induced variability in warm cloud properties under different meteorological conditions over eastern China. Atmos. Environ. 2014, 84, 122–132. [Google Scholar]
  29. Wang, F.; Guo, J.; Zhang, J.; Huang, J.; Min, M.; Chen, T.; Liu, H.; Deng, M.; Li, X. Multi-sensor quantification of aerosol-induced variability in warm clouds over eastern China. Atmos. Environ. 2015, 113, 1–9. [Google Scholar] [CrossRef]
  30. Liu, J.; Li, Z. First Surface-based Estimation of the Aerosol Indirect Effect over a Site in Southeastern China. Adv. Atmos. Sci. 2018, 35, 169–181. [Google Scholar] [CrossRef]
  31. Chen, T.; Guo, J.; Li, Z.; Zhao, C.; He, J. A CloudSat Perspective on the Cloud Climatology and Its Association with Aerosol Perturbations in the Vertical over Eastern China. J. Atmos. Sci. 2016, 73, 3599–3616. [Google Scholar] [CrossRef]
  32. Yan, H.; Wang, T. Ten Years of Aerosol Effects on Single-Layer Overcast Clouds over the US Southern Great Plains and the China Loess Plateau. Adv. Meteorol. 2020, 73, 1–15. [Google Scholar] [CrossRef]
  33. Stevens, B.; Feingold, G. Untangling aerosol effects on clouds and precipitation in a buffered system. Nature 2009, 461, 607–613. [Google Scholar] [CrossRef] [PubMed]
  34. Gryspeerdt, E.; Stier, P.; Grandey, B.S. Cloud fraction mediates the aerosol optical depth-cloud top height relationship. Geophys. Res. Lett. 2014, 41, 3622–3627. [Google Scholar] [CrossRef]
  35. Gryspeerdt, E.G.; Stier, P.; Partridge, D.G. Satellite observations of cloud regime development: The role of aerosol processes. Atmos. Chem. Phys. 2014, 14, 1141–1158. [Google Scholar] [CrossRef] [Green Version]
  36. Oreopoulos, L.; Cho, N.; Lee, D. A Global Survey of Apparent Aerosol-Cloud Interaction Signals. J. Geophys. Res. Atmos. 2020, 125, e2019JD031287. [Google Scholar] [CrossRef]
  37. Leinonen, J.; Lebsock, M.D.; Oreopoulos, L.; Cho, N. Interregional differences in MODIS-derived cloud regimes. J. Geophys. Res. Atmos. 2016, 121, 648–665. [Google Scholar] [CrossRef]
  38. Oreopoulos, L.; Cho, N.; Lee, D.; Kato, S.; Huffman, G.J. An examination of the nature of global MODIS cloud regimes. J. Geophys. Res. Atmos. 2014, 119, 8362–8383. [Google Scholar] [CrossRef] [Green Version]
  39. Saide, P.E.; Kim, J.; Song, C.H.; Choi, M.; Cheng, Y.; Carmichael, G.R. Assimilation of next generation geostationary aerosol optical depth retrievals to improve air quality simulations. Geophys. Res. Lett. 2015, 41, 9188–9196. [Google Scholar] [CrossRef]
  40. Fan, J.; Yuan, T.; Comstock, J.M.; Ghan, S.; Khain, A.; Leung, L.R.; Li, Z.; Martins, V.J.; Ovchinnikov, M. Dominant role by vertical wind shear in regulating aerosol effects on deep convective clouds. J. Geophys. Res. 2009, 114, D22206. [Google Scholar] [CrossRef]
  41. Anderberg, M.R. Cluster Analysis for Applications: Probability & Mathematical Statistics; Academic Press: New York, NY, USA, 1973; pp. 347–353. [Google Scholar]
  42. Rossow, W.B.; Tselioudis, G.; Polak, A.; Jakob, C. Tropical climate described as a distribution of weather states indicated by distinct mesoscale cloud property mixtures. Geophys. Res. Lett. 2005, 32, L21812. [Google Scholar] [CrossRef] [Green Version]
  43. Oreopoulos, L.; Cho, N.; Lee, D.; Kato, S. Radiative effects of global MODIS cloud regimes. J. Geophys. Res. Atmos. 2016, 121, 2299–2317. [Google Scholar] [CrossRef] [PubMed]
  44. Williams, K.D.; Webb, M.J. A quantitative performance assessment of cloud regimes in climate models. Clim. Dynam. 2008, 33, 141–157. [Google Scholar] [CrossRef]
  45. Gryspeerdt, E.; Stier, P. Regime-based analysis of aerosol-cloud interactions. Geophys. Res. Lett. 2012, 39, L21802. [Google Scholar] [CrossRef]
  46. Feingold, G.; Eberhard, W.L.; Veron, D.E.; Previdi, M. First measurements of the Twomey indirect effect using ground-based remote sensors. Geophys. Res. Lett. 2003, 30, 1287. [Google Scholar] [CrossRef] [Green Version]
  47. Roscow, W.B.; Schiffer, R.A. Advances in understanding clouds from ISCCP. Bull. Am. Meteorol. Soc. 1999, 80, 2261–2288. [Google Scholar] [CrossRef] [Green Version]
  48. Yang, B.; Xiaojing, W.U.; Guo, Z. The Characteristics of Cloud Properties in Deep Convective Clouds across China with the Cloud Sat Dataset. Plateau Meteorol. 2017, 36, 1655–1664. [Google Scholar] [CrossRef]
  49. Fan, T.; Liu, X.; Wu, C.; Zhang, Q.; Zhao, C.; Yang, X.; Li, Y. Comparison of the anthropogenic emission inventory for CMIP6 models with a country-level inventory over China and the simulations of the aerosol properties. Adv. Atmos. Sci. 2022, 39, 80–96. [Google Scholar] [CrossRef]
  50. Liu, X.; Mao, J. Statistical Relation Research between Cloud Liquid Water Content and Cloud Optical Thickness from Multiple Observations. Acta Entiarum Nat. Univ. Pekin. 2008, 44, 115. [Google Scholar] [CrossRef]
  51. Chuanbo, F.U.; Dan, L.; Feng, J.; Peng, J.; Ying, N. Temporal and Spatial Variations of Total Cloud Amount and Their Possible Relationships with Temperature and Water Vapor over China during 1960 to 2012. Chin. J. Atmos. Sci. 2019, 43, 87–98. [Google Scholar]
  52. Shi, R.; Wang, T.; Shu, L.I.; Zhuang, B.; Jiang, Z.; Liao, J.; Yin, C. The Spatial and Temporal Characteristics of Aerosol-Cloud-Precipitation Interactions during Summer in East Asia. Chin. J. Atmos. Sci. 2015, 39, 12–22. [Google Scholar]
  53. Koren, I.; Kaufman, Y.J.; Rosenfeld, D.; Remer, L.A.; Rudich, Y. Aerosol invigoration and restructuring of Atlantic convective clouds. Geophys. Res. Lett. 2005, 32, L14828. [Google Scholar] [CrossRef] [Green Version]
  54. Koren, I.; Feingold, G.; Remer, L.A. The invigoration of deep convective clouds over the Atlantic: Aerosol effect, meteorology or retrieval artifact? Atmos. Chem. Phys. 2010, 10, 8855–8872. [Google Scholar] [CrossRef] [Green Version]
  55. Huang, J.; Minnis, P.; Lin, B.; Wang, T.; Yi, Y.; Hu, Y.; Sunmack, S.; Ayers, K. Possible influences of Asian dust aerosols on cloud properties and radiative forcing observed from MODIS and CERES. Geophys. Res. Lett. 2006, 33, L06824. [Google Scholar] [CrossRef] [Green Version]
  56. Pincus, R.; Baker, M.B. Effect of precipitation on the albedo susceptibility of clouds in the marine boundary layer. Nature 1994, 372, 250–252. [Google Scholar] [CrossRef]
  57. Kang, F. A Numerical Study of Effects of Mineral Dust Particles on Cloud and Precipitation in the Northwest China. Meteorol. Mon. 2009. [Google Scholar] [CrossRef]
  58. Toll, V.; Christensen, M.; Quaas, J.; Bellouin, N. Weak average liquid-cloud-water response to anthropogenic aerosols. Nature 2019, 572, 51–55. [Google Scholar] [CrossRef]
  59. Quaas, J.; Ming, Y.; Menon, S.; Takemura, T.; Wang, M.; Penner, J.E.; Gettelman, A.; Lohmann, U.; Bellouin, N.; Boucher, O.; et al. Aerosol indirect effects—General circulation model intercomparison and evaluation with satellite data. Atmos. Chem. Phys. 2009, 9, 8697–8717. [Google Scholar] [CrossRef] [Green Version]
  60. Grandey, B.S.; Stier, P.; Wagner, T.M. Investigating relationships between aerosol optical depth and cloud fraction using satellite, aerosol reanalysis and general circulation model data. Atmos. Chem. Phys. 2013, 13, 3177–3184. [Google Scholar] [CrossRef] [Green Version]
  61. Engström, A.; Ekman, A. Impact of meteorological factors on the correlation between aerosol optical depth and cloud fraction. Geophys. Res. Lett. 2010, 37, L18814. [Google Scholar] [CrossRef]
  62. Huang, J.; Hsu, C.; Tsay, S.; Jeong, M.; Holben, B.N.; Berkoff, T.A.; Welton, E.J. Susceptibility of aerosol optical thickness retrievals to thin cirrus contamination during the BASE-ASIA campaign. J. Geophys. Res. Atmos. 2011, 116, D08214. [Google Scholar] [CrossRef]
  63. Várnai, T.; Marshak, A. MODIS observations of enhanced clear sky reflectance near clouds. Geophys. Res. Lett. 2009, 36, L06807. [Google Scholar] [CrossRef]
  64. Quaas, J.; Stevens, B.; Stier, P.; Lohmann, U. Interpreting the cloud cover–Aerosol optical depth relationship found in satellite data using a general circulation model. Atmos. Chem. Phys. 2010, 10, 6129–6135. [Google Scholar] [CrossRef] [Green Version]
  65. L’Ecuyer, T.S.; Hang, Y.; Matus, A.V.; Wang, Z. Reassessing the Effect of Cloud Type on Earth’s Energy Balance in the Age of Active Spaceborne Observations. Part I: Top of Atmosphere and Surface. J. Clim. 2019, 32, 6197–6217. [Google Scholar] [CrossRef] [Green Version]
Figure 1. The cloud regime centroids derive from k-means analysis on the combined cloud optical thickness (COT)-cloud top pressure (CTP) histograms of the MODIS Aqua Level 3 daily gridded data. Shading indicates the Probability Density Function (PDF) of joint histograms.
Remotesensing 14 03844 g001
Figure 2. The spatial distribution of the relative frequency of occurrence (RFO) for CR1-CR7. The RFO in each 1° × 1° grid for a cloud regime is calculated by dividing the pixel counts of successful retrieval in the regime by the total pixel counts of all regimes. The total RFOs of the regimes are also given in the subtitles of each panel, which are obtained by dividing the pixel counts of all grids over China that belongs to the regime by the total pixel counts of all grids.
Remotesensing 14 03844 g002
Figure 3. The trend of aerosol optical depth (AOD) over time periods of (a) 2002–2006, (b) 2007–2013, (c) 2014–2019, (d) 2002–2019. The dots indicate grids where that the linear trends are significant at the level of 0.05.
Remotesensing 14 03844 g003
Figure 4. The trend of cloud properties for each regime in western and eastern China. (a) CTP, unit: hPa/18 years, (b) COT, unit:/18 years, (c) LWP, unit: g/(m2∙18 years), and (d) TCC, unit: %/18 years. Asterisks indicate that the linear regression coefficient has passed the significance level of 0.05 and dots indicate that the linear regression coefficient has passed the significance level of 0.10. The insert map colors the eastern China in blue and western China in yellow with “Heihe–Tengchong Line” as the divide.
Remotesensing 14 03844 g004
Figure 5. The correlation coefficients between MODIS CTP and AOD for each cloud regime. The dots indicate that the linear regression coefficient has passed the significance level of 0.05. Blank grids are due to missing AOD retrievals.
Remotesensing 14 03844 g005
Figure 6. Same as Figure 5 but for correlation coefficient between COT and AOD.
Remotesensing 14 03844 g006
Figure 7. Same as Figure 5 but for correlation coefficient between LWP and AOD.
Remotesensing 14 03844 g007
Figure 8. Same as Figure 5 but for correlation coefficient between TCC and AOD.
Remotesensing 14 03844 g008
Figure 9. Variations of (a) CTP in the western China, (b) CTP in the eastern China, (c) TCC in the west China, and (d) TCC in the east China with AOD. The vertical bars represent ± one standard error.
Remotesensing 14 03844 g009
Figure 10. The multivariable linear regression between (a) CTP, (b) TCC and AOD and meteorological variables. In the order from top to bottom are results for seven cloud regimes (CR1–CR7). Black triangles represent results in eastern China while red circles represent results in western China. The missing data are variables that did not pass the significance test at the level of 0.05. The abscissa values are 1 for AOD, 2–6 for temperature, 7–11 for horizontal wind, 12–16 for relative humidity, 17–21 for vertical velocity, 22–26 for geopotential height at 200, 500, 700, 850, and 1000 hPa, respectively, 27 for wind shear, and 28 for LTS.
Remotesensing 14 03844 g010
Figure 11. The joint probability density distribution of (a) GPH850 and w850 and (b) GPH1000 and w1000 for mid− and low−level clouds (CR4, CR5, CR6, and CR7) in western China. The dots lines are the relationships between GPH and w. The vertical bars represent ± one standard error.
Remotesensing 14 03844 g011
Table 1. The mean cloud properties and description for each regime.
CRCOT (/)CTP (hPa)TCC (%)LWP(g/m2)Description
15.0438.650.085.8Cirrostratus with low LWP and TCC
27.1428.991.9130.1Cirrostratus with high LWP and TCC
317.4323.098.3295.7Cirrostrats (ISCCP defination), but contains deep convection cloud in the lower reach of YRD, and low-level stratocumulus over TP
413.9626.687.8178.7Altostratus (ISCCP definatiion), with CTP span a wide range from surface to 400 hpa,
56.5727.729.074.3Stratocumulus (ISCCP defination)
63.9885.391.150.8Stratocumulus with high TCC
77.0749.874.394.8Stratocumulus with high LWP
Table 2. The sensitivities of TCC/CTP to AOD for different cloud regimes and regions.
SensitivityCR1CR2CR3CR4CR5CR6CR7
bTCCWest0.5910.5150.5590.5060.6490.8180.591
East0.8170.7500.7170.6850.7700.9250.734
bCTPWest−0.077−0.086−0.074−0.086−0.077−0.027−0.089
East−0.048−0.080−0.066−0.054−0.040−0.012−0.101
Table 3. The linear regression coefficient (β) for the AOD–CTP/TCC relationship, standardized partial regression coefficient (βm) when considering meteorological factors for the AOD−CTP/TCC relationship, and the major factors affecting CTP/TCC.
WestEast
CRLinear Regression Coefficient
β
Standardized Partial Regression
Coefficient
βm
ChangeMajor
Meteor.
Factors
Linear Regression Coefficient
β
Standardized Partial Regression
Coefficient
βm
ChangeMajor
Factors
CTP
1−0.086 *−0.022W1000
RH500
0.027 *0.048RH200
RH500
2−0.095 *−0.015GPH500
W1000
−0.006 *0.041RH200
RH500
3−0.071 *−0.020GPH700
GH500
0.017 *0.036RH200
W1000
4−0.098 *--GPH850
GPH1000
0.022 *0.028W1000
RH200
5−0.144 *--GPH850
GPH1000
−0.017 *0.032RH200
GPH700
6−0.117 *--GPH850
GPH1000
−0.0850.049GPH700
GPH500
7−0.113 *--GPH850
GPH700
0.0020.027RH200
RH500
TCC
WestEast
10.321 *0.276T850
AOD
0.527 *0.347AOD
GH700
20.301 *0.248W1000
AOD
0.503 *0.339AOD
GPH850
30.348 *0.276AOD
W1000
0.477 *0.322AOD
GPH850
40.343 *0.246GPH700
GPH500
0.479 *0.318GPH700
GH850
50.276 *0.251GPH700
GPH500
0.503 *0.340AOD
GPH500
60.307 *0.254GPH1000
GPH850
0.508 *0.364GPH700
GPH850
70.290 *0.228GPH1000
GPH850
0.466 *0.314GPH700
GPH850
* Note: “↑” means the magnitude of the regression coefficient increases from β to βm, and “↓” means vice versa. “↔” means change of sign. “-” means not significant at 0.05 level. The standardized linear regression coefficients have all passed the significance level of 0.05. Asterisk indicates that the linear regression coefficient has passed the significance level of 0.05.
Publisher’s Note: MDPI stays neutral with regard to jurisdictional claims in published maps and institutional affiliations.

