Article

Quantitative Evaluation of Reclamation Intensity Based on Regional Planning Theory and Human–Marine Coordination Since 1974: A Case Study of Shandong, China

1
Yantai Institute of Coastal Zone Research, Chinese Academy of Sciences, Yantai 264003, China
2
University of Chinese Academy of Sciences, Beijing 100049, China
3
Provincial Geomatics Center of Jiangsu, Nanjing 210013, China
4
Key Laboratory of Coastal Environmental Processes and Ecological Remediation, Chinese Academy of Sciences, Yantai 264003, China
*
Author to whom correspondence should be addressed.
These authors contributed equally to this work.
Remote Sens. 2022, 14(15), 3822; https://doi.org/10.3390/rs14153822
Submission received: 10 June 2022 / Revised: 25 July 2022 / Accepted: 5 August 2022 / Published: 8 August 2022
(This article belongs to the Special Issue Remote Sensing of Interaction between Human and Natural Ecosystem)

Abstract

:
Increased reclamation activity has adversely affected the conservation of coastal environments. The interactions between reclamation activities and their interference with the natural and functional properties of coastal zones increase the difficulty of marine spatial planning and eco-environmental management. In this study, an evaluation method for describing the intensity of the reclamation activity (RAI) based on regional planning theory and human–marine coordination theory was proposed, and a quantitative evaluation index system was constructed. The method was applied to Shandong Province in China via geographic information system (GIS) spatial analysis. The results reveal that there was an obvious increase in the RAI from 1974 to 2021, with the total reclamation scale index and coordination of reclamation activities index being the most prominent. In addition, it was found that 2007–2017 was the peak period of infilling reclamation in Shandong Province. The natural coastlines are mainly occupied by enclosed mariculture and saltern, which should be strictly managed. The proposed index system can effectively identify the spatiotemporal characteristics of the reclamation intensity and can be used to efficiently determine management priorities. It provides a theoretical basis for regional reclamation management and can be conveniently adopted by management departments for coastal environmental protection.

Graphical Abstract

1. Introduction

As the boundary area for leapfrog development from land to sea, coastal zones have an optimal geographical location and abundant natural resources [1], and they are regions with high population densities and prosperous economies [2,3]. According to statistics, coastal zones provide habitats for two-thirds of the global population [4], and they supply approximately 90% of the world’s fish catches [5]. The surrounding water and land are full of diverse germplasm resources, and various industries such as fishery, tourism, and transportation are integrated. In addition, coastal zones are able to reduce natural ecological disasters [6]. Therefore, the prominent socio-economic and ecological value of coastal zones plays an essential role in global economic development and ecological sustainability [7]. In recent years, coastal zones have experienced accelerating economic and urban construction, which has had significant impacts [8,9]. There is an increasingly prominent contradiction between the demands of industrialization/urbanization and the limited resources (land/coastline/environmental capacity) available [10,11,12,13]. Specifically, deepening coastal industrialization [14], severe pollution [15,16], serious reduction in natural coastlines [17], degradation of tideland resources [18], and frequent natural disasters are occurring in coastal zones. Although reclamation poses threats to the coastal ecological environment, the infilled areas used for urban construction and industrial/agricultural production effectively alleviate the contradiction between rapid economic development and insufficient construction land [19]. Reclamation of coastal protection engineering has also reduced economic losses caused by storms [20]. Accordingly, reclamation management should not be limited to controlling the reclamation distribution area; moreover, a rational layout and efficient measures have been the management priority for coastal sustainable development. Thus, the exploration of a reasonable layout for coastal land use, analysis of the management effect of coastal spatial planning, and identification of the key points of natural shoreline resource protection have gradually evolved into important research topics.
In terms of interpretation methods, reclamation areas and coastlines are mainly interpreted via manual and automatic/semi-automatic methods. Overall, manual visual interpretation is more accurate than automatic/semi-automatic interpretation, but it has the disadvantages of being time-consuming and requiring more professional interpretation experience. Huang et al. [21] used visual interpretation and field surveys to extract the changes in land reclamation and coastline and then to conduct risk assessment in the China coastal zones from 2000 to 2010. They found that detailed classification of reclamation activities is conducive to further ecological research. Ma et al. [22] analyzed the effects of several reclamation types (i.e., mariculture, cropland, and construction areas) on coastal wetlands in China’s four major deltas in 2014 by manual interpretation combined with field surveys, demonstrating that use of visual interpretation method in coastal reclamation interpretation is feasible. Considering the interpretation accuracy requirements, automatic or semi-automatic interpretation methods mainly adopt local adaptive threshold technology [23], object-oriented classification technology [24], and the normalized water index [25], which are applied for coastline extraction and enclosed mariculture extraction. Since the interpretation signs are relatively similar for various types of reclamation activities, the existing automatic or semi-automatic interpretation technology cannot simultaneously achieve detailed reclamation classification and high-precision interpretation yet. Therefore, before artificial intelligence technology could be maturely applied to automatic interpretation, manual visual method is still preferred for interpreting reclamation activities by most scholars.
Over the last few decades, scholars have conducted in-depth research on changes in the reclamation area and the regional ecological health level. Specifically, Feng et al. [26] evaluated the suitability of coastal reclamation by calculating the distances between coastline and regional economic development areas, and they determined that the impact of reclamation activities on the marine environment was significantly related to the geographic location of the coastline. Song et al. [27] characterized the impact of reclamation activities on the coastal environment according to the changes in the bay area and fractal dimension of the natural coastline. Moreover, Tian et al. [28] and Jiang et al. [29] assessed the intensity of China’s coastal reclamation activities by considering the annual reclamation area per unit of coastline based on long-time-series data. They found that the rapidly developing reclamation seriously threatened the sustainability of the coastal environment. Yang et al. [30] and Jin et al. [31] pointed out that reclamation activities exerted a significant impact on the coastal wetland ecosystem, and the evaluation of the reclamation intensity was meaningful to the protection of the coastal ecological environment. In addition, Huang et al. [21] analyzed the spatiotemporal changes in the land reclamation and coastal zone morphology, emphasizing that more attention should be paid to balancing land reclamation and ecosystem protection. Peng et al. [32] determined that the types of reclamation activities were closely related to the ecological impacts on coastal ecosystems. Choi [33] declared that developing countries should learn from the experience and enlightenment gained from research on the spatial distribution characteristics of long-term reclamation activities. However, such studies have commonly focused on analyzing area changes of reclamation activities or water/sediment quality in reclamation regions rather than comprehensively evaluating the reclamation intensity from the perspectives of coastal zone planning and management activities. In addition, the evaluation indicators used in previous reclamation-related research based on geospatial distribution data are relatively simple, and the chemical and biological indicators of the marine environment are characterized by complicated sampling, high costs, time-consuming processes, and difficulty in accessing historical data.
Meanwhile, in order to protect the marine ecological environment, the government has striven to guide reclamation management via multidisciplinary theories and methods in order to coordinate marine utilization contradictions in coastal zones [34]. To be specific, regional planning theory and human–marine coordination theory are the typical representatives [35,36,37]. Regional planning theory refers to the overall deployment of the layout and total amount of control of regional marine utilization on the macro-scale in order to achieve reasonable resource allocation and promote sustainable socioeconomic development [38]. In China, total quantity control of reclamation and intensive sea-use management are typical marine management policies based on regional planning theory [39]. Human–marine coordination theory is an extension of human–land coordination theory, and it explores the relationship between human social activities and the marine geographical environment. It analyzes the interactions between human activities and the functional attributes of marine resources, thus striving to achieve sustainable marine development and harmony between humans and nature [40]. Marine conservation zone management and the marine function zonation system are the typical marine management measures based on human–marine coordination theory [41,42,43]. However, few studies have been conducted on the evaluation of the reclamation intensity from the coastal zone management perspective. Consequently, it is necessary to develop a geographic method for evaluating the reclamation intensity that can quantitatively analyze the relationship between reclamation activities and coastal spatial resource management from the perspective of regional planning and management [44,45]. A general index system should be established to intuitively quantify the impact of long-term reclamation on natural resources and the basic functions of the coastal zone [46].
Previous studies have shown that most coastal zones in the world experience high-intensity human activities [47,48]. In particular, in the period of rapid marine economic development, reclamation occupies massive amounts of natural coastlines and tidal flats [49]. Unreasonable reclamation brings about several environmental and socio-economic problems, dramatically damaging the ecological balance of coastal zones [50,51]. One example is Shandong Province, which has the largest reclamation area and almost all reclamation activities in China, with long coastlines, complex human–marine interactions, and a centuries-old history of marine economic development [52]. It is urgent to establish professional management and coordination schemes in order to enhance the management effect of coastal reclamation [53]. In this study, the coastal area in Shandong Province was selected as an ideal study area to analyze the spatiotemporal characteristics of reclamation intensity.
Based on the above-described studies, in this study, we focused on the geographical characteristics of reclamation activities and human–marine interactions and established an evaluation index system from the perspectives of the structural scale of reclamation, spatial characteristics of reclamation, and coordination of marine utilization. Moreover, a geographic spatial model based on the geographical distribution of reclamation and regional management policies was constructed in order to evaluate the reclamation intensity. Taking Shandong Province as a case study, in this study, the distribution characteristics, intensity changes, and main stressors of reclamation activities were explored in order to provide decision-making support for coastal reclamation management [46].

2. Materials and Methods

2.1. Study Area

As an important component in China’s marine development and regional coordinated development strategy, Shandong Province covers a total administrative area of 157,900 km2 and a coastline of more than 3000 m2 in eastern China (Figure 1). The tortuous coastline forms several typical semi-closed bays and large open coastal waters. Its offshore areas account for about 37% of the total area of the Yellow Sea and Bohai Sea and are abundant in fishery, tourism, harbor, saltern, and mineral resources.
Shandong Province had a population of 102 million and a gross domestic product (GDP) of CNY 8.31 trillion in 2021, ranking second and third among over 30 provinces in China, respectively. It has a superior geographical location and abundant natural resources. Frequent human economic activities have resulted in large-scale reclamation activities taking place in the coastal zone [54,55], including almost all of the major types of reclamation. Undoubtedly, the high-intensity reclamation has propelled the economies of coastal cities, but it has also posed significant threats to the ecological environment in coastal areas, such as a sharp reduction in the area of natural coastlines, serious degradation of coastal wetlands, and substantial shrinkage of the bay area [56]. As a typical representative of human activities in coastal areas, rational reclamation is important to supporting the socio-economic sustainability of surrounding coastal areas.
Reclamation refers to the high-intensity utilization of coastal areas through human enclosing and infilling outside of the coastline. Based on previous research [57,58], in this study, the coastal zone of Shandong Province was taken as the study area in accordance with administrative division boundaries of seven coastal prefecture-level cities in Shandong Province, which were Binzhou, Dongying, Weifang, Yantai, Weihai, Qingdao, and Rizhao. Specifically, the study area was 10 km buffer zone of management coastline to the sea and landward designated by the government (Figure 1).

2.2. Definition and Classification of Reclamation Activities

In contrast to the proven inland land-use classification methodology, which has well-developed interpretation signs, the classification of reclamation activities is difficult due to the subtle differences in remote sensing images. For this reason, reclamation activities are usually divided into enclosed and infilled areas [59], or roughly into a few typical types of activities [60], such as mariculture and ports. In reality, accurate and detailed classification of reclamation activities using remote sensing data could help fully reveal the evolution process and facilitate efficient supervision of reclamation activities. Thus, definition and identification of interpretation signs of diverse reclamation activities were conducted in this study (Table 1) in order to improve the interpretation accuracy of reclamation activities.

2.3. Data Source

To ensure the accuracy of reclamation data, 1974, 1990, 2000, 2007, 2017, and 2021 were selected as the research periods based on the quality of available remote sensing images and the coastal special survey data obtained from local government and field surveys carried out by our research group. The spatial distribution data for reclamation activities in 1990, 2000, 2007, 2017, and 2021 were mapped from 40 Landsat remote sensing images via visual interpretation [62], including Landsat 5 Thematic Mapper (TM) images acquired in 1990, Landsat 7 Enhanced TM-Plus (ETM+) images acquired in 2000 and 2007, and Landsat 8 Operational Land Imager (OLI) images acquired in 2017 and 2021. The details of satellite datasets used for reclamation classification in Shandong coastal zone are elaborated in Table S1. Because there were no remote sensing image data with an accuracy that matched the display effect in the study area prior to 1990, spatial distribution data of reclamation in 1974 was obtained based on interpretation of a 1:100,000 coastal topographic map and a historical photo atlas in 1974. Finally, a spatial distribution database of long-term reclamation in Shandong Province was created.
According to the technical guidelines of Sea Area Use Classification (HY/T123-2009) and Current Land Use Classification (GB/T 21010-2007) promulgated by national government departments, the database classifies reclamation activities as enclosed mariculture, saltern, fishery infrastructure, coastal industrial construction, tourism infrastructure, port, urbanization, others, unused infilled reclamation area, and unused enclosed reclamation area (Figure 2). Subsequently, the reclamation distribution data for 1974 in Shandong obtained from the vectorization results of 1:100,000 topographic maps were defaulted to meet the interpretation accuracy. Furthermore, in this study, Google HD images, SPOT images, authentic right data for marine utilization, topographic maps, and special survey drawings of the coastal zone were used as basic data for verification. Annually, 300 points covering 10 reclamation activities were randomly selected for the overall accuracy verification of reclamation classification in 1990, 2000, 2007, 2017, and 2021, with passing point percentages accounting for 80.70%, 90.30%, 92.70%, 93.70%, and 95.30%, respectively. The accuracy verification results reveal that the annual interpretation accuracy of the reclamation data in this database was higher than 80%, indicating that the high accuracy meets the data accuracy requirements of this study. In addition, data on marine spatial planning were obtained from the local government.
It is noteworthy that the interpretation accuracy of reclamation classification heavily depends on the familiarity of researchers with study area because the differences in a few reclamation activities (e.g., coastal industrial construction, tourism infrastructure, and urbanization) in satellite images were particularly slight, which requires researchers to use regional human geography knowledge to distinguish them.

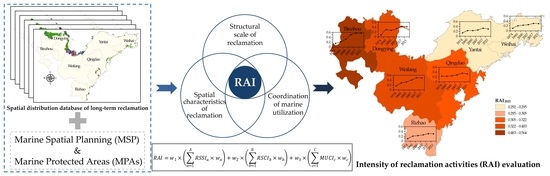
2.4. Quantitative Evaluation of the Reclamation Intensity

2.4.1. Construction of Evaluation Index System

Based on the layout of reclamation space and coordinated regional development theory, a comprehensive index framework was developed by following scientific, quantitative, comprehensive, and feasible principles. Several indicators including structural scale of reclamation, spatial characteristics of reclamation, and coordination of marine utilization indicators were selected from the perspectives of ocean space occupation, diverse sea-use modes, and the impact of reclamation activities on other activities and/or marine function, respectively.
Structural scale of reclamation index (RSSI) refers to the marine utilization scale and its internal composition caused by reclamation, including five secondary indicators. The in-depth understanding of RSSI is significant to guiding rational layout of reclamation and effectively improving sustainable coastal development. To be specific, the total reclamation scale (TRS) and reclamation rate (RRT) reflect the occupation of two-dimensional space resources in coastal zones by reclamation activities. The infilled reclamation proportion (IRP) was used to measure the impact intensity of different reclamation modes on marine natural properties. The reclamation intensity per unit coastline (CRI) index calculates the reclamation area per unit coastline to represent the over-exploitation possibility of coastline. Diversity of reclamation activities (RAD) reflects the potential impact level of reclamation on marine functional attributes from the perspective of the number of reclamation activity types.
Spatial characteristics of reclamation index (RSCI) mainly includes the distribution azimuth and aggregation degree of reclamation activities. It is helpful to identify hotspot areas of reclamation. More specifically, the spatial equilibrium of reclamation (RSE) calculates the equilibrium of spatial resources allocation by the area distribution of different reclamation patches. The nearest neighbor index is used by spatial concentration of reclamation (RSC) to reveal the concentration degree of reclamation [63]. The larger RSC value, the less uniform distribution of reclamation activities, and the higher regional reclamation intensity caused by it. The center migration rate of reclamation (RCR) represents the changes in the distribution of hotspot areas of reclamation.
Coordination of marine utilization index (MUCI) indicates the impact of reclamation on adjacent activities and dominant marine functions from the perspectives of marine resource utilization and ecological impacts. Specifically, coordination of reclamation activities (RAC) reflects the mutual interference between main purposes of adjacent reclamation activities. The main purposes of reclamation activities are shown in Table S2. The compliance with marine spatial planning (MSC) indicates the degree of compliance between main purposes of reclamation activities and policy guidance for marine protection and development [64]. Coordination of marine ecological protection (MPC) reflects the tolerance ability of offshore area that bears the ecological impact caused by reclamation activities by calculating the area proportion of marine conversation zones in the region. Natural coastline retention rate (NCR) is an important indicator in the protection, utilization, and management of coastal zones, which characterizes the negative impacts of reclamation on marine natural resources and ecological environment.
Finally, a quantitative evaluation index system for the reclamation intensity consisting of three primary indicators and twelve secondary indicators was established (Table 2).

2.4.2. Index Assignment

Taking into consideration the 10 reclamation activities defined above, all the secondary indicators were assigned in the coastal zone with the administrative jurisdiction of each prefecture-level city as the calculation unit. The specific calculation methods are as follows:
(1)
Structural Scale of Reclamation Index
Five indicators were calculated to quantify the structural scale of reclamation: total reclamation scale (TRS, ha), reclamation rate (RRT, %), infilled reclamation proportion (IRP, %), reclamation intensity per unit coastline (CRI, ha/km), and diversity of reclamation activities (RAD, number). The calculation formulas are as follows:
TRS = 1 2 j = 1 n x j y j + 1 x j + 1 y j
RRT = A r A × 100 %
IRP = A i A r × 100 %
CRI = A r L
RAD = C o u n t i f R 1 , R 2 R m ,   E R m = 1
where TRS is the total area of all reclamation activity patches; (xj, yj) is the vertex coordinates of each reclamation activity; Ar represents total area of reclamation; A is the total area of evaluation area; Ai means the area of infilled reclamation; L is the coastline length; Rm indicates the m-th type of reclamation; ERm indicates whether the m-th reclamation exists, and if so, the value is 1; otherwise it is 0.
(2)
Spatial Characteristics of Reclamation Index
The spatial distribution characteristics of reclamation were reflected by spatial equilibrium of reclamation (RSE) [65], spatial concentration of reclamation (RSC) [63], and center migration rate of reclamation (RCR, km/a) [66]. The calculation formulas are as follows:
RSE = 1 i = 1 n A i 2 i = 1 n A i 2
RSC = R 1 R e 1
x c = A i x i A i
y c = A i y i A i
RCR = x e n d x s t a r t 2 + y e n d y s t a r t 2 T e n d T s t a r t
wherein n is number of reclamation activities in evaluation area; Ai refers to area of the i-th reclamation patch. R1 means the actual nearest neighbor distance, and Re represents nearest neighbor distance theoretically, which is calculated by spatial statistical analysis tool in GIS. (xc, yc) is centroid coordinate of reclamation activities; (xi, yi) means the centroid coordinates of i-th reclamation activity patch; (xstart, ystart) and (xend, yend) refer to centroid coordinates of reclamation activities at initial stage and end of the study period; Tstart and Tend represent years at initial stage and end of the study period, respectively.
(3)
Coordination of Marine Utilization Index
The coordination of marine utilization in the process of reclamation was quantified by coordination of reclamation activities (RAC), compliance with marine spatial planning (MSC), coordination of marine ecological protection (MPC, %), and natural coastline retention rate (NCR, %). The calculation formulas are as follows:
RAC = M i n 0 < i n E i × E i × C i i + E i × E i 1 × 3
wherein n means the number of reclamation activity types; Cii is the degree of coordination between i-th activity and the i’-th activity, which is 3 when it is very coordinated, 2 for partially coordinated, and 1 for completely uncoordinated (Table 3). If there is no reclamation activity within evaluation area, the value of Cii is 3.
MSC = M i n 0 < i n E i × E f × C i f + E i × E f 1 × 3
wherein Cif is the degree of compliance between i-th activity and f-th marine spatial planning zone, with value of 3 for complete compliance, 2 for basic compliance, and 1 for non-compliance (Table 3). Ei and Ef represent there is i-th activity and f-th marine spatial planning area or not, respectively, and the value is 0 or 1. When there is no reclamation activity in the evaluation area or it is not designated as a marine spatial planning zone (Ei = 0 or Ef = 0), the compatibility of this area is considered high, and Cif value is 3. It should be noted that RAC and MSC were calculated using the 5 km × 5 km grid as the calculation unit.
MPC = A p A 1 × 100 %
wherein Ap refers to the area of marine conversation zone; A is the total area of the calculation area.
NCR = L n L × 100 %
wherein Ln is the length of natural coastline; L represents total length of coastline.
Furthermore, in order to ensure the quantitative comparability among indicators, the secondary indicators were normalized to 0–1 by linear function normalization after they were calculated. The extreme standard method takes the form of the following equations:
N i * = N i N m i n N m a x N m i n
N i * = N m a x N i N m a x N m i n
wherein Ni* and Ni are normalized and calculated values, respectively; Nmax and Nmin represent maximum and minimum of multi-year historical calculation value of the index in all evaluation areas, respectively. Herein, the higher value of Ni*, the higher intensity of reclamation is. For positive indicator whose ecological impact is greater when indicator value is higher, Formula (15) is used. Otherwise, Formula (16) shall prevail.

2.4.3. Calculation of Reclamation Intensity

Based on the established evaluation index system, all indicators were weighted in order to evaluate the intensity of reclamation activities in the coastal zones. After the dimensionless calculation of indicators was performed, the closer the indicator value was to 1, the greater the reclamation intensity was. The intensity of reclamation activities (RAI) was then formulated by Formula (17):
RAI = w 1 × a = 1 A R S S I a × w a + w 2 × b = 1 B R S C I b × w b + w 3 × c = 1 C M U C I c × w c
where w1, w2, and w3 are the weights of structure and scale of reclamation index (RSSI), spatial characteristics of reclamation index (RSCI), and coordination of marine utilization index (MUCI), respectively; wa, wb, and wc are the weights of each secondary indicator.
The calculated RAI value is between 0 and 1, it is divided by natural breaks to represent the intensity of reclamation activities, and it then assists in spatial statistical analysis.

2.5. Weight Determination

The weight refers to the relative importance coefficient of indicator. Considering that the established index system is a hierarchical structure composed of target layer, criterion layer, and element layer, the weight of each indicator was determined by the analytic hierarchy process (AHP), which is suitable for multi-objective decision analysis. The AHP has been extensively used for the objective quantitative analysis of qualitative transactions to determine the weights of complex index systems by collecting the judgment of experts [67], which consists of three key steps: construction of a judgment matrix, calculation of index weights, and consistency check [68].

2.5.1. Construction of Judgment Matrix

The values of elements in the judgment matrix of every hierarchy were determined using the expert scoring method. To be specific, 15 experts engaged in coastal protection and marine ecosystem management were invited to score the questionnaire by 9-point method [69]. Scores of 1, 3, 5, 7, 9, or their reciprocals were viewed as quantitative standards to judge relative importance of indicators at the same level. These experts were professors from universities and research institutes, as well as senior engineers in government departments involved in coastal management. After the questionnaire was completed, a judgment matrix was constructed using the mode of each element value, which was expressed as P. It was assumed that there were n evaluation indicators as (f1, f2, …, fn) in evaluation target A, and element of fij in the judgment matrix element set F represented the ratio of the importance of row element fi and column element fj to A. Judgment matrix P(AF) was:
P = f 11 f 1 n f n 1 f n n

2.5.2. Calculation of the Index Weight Coefficients

Based on the constructed judgment matrix, AHP was applied to calculate weight coefficients of each evaluation indicator in three steps:
(1)
Calculate the product Mi of elements in each row of judgment matrix P.
M i = j = 1 n f i j
(2)
Calculate the n-th root of Mi.
W i ¯ = M i n
(3)
Calculate eigenvector W = [w1, w2, …, wn] T, wherein each element is the weight coefficient of indicator.
w i = W i ¯ / j = 1 n W i ¯

2.5.3. Consistency Check

Considering the possible subjective errors introduced when relative importance coefficient (fij) of multiple indicators was scored, the consistency of judgment matrix was checked by calculating random consistency ratio (CR), in order to improve the reliability of results.
C R = C I / R I
C I = λ m a x n / n 1
λ m a x = i = 1 n P W i n w i
wherein CI is consistency indicator; RI is random consistency indicator; λmax represents the largest characteristic root; n is the order of matrix. RI values corresponding to first to ninth order matrix are 0, 0, 0.58, 0.90, 1.12, 1.24, 1.32, 1.41, and 1.45, respectively.
When CR < 0.1, the judgment matrix is considered to have a satisfactory consistency, and the elements in eigenvector W were the weight of each indicator. Otherwise, the judgment matrix should be adjusted until it passes consistency test. The weight calculation results of indicators in the evaluation index system are shown in Table 1.

3. Results

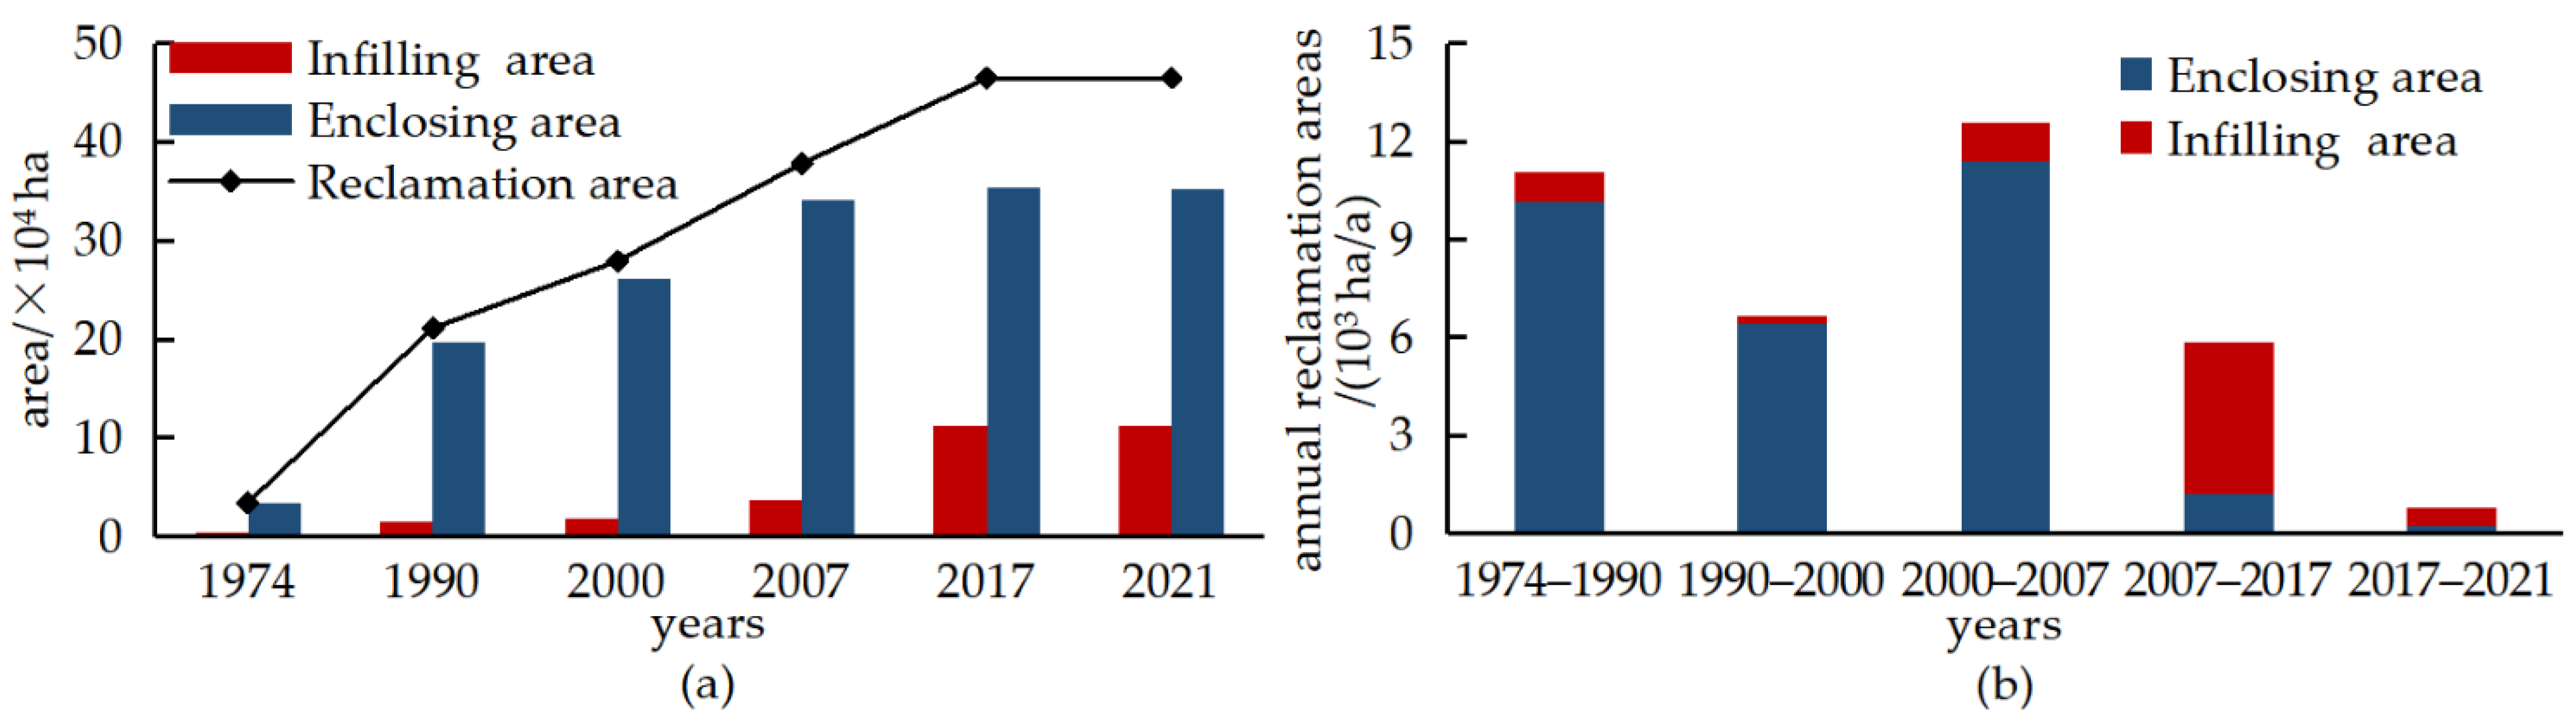
3.1. Evolution Characteristics of Reclamation from 1974 to 2021

Statistical analysis of the long-term reclamation area (Figure 3a) revealed that the total reclamation area in Shandong Province increased from 34,497.73 ha in 1974 to 464,865.05 ha in 2021, with an average annual increase of 9156.75 ha. More precisely, during the study period, enclosed reclamation occupied a dominant position in reclamation activities in Shandong for a long time. Although the enclosed area decreased year by year, the annual proportion of enclosed reclamation area to the total reclamation area was consistently greater than 75%. The infilled reclamation area significantly increased, and the area of infilled reclamation in 2021 was 623.97 times that in 1974, indicating that in recent years, Shandong has tended to fill in offshore areas during marine development.
According to the statistical results (Figure 3b), the growth rate of the reclamation scale in Shandong Province generally followed a trend of decreasing–increasing–decreasing, and its change trend was essentially the same as that of the enclosed reclamation. The average annual growth rate of reclamation area was 6183.61 ha/a, which was the highest during 2000–2007; while in 2017–2021, it was only 32.15 ha/a. Additionally, the average annual increases in the reclamation area were similar during 1990–2000 and 2007–2017, but the growth rates of enclosed and infilled reclamation areas were quite different. The increase in the enclosed area slowed down in 2007–2017, while infilled area expanded significantly after 2000, and it reached the peak value (4617.61 ha/a) in 2007–2017, which was 2.75 times the increase rate of the enclosed area.

3.2. Comprehensive Analysis of RAI

The intensity of reclamation activity (RAI) and three primary indicators (RSSI, RSCI, and MUCI) in Shandong Province were calculated, and the evaluation value was calculated through normalized value multiplied by weight. According to evaluation results (Figure 4a), RAI increased overall from 1974 to 2021, but it decreased slightly from 2017 to 2021, which was due to regional strict management measures for reclamation activities and coastal zone restoration during these periods.
Specifically, RSCI played a key role in enhancing reclamation intensity in 1974, and the levels of RSSI, RSCI, and MUCI values were essentially the same in 1990 and 2000. The contribution of RSSI became increasingly prominent in 2007–2021, while that of RSCI decreased significantly. The changes in the evaluation values of three primary indicators during different periods indicated that when the overall scale of reclamation was small, the intensity was mainly enhanced by the rationality of reclamation spatial distribution. With a sudden increase in reclamation activity areas, more attention should be paid to the interactions between reclamation activities and their impacts on the natural and functional properties of coastal zones.

3.3. Analysis of Sub-Indices of the RAI from 1974 to 2021

To determine the contribution of each indicator, the evaluation values of 12 secondary indicators and their trends were analyzed as follows (Figure 4b). First, the TRS, RRT, IRP, CRI, RAC, MSC, and NCR exhibited increasing trends overall, among which TRS and RAC increased the most (by 0.063 and 0.050, respectively), indicating that the sharp increase in reclamation area was due to significant changes in reclamation activities. Second, for RAD, the types of reclamation were only fewer in 1974 in Shandong Province, and diverse activities have occurred since 1990. Third, RSE slightly decreased as the small-scale reclamation projects were expanded due to the typical upsurge in reclamation since 1974. Fourth, RSC and RCR fluctuated due to both policies and natural resources, while reclamation activities were managed by different cities.
A horizontal comparison of the secondary indicators in different years revealed that RSC was the main stressor in 1974 and 1990, and there were generally fewer reclamation activities. A rapid development period of reclamation occurred during 2000–2017, and the effects of TRS and RAC were significantly stronger. In 2017 and 2021, the effect of TRS and RSC was the strongest, followed by that of RAC.

3.4. Analysis of RAI in Different Cities

To improve the practical significance for regional reclamation management and regional statistics, spatial analysis of the evaluation values of reclamation intensity and primary indicators for different cities in the study area was conducted based on the geographic information system (GIS) (Figure 5). The results indicate that the spatial distribution of RAI was higher in the west than in the east. In 1974, the RAI values in the coastal cities in Shandong were ranked from highest to lowest as Qingdao, Weifang, Binzhou, Yantai, Rizhao, Weihai, and Dongying. However, the sequence was Binzhou, Weifang, Dongying, Qingdao, Rizhao, Yantai, and Weihai in 2021. This demonstrated that reclamation activities were mostly concentrated in well-developed coastal cities at the initial stage of the study period. In the development process of nearly 50 years, cities that focused on sustainability and diversified industries represented by Qingdao managed the reclamation activities more effectively than those with a single type of industry, such as Dongying and Binzhou. For the RAI trends of different cities, the RAI values in Dongying, Binzhou, and Weifang increased significantly, which is by 426.47%, 280.70%, and 196.67%, respectively.
According to the spatial statistical results of the three RAI sub-indicators in different cities, RSSI increased frequently in Binzhou between 1974 and 2021, and the RSSI was managed most effectively in Weihai. In 2021, RAI caused by the structural scale of reclamation activities was the most remarkable stressor in Binzhou, while it was the lowest stressor in Yantai and Weihai. As for RSCI, it was significantly higher in developed cities, such as Yantai and Qingdao, due to their long coastlines and diverse sectors. Additionally, Binzhou had higher MUCI throughout the entire study period, and the management effect of marine utilization coordination was superior in Rizhao, benefiting from measures such as returning port to sea and returning port to the beach.

4. Discussion

4.1. Impact of Reclamation Activities on Natural Coastline Resources

Massive high-quality natural coastlines and tidal flat wetland resources were encroached upon due to the large-scale, long-term, and high-intensity reclamation activities, which had significant impacts on the properties and layout of the regional natural shoreline [70], including extrapolation of natural coastlines, narrowing of the beach area, and degradation of ecological functions of the coastline [71].
The impact of reclamation on natural coastline resources was reflected by the encroachment on the natural coastline based on historical data for reclamation and coastline evolution (Table 4). The statistical results reveal that reclamation had various development focuses during different periods in the study area, which caused natural coastlines to be occupied by diverse reclamation activities at different times. To be specific, the natural coastlines were mainly used for mariculture and saltern, with an average annual occupation rate of almost 1.00 km or above. In 2000 and 2007, the occupation rates were 19.890 km/a and 4.692 km/a, respectively. The occupation rate decreased significantly during 2007–2021, and natural coastlines were not occupied by saltern after 2017. It was the result of regulation that the Ministry of Natural Resources of China proposed to completely stop the approval of new reclamation projects except for major national strategic projects [72]. After 2018, reclamation activities were under strict control. Thus, it can be seen that natural coastline resources can be effectively protected through the strict implementation of rational governmental management and control policies.

4.2. Response of Reclamation Activities to Marine Spatial Planning

As an important management measure for coastal development, marine spatial planning (MSP) was attempted to coordinate the relationship between human activities and marine space by exploring the basic characteristics of marine utilization in order to provide a basis for achieving the ideal distribution of rational marine spatial protection and marine utilization [73,74].
The effectiveness of policy guidance and management regulations can be judged by analyzing the response of reclamation activities to marine spatial planning, which is of great guiding significance for reclamation management [75]. Moreover, considering that China established the relatively sophisticated technology system of marine spatial planning in 2002, the total reclamation area has been controlled since 2011, and the types/modes/intensity of coastal utilization have been regulated by classified guidance and regional management since 2012 [64,76]. The reclamation areas that conflict with the properties of MSP zones as a percentage of total reclamation area were adopted to judge the effectiveness of MSP in 2007, 2017, and 2021 (Figure 6, Table 5).
The results of the GIS-based spatial overlay analysis revealed that there were no conflicting reclamation activities in the agriculture and fishery zones, port shipping zones, and industrial and urban sea zones. The conflict in the marine reserved zones (MRZs) and marine conservation zones (MCZs) was relatively strong and was dominated by enclosed mariculture. It was mainly related to the need for the conservation of important germplasm resources in the MRZs and MCZs, and some reclamation activities had been conducted before MSP was proposed. Therefore, management strategies should ensure that reclamation activities in the MRZs and MCZs are aimed at protecting marine ecological rather than economical and profitable activities. Most notably, more importance should be attached to the management of marine reserved zones because the relevant departments tend to ignore the management of reclamation activities in reserved areas due to its uncertain basic functions.
Additionally, the conflicts of reclamation activities in marine spatial planning zones were mitigated from 2007 to 2021, which is represented by a decrease in the conflict ratio of 83.43%, 76.82%, and 28.18% in tourism and recreation zones, mineral and energy zones, and marine conservation zones, respectively. The statistical results indicate that the guidance and control of management policies played a crucial role in the reclamation management and coastal sustainability.

4.3. Bays: Highlighted Hotspots of Reclamation Activities

Compared with open sea areas, reclamation tends to easily change the water-exchange ability of bays, thereby reducing the self-purification and environmental capacity of bays [77,78]. Destruction of marine biological breeding grounds, frequent red tides, and biological extinction have been caused by excessive reclamation, which have restricted the sustainable development of the regional marine economy [79]. Therefore, bays were the key management zones for reclamation, because they were the most vulnerable and sensitive areas under the background of a rapidly expanding economy in the coastal zone. Undoubtedly, focusing on the distribution characteristics of reclamation activities in the bays will help to improve regional coastal management.
Taking the bays with coastline lengths of greater than 200 km and seawater areas of greater than 104 ha as research targets, spatial correlation of reclamation distribution and Jiaozhou Bay, Laizhou Bay, Jinghai Bay, and Wuleidao Bay (Figure 1) was conducted. The statistical results indicate that more than 50% of reclamation activities in Shandong Province were distributed in these bays during the study period, while the proportions of coastline and coastal areas in these bays were only 32.42% and 31.42%, respectively (Table 6). Thus, it can be seen that reclamation activities in Shandong were concentrated in the bays, especially in the bay head area. Accordingly, further research and discussion on the reclamation distribution and corresponding ecological effects in bays need to be conducted.

4.4. Rationality Analysis of the RAI Evaluation Index System

The evaluation of reclamation intensity in Shandong Province indicated that the quantitative evaluation index system for reclamation intensity is scientifically feasible. The case study intuitively and faithfully reflected the spatiotemporal distribution characteristics of reclamation activities and the response of reclamation activities to coastal management policies. The results of this study are consistent with those of previous studies, as follows. The reclamation activities in Shandong Province were mainly distributed in the northern coastal zone [80]; the enclosed area was significantly greater than the infilled area [21]; the long time series of average annual reclamation area in Shandong Province showed a trend of fluctuation, and the reclamation rate gradually slowed down after 2000 [81]; marine spatial planning played an important role in the coastal protection and reclamation management [19]. Accordingly, the rationality and validity of the research results were confirmed, although it was the first time that a quantitative evaluation index system for reclamation intensity was proposed based on the geographical method and regional management concept.

4.5. Research Limitations and Future Directions

The established index system for evaluating reclamation intensity is intuitive and highly portable, but the evaluation accuracy depended on the quality of remote sensing interpretation data. Except for the accidental error introduced by the manual visual interpretation, a slight deviation in reclamation activity area may be caused by a contingent incomplete display at the instant of satellite image capturing, especially in places where the slope of the water line area is gentle. In addition, to be precise, the calculated indices were intended to make the qualitative problems quantitative as much as possible via mathematical models to ensure objective and rational evaluation. In order to ensure the differentiation between various years/activities/indices, three decimal places were retained in most of the calculations. The significance of retaining so many accurate digits was the improvement in the comparability of calculation results, instead of subjectively judging the contribution of a single index to the reclamation intensity just based on a calculation digit. In addition, the reclamation activities probably exhibited interesting characteristics in some years when marine management policies were issued [81]. However, the time interval of our study was four to sixteen years because data accuracy needed to be verified by relying heavily on field surveys, which are time-consuming and labor-intensive.
Furthermore, despite some reclamation activities having the same area and sea-use type, their intensities still varied theoretically as a result of the different distribution regions. For example, the intensity of equal-area mariculture was different because of diverse fishery outputs. Unfortunately, area was used as a basic index to characterize reclamation intensity due to the difficulty of accessing the spatial distribution of socioeconomic data from multiple sectors. With the in-depth application of geographical methodology in analyzing the spatiotemporal characteristics of reclamation and assessing the ecological impact caused by reclamation, indicators of the quantitative evaluation index system for reclamation intensity can be adjusted to improve its internal logic according to the regional characteristics and data availability. In the future, it is recommended that researchers conduct spatialization of socioeconomic data with reference to the methods for population and GDP spatial simulation [82,83,84], which can be applied to evaluate the reclamation intensity and corresponding ecological effects, thereby helping policymakers balance the relationship between natural resources, economy, and environment to promote regional sustainable development.

5. Conclusions

Based on the GIS and reclamation distribution data from 1974 to 2021, a quantitative evaluation system for reclamation intensity was constructed by taking geospatial methods with regional planning and human–marine coordination theory. The method was demonstrated to be practicable and effective by evaluating the case of Shandong Province. The main conclusions of this study are as follows: (1) The reclamation area in Shandong Province has significantly increased since 1974, and RSSI played an increasingly prominent role in enhancing the reclamation intensity. To be specific, Dongying, Binzhou, and Weifang had higher reclamation intensities, and 2007–2017 was the peak period of infilled reclamation in Shandong Province. (2) TRS and RAC were the main stressors of reclamation intensity, and more attention should be paid to the interactions between reclamation activities and their interference with the natural and functional properties of the marine environment. (3) Natural coastlines are mainly occupied by enclosed mariculture and saltern, which should be strictly managed. (4) Marine spatial planning is helpful for regulating reclamation activities, but reclamation management in bays is still challenging. In conclusion, the research results of this study can be used to help judge the implementation effects of marine spatial management measures and to identify the management focus of reclamation activities, thereby providing a theoretical basis for integrated coastal management.
The proposed index system for evaluating the reclamation intensity is significant under the current development background, in which the prosperous marine economy poses severe threats to coastal ecological balance and sustainability. In contrast to multiple mature ecological studies based on land use/cover change (LUCC), research on LUCC in reclamation interpretation has been poorly carried out. In addition, research on the ecological impact caused by reclamation heavily relies on marine environmental monitoring. Therefore, quantitative evaluation of the reclamation intensity adopting geographic methods is a priority in coastal protection and reclamation management. This paper also provides a useful example of how to evaluate the reclamation intensity using remote sensing data. Furthermore, as a decision-making evaluation index system, the proposed method is universal, standardized, and repeatable, and thus, it has more advantages within complex reclamation areas so as to provide theoretical reference and decision-making support for coastal reclamation management.

Supplementary Materials

The following supporting information can be downloaded at: https://www.mdpi.com/article/10.3390/rs14153822/s1, Table S1: Details of satellite datasets used for reclamation classification in Shandong coastal zone.; Table S2: The main purposes of each reclamation activity.

Author Contributions

Conceptualization, B.L., M.G., and X.W.; Data curation, B.L.; Formal analysis, B.L., M.G., and Z.W.; Funding acquisition, X.W.; Investigation, B.L. and M.G.; Methodology, B.L. and M.G.; Project administration, X.W.; Software, B.L., M.G., and Z.W.; Supervision, X.W.; Validation, B.L. and M.G.; Visualization, B.L.; Writing—original draft, B.L. and M.G.; Writing—review and editing, B.L., M.G., and X.W. All authors have read and agreed to the published version of the manuscript.

Funding

This work was supported by the National Key R&D Program of China (grant No. 2019YFD0900705) and the Shandong Provincial Natural Science Foundation (grant No. ZR2020MD014).

Data Availability Statement

Not applicable.

Acknowledgments

We would like to express thanks for the constructive comments from the editor, associate editor, and anonymous reviewers.

Conflicts of Interest

We declare that the research was conducted in the absence of any commercial or financial relationships that could be construed as a potential conflict of interest.

References

  1. Seijo, J.C.; Caddy, J.F. Port location for inshore fleets affects the sustainability of coastal source–sink resources: Implications for spatial management of metapopulations. Fish. Res. 2008, 91, 336–348. [Google Scholar] [CrossRef]
  2. Tian, B.; Wu, W.; Yang, Z.; Zhou, Y. Drivers, trends, and potential impacts of long-term coastal reclamation in China from 1985 to 2010. Estuar. Coast. Shelf Sci. 2016, 170, 83–90. [Google Scholar] [CrossRef]
  3. Jiang, S.S.; Li, J.M. Exploring the motivation and effect of government-enterprise collusion in the utilization of marine resources: Evidence from China’s coastal areas. Ocean Coast. Manag. 2021, 212, 105822. [Google Scholar] [CrossRef]
  4. Singh, A. Managing the environmental problem of seawater intrusion in coastal aquifers through simulation–optimization modeling. Ecol. Indic. 2015, 48, 498–504. [Google Scholar] [CrossRef]
  5. Cordell, J. Social Marginality and Sea Tenure in Bahia: A Sea of Small Boats; Cultural Survival: Cambridge, MA, USA, 1989; pp. 125–151. [Google Scholar]
  6. Costanza, R.; Andrade, F.; Antunes, P.; den Belt, M.; Boersma, D.; Boesch, D.F.; Catarino, F.; Hanna, S.; Limburg, K.; Low, B.; et al. Principles for Sustainable Governance of the Oceans. Science 1998, 281, 198–199. [Google Scholar] [CrossRef]
  7. García-Ayllón, S. New Strategies to Improve Co-Management in Enclosed Coastal Seas and Wetlands Subjected to Complex Environments: Socio-Economic Analysis Applied to an International Recovery Success Case Study after an Environmental Crisis. Sustainability 2019, 11, 1039. [Google Scholar] [CrossRef] [Green Version]
  8. Bonsignore, M.; Salvagio Manta, D.; Al-Tayeb Sharif, E.A.; D’Agostino, F.; Traina, A.; Quinci, E.M.; Giaramita, L.; Monastero, C.; Benothman, M.; Sprovieri, M. Marine pollution in the Libyan coastal area: Environmental and risk assessment. Mar. Pollut. Bull. 2018, 128, 340–352. [Google Scholar] [CrossRef]
  9. Fujita, R.; Lynham, J.; Micheli, F.; Feinberg, P.G.; Bourillón, L.; Sáenz-Arroyo, A.; Markham, A.C. Ecomarkets for conservation and sustainable development in the coastal zone. Biol. Rev. 2013, 88, 273–286. [Google Scholar] [CrossRef]
  10. Scherner, F.; Horta, P.A.; Oliveira, E.; Simonassi, J.C.; Hall-Spencer, J.M.; Chow, F.; Nunes, J.M.C.; Pereira, S. Coastal urbanization leads to remarkable seaweed species loss and community shifts along the SW Atlantic. Mar. Pollut. Bull. 2013, 76, 106–115. [Google Scholar] [CrossRef] [Green Version]
  11. Sesli, F.A. Mapping and monitoring temporal changes for coastline and coastal area by using aerial data images and digital photogrammetry: A case study from Samsun, Turkey. Int. J. Phys. Sci. 2010, 5, 1567–1575. [Google Scholar]
  12. Nicholls, R.J. Coastal flooding and wetland loss in the 21st century: Changes under the SRES climate and socio-economic scenarios. Glob. Environ. Chang. 2004, 14, 69–86. [Google Scholar] [CrossRef]
  13. Zhu, G.; Xu, X.; Ma, Z.; Xu, L.; Porter, J.H. Spatial Dynamics and Zoning of Coastal Land-Use Change along Bohai Bay, China, during 1979–2008. J. Coast. Res. 2012, 28, 1186–1196. [Google Scholar]
  14. Zhu, G.; Xie, Z.; Xu, X.; Ma, Z.; Wu, Y. The landscape change and theory of orderly reclamation sea based on coastal management in rapid industrialization area in Bohai Bay, China. Ocean. Coast. Manag. 2016, 133, 128–137. [Google Scholar] [CrossRef]
  15. Islam, M.S.; Tanaka, M. Impacts of pollution on coastal and marine ecosystems including coastal and marine fisheries and approach for management: A review and synthesis. Mar. Pollut. Bull. 2004, 48, 624–649. [Google Scholar] [CrossRef]
  16. Forchino, A.; Borja, A.; Brambilla, F.; Rodriguez, J.G.; Muxika, I.; Terova, G.; Saroglia, M. Evaluating the influence of off-shore cage aquaculture on the benthic ecosystem in Alghero Bay (Sardinia, Italy) using AMBI and M-AMBI. Ecol. Indic. 2011, 11, 1112–1122. [Google Scholar] [CrossRef]
  17. Xu, N.; Gao, Z.; Ning, J. Analysis of the characteristics and causes of coastline variation in the Bohai Rim (1980–2010). Environ. Earth Sci. 2016, 75, 719. [Google Scholar] [CrossRef]
  18. Kahn, J.G. Coastal Occupation at the GS-1 Site, Cook’s Bay, Mo’orea, Society Islands. J. Pac. Archaeol. 2012, 3, 52–61. [Google Scholar]
  19. Wu, X.Q.; Gao, M.; Wang, D.; Wang, Y.; Lu, Q.S.; Zhang, Z.D. Framework and practice of integrated coastal zone management in Shandong Province, China. Ocean. Coast. Manag. 2012, 69, 58–67. [Google Scholar] [CrossRef]
  20. Geng, R.; Liu, X.; Lv, X.; Gao, Z.; Xu, N. Comparing cost-effectiveness of paddy fields and seawalls for coastal protection to reduce economic damage of typhoons in China. Ecosyst. Serv. 2021, 47, 101232. [Google Scholar] [CrossRef]
  21. Huang, C.; Zhang, C.; Liu, Q.; Wang, Z.; Li, H.; Liu, G. Land reclamation and risk assessment in the coastal zone of China from 2000 to 2010. Reg. Stud. Mar. Sci. 2020, 39, 101422. [Google Scholar] [CrossRef]
  22. Ma, T.; Li, X.; Bai, J.; Cui, B. Habitat modification in relation to coastal reclamation and its impacts on waterbirds along China’s coast. Glob. Ecol. Conserv. 2019, 17, e00585. [Google Scholar] [CrossRef]
  23. Liu, H.; Jezek, K.C. Automated extraction of coastline from satellite imagery by integrating Canny edge detection and locally adaptive thresholding methods. Int. J. Remote Sens. 2004, 25, 937–958. [Google Scholar] [CrossRef]
  24. Xu, N.; Wang, Y.; Huang, C.; Jiang, S.; Jia, M.; Ma, Y. Monitoring coastal reclamation changes across Jiangsu Province during 1984–2019 using landsat data. Mar. Policy 2022, 136, 104887. [Google Scholar] [CrossRef]
  25. Wu, W.; Yang, Z.; Tian, B.; Huang, Y.; Zhou, Y.; Zhang, T. Impacts of coastal reclamation on wetlands: Loss, resilience, and sustainable management. Estuar. Coast. Shelf Sci. 2018, 210, 153–161. [Google Scholar] [CrossRef]
  26. Zhu, X.; Xiang, S. Assessing coastal reclamation suitability based on a fuzzy-AHP comprehensive evaluation framework: A case study of Lianyungang, China. Mar. Pollut. Bull. 2014, 89, 102–111. [Google Scholar]
  27. Song, D.; Wang, X.H.; Zhu, X.; Bao, X. Modeling studies of the far-field effects of tidal flat reclamation on tidal dynamics in the East China Seas. Estuar. Coast. Shelf Sci. 2013, 133, 147–160. [Google Scholar] [CrossRef]
  28. Tian, P.; Li, J.; Cao, L.; Pu, R.; Gong, H.; Liu, Y.; Zhang, H.; Chen, H. Impacts of reclamation derived land use changes on ecosystem services in a typical gulf of eastern China: A case study of Hangzhou bay. Ecol. Indic. 2021, 132, 108259. [Google Scholar] [CrossRef]
  29. Jiang, S.; Xu, N.; Li, Z.; Huang, C. Satellite derived coastal reclamation expansion in China since the 21st century. Glob. Ecol. Conserv. 2021, 30, e01797. [Google Scholar] [CrossRef]
  30. Yang, M.; Yang, T.; Zhang, L.; Lin, J.; Qin, X.; Liao, M. Spatio-Temporal Characterization of a Reclamation Settlement in the Shanghai Coastal Area with Time Series Analyses of X-, C-, and L-Band SAR Datasets. Remote Sens. 2018, 10, 329. [Google Scholar] [CrossRef] [Green Version]
  31. Jin, Y.; Yang, W.; Sun, T.; Yang, Z.; Li, M. Effects of seashore reclamation activities on the health of wetland ecosystems: A case study in the Yellow River Delta, China. Ocean. Coast. Manag. 2016, 123, 44–52. [Google Scholar] [CrossRef] [Green Version]
  32. Peng, B.; Lin, C.; Jin, D.; Rao, H.; Jiang, Y.; Liu, Y. Modeling the total allowable area for coastal reclamation: A case study of Xiamen, China. Ocean. Coast. Manag. 2013, 76, 38–44. [Google Scholar] [CrossRef]
  33. Choi, Y.R. Modernization, Development and Underdevelopment: Reclamation of Korean tidal flats, 1950s–2000s. Ocean. Coast. Manag. 2014, 102, 426–436. [Google Scholar] [CrossRef]
  34. Bao, J.L.; Gao, S. Environmental characteristics and land-use pattern changes of the Old Huanghe River delta, eastern China, in the sixteenth to twentieth centuries. Sustain. Sci. 2016, 11, 695–709. [Google Scholar] [CrossRef]
  35. Grip, K.; Blomqvist, S. Marine spatial planning: Coordinating divergent marine interests. Ambio 2021, 50, 1172–1183. [Google Scholar] [CrossRef]
  36. Hovik, S.; Stokke, K.B. Balancing aquaculture with other coastal interests: A study of regional planning as a tool for ICZM in Norway. Ocean. Coast. Manag. 2007, 50, 887–904. [Google Scholar] [CrossRef]
  37. Bryant, B.C. The Regional Marine Research-Program (RMRP)—A new approach to marine research planning. Coast. Manag. 1993, 21, 327–332. [Google Scholar] [CrossRef]
  38. Marcucci, D.J.; Brinkley, J.D.; Jordan, L.M. A Case for Coastal Theory with Lessons from Planning Theory. Coast. Manag. 2012, 40, 401–420. [Google Scholar] [CrossRef]
  39. Yue, Q.; Zhao, M.; Yu, H.M.; Xu, W.; Ou, L. Total quantity control and intensive management system for reclamation in China. Ocean. Coast. Manag. 2016, 120, 64–69. [Google Scholar] [CrossRef]
  40. Zhang, Q.X.; Zhang, L.J.; Li, Y.Y. Exploring the Path of Regional Eco-Compensation under the Coordination of Man-land Relationship Perspective. Disaster Adv. 2012, 5, 31–36. [Google Scholar]
  41. Lin, Y.H.; Huang, F.M.; Zhang, Y.; Wang, Q.; Huang, J.L.; Chen, Q.M.; Xue, X.Z. An Improved Framework of Marine Major Function-Oriented Zoning in Advancing Ecosystem-Based Management. J. Mar. Sci. Eng. 2022, 10, 684. [Google Scholar] [CrossRef]
  42. Mangi, S.C.; Austen, M.C. Perceptions of stakeholders towards objectives and zoning of marine-protected areas in southern Europe. J. Nat. Conserv. 2008, 16, 271–280. [Google Scholar] [CrossRef]
  43. Ortiz-Lozano, L.; Espejel, I.; Granados-Barba, A.; Arceo, P. A functional and integrated approach of methods for the management of protected marine areas in the Mexican Coastal Zone. Ocean. Coast. Manag. 2007, 50, 379–391. [Google Scholar] [CrossRef]
  44. Bremer, S.; Glavovic, B. Exploring the science–policy interface for Integrated Coastal Management in New Zealand. Ocean. Coast. Manag. 2013, 84, 107–118. [Google Scholar] [CrossRef]
  45. Willsteed, E.A.; Birchenough, S.N.R.; Gill, A.B.; Jude, S. Structuring cumulative effects assessments to support regional and local marine management and planning obligations. Mar. Policy 2018, 98, 23–32. [Google Scholar] [CrossRef] [Green Version]
  46. Davies, K.; Fisher, K.; Foley, M.; Greenaway, A.; Hewitt, J.; Le Heron, R.; Mikaere, H.; Ratana, K.; Spiers, R.; Lundquist, C. Navigating collaborative networks and cumulative effects for Sustainable Seas. Environ. Sci. Policy 2018, 83, 22–32. [Google Scholar] [CrossRef]
  47. Halpern, B.S.; Walbridge, S.; Selkoe, K.A.; Kappel, C.V.; Micheli, F.; D’Agrosa, C.; Bruno, J.F.; Casey, K.S.; Ebert, C.; Fox, H.E. A global map of human impact on marine ecosystems. Science 2008, 319, 948–952. [Google Scholar] [CrossRef] [Green Version]
  48. Halpern, B.S.; Frazier, M.; Potapenko, J.; Casey, K.S.; Walbridge, S. Spatial and temporal changes in cumulative human impacts on the world’s ocean. Nat. Commun. 2015, 6, 7615. [Google Scholar] [CrossRef] [Green Version]
  49. Cao, W.; Zhang, H.; Li, R. Change characters of coastline and tidal flat in the islands with different principle functions in the Zhoushan Archipelago from 1986 to 2017. J. Mar. Sci. 2022, 39, 123–131. [Google Scholar]
  50. Qiu, L.; Zhang, M.; Zhou, B.; Cui, Y.; Yu, Z.; Liu, T.; Wu, S. Economic and ecological trade-offs of coastal reclamation in the Hangzhou Bay, China. Ecol. Indic. 2021, 125, 107477. [Google Scholar] [CrossRef]
  51. Sun, F.; Ye, C. Modeling of the Ecological Carrying Index of reclaimed land in coastal city: A sustainable marine ecology perspective. Environ. Res. 2021, 201, 111612. [Google Scholar] [CrossRef]
  52. Meng, W.; Hu, B.; He, M.; Liu, B.; Mo, X.; Li, H.; Wang, Z.; Zhang, Y. Temporal-spatial variations and driving factors analysis of coastal reclamation in China. Estuar. Coast. Shelf Sci. 2017, 191, 39–49. [Google Scholar] [CrossRef]
  53. Jongman, R.H.G.; Külvik, M.; Kristiansen, I. European ecological networks and greenways. Landsc. Urban Plan. 2004, 68, 305–319. [Google Scholar] [CrossRef]
  54. Ju, H.; Niu, C.; Zhang, S.; Jiang, W.; Zhang, Z.; Zhang, X.; Yang, Z.; Cui, Y. Spatiotemporal patterns and modifiable areal unit problems of the landscape ecological risk in coastal areas: A case study of the Shandong Peninsula, China. J. Clean. Prod. 2021, 310, 127522. [Google Scholar] [CrossRef]
  55. Feinman, G.M.; Fang, H.; Nicholas, L.M. Coastal Shandong, China: The longue durée. J. Anthropol. Archaeol. 2019, 55, 101076. [Google Scholar] [CrossRef]
  56. Chen, Y.; Chen, A.; Zhang, D. Evaluation of resources and environmental carrying capacity and its spatial-temporal dynamic evolution: A case study in Shandong Province, China. Sustain. Cities Soc. 2022, 82, 103916. [Google Scholar] [CrossRef]
  57. Yu, L.; Wu, X.; Zheng, X.; Zheng, T.; Xin, J.; Walther, M. An index system constructed for ecological stress assessment of the coastal zone: A case study of Shandong, China. J. Environ. Manag. 2019, 232, 499–504. [Google Scholar] [CrossRef]
  58. Liu, Y.; Hou, X.; Li, X.; Song, B.; Wang, C. Assessing and predicting changes in ecosystem service values based on land use/cover change in the Bohai Rim coastal zone. Ecol. Indic. 2020, 111, 106004. [Google Scholar] [CrossRef]
  59. Shen, C.; Shi, H.; Zheng, W.; Li, F.; Peng, S.; Ding, D. Study on the cumulative impact of reclamation activities on ecosystem health in coastal waters. Mar. Pollut. Bull. 2016, 103, 144–150. [Google Scholar] [CrossRef]
  60. Lu, L.; Qureshi, S.; Li, Q.; Chen, F.; Shu, L. Monitoring and projecting sustainable transitions in urban land use using remote sensing and scenario-based modelling in a coastal megacity. Ocean. Coast. Manag. 2022, 224, 106201. [Google Scholar] [CrossRef]
  61. State Oceanic Administration. Sea Area Use Classification System; China Standards Press: Beijing, China, 2020. [Google Scholar]
  62. Shalaby, A.; Tateishi, R. Remote sensing and GIS for mapping and monitoring land cover and land-use changes in the Northwestern coastal zone of Egypt. Appl. Geogr. 2007, 27, 28–41. [Google Scholar] [CrossRef]
  63. Wilkins, D.E.; Ford, R.L. Nearest neighbor methods applied to dune field organization: The Coral Pink Sand Dunes, Kane County, Utah, USA. Geomorphology 2007, 83, 48–57. [Google Scholar] [CrossRef]
  64. Fang, Q.; Zhu, S.; Ma, D.; Zhang, L.; Yang, S. How effective is a marine spatial plan: An evaluation case study in China. Ecol. Indic. 2019, 98, 508–514. [Google Scholar] [CrossRef]
  65. Abdullah Al, M.; Akhtar, A.; Rahman, M.F.; Kamal, A.H.M.; Karim, N.U.; Hassan, M.L. Habitat structure and diversity patterns of seaweeds in the coastal waters of Saint Martin’s Island, Bay of Bengal, Bangladesh. Reg. Stud. Mar. Sci. 2020, 33, 100959. [Google Scholar] [CrossRef]
  66. Qi, W.; Abel, G.J.; Liu, S. Geographic transformation of China’s internal population migration from 1995 to 2015: Insights from the migration centerline. Appl. Geogr. 2021, 135, 102564. [Google Scholar] [CrossRef]
  67. Saaty, T.L. A scaling method for priorities in hierarchical structures. J. Math. Psychol. 1977, 15, 234–281. [Google Scholar] [CrossRef]
  68. Kundu, S.; Khare, D.; Mondal, A. Landuse change impact on sub-watersheds prioritization by analytical hierarchy process (AHP). Ecol. Inform. 2017, 42, 100–113. [Google Scholar] [CrossRef]
  69. Saaty, T.L. How to make a decision: The analytic hierarchy process. Eur. J. Oper. Res. 1990, 48, 9–26. [Google Scholar] [CrossRef]
  70. Wang, X.; Yan, F.; Su, F. Changes in coastline and coastal reclamation in the three most developed areas of China, 1980–2018. Ocean. Coast. Manag. 2021, 204, 105542. [Google Scholar] [CrossRef]
  71. Hu, X.; Wang, Y. Monitoring coastline variations in the Pearl River Estuary from 1978 to 2018 by integrating Canny edge detection and Otsu methods using long time series Landsat dataset. Catena 2022, 209, 105840. [Google Scholar] [CrossRef]
  72. Miao, D.; Xue, Z. The current developments and impact of land reclamation control in China. Mar. Policy 2021, 134, 104782. [Google Scholar] [CrossRef]
  73. Albotoush, R.; Tan Shau-Hwai, A. An authority for marine spatial planning (MSP): A systemic review. Ocean. Coast. Manag. 2021, 205, 105551. [Google Scholar] [CrossRef]
  74. Finke, G.; Gee, K.; Gxaba, T.; Sorgenfrei, R.; Russo, V.; Pinto, D.; Nsiangango, S.E.; Sousa, L.N.; Braby, R.; Alves, F.L.; et al. Marine Spatial Planning in the Benguela Current Large Marine Ecosystem. Environ. Dev. 2020, 36, 100569. [Google Scholar] [CrossRef] [PubMed]
  75. Pataki, Z.; Kitsiou, D. Marine Spatial Planning: Assessment of the intensity of conflicting activities in the marine environment of the Aegean Sea. Ocean. Coast. Manag. 2022, 220, 106079. [Google Scholar] [CrossRef]
  76. Hou, Y.; Xue, X.; Liu, C.; Xin, F.; Lin, Y.; Wang, S. Marine Spatial Planning Scheme evaluation based on the conflict analysis system—A case study in Xiamen, China. Ocean. Coast. Manag. 2022, 221, 106119. [Google Scholar] [CrossRef]
  77. Zhang, L.J. Simulation of water exchange in Jiaozhou Bay by average residence time approach. Estuar. Coast. Shelf Sci. 2004, 61, 25–35. [Google Scholar]
  78. Yuan, Y.; Jalón-Rojas, I.; Wang, X.H. Response of water-exchange capacity to human interventions in Jiaozhou Bay, China. Estuar. Coast. Shelf Sci. 2021, 249, 107088. [Google Scholar] [CrossRef]
  79. Li, X.; Chen, L.; Zhou, Z.; Li, B.; Liu, X.; Yang, L.; Liu, B.; Song, B. Spatio-temporal variation of subtidal macrobenthic fauna and the ecological assessment of Longkou Artificial Island construction in Bohai Sea, China. J. Oceanol. Limnol. 2020, 38, 1811–1824. [Google Scholar] [CrossRef]
  80. Wang, X.; Xiao, X.; Zou, Z.; Hou, L.; Qin, Y.; Dong, J.; Doughty, R.B.; Chen, B.; Zhang, X.; Chen, Y.; et al. Mapping coastal wetlands of China using time series Landsat images in 2018 and Google Earth Engine. ISPRS J. Photogramm. Remote Sens. 2020, 163, 312–326. [Google Scholar] [CrossRef]
  81. Li, F.; Ding, D.; Chen, Z.; Chen, H.; Shen, T.; Wu, Q.; Zhang, C. Change of sea reclamation and the sea-use management policy system in China. Mar. Policy 2020, 115, 103861. [Google Scholar] [CrossRef]
  82. Lu, D.; Tian, H.; Zhou, G.; Ge, H. Regional mapping of human settlements in southeastern China with multisensor remotely sensed data. Remote Sens. Environ. 2008, 112, 3668–3679. [Google Scholar] [CrossRef]
  83. Proville, J.; Zavala-Araiza, D.; Wagner, G. Night-time lights: A global, long term look at links to socio-economic trends. PLoS ONE 2017, 12, e0174610. [Google Scholar] [CrossRef] [PubMed] [Green Version]
  84. Chen, X.; Nordhaus, W.D. VIIRS Nighttime Lights in the Estimation of Cross-Sectional and Time-Series GDP. Remote Sens. 2019, 11, 1057. [Google Scholar] [CrossRef] [Green Version]
Figure 1. Geographical location of the Shandong Province.
Remotesensing 14 03822 g001
Figure 2. Reclamation maps in Shandong coastal area based on remote sensing techniques.
Remotesensing 14 03822 g002
Figure 3. Reclamation area (a) and its average annual increase in the study area from 1974 to 2021 (b).
Remotesensing 14 03822 g003
Figure 4. The evaluation results (a) and trends of the intensity of reclamation activity (RAI) in the study area (b).
Remotesensing 14 03822 g004
Figure 5. Spatial distribution of sub-indexes in different cities. The structural scale of reclamation index (RSSI), spatial characteristics of reclamation index (RSCI), and coordination of marine utilization index (MUCI) are the weighted values.
Remotesensing 14 03822 g005
Figure 6. Distribution of conflict areas between reclamation activities and marine spatial planning.
Remotesensing 14 03822 g006
Table 1. Definitions and interpretation signs of typical reclamation activities.
Reclamation ActivitiesDefinitions [61]Interpretation SignsExamples
Enclosed maricultureEmbankment to enclose offshore area for closed or semi-closed mariculture.Mostly in regular long strips; the embankment is white, and the inside area is dark blue-green. Remotesensing 14 03822 i001
SalternEnclosed or infilled area used for salt production, including salt flats, salt pans, etc.Neatly arranged rectangles with a high density; the color in images is gray-brown or white-green. Remotesensing 14 03822 i002
Fishery infrastructureEnclosed or infilled area used for breeding important germplasm resources or for fishing boat docking/loading/unloading/sheltering from wind.Grayish-white piers with long strips extend into the sea, and sometimes culture ponds are distributed nearby. Remotesensing 14 03822 i003
Coastal industrial constructionEnclosed or infilled area used for industrial production, including shipbuilding industry, electric power generation, etc.Gray-white, with low density of internal buildings, distribution of dome-shaped or block-shaped workshops. Remotesensing 14 03822 i004
Tourism infrastructureFacilities built to meet the needs of coastal recreational activities.Mostly gray-white/dark green /blue-black strips along the coast and generally having regular roads and greening. Remotesensing 14 03822 i005
PortCargo/passenger terminals for ship docking/loading/unloading/sheltering/maneuvering.Dark brown or bright white blocks are widely distributed, and the wharf extends into the sea in the form of a large rectangle. Remotesensing 14 03822 i006
UrbanizationBuilding towns (e.g., industrial parks, urban parks, etc.) through infilling of the offshore area via embanking and filling.Neatly arranged buildings with a high density; the color in the image is taupe or dark red with shadows caused by high buildings. Remotesensing 14 03822 i007
OthersEnclosed or infilled areas used for other purposes, including coastal protection engineering and reservoirs.Gray-white strip-shaped dikes on the periphery of non-functional closed or semi-closed waters. Remotesensing 14 03822 i008
Unused infilled reclamation areaInfilled reclamation construction in progress or completed but not developed.Smooth gray texture, similar to sand. Remotesensing 14 03822 i009
Unused enclosed reclamation areaEnclosed reclamation construction in progress or completed but not developed.White embankment with dark blue-green interior area but not irregularly arranged in long strips. Remotesensing 14 03822 i010
Table 2. Quantitative evaluation index system for reclamation intensity and index weights.
Index NamePrimary IndexSecondary IndexPrimary WeightSecondary WeightIndex Attribute
Intensity of reclamation activitiesStructural scale of reclamationTotal reclamation scale (TRS)0.4930.138+
Reclamation rate (RRT)0.301+
Infilled reclamation proportion (IRP)0.210+
Reclamation intensity per unit coastline (CRI)0.262+
Diversity of reclamation activities (RAD)0.089+
Spatial characteristics of reclamationSpatial equilibrium of reclamation (RSE)0.1960.413
Spatial concentration of reclamation (RSC)0.327+
Center migration rate of reclamation (RCR)0.260+
Coordination of marine utilizationCoordination of reclamation activities (RAC)0.3110.429
Compliance with marine spatial planning (MSC)0.230
Coordination of marine ecological protection (MPC)0.194
Natural coastline retention rate (NCR)0.147
Table 3. Coordination and compliance coefficient of reclamation and marine spatial planning zones.
Coordination Coefficient in RAC (Cii’)Compliance Coefficient in MSC (Cif)
EMSAFIPOCIURTIOTIUEUAFZPSZIUZMEZTRZMCZSUZMRZ
EM313123332232222221
SA32133332212331121
FI3223223312212121
PO333232223222121
CI33333212321111
UR3333312322121
TI333322223222
OT33332322222
IU3212313111
EU332322121
Abbreviations: RAC—coordination of reclamation activities, MSC—compliance with marine spatial planning, EM—enclosed mariculture, SA—saltern, FI—fishery infrastructure, PO—port, CI—coastal industrial construction, UR—urbanization, TI—tourism infrastructure, OT—others, IU—unused infilled reclamation area, EU—unused enclosed reclamation area. AFZ—agriculture and fishery zone, PSZ—port shipping zone, IUZ—industrial and urban sea zone, MEZ—minerals and energies zone, TRZ—tourism and recreation zone, MCZ—marine conservation zone, SUZ—special utilization zone, MRZ—marine reserved zone.
Table 4. Statistics on the rate of natural coastline occupation by different reclamation activities (Unit: km/a).
1974–19901990–20002000–20072007–20172017–2021
Enclosed mariculture17.05414.95519.8906.8742.218
Saltern1.4621.4284.6921.5030
Fishery infrastructure0.0350.1230.2560.6930.075
Coastal industrial construction0.3720.3211.0020.6550.222
Tourism infrastructure0.0620.0750.4650.4590.023
Port0.1100.1710.2860.8000
Urbanization0.1510.06700.2630
Others0.9810.1920.0550.4670
Unused infilled reclamation area0.2430.0571.2351.6180.064
Unused enclosed reclamation area0.78400.08800
Table 5. Statistics on conflict ratio of reclamation activities in different marine spatial planning zones (Unit: %).
Marine Reserved ZonesMarine Conservation ZonesMinerals and Energies ZonesTourism and Recreation ZonesSpecial Utilization Zones
20074.7872.6150.1510.5070.046
20174.5002.6000.1210.1610.042
20214.4981.8780.0350.0840.042
Table 6. Statistics of reclamation areas in bays, the total reclamation area in the study area, and the proportion of reclaimed area in bays.
Unit197419902000200720172021
Reclamation area in bays104 ha2.02913.06915.24919.35523.01222.989
Total reclamation area in the study area104 ha3.45021.12227.92137.81546.43546.487
Proportion of reclaimed area in bays%58.8161.8754.6251.1849.5649.45
Publisher’s Note: MDPI stays neutral with regard to jurisdictional claims in published maps and institutional affiliations.

