Article

Performance Evaluation of Six Gridded Precipitation Products throughout Iran Using Ground Observations over the Last Two Decades (2000–2020)

1
Department of Photogrammetry and Remote Sensing, Faculty of Geodesy and Geomatic Engineering, K. N. Toosi University of Technology, Tehran 19967-15433, Iran
2
Department of Technology and Society, Faculty of Engineering, Lund University, P.O. Box 118, SE-221 00 Lund, Sweden
3
Department of Physical Geography and Ecosystem Science, Lund University, SE-223 62 Lund, Sweden
*
Author to whom correspondence should be addressed.
Remote Sens. 2022, 14(15), 3783; https://doi.org/10.3390/rs14153783
Submission received: 6 July 2022 / Revised: 2 August 2022 / Accepted: 3 August 2022 / Published: 6 August 2022
(This article belongs to the Special Issue Remote Sensing of Precipitation: Part III)

Abstract

:
Precipitation, as an important component of the Earth’s water cycle, plays a determinant role in various socio-economic practices. Consequently, having access to high-quality and reliable precipitation datasets is highly demanded. Although Gridded Precipitation Products (GPPs) have been widely employed in different applications, the lack of quantitative assessment of GPPs is a critical concern that should be addressed. This is because the inherent errors in GPPs would propagate into any models in which precipitation values are incorporated, introducing uncertainties into the final results. This paper aims to quantify the capability of six well-known GPPs (TMPA, CHIRPS, PERSIANN, GSMaP, IMERG, and ERA5) at multiple time scales (daily, monthly, and yearly) using in situ observations (over 1.7 million) throughout Iran over the past two decades (2000–2020). Both continuous and categorical metrics were implemented for precipitation intensity and occurrence assessment based on the point-to-pixel comparison approach. Although all metrics did not support the superior performance of any specific GPP, taking all investigations into account, the findings suggested the better performance of the Global Satellite Mapping of Precipitation (GSMaP) in estimating daily precipitation (CC = 0.599, RMSE = 3.48 mm/day, and CSI = 0.454). Based on the obtained continuous metrics, all the GPPs had better performances in dry months, while this did not hold for the categorical metrics. The validation at the station level was also carried out to present the spatial characteristics of errors throughout Iran, indicating higher overestimation/underestimation in regions with higher precipitation rates. The validation analysis over the last two decades illustrated that the GPPs had stable performances, and no improvement was seen, except for the GSMaP, in which its bias error was significantly reduced. The comparisons on monthly and yearly time scales suggested the higher accuracy of monthly and yearly averaged precipitation values than accumulated values. Our study provides valuable guidance to the selection and application of GPPs in Iran and also offers beneficial feedback for further improving these products.

1. Introduction

Precipitation is a crucial component of the Earth’s water cycle, associated with atmospheric circulation in weather and climate studies [1]. Furthermore, precipitation is an essential determinant of a variety of socio-economic practices, including hydrological modeling [2,3], hydro-electric power generation [4], drought detection and monitoring [5], flood prediction and modeling [6], and food security [7]. Consequently, the availability of accurate and reliable precipitation data is of significant importance in supporting the successful execution of these practices. Conventionally, precipitation data were only collected using in situ instruments, such as rain gauges, synoptic stations, and ground-based radar. Although these observations, as the most intuitive method, provide the most accurate precipitation data due to their direct physical measurement, they include several limitations that may hamper our understanding of various climate events [8]. In particular, in situ measurements suffer from a sparse and uneven distribution, incomplete areal coverage, and recording sequence discontinuities [9,10]. The aforementioned limitations could result in an inadequate spatial and temporal representation of precipitation patterns, especially in remote regions and areas with a complex terrain [11,12]. Additionally, the high cost associated with installing and consistently maintaining accurate ground stations makes it almost impractical to establish a very high-density network with a suitable spatial distribution. Accordingly, the utility of other technologies and datasets that could potentially address these limitations should be on the agenda.
More recently, different Gridded Precipitation Products (GPPs) have emerged, satisfying the requirements and resolving previous limitations that could suitably support a variety of applications. These GPPs, covering regional and global scales with consistent and various spatial and temporal resolutions, have been developed from (1) in situ measurements, (2) numerical models, (3) satellite data, and (4) a combination of different sources [13]. Among these data sources, the advancement of infrared and microwave sensors onboard satellites has significantly contributed toward retrieving precipitation estimates with homogenous spatial and temporal characteristics. For instance, the Tropical Rainfall-Measuring Mission Multi-satellite Precipitation Analysis (TMPA) [14], the Global Satellite Mapping of Precipitation (GSMaP) [15], and the Precipitation Estimation from Remotely Sensed Information using Artificial Neural Networks (PERSIANN) [16] are among the widely used satellite-based GPPs. Additionally, the combination of various data sources, such as the integration of satellite data with in situ measurements (i.e., for calibration and adjustment) and data assimilation through the atmospheric reanalysis/modeling of climate data, generally have enhanced the performance of the GPPs [17,18,19].
Due to their consistent spatial and temporal resolutions, these GPPs have been employed globally by a range of researchers for a wide variety of applications [20,21,22]. For instance, GPPs were employed for drought monitoring [23,24], flood prediction and modeling [6,25], water resource management [26], stream-flow estimation [27,28], and trend analysis [29,30]. However, the discrepancies between different GPPs, affected by different sensor types, algorithm principles, assimilation methods, and input data sources, necessitate the performance evaluation [9,31]. Performance evaluation is a prerequisite to guarantee success in different studies as it notably depends on the accuracy of GPPs [9]. Therefore, many studies have been carried out to investigate the accuracy of different GPPs in different time scales using in situ observations [6,13,32,33,34,35,36,37,38,39,40,41,42]. For instance, Tang et al. [35] examined the performance of ten satellite-based and reanalysis GPPs throughout China between 2000 and 2018 on different time scales. They reported that the GSMaP precipitation products outperformed other GPPs, followed by the Integrated Multi-satellitE Retrieval for Global Precipitation Measurement (IMERG). Moreover, Boluwade [6] assessed the performance of four GPPs using in situ observations from the Trans-African Hydro-Meteorological Observatory (TAHMO) over the eastern (i.e., Uganda) and western (i.e., Ghana) parts of Africa. The evaluations were conducted in various time scales, revealing weak performances of all examined GPPs in capturing daily precipitation patterns, but better performances on monthly and seasonal scales. Moreover, Sharma et al. [40] compared the accuracy of four Global Precipitation Measurement (GPM)-based GPPs over the southern slopes of the central Himalayas between March 2014 and December 2016. The statistical analyses indicated that the GSMaP gauge-adjusted GPP obtained higher accuracy, and the gauge-adjusted GPPs in general performed consistently well at representing seasonal dynamics.
As in other parts of the world, GPPs have been employed for different purposes in Iran [24,43,44,45,46]. Consequently, several studies were devoted to comparing and evaluating the accuracy of different GPPs in Iran [43,45,47,48,49,50,51,52,53,54,55,56,57,58]. For example, Moazami et al. [57] investigated the performance of four high-resolution GPPs over six regions in Iran during a 5-year period (2003–2008). Overall, they discovered that the TRMM Multi-sensor Precipitation Analysis (TMPA) 3B42V7 led to better performance over three other GPPs (i.e., PERSIANN, TMPA-3B42RT, and the Climate Prediction Center Morphing technique (CMORPH)). In another study, Maghsood et al. [55] conducted a thorough accuracy analysis of different IMERG GPPs over Iran between 2014 and 2017. The intercomparison with in situ precipitation observations suggested a discrepant performance of IMERG products. In particular, they reported that, on average, the performances improved from IMERG-early to IMERG-final products, while it was recommended not to rely on IMERG-final products for extreme precipitations. Likewise, Mosaffa et al. [58] explored the capability of six GPPs, namely, Climate Hazards Group Infrared Precipitation with Station data (CHIRPS), CMORPH, PERSIANN, PERSIANN Climate Data Record (PERSIANN-CDR), TRMM 3B42V7, and Soil Moisture inversion to RAIN (SM2RAIN) in Karkheh Basin between 2003 and 2014. They incorporated in situ precipitation observations from 28 stations, and both continuous and categorical analyses specified low variation in the performance of all GPPs. However, considering all investigations, it was stated that the PERSIANN-CDR and SM2RAIN showed the best performance as post-satellite precipitation estimates. Furthermore, [51] employed in situ observations from 344 stations to assess the capability of three GSMaP GPPs in Iran between 2014 and 2018. It was stated that all three versions of GSMaP were capable of displaying the spatial pattern of precipitation. However, findings demonstrated the higher accuracy of the GSMaP gauge-adjusted type at daily and monthly time scales. Although different studies were carried out to evaluate the performance of GPPs in Iran, each focused on a relatively small area (i.e., province or basin) or investigated one or two different GPPs. The other studies incorporated a small number of stations or considered a short period for comparisons and performance evaluation. These factors make it impractical to compare GPPs when considering the entirety of Iran, necessitating a consistent intercomparison of different well-known and recent GPPs.
In light of the preceding, the aim of this paper is to evaluate the performance and capability of six satellite and reanalysis GPPs throughout Iran using in situ observations. In particular, this paper aims to evaluate GPPs by considering: (1) widely used and recent GPPs with demonstrated satisfactory accuracies (i.e., based on the literature) in a consistent framework, (2) a large number of synoptic stations, as the source of in situ observations, spreading throughout Iran, and (3) a long-term period (over two decades) for comparison, which were not considered in the previous studies simultaneously. The evaluations were performed using daily observations on daily, monthly (i.e., daily observations in each month between 2000 and 2020), and annual (i.e., daily observations in each year between 2000 and 2020) time scales based on both continuous and categorical metrics. Furthermore, daily data were aggregated to compute the accumulated and average monthly and annual precipitation data, enabling the examinations of GPPs in capturing the monthly and annual precipitation values. It is believed that these validations can elucidate the path for many other researchers in different disciplines in Iran to have an applied overview of the capability of the most recently used GPPs. Furthermore, these findings could also provide practical implications for other researchers incorporating GPPs into their studies in other parts of the world.

2. Study Area

Iran is the study area (see Figure 1a), which is located in the western part of Asia between latitudes and longitudes of 24–40°N and 44–64°E, respectively. Iran is the seventeenth largest country in the world, with an area of around 1.7 million km2. Iran is a mountainous country with two main mountain ranges, Alborz and Zagros, located in the country’s northern and western (spans from northwest to the southwest) parts, respectively. The southern border of Iran is formed by the coastal frontiers of the Persian Gulf and the Oman Sea, and the Caspian Sea is situated in the north of Iran. Moreover, the central parts of the country are covered by barren areas [59], particularly formed by two deserts named Dasht-e-Lut and Dasht-e-Kavir. Due to the massive latitudinal range of Iran, its climate varies from hyper-arid to very-humid climate zones with the dominant types of arid and semi-arid climate zones [60,61]. The geographical characteristics (i.e., topographic and latitudinal features) of Iran are the dominant factors of precipitation variations throughout the country (see Figure 1b; [62,63]). For instance, the annual accumulated precipitation varied between nearly 45 mm and 1950 mm for 2020 (calculated based on in situ data), representing high precipitation dynamics throughout the country. It has been reported that the western Mediterranean oscillation is the most influential source of precipitation in Iran [64]. Most parts of the country, i.e., arid and semi-arid climate zones, are characterized by low precipitations and high potential evapotranspiration. Additionally, Iran has experienced many climate extreme events, such as droughts and floods [65], emphasizing the significance of identifying accurate and reliable precipitation products. In this regard, reliable GPPs can be employed for monitoring and modeling tasks to promote informative management.

3. Datasets

3.1. Gridded Precipitation Products (GPPs)

Six widely used and recent GPPs, including five satellite precipitation datasets and one reanalysis dataset, were considered to identify the most accurate GPPs over Iran. It is worth noting that all mentioned data were downloaded from Google’s cloud computing platform, Google Earth Engine [66,67]. A brief description of each GPP is provided in the succeeding subsections.

3.1.1. Tropical Rainfall-Measuring Mission Multi-Satellite Precipitation Analysis (TMPA)

The Tropical Rainfall-Measuring Mission (TRMM) Multi-satellite Precipitation Analysis (TMPA) is among the first satellite-based GPPs with fine spatial resolution covering the globe (i.e., 50°S–50°N). This dataset includes precipitation estimates at a 0.25° × 0.25° latitude/longitude spatial resolution in a sub-daily (i.e., three hourly) time scale [14]. The TMPA incorporates precipitation estimates from various satellites, as well as in situ observations. Precipitation estimates are derived from the TRMM Microwave Imager, Special Sensor Microwave Imager, Advanced Microwave Scanning Radiometer-Earth Observing System, Advanced Microwave Sounding Unit-B, Geostationary Operational Environmental Satellite, and METEOSAT [14,68,69]. Precipitation estimates are then enhanced by the TRMM Precipitation Radar and in situ rain gauges from the Global Precipitation Climatological Center (GPCC). Further and detailed information about TMPA GPP can be found in [14]. In this study, TMPA precipitation data from 2000 to the end of 2019 were considered due to their unavailability in 2020.

3.1.2. Climate Hazard Group Infrared Precipitation with Stations (CHIRPS)

The Climate Hazards Group Infrared Precipitation with Stations (CHIRPS) provides quasi-global (50°S–50°N) daily precipitation estimates at a 0.05° × 0.05° latitude/longitude spatial resolution [70]. The CHIRPS algorithm integrates three different sources of data, including (1) the Climate Hazards group Precipitation climatology (CHPclim), (2) thermal infrared-based precipitation estimates from geostationary satellite observations, and (3) in situ rainfall observations generally from the Global Historical Climate Network (GHCN; [71,72]), the Global Summary of the Day (GSD), and Global Telecommunication System (GTS) datasets. With a latency of about three weeks, the final CHIRPS precipitation values are initially calculated at pentad and then converted to daily and monthly scales [70,73]. Further and detailed information about CHIRPS precipitation products can be found in Funk et al. [70]. In this study, CHIRPS precipitation data from 2000 to the end of 2020 were employed.

3.1.3. Precipitation Estimation from Remotely-Sensed Information Using Artificial Neural Networks (PERSIANN)

Precipitation Estimation from Remotely Sensed Information using Artificial Neural Network (PERSIANN)—the Climate Data Record (CDR) is a version of PERSIANN GPPs that provides daily quasi-global (60°S–60°N) observations at a 0.25° × 0.25° spatial resolution [16]. Hourly precipitation values are initially estimated by applying the PERSIANN algorithm [74] to high spatial and temporal cloud infrared images of the GridSat-B1, compiled by the International Satellite Cloud Climatology Project (ISCCP; [75]). Afterward, the hourly estimates are accumulated to generate monthly precipitation estimates at a 2.5° × 2.5° spatial resolution and then are enhanced through bias adjustment using the monthly Global Precipitation Climatology Project (GPCP) data. Finally, the bias-adjusted values are downscaled and converted to three hourly precipitation estimates. Additional information about the PERSIANN series and also PERSIANN-CDR can be found in Ashouri et al. [16]. In this study, PERSIANN-CDR (hereafter PERSIANN) precipitation data from 2000 to the end of 2020 were utilized for evaluation.

3.1.4. Global Satellite Mapping of Precipitation (GSMaP)

The Global Satellite Mapping of Precipitation (GSMaP) project, which began in 2002, intended to provide precise high-resolution precipitation estimates for the entire globe [15]. The GSMaP project includes different precipitation datasets, and the gauge-adjusted GSMaP product was employed herein. This GPP is initially produced using observations from various microwave radiometers and sounders based on the 2-D radiative transfer model and climatological precipitation type classification. Subsequent to that, cloud motion vector analysis and the Kalman filtering algorithm were applied to combine previous estimates with infrared data and produce a more accurate hourly dataset with a 0.1° × 0.1° spatial resolution [19,76]. Finally, the daily unified Climate Prediction Center (CPC) datasets are introduced to the GSMaP estimates for bias correction and enhancement. Additional information can be found in Kubota et al. [15] and Mega et al. [19]. GSMaP precipitation data from 2000 to the end of 2020 was considered for performance evaluation.

3.1.5. Integrated Multi-Satellite Retrieval for GPM (IMERG)

Integrated Multi-Satellite Retrieval for the GPM (IMERG) project intended to combine all satellite microwave precipitation data, geosynchronous satellite Infrared data, and gauge observations to generate precise precipitation estimates at a fine spatial resolution of 0.1° × 0.1° in half-hourly scales [77]. To this end, first, precipitation estimates from passive microwave satellites are integrated using the morphing technique [78]. Subsequently, the microwave passive precipitation estimates are supplemented with Infrared precipitation estimates using the Kalman filtering approach for the regions where the passive precipitations estimates are sparse [79]. In the final step, monthly gauge-based precipitation data from the Global Precipitation Climatology Center (GPCC) are included to regionalize and correct the inherent biases of satellite estimates. See Huffman et al. [77] for further detail on the IMERG satellite precipitation products. In this study, gauge-adjusted IMERG precipitation data between 2000 and 2020 was employed for evaluation.

3.1.6. Fifth Generation of ECMWF Reanalysis Precipitation Products (ERA5)

ERA5 is the fifth generation of the European Center for Medium-Range Weather Forecasts (ECMWF) that provides a global reanalysis of climate variables [17]. ERA5 reanalysis data are based on the Integrated Forecasting System (IFS) and make use of the 4D-Var data assimilation scheme [80]. Multiple sources of data (e.g., microwave radiances, humidity sounder radiances, Infrared radiances, atmospheric motion vectors data, gauge-based data, etc.) and a large number of observations (i.e., nearly 24 million per day as of January 2019) were integrated to generate ERA5 datasets. Precipitation estimates are one of the climatological variables by ERA5, which are generated at a 0.25° × 0.25° spatial resolution on an hourly time scale. Comprehensive information about data and technical configurations of the ERA5 dataset is described in Hersbach et al. [17]. In this study, ERA5 reanalysis precipitation data from 2000 to the end of 2020 was utilized for performance evaluation.

3.2. Synoptic Stations

Numerous precipitation observations from synoptic stations distributed throughout Iran (see Figure 1a) were acquired from the Islamic Republic of Iran Meteorological Organization (IRIMO) for over 20 years, from 2000 to the end of 2020, to evaluate the performance of selected GPPs. On average, daily observations from 229 synoptic stations were employed for validation, starting with 164 synoptic stations in 2000 and reaching 244 synoptic stations in 2020 (see Figure 2). A notable effort was made to select the most appropriate stations by considering the long-term and consistent daily observations. Consistency of the considered in situ observations for GPP validation allows for a robust evaluation and comparison. As is evident, a larger number of synoptic stations with consistent observations were available in the central to the western parts of the country, where higher precipitation rates occurred. On the other hand, relatively fewer synoptic stations were located in the central to the eastern parts of the country with lower precipitation rates, where unvegetated planes and deserts existed [59]. In total, over 1.7 million daily observations (see Figure 2) were employed to evaluate the selected GPPs. These daily observations were also aggregated to generate accumulated and average monthly and annual precipitation values for further investigations.
One crucial issue in evaluating the GPPs is incorporating enough independent in situ observations [11]. In other words, the GPPs that have been subjected to calibration or bias correction used interpolated precipitation data from in situ observations. Therefore, it is necessary to determine the data independency rate to ensure an appropriate evaluation. In this regard, the underlying in situ data of GPCC, GHCN, GSD, and GTS were examined, and it was observed that, on average, over 81% (at least) of synoptic stations were not employed in the creation of these datasets, justifying the independent evaluation of the current study. However, it should be noted that such precipitation products, used for calibration and bias correction, are mostly monthly averaged interpolated values and are not used in daily scales. Accordingly, their values are not identical to the used in situ observations of this study, increasing the data independency rates.

4. Evaluation Methods

In situ observations from the synoptic stations were employed to validate and compare the performance of six GPPs (see Section 3.2). Hereafter, the precipitation values of GPPs and in situ observations are called target precipitation and reference precipitation, respectively. Two types of statistical metrics, including continuous and categorical metrics, were calculated to assess the performance of GPPs from two complementary perspectives.
Continuous metrics are used to determine the accurateness (i.e., how close) of the target precipitation against the corresponding reference precipitation. In other words, continuous metrics are employed for precipitation intensity assessment. Pearson Correlation Coefficient (CC), Mean Bias Error (MBE), Mean Absolute Error (MAE), and Root Mean Square Error (RMSE) are among the continuous metrics that were employed in this study. The CC (Equation (1)) is a unitless metric that describes how well the target precipitation corresponds to the reference precipitation. Its optimal value (i.e., 1) indicates the high representativeness of the target precipitation against the reference precipitation. The MBE (Equation (2)), with the same unit as the input data, measures the average bias between the target precipitation and reference precipitation, representing the systematic overestimation or underestimation of the target precipitation. The MBE is a signed metric with an optimal value of 0, meaning no bias between target and reference precipitation values. Accordingly, the positive and negative values of MBE represent overestimation and underestimation in the target precipitation when compared with the reference precipitation. Moreover, the MAE (Equation (3)) measures the average magnitude difference between the corresponding target and reference precipitation values without considering the direction and provides a quantitative value with the same scale as the input data. The RMSE (Equation (4)) is a standard scale-dependent metric representing the quadratic mean of error between target and reference precipitation values. High values of RMSE denote a higher dispersion degree, while theoretically, a zero RMSE indicates a perfect quantitative match.
CC = i = 1 n ( x i x ¯ ) ( y i y ¯ ) i = 1 n ( x i x ¯ ) 2 . i = 1 n ( y i y ¯ ) 2
MBE = 1 n i = 1 n ( y i x i )
MAE = 1 n i = 1 n | y i x i |
RMSE = 1 n i = 1 n ( y i x i ) 2
In the above Equations, x i is the reference precipitation (i.e., from synoptic stations), x ¯ is the average value of reference precipitation, y i is the target precipitation (i.e., from the GPPs), y ¯ is the average value of target precipitation, and n is the number of corresponding reference and target precipitations.
In addition to continuous metrics that measure the accurateness of GPPs, it is essential to investigate their capability of precipitation occurrence detection. Therefore, three categorical metrics, including the Probability of Detection (POD), False Alarm Ratio (FAR), and Critical Success Index (CSI), with range values of 0 to 1 were calculated. The POD (Equation (5)) specifies the ability of GPPs to capture actual precipitation occurrence with an optimal value of 1. On the other hand, the FAR (Equation (6)) with an optimal value of 0 indicates the incorrect detection of actual precipitation occurrence (i.e., spurious events). Considering the one-sided investigations of POD and FAR, the CSI (Equation (7)) comprehensively illustrates the overall fraction of precipitation events correctly detected by GPPs [81]. Commonly, a fixed threshold value of 1 mm/day is adopted for precipitation/no-precipitation day identification due to high uncertainties for light precipitations [33,82]. However, a fixed threshold can either be small or large for humid and dry regions, respectively. Accordingly, in this study, a smaller threshold value between 20% of average daily precipitation and 1 mm/day was set to determine precipitation/no-precipitation days [35]. This choice will ensure more corresponding observations for GPPs’ capability assessment in regions with lighter precipitations. This dynamic threshold could lead to a spatially non-uniform evaluation; however, since the primary objective of this paper is to compare the performance and capability of different GPPs, its influence on the results is negligible [35].
POD = Hit Hit + Miss
FAR = False Hit + False
CSI = Hit Hit + Miss + False
The first step to computing the above-mentioned categorical metrics is calculating four elements of Hit, False, Miss, and Correct Negative. Table 1 shows the contingency table between the target (GPP) and reference (synoptic station) precipitations, allowing the calculation of the four elements. For instance, a corresponding observation is identified as Hit if both sources (i.e., GPP and synoptic station) have recorded a rain event. Similarly, if two sources have recorded a no-rain occurrence, the corresponding observation is considered as Correct Negative. In conditions of different responses (i.e., capturing non-identical precipitation/no-precipitation events) from two sources, the observations will be categorized as Miss or False.
The point-to-pixel (i.e., reference precipitations as points and target precipitations as pixels) approach was implemented to validate and compare the performance of GPPs using in situ data [83,84,85]. In this regard, the target precipitation values were extracted at each synoptic station location and then compared with reference precipitation values of the corresponding synoptic station. Different time scales were considered for comprehensive evaluation and comparison of GPPs. First, daily comparisons were performed between target and reference precipitation values for the entire two decades (i.e., 2000–2020) of observations. In this regard, first, the target precipitation values with sub-daily temporal resolutions were accumulated to generate daily target precipitation values. The comparisons were implemented on daily (i.e., considering all corresponding precipitation values at each synoptic station), monthly (i.e., considering all corresponding precipitation values at each synoptic station at each month), and yearly (i.e., considering all corresponding precipitation values at each synoptic station at each year) time scales. Taylor Diagram [86], focusing on precipitation intensity assessment using continuous metrics, and the Performance Diagram [87], focusing on precipitation occurrence evaluation using categorical metrics, were implemented to illustrate the monthly precision characteristics of GPPs. Later, monthly and yearly average and accumulated values were computed for both target and reference precipitations to apply monthly and yearly comparisons. The last two time scales allow for better comparison and validation of GPPs, especially targeting the needs of disciplines that employ monthly or yearly precipitation values instead of daily precipitation values.
Daily observations were also used to validate the selected GPPs at each synoptic station, considering their geographical coordinates. This analysis was conducted to explore the capability of GPPs in a spatial manner. In particular, GPPs might have varied performances in different parts of the country, and thus, such analysis could illustrate these spatial variabilities. In this regard, continuous and categorical metrics were computed using over 7500 corresponding precipitation values for each synoptic station.

5. Results

As stated earlier, the comparisons and validation steps were carried out on different time scales using daily, monthly, and yearly observations, the results of which are presented in the following subsections.

5.1. Evaluation Using Daily Observations from 2000 to 2020

In this section, corresponding daily precipitation values from GPPs (target precipitation) and synoptic stations (reference precipitation) were compared. These precipitation values were compared for the whole study period on a daily basis, followed by the comparisons in each month and year from 2000 to 2020. Both continuous and categorical metrics were employed in this section.

5.1.1. Daily Time Scale

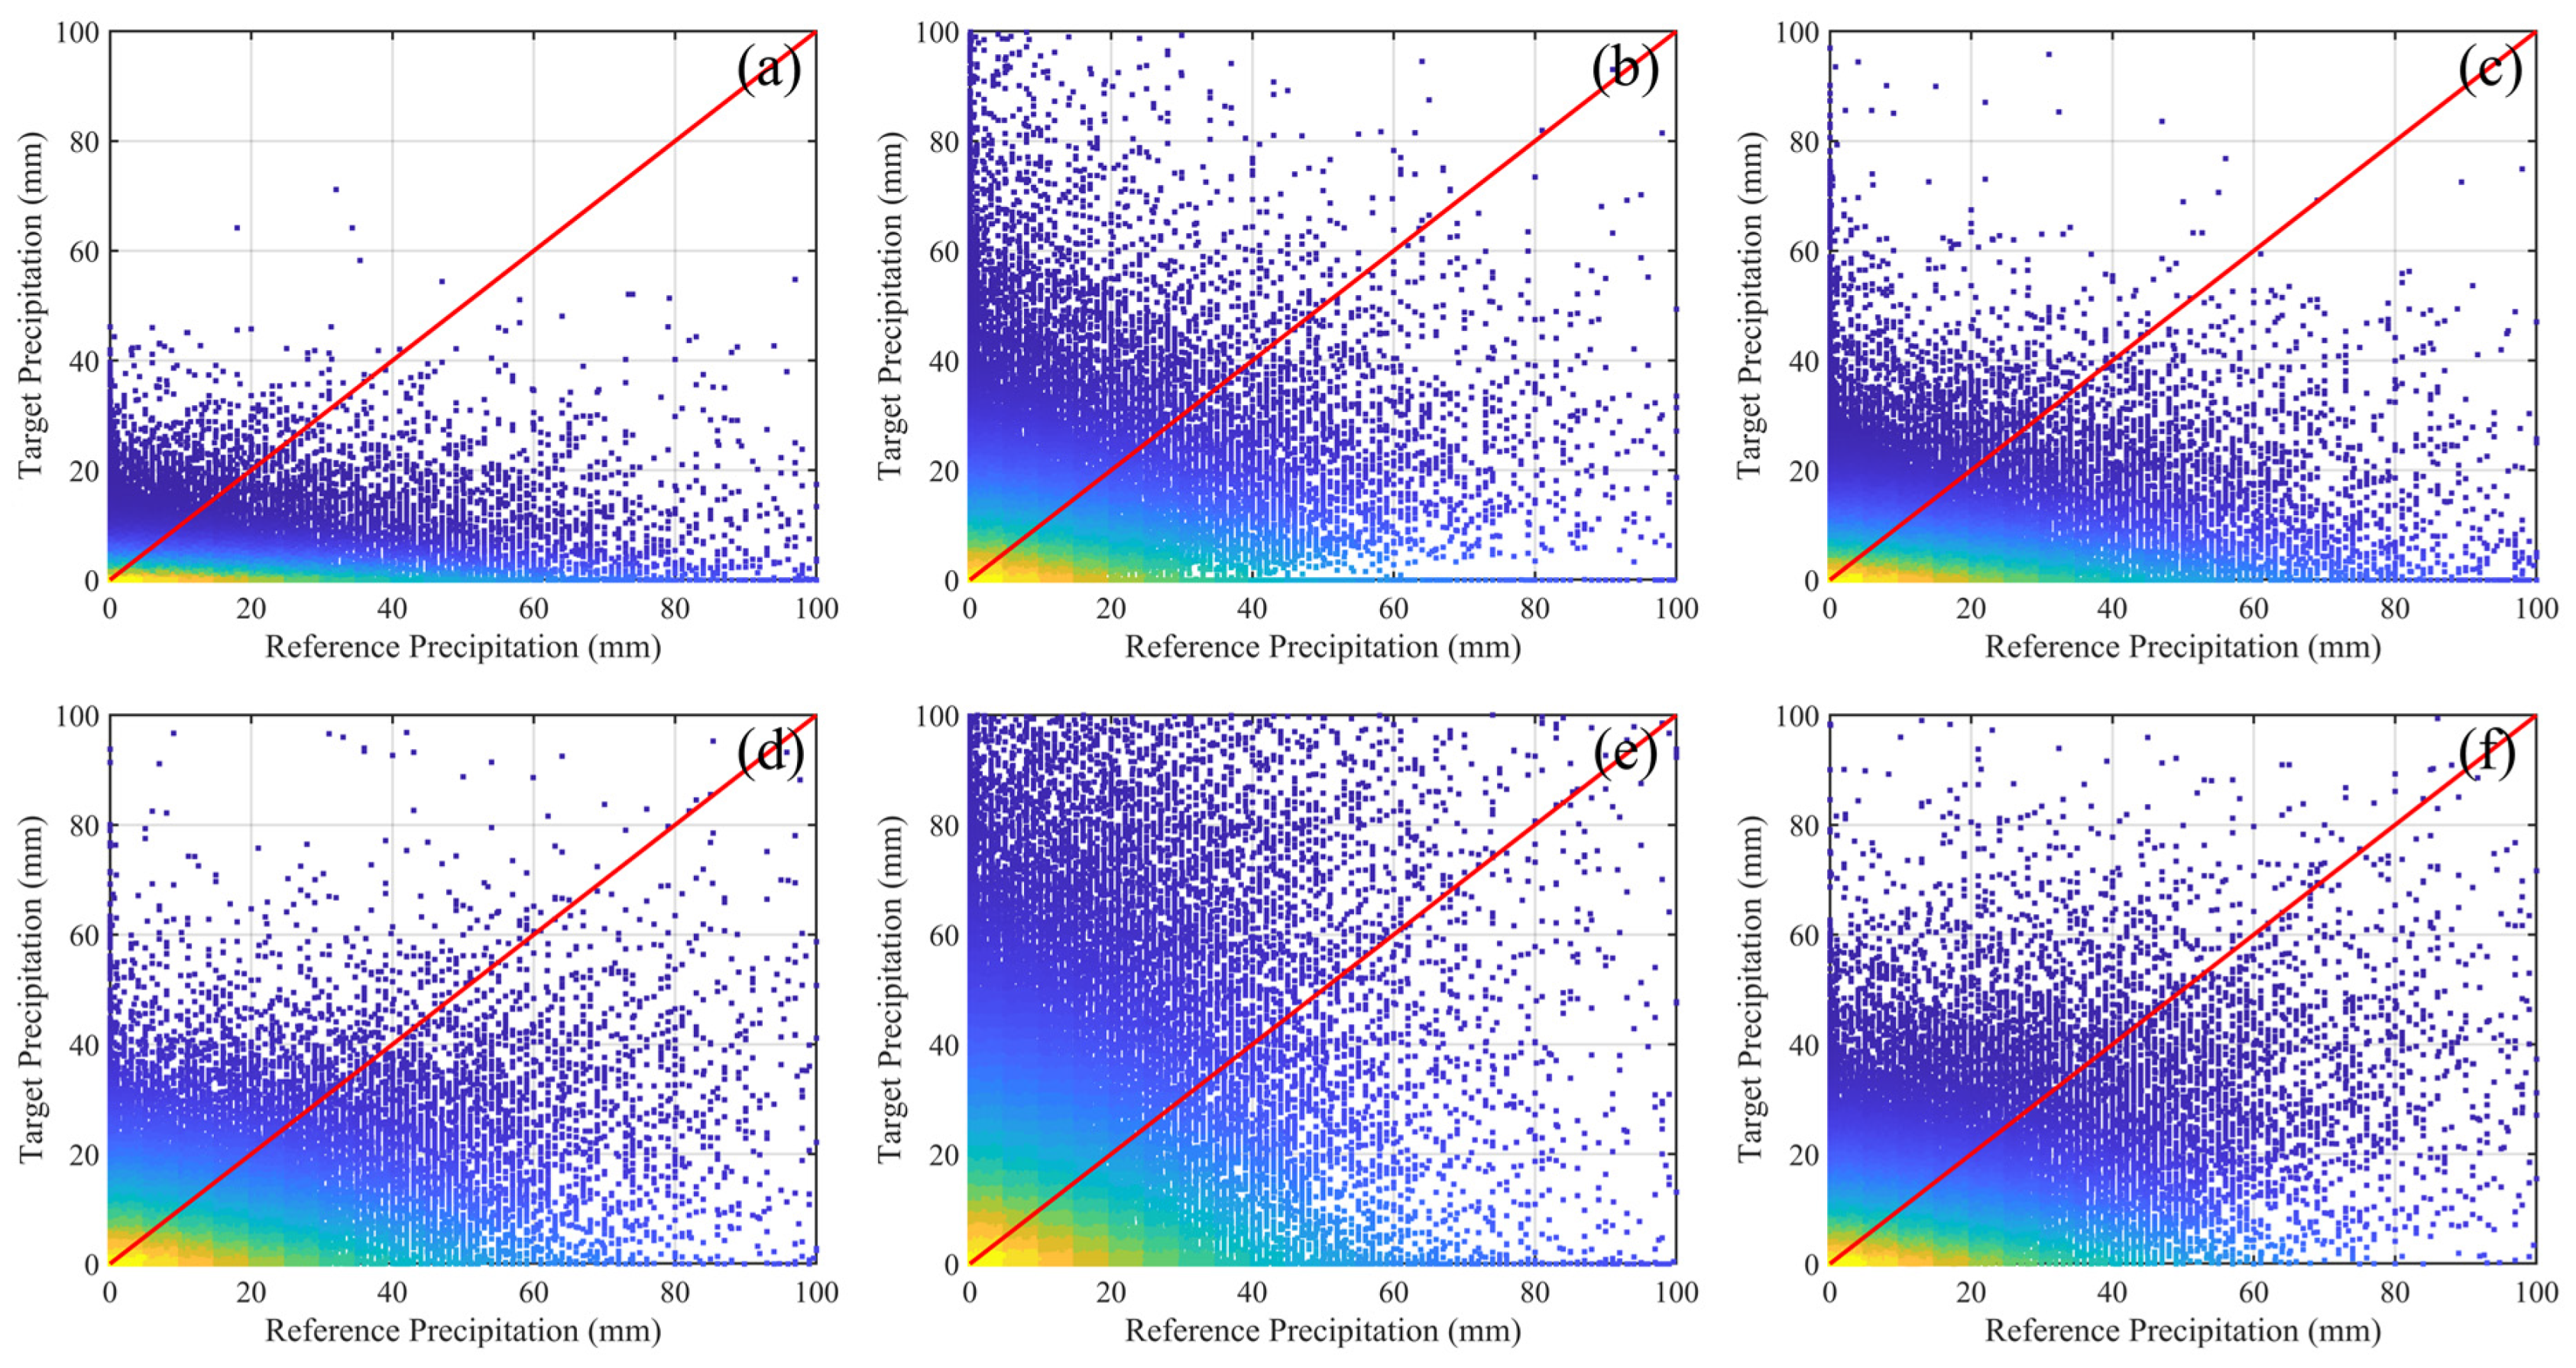
All daily corresponding precipitation values (i.e., nearly 1.7 million observations) were compared to achieve a general overview of the performance of the selected GPPs (see Figure 3). This comparison considers no spatial or temporal characteristics, and includes all precipitation values, and thus, only provides merely a broad depiction of GPPs’ performance over the last two decades. Large scatterings indicate relatively imperfect agreements between target and reference precipitations. Figure 3 shows that the precipitation values were mainly low, especially less than 20 mm/day, as anticipated based on the daily precipitation values in Iran. Visually, it can be seen that the TMPA precipitations (Figure 3a) had the least variation (i.e., standard deviation), while the IMERG precipitation values (Figure 3e) had the highest variation. Generally, Figure 3 shows that the target and reference precipitation values were closer to the identical reference line for ERA5 and GSMaP GPPs. In particular, ERA5 (Figure 3f) obtained the highest CC of 0.623, closely followed by GSMaP with a CC of 0.599, and IMERG (CC = 0.483), PERSIANN (CC = 0.356), CHIRPS (CC = 0.353), and TMPA (CC = 0.330) were in the subsequent ranks. Moreover, Figure 3a–d illustrate that TMPA and GSMaP had an underestimation when retrieving the precipitation values. These also are in agreement with the calculated MBE values, which were −0.574 mm and −0.132 mm for TMPA and GSMaP. On the other hand, IMERG, ERA5, CHIRPS, and PERSIANN overestimated the precipitation values with the MBE values of 1.001 mm, 0.268 mm, 0.152 mm, and 0.094 mm, respectively. Table 2 summarizes the quantitative values of both continuous and categorical metrics that support the perceptions drawn from Figure 3. The GSMaP and TMPA achieved the first- and second-lowest MAE values of 0.834 mm and 0.913 mm, while other GPPs with overestimation characteristics obtained higher MAE values, with the highest value of 1.791 mm for IMERG. Considering the RMSE metric, the GSMaP obtained the lowest value (3.48 mm), and the second most accurate GPP was ERA5, with an RMSE value of 3.59 mm. IMERG and CHIRPS, on the other hand, were less accurate by acquiring the RMSE values of 6.89 mm and 4.68 mm, respectively.
Furthermore, the POD values indicated that ERA5 (POD = 0.867) had the best performance, followed by GSMaP (POD = 0.784), although the FAR metric suggested the exact opposite. In particular, ERA5 and GSMaP obtained FAR values of 0.480 and 0.568, respectively, indicating that GSMaP performed the best among the other GPPs. The obtained POD values illustrated the weakest performance of TMPA and CHIRPS; while considering the FAR metrics, their performances were second to GSMaP and closely similar to ERA5. With respect to CSI, GSMaP was identified as the most accurate GPP in precipitation occurrence identification, with a CSI value of 0.454, followed by ERA5, IMERG, PERSIANN, CHIRPS, and TMPA. The findings support that GSMaP outperformed other GPPs, and both TMPA and CHIRPS were identified as the least suitable GPPs in the last two decades.
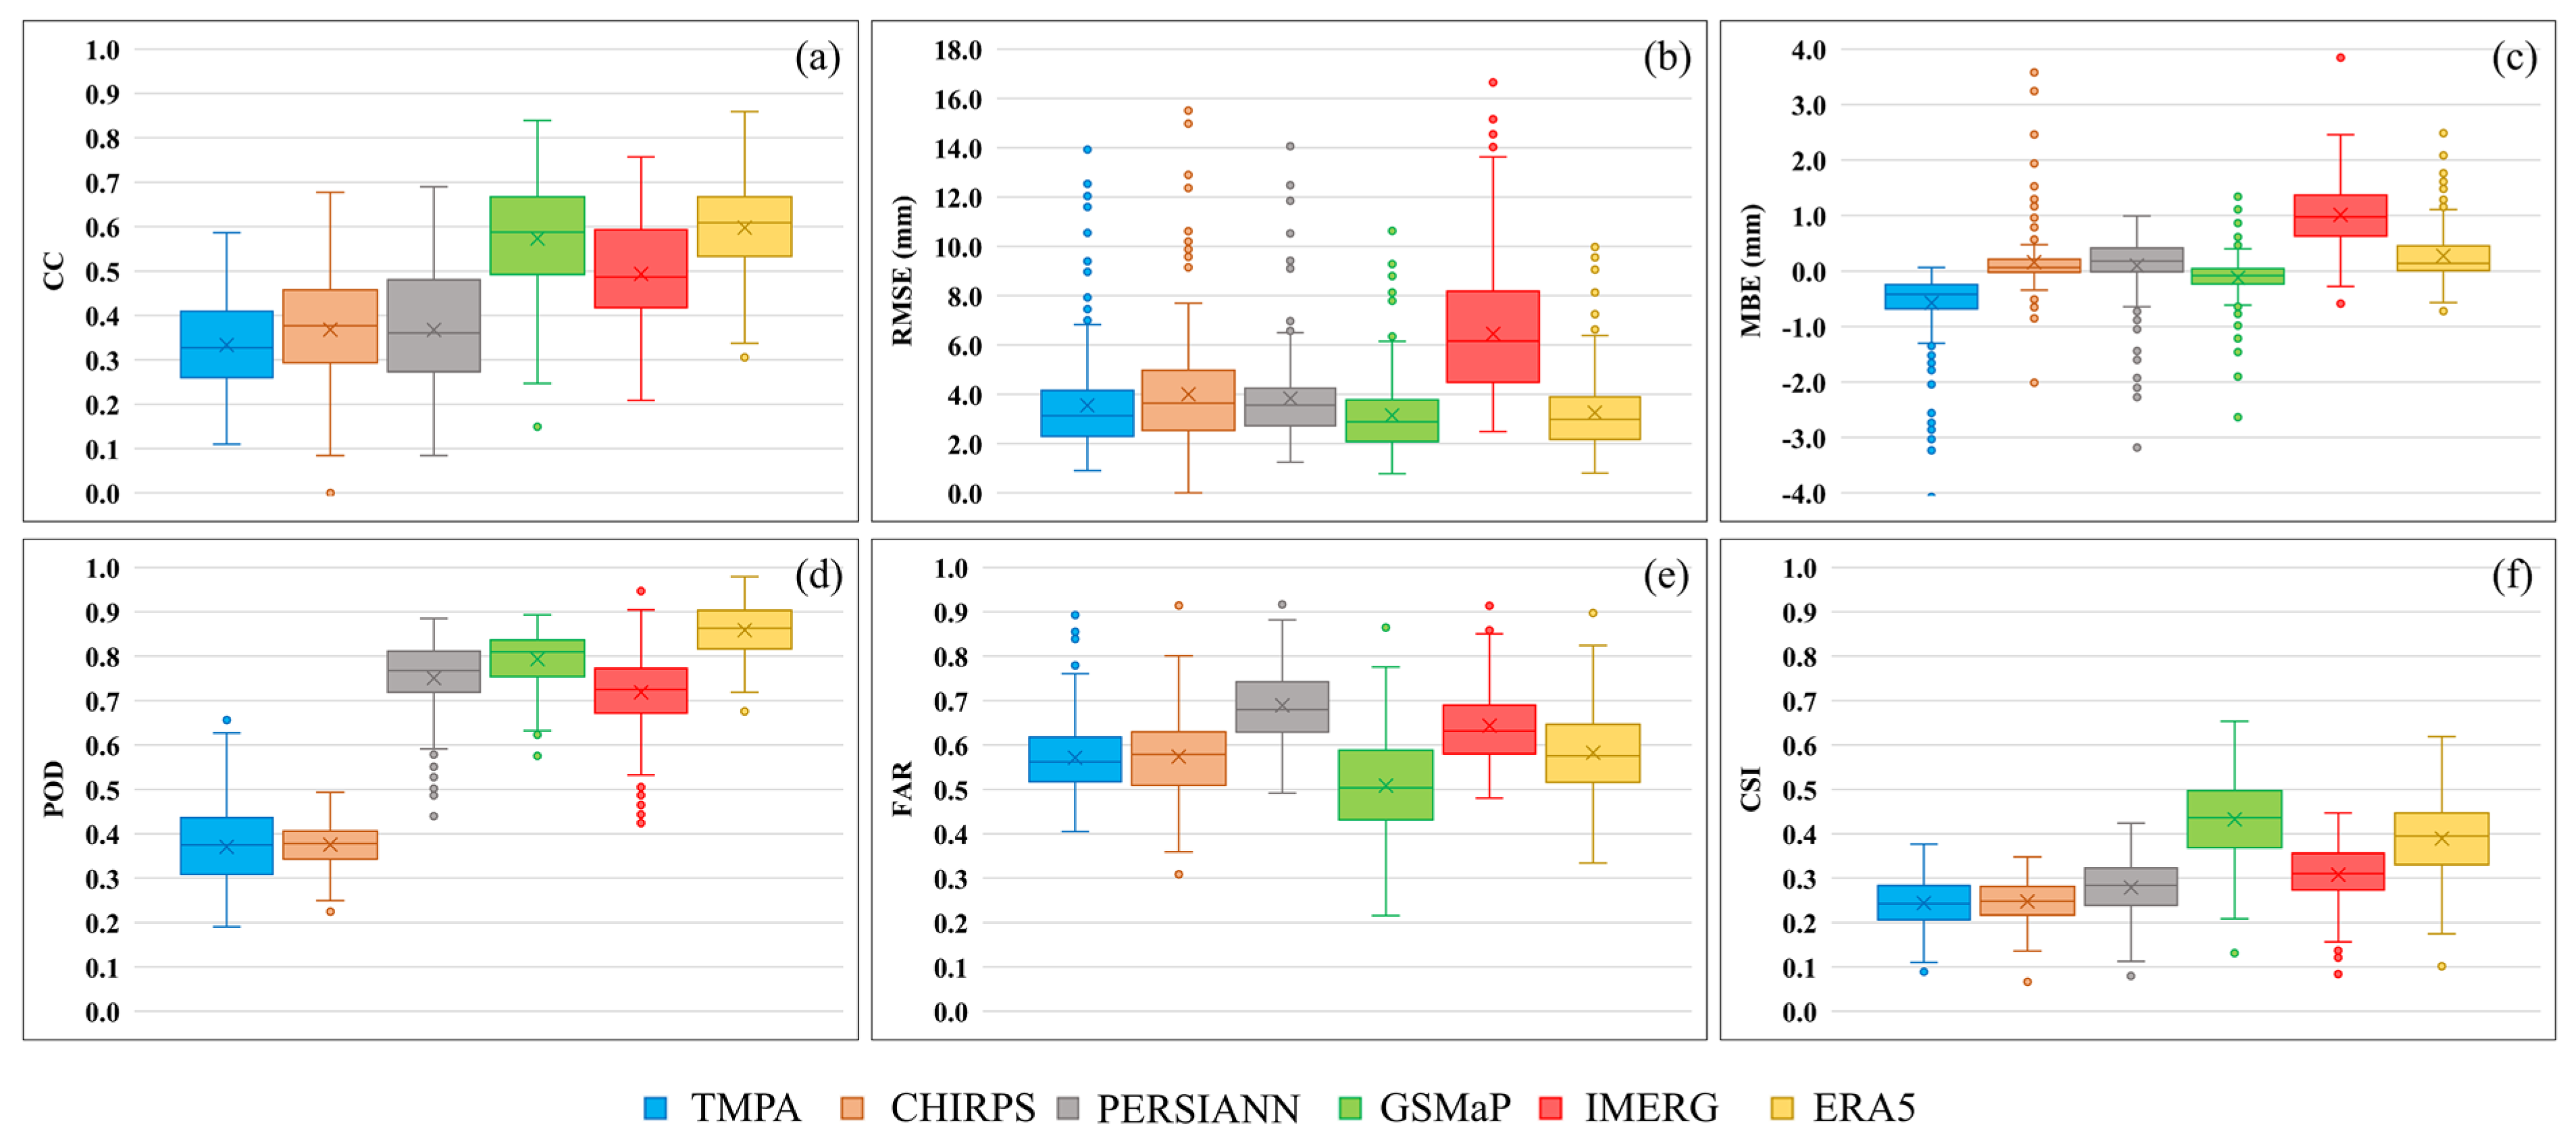
The daily comparisons were also adopted at each synoptic station individually. The boxplots of six metrics, including CC, RMSE, MBE, POD, FAR, and CSI, are presented in Figure 4. Figure 4a shows that GSMaP and ERA5 outperformed the other GPPs by generally obtaining higher CC values at each station, while the TMPA presented the weakest performance. Moreover, Figure 4b clearly illustrates that the IMERG achieved higher RMSE values at each station, supporting the previous finding reported in Table 2. Other GPPs manifested relatively similar performances when considering RMSE at each station, with the best performance for GSMaP, followed by ERA5, TMPA, PERSIANN, and CHIRPS. Likewise, Figure 4c presents MBE, indicating the existence of overestimation and underestimation possibilities in all GPPs, except for TMPA, in which almost all stations had underestimations. Meanwhile, more considerable variation and magnitudes in MBE at all stations are evident for IMERG, which agrees with the obtained results when considering all corresponding precipitation values (MBE = 1.01 mm). Figure 4d shows that PERSIANN, GSMaP, IMERG, and ERA5 had relatively similar behaviors when considering POD values at the station level with the superiority of ERA5 and GSMaP, respectively, while TMPA and CHIRPS had poor performances. On the other hand, the FAR boxplot (Figure 4e) shows rather close performance patterns for all GPPs, with the best and worst performances for GSMaP and PERSIANN. Finally, the CSI metric demonstrated that the GSMaP, followed by ERA5, IMERG, and PERSIANN, had the best performances, respectively, while the two other GPPs had similar weak performances (see Figure 4f).
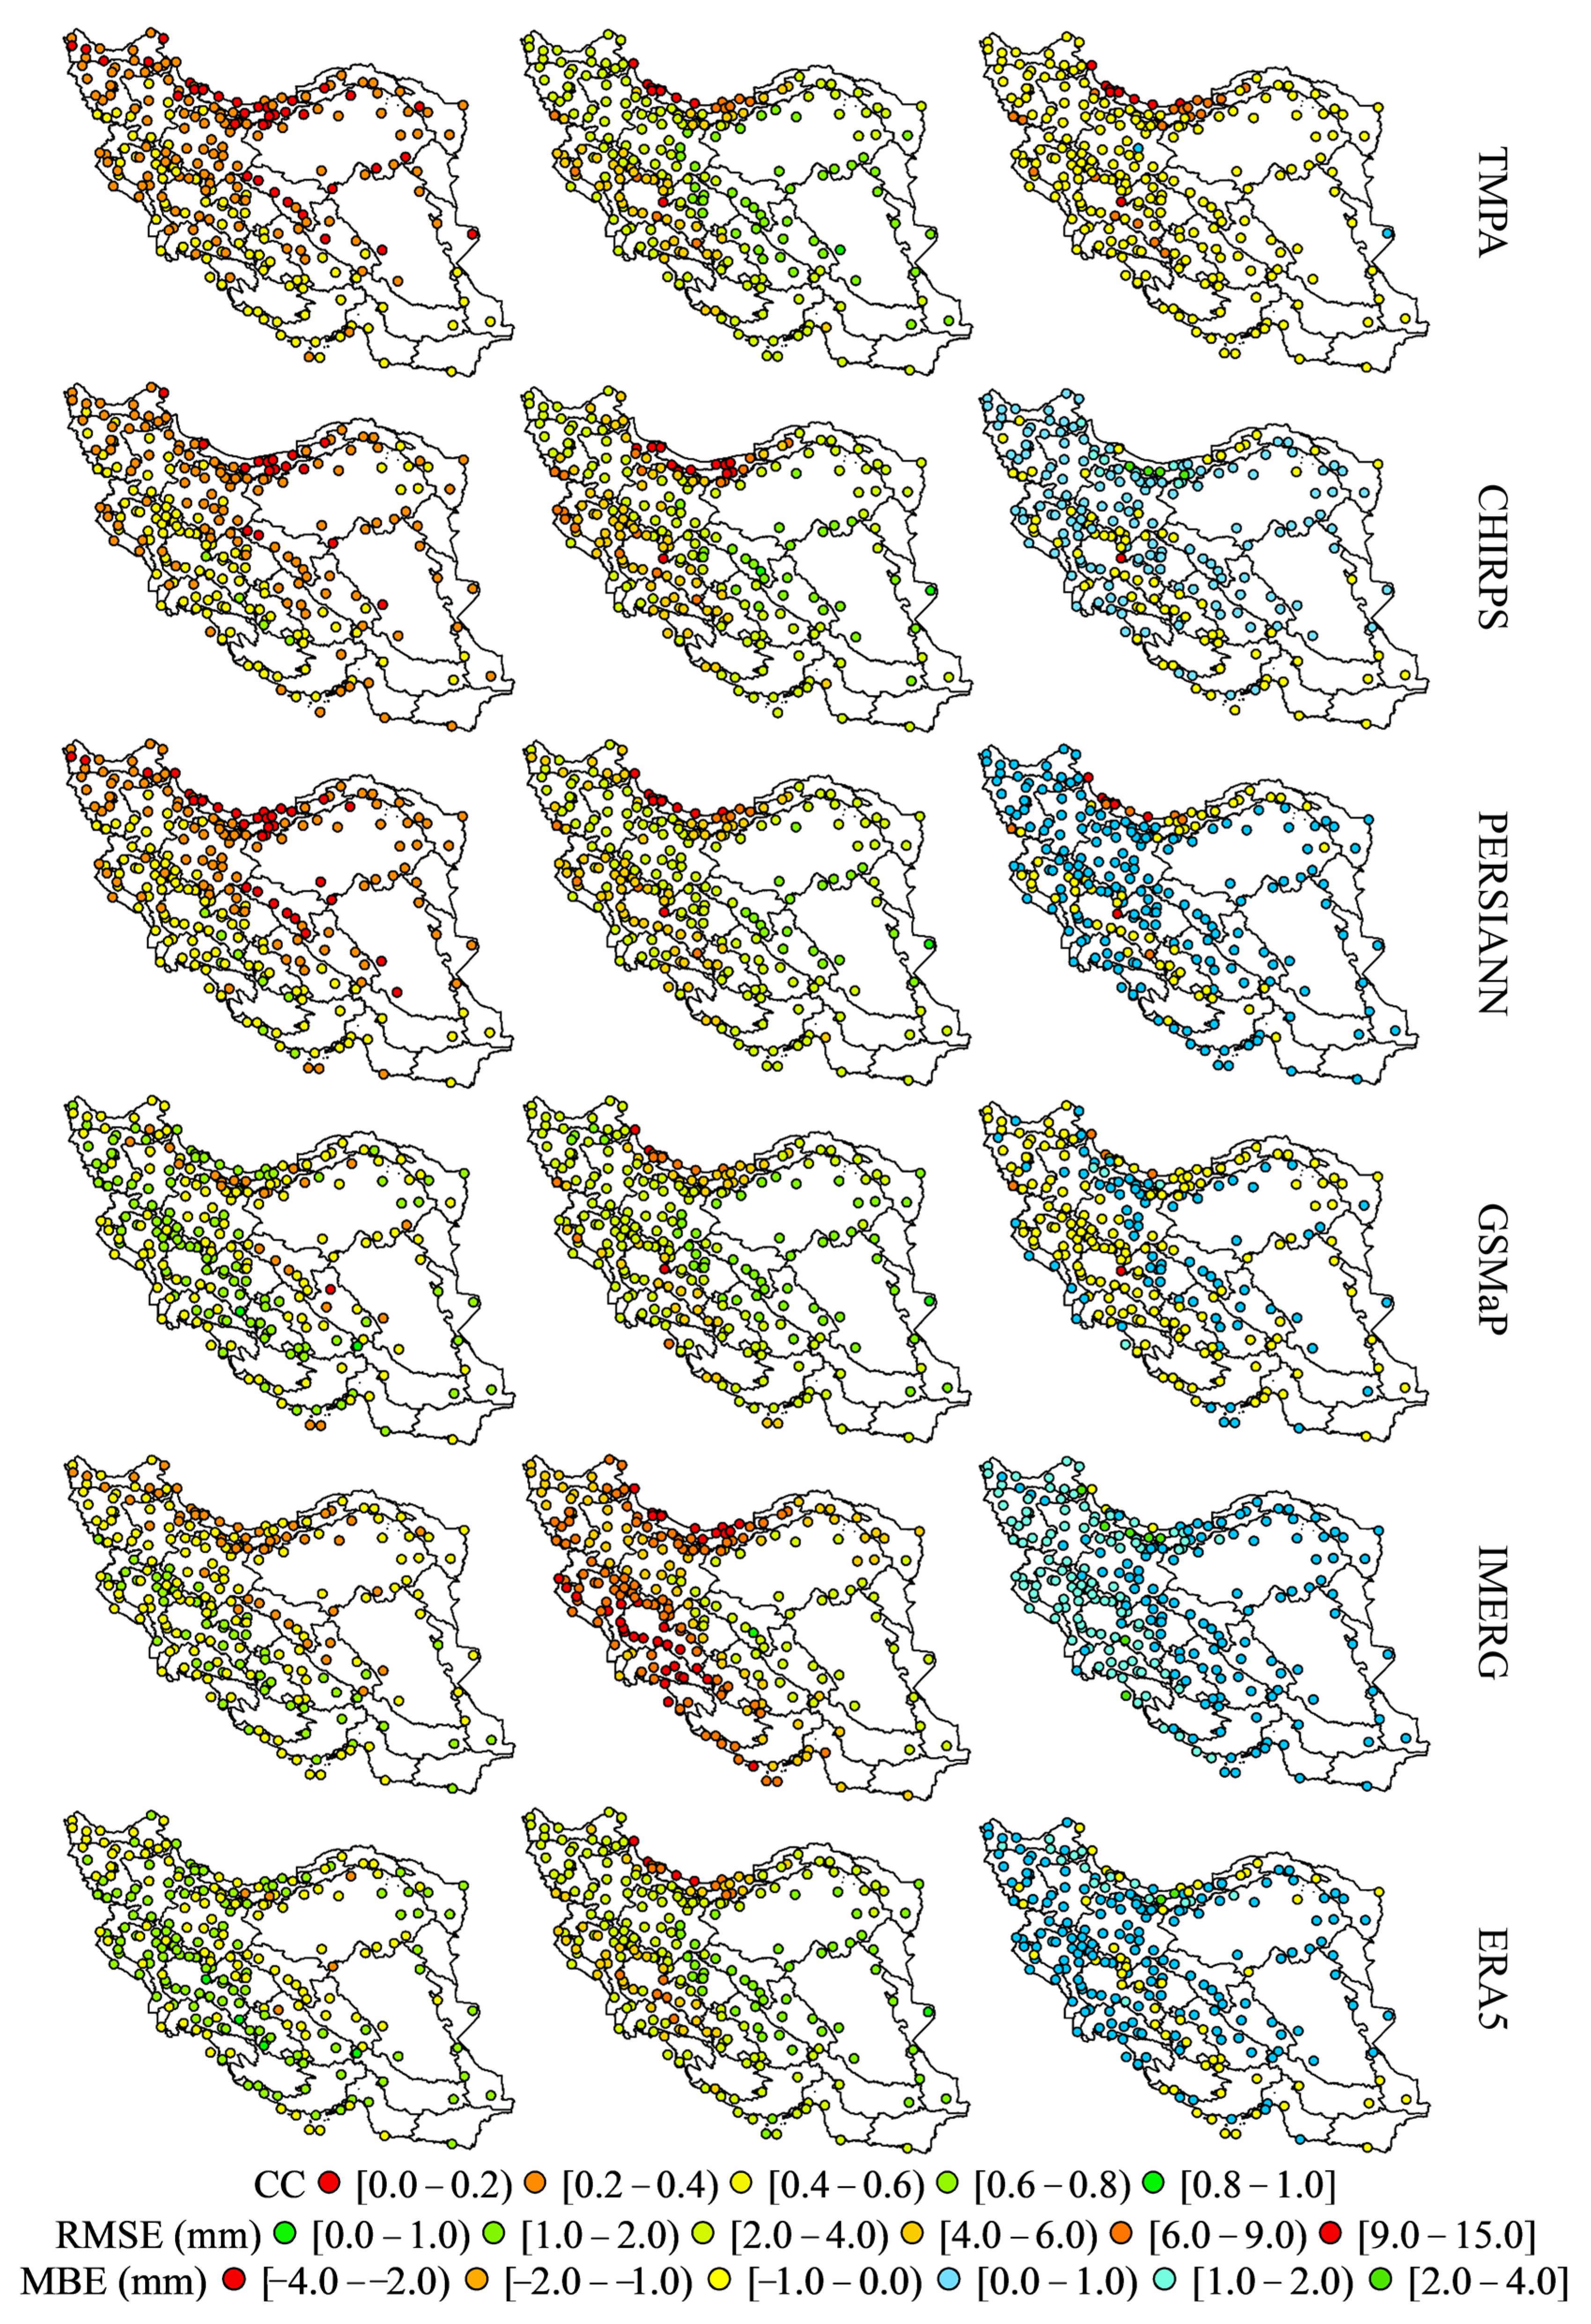
In addition to presenting the statistical metrics at the station level through boxplots, they are also illustrated based on geographical coordinates. This analysis enables a more profound investigation of the spatial variability of GPPs performance in Iran. Figure 5 shows the calculated continuous metrics, presenting the precipitation intensity accuracies at each station. It is worth noting that the country’s second-level basins boundaries (in black line) are also overlaid to benefit the individuals working on smaller-scale studies (i.e., one or more basins). In general, all GPPs had the best performances in the western part of the country; however, GSMaP, ERA5, and IMERG presented considerably more applicable performances throughout Iran. In terms of CC (Figure 5—left column), for TMPA, the best performances were observed for 81 (33%) stations in CC ranges of 0.4–0.6. However, the remnant (67%), mostly located in the northern parts of the country with higher precipitation rates and central regions, were in lower CC value ranges. Relatively similar patterns were also observed for CHIRPS and PERSIANN with slightly better performances, in which 38% and 40% of stations were assigned in the same CC range, and very few stations obtained higher CC values. However, three other GPPs, i.e., GSMaP, ERA5, and IMERG, manifested considerably better performances by including many stations with higher CC values. Particularly, ERA5, with 127 (52%) stations in the CC range of 0.6–0.8, followed by GSMaP and IMERG, with 106 (43%) and 55 (22%) stations in the same range, provided more accurate precipitation. Likewise, Figure 5 (middle column) illustrates the spatial pattern of the obtained RMSE values at each station for the GPPs. Considering the higher values of RMSE as an adverse indicator of GPPs performance, IMERG included 161 (65%) stations with RMSE values over 4 mm. In contrast, GSMaP provided more precise precipitation estimates since 194 stations (79%) had RMSE values of less than 4 mm. The performance of GSMaP was followed by those of ERA5, TMPA, PERSIANN, and CHIRPS. Further investigations revealed that stations with higher RMSE values were mainly located in regions with higher precipitation rates. Figure 5 (right column) shows the spatial variability of the average biases (MBE) at each station for the GPPs. On the whole, all GPPs presented diverse performances and included stations with overestimation and underestimation, except for TMPA and IMERG, with almost dominant behaviors in underestimating and overestimating precipitation values, respectively. Underestimation at almost all stations was obtained for TMPA, with dominant MBE values in the range of −1 to 0, indicating low biases throughout the country. Conversely, IMERG exhibited a relatively much higher MBE and included 241 (98%) stations with overestimation, of which the dominant number of stations were fallen in MBE ranges of 0–1 mm (50%) and 1–2 mm (46%). Based on Figure 5 (right column), CHIRPS, PERSIANN, and ERA5 presented relatively similar patterns, with, respectively, 167 (69%), 181 (74%), and 188 (77%) stations with overestimation and the remnant underestimated precipitation values. For GSMaP, most of the stations were assigned to MBE ranges of -1 mm and 1 mm, of which 158 (65%) and 77 (31%) stations had underestimation and overestimation, resulting in the best performance among other GPPs in total.
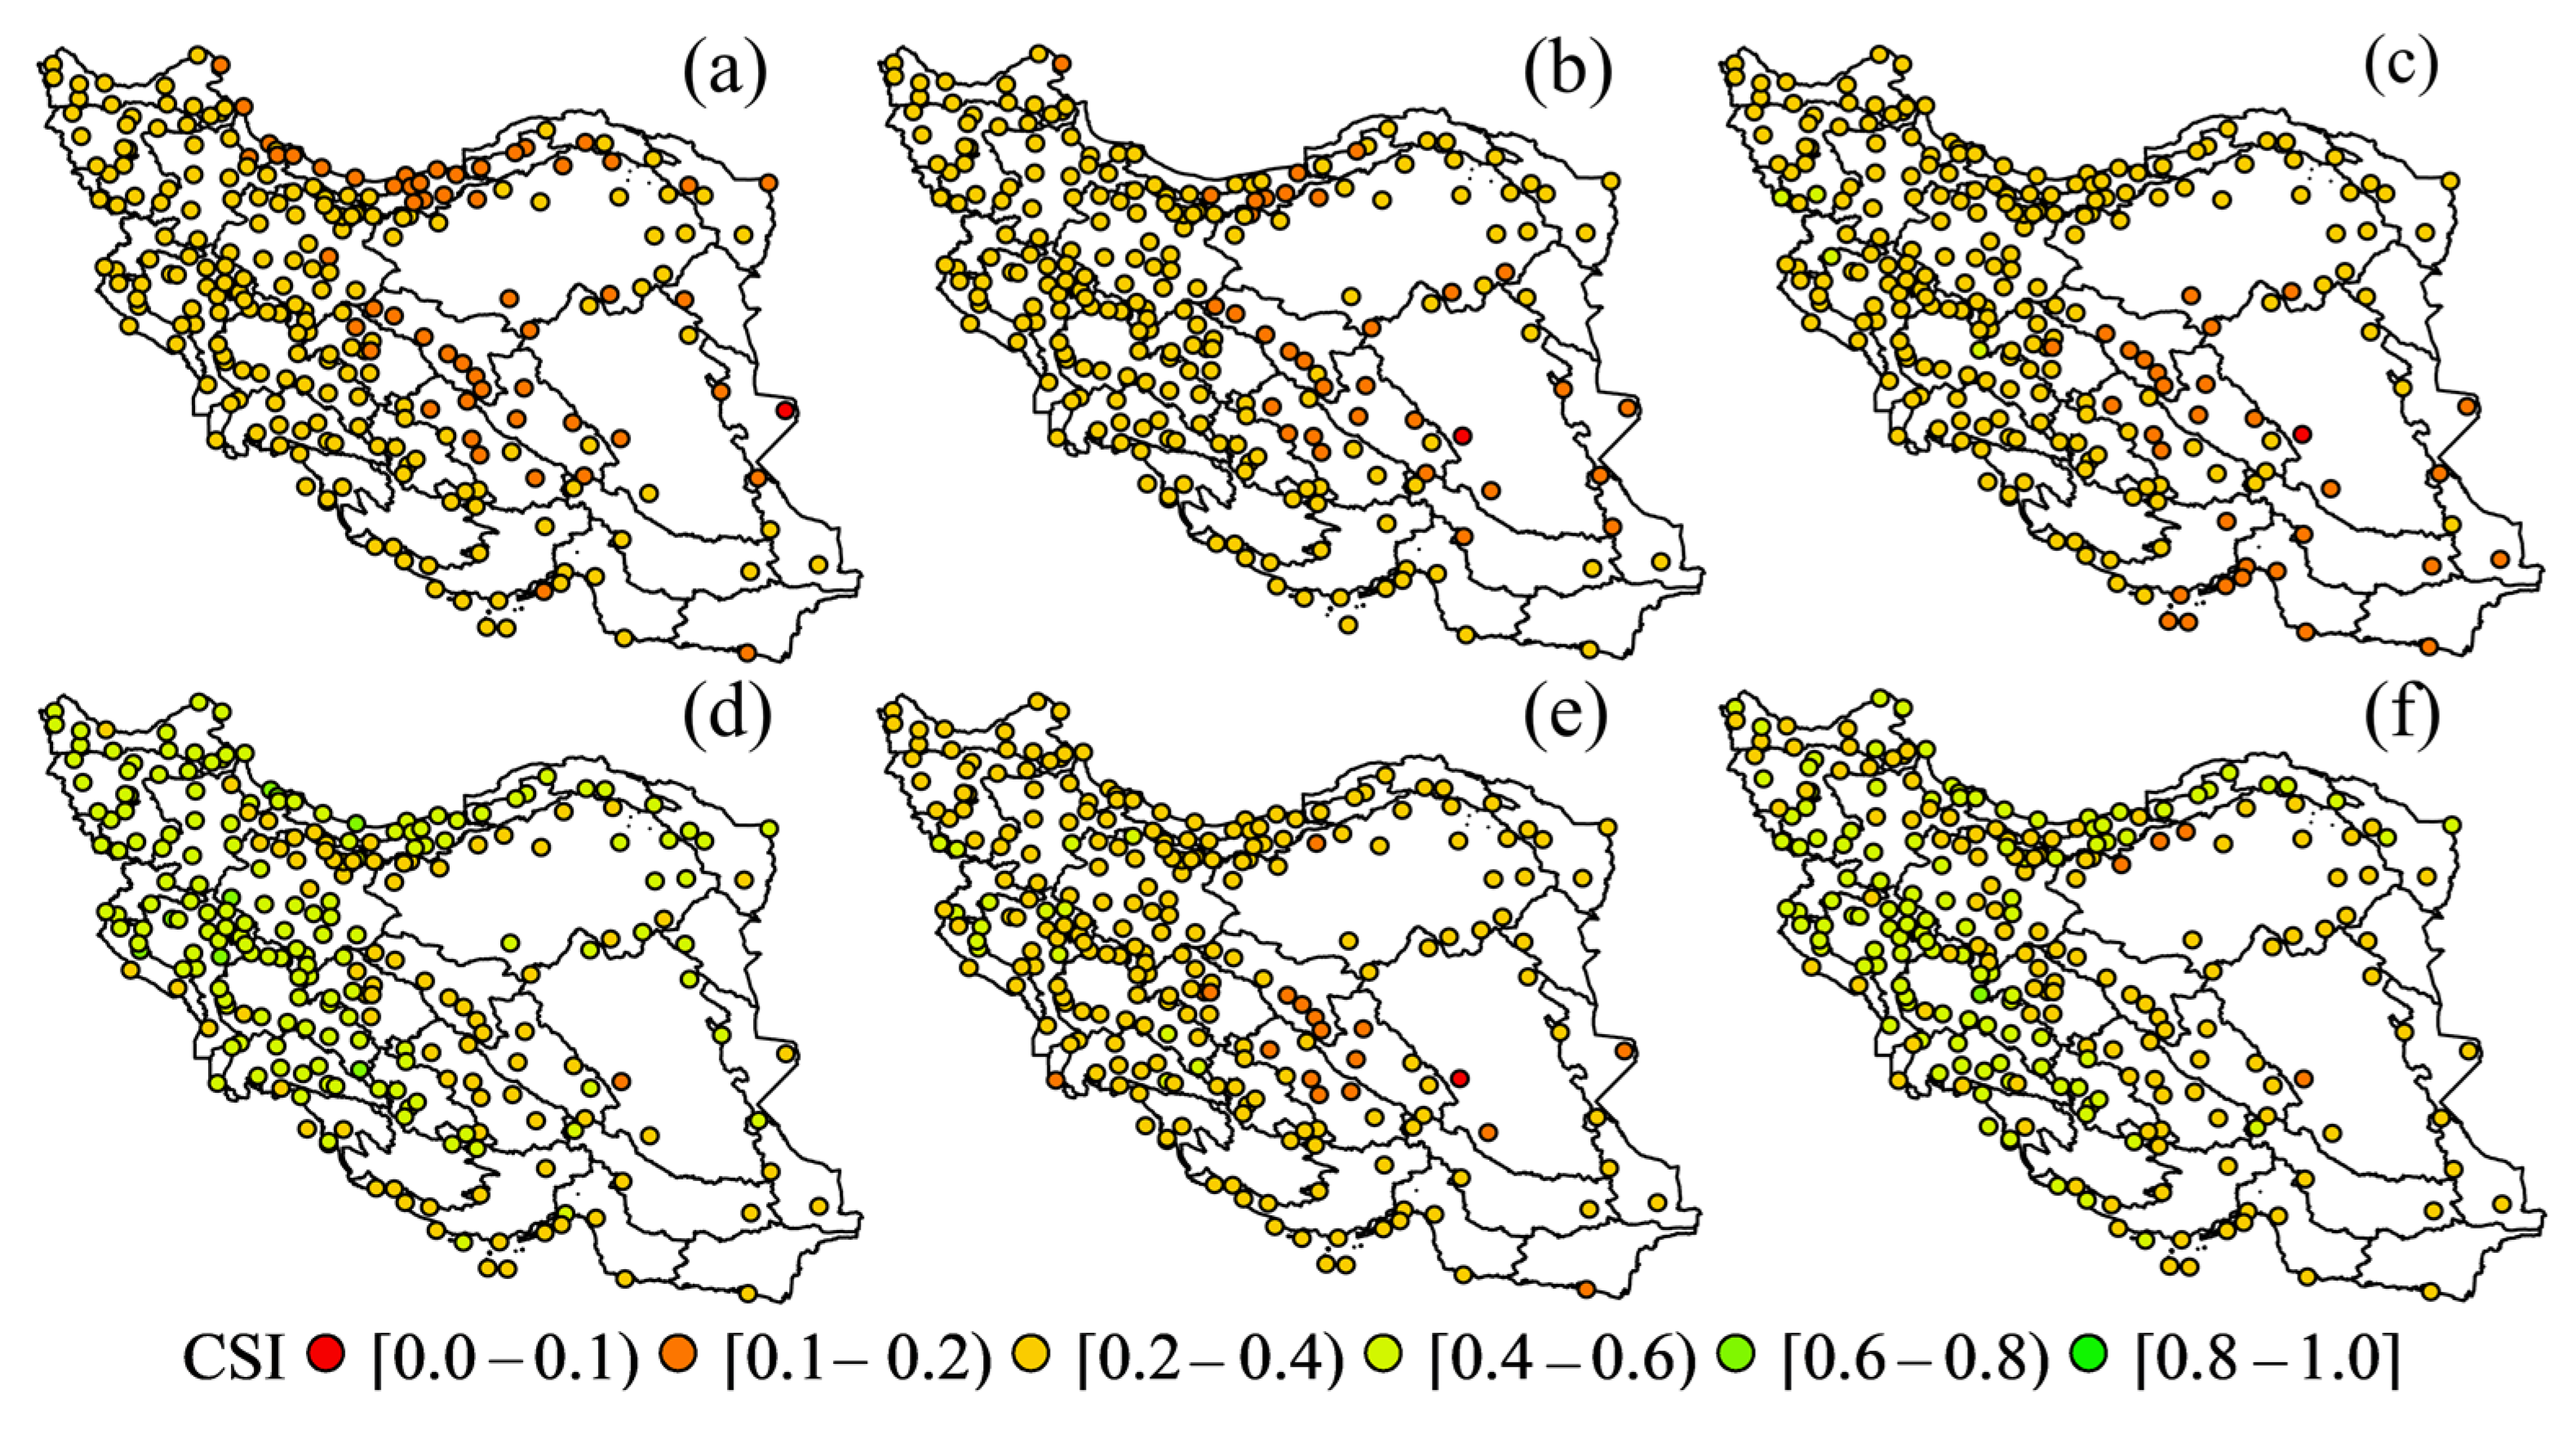
Complementary to the spatial evaluation of the selected GPPs using continuous metrics, Figure 6 presents the obtained CSI values at the station level based on two decades of daily observations. At a glance, Figure 6 shows that for all GPPs, the weakest performances occurred in the central parts of the country. Furthermore, the findings indicate the superior performance of GSMaP in comparison to other GPPs. In particular, over 34% and 61% of stations fell in the CSI ranges of [0.2–0.4) and (0.4–0.6], respectively, for GSMaP, which proved its potential capability to capture the precipitation occurrence. Meanwhile, ERA5 was identified as the second most accurate GPP, with approximately 50% and 47% of stations in the CSI ranges of [0.2–0.4) and (0.4–0.6], respectively. For IMERG, as the third most accurate GPP in terms of precipitation occurrence detection, the dominant proportion (86%) of stations achieved CSI values in the range of [0.2–0.4), and a minority of stations had upper and lower CSI values. For the other three GPPs, 77% (TMPA), 83% (CHIRPS), and 85% (PERSIANN) of stations acquired CSI values between 0.2 and 0.4, and almost all of the other stations obtained lower CSI values. Based on the results, these GPPs were ordered as PERSIANN, CHIRPS, and TMPA, considering the accurateness in the precipitation occurrence detection at the station level.

5.1.2. Monthly Time Scale

In this subsection, the daily observations (i.e., target and reference precipitations) are compared on monthly time scales. In other words, the continuous and categorical metrics were computed for each month, including dry and wet months, using the daily observations to investigate the performance of the GPPs. In addition to providing the temporal accuracy characteristics of GPPs, the findings might benefit researchers working in individual months. In this regard, the computed metrics are presented using the Taylor Diagram [86] and Performance Diagram [87], through which the performance of the GPPs in multi-metric methods can be compared.
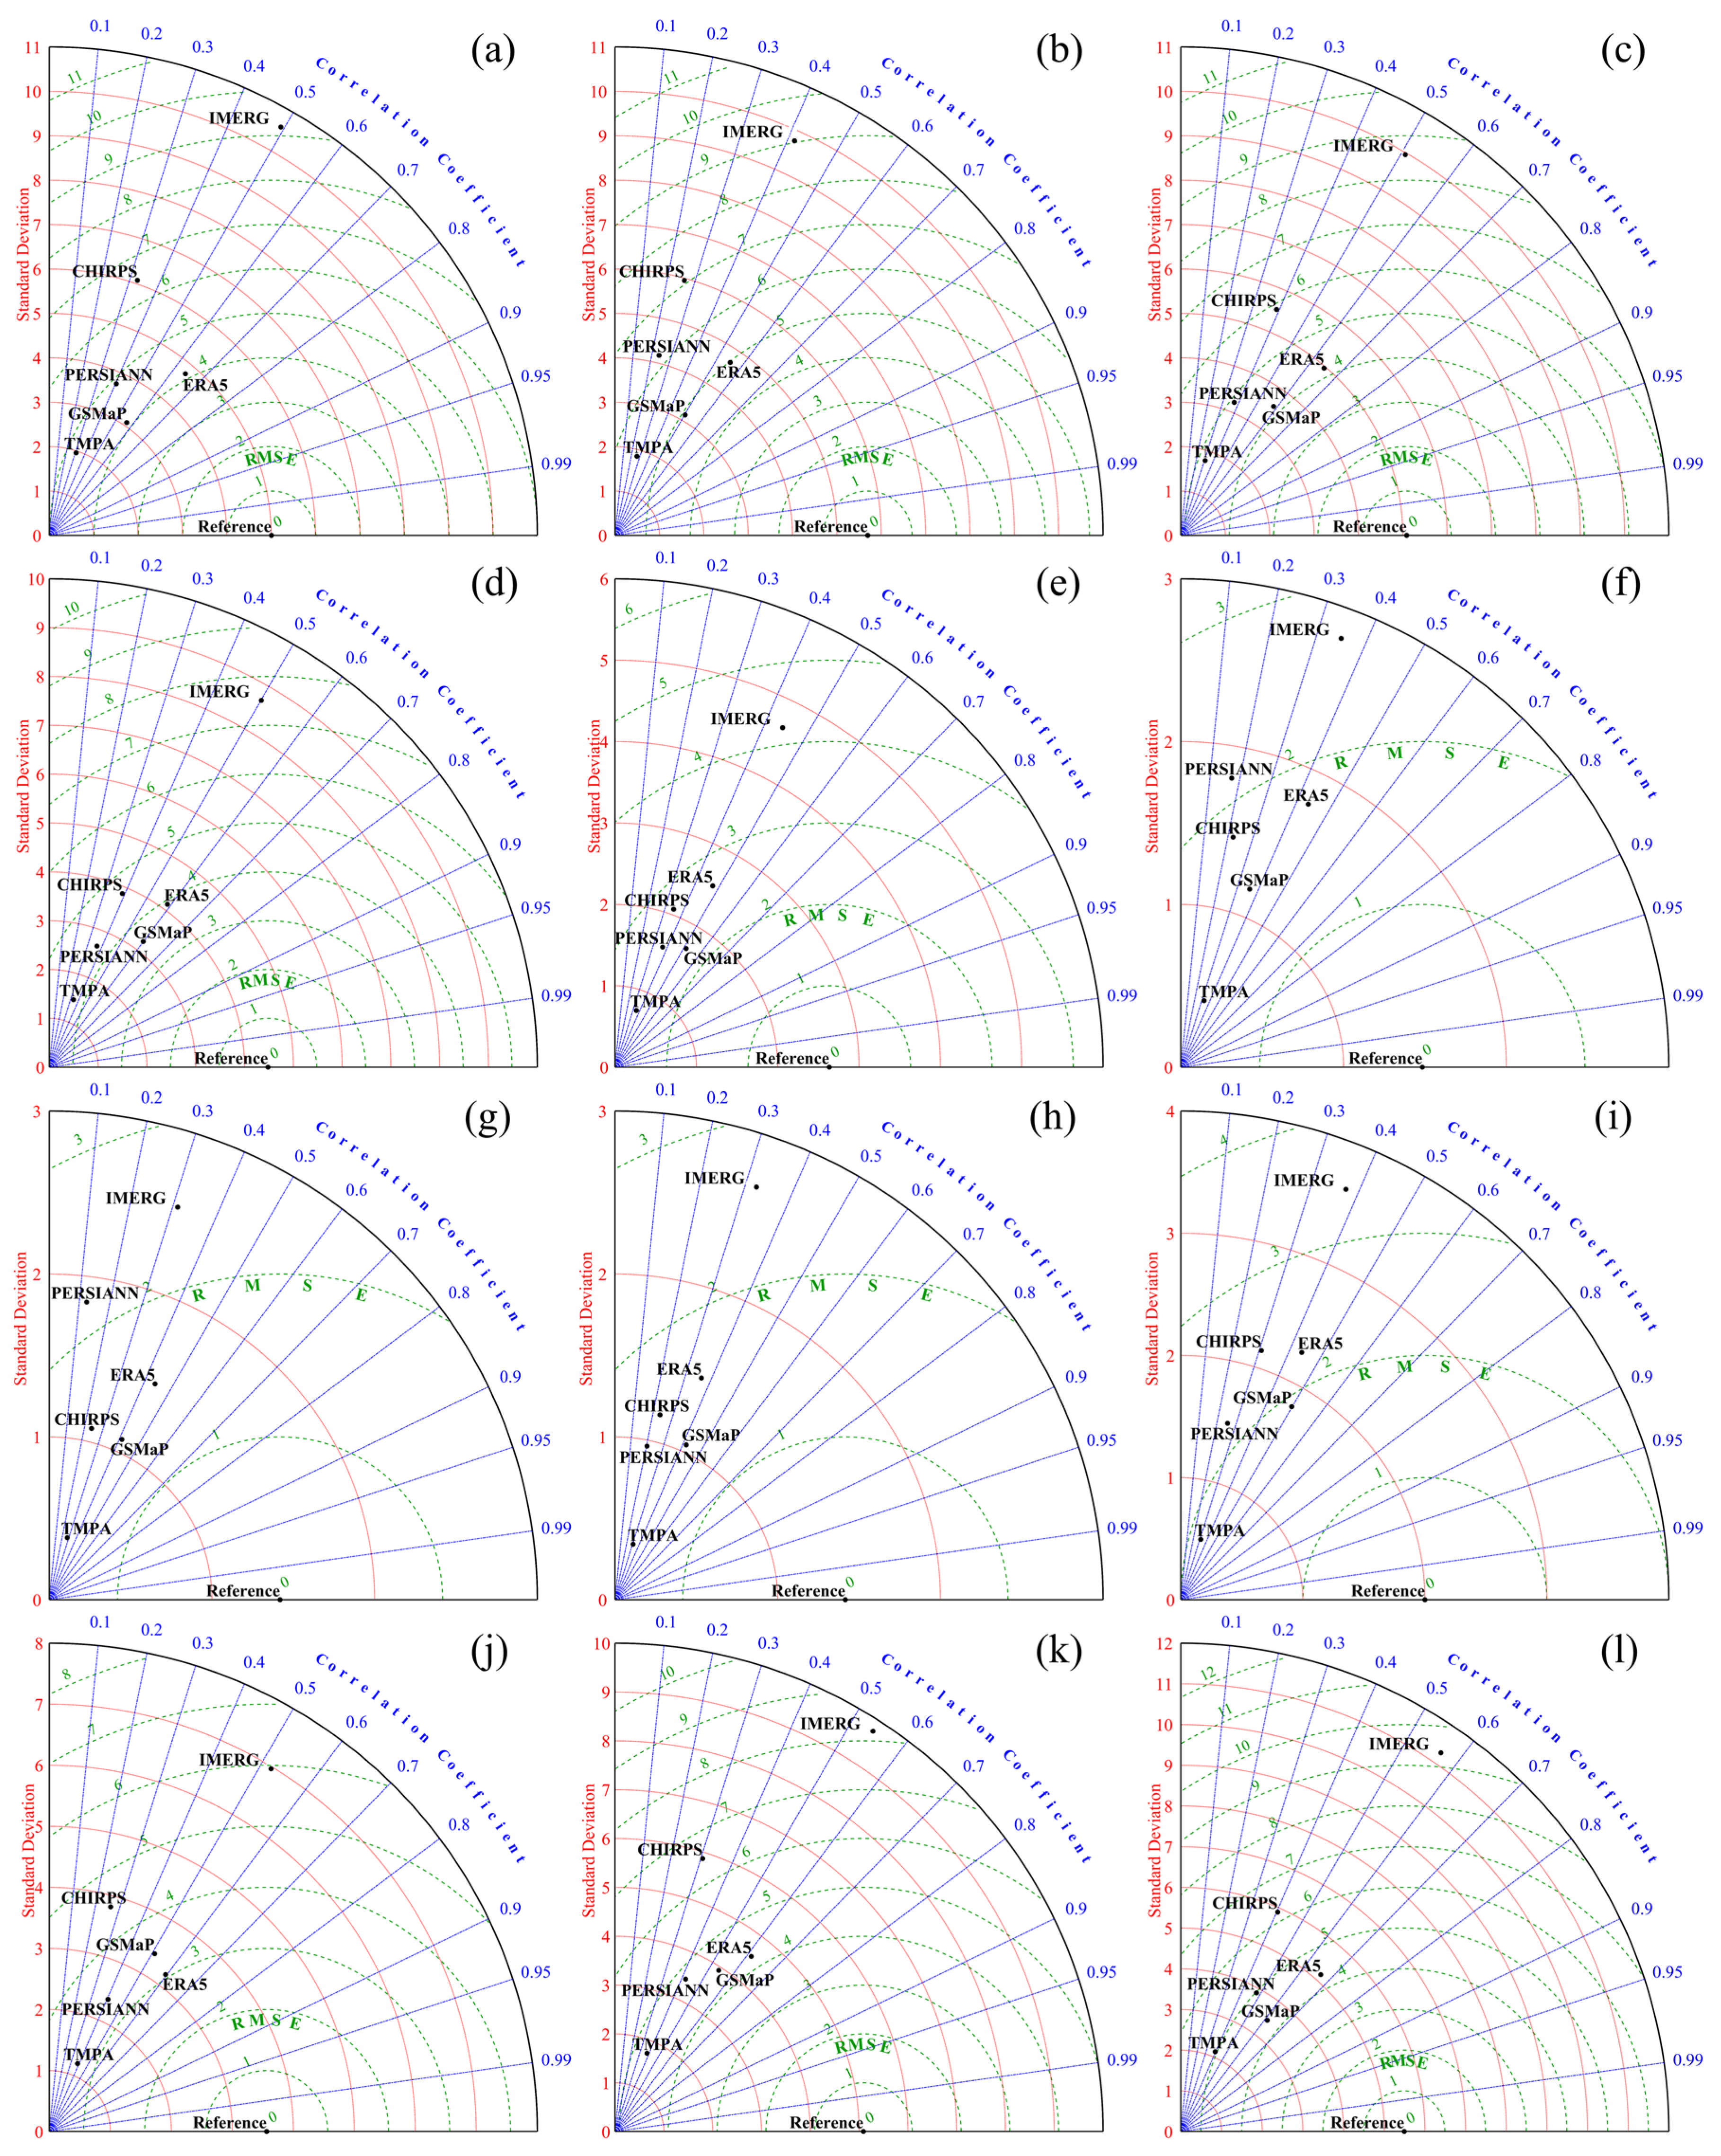
The Taylor Diagram [86] focuses on precipitation intensity assessment metrics, i.e., RMSE, CC, and Standard Deviation (SD), for performance comparison, and the associated results are illustrated in Figure 7. In these diagrams, the points (i.e., representing target precipitations for GPPs) closer to the “Reference” (i.e., representing reference precipitations from synoptic stations) point, illustrated on the horizontal axis, show better performances. In other words, closer points to the “Reference” had lower RMSE values, higher CC values, and similar SD values to the reference precipitations. In general, Figure 7 illustrates that in drier months in Iran (i.e., June, July, August, and September), in which lower precipitations occur, all GPPs are relatively closer to the “Reference” point, indicating their better performances. This was because, in drier months, the obtained RMSE and SD values for all GPPs were closer to the ones obtained from reference precipitations. However, the results indicated that all GPPs had their lowest CC values in drier months. Figure 7 shows that TMPA and GSMaP always had lower SD values than reference precipitations, and the exact reverse for IMERG, while the other GPPs did not have identical characteristics. According to Figure 7, IMERG had the highest distance from the “Reference” point, mainly due to its higher RMSE and SD values compared to other GPPs. The IMERG CC values were mostly between 0.4 and 0.6 in wet months and lower than 0.4 in drier months, making it the third most accurate GPP. The two other GPPs, namely GSMaP and ERA5, had comparable performances since, in some months, GSMaP performed better and in the remnant, ERA5 had the highest accuracies, and no exact monthly pattern was seen. For these GPPs, the CC values were between 0.4 and 0.7, both had relatively lower RMSE values, and their SD values, especially ERA5, were much closer to the reference precipitations. The other GPPs, i.e., TMPA, CHIRPS, and PERSIANN, had the weakest performance in nearly all months, where low CC, relatively higher RMSE, and disparate SD values were obtained.
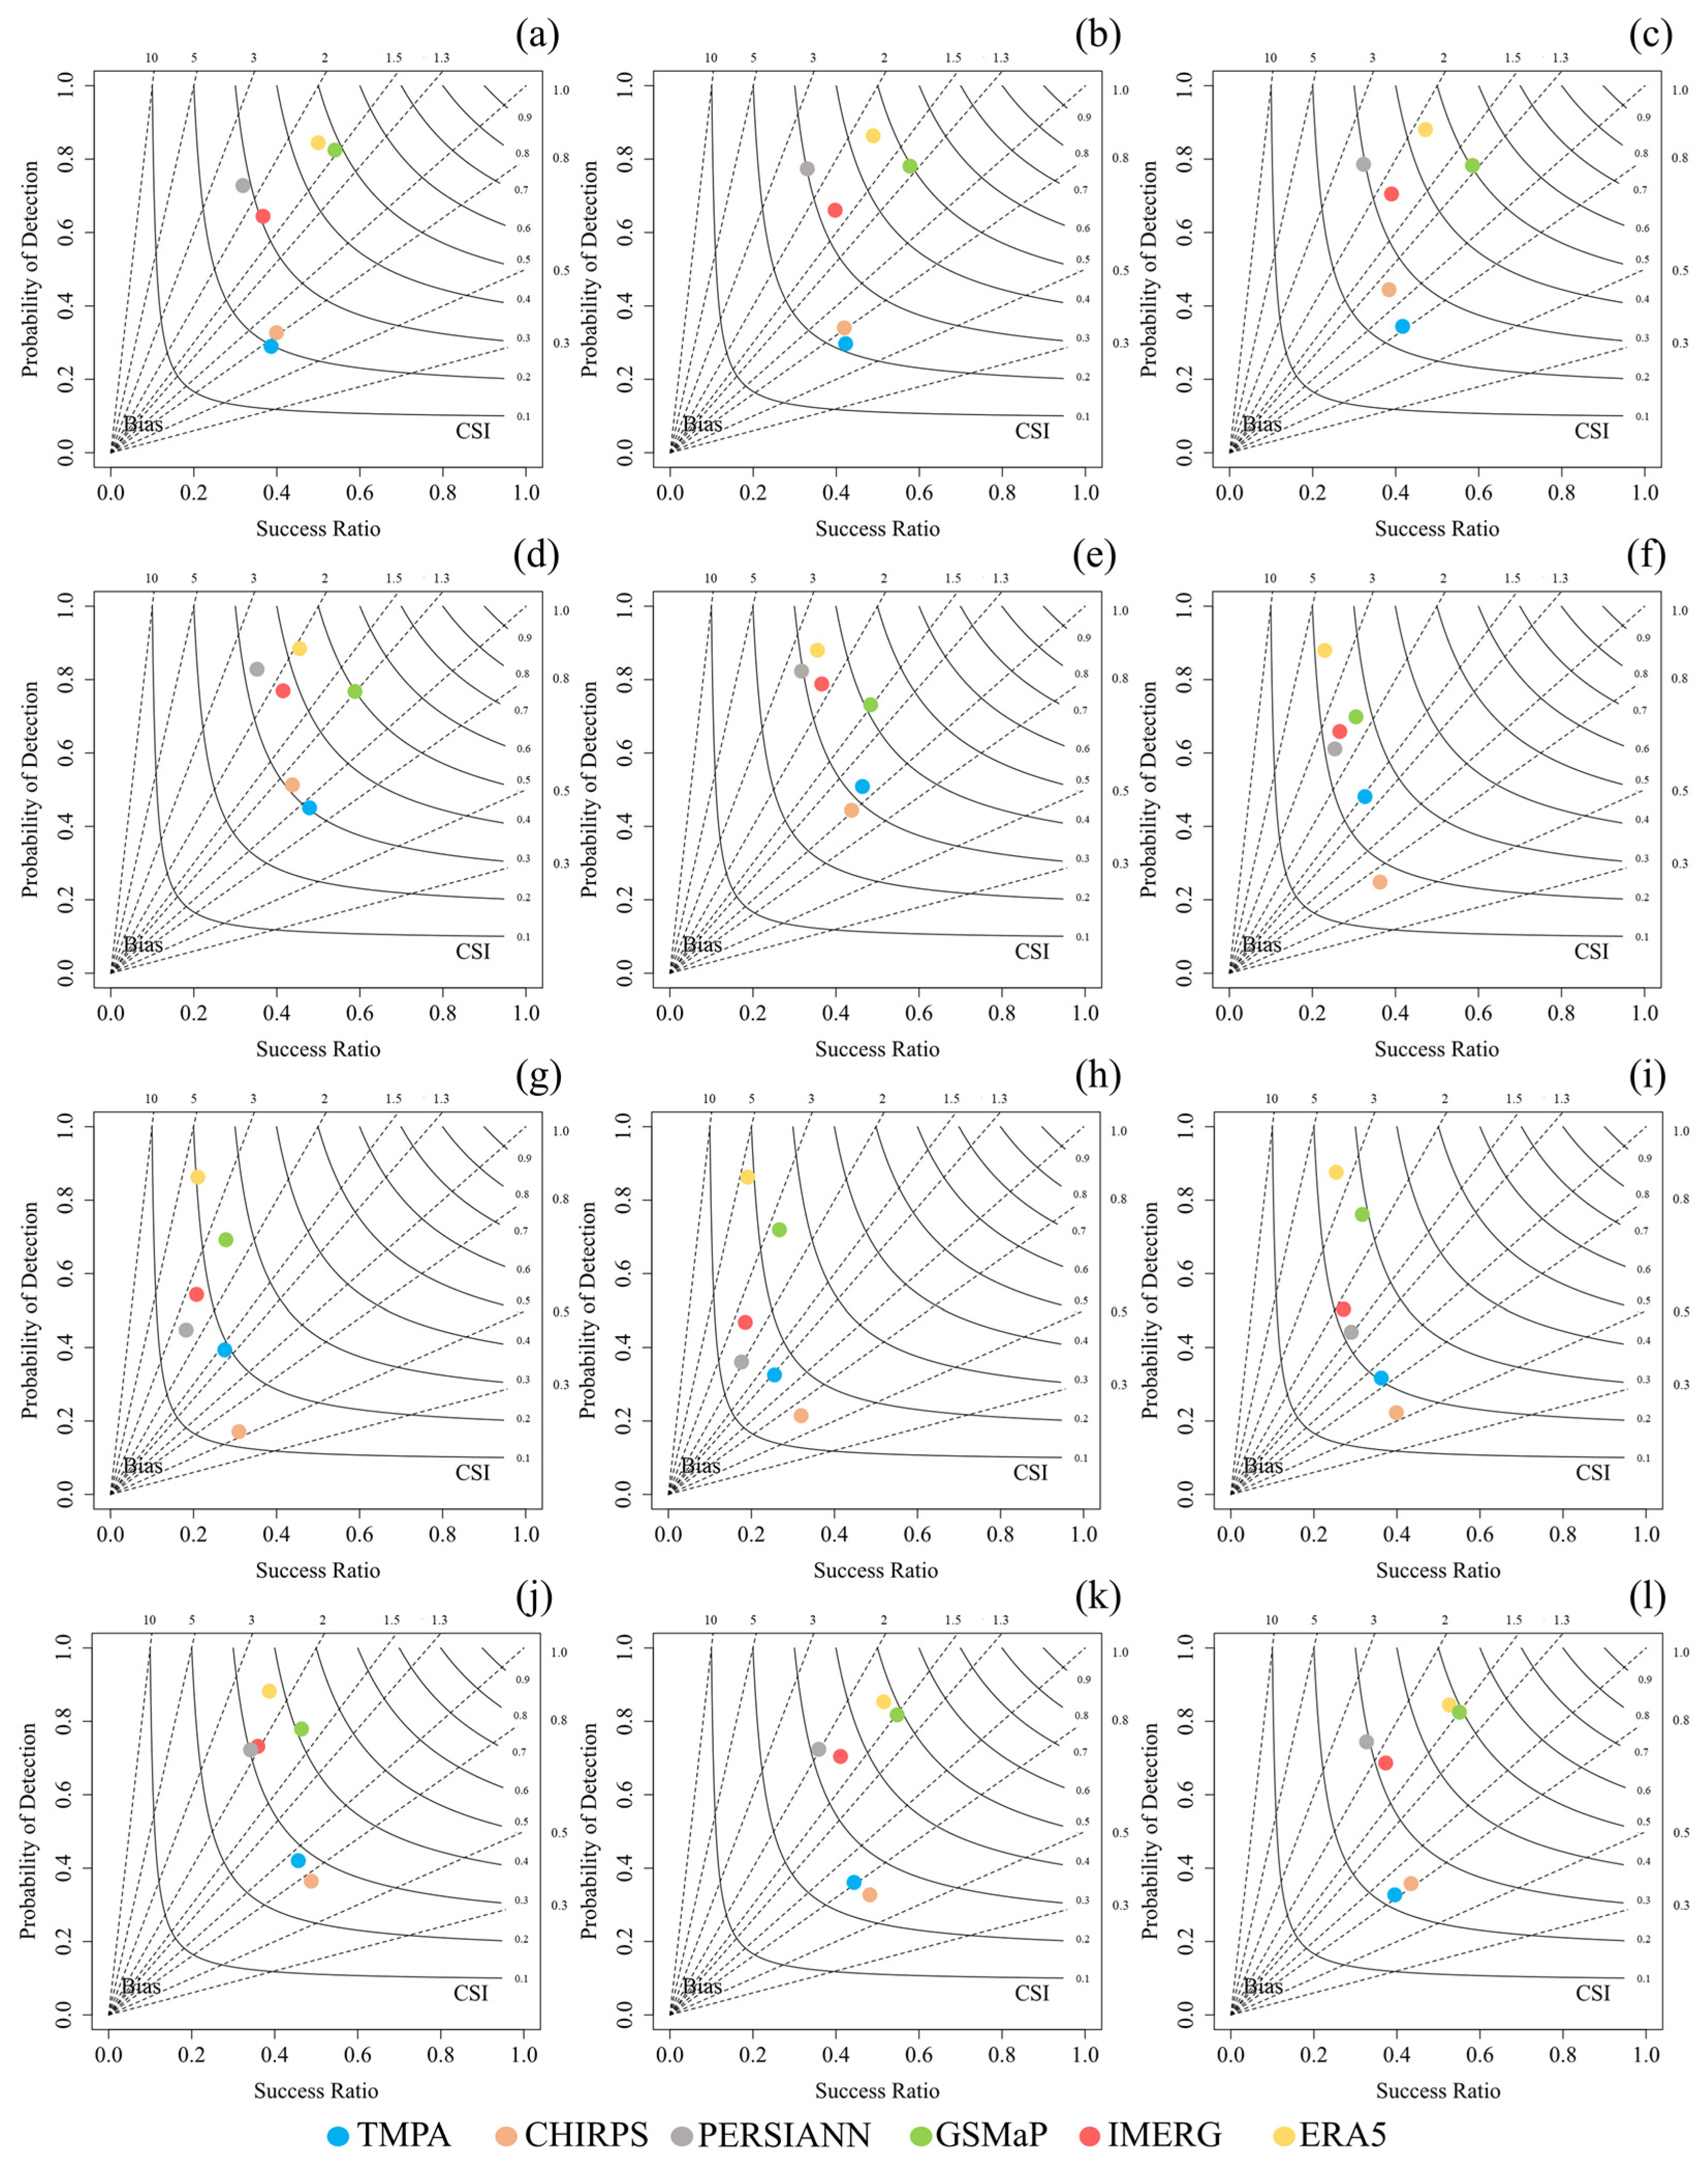
The Performance Diagram [87] focuses on precipitation occurrence assessment metrics, i.e., POD, success ratio (1 − FAR), CSI, and biases, to compare GPPs performances, and related results are presented in Figure 8. In these diagrams, the points (i.e., representing target precipitation for GPPs) closer to the right top corner had better precipitations occurrence detectability. In other words, closer points to the right top corner had high POD and CSI values and low FAR and bias values. Figure 8 demonstrates that in nearly all months, PERSIANN obtained higher biases, except for two months, in which ERA5 and IMERG had higher values. Conversely, TMPA and CHIRPS, respectively, had the lowest biases in all months. Additionally, ERA5 achieved the highest POD values monthly time scale, which was most often followed by GSMaP. However, in a few months, higher POD values were recorded for IMERG and PERSIANN than GSMaP. The Performance diagrams indicate that in dry months CHIRPS achieved a higher success ratio (lower FAR) values, while GSMaP was ranked first in the wet months. More general, the performance of all GPPs declined in drier months compared to months with higher precipitation rates and occurrences. Concerning CSI, the best performance was achieved by GSMaP, and ERA5 and IMERG were in the second and third ranks. TMPA and CHIRPS had the lowest CSI values in five and seven months, respectively, suggesting the weakest performance of TMPA. Taking all the metrics of the Performance Diagram into account, GSMaP remained the most accurate GPP in all months, and the ERA5 was second to that, followed by IMERG, PERSIANN, CHIRPS, and TMPA.

5.1.3. Yearly Time Scale

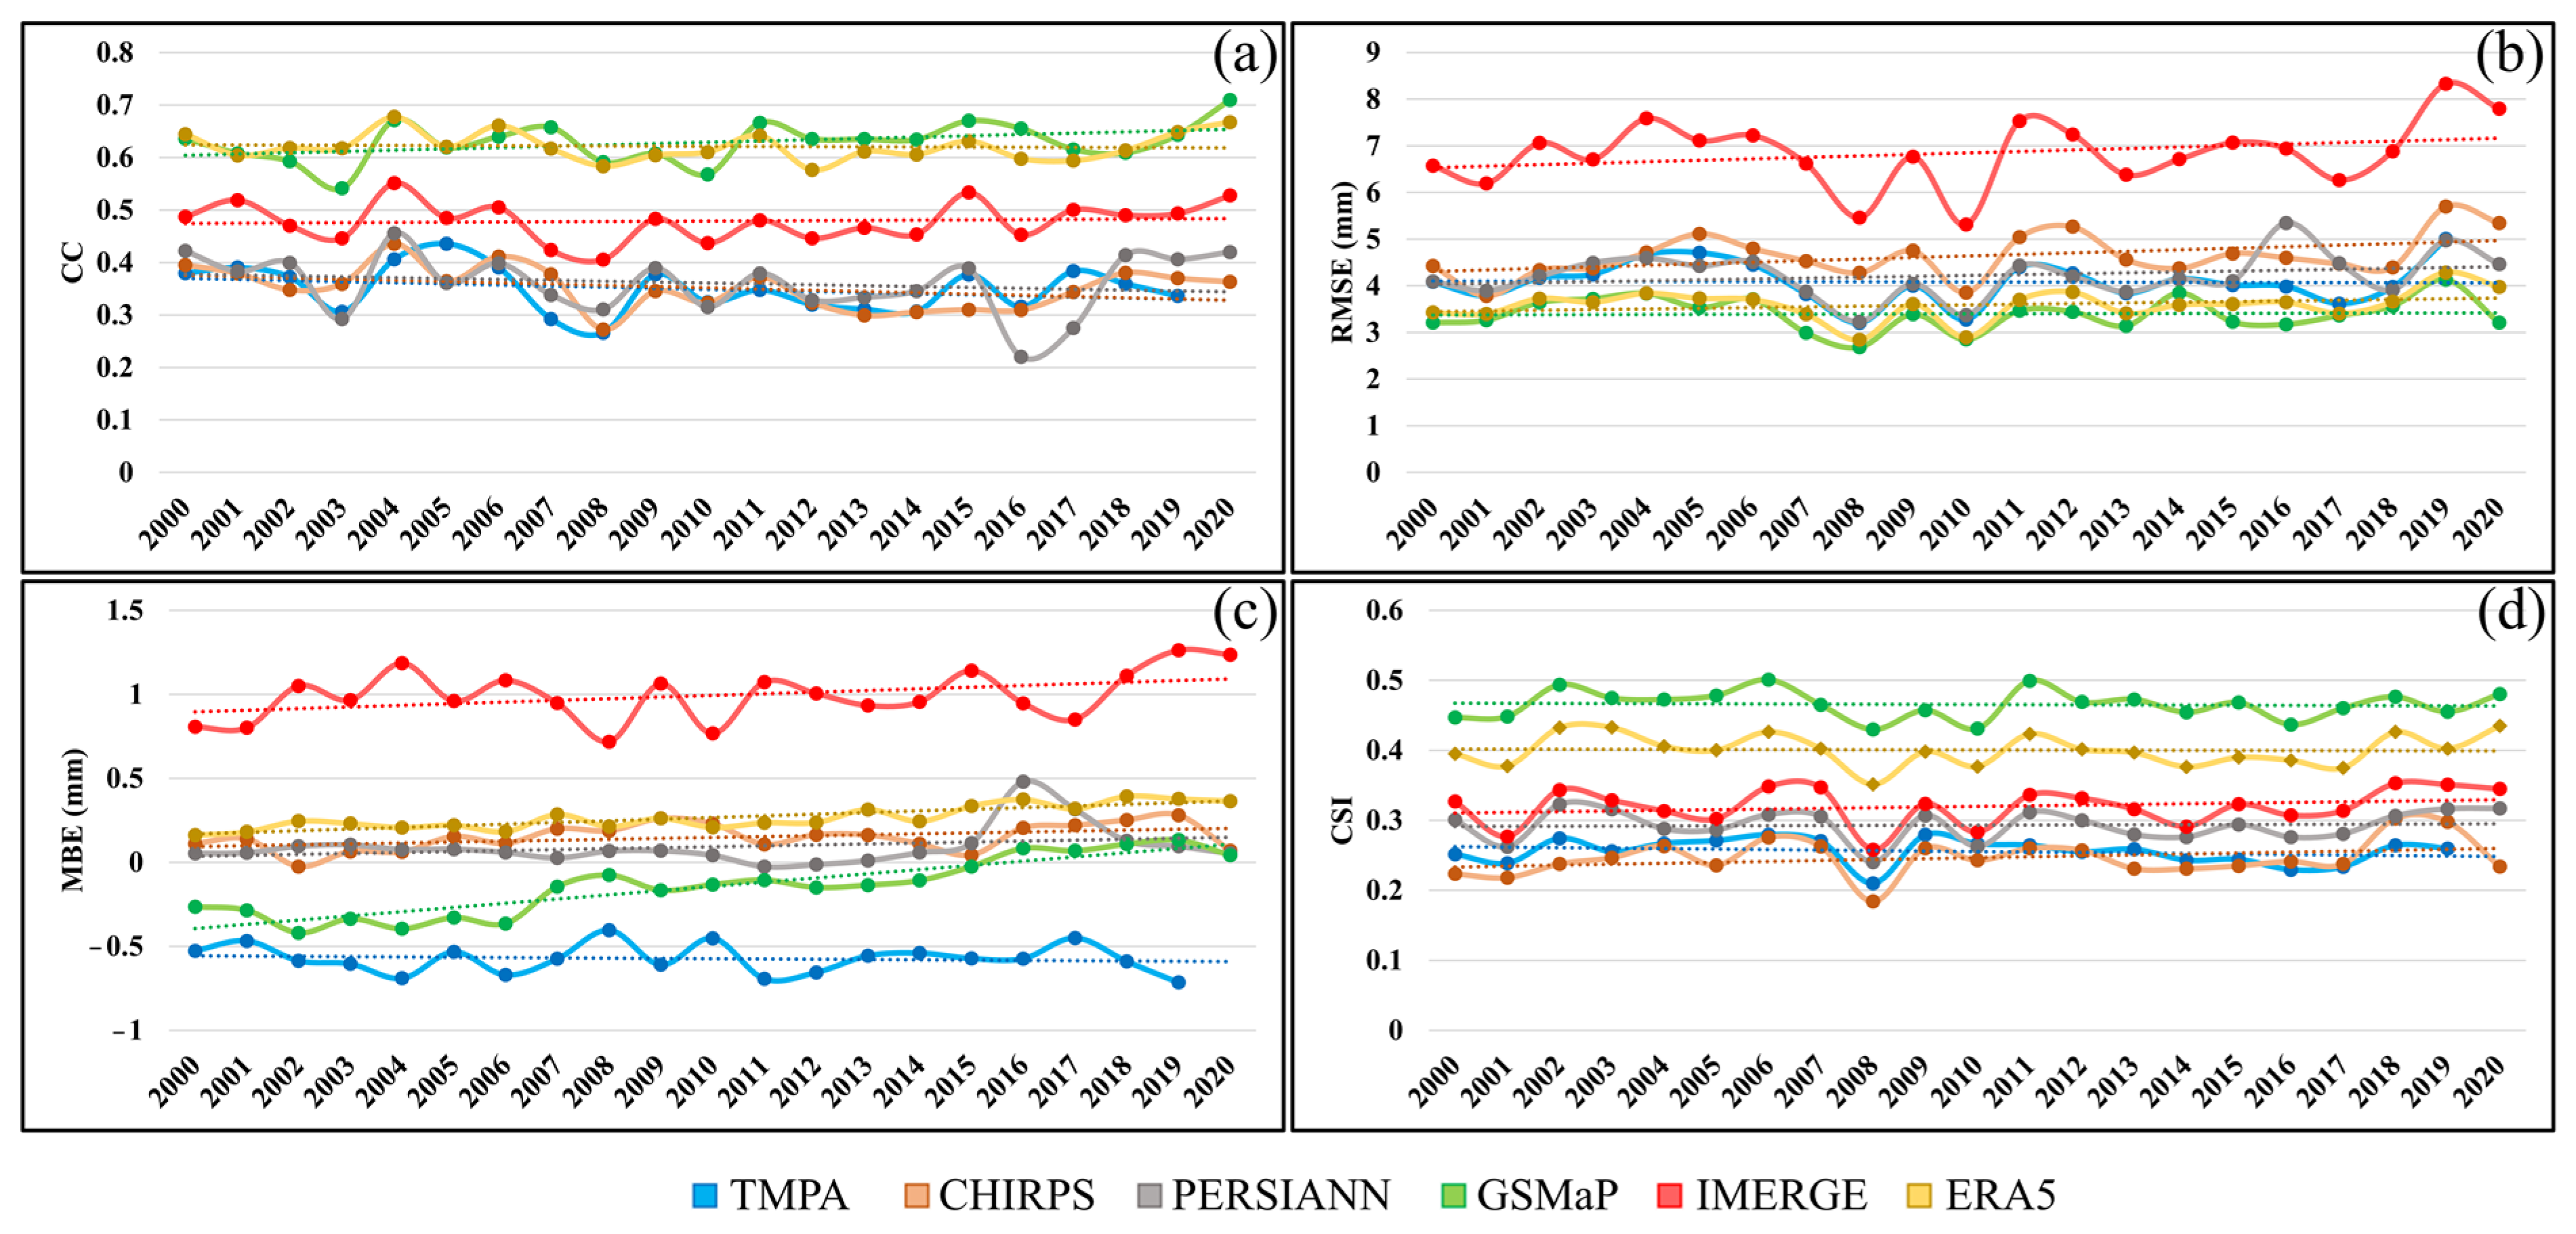
In completing the previous two subsections, daily observations of each year were also used to validate the GPPs based on CC, RMSE, MBE, and CSI (see Figure 9). This analysis could provide supportive information to understand the temporal characteristics of the selected GPPs, revealing whether they had stable performances in years over the last two decades. Figure 9a displays the yearly CC values for the GPPs, clearly indicating that before 2011, either GSMaP or ERA5 had the highest CC values, while after that, GSMaP proved to be the most accurate GPP. The results also suggested the better performance of IMERG in comparison to TMPA, CHIRPS, and PERSIANN, being the third most accurate dataset after ERA5 and GSMaP. Moreover, the CC trend lines of GPPs remained stable without a considerable and significant upward/downward trend throughout the time, with the lowest and highest SD of 0.026 (ERA5) and 0.055 (PERSIANN). Likewise, Figure 9b illustrates the RMSE dynamics for the GPPs, suggesting the higher RMSE values for IMERG. In comparison, other GPPs had lower RMSE values with relatively monotonous trends during the last two decades. The results also demonstrated that the GSMaP in almost all time intervals was the GPP with the least RMSE values, closely followed by ERA5. Additionally, the trends of MBE variations were also investigated (Figure 9c), and the results show that TMPA and IMERG had extreme consistent behaviors during the study period, having the highest underestimations and overestimations, respectively. The MBE values for the other three GPPs, i.e., CHIRPS, PERSIANN, and ERA5, were stable between 2000 and 2020, varying between 0.0 and 0.5, indicating the stable overestimations of these GPPs. However, the findings demonstrated that GSMaP MBE values had a significant trend (p-value < 0.05), which was statistically confirmed by checking the randomness test. This certified the improvement in the average bias of the GSMaP that roughly started from nearly -0.5 and reached 0.04 over the last two decades. Finally, the yearly precipitation occurrence detectability of GPPs was examined using the CSI metric. The results indicated stable trends for all GPPs with low variations and the superior performance of GSMaP and ERA5 as the two first accurate GPPs, respectively.

5.2. Evaluation Using Monthly Observations from 2000 to 2020

Daily target and reference precipitation values were employed in the present section to generate monthly accumulated and average precipitations. To this end, monthly accumulated and average precipitations were calculated for each synoptic station and the corresponding GPPs for each month between 2000 and 2020, resulting in over 250 mutual observations at the station level. Later, these values were incorporated to compute three continuous metrics of CC, RMSE, and MBE at the station level. Their average and SD values were used to examine the capability of the six GPPs in capturing monthly accumulated and average precipitations throughout Iran. Table 3 and Table 4 summarize the computed continuous metrics for the GPPs. It is evident that the CC values of all GPPs had improved as the monthly accumulated and average data were used. In this regard, the most remarkable improvement was observed for TMPA, in which its CC values increased from 0.330 (daily observations) to 0.794 (monthly accumulated values). Furthermore, in terms of the CC value when using monthly accumulated precipitations, IMERG obtained the highest value of 0.857 ± 0.094, and ERA5 was the second most accurate GPP. The low SD of the CC value for the IMERG suggested that the high CC value was recorded for most of the stations. On the other hand, GSMaP and PERSIANN with 0.767 ± 0.137 and 0.752 ± 0.122 were two GPPs with the weakest performances. The achieved MBE values suggested that the underestimation and overestimation behavior of GPPs remained similar to daily observations; however, their magnitudes have notably increased. The MBE value of IMERG for monthly accumulated data exceeded 30 mm/month on average, with a relatively high SD value, indicating much higher recorded overestimations. Likewise, TMPA had an MBE value of −17.65 mm/month with a greater SD value, identifying this GPP as the second-worst GPP in terms of precipitation biases. Moderate overestimation was observed for ERA5, and CHIRPS, GSMaP, and PERSIANN had more satisfactory performances. Based on the RMSE values, the GPPs performance can be ranked as GSMaP, ERA5, CHIRPS, PERSIANN, and IMERG, with the highest and lowest RMSE values of 22.73 mm/month and 50.89 mm/month. Furthermore, the findings revealed that when using monthly average precipitations, IMERG and ERA5 are the two highest GPPs, while this does not hold for the other two metrics. In fact, PERSIANN and GSMaP were recognized as the best-performing GPPs in terms of MBE and RMSE, respectively.

5.3. Evaluation Using Yearly Observations from 2000 to 2020

Similar to using monthly observations, in this part, daily precipitation data of both synoptic stations and GPPs were aggregated to generate yearly accumulated and average precipitations. Afterward, three continuous metrics were computed using the generated yearly precipitations to assess the performance of the GPPs. The obtained average and SD values of CC, RMSE, and MBE based on yearly observations at the station level are provided in Table 5 and Table 6. The findings suggest that the computed CC values increased for all GPPs in comparison to using daily observations, except for GSMaP. Based on yearly observations, IMERG and GSMaP were identified as the most and least accurate GPPs, and the second to fifth ranks were for ERA5, TMPA, CHIRPS, and PERSIANN, respectively. However, when considering MBE, PERSIANN and GSMaP had the two lowest average MBE magnitudes of 34.79 mm/year (overestimation) and 44.23 mm/year (underestimation), with the lowest MBE SD for GSMaP, proving its more stable characteristics throughout the country. On the other hand, TMPA and IMERG underestimated and overestimated the yearly precipitation values by about 200 mm/year and 360 mm/year, respectively. In terms of the RMSE, the lowest value was acquired by CHIRPS and was very closely followed by GSMaP; however, considering their RMSE SD values, GSMaP had the capability of providing more consistent precipitation estimates across the country. Conversely, IMERG with 389.29 mm/year and TMPA with 223.23 mm/year obtained the two highest RMSE values, along with the two highest RMSE SD values, representing their unsatisfactory performances in capturing yearly precipitations.

6. Discussion

6.1. General Remarks

The increasing availability of GPPs has attracted the interest of many scholars in a wide range of academics. Accordingly, the developed GPPs have been widely employed for different purposes worldwide [20,23,29,38,46,81,88]. However, the lack of quantitative confidence in GPPs remained a critical concern that should be addressed appropriately [89]. This is due to the fact that any existing error in precipitation estimates, such as magnitude errors, will propagate into the used models and final results, in which precipitation estimates are incorporated [90,91,92]. For instance, studies reported the impact of bias error on specific parameters in hydrological modeling, such as peak flow and catchment modeling, as well as the effect of precipitation underestimation/overestimation on drought/wet event detection and drought monitoring [24,93,94,95]. Additionally, the introduced error may be amplified through the modulation, causing higher uncertainties and making the final results less reliable [91]. Therefore, the best practice as the prerequisite is to evaluate GPPs in order to quantitate the magnitudes of errors and identify the error characteristics adequately. This will allow one to choose a product with higher accuracy and make it possible to model the error propagation for any specific goal, and thus, the final results can be provided with associated uncertainties as auxiliary information. This may result in better representations of the real-world situation when using GPPs and promoting informed decision making. Additionally, the validation results in any specific region could be considered an effective proxy to foster enhancements in GPPs globally or regionally [32].
It is essential to incorporate various metrics to evaluate the performance of GPPs from different and complementary perspectives. In this regard, continuous and categorical metrics focusing on precipitation intensity and occurrence evaluation could be used. Accordingly, comprehensive validation research should include both aspects to benefit the research community. Furthermore, a critical reason that lies under the consideration of various metrics is that no single metric could manifest the performance of GPPs, and no single perspective could satisfy the requirement of the whole research community. In other words, one metric might be relatively more important for some researchers, while other metrics are more influential in other disciplines. For instance, Camici et al. [96] investigated the importance of continuous and categorical metrics for GPPs’ evaluation on river discharge simulation. They reported that the categorical metrics and the continuous metric of CC did not provide pertinent information, whereas biases (i.e., MBE) and the RMSE were reliable metrics to select a GPP with superior performance for discharge simulation [96]. Conversely, for some other disciplines in which the number of precipitations/no-precipitations is an influential factor, the categorical metrics, i.e., POD, FAR, and CSI, would be more informative [97,98].

6.2. Discussing and Comparing the Results

This paper evaluated six GPPs using in situ observations of synoptic stations from 2000 to 2020 throughout Iran. Both continuous and categorical metrics were considered for the validation process to benefit researchers in different disciplines. The findings, in general, suggested a discrepant performance of all GPPs, which was anticipated since each GPP was generated using multiple sources, different approaches and algorithm principles for blending the sources, and different bias adjustment procedures. In total, the findings pointed out that TMPA and GSMaP underestimated the precipitation values, while other GPPs, i.e., PERSIANN, CHIRPS, ERA5, and IMERG, overestimated precipitation values with spatial discrepancies across Iran (see Table 2, Table 3, Table 4, Table 5 and Table 6 and Figure 5). These were in agreement with previous investigations globally and regionally [51,99,100,101,102,103,104]. Considering daily data that contained over 1.7 million observations, GSMaP was identified as the first accurate precipitation product in Iran over the last two decades, which was similar to findings by Tang et al. [35] in China. In particular, GSMaP obtained the lowest RMSE and MAE values with the highest CSI value, supporting the superior performance of this GPP over others compared in this study. This may be traced back to the utility of both infrared and microwave data sources, as well as daily bias adjustment to generate GSMaP GPP [15,19]. ERA5 was identified as the second most accurate GPP, suggesting the acceptable performance of this reanalysis precipitation product throughout Iran. Although both IMERG and GSMaP are emerging GPPs from the GPM mission, the daily observations indicated a higher overestimation and biases of IMERG. It could probably be associated with the monthly bias adjustment of IMERG, while the GSMaP uses daily adjustments, and this could be a prospect to improve IMERG performance. The daily observations at the station level also supported the findings when using the whole time-series observations. Furthermore, the station-level analysis revealed that overestimation/underestimation with larger magnitudes occurred in regions with higher precipitation rates. Therefore, such knowledge could be effectively incorporated when working on GPPs’ enhancement. In other words, the precipitation rate (i.e., yearly) could be considered as an input factor, along with other relevant factors, to apply recalibrations and improvements to GPPs using statistical and machine learning algorithms [105,106]. The investigations on the monthly time scale using daily observations revealed the better performances of all GPPs in dry months based on lower RMSE and SD values, which can also be related to lower precipitation rates in these times. However, this did not hold for precipitation occurrence detectability since all GPPs had their weakest performances in dry months based on categorical metrics. This suggests that future studies could be shaped on improving the precipitation intensity and occurrence enhancement of GPPs in wet and dry months, respectively. Categorical metrics in all months suggested the premiere performance of GSMaP, while the continuous metrics indicated the better performance of ERA5 in some months. The yearly time scale comparisons (Section 5.1.3) illustrated that, in general, the quality of GPPs remained the same over the past two decades in Iran. In particular, the consistent and stable CSI values indicated no improvement in precipitation occurrence detectability for all GPPs, which was in contrast with another study conducted in China [35]. The discrepancies may lie in the geographical conditions of the study areas, the implemented frameworks, and the amount of international collaboration of countries in sharing the in situ data for global datasets that are employed for bias adjustments. In fact, the global GPPs that are used for calibration and bias adjustment of other GPPs suffer from a lack of spatial density consistency, and such limitations could lead to inconsistent results [107,108]. However, based on the MBE metric, a notable trend was observed for GSMaP, indicating bias correction improvements over the last two decades.
Moving toward monthly observations, the CC values of all GPPs improved considerably; however, this was not true for two other metrics. The increase of CC values, while other metrics were not generally enhanced, probably suggests that CC would not be a reliable metric to present the best performing GPP (see Table 3 and Table 4), which was also stated by Camici et al. [96] for discharge modeling. In fact, the obtained MBE and RMSE values were relatively higher when compared to daily values multiplied by the number of days. This suggests applying more robust bias correction procedures since this amount of bias and RMSE value could lead to unreliable results. Although, one alternative solution could be the use of monthly estimates of GPPs instead of generating monthly estimates from daily estimations, in case their monthly estimations are available and had been generated separately. For instance, the PERSIANN daily estimates are the disaggregation of monthly estimates [16], and thus, the original monthly estimates might have better accuracies. Furthermore, the average monthly data were found to be more accurate than the monthly accumulated data, suggesting the usage of monthly average data instead of accumulated data for different applications if applicable. Finally, the validation of GPPs based on yearly (12 months) observations, either in average or accumulation, showed that the CC values for some GPPs were improved, while some remained relatively the same with respect to the daily comparison. However, even for GPPs whose CC values had improved, other metrics, i.e., MBE and RMSE, generally showed reverse trends. High MBE and RMSE values, along with their high SD values, suggest using yearly accumulated data with high caution. The yearly observations also implied that CHIRPS data had the lowest RMSE values and, in this term, were the most accurate GPP, and GSMaP was second to that. In summary, the comparison in different time scales indicated that in longer time intervals (monthly or yearly), the accumulated estimates had larger errors than the average estimates and may lead to higher uncertainties in any task. For instance, it can be suggested that yearly average data could provide more accurate results (i.e., than yearly accumulated) for applications in which annual precipitation data are required, such as trend analysis. This is because yearly accumulated data are associated with more significant errors, and consequently, these errors would propagate and amplify into the models [91], making the final result unreliable. Consequently, the results could not present the real-world situation properly and may bias the final understandings and conclusions.

6.3. Sources of Uncertainties

In this paper, the point-to-pixel comparison method was implemented to assess the performance of the GPPs throughout Iran [83,84,85]. Accordingly, the results may undervalue the exact accuracies of the GPPs due to mismatches between point measurements (i.e., synoptic stations) and pixel measurements (i.e., GPPs), which is acceptable for any in situ based validation studies [35]. This issue may also be a source of uncertainty as the spatial resolution of GPPs differ, and the limited representativeness of point observations could affect the results. For instance, the temporal inconsistency between the Coordinated Universal Time (UTC) and local time of recording in situ could probably introduce some uncertainties into the daily validations [109]. Furthermore, the inherent spatial mismatch between in situ data and GPPs, as well as the precipitation under-catch of in situ instruments due to the wind effect, are other sources of uncertainties [110,111]. However, it is worth noting that the point-to-pixel and pixel-to-pixel comparisons would provide similar statistical results and may be negligible for the inter-comparison and ranking of GPPs [112]. Therefore, it is expected that the actual accuracy of GPPs would be higher than the ones reported in this study and also other validation studies. Although, the current state of GPPs required further modifications and enhancement to provide more accurate data.

6.4. Criteria beyond Accuracy

In addition to the discussed criteria for measuring the accuracy of GPPs, some other criteria might be considered simultaneously to select the most appropriate GPP. For instance, the spatial resolution of GPPs might be a constraint in some applications, and accordingly, GPPs with a higher spatial resolution should be employed [113]. Among the GPPs, CHIRPS provides precipitation estimates with the highest spatial resolution (0.05° × 0.05°), and thus, could be of use for the application needing more data for a particular region. Additionally, some other applications which require simulating the diurnal cycles need GPPs with sub-daily estimates that also limit the choices considering the original GPPs. However, another solution might be to use the most accurate GPP and apply downscaling approaches to have the most accurate GPP with higher spatial and temporal resolutions [114,115]. Moreover, the necessity of having precipitation data for a more extended period, i.e., before 2000, could also introduce another factor that limits the choices to fewer GPPs, such as CHIRPS, PERSIANN, and ERA5.

6.5. Current State and Future Perspectives

Iran’s climate is dominated by arid and semi-arid climate zones, which are characterized by low precipitation and high evapotranspiration rates. The country has faced many climate hazards, such as drought and floods [65]. Meanwhile, the events are coupled with the over-abstraction of groundwater and over-reliance on non-renewable water sources that have escalated the water resource condition into crisis [116,117]. Accordingly, to reduce and reverse the current water resource trend in Iran, in addition to effective legislation to stop aggressive water demands, having access to high-quality data, such as accurate precipitation estimates, is a prime need. In particular, the availability of reliable and long-term precipitation data allows for the better monitoring of water resource conditions and the adoption of more sophisticated strategies to mitigate the water crisis. The findings of this paper, on the whole, indicate that the current state of GPPs requires further modifications and enhancements to provide more precise and accurate estimates of precipitation over Iran. Although these GPPs have been widely employed globally, and also in Iran, more accurate GPPs are needed with respect to the current state of Iran. In fact, the more accurate GPPs allow the more accurate monitoring of relevant phenomena, such as drought, and managing water resources. Beyond the validation analyses in the present study, other scholars reported just satisfactory accuracies and flaws of GPPs across Iran and globally [35,56,57,109,118]. Although they have identified the best-performing GPP in their region, the common implications in the most relevant studies were the acceptable accuracy of GPPs, not the highly potential precipitation estimates overall. Therefore, this is a critical need to enhance such GPPs for the entirety of Iran. The common practices may include applying the further regional (i.e., country/basin level) bias correction and calibration of a GPP, with potential performance, enhancing its capabilities, as with other regions [98]. An alternative solution could be to generate a precipitation platform, similar to the Canadian Precipitation Analysis [119], to combine all available data sources, GPPs and in situ data, and generate a unified and accurate GPP for Iran. This platform can have the sub-country level extension based on the precipitation rate, climate zones, or basins to develop the unified GPP with higher accuracy. This platform could provide high-quality precipitation data to help scholars conduct more accurate research and governors make informative decisions for water resource monitoring and management.
Although Iran was considered the case study here, the aforementioned points are not only associated with Iran. Accordingly, other countries with a high demand for accurate precipitation datasets require such platforms to deepen their understanding of relevant phenomena and future forecasts [13]. There are currently several global and regional GPPs and platforms; nevertheless, the diversity of climates and other influential factors hamper the full potential of these GPPs for detailed regional or country-level studies [6]. Consequently, the generation of national precipitation platforms can be a prospective solution for a better understanding of precipitation patterns, promoting better water resource management, and achieving Sustainable Development Goals (SDGs). In the last point, these national platforms could be merged through international collaborations to make a consolidated precipitation platform that better fits the national, regional, and global scales.

7. Conclusions

In this paper, six well-known Gridded Precipitation Products (GPPs) were evaluated using two decades of in situ observations (over 1.7 million) throughout Iran. The initial examinations revealed that over 81% of synoptic stations were independent of those incorporated for the calibration or bias correction of GPPs. The evaluation results based on daily observations suggested the better overall performance of GSMaP in the last two decades. Considering the whole time series, TMPA and GSMaP had underestimation, while the other GPPs overestimated the precipitation values. However, the further spatial analysis at the station level revealed that all GPPs, except TMPA, had diverse error characteristics throughout Iran. In other words, the GPPs include both underestimations and overestimations in different regions, with the dominance of one. It was also observed that for all GPPs, the overestimation and underestimation magnitudes were linked to the precipitation rates with the same behavior. Furthermore, the daily observations at the monthly time scale illustrated that all GPPs obtained better quantitative values in dry months based on continuous metrics, while the categorical metrics suggested the reverse. The yearly comparisons demonstrated that the GPPs’ capability, in general, remained the same over the past two decades, except for the MBE of GSMaP, which presented a significant improvement. The monthly and yearly accumulated precipitation values from the GPPs represented large errors, i.e., RMSE and MBE, indicating that the utility of these values would introduce high uncertainties to any models or results. Therefore, the monthly or yearly average values could better suit similar applications, or the original monthly/yearly precipitation products could provide more accurate results. Additionally, the yearly precipitation values illustrated the superior performance of CHIRPS, and GSMaP was ranked second in this regard. Although, on the whole, this paper identified GSMaP as the best-performing GPP in Iran, other factors (e.g., temporal resolution and spatial resolution) that were discussed should also be taken into account for GPP preferences. Moreover, the general implication of this paper was that even though different GPPs have emerged, they do not include highly accurate precipitation estimates, and more future works are required to improve their performances or merge multiple products to obtain new precipitation products with better accuracy.

Author Contributions

Conceptualization, A.G., A.M. and S.J.; methodology, A.G.; software, A.G.; validation, A.G.; formal analysis, A.G.; investigation, A.G.; resources, A.G.; data curation, A.G.; writing—original draft preparation, A.G.; writing—review and editing, A.G., A.M., S.J. and Z.D.; visualization, A.G.; supervision, A.M. and S.J.; project administration, A.G. and S.J.; funding acquisition, S.J. All authors have read and agreed to the published version of the manuscript.

Funding

This research received no external funding.

Data Availability Statement

The Gridded Precipitation Products (GEE) supporting the reported results of this paper are publicly available from the Google Earth Engine (GEE) data catalog. The in situ precipitation observations were obtained from the Islamic Republic of Iran Meteorological Organization (IRIMO).

Acknowledgments

The authors would like to sincerely appreciate the support of the Islamic Republic of Iran Meteorological Organization (IRIMO) for kindly providing the in situ precipitation values from the synoptic stations throughout Iran. During this study, Arsalan Ghorbanian was funded by the Erasmus + ICM programme for a 5-month stay at Lund University, Sweden.

Conflicts of Interest

The authors declare no conflict of interest.

References

  1. Kidd, C.; Huffman, G. Global Precipitation Measurement. Meteorol. Appl. 2011, 18, 334–353. [Google Scholar] [CrossRef]
  2. Alazzy, A.A.; Lü, H.; Chen, R.; Ali, A.B.; Zhu, Y.; Su, J. Evaluation of Satellite Precipitation Products and Their Potential Influence on Hydrological Modeling over the Ganzi River Basin of the Tibetan Plateau. Adv. Meteorol. 2017, 2017, 3695285. [Google Scholar] [CrossRef] [Green Version]
  3. Try, S.; Tanaka, S.; Tanaka, K.; Sayama, T.; Oeurng, C.; Uk, S.; Takara, K.; Hu, M.; Han, D. Comparison of Gridded Precipitation Datasets for Rainfall-Runoff and Inundation Modeling in the Mekong River Basin. PLoS ONE 2020, 15, e0226814. [Google Scholar] [CrossRef] [PubMed] [Green Version]
  4. Romero, P.E.; González, M.H.; Rolla, A.L.; Losano, F. Forecasting Annual Precipitation to Improve the Operation of Dams in the Comahue Region, Argentina. Hydrol. Sci. J. 2020, 65, 1974–1983. [Google Scholar] [CrossRef]
  5. Wei, L.; Jiang, S.; Ren, L.; Wang, M.; Zhang, L.; Liu, Y.; Yuan, F.; Yang, X. Evaluation of Seventeen Satellite-, Reanalysis-, and Gauge-Based Precipitation Products for Drought Monitoring across Mainland China. Atmos. Res. 2021, 263, 105813. [Google Scholar] [CrossRef]
  6. Boluwade, A. Remote Sensed-Based Rainfall Estimations over the East and West Africa Regions for Disaster Risk Management. ISPRS J. Photogramm. Remote Sens. 2020, 167, 305–320. [Google Scholar] [CrossRef]
  7. Amekudzi, L.K.; Yamba, E.I.; Preko, K.; Asare, E.O.; Aryee, J.; Baidu, M.; Codjoe, S.N.A. Variabilities in Rainfall Onset, Cessation and Length of Rainy Season for the Various Agro-Ecological Zones of Ghana. Climate 2015, 3, 416–434. [Google Scholar] [CrossRef]
  8. Atiah, W.A.; Tsidu, G.M.; Amekudzi, L.K. Investigating the Merits of Gauge and Satellite Rainfall Data at Local Scales in Ghana, West Africa. Weather Clim. Extrem. 2020, 30, 100292. [Google Scholar] [CrossRef]
  9. Yu, C.; Hu, D.; Liu, M.; Wang, S.; Di, Y. Spatio-Temporal Accuracy Evaluation of Three High-Resolution Satellite Precipitation Products in China Area. Atmos. Res. 2020, 241, 104952. [Google Scholar] [CrossRef]
  10. Wang, N.; Liu, W.; Sun, F.; Yao, Z.; Wang, H.; Liu, W. Evaluating Satellite-Based and Reanalysis Precipitation Datasets with Gauge-Observed Data and Hydrological Modeling in the Xihe River Basin, China. Atmos. Res. 2020, 234, 104746. [Google Scholar] [CrossRef]
  11. Duan, Z.; Liu, J.; Tuo, Y.; Chiogna, G.; Disse, M. Evaluation of Eight High Spatial Resolution Gridded Precipitation Products in Adige Basin (Italy) at Multiple Temporal and Spatial Scales. Sci. Total Environ. 2016, 573, 1536–1553. [Google Scholar] [CrossRef] [Green Version]
  12. Faridzad, M.; Yang, T.; Hsu, K.; Sorooshian, S.; Xiao, C. Rainfall Frequency Analysis for Ungauged Regions Using Remotely Sensed Precipitation Information. J. Hydrol. 2018, 563, 123–142. [Google Scholar] [CrossRef] [Green Version]
  13. Sun, Q.; Miao, C.; Duan, Q.; Ashouri, H.; Sorooshian, S.; Hsu, K.-L. A Review of Global Precipitation Data Sets: Data Sources, Estimation, and Intercomparisons. Rev. Geophys. 2018, 56, 79–107. [Google Scholar] [CrossRef] [Green Version]
  14. Huffman, G.J.; Bolvin, D.T.; Nelkin, E.J.; Wolff, D.B.; Adler, R.F.; Gu, G.; Hong, Y.; Bowman, K.P.; Stocker, E.F. The TRMM Multisatellite Precipitation Analysis (TMPA): Quasi-Global, Multiyear, Combined-Sensor Precipitation Estimates at Fine Scales. J. Hydrometeorol. 2007, 8, 38–55. [Google Scholar] [CrossRef]
  15. Kubota, T.; Shige, S.; Hashizume, H.; Aonashi, K.; Takahashi, N.; Seto, S.; Hirose, M.; Takayabu, Y.N.; Ushio, T.; Nakagawa, K.; et al. Global Precipitation Map Using Satellite-Borne Microwave Radiometers by the GSMaP Project: Production and Validation. IEEE Trans. Geosci. Remote Sens. 2007, 45, 2259–2275. [Google Scholar] [CrossRef]
  16. Ashouri, H.; Hsu, K.-L.; Sorooshian, S.; Braithwaite, D.K.; Knapp, K.R.; Cecil, L.D.; Nelson, B.R.; Prat, O.P. PERSIANN-CDR: Daily Precipitation Climate Data Record from Multisatellite Observations for Hydrological and Climate Studies. Bull. Am. Meteorol. Soc. 2015, 96, 69–83. [Google Scholar] [CrossRef] [Green Version]
  17. Hersbach, H.; Bell, B.; Berrisford, P.; Hirahara, S.; Horányi, A.; Muñoz-Sabater, J.; Nicolas, J.; Peubey, C.; Radu, R.; Schepers, D.; et al. The ERA5 Global Reanalysis. Q. J. R. Meteorol. Soc. 2020, 146, 1999–2049. [Google Scholar] [CrossRef]
  18. Fujii, Y.; Ishibashi, T.; Yasuda, T.; Takaya, Y.; Kobayashi, C.; Ishikawa, I. Improvements in Tropical Precipitation and Sea Surface Air Temperature Fields in a Coupled Atmosphere—Ocean Data Assimilation System. Q. J. R. Meteorol. Soc. 2021, 147, 1317–1343. [Google Scholar] [CrossRef]
  19. Mega, T.; Ushio, T.; Takahiro, M.; Kubota, T.; Kachi, M.; Oki, R. Gauge-Adjusted Global Satellite Mapping of Precipitation. IEEE Trans. Geosci. Remote Sens. 2018, 57, 1928–1935. [Google Scholar] [CrossRef]
  20. Raimonet, M.; Oudin, L.; Thieu, V.; Silvestre, M.; Vautard, R.; Rabouille, C.; Le Moigne, P. Evaluation of Gridded Meteorological Datasets for Hydrological Modeling. J. Hydrometeorol. 2017, 18, 3027–3041. [Google Scholar] [CrossRef]
  21. Salman, S.A.; Shahid, S.; Ismail, T.; Al-Abadi, A.M.; Wang, X.; Chung, E.-S. Selection of Gridded Precipitation Data for Iraq Using Compromise Programming. Measurement 2019, 132, 87–98. [Google Scholar] [CrossRef]
  22. Serrat-Capdevila, A.; Valdes, J.B.; Stakhiv, E.Z. Water Management Applications for Satellite Precipitation Products: Synthesis and Recommendations. JAWRA J. Am. Water Resour. Assoc. 2014, 50, 509–525. [Google Scholar] [CrossRef]
  23. Bai, X.; Shen, W.; Wu, X.; Wang, P. Applicability of Long-Term Satellite-Based Precipitation Products for Drought Indices Considering Global Warming. J. Environ. Manag. 2020, 255, 109846. [Google Scholar] [CrossRef]
  24. Kazemzadeh, M.; Noori, Z.; Alipour, H.; Jamali, S.; Akbari, J.; Ghorbanian, A.; Duan, Z. Detecting Drought Events over Iran during 1983–2017 Using Satellite and Ground-Based Precipitation Observations. Atmos. Res. 2022, 269, 106052. [Google Scholar] [CrossRef]
  25. Mekonnen, K.; Melesse, A.M.; Woldesenbet, T.A. Merging Satellite Rainfall Estimates and Daily Rain Gauge Observations for Improved Flood Simulation in MelkaKuntire Catchment, Upper Awash Basin, Ethiopia. Remote Sens. Appl. Soc. Environ. 2022, 25, 100701. [Google Scholar] [CrossRef]
  26. Omonge, P.; Feigl, M.; Olang, L.; Schulz, K.; Herrnegger, M. Evaluation of Satellite Precipitation Products for Water Allocation Studies in the Sio-Malaba-Malakisi River Basin of East Africa. J. Hydrol. Reg. Stud. 2022, 39, 100983. [Google Scholar] [CrossRef]
  27. Wang, Q.; Xia, J.; She, D.; Zhang, X.; Liu, J.; Zhang, Y. Assessment of Four Latest Long-Term Satellite-Based Precipitation Products in Capturing the Extreme Precipitation and Streamflow across a Humid Region of Southern China. Atmos. Res. 2021, 257, 105554. [Google Scholar] [CrossRef]
  28. Mokhtari, S.; Sharafati, A.; Raziei, T. Satellite-Based Streamflow Simulation Using CHIRPS Satellite Precipitation Product in Shah Bahram Basin, Iran. Acta Geophys. 2022, 70, 385–398. [Google Scholar] [CrossRef]
  29. Kazemzadeh, M.; Hashemi, H.; Jamali, S.; Uvo, C.B.; Berndtsson, R.; Huffman, G.J. Linear and Nonlinear Trend Analyzes in Global Satellite-Based Precipitation, 1998–2017. Earth’s Future 2021, 9, e2020EF001835. [Google Scholar] [CrossRef]
  30. Toride, K.; Cawthorne, D.L.; Ishida, K.; Kavvas, M.L.; Anderson, M.L. Long-Term Trend Analysis on Total and Extreme Precipitation over Shasta Dam Watershed. Sci. Total Environ. 2018, 626, 244–254. [Google Scholar] [CrossRef]
  31. An, Y.; Zhao, W.; Li, C.; Liu, Y. Evaluation of Six Satellite and Reanalysis Precipitation Products Using Gauge Observations over the Yellow River Basin, China. Atmosphere 2020, 11, 1223. [Google Scholar] [CrossRef]
  32. Tan, M.L.; Santo, H. Comparison of GPM IMERG, TMPA 3B42 and PERSIANN-CDR Satellite Precipitation Products over Malaysia. Atmos. Res. 2018, 202, 63–76. [Google Scholar] [CrossRef]
  33. Zhou, Z.; Guo, B.; Xing, W.; Zhou, J.; Xu, F.; Xu, Y. Comprehensive Evaluation of Latest GPM Era IMERG and GSMaP Precipitation Products over Mainland China. Atmos. Res. 2020, 246, 105132. [Google Scholar] [CrossRef]
  34. Satgé, F.; Ruelland, D.; Bonnet, M.-P.; Molina, J.; Pillco, R. Consistency of Satellite-Based Precipitation Products in Space and over Time Compared with Gauge Observations and Snow-Hydrological Modelling in the Lake Titicaca Region. Hydrol. Earth Syst. Sci. 2019, 23, 595–619. [Google Scholar] [CrossRef] [Green Version]
  35. Tang, G.; Clark, M.P.; Papalexiou, S.M.; Ma, Z.; Hong, Y. Have Satellite Precipitation Products Improved over Last Two Decades? A Comprehensive Comparison of GPM IMERG with Nine Satellite and Reanalysis Datasets. Remote Sens. Environ. 2020, 240, 111697. [Google Scholar] [CrossRef]
  36. Navarro, A.; García-Ortega, E.; Merino, A.; Sánchez, J.L.; Kummerow, C.; Tapiador, F.J. Assessment of IMERG Precipitation Estimates over Europe. Remote Sens. 2019, 11, 2470. [Google Scholar] [CrossRef] [Green Version]
  37. Chua, Z.-W.; Kuleshov, Y.; Watkins, A. Evaluation of Satellite Precipitation Estimates over Australia. Remote Sens. 2020, 12, 678. [Google Scholar] [CrossRef] [Green Version]
  38. Yuan, F.; Zhang, L.; Soe, K.M.W.; Ren, L.; Zhao, C.; Zhu, Y.; Jiang, S.; Liu, Y. Applications of TRMM-and GPM-Era Multiple-Satellite Precipitation Products for Flood Simulations at Sub-Daily Scales in a Sparsely Gauged Watershed in Myanmar. Remote Sens. 2019, 11, 140. [Google Scholar] [CrossRef] [Green Version]
  39. Nguyen, P.; Ombadi, M.; Sorooshian, S.; Hsu, K.; AghaKouchak, A.; Braithwaite, D.; Ashouri, H.; Thorstensen, A.R. The PERSIANN Family of Global Satellite Precipitation Data: A Review and Evaluation of Products. Hydrol. Earth Syst. Sci. 2018, 22, 5801–5816. [Google Scholar] [CrossRef] [Green Version]
  40. Sharma, S.; Chen, Y.; Zhou, X.; Yang, K.; Li, X.; Niu, X.; Hu, X.; Khadka, N. Evaluation of GPM-Era Satellite Precipitation Products on the Southern Slopes of the Central Himalayas against Rain Gauge Data. Remote Sens. 2020, 12, 1836. [Google Scholar] [CrossRef]
  41. Abdelmoneim, H.; Soliman, M.R.; Moghazy, H.M. Evaluation of TRMM 3B42V7 and CHIRPS Satellite Precipitation Products as an Input for Hydrological Model over Eastern Nile Basin. Earth Syst. Environ. 2020, 4, 685–698. [Google Scholar] [CrossRef]
  42. Baez-Villanueva, O.M.; Zambrano-Bigiarini, M.; Ribbe, L.; Nauditt, A.; Giraldo-Osorio, J.D.; Thinh, N.X. Temporal and Spatial Evaluation of Satellite Rainfall Estimates over Different Regions in Latin-America. Atmos. Res. 2018, 213, 34–50. [Google Scholar] [CrossRef]
  43. Shayeghi, A.; Azizian, A.; Brocca, L. Reliability of Reanalysis and Remotely Sensed Precipitation Products for Hydrological Simulation over the Sefidrood River Basin, Iran. Hydrol. Sci. J. 2020, 65, 296–310. [Google Scholar] [CrossRef]
  44. Aminyavari, S.; Saghafian, B.; Sharifi, E. Assessment of Precipitation Estimation from the NWP Models and Satellite Products for the Spring 2019 Severe Floods in Iran. Remote Sens. 2019, 11, 2741. [Google Scholar] [CrossRef] [Green Version]
  45. Kiany, M.S.K.; Masoodian, S.A.; Balling, R.C., Jr.; Montazeri, M. Evaluation of the TRMM 3B42 Product for Extreme Precipitation Analysis over Southwestern Iran. Adv. Space Res. 2020, 66, 2094–2112. [Google Scholar] [CrossRef]
  46. Mohseni, F.; Sadr, M.K.; Eslamian, S.; Areffian, A.; Khoshfetrat, A. Spatial and Temporal Monitoring of Drought Conditions Using the Satellite Rainfall Estimates and Remote Sensing Optical and Thermal Measurements. Adv. Space Res. 2021, 67, 3942–3959. [Google Scholar] [CrossRef]
  47. Sharifi, E.; Steinacker, R.; Saghafian, B. Assessment of GPM-IMERG and Other Precipitation Products against Gauge Data under Different Topographic and Climatic Conditions in Iran: Preliminary Results. Remote Sens. 2016, 8, 135. [Google Scholar] [CrossRef] [Green Version]
  48. Aslami, F.; Ghorbani, A.; Sobhani, B.; Esmali, A. Comprehensive Comparison of Daily IMERG and GSMaP Satellite Precipitation Products in Ardabil Province, Iran. Int. J. Remote Sens. 2019, 40, 3139–3153. [Google Scholar] [CrossRef]
  49. Shobeiri, S.; Sharafati, A.; Neshat, A. Evaluation of Different Gridded Precipitation Products in Trend Analysis of Precipitation Features over Iran. Acta Geophys. 2021, 69, 959–974. [Google Scholar] [CrossRef]
  50. Ghajarnia, N.; Liaghat, A.; Arasteh, P.D. Comparison and Evaluation of High Resolution Precipitation Estimation Products in Urmia Basin-Iran. Atmos. Res. 2015, 158, 50–65. [Google Scholar] [CrossRef]
  51. Darand, M.; Siavashi, Z. An Evaluation of Global Satellite Mapping of Precipitation (GSMaP) Datasets over Iran. Meteorol. Atmos. Phys. 2021, 133, 911–923. [Google Scholar] [CrossRef]
  52. Ghozat, A.; Sharafati, A.; Hosseini, S.A. Long-Term Spatiotemporal Evaluation of CHIRPS Satellite Precipitation Product over Different Climatic Regions of Iran. Theor. Appl. Climatol. 2021, 143, 211–225. [Google Scholar] [CrossRef]
  53. Taghizadeh, E.; Ahmadi-Givi, F.; Brocca, L.; Sharifi, E. Evaluation of Satellite/Reanalysis Precipitation Products over Iran. Int. J. Remote Sens. 2021, 42, 3474–3497. [Google Scholar] [CrossRef]
  54. Fallah, A.; Rakhshandehroo, G.R.; Berg, P.O.S.; Orth, R. Evaluation of Precipitation Datasets against Local Observations in Southwestern Iran. Int. J. Climatol. 2020, 40, 4102–4116. [Google Scholar] [CrossRef] [Green Version]
  55. Maghsood, F.F.; Hashemi, H.; Hosseini, S.H.; Berndtsson, R. Ground Validation of GPM IMERG Precipitation Products over Iran. Remote Sens. 2019, 12, 48. [Google Scholar] [CrossRef] [Green Version]
  56. Eini, M.R.; Olyaei, M.A.; Kamyab, T.; Teymoori, J.; Brocca, L.; Piniewski, M. Evaluating Three Non-Gauge-Corrected Satellite Precipitation Estimates by a Regional Gauge Interpolated Dataset over Iran. J. Hydrol. Reg. Stud. 2021, 38, 100942. [Google Scholar] [CrossRef]
  57. Moazami, S.; Golian, S.; Hong, Y.; Sheng, C.; Kavianpour, M.R. Comprehensive Evaluation of Four High-Resolution Satellite Precipitation Products under Diverse Climate Conditions in Iran. Hydrol. Sci. J. 2016, 61, 420–440. [Google Scholar] [CrossRef]
  58. Mosaffa, H.; Shirvani, A.; Khalili, D.; Nguyen, P.; Sorooshian, S. Post and near Real-Time Satellite Precipitation Products Skill over Karkheh River Basin in Iran. Int. J. Remote Sens. 2020, 41, 6484–6502. [Google Scholar] [CrossRef]
  59. Ghorbanian, A.; Kakooei, M.; Amani, M.; Mahdavi, S.; Mohammadzadeh, A.; Hasanlou, M. Improved Land Cover Map of Iran Using Sentinel Imagery within Google Earth Engine and a Novel Automatic Workflow for Land Cover Classification Using Migrated Training Samples. ISPRS J. Photogramm. Remote Sens. 2020, 167, 276–288. [Google Scholar] [CrossRef]
  60. Rahimi, J.; Ebrahimpour, M.; Khalili, A. Spatial Changes of Extended De Martonne Climatic Zones Affected by Climate Change in Iran. Theor. Appl. Climatol. 2013, 112, 409–418. [Google Scholar] [CrossRef]
  61. Fallah, B.; Sodoudi, S.; Russo, E.; Kirchner, I.; Cubasch, U. Towards Modeling the Regional Rainfall Changes over Iran Due to the Climate Forcing of the Past 6000 Years. Quat. Int. 2017, 429, 119–128. [Google Scholar] [CrossRef] [Green Version]
  62. Daneshvar, M.R.M.; Ebrahimi, M.; Nejadsoleymani, H. An Overview of Climate Change in Iran: Facts and Statistics. Environ. Syst. Res. 2019, 8, 7. [Google Scholar] [CrossRef] [Green Version]
  63. Razmi, R.; Balyani, S.; Mansouri Daneshvar, M.R. Geo-Statistical Modeling of Mean Annual Rainfall over the Iran Using ECMWF Database. Spat. Inf. Res. 2017, 25, 219–227. [Google Scholar] [CrossRef]
  64. Ghasemi, A.R.; Khalili, D. The Association between Regional and Global Atmospheric Patterns and Winter Precipitation in Iran. Atmos. Res. 2008, 88, 116–133. [Google Scholar] [CrossRef]
  65. Modarres, R.; Sarhadi, A.; Burn, D.H. Changes of Extreme Drought and Flood Events in Iran. Glob. Planet. Chang. 2016, 144, 67–81. [Google Scholar] [CrossRef]
  66. Gorelick, N.; Hancher, M.; Dixon, M.; Ilyushchenko, S.; Thau, D.; Moore, R. Google Earth Engine: Planetary-Scale Geospatial Analysis for Everyone. Remote Sens. Environ. 2017, 202, 18–27. [Google Scholar] [CrossRef]
  67. Amani, M.; Ghorbanian, A.; Ahmadi, S.A.; Kakooei, M.; Moghimi, A.; Mirmazloumi, S.M.; Moghaddam, S.H.A.; Mahdavi, S.; Ghahremanloo, M.; Parsian, S.; et al. Google Earth Engine Cloud Computing Platform for Remote Sensing Big Data Applications: A Comprehensive Review. IEEE J. Sel. Top. Appl. Earth Obs. Remote Sens. 2020, 13, 5326–5350. [Google Scholar] [CrossRef]
  68. Milewski, A.; Elkadiri, R.; Durham, M. Assessment and Comparison of TMPA Satellite Precipitation Products in Varying Climatic and Topographic Regimes in Morocco. Remote Sens. 2015, 7, 5697–5717. [Google Scholar] [CrossRef] [Green Version]
  69. Kim, K.; Park, J.; Baik, J.; Choi, M. Evaluation of Topographical and Seasonal Feature Using GPM IMERG and TRMM 3B42 over Far-East Asia. Atmos. Res. 2017, 187, 95–105. [Google Scholar] [CrossRef]
  70. Funk, C.; Peterson, P.; Landsfeld, M.; Pedreros, D.; Verdin, J.; Shukla, S.; Husak, G.; Rowland, J.; Harrison, L.; Hoell, A.; et al. The Climate Hazards Infrared Precipitation with Stations—A New Environmental Record for Monitoring Extremes. Sci. Data 2015, 2, 150066. [Google Scholar] [CrossRef] [Green Version]
  71. Menne, M.J.; Durre, I.; Vose, R.S.; Gleason, B.E.; Houston, T.G. An Overview of the Global Historical Climatology Network-Daily Database. J. Atmos. Ocean. Technol. 2012, 29, 897–910. [Google Scholar] [CrossRef]
  72. Peterson, T.C.; Vose, R.S. An Overview of the Global Historical Climatology Network Temperature Database. Bull. Am. Meteorol. Soc. 1997, 78, 2837–2850. [Google Scholar] [CrossRef] [Green Version]
  73. Dinku, T.; Funk, C.; Peterson, P.; Maidment, R.; Tadesse, T.; Gadain, H.; Ceccato, P. Validation of the CHIRPS Satellite Rainfall Estimates over Eastern Africa. Q. J. R. Meteorol. Soc. 2018, 144, 292–312. [Google Scholar] [CrossRef] [Green Version]
  74. Hsu, K.; Gao, X.; Sorooshian, S.; Gupta, H.V. Precipitation Estimation from Remotely Sensed Information Using Artificial Neural Networks. J. Appl. Meteorol. 1997, 36, 1176–1190. [Google Scholar] [CrossRef]
  75. Knapp, K.R.; Ansari, S.; Bain, C.L.; Bourassa, M.A.; Dickinson, M.J.; Funk, C.; Helms, C.N.; Hennon, C.C.; Holmes, C.D.; Huffman, G.J.; et al. Globally Gridded Satellite Observations for Climate Studies. Bull. Am. Meteorol. Soc. 2011, 92, 893–907. [Google Scholar] [CrossRef]
  76. Ushio, T.; Sasashige, K.; Kubota, T.; Shige, S.; Okamoto, K.; Aonashi, K.; Inoue, T.; Takahashi, N.; Iguchi, T.; Kachi, M.; et al. A Kalman Filter Approach to the Global Satellite Mapping of Precipitation (GSMaP) from Combined Passive Microwave and Infrared Radiometric Data. J. Meteorol. Soc. Japan Ser. II 2009, 87, 137–151. [Google Scholar] [CrossRef] [Green Version]
  77. Huffman, G.J.; Bolvin, D.T.; Braithwaite, D.; Hsu, K.; Joyce, R.; Xie, P.; Yoo, S.-H. NASA Global Precipitation Measurement (GPM) Integrated Multi-Satellite Retrievals for GPM (IMERG). Algorithm Theor. Basis Doc. 2015, 4, 26. [Google Scholar]
  78. Tan, J.; Huffman, G.J.; Bolvin, D.T.; Nelkin, E.J. IMERG V06: Changes to the Morphing Algorithm. J. Atmos. Ocean. Technol. 2019, 36, 2471–2482. [Google Scholar] [CrossRef]
  79. Joyce, R.J.; Xie, P. Kalman Filter—Based CMORPH. J. Hydrometeorol. 2011, 12, 1547–1563. [Google Scholar] [CrossRef]
  80. Jiang, Q.; Li, W.; Fan, Z.; He, X.; Sun, W.; Chen, S.; Wen, J.; Gao, J.; Wang, J. Evaluation of the ERA5 Reanalysis Precipitation Dataset over Chinese Mainland. J. Hydrol. 2021, 595, 125660. [Google Scholar] [CrossRef]
  81. Yuan, F.; Wang, B.; Shi, C.; Cui, W.; Zhao, C.; Liu, Y.; Ren, L.; Zhang, L.; Zhu, Y.; Chen, T.; et al. Evaluation of Hydrological Utility of IMERG Final Run V05 and TMPA 3B42V7 Satellite Precipitation Products in the Yellow River Source Region, China. J. Hydrol. 2018, 567, 696–711. [Google Scholar] [CrossRef]
  82. Mantas, V.M.; Liu, Z.; Caro, C.; Pereira, A. Validation of TRMM Multi-Satellite Precipitation Analysis (TMPA) Products in the Peruvian Andes. Atmos. Res. 2015, 163, 132–145. [Google Scholar] [CrossRef]
  83. Islam, M.A. Statistical Comparison of Satellite-Retrieved Precipitation Products with Rain Gauge Observations over Bangladesh. Int. J. Remote Sens. 2018, 39, 2906–2936. [Google Scholar] [CrossRef] [Green Version]
  84. Rivera, J.A.; Marianetti, G.; Hinrichs, S. Validation of CHIRPS Precipitation Dataset along the Central Andes of Argentina. Atmos. Res. 2018, 213, 437–449. [Google Scholar] [CrossRef]
  85. Peng, F.; Zhao, S.; Chen, C.; Cong, D.; Wang, Y.; Ouyang, H. Evaluation and Comparison of the Precipitation Detection Ability of Multiple Satellite Products in a Typical Agriculture Area of China. Atmos. Res. 2020, 236, 104814. [Google Scholar] [CrossRef]
  86. Taylor, K.E. Summarizing Multiple Aspects of Model Performance in a Single Diagram. J. Geophys. Res. Atmos. 2001, 106, 7183–7192. [Google Scholar] [CrossRef]
  87. Roebber, P.J. Visualizing Multiple Measures of Forecast Quality. Weather Forecast. 2009, 24, 601–608. [Google Scholar] [CrossRef] [Green Version]
  88. Brocca, L.; Massari, C.; Pellarin, T.; Filippucci, P.; Ciabatta, L.; Camici, S.; Kerr, Y.H.; Fernández-Prieto, D. River Flow Prediction in Data Scarce Regions: Soil Moisture Integrated Satellite Rainfall Products Outperform Rain Gauge Observations in West Africa. Sci. Rep. 2020, 10, 12517. [Google Scholar] [CrossRef]
  89. Bitew, M.M.; Gebremichael, M.; Ghebremichael, L.T.; Bayissa, Y.A. Evaluation of High-Resolution Satellite Rainfall Products through Streamflow Simulation in a Hydrological Modeling of a Small Mountainous Watershed in Ethiopia. J. Hydrometeorol. 2012, 13, 338–350. [Google Scholar] [CrossRef]
  90. Nikolopoulos, E.I.; Anagnostou, E.N.; Hossain, F.; Gebremichael, M.; Borga, M. Understanding the Scale Relationships of Uncertainty Propagation of Satellite Rainfall through a Distributed Hydrologic Model. J. Hydrometeorol. 2010, 11, 520–532. [Google Scholar] [CrossRef]
  91. Furl, C.; Ghebreyesus, D.; Sharif, H.O. Assessment of the Performance of Satellite-Based Precipitation Products for Flood Events across Diverse Spatial Scales Using GSSHA Modeling System. Geosciences 2018, 8, 191. [Google Scholar] [CrossRef] [Green Version]
  92. Gumindoga, W.; Rientjes, T.H.M.; Haile, A.T.; Reggiani, P.; Makurira, H. Propagation of CMORPH Rainfall Errors to REW Streamflow Simulation Mismatch in the Upper Zambezi Basin. J. Hydrol. Reg. Stud. 2021, 38, 100966. [Google Scholar] [CrossRef]
  93. Alemu, M.L.; Worqlul, A.W.; Zimale, F.A.; Tilahun, S.A.; Steenhuis, T.S. Water Balance for a Tropical Lake in the Volcanic Highlands: Lake Tana, Ethiopia. Water 2020, 12, 2737. [Google Scholar] [CrossRef]
  94. Chen, F.; Yuan, H.; Sun, R.; Yang, C. Streamflow Simulations Using Error Correction Ensembles of Satellite Rainfall Products over the Huaihe River Basin. J. Hydrol. 2020, 589, 125179. [Google Scholar] [CrossRef]
  95. Gavahi, K.; Abbaszadeh, P.; Moradkhani, H. How Does Precipitation Data Influence the Land Surface Data Assimilation for Drought Monitoring? Sci. Total Environ. 2022, 831, 154916. [Google Scholar] [CrossRef]
  96. Camici, S.; Massari, C.; Ciabatta, L.; Marchesini, I.; Brocca, L. Which Rainfall Score Is More Informative about the Performance in River Discharge Simulation? A Comprehensive Assessment on 1318 Basins over Europe. Hydrol. Earth Syst. Sci. 2020, 24, 4869–4885. [Google Scholar] [CrossRef]
  97. Jing, X.; Suzuki, K.; Guo, H.; Goto, D.; Ogura, T.; Koshiro, T.; Mülmenstädt, J. A Multimodel Study on Warm Precipitation Biases in Global Models Compared to Satellite Observations. J. Geophys. Res. Atmos. 2017, 122, 11–806. [Google Scholar] [CrossRef] [Green Version]
  98. Xiao, S.; Zou, L.; Xia, J.; Yang, Z.; Yao, T. Bias Correction Framework for Satellite Precipitation Products Using a Rain/No Rain Discriminative Model. Sci. Total Environ. 2022, 818, 151679. [Google Scholar] [CrossRef] [PubMed]
  99. Zhu, B.; Huang, Y.; Zhang, Z.; Kong, R.; Tian, J.; Zhou, Y.; Chen, S.; Duan, Z. Evaluation of TMPA Satellite Precipitation in Driving VIC Hydrological Model over the Upper Yangtze River Basin. Water 2020, 12, 3230. [Google Scholar] [CrossRef]
  100. Habib, E.; ElSaadani, M.; Haile, A.T. Climatology-Focused Evaluation of CMORPH and TMPA Satellite Rainfall Products over the Nile Basin. J. Appl. Meteorol. Climatol. 2012, 51, 2105–2121. [Google Scholar] [CrossRef] [Green Version]
  101. Malayeri, A.K.; Saghafian, B.; Raziei, T. Performance Evaluation of ERA5 Precipitation Estimates across Iran. Arab. J. Geosci. 2021, 14, 2676. [Google Scholar] [CrossRef]
  102. Amjad, M.; Yilmaz, M.T.; Yucel, I.; Yilmaz, K.K. Performance Evaluation of Satellite-and Model-Based Precipitation Products over Varying Climate and Complex Topography. J. Hydrol. 2020, 584, 124707. [Google Scholar] [CrossRef]
  103. Salmani-Dehaghi, N.; Samani, N. Spatiotemporal Assessment of the PERSIANN Family of Satellite Precipitation Data over Fars Province, Iran. Theor. Appl. Climatol. 2019, 138, 1333–1357. [Google Scholar] [CrossRef]
  104. Rahman, K.U.; Shang, S.; Shahid, M.; Li, J. Developing an Ensemble Precipitation Algorithm from Satellite Products and Its Topographical and Seasonal Evaluations over Pakistan. Remote Sens. 2018, 10, 1835. [Google Scholar] [CrossRef] [Green Version]
  105. Bhuiyan, M.A.E.; Yang, F.; Biswas, N.K.; Rahat, S.H.; Neelam, T.J. Machine Learning-Based Error Modeling to Improve GPM IMERG Precipitation Product over the Brahmaputra River Basin. Forecasting 2020, 2, 248–266. [Google Scholar] [CrossRef]
  106. Zhang, L.; Li, X.; Zheng, D.; Zhang, K.; Ma, Q.; Zhao, Y.; Ge, Y. Merging Multiple Satellite-Based Precipitation Products and Gauge Observations Using a Novel Double Machine Learning Approach. J. Hydrol. 2021, 594, 125969. [Google Scholar] [CrossRef]
  107. Prakash, S.; Seshadri, A.; Srinivasan, J.; Pai, D.S. A New Parameter to Assess Impact of Rain Gauge Density on Uncertainty in the Estimate of Monthly Rainfall over India. J. Hydrometeorol. 2019, 20, 821–832. [Google Scholar] [CrossRef]
  108. Merino, A.; García-Ortega, E.; Navarro, A.; Fernández-González, S.; Tapiador, F.J.; Sánchez, J.L. Evaluation of Gridded Rain-Gauge-Based Precipitation Datasets: Impact of Station Density, Spatial Resolution, Altitude Gradient and Climate. Int. J. Climatol. 2021, 41, 3027–3043. [Google Scholar] [CrossRef]
  109. Satgé, F.; Defrance, D.; Sultan, B.; Bonnet, M.-P.; Seyler, F.; Rouche, N.; Pierron, F.; Paturel, J.-E. Evaluation of 23 Gridded Precipitation Datasets across West Africa. J. Hydrol. 2020, 581, 124412. [Google Scholar] [CrossRef] [Green Version]
  110. Bai, P.; Liu, X. Evaluation of Five Satellite-Based Precipitation Products in Two Gauge-Scarce Basins on the Tibetan Plateau. Remote Sens. 2018, 10, 1316. [Google Scholar] [CrossRef] [Green Version]
  111. AghaKouchak, A.; Behrangi, A.; Sorooshian, S.; Hsu, K.; Amitai, E. Evaluation of Satellite-Retrieved Extreme Precipitation Rates across the Central United States. J. Geophys. Res. Atmos. 2011, 116, D2. [Google Scholar] [CrossRef]
  112. Zhang, M.; de Leon, C.; Migliaccio, K. Evaluation and Comparison of Interpolated Gauge Rainfall Data and Gridded Rainfall Data in Florida, USA. Hydrol. Sci. J. 2018, 63, 561–582. [Google Scholar] [CrossRef]
  113. Golian, S.; Javadian, M.; Behrangi, A. On the Use of Satellite, Gauge, and Reanalysis Precipitation Products for Drought Studies. Environ. Res. Lett. 2019, 14, 75005. [Google Scholar] [CrossRef]
  114. Ma, Z.; Xu, J.; He, K.; Han, X.; Ji, Q.; Wang, T.; Xiong, W.; Hong, Y. An Updated Moving Window Algorithm for Hourly-Scale Satellite Precipitation Downscaling: A Case Study in the Southeast Coast of China. J. Hydrol. 2020, 581, 124378. [Google Scholar] [CrossRef]
  115. Sharifi, E.; Saghafian, B.; Steinacker, R. Downscaling Satellite Precipitation Estimates with Multiple Linear Regression, Artificial Neural Networks, and Spline Interpolation Techniques. J. Geophys. Res. Atmos. 2019, 124, 789–805. [Google Scholar] [CrossRef] [Green Version]
  116. Madani, K.; AghaKouchak, A.; Mirchi, A. Iran’s Socio-Economic Drought: Challenges of a Water-Bankrupt Nation. Iran. Stud. 2016, 49, 997–1016. [Google Scholar] [CrossRef]
  117. Noori, R.; Maghrebi, M.; Mirchi, A.; Tang, Q.; Bhattarai, R.; Sadegh, M.; Noury, M.; Haghighi, A.T.; Kløve, B.; Madani, K. Anthropogenic Depletion of Iran’s Aquifers. Proc. Natl. Acad. Sci. USA 2021, 118, e2024221118. [Google Scholar] [CrossRef]
  118. Seyama, E.S.; Masocha, M.; Dube, T. Evaluation of TAMSAT Satellite Rainfall Estimates for Southern Africa: A Comparative Approach. Phys. Chem. Earth Parts A/B/C 2019, 112, 141–153. [Google Scholar] [CrossRef]
  119. Friesen, B.; Boluwade, A.; Rasmussen, P.F.; Fortin, V. Assimilation of Satellite-Based Rainfall Estimations in the Canadian Precipitation Analysis. J. Hydrol. Eng. 2017, 22, 4017049. [Google Scholar] [CrossRef]
Figure 1. (a) Geographical location of Iran, along with spatial distribution of synoptic stations throughout the country in 2020, and (b) the annual accumulated precipitation in Iran produced using kriging interpolation and in situ measurements with a spatial resolution of 0.025°.
Remotesensing 14 03783 g001
Figure 2. The number of synoptic stations and the corresponding daily precipitation observations between 2000 and 2020 that were used to validate and intercompare the selected Gridded Precipitation Products (GPPs).
Remotesensing 14 03783 g002
Figure 3. Scatterplots of daily reference precipitations and target precipitations of (a) TMPA, (b) CHIRPS, (c) PERSIANN, (d) GSMaP, (e) IMERG, and (f) ERA5 for the study period of 2000 and 2020.
Remotesensing 14 03783 g003
Figure 4. Boxplots of three continuous metrics, including (a) Correlation Coefficient, (b) Root Mean Square Error, and (c) Mean Bias Error, and three categorical metrics, including (d) Probability of Detection, (e) False Alarm Ratio, and (f) Critical Success Index at the daily time scale between 2000 and 2020.
Remotesensing 14 03783 g004
Figure 5. Obtained CC (left column), RMSE (middle column), and MBE (right column) values for the GPPs at the station level using daily observations from 2000 to 2020.
Remotesensing 14 03783 g005
Figure 6. Obtained CSI values for (a) TMPA, (b) CHIRPS, (c) PERSIANN, (d) GSMaP, (e) IMERG, and (f) ERA5 at the station level using daily observations between 2000 and 2020.
Remotesensing 14 03783 g006
Figure 7. Taylor diagrams for comparing six GPPs using daily observations between 2000 and 2020 in the monthly time scale from (al) January to December, respectively.
Remotesensing 14 03783 g007
Figure 8. Performance diagrams for comparing six GPPs using daily observations between 2000 and 2020 in the monthly time scale from (al) January to December, respectively.
Remotesensing 14 03783 g008
Figure 9. Evaluation of six GPPs in the yearly time scale using (a) CC, (b) RMSE, (c) MBE, and (d) CSI based on daily observations between 2000 and 2020.
Remotesensing 14 03783 g009
Table 1. The contingency table representing the agreement between Gridded Precipitation Products (GPPs) and the in situ observations from the synoptic stations.
Grided Precipitation Product (GPP)Synoptic Station
YesNo
YesHitFalse
NoMissCorrect Negative
Table 2. The continuous and categorical metrics calculated from all corresponding precipitation observations to provide a general overview of GPPs performance in Iran over the last two decades.
Precipitation ProductCCRMSE (mm)MBE (mm)MAE (mm)PODFARCSI
TMPA0.3304.10−0.5740.9130.3680.5640.249
CHIRPS0.3534.680.1521.2200.3690.5640.250
PERSIANN0.3564.250.0941.2620.7420.6680.297
GSMaP0.5993.48−0.1320.8340.7840.4800.454
IMERG0.4836.891.0011.7910.6930.6210.324
ERA50.6233.590.2681.0270.8670.5680.405
Table 3. Continuous metrics calculated from monthly accumulated precipitations values of the GPPs and synoptic stations at the station level.
GPPsContinuous Metrics
CCMBE (mm)RMSE (mm)
TMPA0.794 ± 0.0101−17.34 ± 17.6530.01 ± 24.09
CHIRPS0.768 ± 0.1164.94 ± 17.4124.43 ± 21.24
PERSIANN0.752 ± 0.1222.84 ± 17.4326.76 ± 18.19
GSMaP0.767 ± 0.137−3.73 ± 11.7322.73 ± 15.87
IMERG0.857 ± 0.09430.34 ± 15.8750.89 ± 22.06
ERA50.827 ± 0.0958.28 ± 13.9923.78 ± 15.06
Table 4. Continuous metrics calculated from monthly average precipitations values of the GPPs and synoptic stations at the station level.
GPPsContinuous Metrics
CCMBE (mm)RMSE (mm)
TMPA0.792 ± 0.0102−0.58 ± 0.581.01 ± 0.80
CHIRPS0.766 ± 0.1160.16 ± 0.580.83 ± 0.71
PERSIANN0.749 ± 0.1220.09 ± 0.580.90 ± 0.60
GSMaP0.771 ± 0.138−0.13 ± 0.400.78 ± 0.55
IMERG0.855 ± 0.0951.01 ± 0.531.70 ± 0.75
ERA50.823 ± 0.0970.28 ± 0.460.81 ± 0.51
Table 5. Continuous metrics calculated from yearly accumulated precipitations values of the GPPs and synoptic stations at the station level.
GPPsContinuous Metrics
CCMBE (mm)RMSE (mm)
TMPA0.703 ± 0.166−209.20 ± 211.57223.23 ± 215.04
CHIRPS0.660 ± 0.18759.44 ± 208.95137.78 ± 187.35
PERSIANN0.581 ± 0.25334.79 ± 209.54173.25 ± 153.11
GSMaP0.580 ± 0.212−44.23 ± 140.09139.06 ± 123.73
IMERG0.797 ± 0.146362.66 ± 188.97389.29 ± 183.38
ERA50.733 ± 0.13997.47 ± 164.13151.28 ± 141.79
Table 6. Continuous metrics calculated from yearly average precipitations values of the GPPs and synoptic stations at the station level.
GPPsContinuous Metrics
CCMBE (mm)RMSE (mm)
TMPA0.706 ± 0.171−0.58 ± 0.580.63 ± 0.59
CHIRPS0.662 ± 0.2040.16 ± 0.570.39 ± 0.52
PERSIANN0.582 ± 0.2640.09 ± 0.580.48 ± 0.42
GSMaP0.571 ± 0.238−0.13 ± 0.400.40 ± 0.37
IMERG0.781 ± 0.1611.01 ± 0.531.11 ± 0.56
ERA50.762 ± 0.1680.28 ± 0.460.44 ± 0.39
Publisher’s Note: MDPI stays neutral with regard to jurisdictional claims in published maps and institutional affiliations.

