Article

Validation of IMERG Oceanic Precipitation over Kwajalein

1
Science System and Applications, Inc., Lanham, MD 20706, USA
2
NASA Goddard Space Flight Center, Greenbelt, MD 20771, USA
3
NASA Wallops Flight Facility, Wallops Island, VA 23337, USA
4
University of Maryland Baltimore County, Baltimore, MD 21250, USA
*
Author to whom correspondence should be addressed.
Remote Sens. 2022, 14(15), 3753; https://doi.org/10.3390/rs14153753
Submission received: 30 June 2022 / Revised: 2 August 2022 / Accepted: 3 August 2022 / Published: 5 August 2022
(This article belongs to the Special Issue Remote Sensing of Precipitation: Part III)

Abstract

:
The integrated Multi-satellitE Retrievals for GPM (IMERG) Version V05B and V06B precipitation products from the Global Precipitation Measurement (GPM) mission are validated against ground-based observations from the Kwajalein Polarimetric S-band Weather Radar (KPOL) deployed at Kwajalein Atoll in the central Pacific Ocean. Such a validation is particularly important as comprehensive surface measurements over the oceans are practically infeasible, which hampers the identification of possible errors, and improvement of future versions of IMERG and other satellite-based retrieval algorithms. The V05B and V06B IMERG products are validated at their native 0.1°, 30 min resolution from 2014 to 2018 based on both volumetric and categorical metrics. This validation study indicates that precipitation rates from both IMERG V05B and V06B are underestimated with respect to radar surface estimates, but the underestimation is much reduced from V05B to V06B. IMERG V06B outperforms V05B with reduced systematic bias and improved precipitation detectability. The IMERG performance is further traced back to its individual sensors and morphing-based algorithms. The overall underestimation in V05B is mainly driven by the negative relative biases from morphing-based algorithms which are largely corrected in V06B. Imagers perform generally better than sounders because of the usage of low-frequency channels in imagers which can better detect emission signals by the hydrometeors. Among imagers, the GPM Microwave Imager (GMI) and Advanced Microwave Scanning Radiometer Version 2 (AMSR2) are the best, followed by Special Sensor Microwave Imager/Sounder (SSMIS). Among sounders, the Microwave Humidity Sounder (MHS) is the best, followed by Advanced Technology Microwave Sounder (ATMS) and the Sounder for Atmospheric Profiling of Humidity in the Intertropics by Radiometry (SAPHIR) for V06B. Among all categories, morph-only and IR + morph only perform better than SAPHIR. SAPHIR shows the worst performance among all categories, likely due to its limited channel selection. It is envisaged that these results will improve our understanding of IMERG performance over oceans and aid in the improvement of future versions of IMERG.

1. Introduction

Global ocean precipitation plays a key role in the water cycle of the climate system as about 78% of the global precipitation occurs over oceans [1]. Oceanic precipitation observations are nearly entirely dependent on satellite remote sensing because of the scarcity of ground measurements over oceans. Great progress in oceanic precipitation observations has been made with the successful Tropical Rainfall Measuring Mission (TRMM) and its successor the Global Precipitation Measurement (GPM) mission. Validation of satellite remote sensing-based data is particularly important, yet remains a challenging issue especially over the large expanses of the ocean where comprehensive surface measurements are practically infeasible. Limited oceanic surface precipitation measurements can only be obtained by using weather radars deployed on islands, near coastlines, or on ships during field campaigns, and in situ instruments onboard ships and buoys.
Situated at the southern tip of the Kwajalein Atoll, the Kwajalein Polarimetric S-band Weather Radar (KPOL) provides over two decades of quality-controlled oceanic precipitation observations. The KPOL precipitation dataset is a product of the work started during TRMM with continuity into the GPM mission. The NASA Ground Validation (GV) team routinely generates this product of tropical ocean–based precipitation estimates. Because of minimized land effect (e.g., land heating and orographic effects), KPOL observations over small islets can be considered a proxy for open ocean, and well suited for use in validating satellite-based precipitation estimates over the open tropical oceans.
The goal of this study is to use the KPOL precipitation product in the validation of oceanic precipitation estimates from the Integrated Multi-satellitE Retrievals for GPM (IMERG) [2,3,4]. IMERG is the U.S. merged-satellite algorithm for GPM, which integrates precipitation estimates from different passive microwave (PMW) and infrared (IR)-based sensors onboard several satellites and bias adjusted by monthly precipitation gauge analysis products. In contrast with IMERG, KPOL precipitation dataset is a homogeneous product from a single ground-based dual-polarimetric radar. Therefore, the relative performance of each sensor in IMERG can be assessed by using KPOL as a homogeneous reference. The results of this study will provide insight into the quality of IMERG estimates over open oceans, and identify sources of errors in IMERG, which can be useful to the improvement of new versions of the product.
IMERG products have been widely used in research and operational applications and validated across the globe. Most of these validations are over land areas only (e.g., [5,6]). Only a few validation studies have been over the oceans. Prakash et al. [7] evaluated IMERG Version 04 against moored buoy observations over the north Indian Ocean at an hourly scale and found a generally positive bias and that noticeable false alarms exist in IMERG Version 04 precipitation estimates. Khan and Maggioni [8] evaluated IMERG Version 05 and its components over oceans using a shipboard disdrometer-derived precipitation product and level-3 Dual-frequency Precipitation Radar product at four spatial resolutions (0.5°, 1°, 2°, and 3°) and the daily time scale during a 3-year study period from March 2014 to February 2017. Their results indicated that IMERG Version 05 has a good ability of detecting precipitation events but underestimates precipitation compared to the disdrometer product, and IMERG-IR component shows a low correlation and large bias, whereas IMERG-PMW generally performs better than other components. Wu and Wang [9] compared IMERG Version 05B with data from 55 buoy-mounted rain gauges in the Pacific, Atlantic, and Indian Oceans, and found that underestimation or overestimation happens depending on locations and precipitation intensities. More recently, Bolvin et al. [10] compared monthly IMERG Version 06B precipitation with gauge observations from 37 low-lying Pacific atolls at 0.1° resolution, and found that IMERG on the whole has a positive bias with underestimates for lower precipitation rates but overestimates for higher rates. Derin et al. [11,12] assessed the uncertainties in precipitation detection and quantification of IMERG Version 06B over coastal regions of the United States using the ground-based and gauge-corrected multi-radar multi-sensor system (MRMS) precipitation product, and found that IMERG and its components overestimate light rainfall (<1 mm h−1) but underestimate high rainfall rates (>10 mm h−1), and IMERG-PMW has the best detectability, followed by morphing, morphing+IR, and IR estimates.
However, these validations are limited to rain gauges and disdrometer measurements over atolls and from ships or buoys, or using MRMS over near-coastal oceans. To our knowledge, there has not been a ground radar-based study to the validation of IMERG components over tropical oceans far from the coast. In this study, precipitation estimates from IMERG Final Run are for the first time extensively evaluated against ground radar observations over an oceanic site at multi-temporal scales. The performance of the latest version (V06B) IMERG is also evaluated in comparison with its previous version (V05B).
This paper is structured in six sections. Following this introduction in Section 1, the data products used in this study are described in Section 2. The methodology and evaluation metrics are described in Section 3. Validation results are presented in Section 4, and discussions in Section 5. The main conclusions are summarized in Section 6.

2. The Kwajalein Oceanic Validation Site and Data Products

2.1. The Kwajalein Oceanic Validation Site and KPOL Precipitation Rates

Kwajalein Atoll in the Republic of the Marshall Islands (RMI) consists of a ring of small, flat coral islets in the central Pacific Ocean. There are no significant orographic and elevational features in Kwajalein Atoll and neighboring atolls. Kwajalein has a high amount of annual rainfall and humidity throughout the year. Generally, Kwajalein precipitation is mainly influenced by convective systems in the Intertropical Convergence Zone (ITCZ) [13]. Isolated shallow “warm rain” clouds also contribute a fair amount of Kwajalein annual precipitation [14].
KPOL was deployed at the southern tip (167.732°E, 8.718°N) of the Kwajalein Atoll. Most of the area covered by KPOL is open ocean (see Figure 1), which makes Kwajalein a representative oceanic site for GPM ground validation. KPOL is an S-band Doppler system with dual-polarization capability upgrades used to detect, analyze, and record precipitating weather systems. It is operated by the U.S. Army, and partially supported by NASA for the past TRMM and currently ongoing GPM ground validation studies. Readers are referred to [13] (their Table 1 and Table 2), [14] (their Table 1), and [15] (their Table 1 and Table 2) for characteristics of the KPOL radar and its task configurations.
Over the TRMM and GPM eras, KPOL experienced numerous operational changes resulting from hardware maintenance (e.g., radar azimuth and elevation motor), software upgrades, component replacement, scan strategy changes, and gradual degradation of the radar performance from calibration drift, etc. Absolute reflectivity calibration was determined via the method of Ryzhkov et al. [16], and differential reflectivity calibration was maintained through an automated engineering approach [17]. An additional level of reflectivity calibration was maintained based on the analysis of ground clutter returns. The Relative Calibration Adjustment (RCA) [18] technique was developed to detect relative changes in the reflectivity data as compared to a baseline [19,20]. Precipitation rates were generated from quality-controlled and RCA-calibrated dual-polarization radar data following Cifelli et al. [21]. The KPOL precipitation rates were first interpolated to a 1-km × 1-km Cartesian grid via the Barnes objective analysis scheme [22] within the Python ARM Radar Toolkit (Py-ART) [23]. The interpolated rates were subsequently gridded to 0.1° latitude/longitude resolution for matching with IMERG data. The gridded KPOL radar precipitation data covers a circular area with radius of 150-km centered at (167.75°E, 8.75°N), the nearest IMERG 0.1° pixel center to KPOL. The gridded KPOL precipitation rates are provided at the 1 km Constant Altitude Plan Position Indicator (CAPPI) level to approximately represent the surface precipitation. The 0.1° gridded radar precipitation rates are available approximately every 10 min corresponding to the time for KPOL to complete a volume scan. The 10-min precipitation rates are averaged to a temporal resolution of 30 min with the aim of comparing the half-hourly IMERG products.
KPOL radar had some downtimes due to various reasons such as scheduled maintenance, unexpected hardware/software problems, and electrical failures, which resulted in data gaps in the series of volume scans. Table 1 lists radar gaps with length of at least one day in the study period from April 2014 to June 2018. All radar gap periods are excluded in comparisons between the KPOL and IMERG.

2.2. IMERG Product and Categorization by Source

V05B and V06B IMERG Final Run products are used in this study. IMERG Final Run is a research-quality multisatellite precipitation product with global coverage at fine spatial (0.1°) and temporal (0.5-h) resolution. The IMERG algorithm grids, calibrates, and combines retrievals from PMW and IR sensors onboard a constellation of satellites, and adjusts the satellite estimates with monthly gauge observations [3]. Near-global PMW precipitation rates from the Goddard Profiling Algorithm (GPROF), and Precipitation Retrieval and Profiling Scheme (PRPS) algorithms are gridded to 0.1° every half-hour, with priority firstly given to imagers over sounders, then secondly to the sensor closest to the center of the half-hour window. The PMW estimates are then calibrated to the combined radar-radiometer estimate on board the GPM Core Observatory [3]. Then, the temporal and spatial gaps between available PMW sensor swaths are filled by the Kalman filter-based time morphing scheme adapted from CMORPH-KF [24], which interpolates precipitation between PMW observation times, and combines PMW-adjusted IR precipitation estimates when the nearest PMW overpass is more than ±30 min away from the time. IR precipitation is estimated by the Precipitation Estimation from Remotely Sensed Information Using Artificial Neural Networks–Cloud Classification System (PERSIANN-CCS) algorithm [25], which converts IR cloud-top Tb into precipitation using neural networks, trained on coincident IR and PMW observations. The final satellite estimate is adjusted against the Global Precipitation Climatology Centre (GPCC) monthly precipitation using the method employed in TRMM Multisatellite Precipitation Analysis (TMPA) [26]. However, for small islands such as Kwajalein, no gauge calibration is applied to the IMERG product because of poor gauge representativeness for the surrounding ocean, and often even for the island in general due to high precipitation variation over the island [10].
There are many changes from V05B to V06B [4], some of which pertain to our results in Section 4. In V05B, the motion vectors used in the quasi-Lagrangian time interpolation were computed from the geostationary IR Tb fields, whereas in V06B, the vectors were computed from moisture fields in numerical models. As for the intercalibration in V05B, only the SSMIS sensors were calibrated to the Combined Radar Radiometer Analysis (CORRA)-calibrated GMI, whereas in V06B, all constellation sensors were calibrated to the GMI. Other changes in IMERG V06B that are relevant to this study include the removal of discretization of precipitation rates, the removal of the 50 mm h−1 cap on maximum PMW precipitation rate, and the inclusion of TMI and SAPHIR (see below).
IMERG has three different Runs with various latencies; this study evaluates the IMERG Final Run against KPOL and identifies the relative performance of the sensors and algorithms from which IMERG precipitation are derived. We choose to evaluate the IMERG Final Run because it is the product in research quality and most widely used in various applications. The IMERG sensor information can be obtained from IMERG ancillary variable HQprecipSource. A complete list of the sensors included in IMERG V06B over Kwajalein for the study period is given in Table 2. Sensors for V05B are not separately listed because they are the same as V06B except that TMI and SAPHIR are not used in V05B. TMI ended in April 2015 after TRMM depleted its fuel reserves. TMI is not included in the V05B IMERG because V05 GPROF-TMI estimates were not available at the time of the IMERG V05B Final Run retrospective processing [2]. SAPHIR onboard the French-Indian Megh-Tropiques Mission, one of the GPM constellation satellites, provides measurements two to five times per day over the 30°S to 30°N area [27]. To enhance the sampling of precipitation over the lower latitudes, SAPHIR is included into IMERG for the first time in V06 [4]. The benefits of the SAPHIR inclusion are largely unclear, hence, its performance is a particular focus in this study.
Because IMERG is a multi-satellite product, sensors contributing to different versions of IMERG change from time to time. Some sensors may be added to IMERG while others might be no longer available. For the IMERG V06B used in this study, there are seven PMW sensors contributing to IMERG: TMI, GMI, AMSR2, SSMIS, ATMS, MHS, and SAPHIR. Table 2 lists the full names of these sensors’ acronyms, along with the sensor types, and the onboard GPM constellation satellites on which they fly, as well as the indices indicated in HQprecipSource. Of the seven sensors listed, the first four sensors (TMI, AMSR2, SSMIS and GMI) are imagers whereas the other three (MHS, ATMS and SAPHIR) are sounders. Imagers are generally considered better than sounders over oceans, which will be shown in our analysis.
All ancillary variables used in this study can be found in Table 3. The variable precipitationUncal is precipitation estimate without gauge calibration, which is confirmed to be identical to precipitationCal (precipitation estimate after gauge calibration) by our data processing because the gauge calibration is not applied to IMERG Final Run over Kwajalein. We categorize IMERG precipitation estimate (precipitationUncal) according to each of the above listed PMW sensors using HQprecipSource. In addition, if no PMW observation is available, we categorize the IMERG estimate into three morphing-based categories according to IRkalmanFilterWeight: (1) morph-only (IRkalmanFilterweight = 0); (2) a mixture of morphing and direct IR, or IR + morph (0% < IRkalmanFilterweight < 100%); (3) IR-only (IRkalmanFilterweight = 100%). In our study, IMERG never uses IR-only estimation because of the availability of numerous sensors during the GPM era and the absence of frozen surfaces in our study area.
Unlike some other studies, ancillary variables HQprecipitation (PMW-only precipitation estimates) and IRprecipitation (PMW-calibrated IR precipitation estimates) are not used in this study. In IMERG V05B and V06B, precipitation rates from HQprecipitation are the same as those from precipitationUncal on pixels with PMW observation. IRprecipitation is not suitable for the morph and IR categories because IRprecipitation is the precipitation estimation obtained from PERSIANN CCS, hence it does not contain any propagated precipitation. On the other hand, precipitationUncal on the pixels without PMW observations is the weighted average from forward propagated precipitation, backward propagated precipitation, and IR precipitation. These are precipitation fields from the morphing algorithm in IMERG and refers to a propagation in time. Forward (backward) propagated precipitation is a precipitation field obtained by spatially moving the PMW precipitation pixels based on motion vectors over successive half-hours beginning at a certain point in the past (future) to the present half-hour. Hence, the categorization for morph and IR should use precipitationUncal. Note that precipitation rates from HQprecipitation and precipitationUncal may not be the same on the pixels with PMW observation in upcoming V07. The variable names HQprecipitation, HQprecipSource and kalmanFilterweight are valid only for the IMERG prior to V06, and will be changed to MWprecipitation, MWprecipSource and IRinfluence in V07 to improve clarity.

3. Methodology and Evaluation Metrics

The comparisons are conducted over the area within a 100-km radius centered at (8.75°N, 167.75°E), the nearest IMERG grid center to KPOL, using the V05B and V06B IMERG Final Run products, and the KPOL gridded data during the commonly available period from April 2014 to June 2018, excluding the missing periods. Because of the low data quality due to KPOL data interpolation with the given scanning strategy and data cutoff at the outer scanning boundary, the data beyond a 100-km range are not included in the analysis. The KPOL gridded data are averaged to half-hourly resolution, and then averaged to various time scales.
As discussed in Section 2, IMERG data are categorized according to five PMW sensors (AMSR2, SSMIS, MHS, GMI and ATMS) for IMERG V05B and seven PMW sensors (TMI, AMSR2, SSMIS, MHS, GMI, ATMS and SAPHIR) for IMERG V06B (Table 2), and two morphing-based categories (morph-only and IR + morph).
The evaluation of IMERG performance is carried out with volumetric and categorical statistical metrics. The volumetric metrics used in this study include Pearson correlation coefficient (Corr), relative bias (Bias), normalized mean absolute error (NMAE) and normalized root-mean-square error (NRMSE).
To assess the precipitation detectability of IMERG V05B and V06B using KPOL as a reference, a 2 × 2 categorical contingency table is constructed for each IMERG product. The contingency table consists of four variables, which are occurrences of hit (h), miss (m), false alarm (f), and correct negative (c). A precipitation or no precipitation threshold is assumed to be 0.1 mm h−1 in the construction of the contingency table. The same threshold was selected in our previous study for the satellite-based precipitation product validation over land [6] and many other studies, e.g., [28]. By using the threshold, the statistics are not overly influenced by the dominance of the non-precipitation and very light precipitation samples.
From h, m, f, and c, three commonly used metrices for precipitation detectability can be calculated. They are Probability of Detection (POD), False Alarm Ratio (FAR) and Heidke Skill Score (HSS).
The explanations and equations for these standard statistical metrics are not elaborated here as readers can always refer to statistics books, e.g., [29] or peer-reviewed papers, e.g., [6,28].
The above categorical statistical skills are the metrics for performance measurement based on precipitation occurrences rather than precipitation volume. Hence, we further introduce a volumetric error decomposition approach [30,31] to decompose the total error (E) of precipitation volume into three independent components: (1) hit bias (H)—precipitation is detected, but the estimated precipitation volume is biased either positively or negatively; (2) bias due to missed precipitation (M)—precipitation is missed, which obviously always causes a negative bias; and (3) bias due to false precipitation detection (F)—precipitation is mistakenly detected while there is no precipitation in reality, which apparently causes a positive bias. Each of these three components could be possibly larger than the total error as they could cancel each other, resulting in a smaller total error. The relationship of the three components is regulated by E = H – M + F.
Among all above metrics, Corr and NRMSE assess the uncertainty; Bias and NMAE assess the systematic error; contingency variables (h, m, f, c), POD, FAR and HSS assess the detectability. The error decomposition components (E,H,M,F) contains information for both systematic error and detectability.

4. Comparisons of IMERG and KPOL

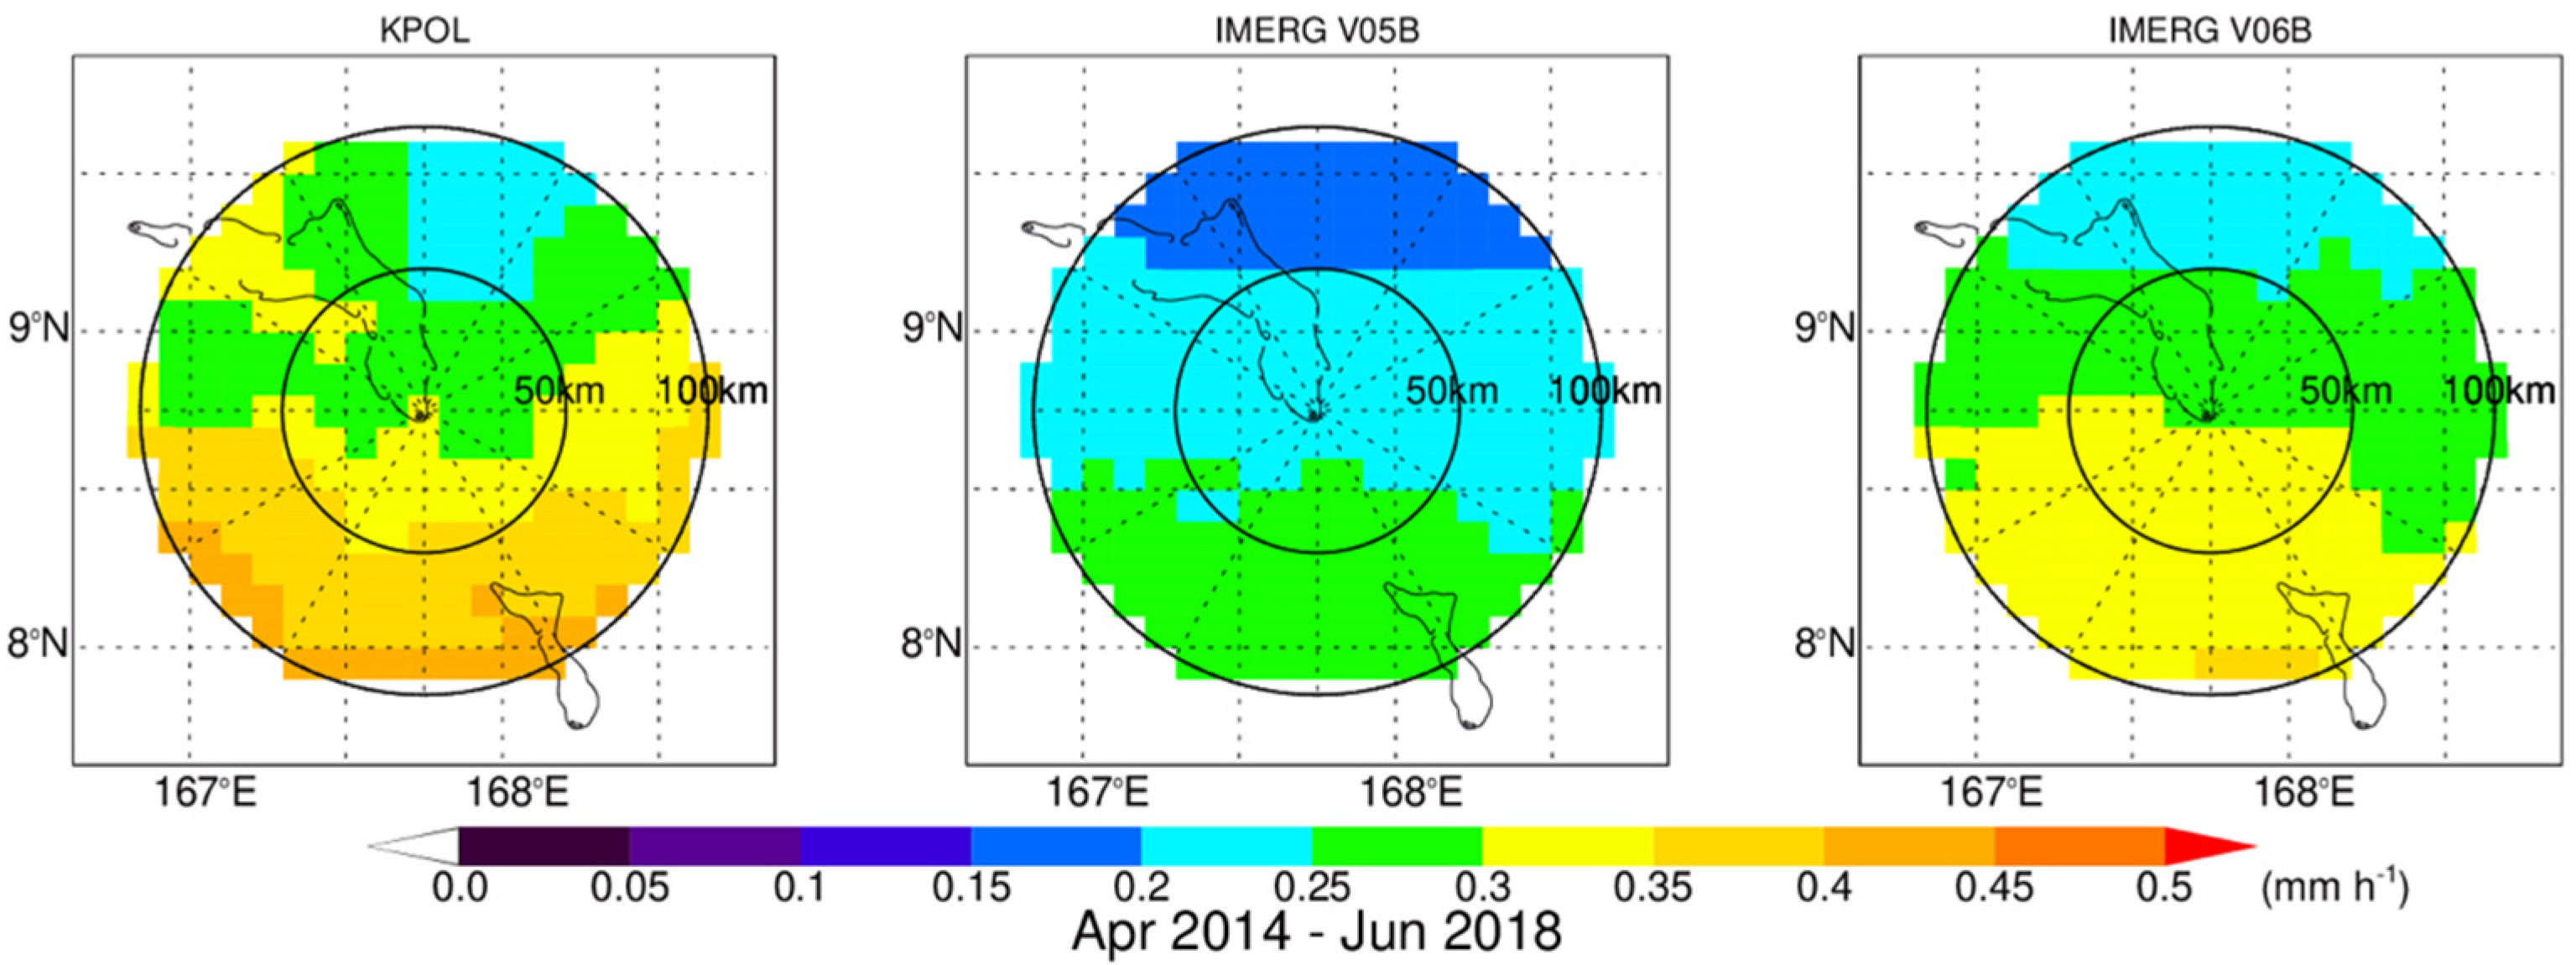
4.1. Mean Monthly Precipitation Maps

Mean monthly precipitation maps at 0.1° resolution averaged from April 2014 to June 2018 for KPOL, IMERG V05B and V06B, respectively, are shown in Figure 1. All products display a general pattern with decreasing precipitation from south to north due to the proximity to the ITCZ. The pattern correlation [29] between IMERG V05B and KPOL is 0.836, slightly better than the pattern correlation (0.813) between IMERG V06B and KPOL. This is likely because of the maximum precipitation cutoff of 50 mm h−1 in V05B IMERG [4], which reduced the number of outliers in the data. This will be further discussed in Section 4. The differences among the three products are obvious. Precipitation contours for IMERG V05B and V06B are smoother than those for KPOL. This is because the PMW sensors (and hence IMERG) cannot resolve the fine-scale features of the precipitation. The precipitation rates from both IMERG V05B and V06B are underestimated with respect to KPOL estimates. As we will see, this underestimation stems from a negative bias in the PMW precipitation retrievals in V05B, but is much alleviated in V06B.
Figure 1. Mean precipitation maps from KPOL, IMERG V05B and V06B over the period of April 2014–June 2018.
Remotesensing 14 03753 g001

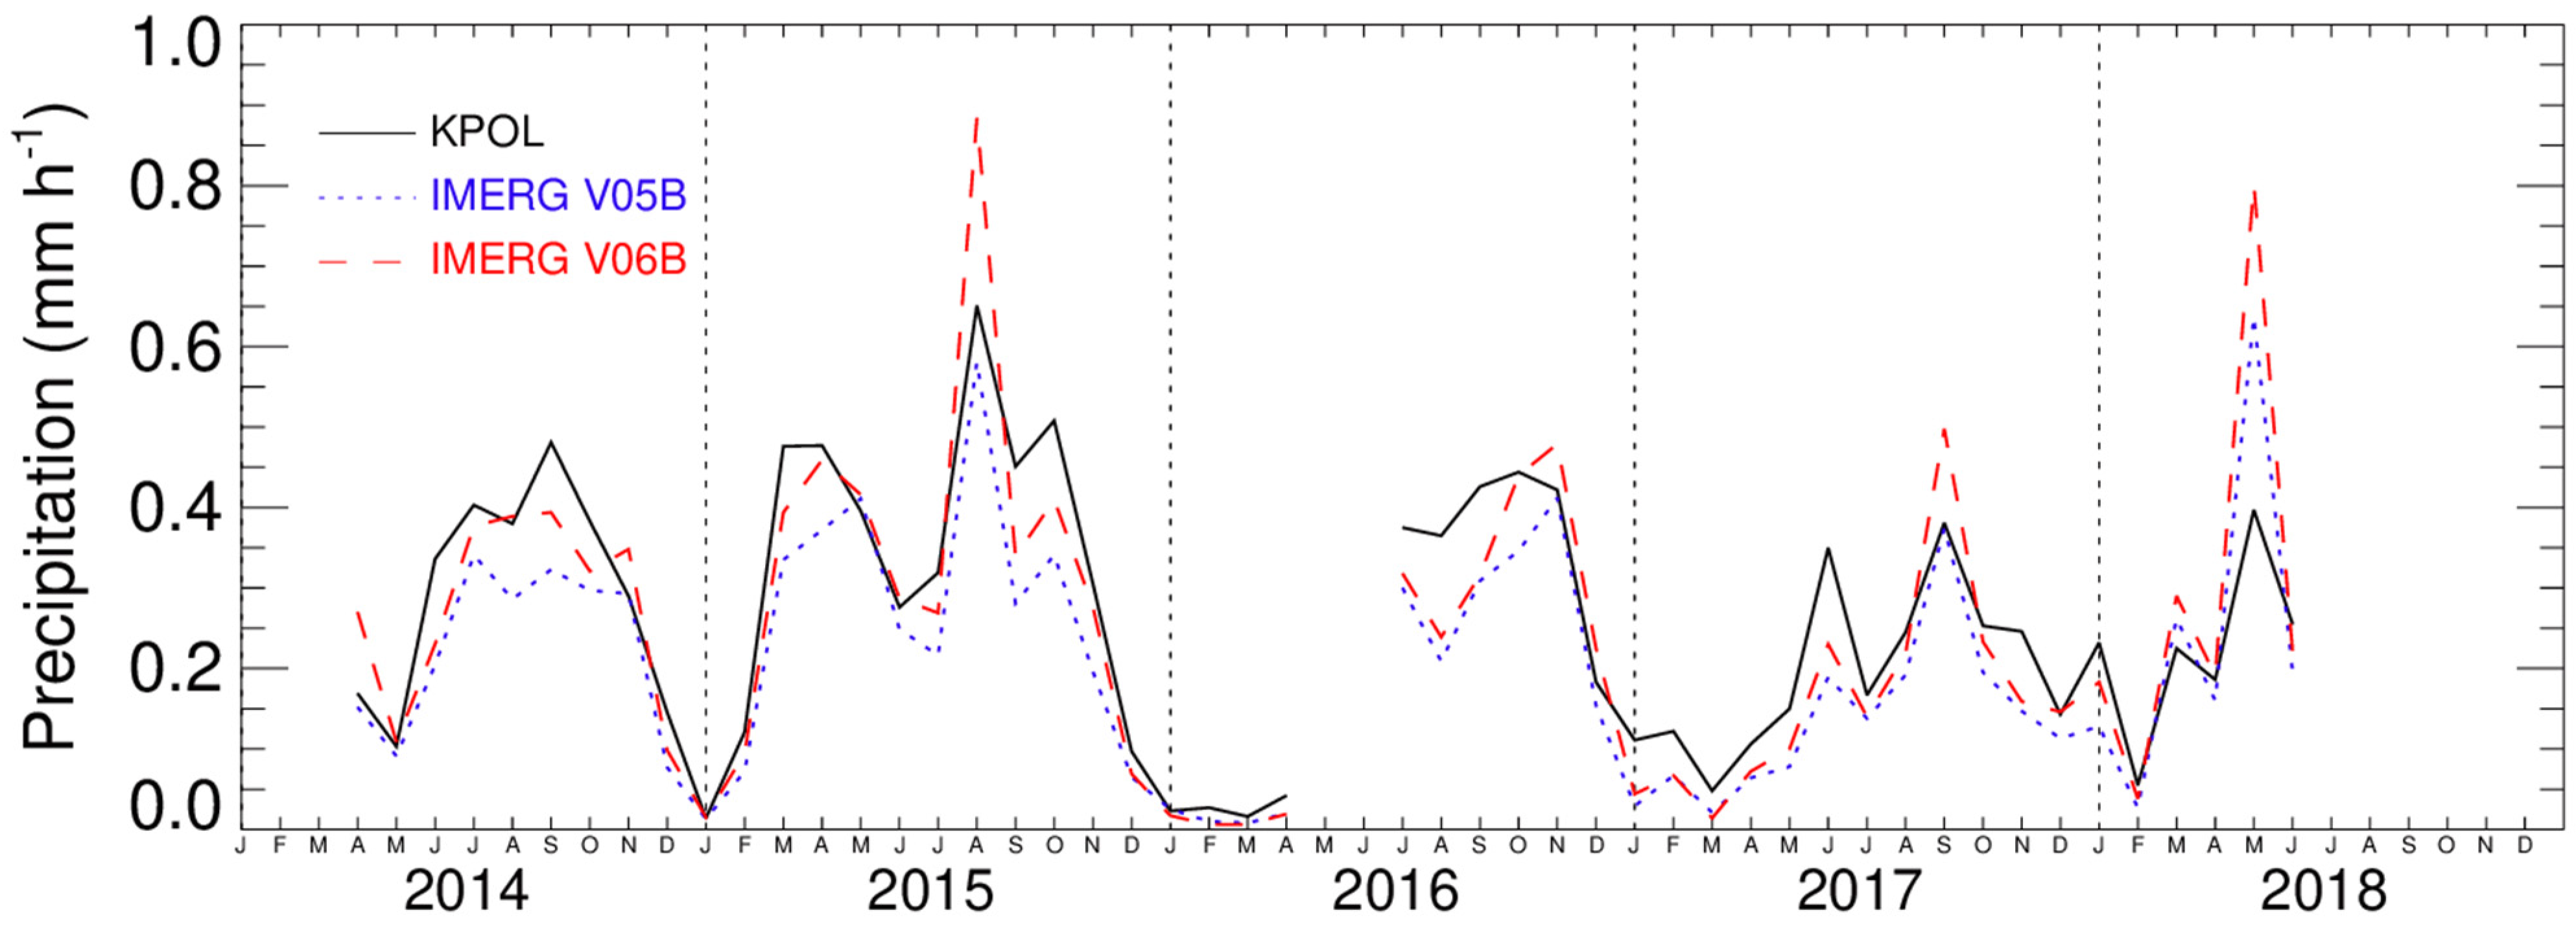
4.2. Time Series of Spatially Averaged Monthly Precipitation

To get a sense of the area-averaged performance over the entire study period, we compare IMERG V05B and V06B against KPOL at the monthly scale. Figure 2 is the time series of monthly precipitation approximately calculated from available half-hourly precipitation rates at 0.1° resolution over the area within the 100-km radius for KPOL, IMERG V05B and V06B, respectively. There is one gap from May to June 2016 in Figure 2 because about 50% of KPOL data are missing. Both V05B and V06B are able to reasonably reproduce the seasonal precipitation variation. IMERG V06B precipitation rates are constantly higher than IMERG V05B and appear closer to KPOL.

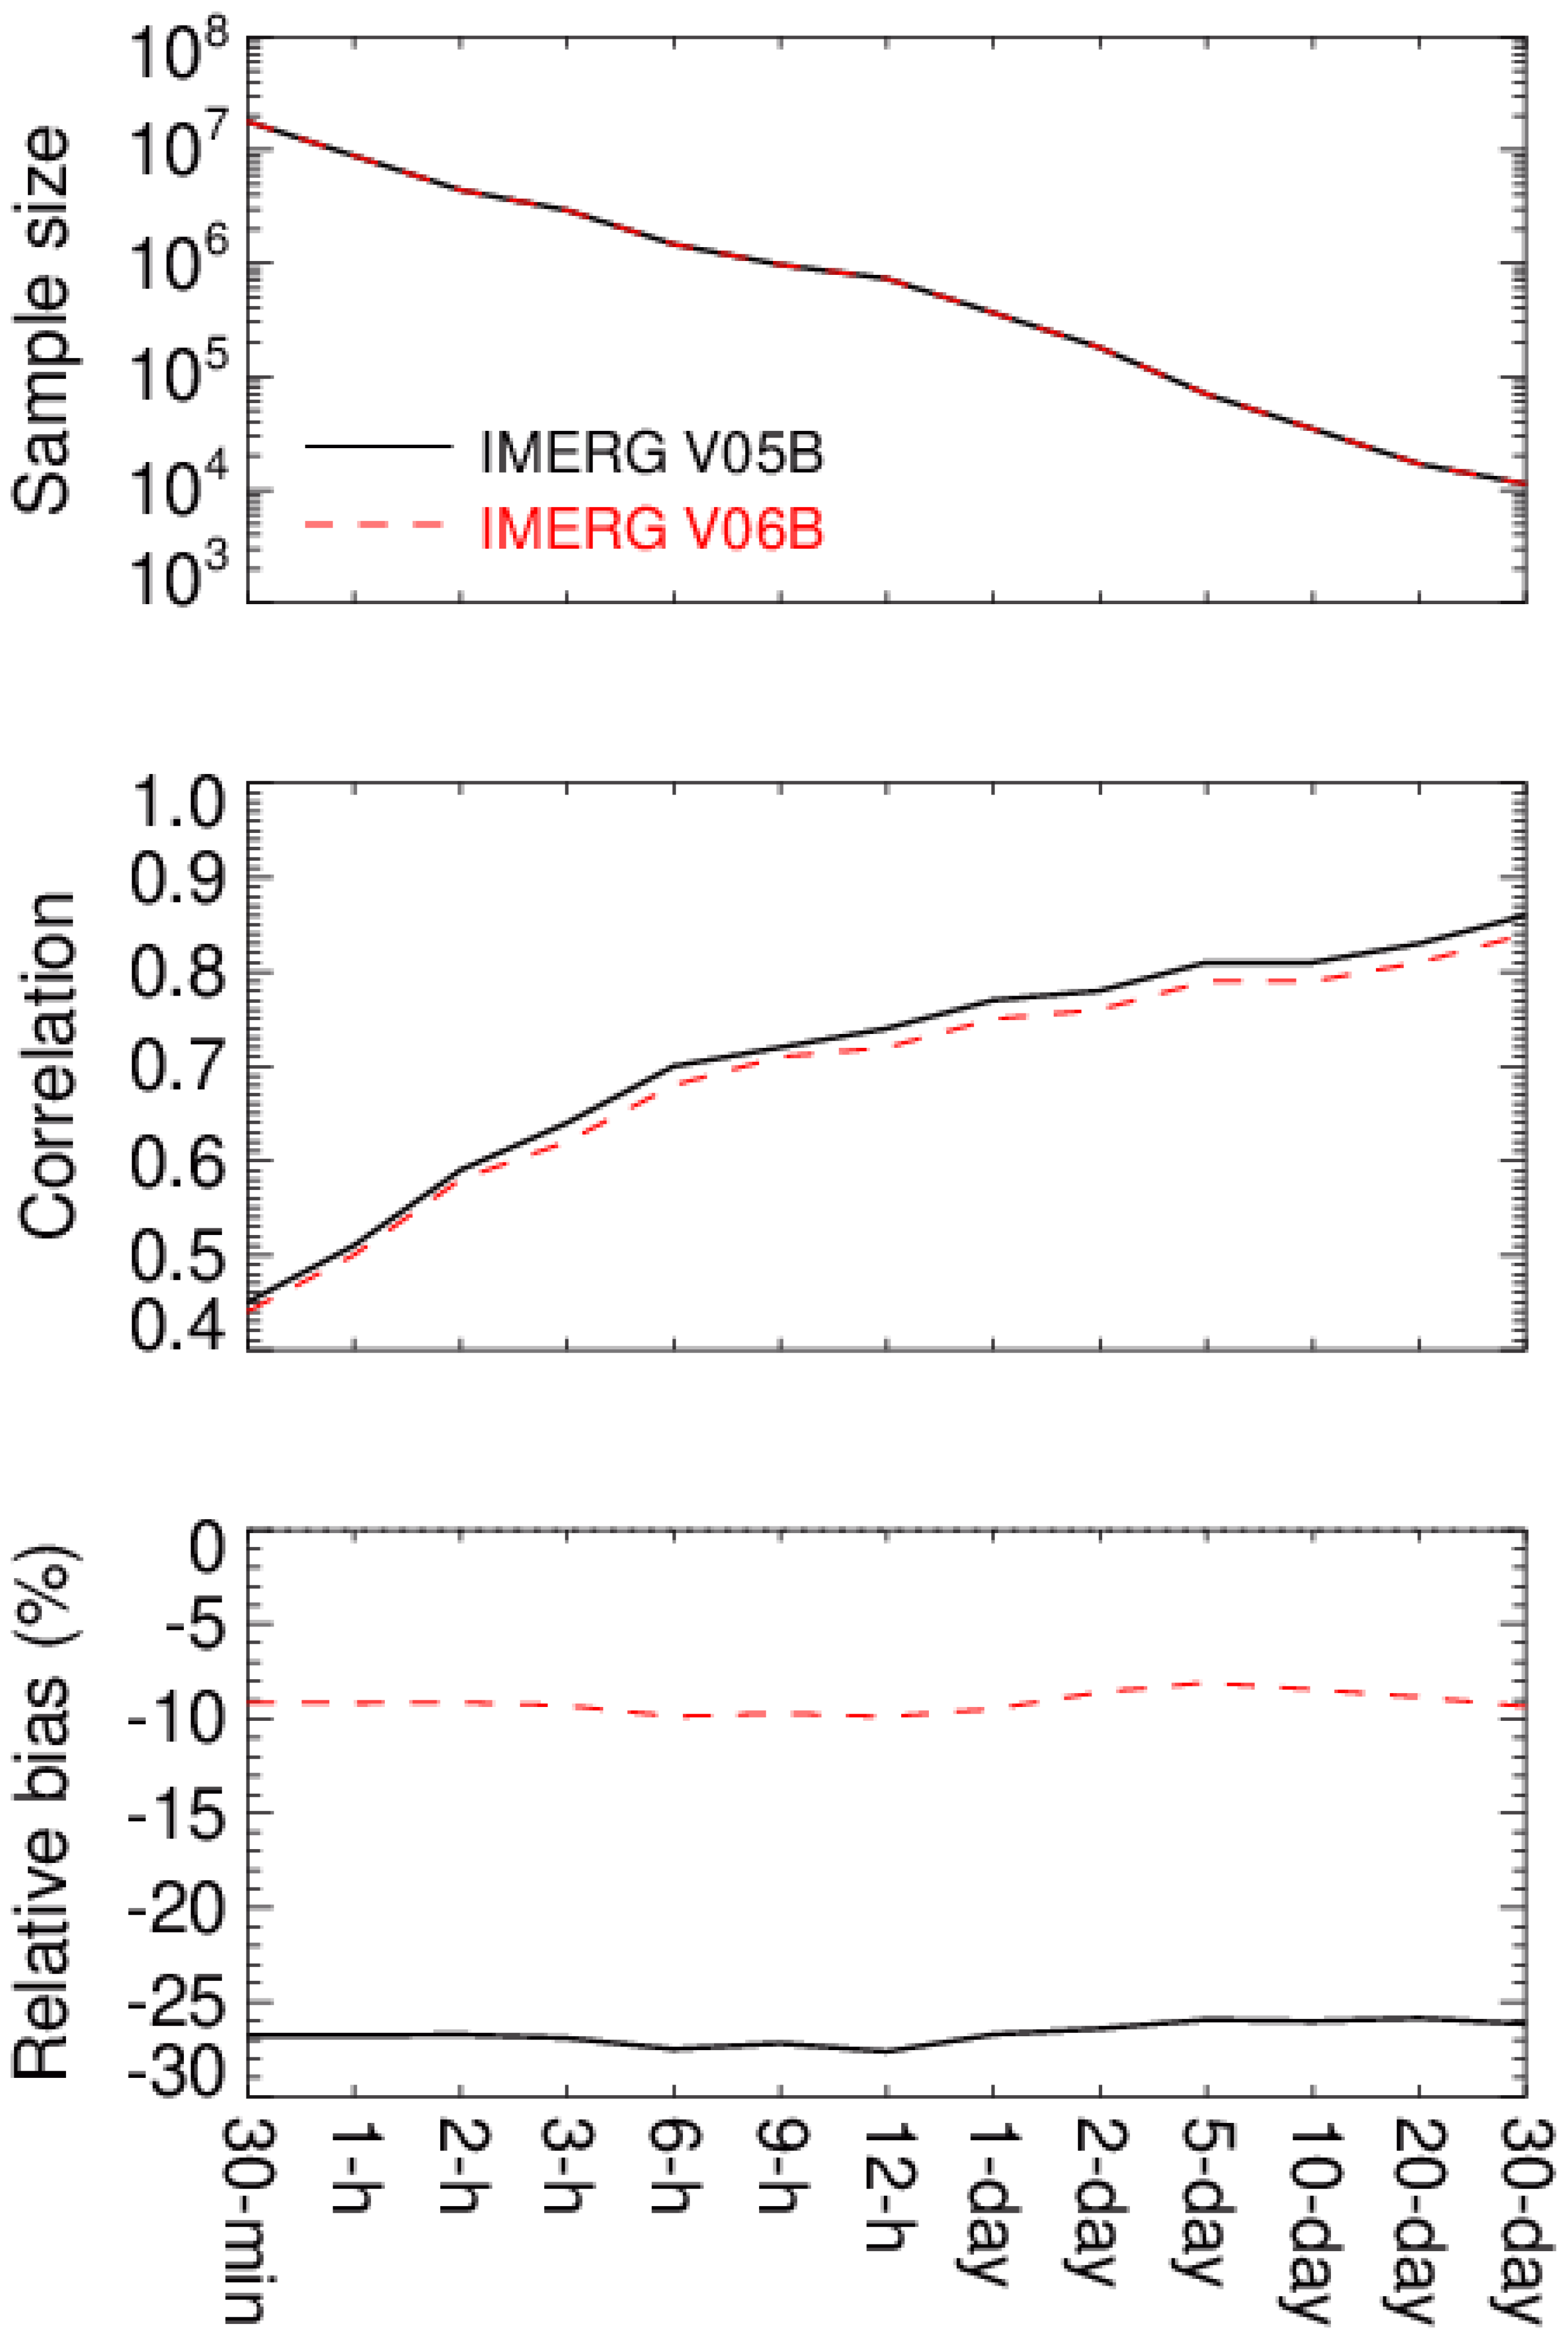
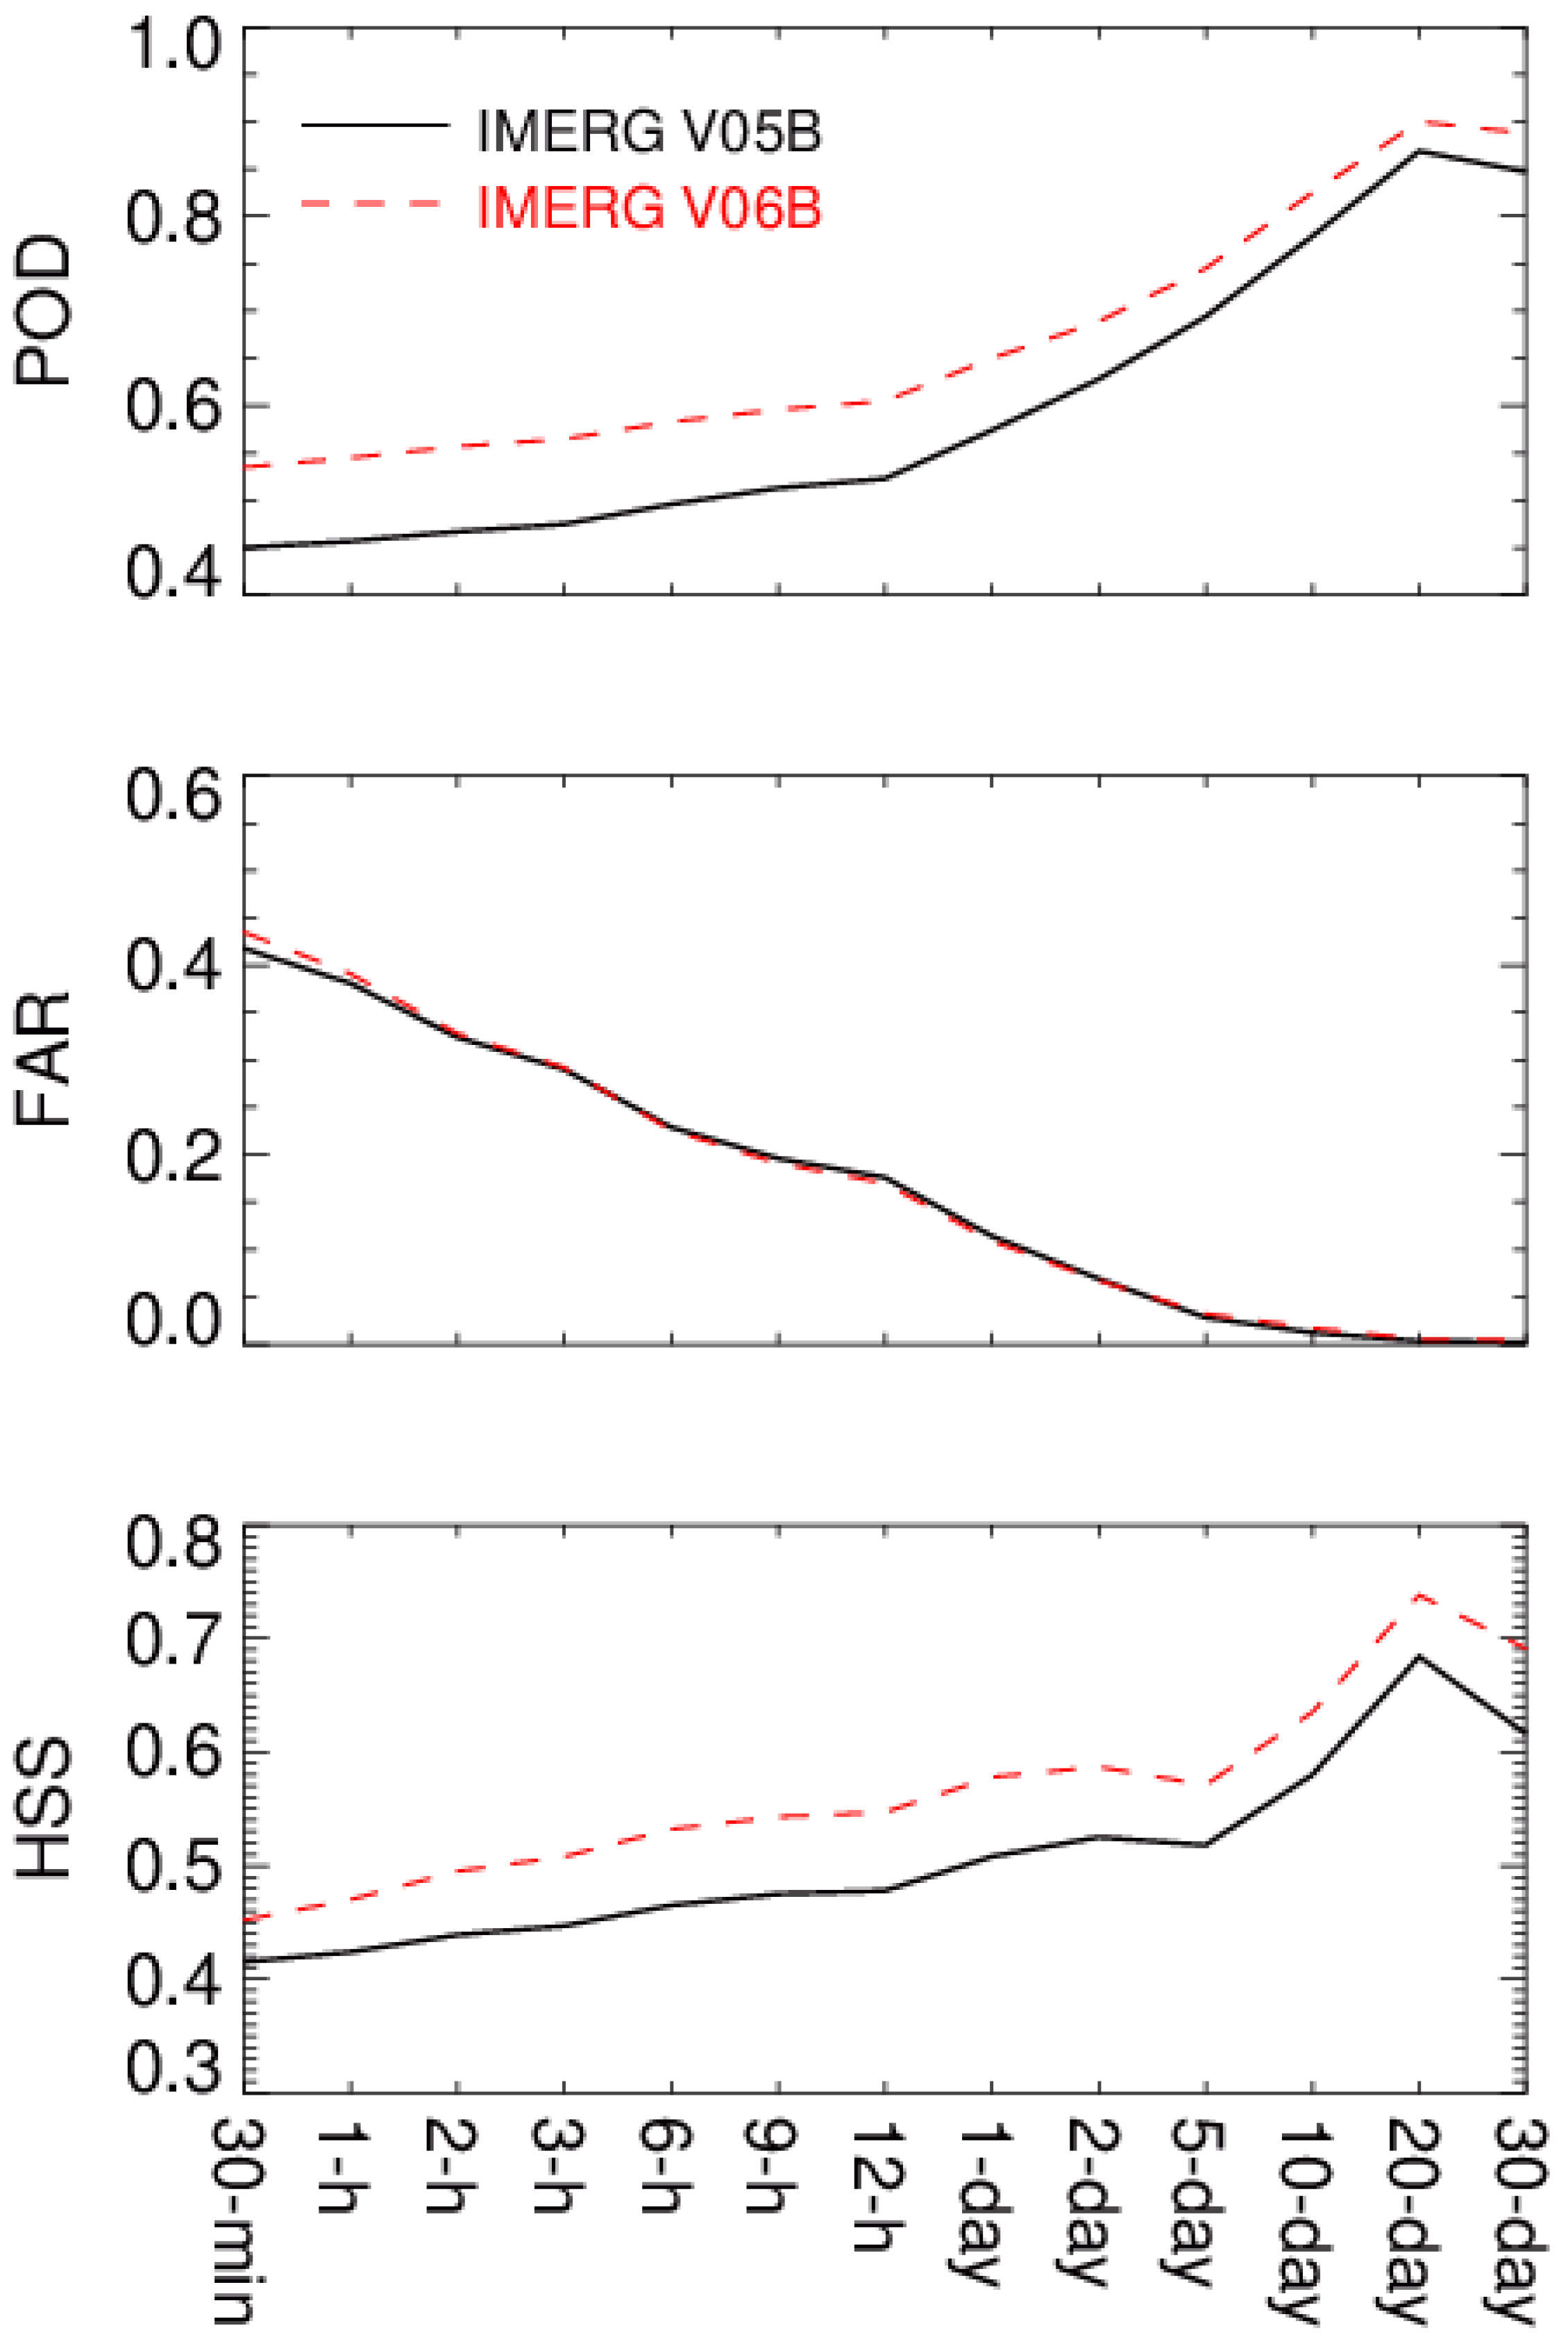
4.3. Mean Precipitation Rates from 5-min to 30-Day Scale

Figure 3 shows the comparison of IMERG V05B and V06B with KPOL at 0.1° resolution and various time scales ranging from 30 min to 30 days over the period from April 2014 to June 2018. The comparison is conducted with all matched pairs of IMERG V05B (V06B) and KPOL mean precipitation rates including zero-precipitation rates. The sample size (the number of matched 0.1° pixels) for IMERG V05B is identical to that for V06B because the changes in V06B to V05B is applied to all 0.1° pixels. As expected, the sample size for IMERG V05B or V06B steadily decreases from 17,837,505 at 30-min scale to 11,220 at 30-day scale. The linear correlation between IMERG and KPOL increases with the time scale because the random fluctuation is gradually smoothed out when the precipitation rates are averaged at each of the larger time scales. The linear correlation for V05B appears to be slightly better than V06B, which will be explained in Section 4. The biases for IMERG V05B and V06B relative to KPOL are very stable with the time scale from 30 min to 12 h, and then slightly increase with the time scale from 12 h to 30 days. The precipitation underestimation from IMERG V06B is obviously reduced as compared to V05B.
To assess the precipitation detectability of IMERG products, three categorical metrics POD, FAR and HSS are introduced for IMERG V05B and V06B precipitation rates with respect to KPOL precipitation rates at various time scales. Figure 4 clearly displays that IMERG V06B outperforms V05B in terms of POD and HSS at all time scales. The FAR score for V06B is slightly higher than for V05B at 30-min and 1-h scales, and very similar at other scales.

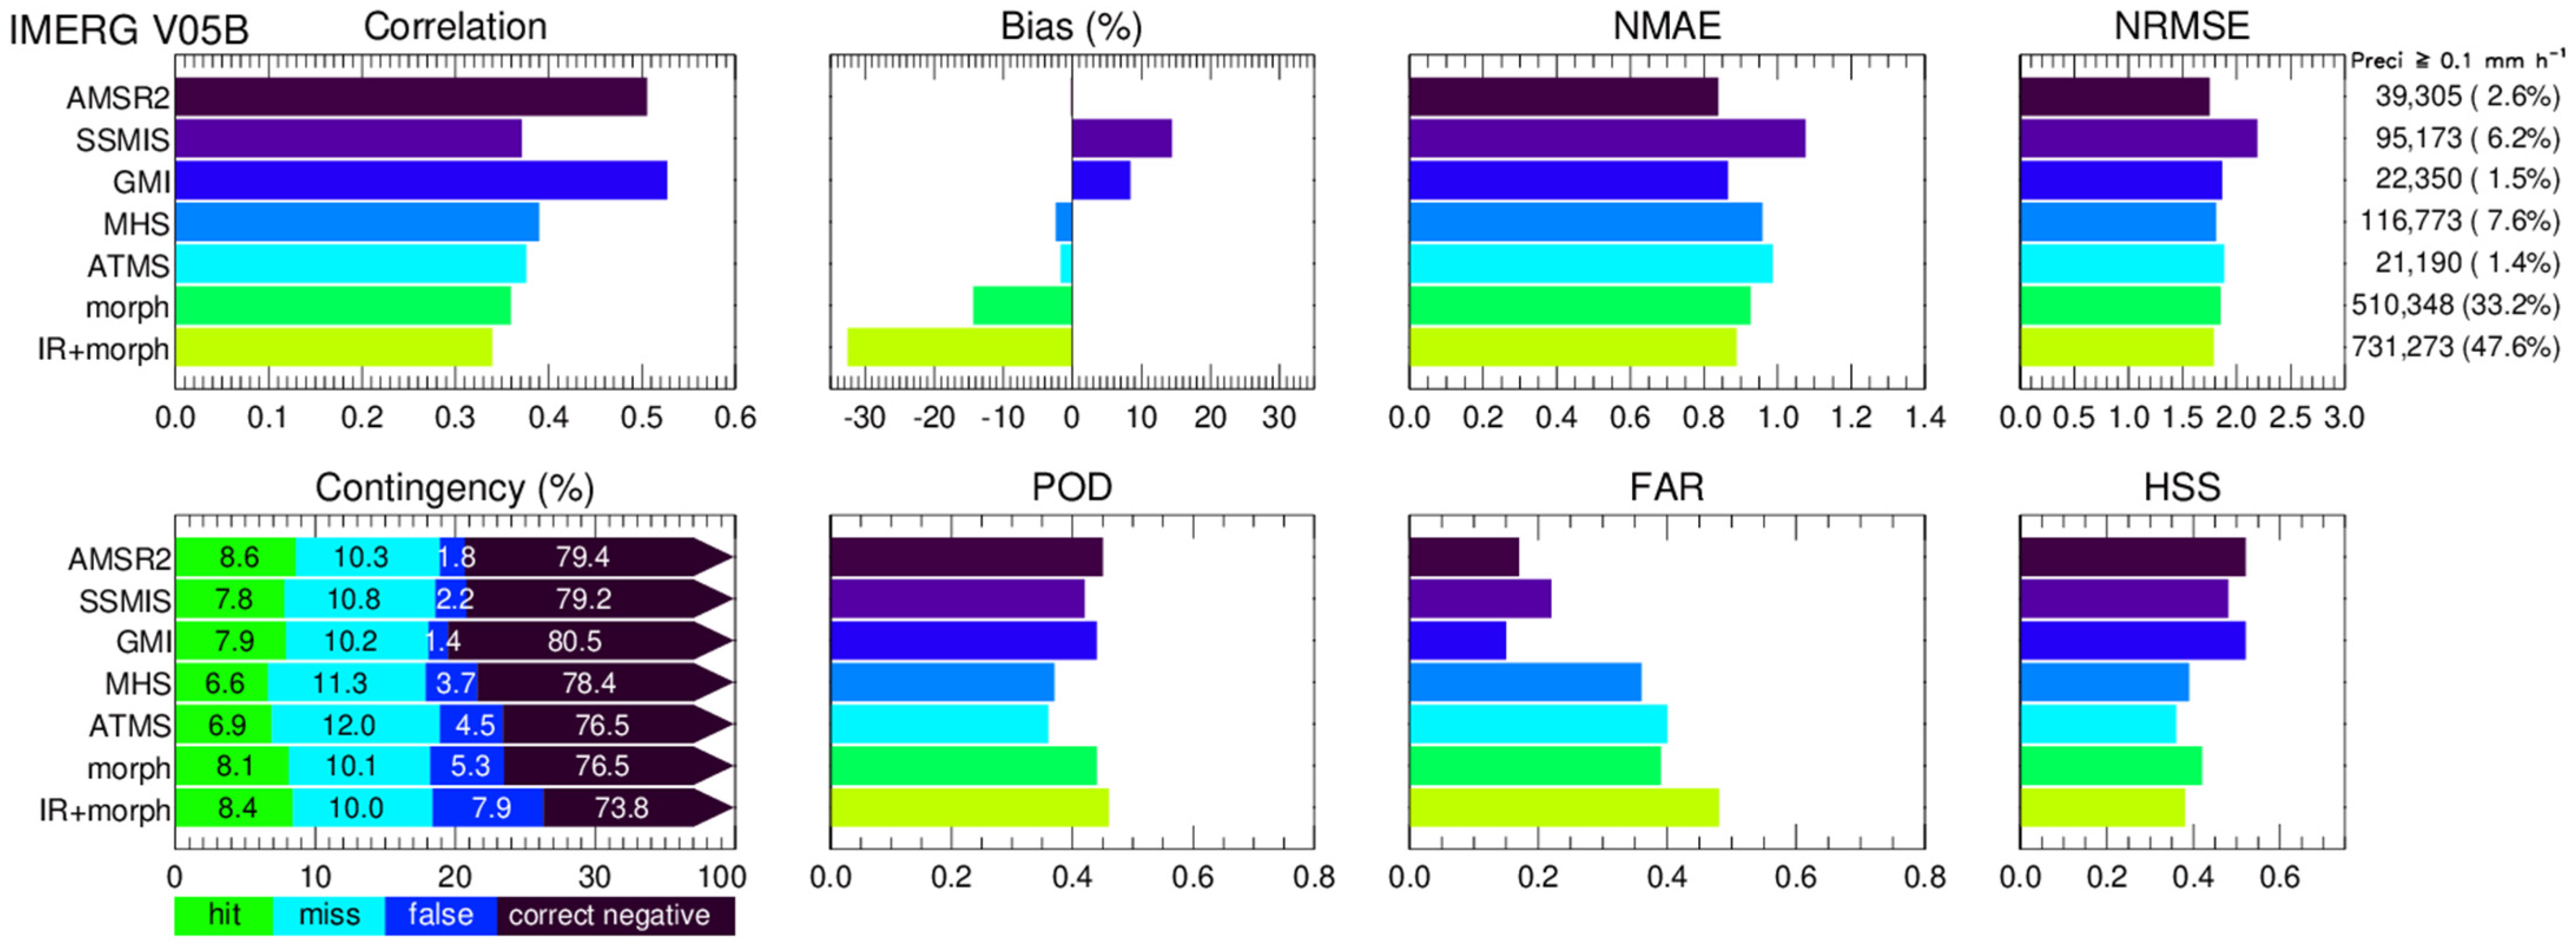
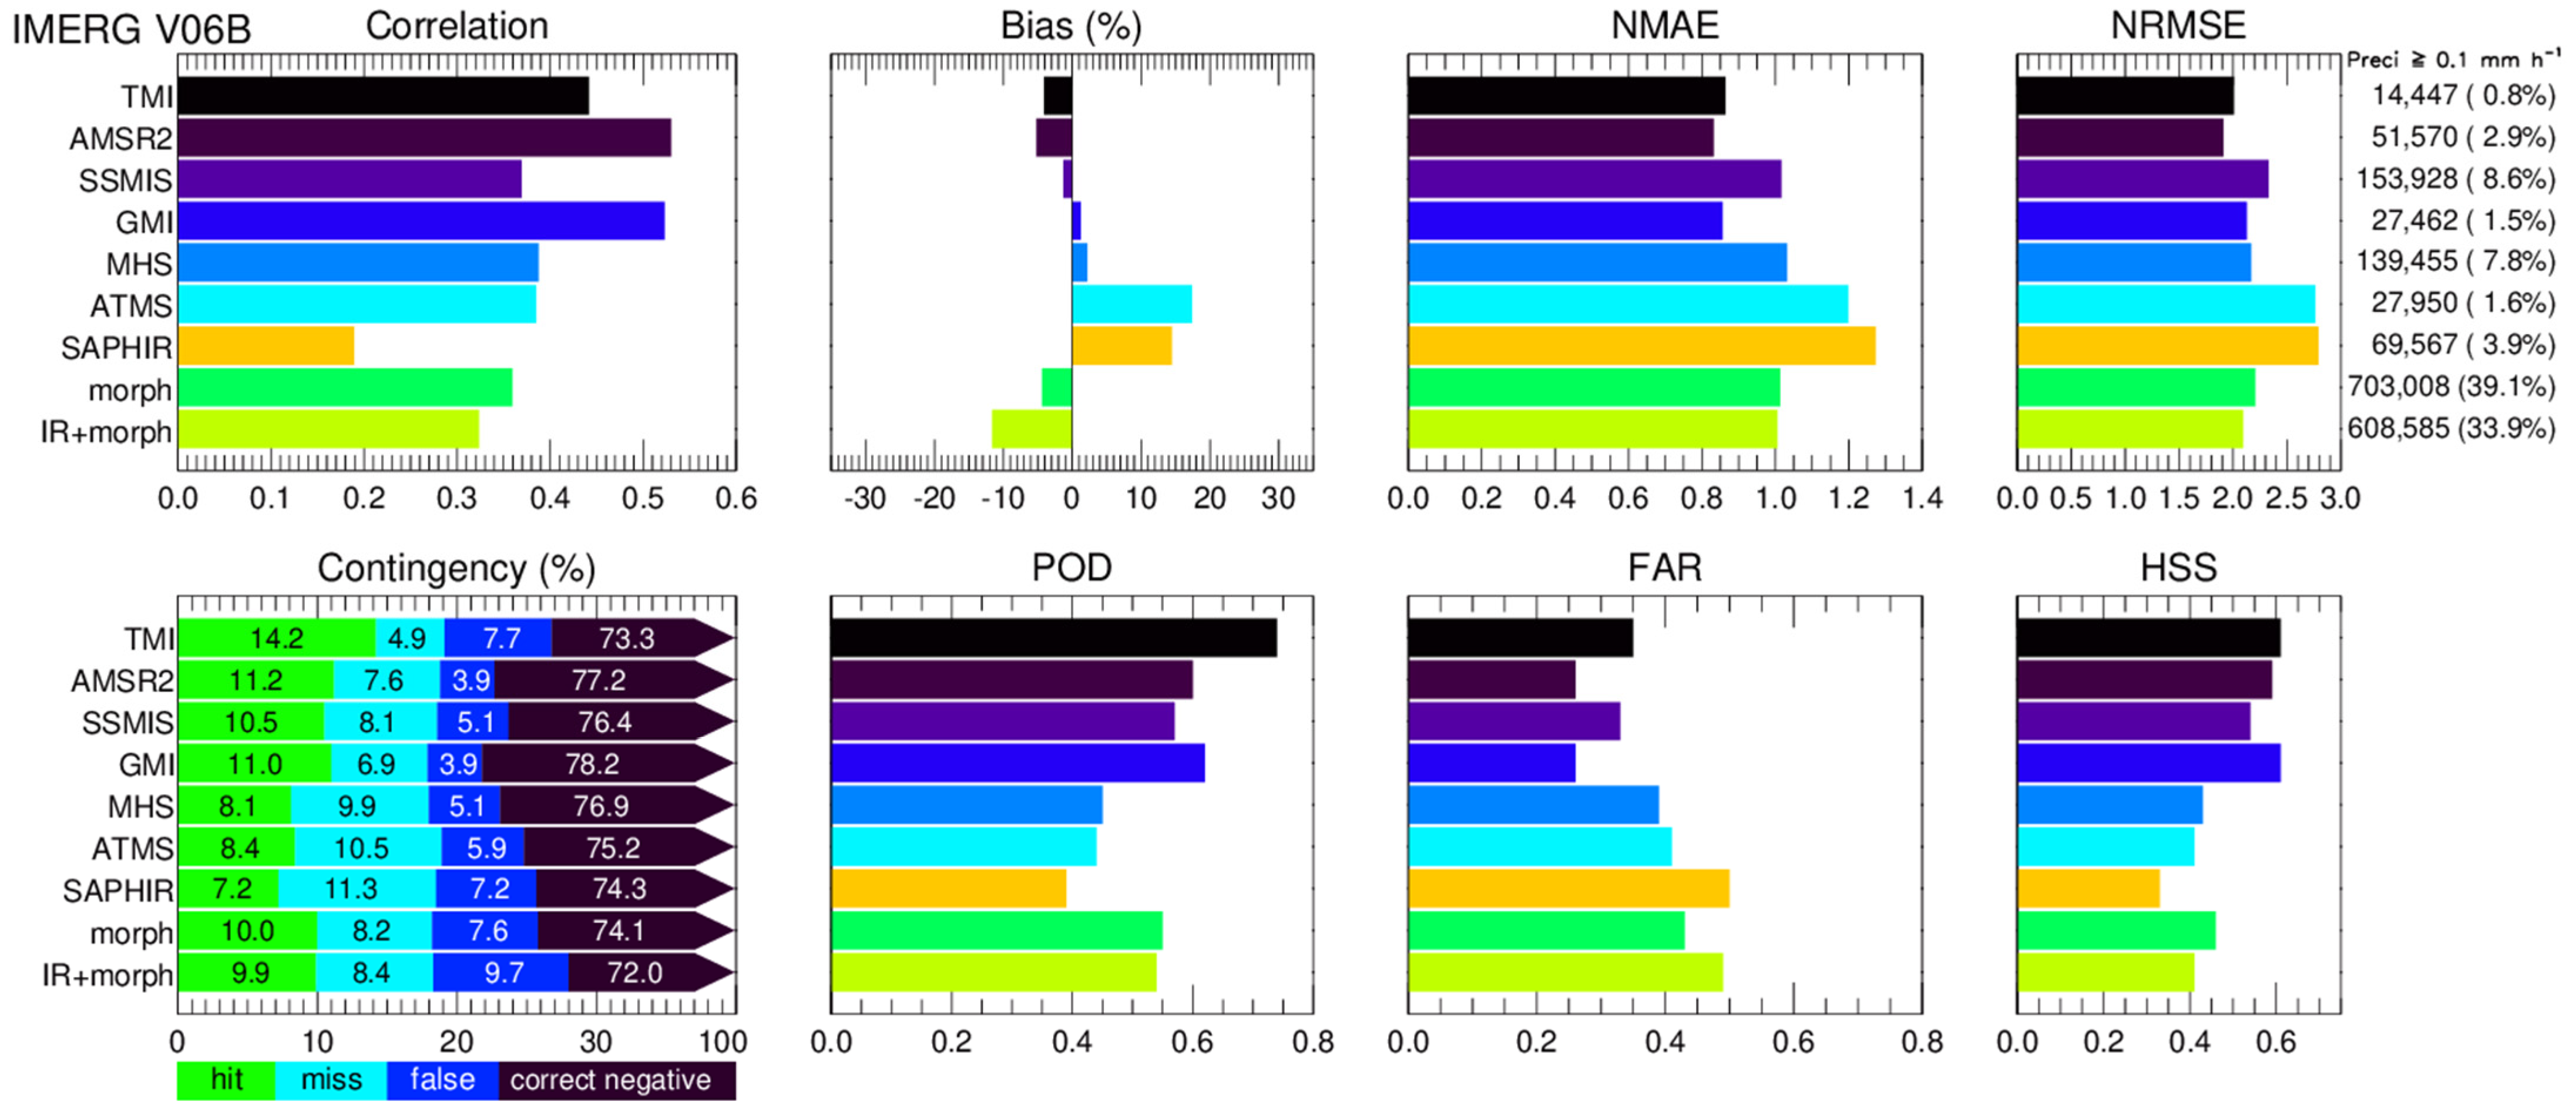
4.4. Categorization by Source

By using the IMERG ancillary variables, we can categorize IMERG estimates by each source, a particular sensor (e.g., GMI) onboard a satellite or a retrieval method (e.g., morph-only). Statistical metrics for the performances of IMERG sources relative to KPOL are displayed in Figure 5 and Figure 6 for V05B and V06B, respectively. The sample size differs greatly among these sources. More than 70% of the total samples are from morph-only and IR + morph categories. Less than 30% of the total samples are directly from PMW only observations without morphing. The source with larger sample size contributes more towards to the overall IMERG performance. A clear feature for both V05B and V06B is that all imagers (AMSR2, SSMIS, GMI for both V05B and V06B, and TMI for V06B only) have higher POD, smaller FAR and better HSS scores than all sounders (MHS and ATMS for both V05B and V06B, and SAPHIR for V06B only). The contingency table also depicts a similar detection feature with higher hit rate, and lower miss and false alarm rates for all imagers (except TMI) than for all sounders. TMI shows the highest hit and lowest miss rates at the price of higher false alarm rate. However, TMI only accounts for 0.6% of the total samples for IMERG V06B because TMI is no longer available after April 2015; hence, TMI only marginally affects the overall IMERG performance in this study. These results are consistent with You et al. [32], which also found that imagers (AMSR2 and SSMIS) perform better than sounders (ATMS and MHS) over the ocean as indicated by larger HSS scores. The better detection performance of imagers can be mainly attributed to the fact that emission signatures from the liquid water drops are better captured by low-frequency channels available from those platforms. Over the tropical oceans, precipitation rates can be physically better estimated through sensing the thermal emission of raindrops at low PMW frequencies because of the relatively uniform and low background emissivity from the ocean surface. In contrast, the inferior detection performance of sounders is largely due to lack of emission signatures because the low frequency channels below 89 GHz are either not available (MHS and SAPHIR) or not used (ATMS) [32].
Looking at correlations for IMERG V05B (Figure 5) and V06B (Figure 6), both GMI and AMSR2 have the best correlation, followed by TMI (for V06B), MHS, ATMS and SSMIS. The two morphing-based categories (Morph-only and IR + morph) only perform better than SAPHIR (for V06B). The good performance from GMI and AMSR2 can be attributed to their finer footprint sizes and broader spectrum of frequencies. The comparison among radiometers in the GPM constellation over Western Europe and USA also showed that GMI and AMSR2 have higher correlations and HSS scores [33].
Comparison between two sounders (MHS and ATMS) for V05B (Figure 5) and V06B (Figure 6) shows that MHS outperforms ATMS in almost all metrics. This is because the footprint size of the 89-GHz channel for ATMS is twice of that for MHS [32].
For another sounder SAPHIR in V06B only (Figure 6), the random error is largest among all nine categories as indicated by the lowest correlation and largest NRMSE. The systematic bias for SAPHIR is also largest with the worst NMAE and nearly largest positive relative bias. The worst detection performance of SAPHIR is evident from all categorical metrics with exception for false alarm and correct negative rates. The similar overestimation, weak correlation, and low detectability from SAPHIR were also reported over ocean by You et al. [32] and over coastal regions by Sui et al. [34]. This is because SAPHIR has only six channels around 183.3 GHz. Bennartz and Bauer [35], and You et al. [36] pointed out that 183.3-GHz channels are less sensitive to the ice-scattering signals.
The HSS scores for morph-only and IR + morph are lower than all imagers, but are comparable to sounders. The relatively higher FAR and POD for morph-only and IR + morph are because the Kalman filter smooths the precipitation fields, resulting in an increase in precipitating areas. The category for IR + morph is outperformed by morph-only in terms of nearly all metrics perhaps due to poor performance of IR.
Comparing contingency tables in Figure 5 and Figure 6, hit and miss rates in each category for IMERG V06B are better than those in IMERG V05B, which is at the expense of higher false alarm and lower correct negative rates in V06B. These features are consistent with the fact that V06B precipitation rates are higher than V05B (Figure 3). The overall underestimation for V05B (Figure 3) is mainly driven by the negative relative biases of two morphing-based algorithms (IR + morph and morph-only) which account for about 80% of the total samples with precipitation rates at least 0.1 mm h−1 (Figure 5). The relative biases for morph-only and IR + morph are largely corrected in V06B (Figure 6). The biases for morph-only and IR + morph in both V05B and V06B are likely due to the interpolation effect in the morphing scheme which leads to homogenization of the varying precipitation rates and underestimation of higher precipitation rates.
Another interesting feature is that the HSS score for each category in V06B (Figure 6) is higher than that score for the same category in V05B (Figure 5). Since both versions of IMERG use GPROF V05, this demonstrates that the full intercalibration and revised morphing scheme in V06B are a step forward.
The IMERG error characteristics can be further analyzed using the error decomposition approach. As described in Section 3, we decompose the total bias into hit, missed-precipitation, and false-precipitation biases for IMERG V05B and V06B, respectively, at 0.1° and 0.5-h resolution for the entire study period. The most salient feature in Figure 7 is that the category for IR + morph has the largest negative hit and total biases among all categories in V05B, which is much mitigated in V06B (Figure 8) though both hit and total biases remain negative. The total bias for IR + morph reduces from −32.2% in V05B to −10.0% in V06B. The category for morph-only displays a similar bias reduction feature from V05B to V06B as IR + morph. Those two morphing-based categories are the main contributors to the total IMERG bias reduction from V05B to V06B as they account for more than 70% of total samples.
In V06B (Figure 8), ATMS has a small positive total bias, which results from the cancellation among the positive hit bias, positive false-precipitation bias, and large negative missed-precipitation bias. The magnitude of the total bias for each source in V06B (Figure 8) is smaller than that in V05B (Figure 7).
Figure 9 shows statistical metrics for IMERG V05B and V06B performances relative to KPOL regardless of IMERG sources. This reflects the summary of all above results from each source. The sample sizes listed in Figure 9 are for V05B and V06B with the precipitation rate threshold of 0.1-mm h−1. They are simply the summations of the numbers from all categories listed in Figure 5 for V05B and Figure 6 for V06B. From V05B to V06B, the hit and miss rates are improved, but at the price of increased false alarm rate and decreased corrective negative rate. The random error seems to be slightly increased from V05B to V06B as indicated by the correlation and NRMSE. The total bias for V06B is much improved from V05B, mainly because of the reduced magnitudes of the negative hit bias and missed-precipitation bias. V06B performs better than V05B in terms of HSS, POD, hit and miss rates, but with increased FAR and false alarm rate for V06B.
To further investigate the distribution of precipitation occurrences by intensity, joint distributions of half-hourly precipitation rates at 0.1° resolution are constructed for IMERG V05B (Figure 10) and V06B (Figure 11) relative to KPOL, respectively, over the area with 100-km radius from KPOL during the entire study period. The precipitation threshold is again set to 0.1 mm h−1. The black dotted line overlayed on each panel of Figure 10 and Figure 11 is the quantile–quantile (Q-Q) plot, which indicates deviations from the one-to-one line at different quantiles. The numbers on the bottom right are the sample sizes (number of hits), ratio (IMERG/KPOL), and correlation for all matched IMERG and KPOL precipitation rates.
For V06B (Figure 11), the random errors for imagers (AMSR2, GMI and TMI) are fairly low in comparison with all other categories as seen by the tighter scatters in the plots. This is consistent with higher correlations and lower NRMSE in Figure 6. The similar results can be seen for AMSR2 and GMI from V05B in Figure 10. Note TMI and SAPHIR are not available for V05B. The zigzags in Q-Q plots in V05B (Figure 10) reflect the discretization of precipitation rates due to obsolete internal storage limitations in the IMERG V05B algorithm [4], which are eliminated in V06B. Moreover, because of the internal storage limitations, the maximum precipitation rate in V05B (Figure 10) is capped at 50 mm h−1 [4].
A noticeable difference for SAPHIR in comparison with all other sensors is that it has the widest spread in the distribution of precipitation rates (Figure 11), which is consistent with its weakest correlation and largest NRMSE (Figure 6). SAPHIR’s largest random error could be due to the narrow range of channel frequencies.
Another feature seen from V05B (Figure 10) is that both higher and lower precipitation rates are somewhat overestimated by all imagers. There is generally improvement for all imagers, as well as most of all other categories from V05B to V06B, with IR + morph being more noticeable. For morph-only and IR + morph, the overestimation for lower precipitation and underestimation for higher precipitation in V05B are fairly well corrected as indicated by much improved Q-Q correspondence in V06B (Figure 11). This can be mainly attributed to the improved morphing scheme in V06B.
Figure 12 shows the joint distributions of half-hourly precipitation rates at 0.1° resolution from V05B and V06B, respectively, as a whole, regardless of sources. IMERG V05B overestimates the precipitation rates below 2 mm h−1, whereas the precipitation rates above 2 mm h−1 are generally underestimated. As clearly indicated by the Q-Q line, both higher and lower precipitation rates are better estimated in V06B, which could be attributed to the intercalibration and improved morphing scheme in V06B. From V05B to V06B, there is a good improvement in the relative bias (from −18.7% to −4.8%), but a slight decrease in the Pearson’s correlation (from 0.351 to 0.349). The Pearson’s correlation measures the linear relation between two variables and is sensitive to a few outliers in the data. Because the maximum precipitation rate in V05B is capped at 50 mm h−1 which is lifted in V06B [4], the large outliers beyond 50 mm h−1 in V06B are the main culprits for the lower Pearson’s correlation. The Spearman’s rank correlation [29] measures the monotonic relationship (whether linear or not) between two variables, which is much less sensitive to outliers. If the Spearman correlation is used here, the correlation for V06B would be 0.360, slightly better than the correlation of 0.356 for V05B.

5. Discussion

The analysis in his study is based on the comparisons between IMERG and KPOL. The KPOL precipitation rates may suffer from some inaccuracies introduced by the drop size distribution (DSD) uncertainty associated with the algorithm by Cifelli et al. [21]. Figure 13 shows precipitation occurrences from available 2A56 gauge data [37] over Kwajalein and KPOL for the period from April 2014 to April 2015. KPOL and gauge agree reasonably well as indicated by the Pearson correlation of 0.891 and relative bias of 2.7%.
It should be noted that the use of KPOL, a single ground-based radar, as the ground truth reference may have some shortcomings in representativeness. After all, the observations from a single radar hardly represent the entire precipitation distribution over global oceans; e.g., the systematic bias for IMERG estimates over Kwajalein might be different from other areas, especially in oceanic regions outside the tropics. However, the relative performances of sensors in IMERG and the morphing-based algorithms are in line with other studies over other ocean, land and coastal areas [11,12,28,32,34], suggesting that the results are robust.
It is also recognized that KPOL, as other instruments, has sampling issues related to its scan strategy. KPOL provides precipitation measurements over an area within its approximately 150-km radius during a volume scan time of about 10 min, whereas a satellite essentially makes an instantaneous observation over a specific location, and the observation time changes along the satellite overpass. As a result, an inevitable temporal-spatial mismatch exists when comparing any satellite product with a ground-based product. In this study, the mismatch effect is largely mitigated as the comparison is conducted by using a large amount of co-located and co-temporal match-ups from both radar and satellite observations. Nevertheless, KPOL does provide a homogenous ground reference for direct pixel-to-pixel comparison over the radar covered area with different sensors in the satellite estimates. The relative performance of each IMERG sensor is expected to provide important information to IMERG developers for a sensor prioritization scheme when there is more than one sensor overpass over a pixel at a time step. This study emphasizes the relative performance of each IMERG sensor, as well as each morph-based algorithm, rather than judging a perfect agreement with KPOL.
Further, the KPOL radar is a unique resource for precipitation research, providing a rich set of high-resolution observations over what is effectively an open ocean environment. As demonstrated in this study, it can serve as an invaluable tool for evaluating satellite precipitation over the oceans, an important activity which has been limited in scope due to sparse surface observations. With careful quality control to ensure reliable precipitation estimates, this KPOL dataset, which is publicly available (see Data Availability Statement), has the potential to contribute to our understanding of precipitation processes over the ocean and thus globally.

6. Conclusions

This study has used a KPOL radar precipitation product to validate IMERG Final products V05B and V06B over Kwajalein in the central Pacific Ocean. The IMERG performance has been traced back to its individual sensors and morphing-based algorithms. The performance has been assessed on both volumetric and categorical metrics. The main results are summarized as follows:
(1)
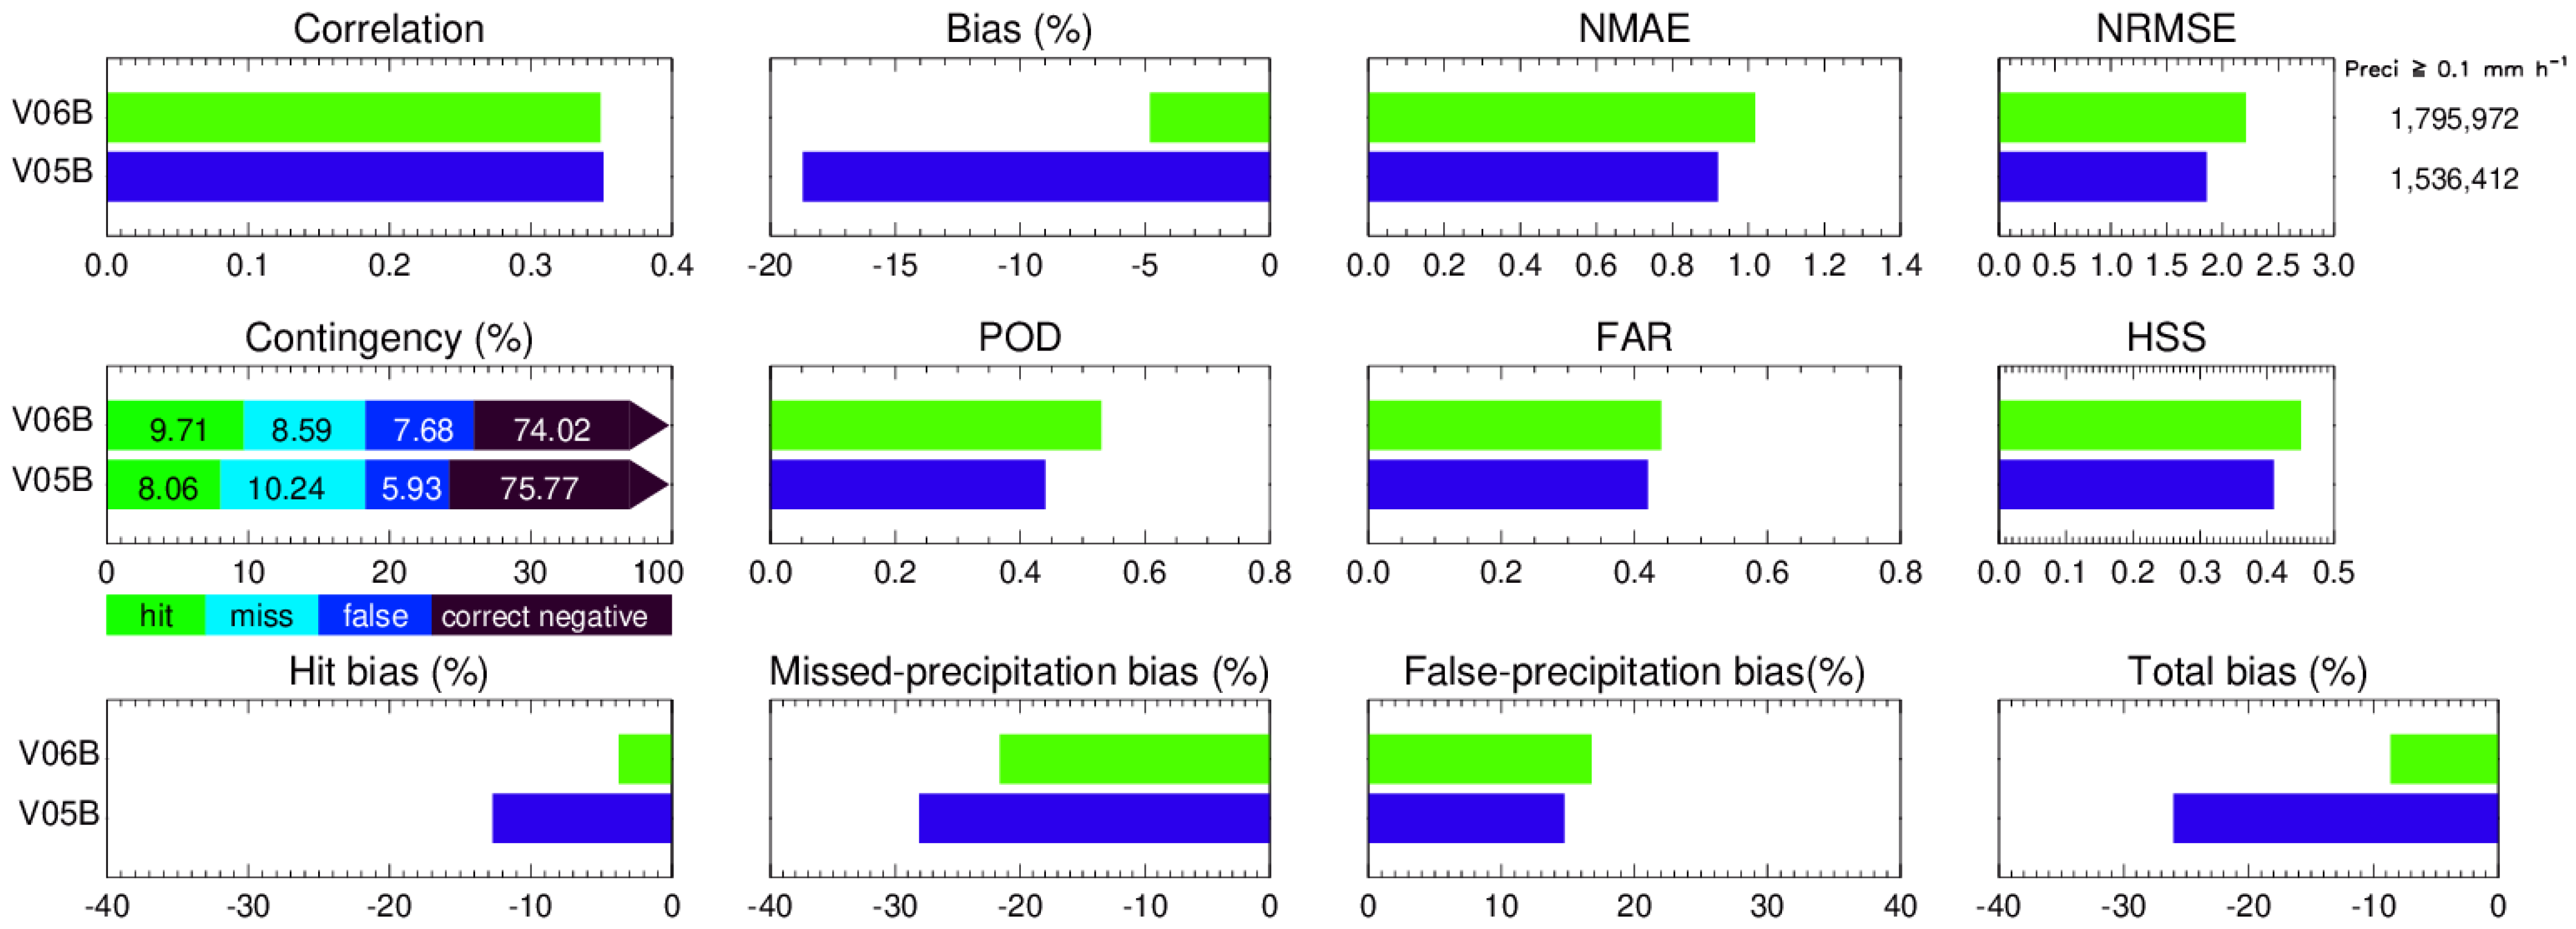
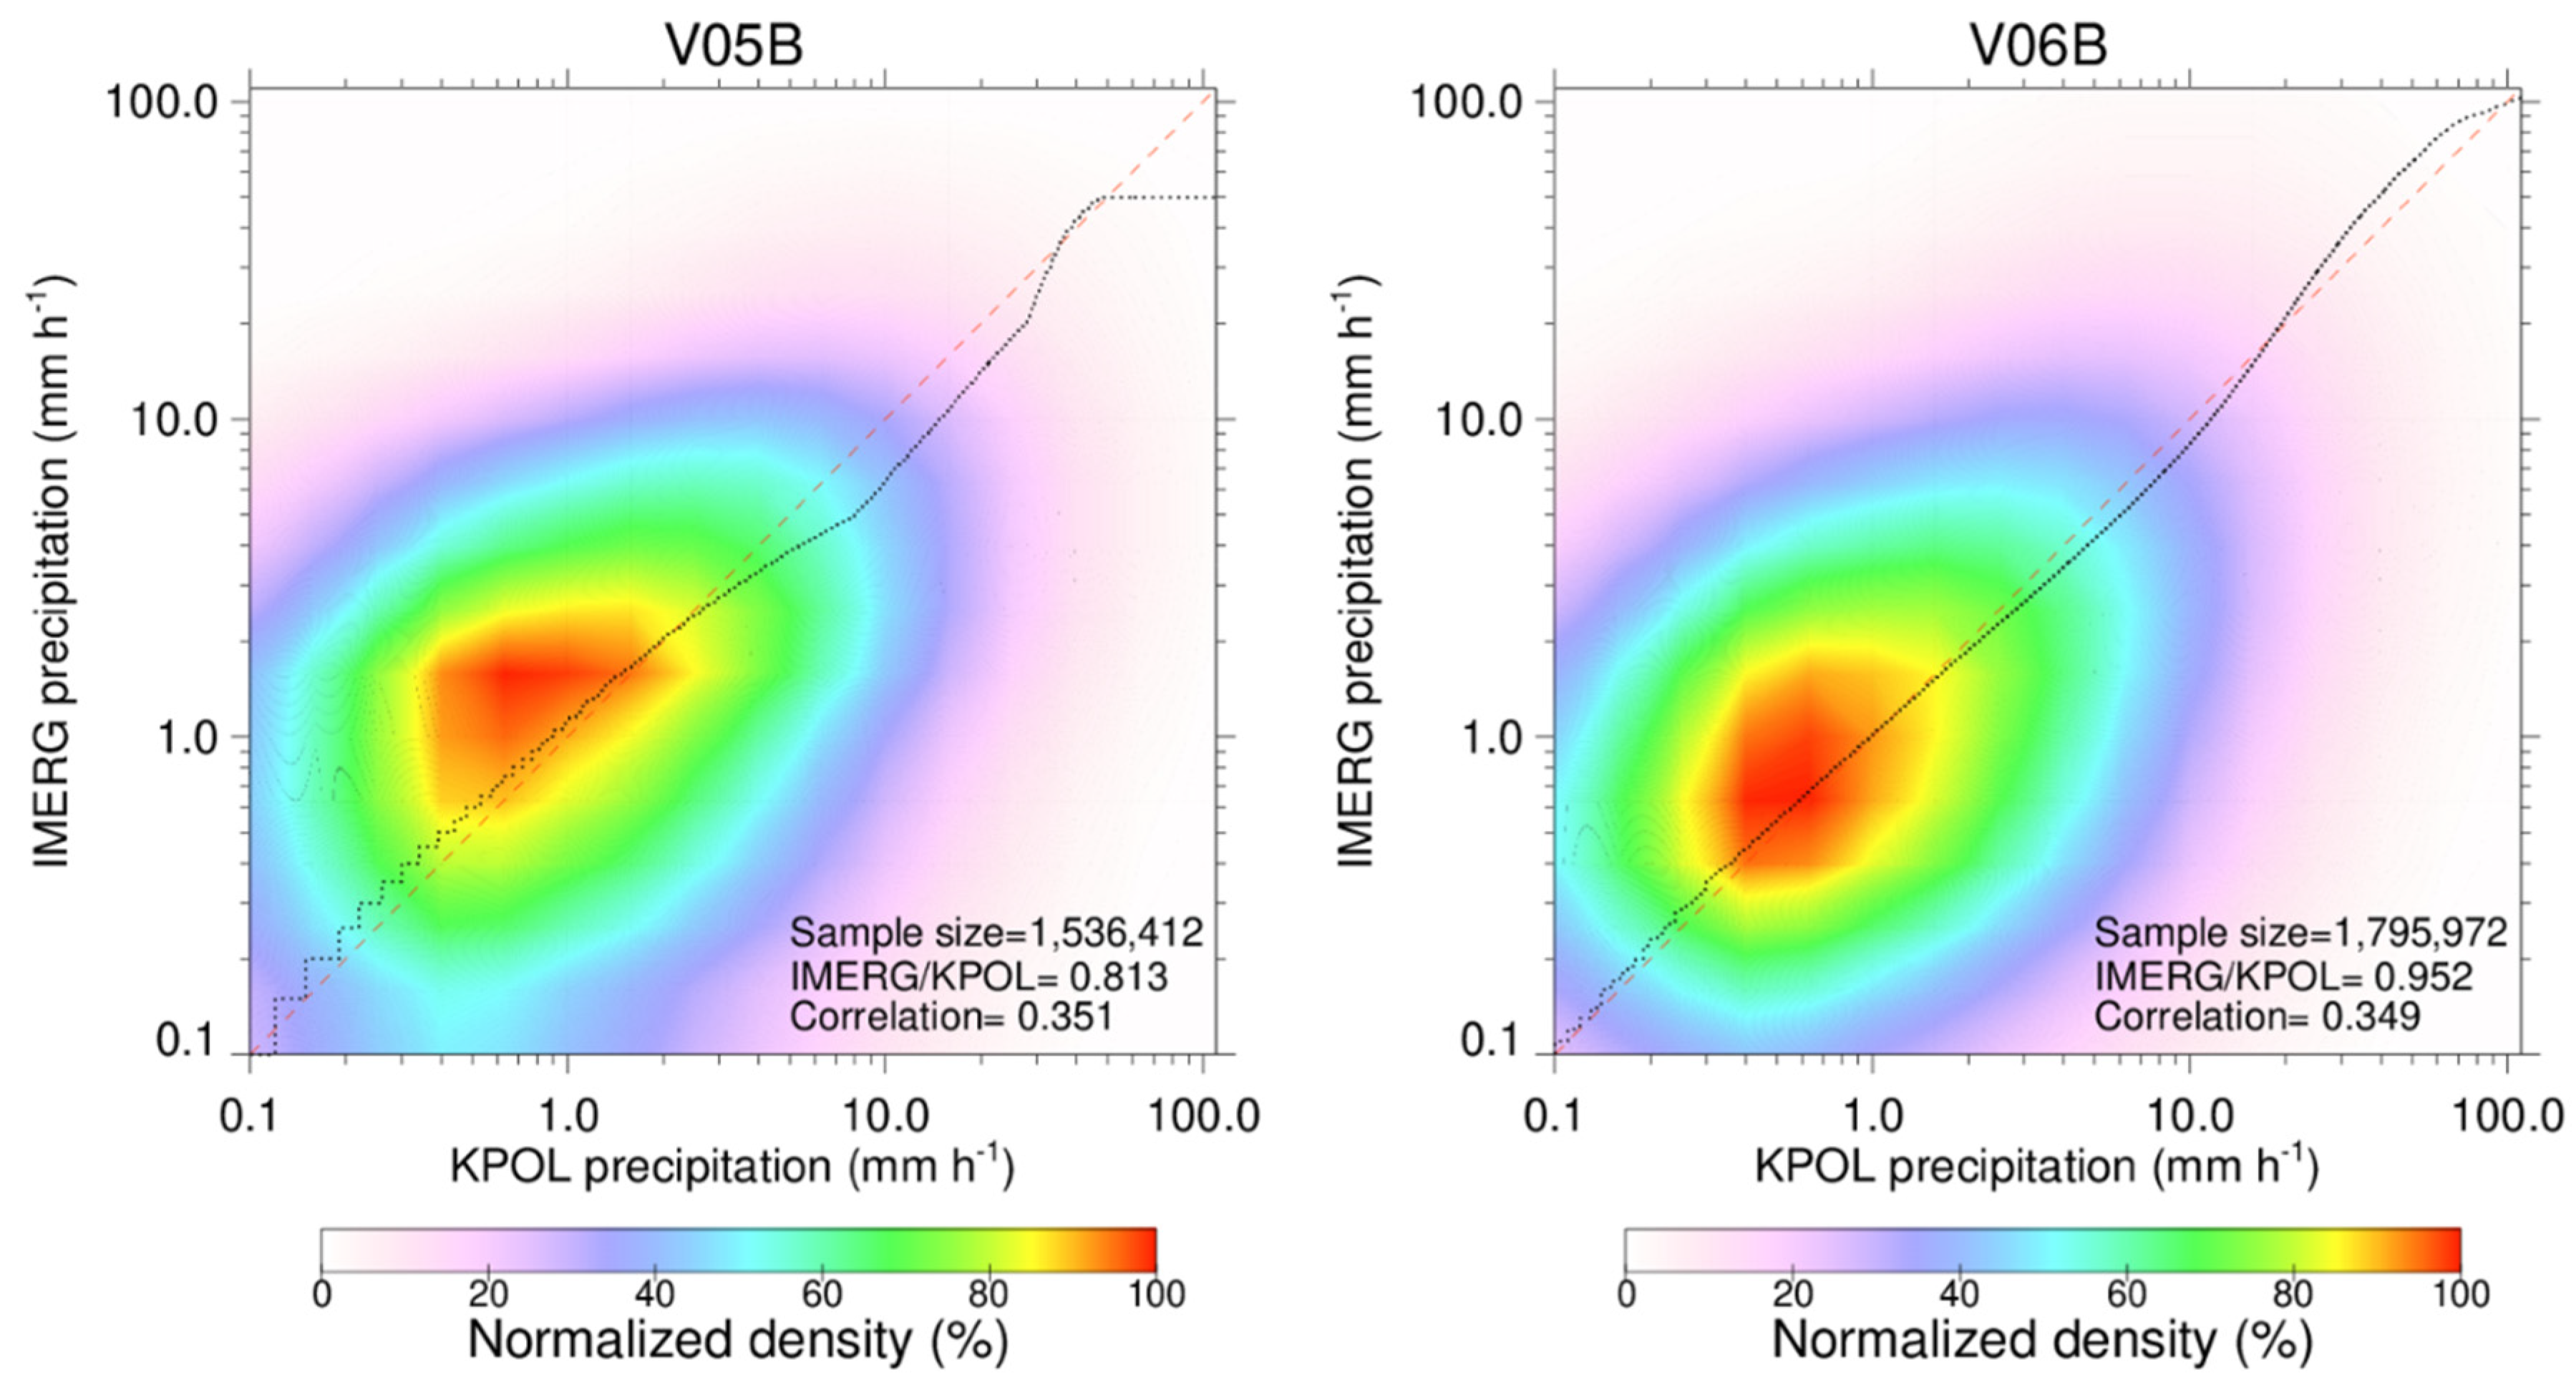
Both IMERG V05B and V06B display a general pattern similar to KPOL with decreasing precipitation from south to north. Precipitation contours for IMERG V05B and V06B are smoother than those for KPOL because of the challenges in capturing the fine-scale features by satellite observations. Precipitation rates from both IMERG V05B and V06B are underestimated, but the underestimation from V06B is much reduced. IMERG V06 displays an obvious improvement with reduced systematic bias and increased precipitation detectability in comparison with V05B.
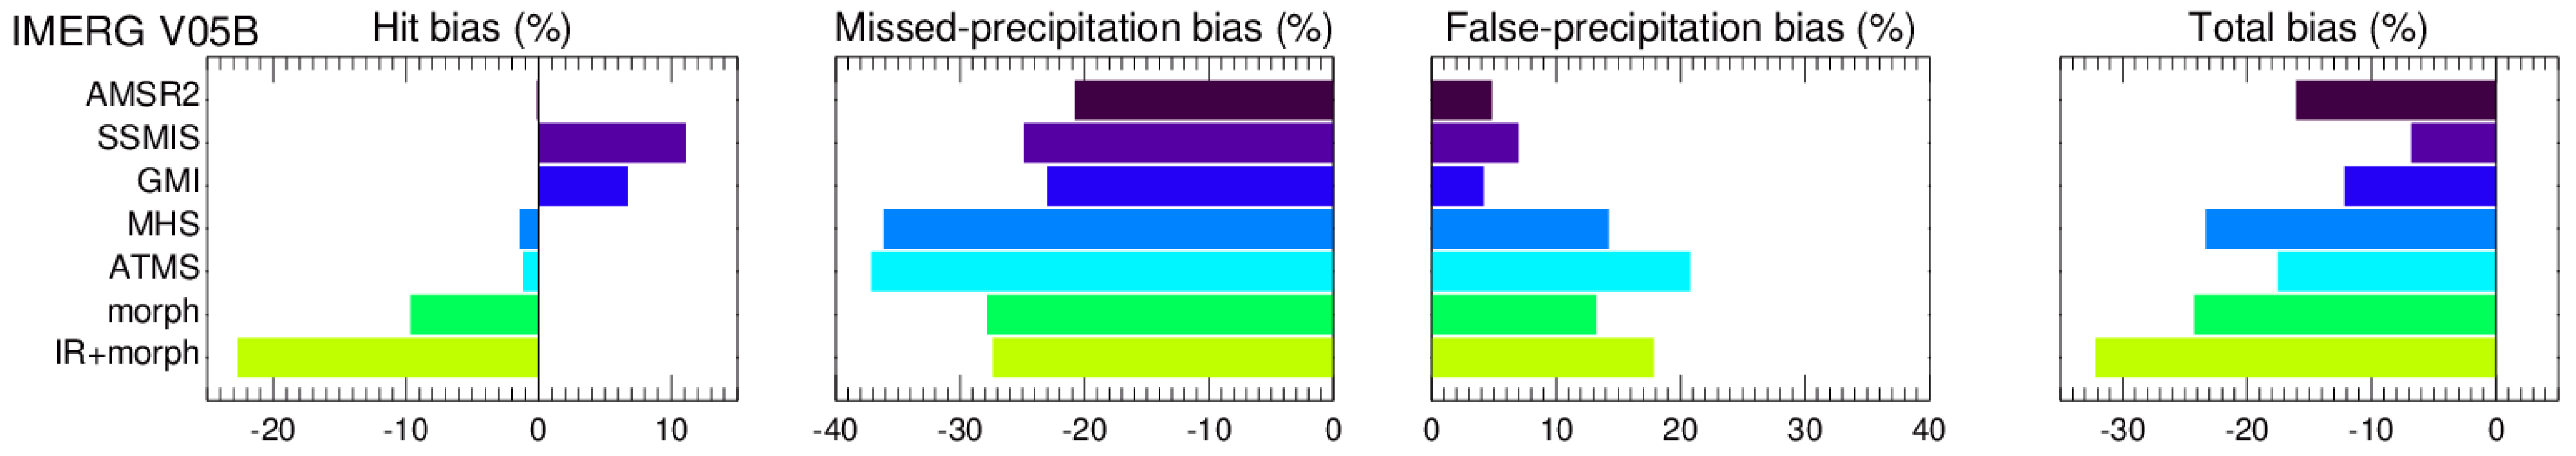
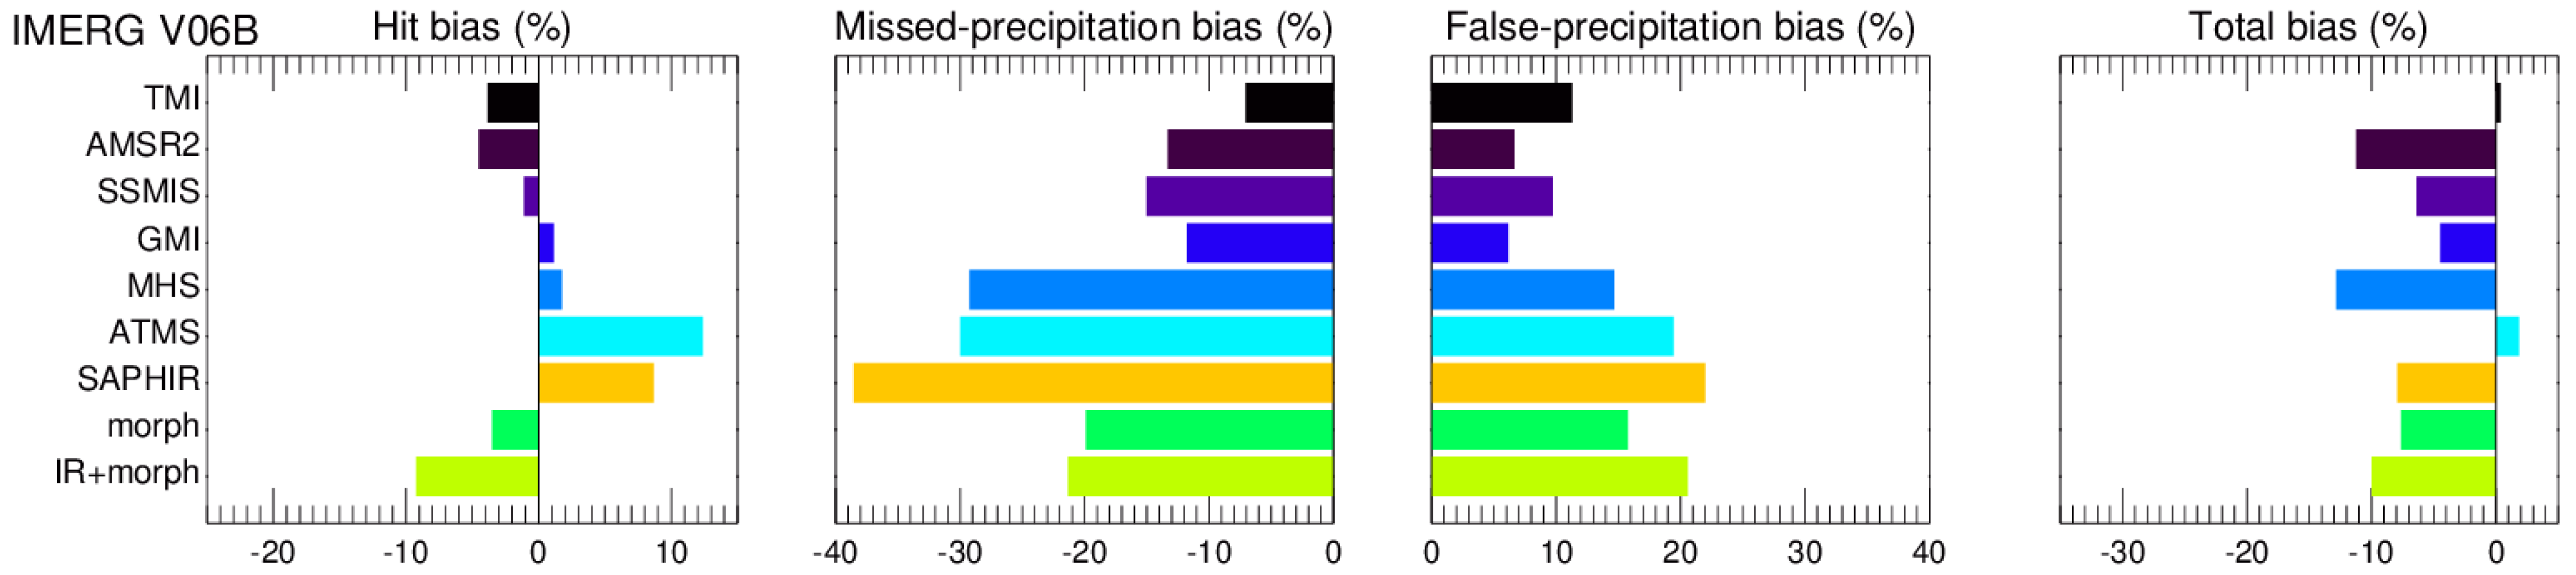
(2)
The overall underestimation in V05B is mainly driven by the negative relative biases of morphing-based algorithms (IR + morph and morph-only) which are largely corrected in V06B.
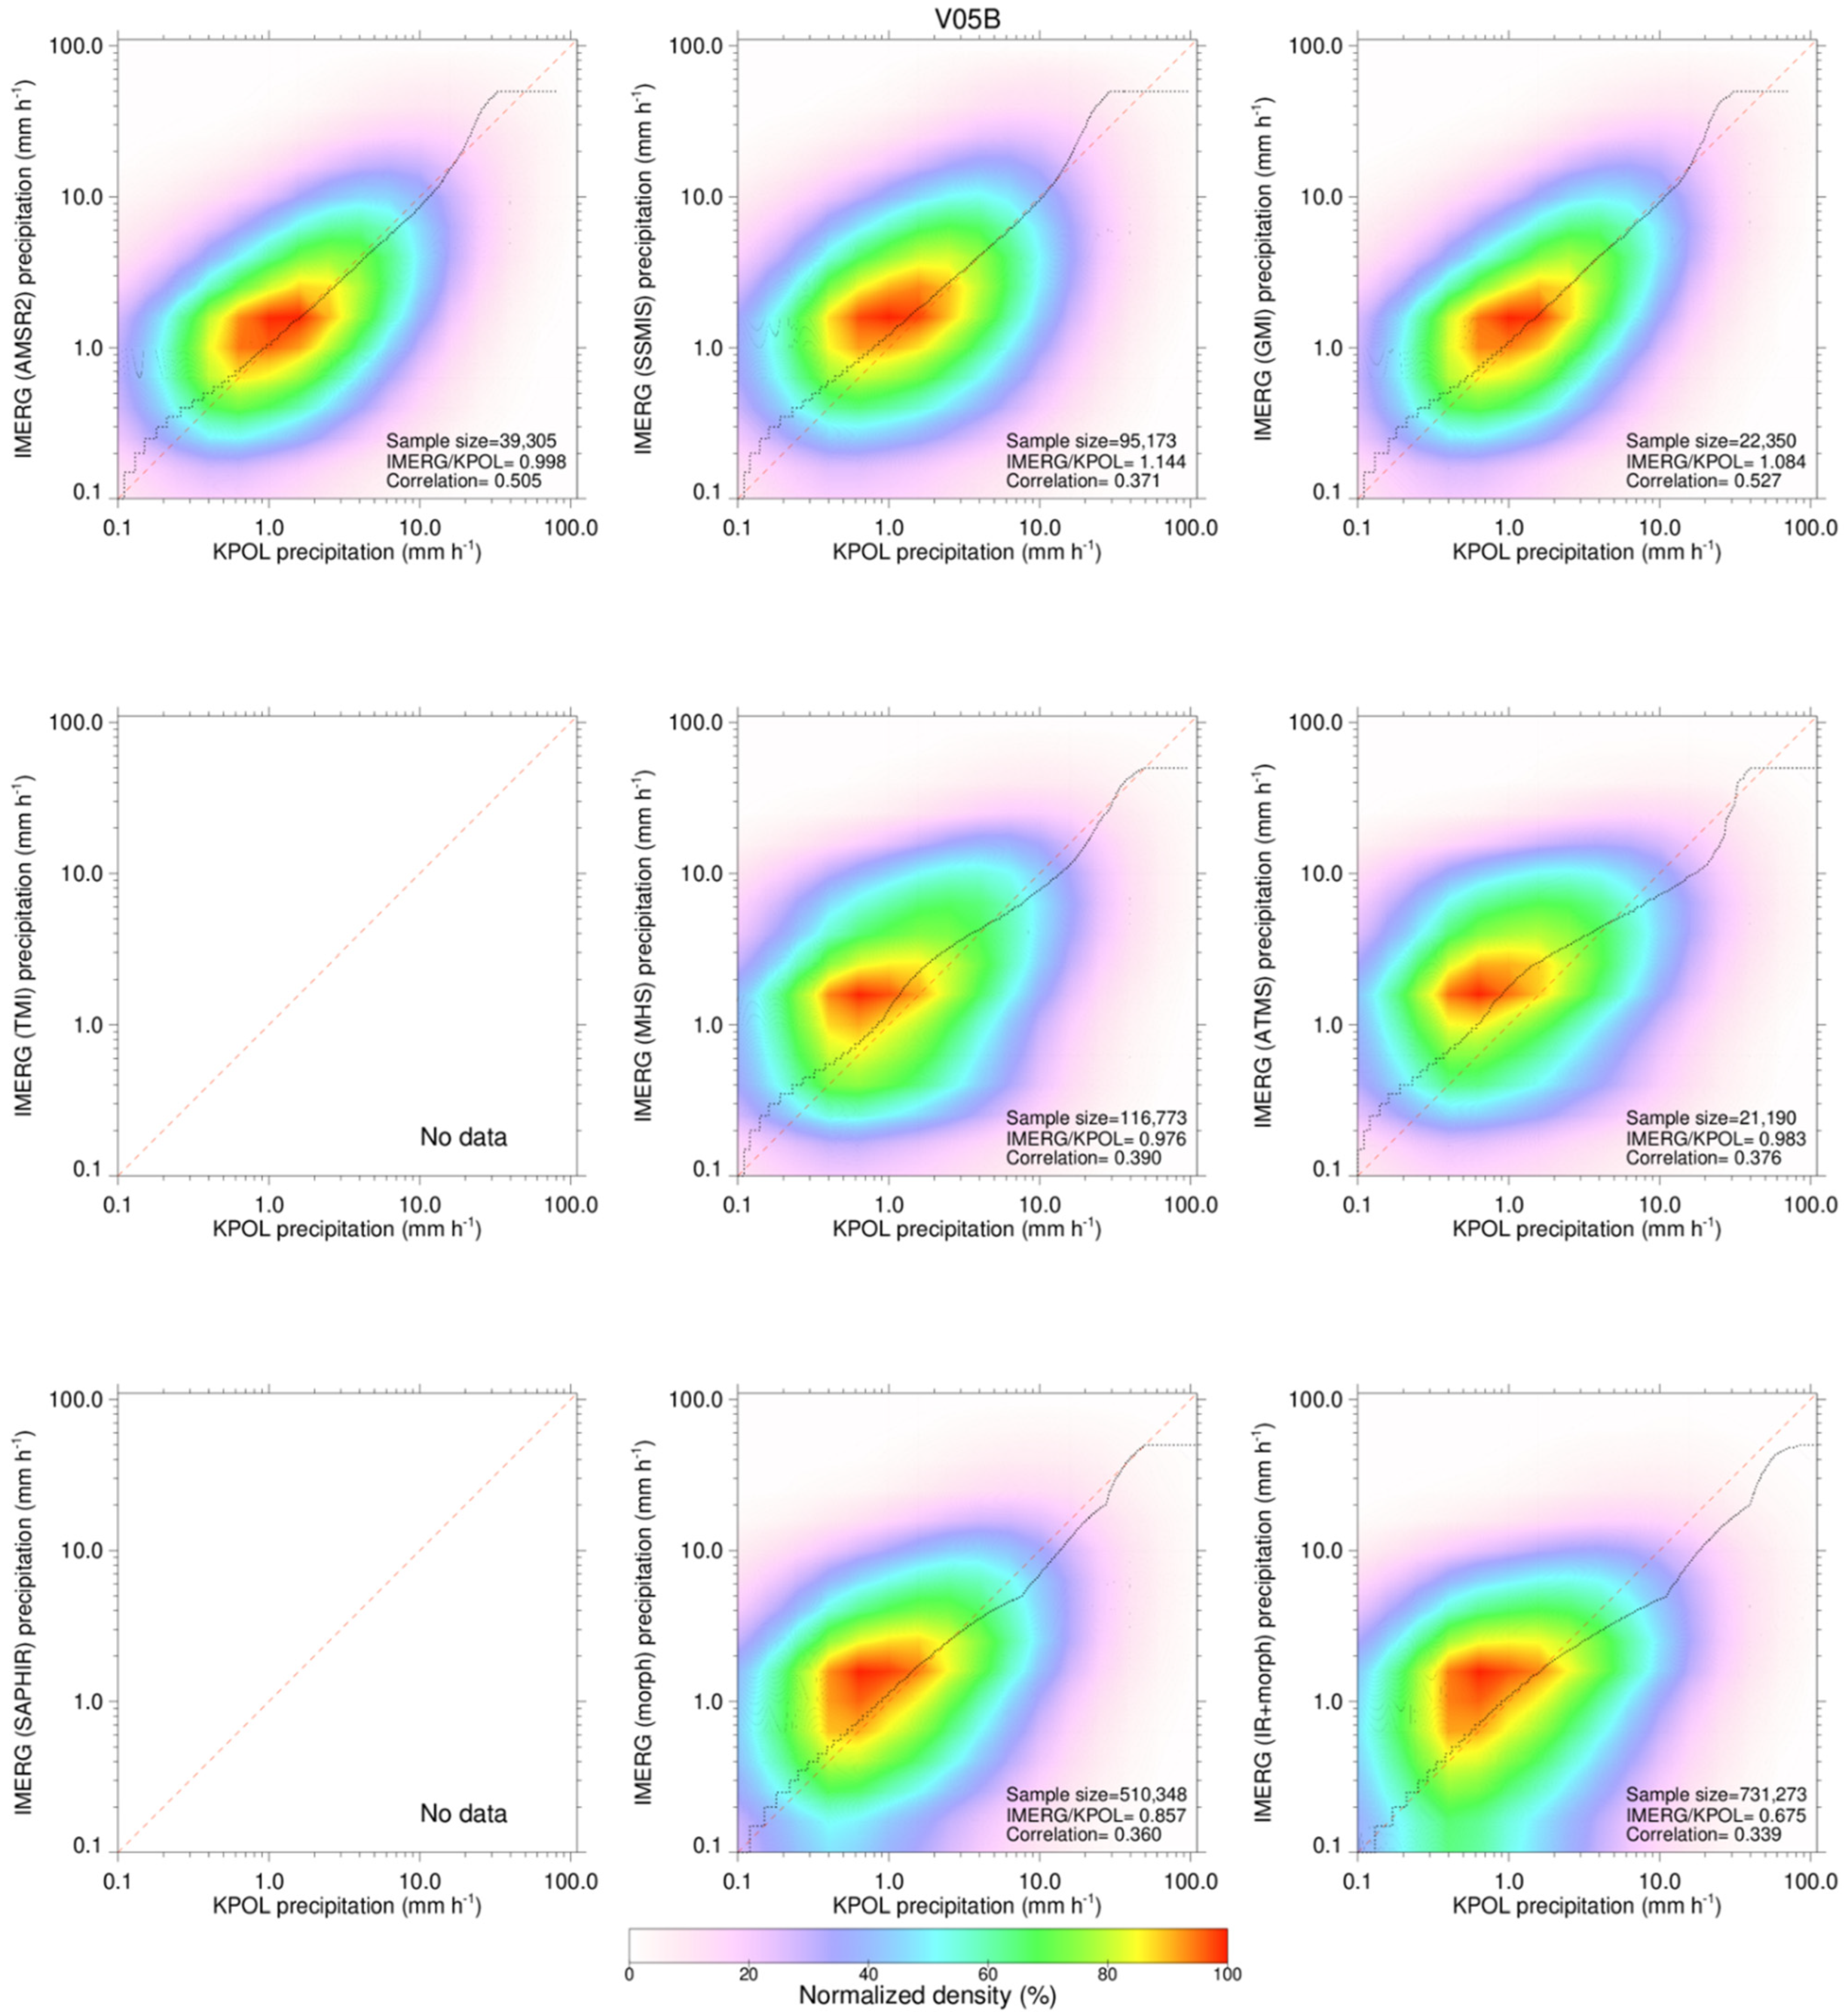
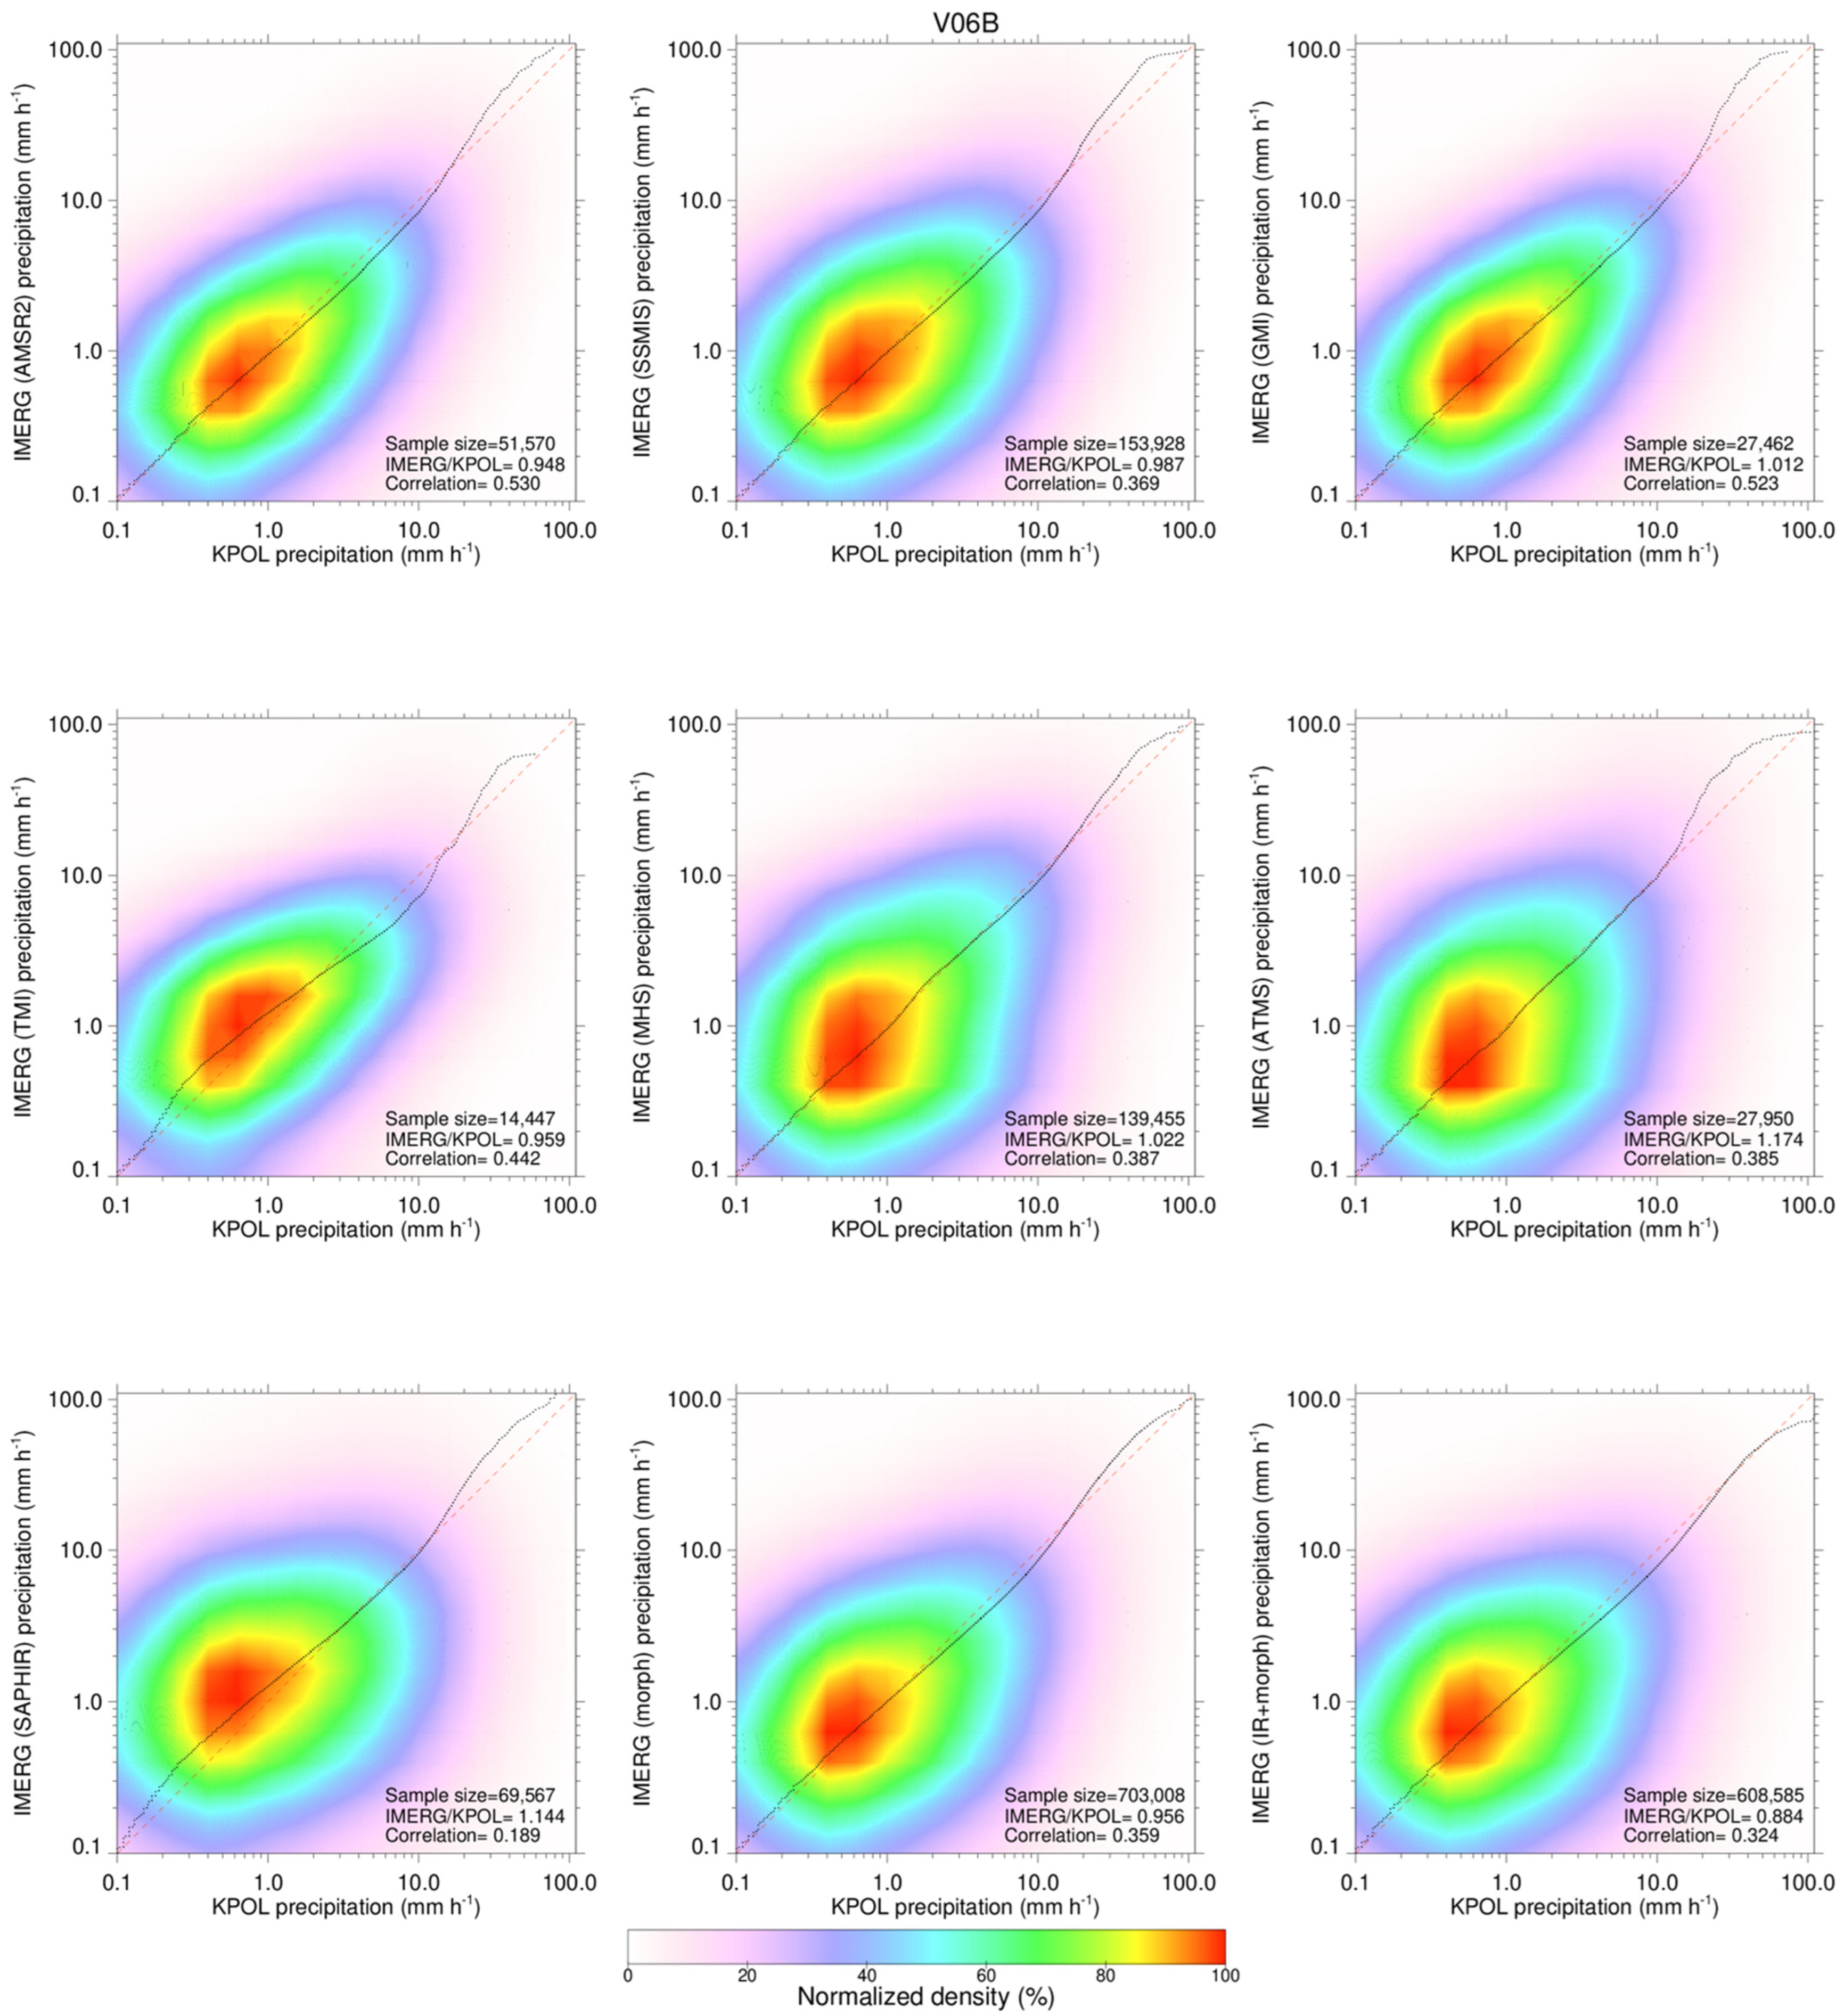
(3)
Imagers generally perform better than sounder because of the availability of lower frequency channels. Among imagers, GMI and AMSR2 are the best, followed by SSMIS. Among sounders, MHS is the best, followed by ATMS and SAPHIR. Among all categories, morph-only and IR + morph only perform better than SAPHIR. SAPHIR shows the worst performance among all categories in terms of almost all metrics because SAPHIR has only 183.3 GHz channels.

Author Contributions

Conceptualization, J.W., D.B.W., J.T. and G.J.H.; methodology, J.W., D.B.W. and J.T.; software, J.W., D.A.M. and J.L.P.; validation, J.W., G.J.H., D.B.W., J.T., D.A.M. and J.L.P.; formal analysis, J.W.; investigation, J.W., J.T., D.B.W., D.A.M. and J.L.P.; resources, D.B.W. and G.J.H.; data curation, J.W., D.A.M. and J.L.P.; writing—original draft preparation, J.W.; writing—review and editing, J.W., J.T., G.J.H., D.B.W., D.A.M. and J.L.P.; visualization, J.W.; supervision, G.J.H., D.B.W. and D.A.M.; project administration, G.J.H. and D.B.W.; funding acquisition, G.J.H. and D.B.W. All authors have read and agreed to the published version of the manuscript.

Funding

This research was supported by GPM Ground Validation (D.M., J.P., D.W., J.W.), GPM Algorithm ISFM (G.H., J.T.), and GPM Data Analysis (J.T.) funding.

Data Availability Statement

The IMERG V06B are available from the NASA Goddard Earth Sciences Data and Information Services Center at https://gpm1.gesdisc.eosdis.nasa.gov/data/GPM_L3/GPM_3IMERGHH.06/ (accessed on 29 June 2022). The KPOL precipitation dataset is a product of NASA’s Precipitation Measurement Missions (TRMM and GPM), and can be accessed from https://trmm-fc.gsfc.nasa.gov/ftp/pub/Wallops_PRF/KPOL/gridded/ (accessed on 29 June 2022).

Acknowledgments

We are grateful to personnel at NASA/GSFC Precipitation Processing Systems led by Erich Stocker, for the provision of IMERG products.

Conflicts of Interest

The authors declare no conflict of interest.

References

  1. Trenberth, K.E.; Smith, L.; Qian, T.; Dai, A.; Fasullo, J. Estimates of the global water budget and its annual cycle using observational and model data. J. Hydrometeorol. 2007, 8, 758–769. [Google Scholar] [CrossRef]
  2. Huffman, G.J.; Bolvin, D.T.; Nelkin, E.J.; Stocker, E.F.; Tan, J. V05 IMERG Release Notes; NASA: Washington, DC, USA, 2017; 8p. Available online: https://gpm.nasa.gov/sites/default/files/document_files/IMERG_FinalRun_V05_release_notes-rev3.pdf (accessed on 29 June 2022).
  3. Huffman, G.J.; Bolvin, D.T.; Braithwaite, D.; Hsu, K.; Joyce, R.; Kidd, C.; Nelkin, E.J.; Sorooshian, S.; Tan, J.; Xie, P. NASA Global Precipitation Measurement (GPM) Integrated Multi-satellitE Retrievals for GPM (IMERG). Algorithm Theoretical Basis Document Version 6; NASA: Washington, DC, USA, 2020; 35p. Available online: https://gpm.nasa.gov/sites/default/files/2020-05/IMERG_ATBD_V06.3.pdf (accessed on 29 June 2022).
  4. Huffman, G.J.; Bolvin, D.T.; Nelkin, E.J.; Stocker, E.F.; Tan, J. V06 IMERG Release Notes; NASA: Washington, DC, USA, 2020; 15p. Available online: https://gpm.nasa.gov/sites/default/files/2020-10/IMERG_V06_release_notes_201006_0.pdf (accessed on 29 June 2022).
  5. Petersen, W.A.; Kirstetter, P.E.; Wang, J.; Wolff, D.B.; Tokay, A. The GPM Ground Validation Program. In Satellite Precipitation Measurement; Levizzani, V., Kidd, C., Kirschbaum, D.B., Kummerow, C., Nakamura, K., Turk, F.J., Eds.; Springer-Nature: Cham, Switzerland, 2020. [Google Scholar]
  6. Wang, J.; Petersen, W.A.; Wolff, D.B. Validation of Satellite-Based Precipitation Products from TRMM to GPM. Remote Sens. 2021, 13, 1745. [Google Scholar] [CrossRef]
  7. Prakash, S.; Ramesh Kumar, M.R.; Mathew, S.; Venkatesan, R. How accurate are satellite estimates of precipitation over the north Indian Ocean? Theor. Appl. Climatol. 2018, 134, 467–475. [Google Scholar] [CrossRef] [Green Version]
  8. Khan, S.; Maggioni, V. Assessment of Level-3 Gridded Global Precipitation Mission (GPM) Products Over Oceans. Remote Sens. 2019, 11, 255. [Google Scholar] [CrossRef] [Green Version]
  9. Wu, Q.; Wang, Y. Comparison of oceanic multisatellite precipitation data from tropical rainfall measurement mission and global precipitation measurement mission datasets with rain gauge data from ocean buoys. J. Atmos. Ocean. Technol. 2019, 36, 903–920. [Google Scholar] [CrossRef]
  10. Bolvin, D.; Huffman, G.; Nelkin, E.; Tan, J. Comparison of Monthly IMERG Precipitation Estimates with PACRAIN Atoll Observations. J. Hydrometeorol. 2021, 22, 1745–1753. [Google Scholar] [CrossRef]
  11. Derin, Y.; Kirstetter, P.-E.; Gourley, J.J. Evaluation of IMERG satellite precipitation over the land–coast–ocean continuum. Part I: Detection. J. Hydrometeorol. 2021, 22, 2843–2859. [Google Scholar] [CrossRef]
  12. Derin, Y.; Kirstetter, P.-E.; Brauer, N.; Gourley, J.J.; Wang, J. Evaluation of IMERG satellite precipitation over the land–coast–ocean continuum. Part II: Quantification. J. Hydrometeorol. 2022. accepted. [Google Scholar] [CrossRef]
  13. Wolff, D.B.; Marks, D.A.; Amitai, E.; Silberstein, D.S.; Fisher, B.L.; Tokay, A.; Wang, J.; Pippitt, J.L. Ground Validation for the Tropical Rainfall Measuring Mission (TRMM). J. Atmos. Ocean. Technol. 2005, 22, 365–380. [Google Scholar] [CrossRef]
  14. Schumacher, C.; Houze, R.A. Comparison of radar data from TRMM satellite and Kwajalein oceanic validation site. J. Appl. Meteorol. 2000, 39, 2151–2164. [Google Scholar] [CrossRef] [Green Version]
  15. Marks, D.A.; Wolff, D.B.; Carey, L.B.; Tokay, A. Quality control and calibration of the dual-polarization radar at Kwajalein, RMI. J. Atmos. Ocean. Technol. 2011, 28, 181–196. [Google Scholar] [CrossRef]
  16. Ryzhkov, A.V.; Giangrande, S.E.; Melnikov, V.M.; Schuur, T.J. Calibration issues of dual-polarization radar measurements. J. Atmos. Ocean. Technol. 2005, 22, 1138–1154. [Google Scholar] [CrossRef] [Green Version]
  17. Zrnić, D.S.; Melnikov, V.M.; Carter, J.K. Calibrating Differential Reflectivity on the WSR-88D. J. Atmos. Ocean. Technol. 2006, 23, 944–951. [Google Scholar] [CrossRef] [Green Version]
  18. Silberstein, D.S.; Wolff, D.B.; Marks, D.A.; Atlas, D.; Pippitt, J.L. Ground Clutter as a Monitor of Radar Stability at Kwajalein, RMI. J. Atmos. Ocean. Technol. 2007, 25, 2037–2045. [Google Scholar] [CrossRef]
  19. Marks, D.A.; Wolff, D.B.; Silberstein, D.D.; Tokay, A.; Pippitt, J.L.; Wang, J. Availability of High Quality TRMM Ground Validation Data at Kwajalein, RMI: A Practical Application of the Relative Calibration Adjustment Technique. J. Atmos. Ocean. Technol. 2009, 26, 413–429. [Google Scholar] [CrossRef]
  20. Wolff, D.B.; Marks, D.A.; Petersen, W.A. General Application of the Relative Calibration Adjustment (RCA) Technique for Monitoring and Correcting Radar Reflectivity Calibration. J. Atmos. Ocean. Technol. 2015, 32, 496–506. [Google Scholar] [CrossRef]
  21. Cifelli, R.; Chandrasekar, V.; Lim, S.; Kennedy, P.C.; Wang, Y.; Rutledge, S.A. A new dual-polarization radar rainfall algorithm: Application in Colorado precipitation events. J. Atmos. Ocean. Technol. 2011, 28, 352–364. [Google Scholar] [CrossRef] [Green Version]
  22. Barnes, S. A Technique for Maximizing Details in Numerical Weather Map Analysis. J. Appl. Meteorol. Climatol. 1964, 3, 396–409. [Google Scholar] [CrossRef] [Green Version]
  23. Helmus, J.J.; Collis, S.M. The Python ARM Radar Toolkit (Py-ART), a Library for Working with Weather Radar Data in the Python Programming Language. J. Open Res. Softw. 2016, 4, e25. [Google Scholar] [CrossRef] [Green Version]
  24. Joyce, R.J.; Xie, P. Kalman Filter–Based CMORPH. J. Hydrometeorol. 2011, 12, 1547–1563. [Google Scholar] [CrossRef]
  25. Hong, Y.; Hsu, K.-L.; Sorooshian, S.; Gao, X. Precipitation Estimation from Remotely Sensed Imagery Using an Artificial Neural Network Cloud Classification System. J. Appl. Meteorol. 2004, 43, 1834–1853. [Google Scholar] [CrossRef] [Green Version]
  26. Huffman, G.J.; Bolvin, D.T.; Nelkin, E.J.; Wolff, D.B.; Adler, R.F.; Gu, G.; Hong, Y.; Bowman, K.P.; Stocker, E.F. The TRMM Multisatellite Precipitation Analysis (TMPA): Quasi-Global, Multiyear, Combined-Sensor Precipitation Estimates at Fine Scales. J. Hydrometeorol. 2007, 8, 38–55. [Google Scholar] [CrossRef]
  27. Kidd, C. NASA Global Precipitation Measurement (GPM) Precipitation Retrieval and Profiling Scheme (PRPS). Algorithm Theoretical Basis Doc., Version 01-02; NASA: Washington, DC, USA, 2018; 17p. Available online: https://pps.gsfc.nasa.gov/Documents/20180203_SAPHIR-ATBD.pdf (accessed on 29 June 2022).
  28. Tan, J.; Petersen, W.A.; Tokay, A. A Novel Approach to Identify Sources of Errors in IMERG for GPM Ground Validation. J. Hydrometeorol. 2016, 17, 2477–2491. [Google Scholar] [CrossRef]
  29. Wilks, D.S. Statistical Methods in the Atmospheric Sciences, 3rd ed.; International Geophysics Series; Academic Press: Waltham, MA, USA, 2011; Volume 100, p. 704. [Google Scholar]
  30. Tian, Y.; Peters-Lidard, C.D.; Eylander, J.B.; Joyce, R.J.; Huffman, G.J.; Adler, R.F.; Hsu, K.-L.; Turk, F.J.; Garcia, M.; Zeng, J. Component analysis of errors in satellite-based precipitation estimates. J. Geophys. Res. 2009, 114, D24101. [Google Scholar] [CrossRef] [Green Version]
  31. Habib, E.; Larson, B.F.; Graschel, J. Validation of NEXRAD multisensor precipitation estimates using an experimental dense rain gauge network in south Louisiana. J. Hydrol. 2009, 373, 463–478. [Google Scholar] [CrossRef]
  32. You, Y.; Petkovic, V.; Tan, J.; Kroodsma, R.; Berg, W.; Kidd, C.; Peters Lidard, C. Evaluation of V05 precipitation estimates from GPM constellation radiometers using KuPR as the reference. J. Hydrometeorol. 2020, 21, 705–728. [Google Scholar] [CrossRef]
  33. Kidd, C.; Tan, J.; Kirstetter, P.-E.; Petersen, W.A. Validation of the Version 05 Level 2 precipitation products from the GPM Core Observatory and constellation satellite sensors. Q. J. R. Meteorol. Soc. 2018, 144, 313–328. [Google Scholar] [CrossRef] [Green Version]
  34. Sui, X.; Li, Z.; Ma, Z.; Xu, J.; Zhu, S.; Liu, H. Ground Validation and Error Sources Identification for GPM IMERG Product over the Southeast Coastal Regions of China. Remote Sens. 2020, 12, 4154. [Google Scholar] [CrossRef]
  35. Bennartz, R.; Bauer, P. Sensitivity of microwave radiances at 85–183 GHz to precipitating ice particles. Radio Sci. 2003, 38, 8075. [Google Scholar] [CrossRef]
  36. You, Y.; Wang, N.-Y.; Ferraro, R.; Rudlosky, R. Quantifying the snowfall detection performance of the GPM Microwave Imager channels over land. J. Hydrometeorol. 2017, 18, 729–751. [Google Scholar] [CrossRef]
  37. Wang, J.; Fisher, B.L.; Wolff, D.B. Estimating rain rates from tipping-bucket rain gauge measurements. J. Atmos. Ocean. Technol. 2008, 25, 43–56. [Google Scholar] [CrossRef] [Green Version]
Figure 2. Monthly precipitation rates averaged over the 100-km range from the half-hourly precipitation rates at 0.1° resolution from KPOL, IMERG V05B and V06B.
Remotesensing 14 03753 g002
Figure 3. Comparisons of IMERG V05B and V06B with KPOL at 0.1° resolution and various time scales ranging from 30 min to 30 days over the period from April 2014 to June 2018. Number of matched pairs of IMERG V05B (V06B) and KPOL mean precipitation rate (≥0.0 mm h−1) (top). Pearson correlation coefficient between IMERG V05B (V06B) and KPOL mean precipitation rates (middle). Relative bias for mean precipitation rate from IMERG V05B (V06B) with respect to KPOL mean precipitation rates (bottom).
Remotesensing 14 03753 g003
Figure 4. POD, FAR and HSS as functions of the time scale. The precipitation/no-precipitation threshold is set to 0.1 mm h−1.
Remotesensing 14 03753 g004
Figure 5. Statistical metrics for each source in IMERG V05B. (Top): Pearson correlation coefficient (correlation), relative bias (bias), normalized mean absolute error (NMAE), and normalized root mean square error (NRMSE). (Bottom): contingency table with hit (green), miss (aqua), false alarm (blue), and correct negative (black). Probability of detection (POD), False alarm ratio (FAR) and Heike skill score (HSS) are also displayed. The numbers at the right are the numbers of matched samples and their percentages of the total samples with conditions of precipitation rates at least 0.1 mm h−1 (upper panel).
Remotesensing 14 03753 g005
Figure 6. Same as Figure 5 but for IMERG V06B.
Remotesensing 14 03753 g006
Figure 7. Error components for each source of IMERG V05B at 0.5 h and 0.1° resolution.
Remotesensing 14 03753 g007
Figure 8. Same as Figure 7 but for IMERG V06B.
Remotesensing 14 03753 g008
Figure 9. Same as Figure 5 but for IMERG V05B and V06B regardless of sources.
Remotesensing 14 03753 g009
Figure 10. Joint distributions of half-hourly precipitation rates at 0.1° resolution from IMERG V05B against KPOL, conditional on both precipitation rates at least 0.1 mm h−1. The black dotted line denotes the quantile–quantile match-ups, and the diagonal red dashed line indicates 1:1 correspondence.
Remotesensing 14 03753 g010
Figure 11. Same as Figure 10 but for IMERG V06B.
Remotesensing 14 03753 g011
Figure 12. Same as Figure 10 but for precipitation rates from IMERG V05B and V06B, respectively, regardless of sources.
Remotesensing 14 03753 g012
Figure 13. Precipitation occurrences from available gauge data over Kwajalein and KPOL for the period from April 2014 to April 2015. Gauge precipitation rates were selected from 10-min prior to KPOL volume scan time, to 10-min after the scan time. The KPOL precipitation average is from the nine 1 km × 1 km horizontal grids surrounding the gauge location. Zero rates are excluded from both gauge and radar averages.
Remotesensing 14 03753 g013
Table 1. KPOL data gaps from April 2014 to June 2018 with length of at least one day.
YearMonth/Day
201404/29–04/30
201507/12, 07/30
201602/29–03/09, 05/19–06/17, 10/28–10/31, 11/05–11/08
201705/24–05/25, 06/16, 07/05–07/10, 08/04–08/06, 09/25, 11/06, 11/23–11/30
201801/12, 06/25, 06/30
Table 2. Sensors included in IMERG V06B over Kwajalein for April 2014–June 2018. Index is the source. Number for each sensor in IMERG ancillary variable HQprecipSource.
IndexSensor AcronymSensor NameSensor TypeSatellite
1TMITRMM Microwave ImagerImagerTRMM
3AMSR2Advanced Microwave Scanning Radiometer Version 2ImagerGCOM-W1
5SSMISSpecial Sensor Microwave Imager/Sounder ImagerDMSP-F16-19
9GMIGPM Microwave ImagerImagerGPM
7MHSMicrowave Humidity SounderSounderNOAA-18,19; MetOp-A, B
11ATMSAdvanced Technology Microwave Sounder SounderSuomi-NPP
20SAPHIRSounder for Atmospheric Profiling of Humidity in the Intertropics by RadiometrySounderMeghaTropiques
Table 3. IMERG ancillary variables and definitions.
Ancillary VariableDescription
precipitationUncalMulti-satellite precipitation estimate without gauge calibration.
HQprecipSource PMW sensor identifier
IRkalmanFilterweight IR-only precipitation weight (%) in the final precipitation estimate
Publisher’s Note: MDPI stays neutral with regard to jurisdictional claims in published maps and institutional affiliations.

