
Subsidence Monitoring and Mechanism Analysis of Anju Airport in Suining Based on InSAR and Numerical Simulation


 , ,
, ,
Abstract
:1. Introduction
2. Study Area and Material
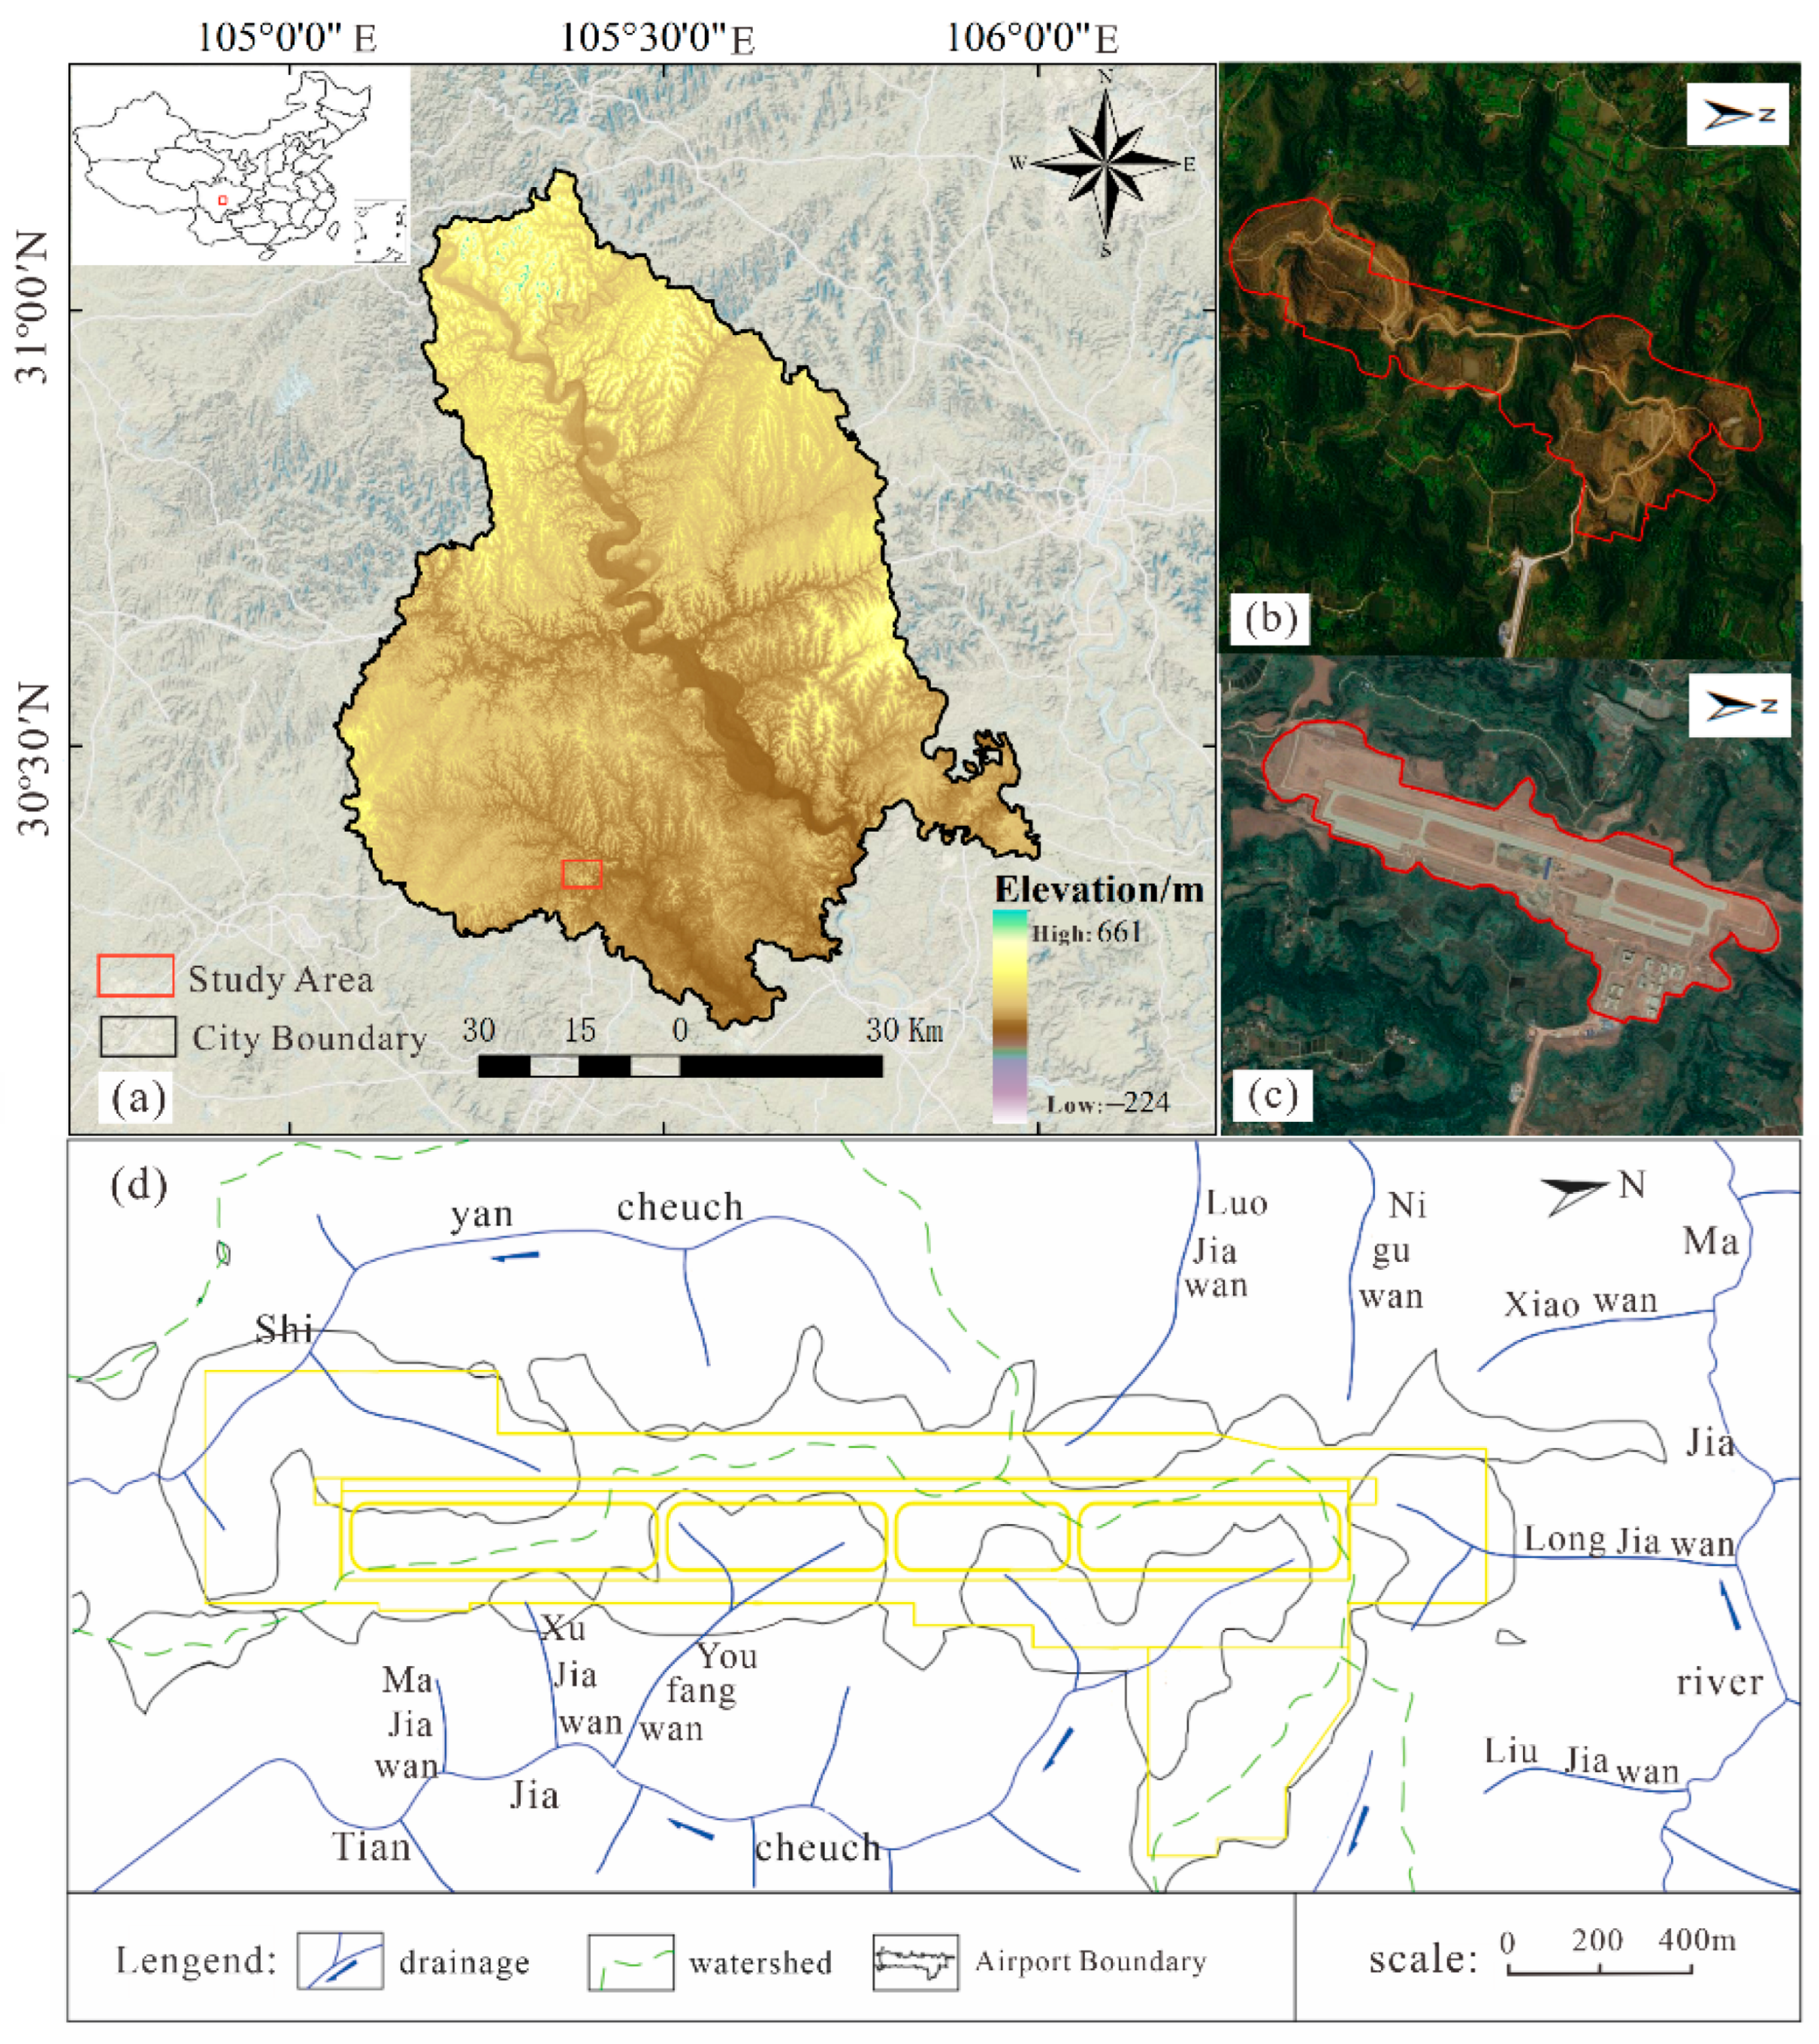
2.1. Study Area
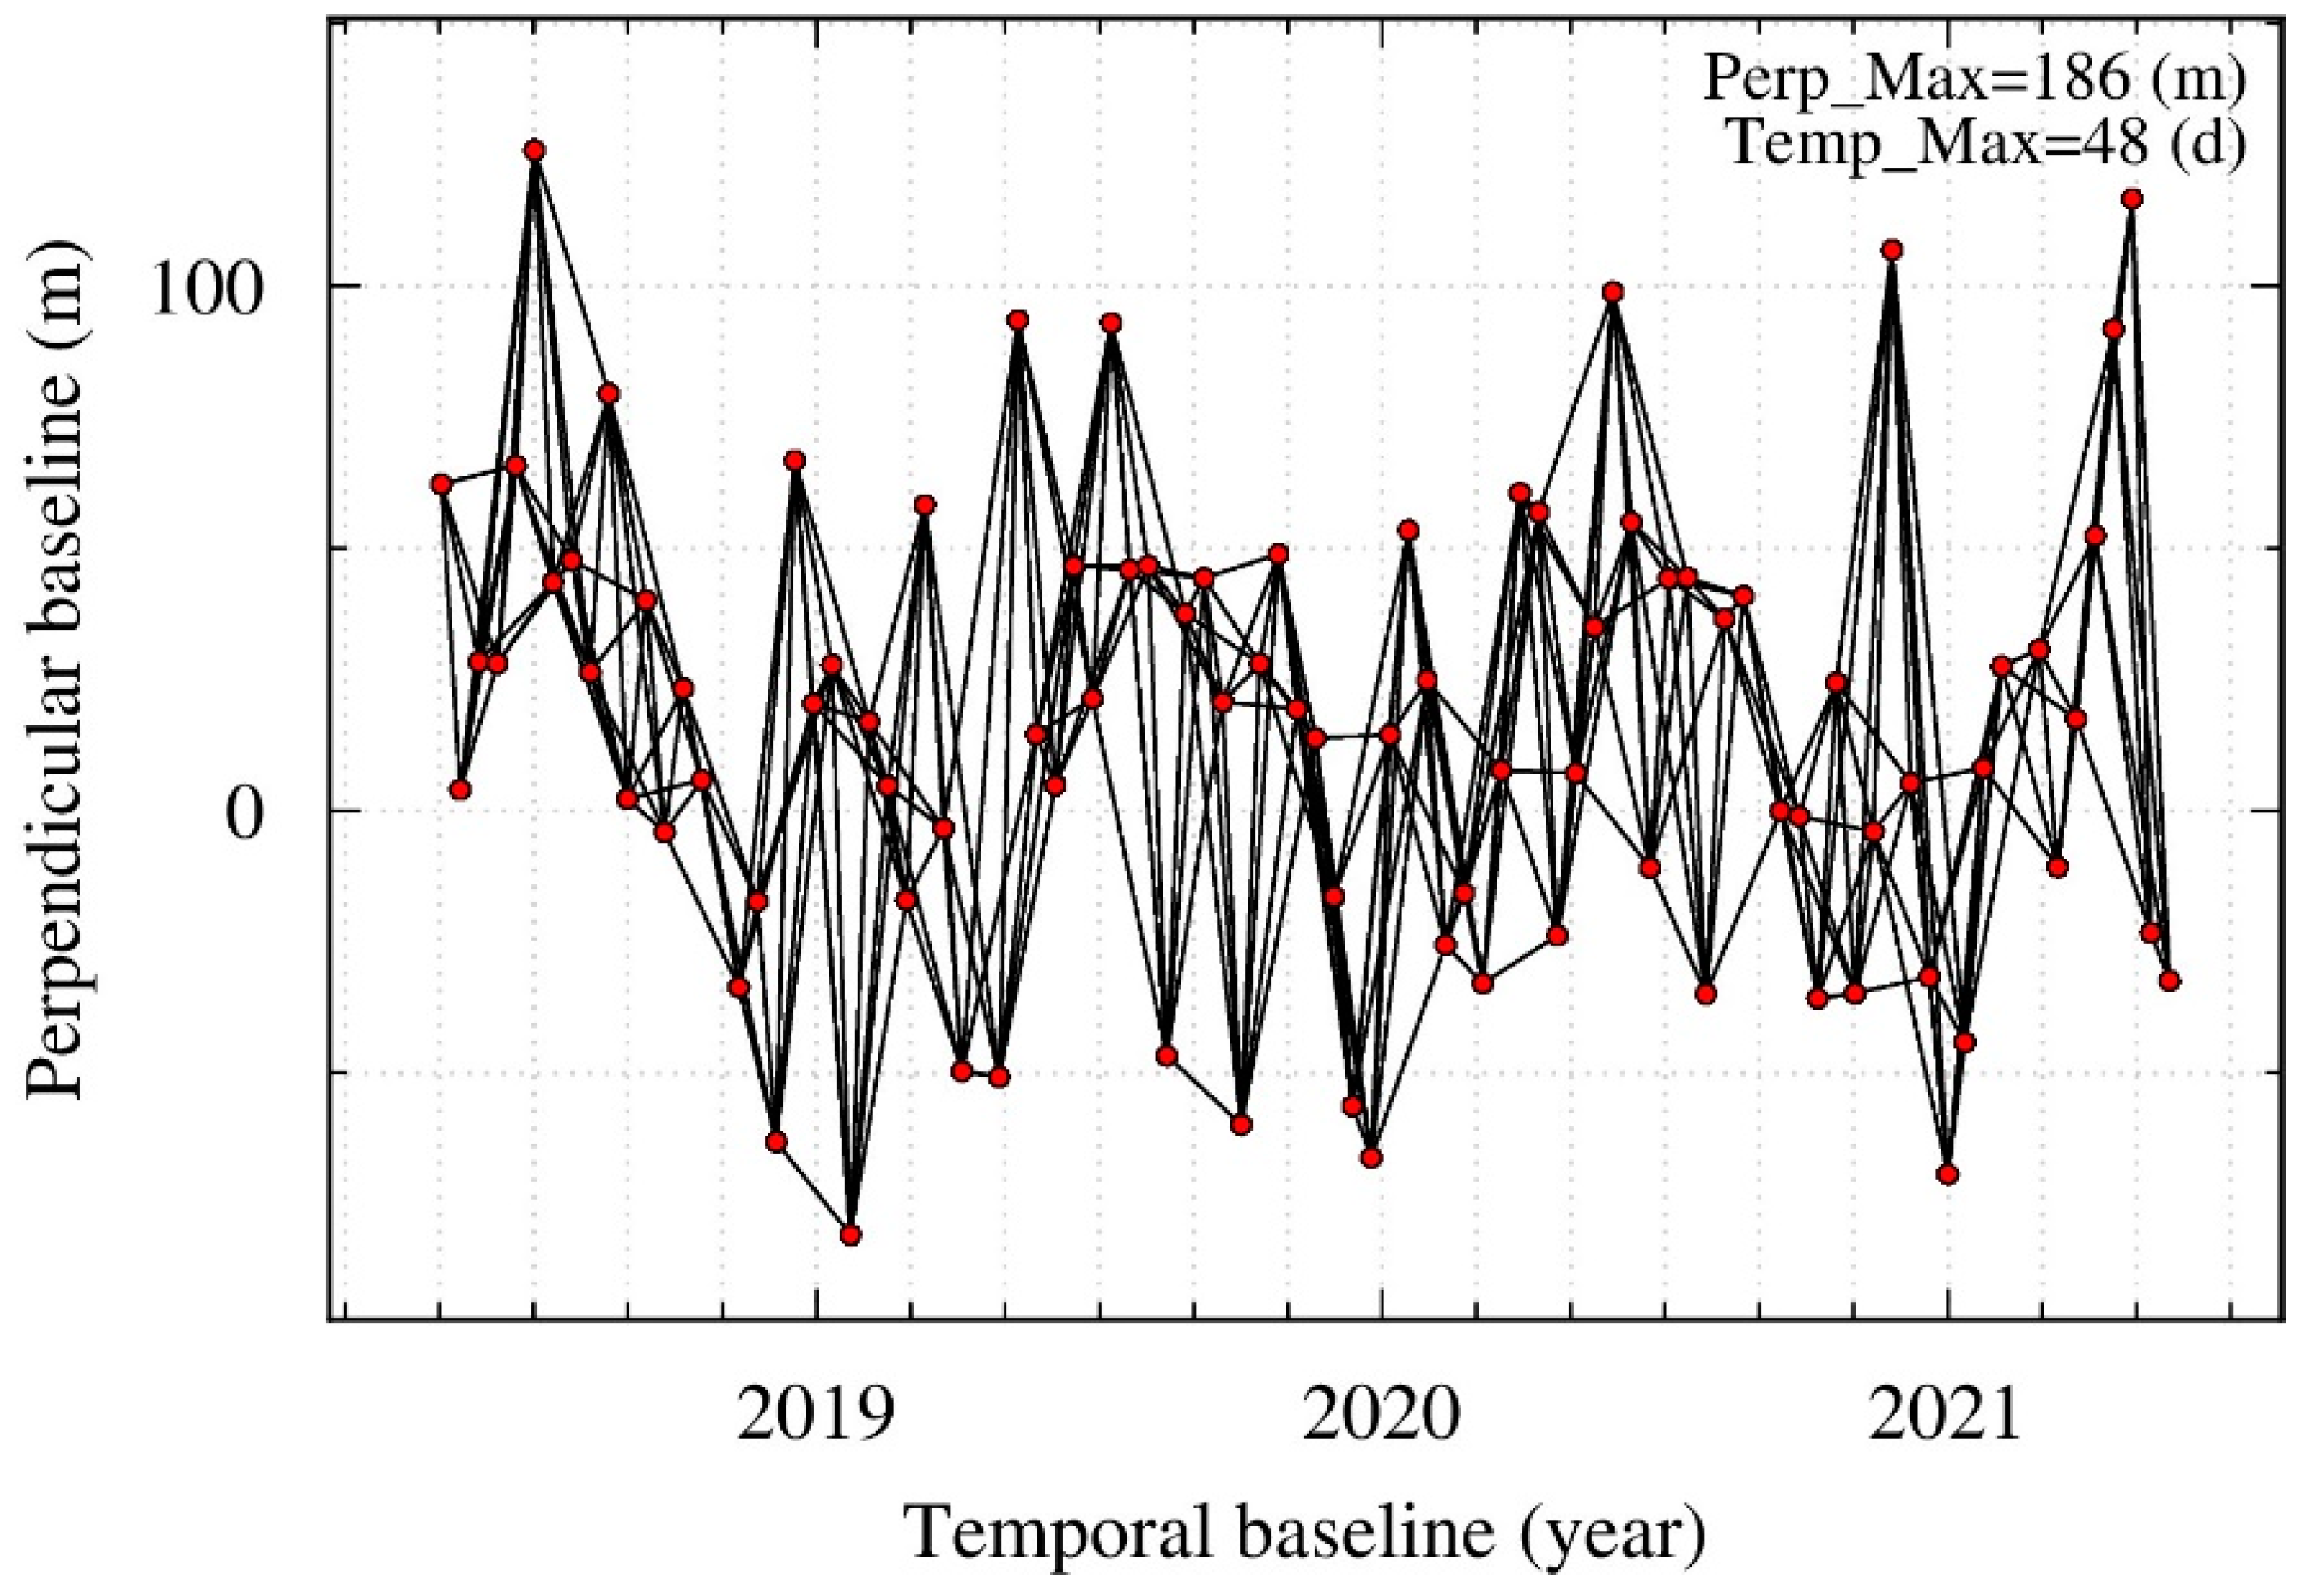
2.2. Data Source
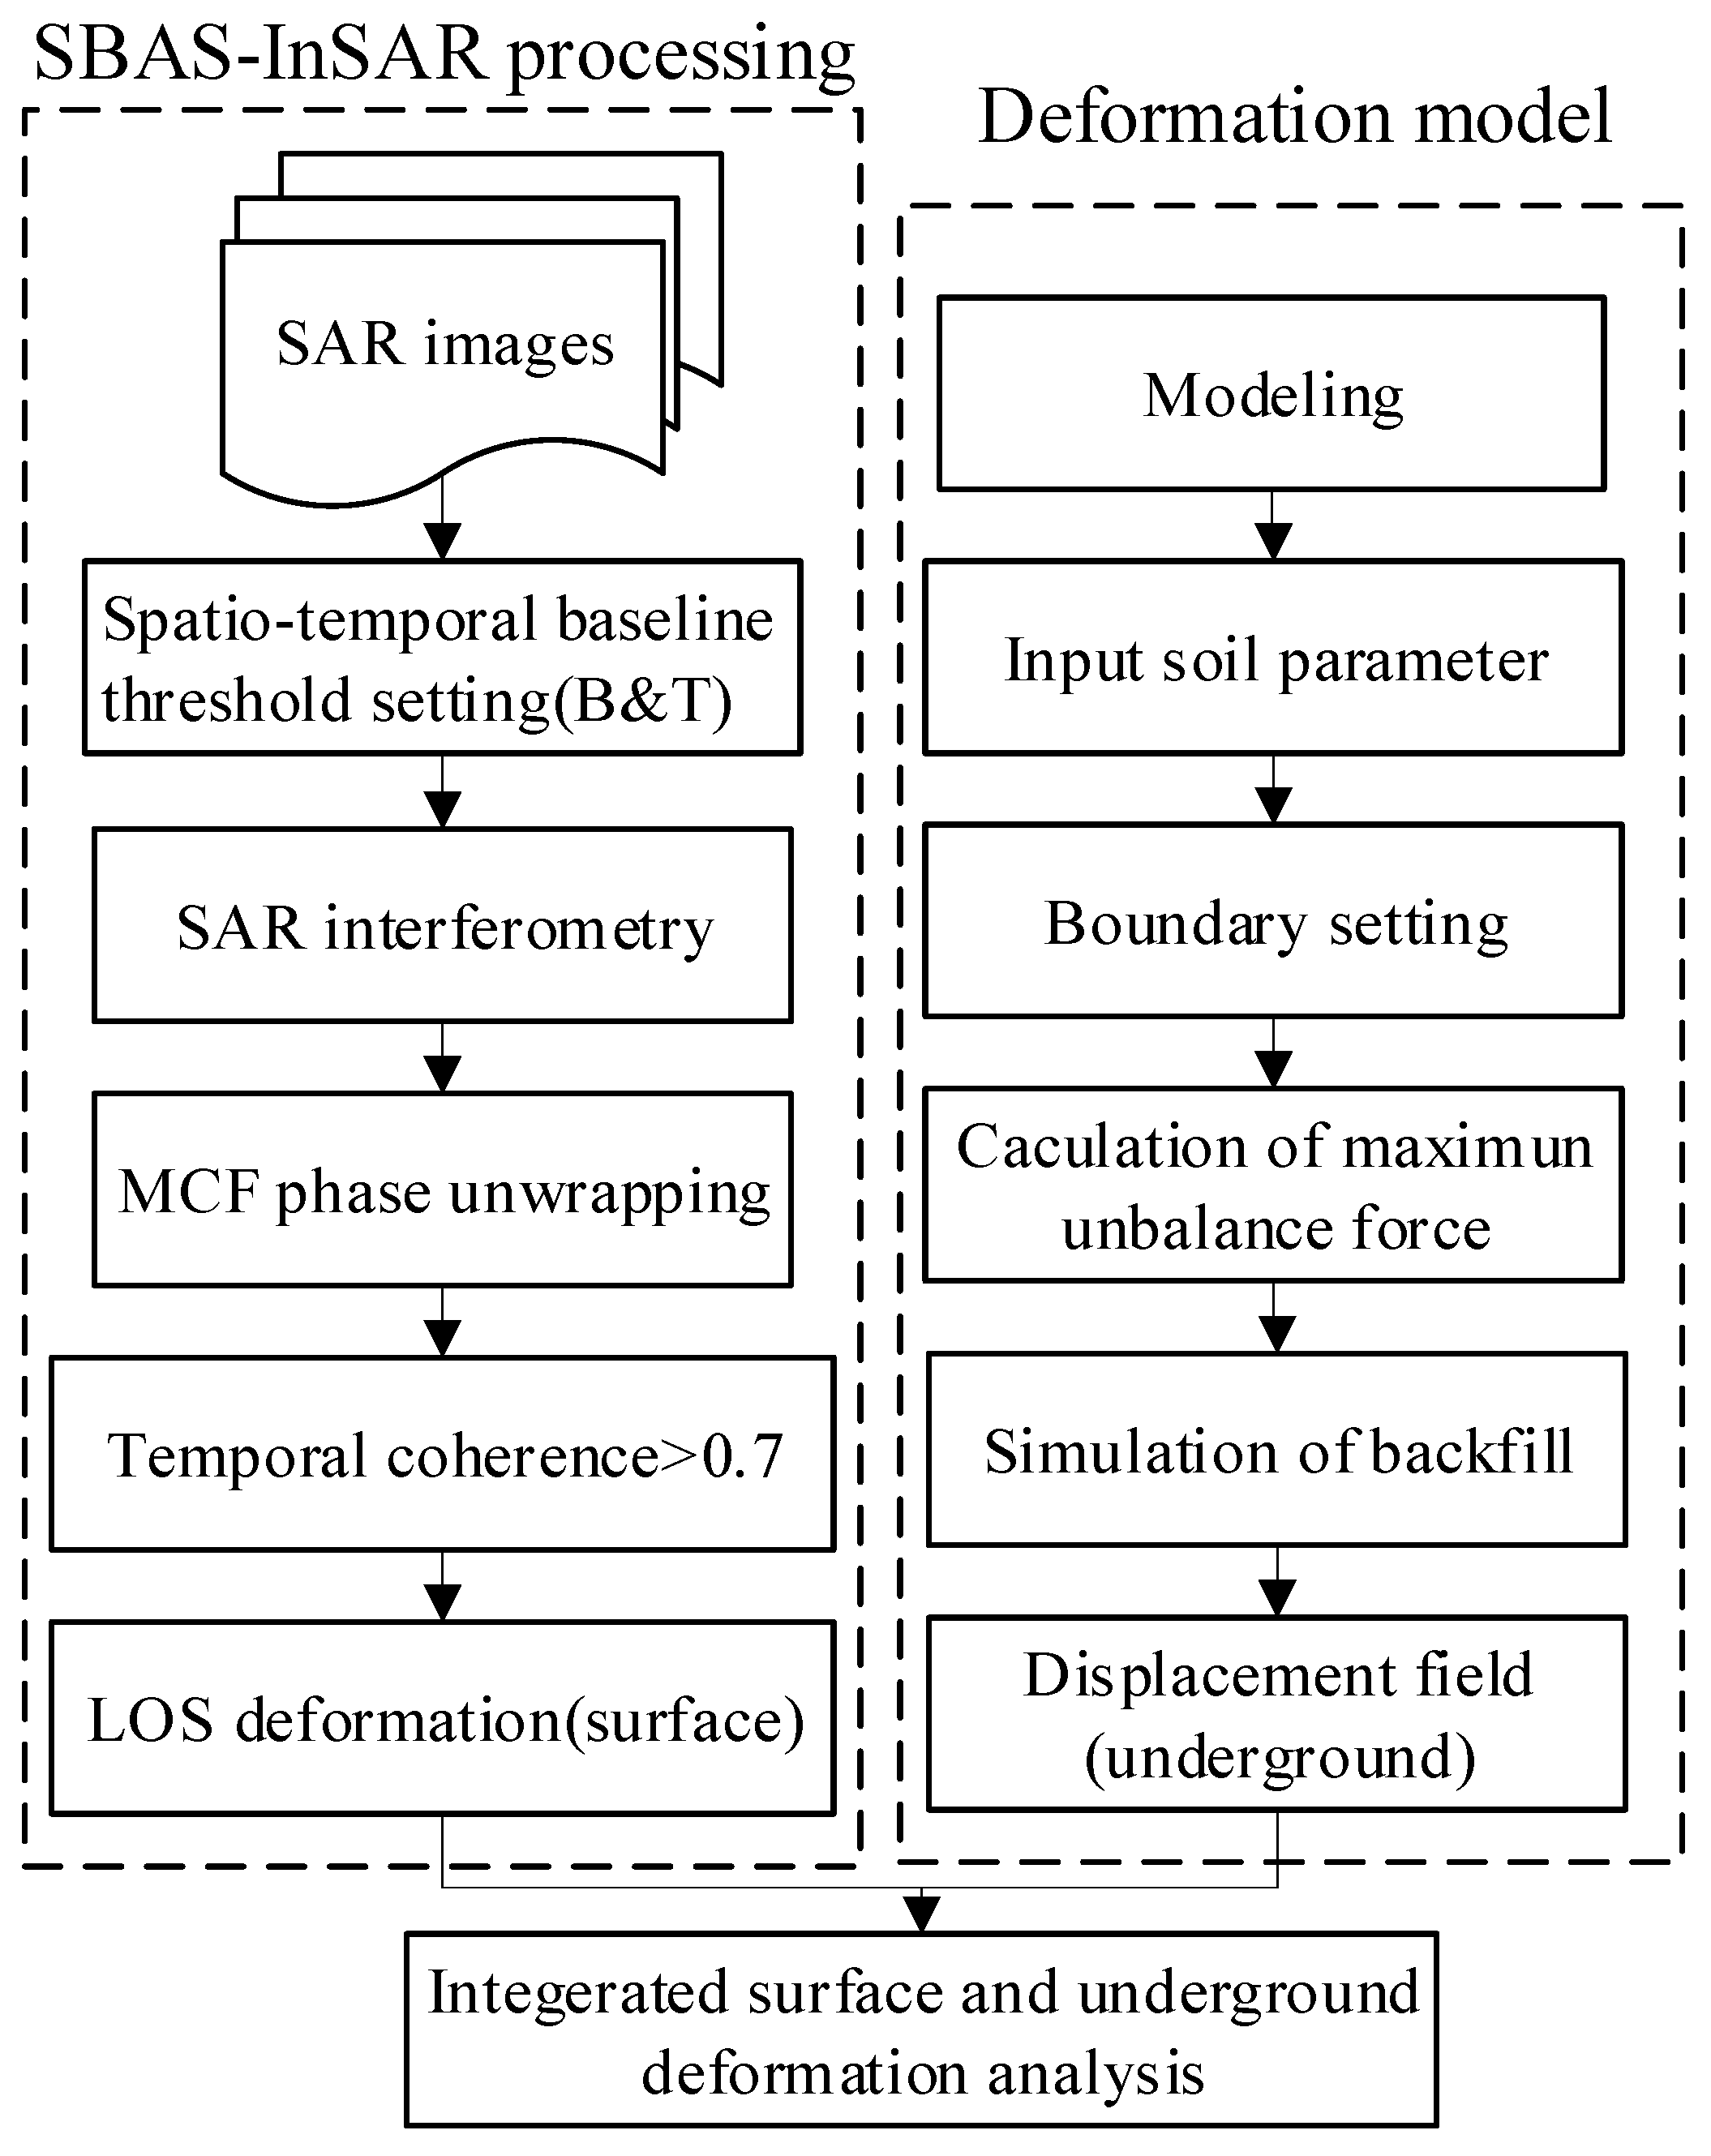
3. Study Methods
3.1. SBAS-InSAR Method
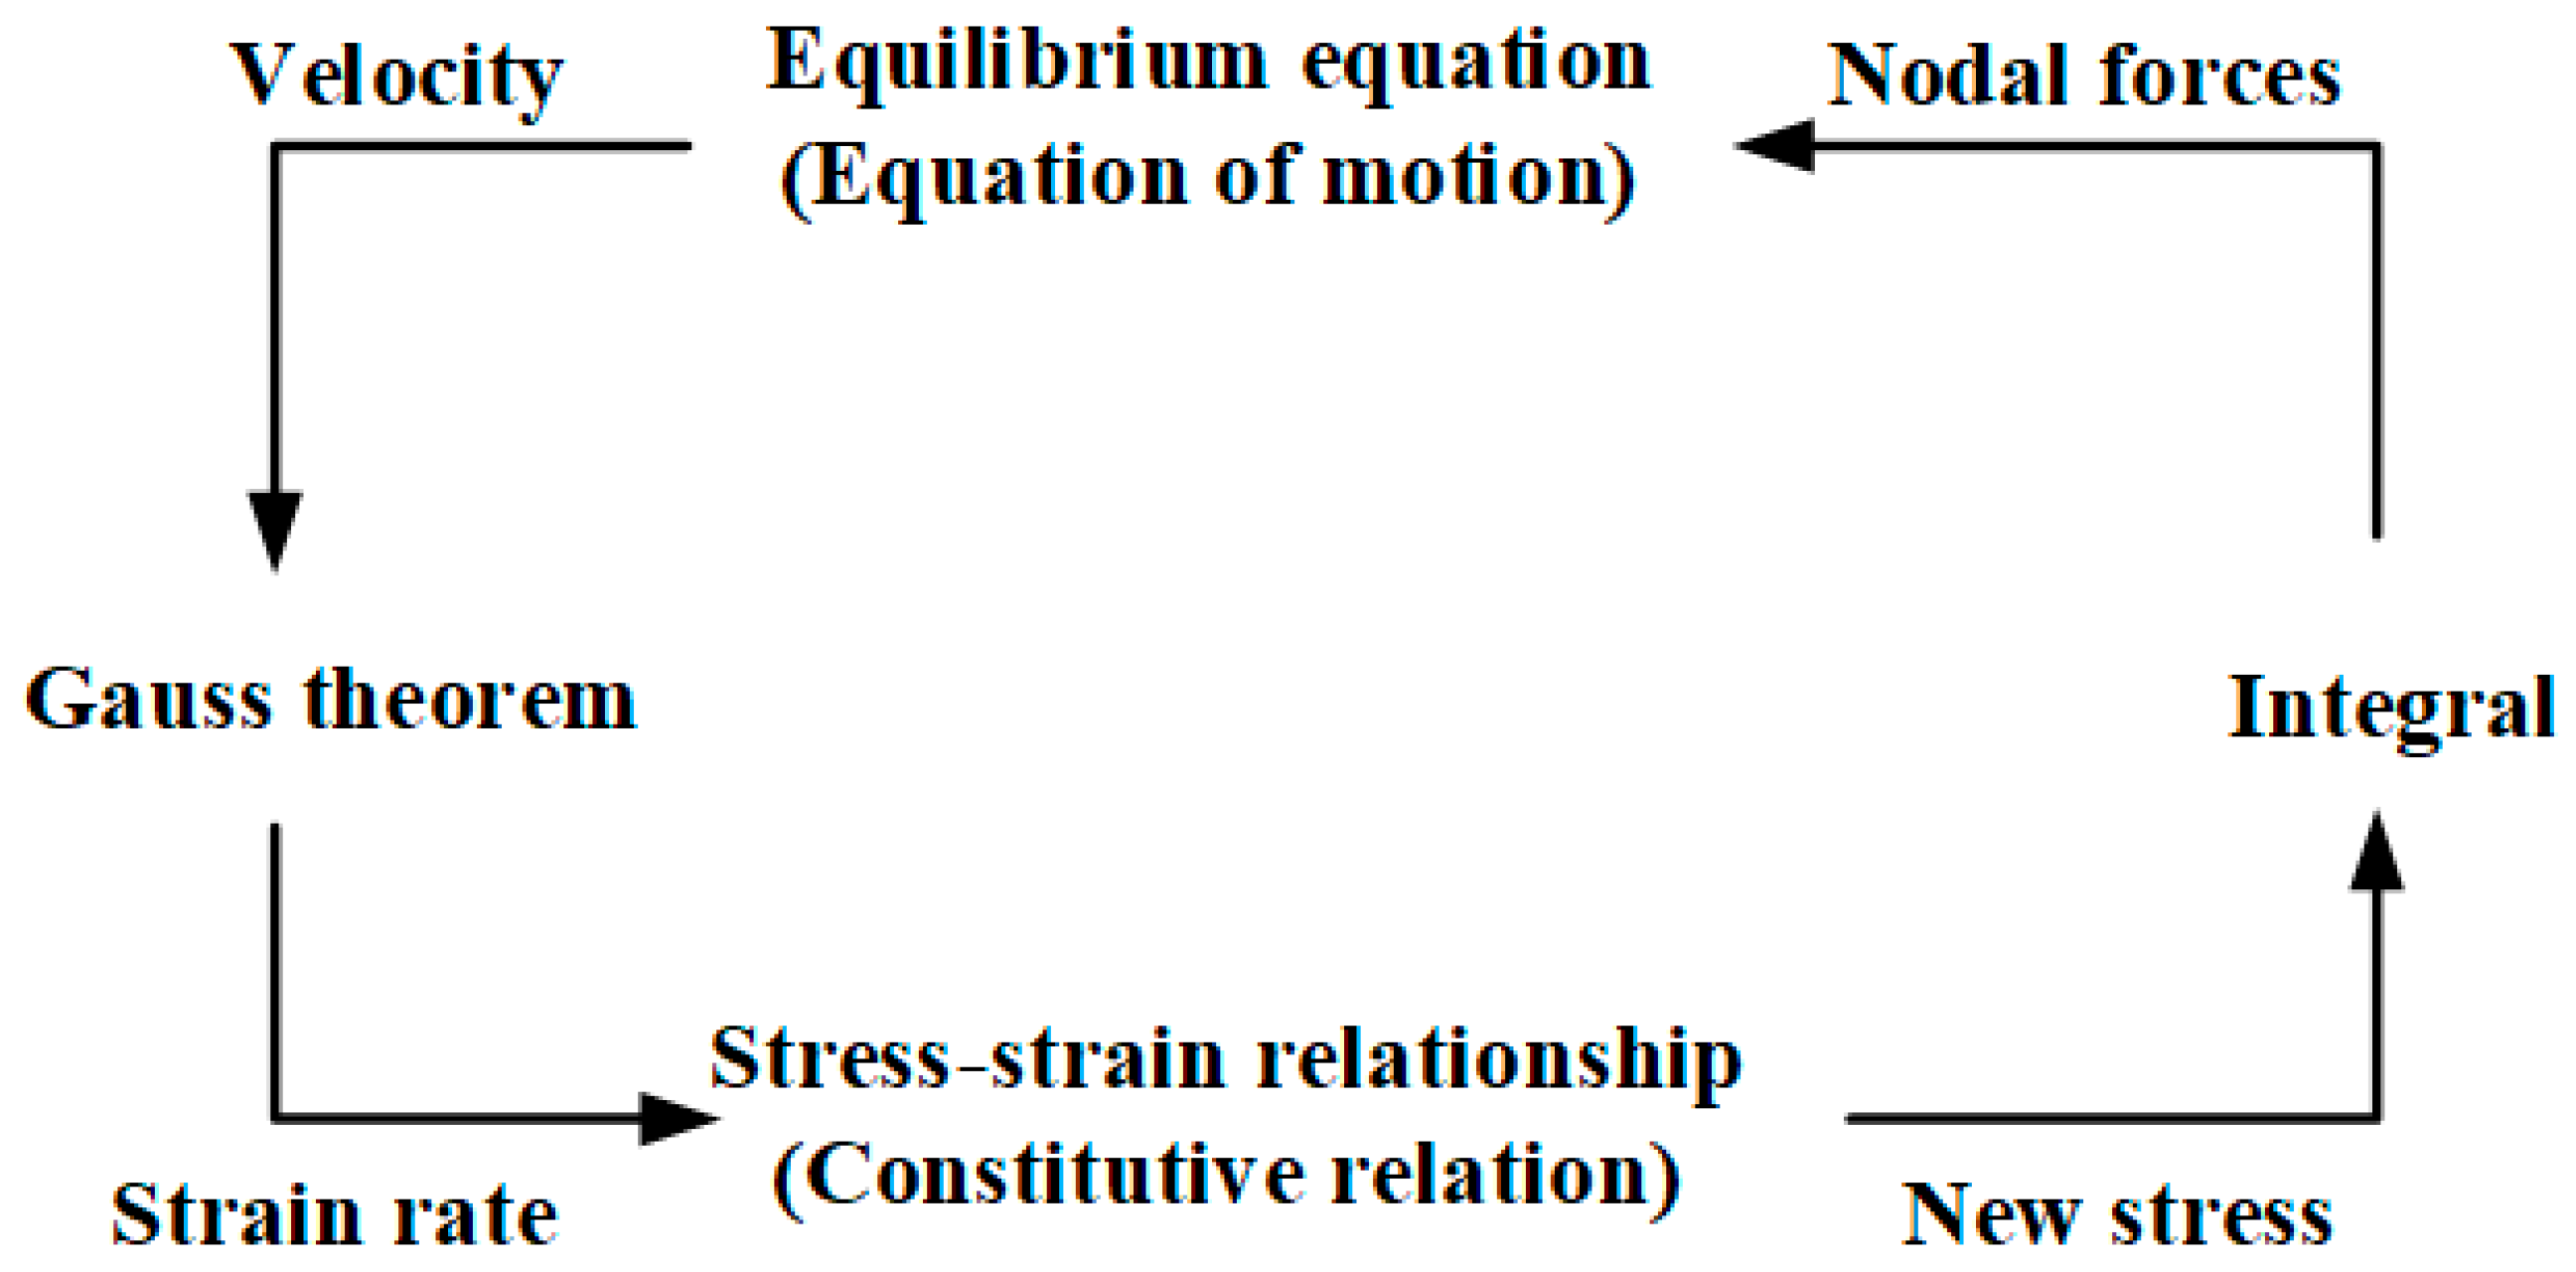
3.2. Iterative Solution Based on Mohr–Coulomb Model
4. Subsidence Monitoring and Analysis
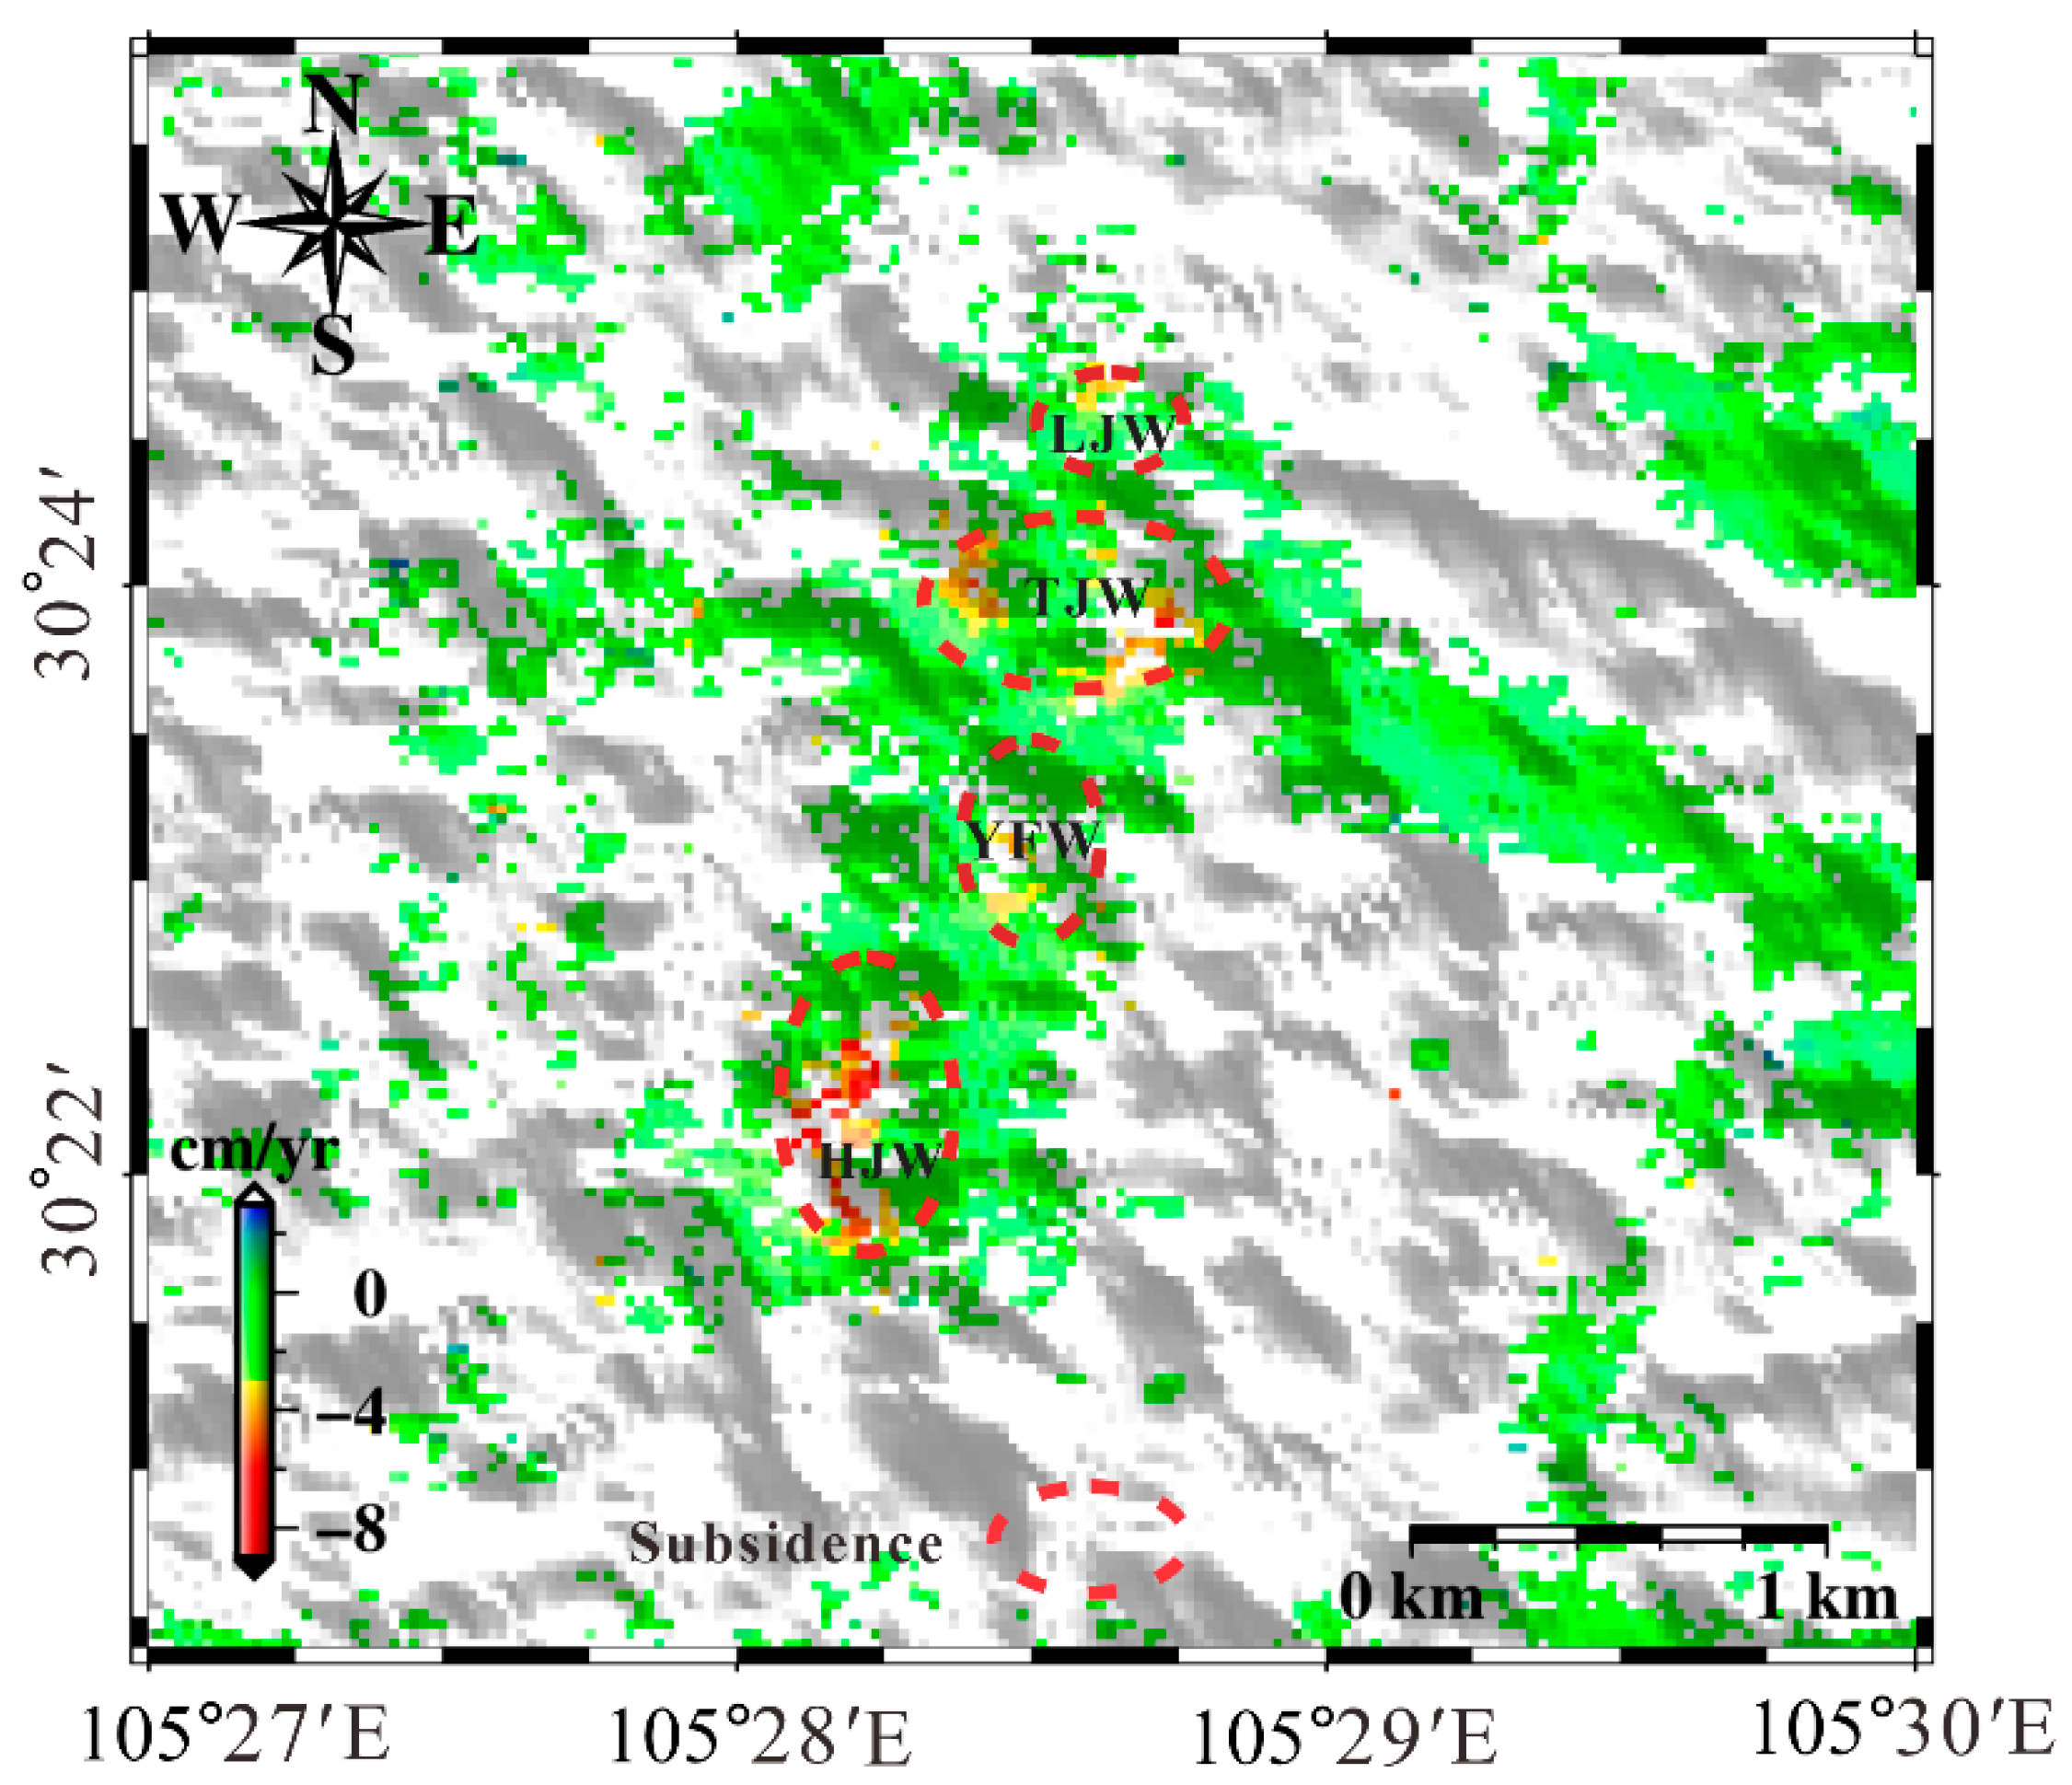
4.1. Analysis of Ground Subsidence Monitoring Results in the Construction Period
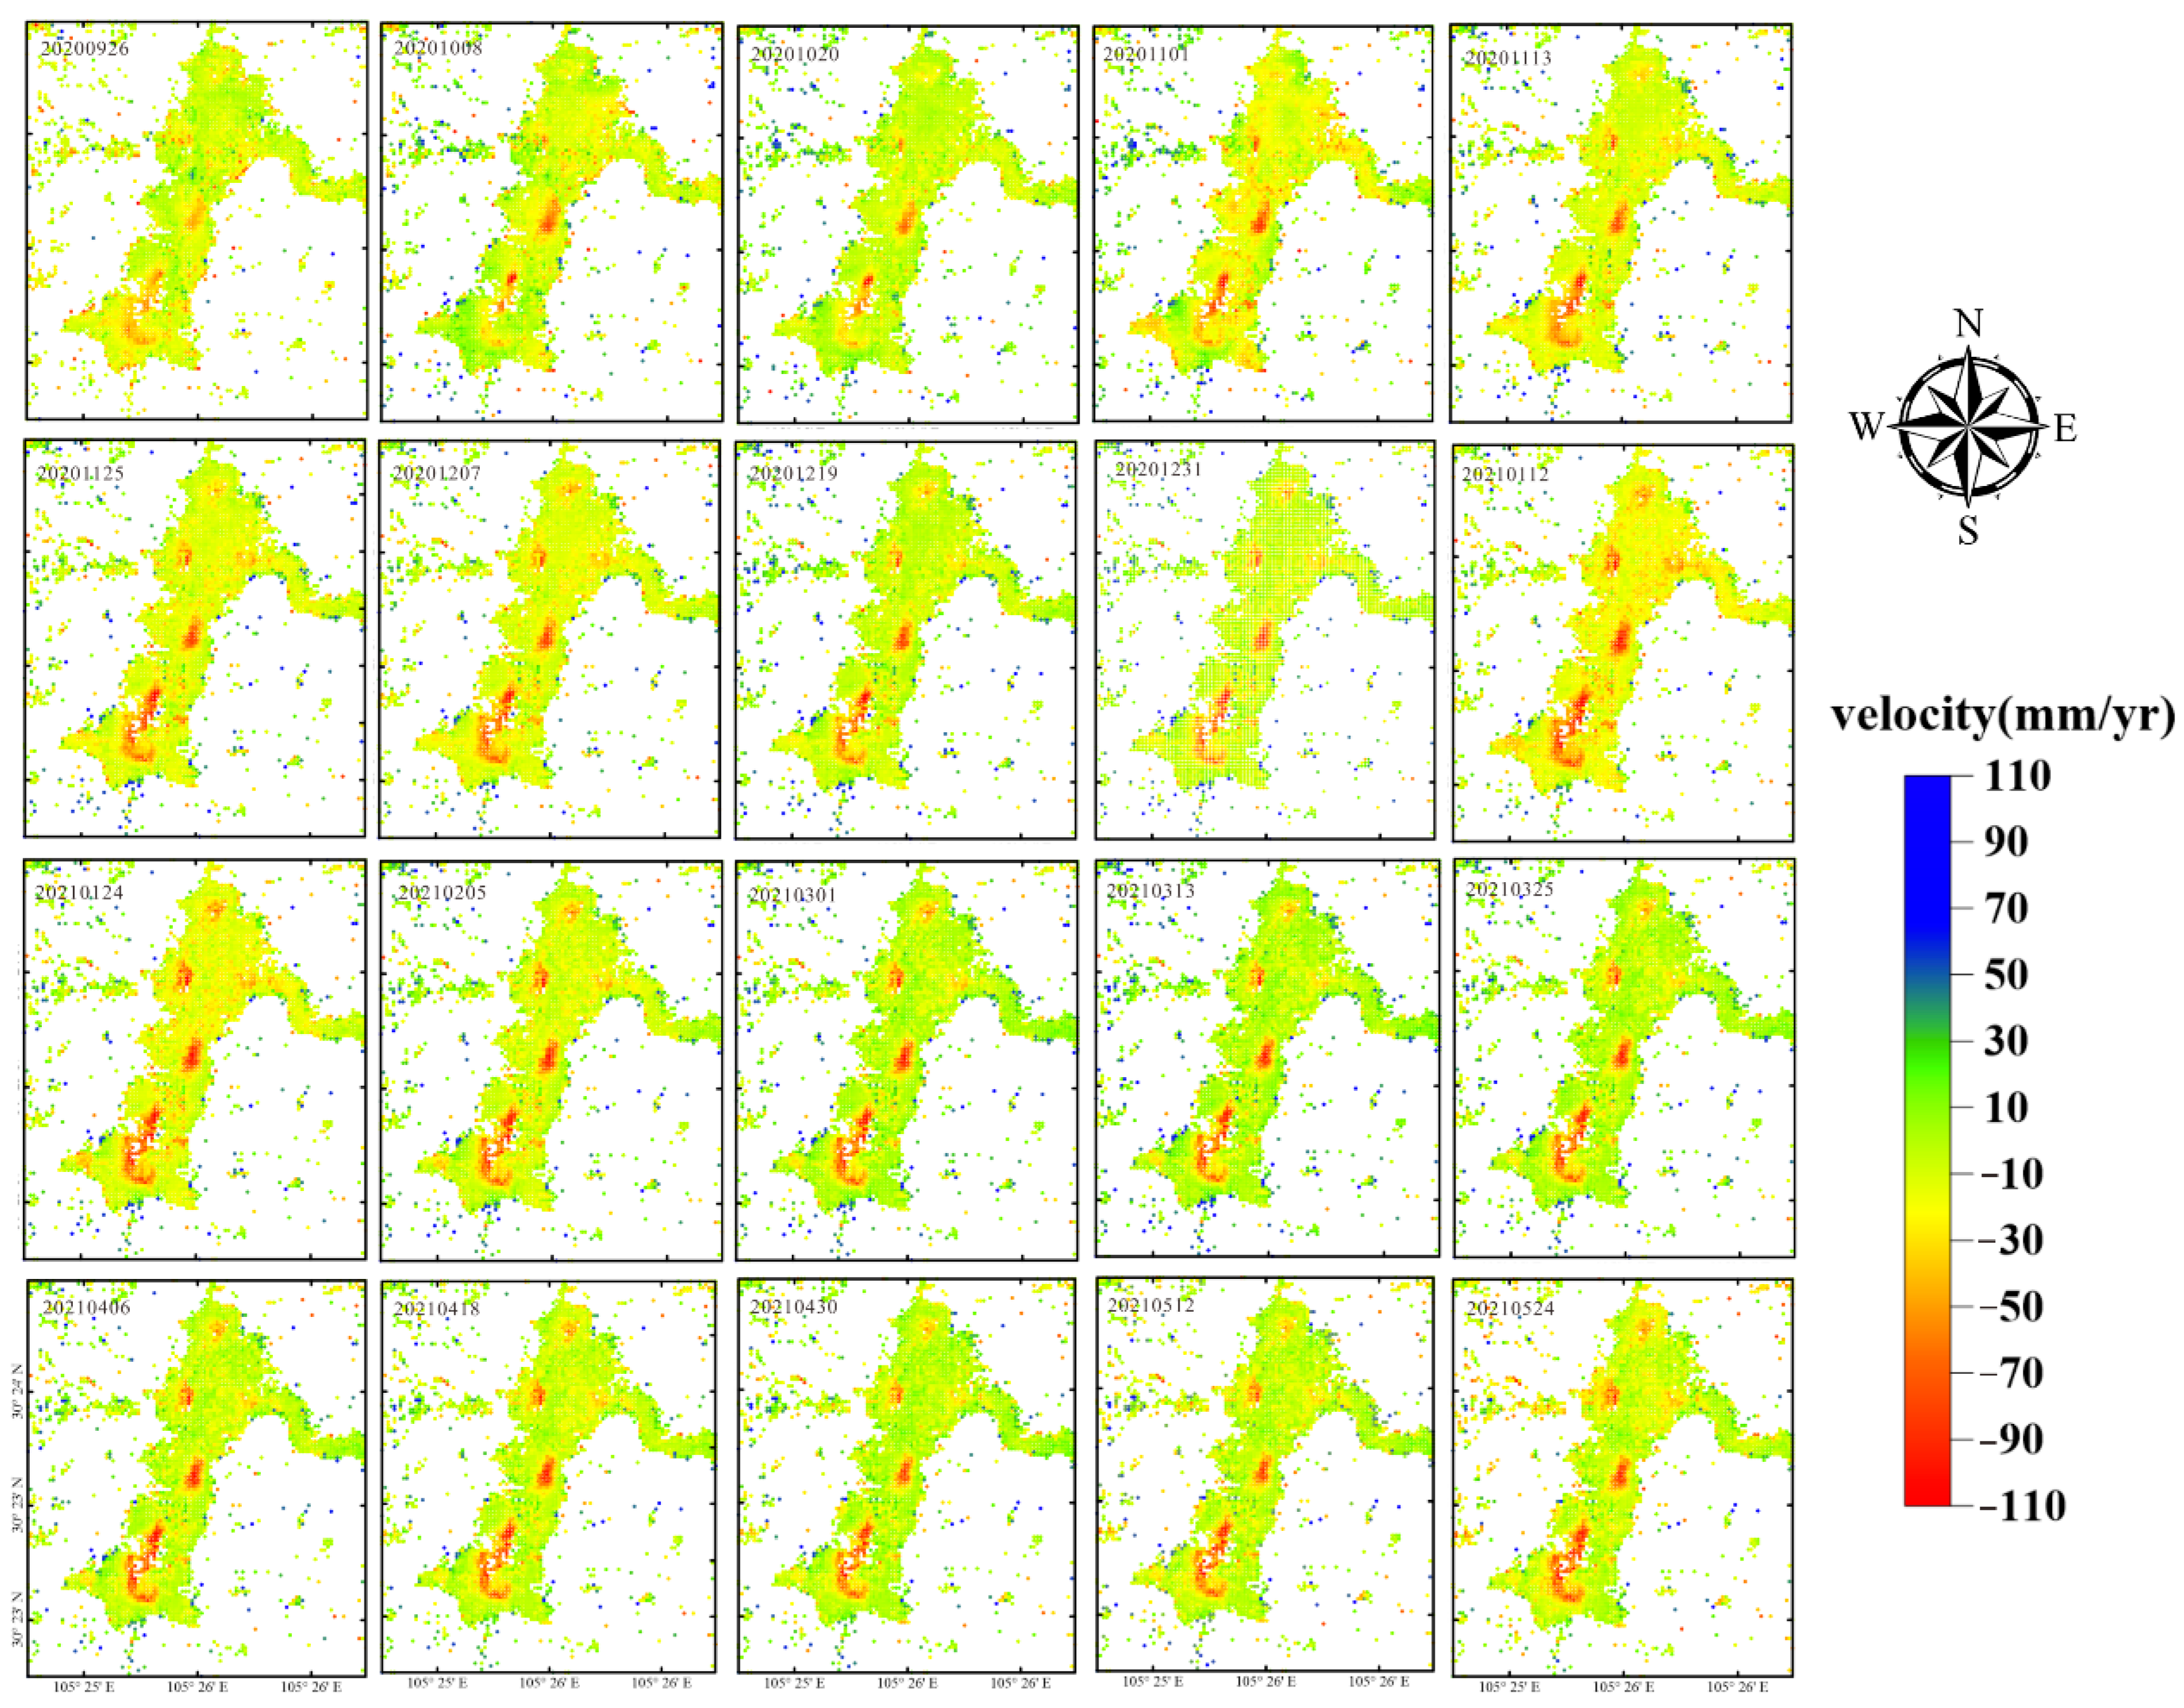
4.2. Analysis of Ground Subsidence Monitoring Results in the Late Construction Period after Landfill
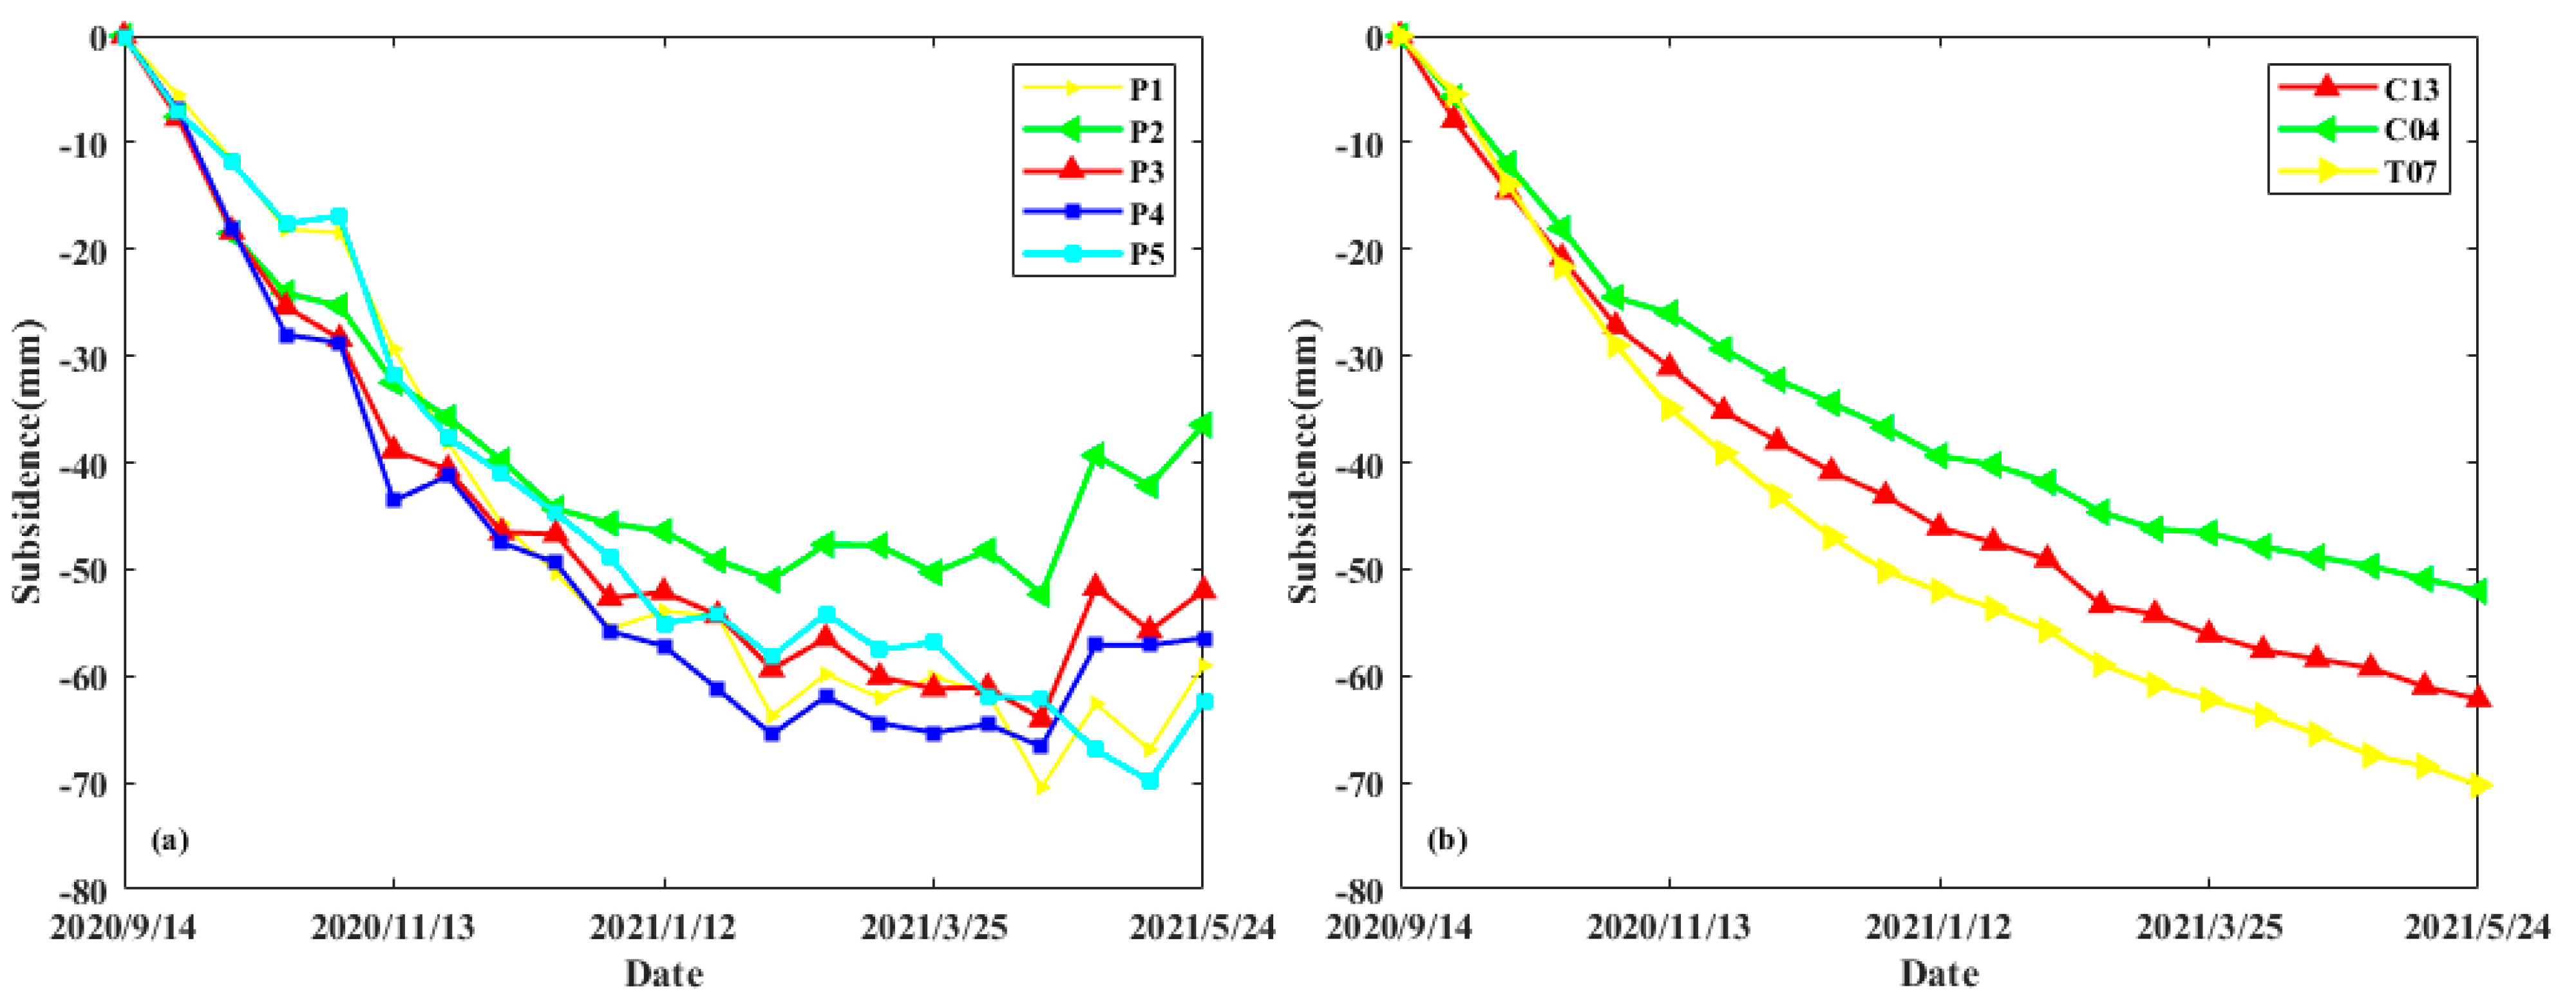
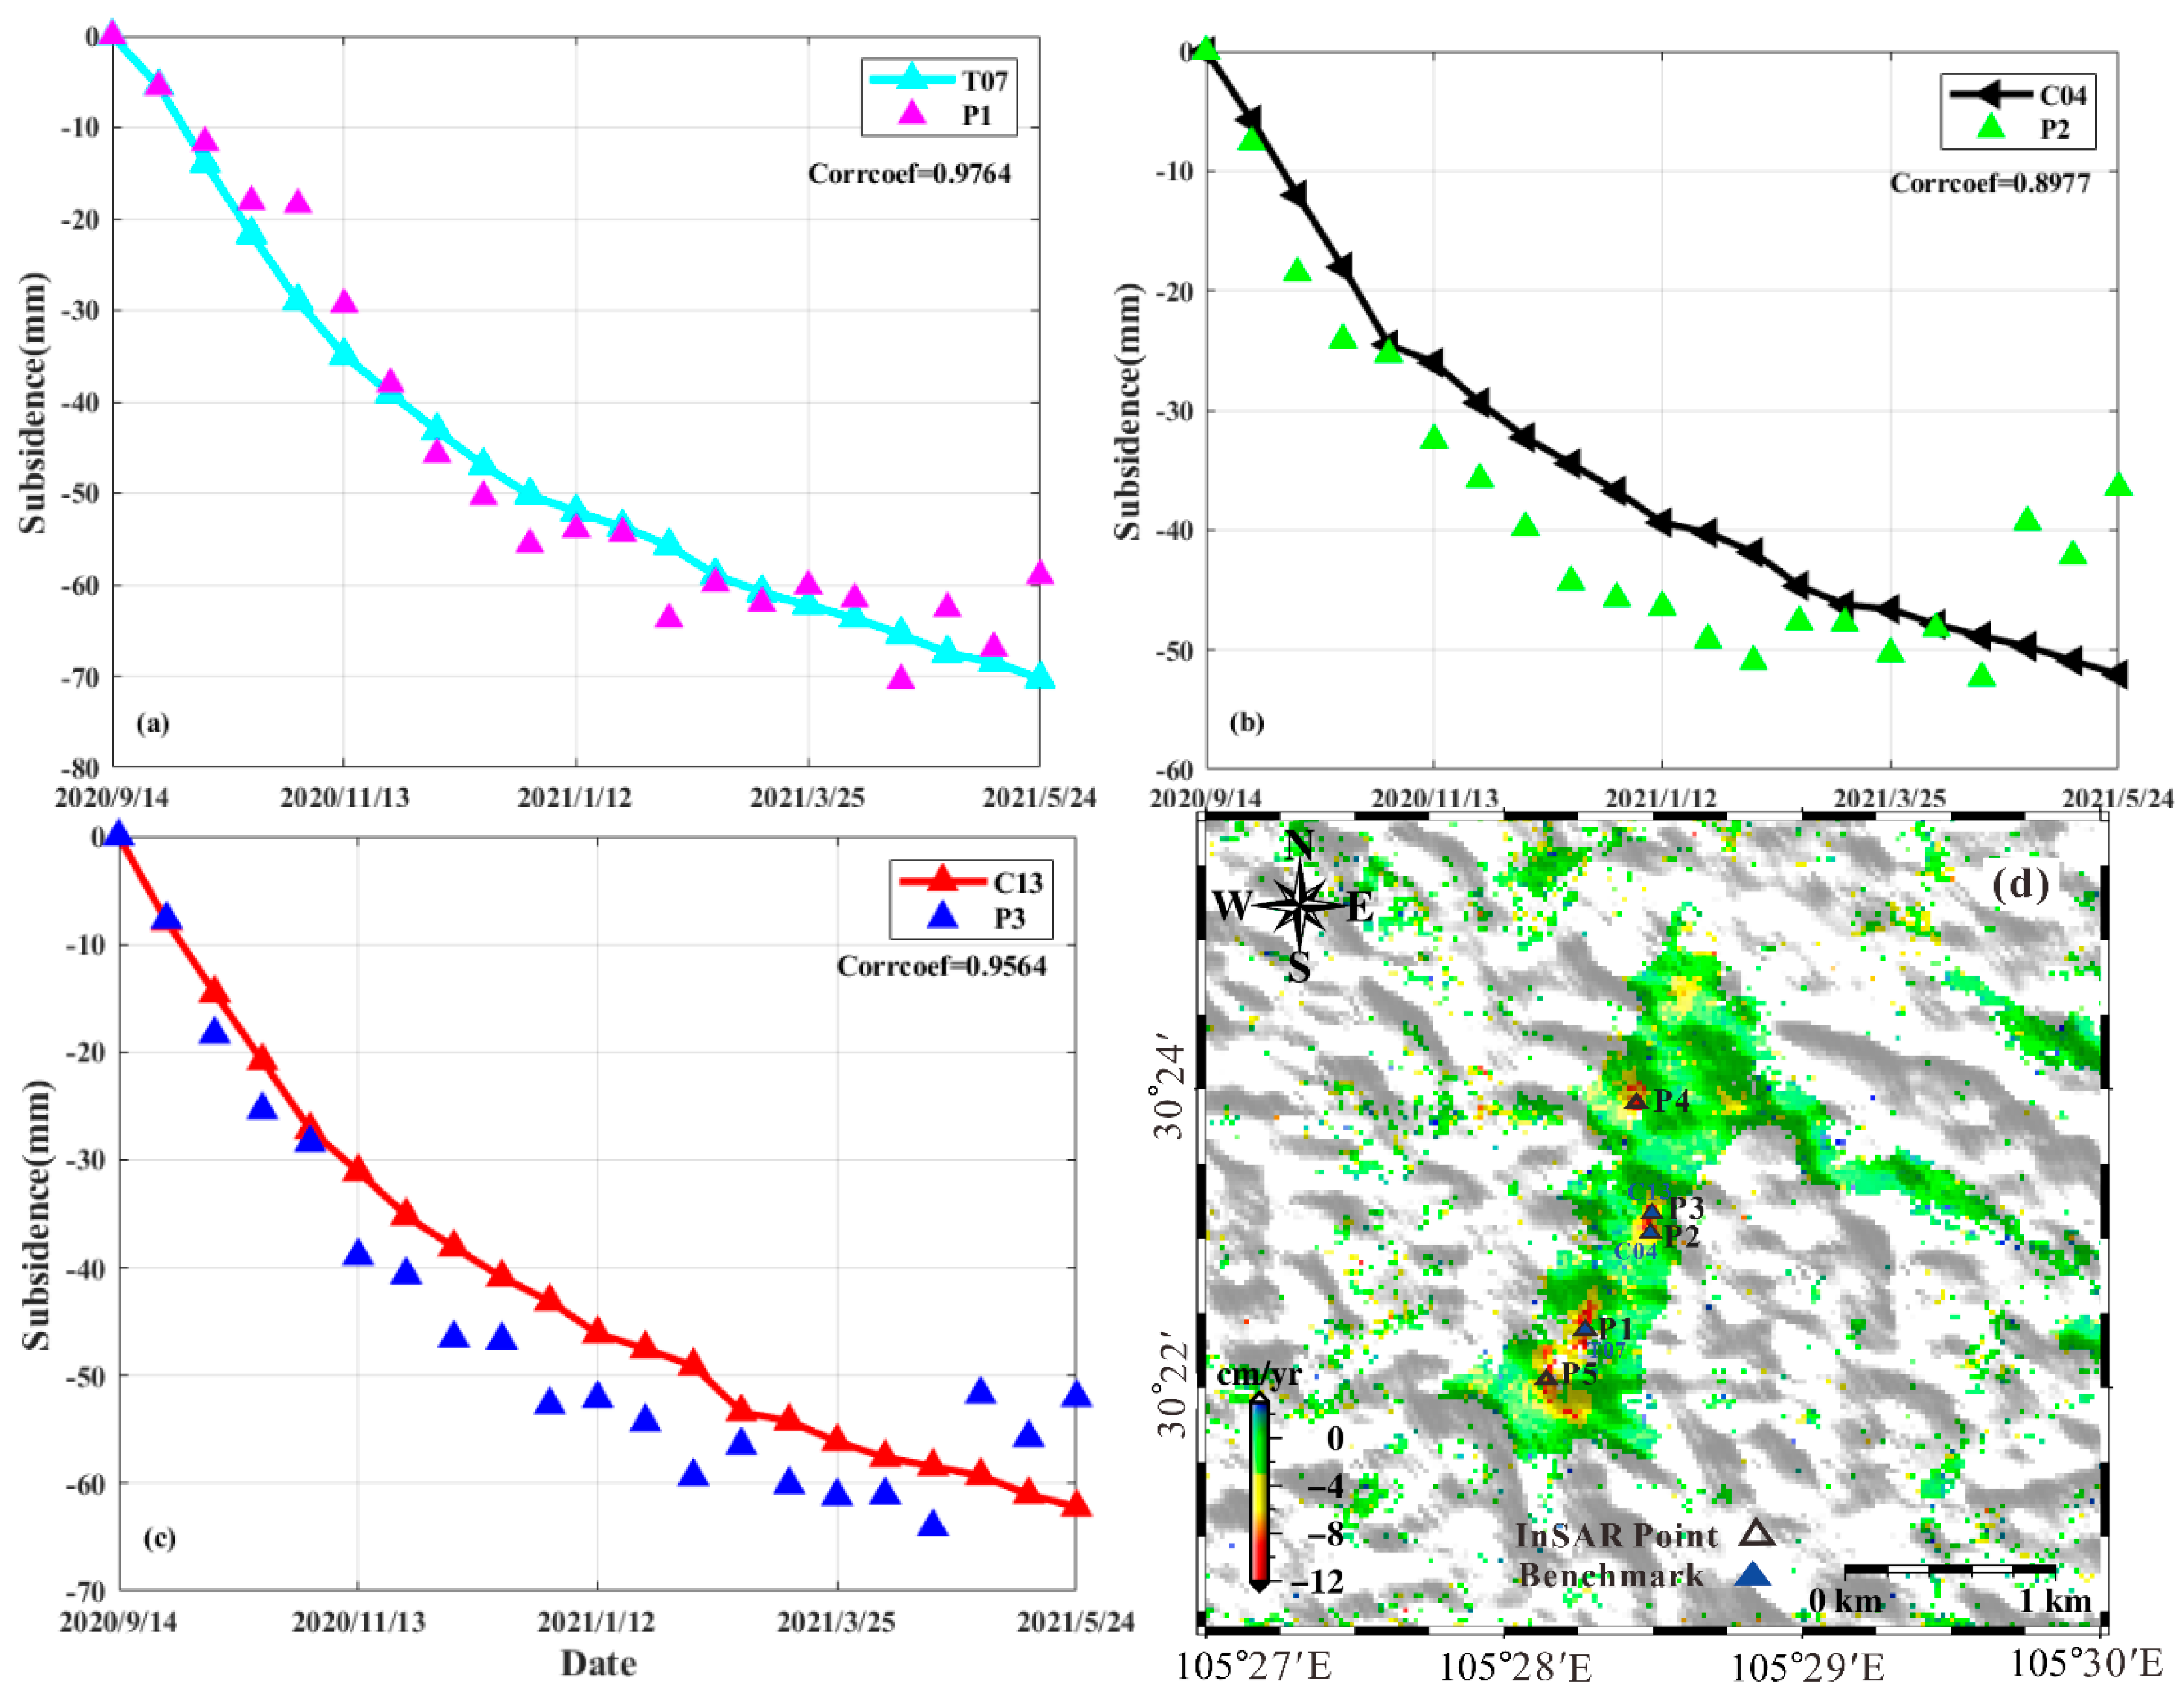
4.3. Ground-Level Data Validation
5. Embankment Filling Deformation Model
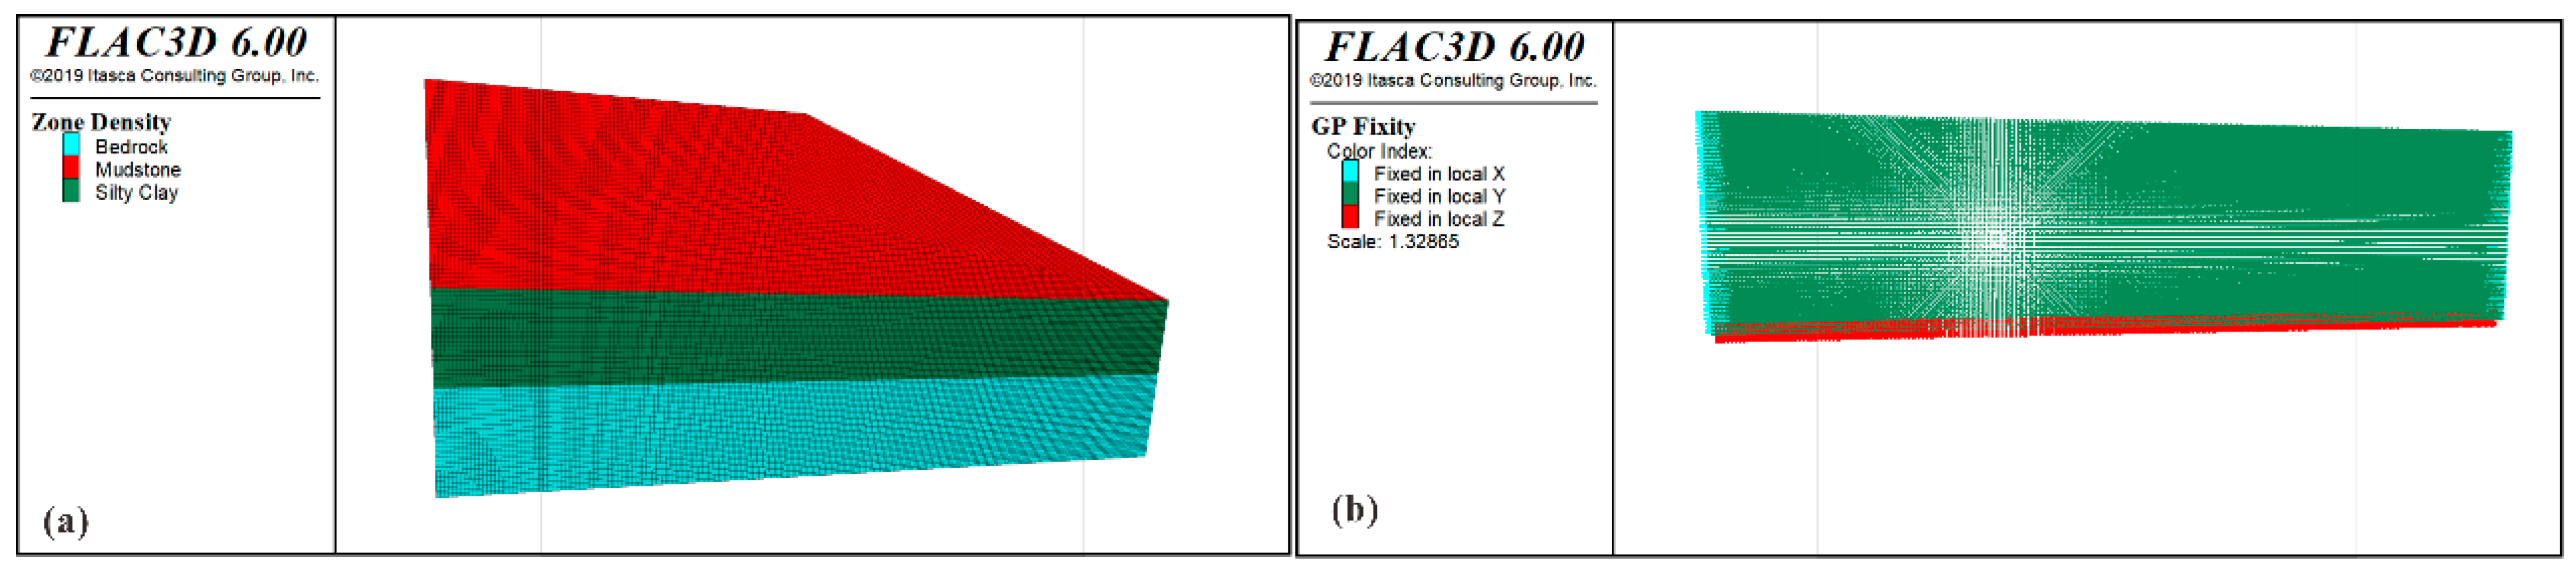
5.1. Filling Areas Model

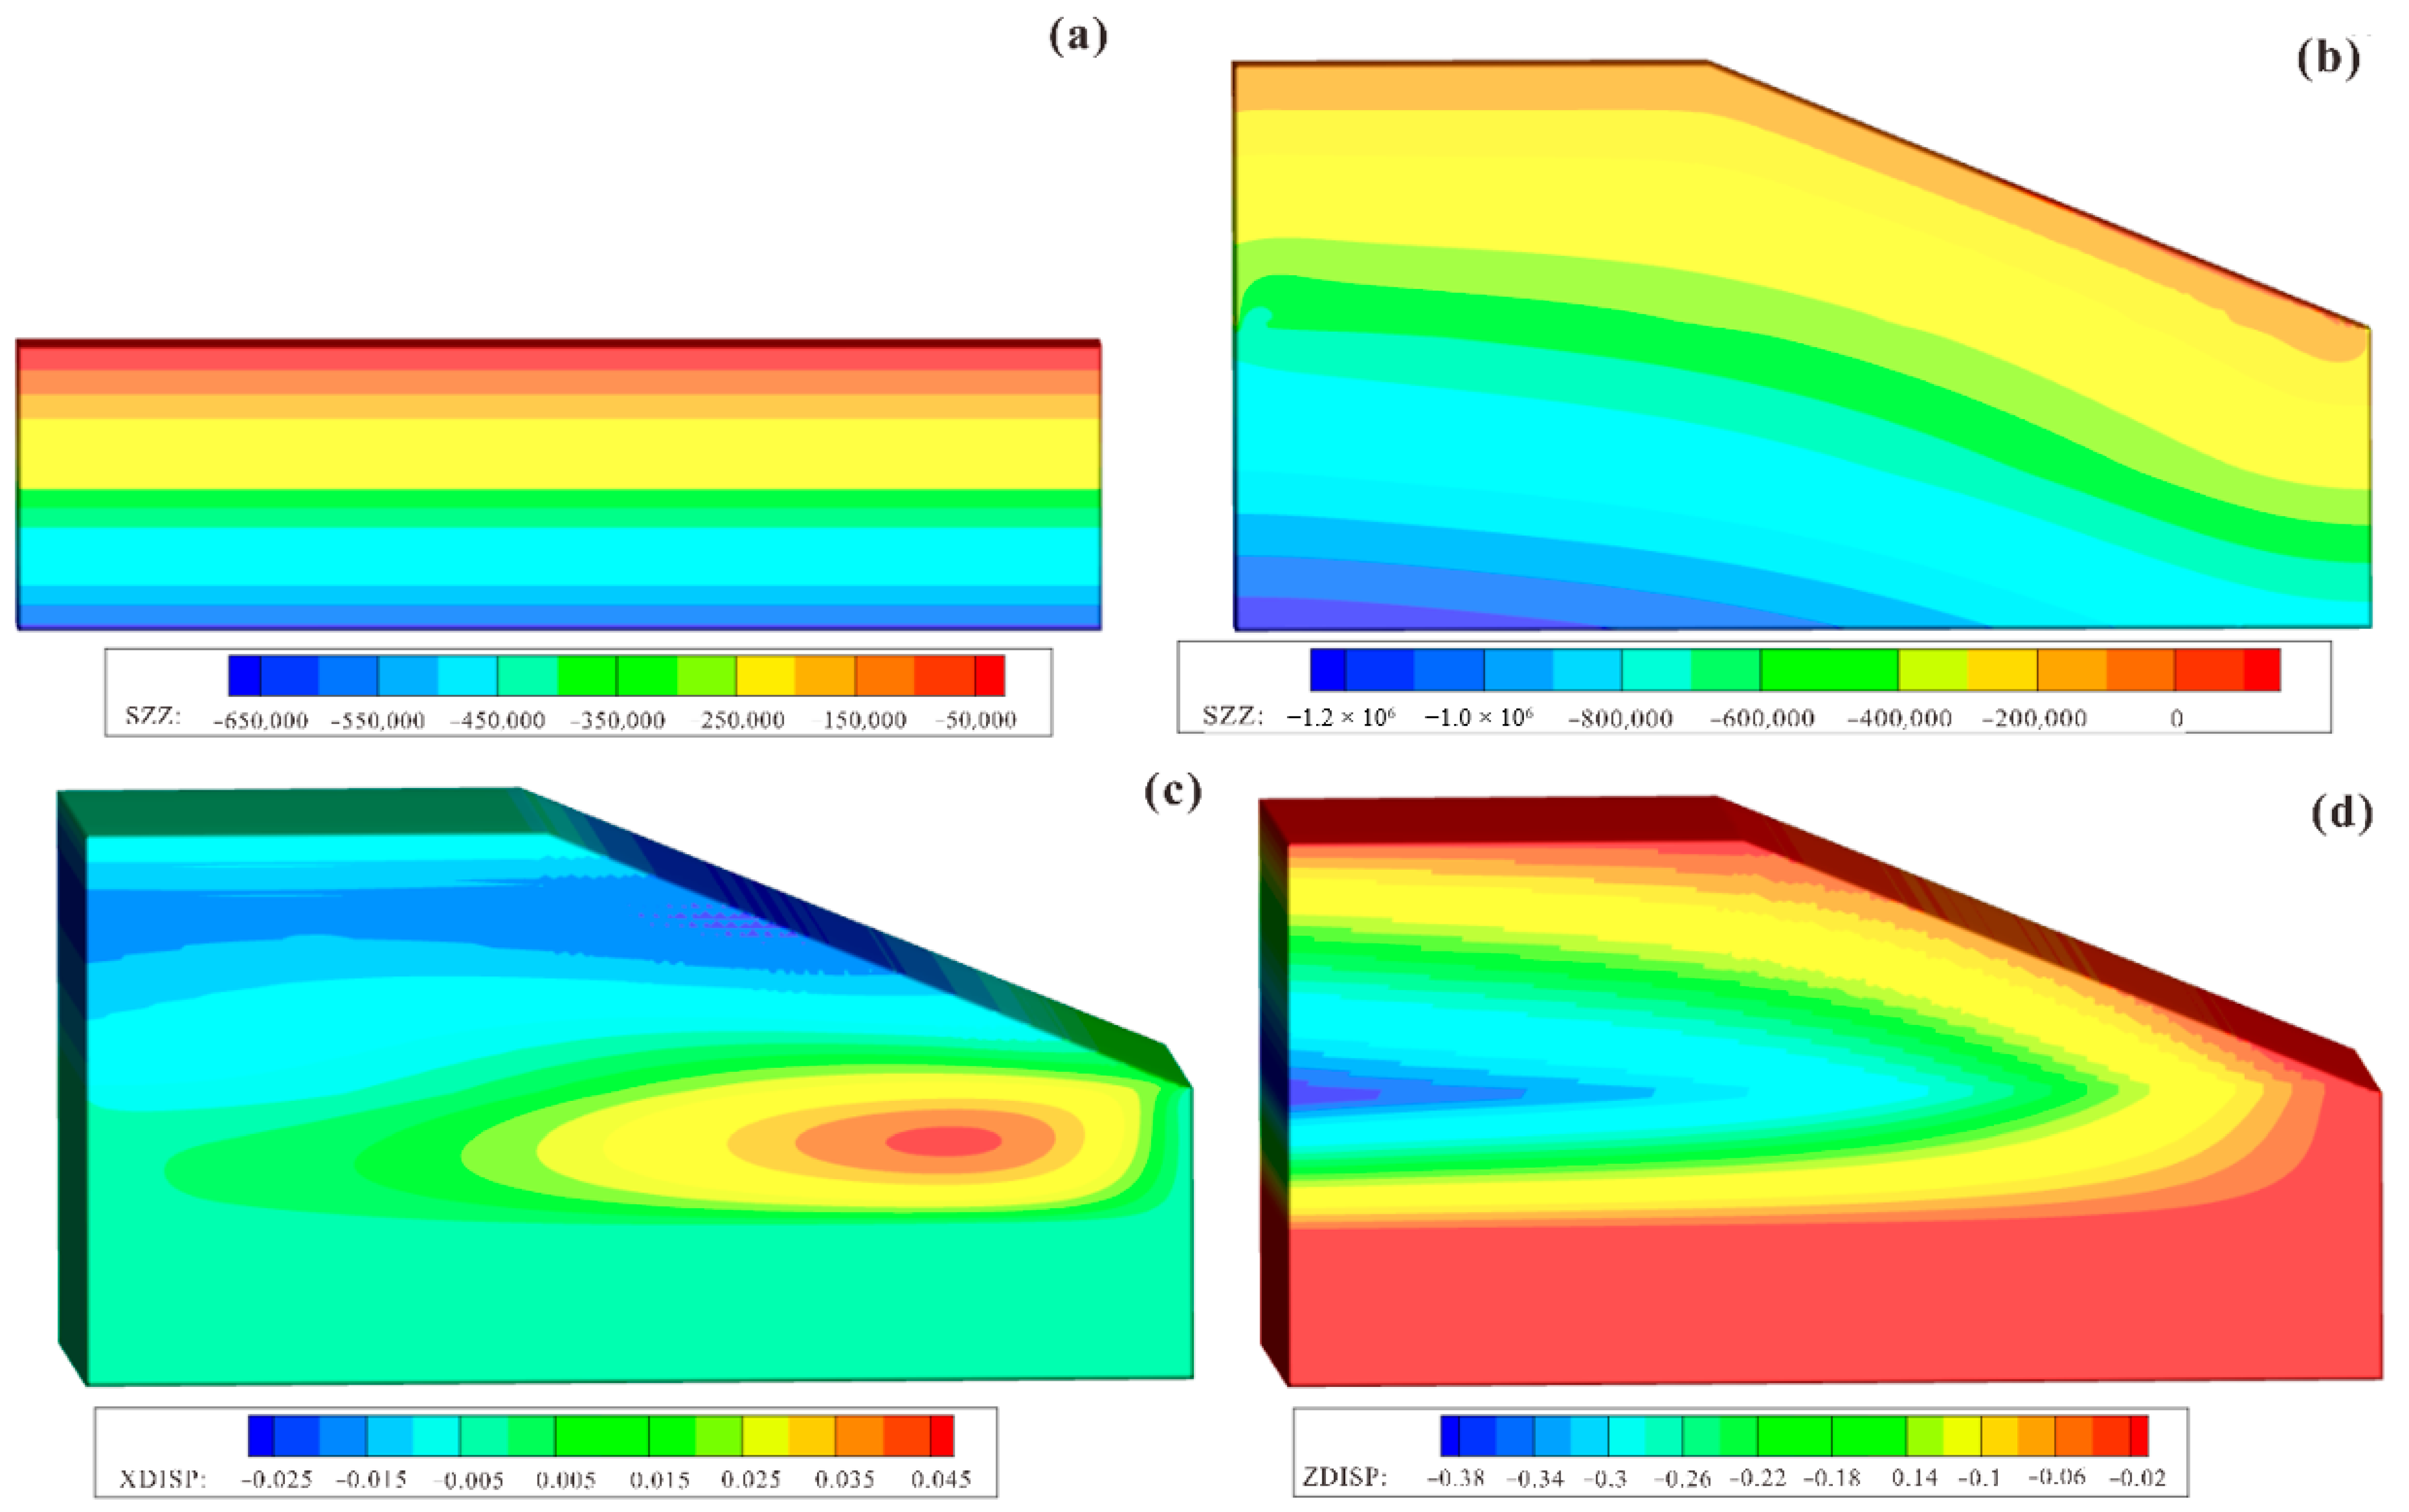
5.2. Subgrade Backfilling Simulation
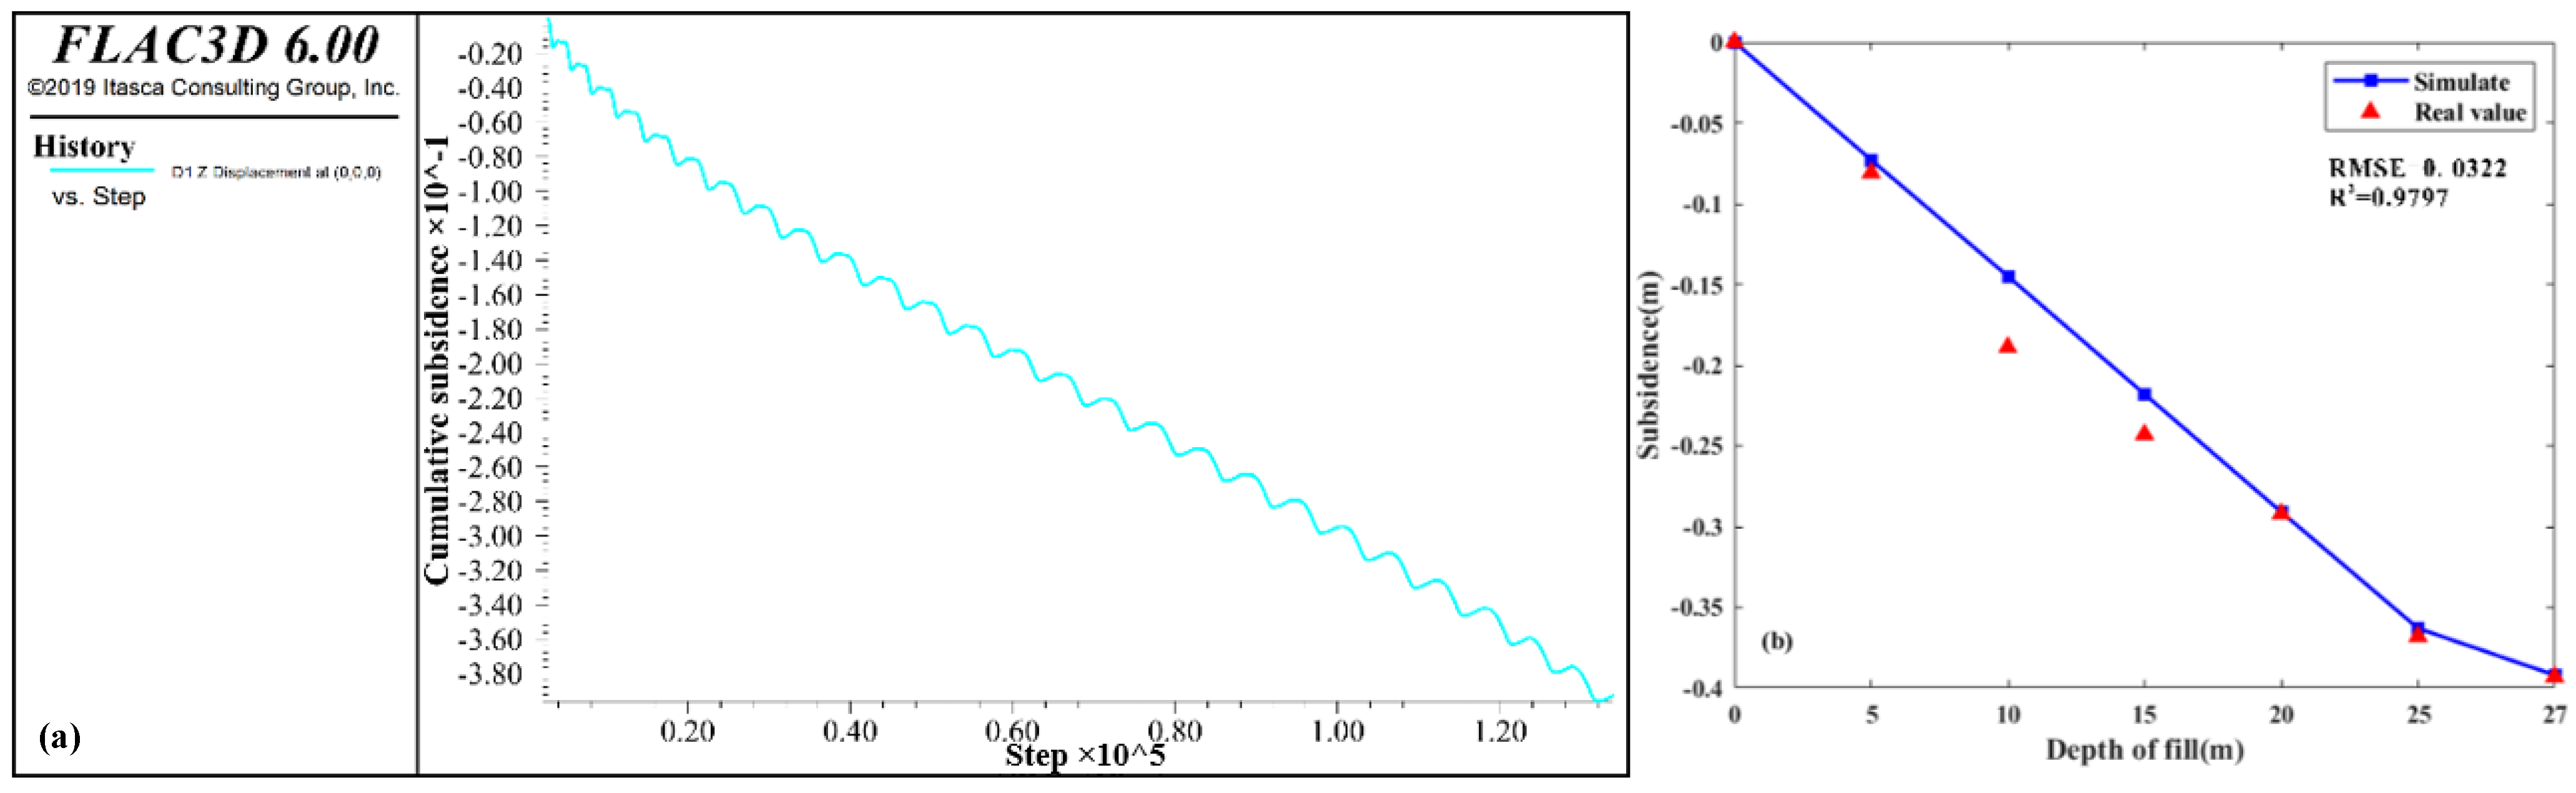
5.3. Influence of Fill Thickness
6. Discussion
7. Conclusions
- After the completion of the main body of Anju Airport, uneven land subsidence occurred, and its subsidence center is mainly distributed in YFW and HJW fill areas. The maximum subsidence rate of YFW is −108 mm/yr, and the maximum subsidence rate of HJW is −94 mm/yr. Compared with the leveling observations of three in situ points, the precision and reliability of the accumulated ground subsidence detected by InSAR were validated. The RMSEs of the InSAR observations in three points are ±4.72, ±7.17, and ±6.23 mm, respectively. Additionally the R2s are 0.98, 0.90, and 0.96, respectively. Statistic analysis with all in situ data shows the RMSE is ±6.12 mm.
- Through numerical simulation of the backfilling of subgrade in YFW, the accumulated subsidence of the original ground with different backfilling heights is obtained. When the backfilling height reaches 15 m, the accumulated subsidence of the original foundation is 0.218 m. When filled to 27 m, the maximum accumulated subsidence of the original foundation is 0.392 m. The RMSE is ±0.03 m, and the correlation is 0.98 when comparing the numerical simulation results with the measured data. The numerical simulation results reflect the internal subsidence of soil in detail, provide an analytical basis for ground monitoring data detected by InSAR, and make up for the shortcomings of InSAR monitoring points caused by frequent engineering disturbances.
- This paper finally realized the monitoring and analysis of airport subsidence during construction by combining InSAR and numerical simulation methods. It provides technical means for studying high-fill airports’ differential ground subsidence and slope stability. Related results are essential for further monitoring, early warning, and scientific prevention and control.
Author Contributions
Funding
Data Availability Statement
Acknowledgments
Conflicts of Interest
References
- Jie, Y.; Wei, Y.; Wang, D.; Wei, Y. Numerical study on settlement of high-fill airports in collapsible loess geomaterials: A case study of Lüliang Airport in Shanxi Province. China Springer 2021, 15, 2423–2435. [Google Scholar] [CrossRef]
- Wang, J.; Ma, Y.; Qiao, S.; Feng, K. Study on the deformation and failure modes of filling slope in loess filling engineering: A case study at a loess mountain airport. Landslides 2018, 28, 939–953. [Google Scholar] [CrossRef]
- Abad, L. Detecting landslide-dammed lakes on Sentinel-2 imagery and monitoring their Spatio-temporal evolution following the Kaikoura earthquake in New Zealand. Sci. Total Environ. 2022, 820, 153335. [Google Scholar] [CrossRef]
- Li, G.; Hu, B.; Li, H.; Lu, F. Early Identifying and Monitoring Landslides in Guizhou Province with InSAR and Optical Remote Sensing. J. Sens. 2021, 2021, 6616745. [Google Scholar] [CrossRef]
- Liang, X.; Gui, L.; Wang, W.; Du, J.; Ma, F.; Yin, K. Characterizing the Development Pattern of a Colluvial Landslide Based on Long-Term Monitoring in the Three Gorges Reservoir. Remote Sens. 2021, 13, 224. [Google Scholar] [CrossRef]
- Zitzlsberger, G.; Podhorányi, M.; Svatoň, V.; Lazecký, M.; Martinovič, J. Neural Network-Based Urban Change Monitoring with Deep-Temporal Multispectral and SAR Remote Sensing Data. Remote Sens. 2021, 13, 3000. [Google Scholar] [CrossRef]
- Boukhemacha, M.A. Combined in-situ and Persistent Scatterers Interferometry Synthetic Aperture Radar (PSInSAR) Monitoring of Land Surface Deformation in Urban Environments-Case Study: Tunnelling Works in Bucharest (Romania). Int. J. Remote Sens. 2021, 42, 2641–2662. [Google Scholar] [CrossRef]
- Guilhot, D.; del Hoyo, T.M.; Bartoli, A.; Ramakrishnan, P.; Leemans, G.; Houtepen, M.; Salzer, J.; Metzger, J.; Maknavicius, G. Internet-of-Things-Based Geotechnical Monitoring Boosted by Satellite InSAR Data. Remote Sens. 2021, 13, 2757. [Google Scholar] [CrossRef]
- Li, S. Earth Fissures and Land Subsidence in Xi’an from NPSI Monitoring and Analysis. Remote Sens. Technol. Appl. 2021, 36, 857–864. [Google Scholar]
- Vidal, C.A.; Zaccarelli, L.; Pintori, F.; Bragato, P.L.; Serpelloni, E. Hydrological Effects on Seismic-Noise Monitoring in Karstic Media. Geophys. Res. Lett. 2021, 48, e2021GL093191. [Google Scholar]
- Zhang, T.; Zhang, W.; Yang, R.; Cao, D.; Chen, L.; Li, D.; Meng, L. CO2 Injection Deformation Monitoring Based on UAV and InSAR Technology: A Case Study of Shizhuang Town, Shanxi Province, China. Remote Sens. 2022, 14, 237. [Google Scholar] [CrossRef]
- Zhang, Y. Characterizing pre-failure deformation and evolution of a large earthflow using InSAR monitoring and optical image interpretation. Landslides 2022, 19, 35–50. [Google Scholar]
- Liao, M.; Zhang, R.; Lv, J.; Yu, B.; Pang, J.; Li, R.; Xiang, W.; Tao, W. Subsidence Monitoring of Fill Area in Yan’an New District Based on Sentinel-1A Time Series Imagery. Remote Sens. 2021, 13, 3044. [Google Scholar] [CrossRef]
- Berardino, P.; Fornaro, G.; Lanari, R.; Sansosti, E. A New Algorithm for Surface Deformation Monitoring Based on Small Baseline Differential SAR Interferograms. IEEE Trans. Geosci. Remote Sens. 2002, 40, 2375–2383. [Google Scholar] [CrossRef]
- Mora, O.; Mallorqu, J.J.; Broquetas, A. Linear and nonlinear terrain deformation maps from a reduced set of interferometric SAR images. IEEE Trans. Geosci. Remote Sens. 2003, 41, 2243–2253. [Google Scholar] [CrossRef]
- Lanari, R.; Casu, F.; Manzo, M.; Zeni, G.; Berardino, P.; Manunta, M.; Pepe, A. An Overview of the Small Baseline Subset Algorithm: A DInSAR Technique for Surface Deformation Analysis. Pure Appl. Geophys. 2007, 164, 637–661. [Google Scholar] [CrossRef]
- Lanari, R.; Mora, O.; Manunta, M.; Mallorqui, J.; Berardino, P.; Sansosti, E. A small-baseline approach for investigating deformations on full-resolution differential SAR interferograms. IEEE Trans. Geosci. Remote Sens. 2004, 42, 1377–1386. [Google Scholar] [CrossRef]
- Wu, S.; Yang, Z.; Ding, X.; Zhang, B.; Zhang, L.; Lu, Z. Two decades of settlement of Hong Kong International Airport measured with multi-temporal InSAR. Remote Sens. Environ. 2020, 248, 111976. [Google Scholar] [CrossRef]
- Chen, Y.; Wang, W. Surface deformation monitoring and analysis of Zhongchuan International Airport in Sentinel_1A time series. J. Eng. Geol. 2022, 30, 803–816. [Google Scholar] [CrossRef]
- Zhang, S. Time-Series InSAR for Stability Monitoring of Ankang Airport with Expansive Soil. Geomat. Inf. Sci. Wuhan Univ. 2021, 46, 1519–1528. [Google Scholar]
- Kudryavtsev, S.; Valtseva, T.; Bugunov, S.; Kotenko, Z.; Paramonov, V.; Saharov, I.; Sokolova, N. Numerical Simulation of the Work of a Low-Settlement Embankment on a Pile Foundation in the Process of Permafrost Soil Thawing. In Proceedings of the 4th International Scientific Conference on Transportation Soil Engineering in Cold Regions (TRANSOILCOLD), St. Petersburg, Russia, 20–23 May 2019. [Google Scholar]
- Li, X.; Kong, J.; Ding, X. Numerical simulation of high fill foundation settlement in Jiuzhai Huanglong Airport. J. Geomech. Geotech. Eng. 2005, 24, 2188–2193. [Google Scholar]
- Suining 2016 National Economic and Social Development Statistical Bulletin. Available online: https://www.cnstats.org/tjgb/201705/scsns-2016-ejn.html (accessed on 7 July 2022).
- Ma, L. Stability Analysis of High-Fill Slope at Suining Airport. 2013; Chengdu University of Technology: Chengdu, China, 2013. [Google Scholar]
- Pu, C.; Chen, Q. Temporal InSAR Monitoring of land subsidence distribution and its influencing factors in Yan’ a New Area. J. Wuhan Univ. 2020, 45, 1728–1738. [Google Scholar]
- Voigt, S.; Tetzlaff, A.; Zhang, J.; Künzer, C.; Zhukov, B.; Strunz, G.; Oertel, D.; Roth, A.; van Dijk, P.; Mehl, H. Integrating satellite remote sensing techniques for detection and analysis of uncontrolled coal seam fires in North China. Int. J. Coal Geol. 2004, 59, 121–136. [Google Scholar] [CrossRef]
- Yang, C.; Lv, S.; Hou, Z.; Zhang, Q.; Li, T.; Zhao, C. Monitoring of Land Subsidence and Ground Fissure Activity within the Su-Xi-Chang Area Based on Time-Series InSAR. Remote Sens. 2022, 14, 903. [Google Scholar] [CrossRef]
- Le, J.; Pu, C.; Wang, Y. Generalized Mool-Coulomb Model and its Implementation in FLAC3D. J. Railw. Sci. Eng. 2012, 9, 112–116. [Google Scholar] [CrossRef]
- Chen, Y.; Xu, D. FLAC/FLAC3D Foundation and Engineering Examples, 2nd ed.; China WaterPower Press: Beijing, China, 2013. [Google Scholar]


| Sensor | Path | Number of Images | Date Range |
|---|---|---|---|
| Sentinel-1A | 164 | 89 | May 2018–June 2021 |
| Date | Accumulated Subsidence (mm) | |||||
|---|---|---|---|---|---|---|
| Point | ||||||
| P1 | T07 | P2 | C04 | P3 | C13 | |
| 2020/09/14 | 0.00 | 0.00 | 0.00 | 0.00 | 0.00 | 0.00 |
| 2020/9/26 | −5.56 | −5.49 | −7.58 | −5.73 | −7.69 | −7.87 |
| 2020/10/08 | −11.66 | −13.90 | −18.51 | −12.02 | −18.34 | −14.54 |
| 2020/10/20 | −18.11 | −21.69 | −24.10 | −18.04 | −25.39 | −20.83 |
| 2020/11/01 | −18.44 | −29.00 | −25.30 | −24.51 | −28.40 | −27.22 |
| 2020/11/13 | −29.36 | −34.93 | −32.50 | −26.00 | −38.88 | −31.10 |
| 2020/11/25 | −38.07 | −39.10 | −35.75 | −29.36 | −40.63 | −35.18 |
| 2020/12/07 | −45.72 | −43.14 | −39.82 | −32.26 | −46.53 | −38.06 |
| 2020/12/19 | −50.37 | −46.99 | −44.32 | −34.44 | −46.71 | −40.86 |
| 2020/12/31 | −55.59 | −50.17 | −45.70 | −36.74 | −52.70 | −43.13 |
| 2021/01/12 | −53.94 | −52.02 | −46.43 | −39.37 | −52.13 | −46.11 |
| 2021/01/24 | −54.39 | −53.68 | −49.17 | −40.22 | −54.31 | −47.50 |
| 2021/02/05 | −63.76 | −55.73 | −50.98 | −41.86 | −59.37 | −49.09 |
| 2021/03/01 | −59.85 | −58.94 | −47.66 | −44.65 | −56.48 | −53.38 |
| 2021/03/13 | −62.03 | −60.84 | −47.77 | −46.24 | −60.10 | −54.24 |
| 2021/03/25 | −60.13 | −62.23 | −50.32 | −46.61 | −61.18 | −56.14 |
| 2021/04/06 | −61.55 | −63.67 | −48.21 | −47.88 | −61.07 | −57.60 |
| 2021/04/18 | −70.46 | −65.44 | −52.34 | −48.87 | −64.05 | −58.43 |
| 2021/04/30 | −62.58 | −67.46 | −39.32 | −49.72 | −51.72 | −59.28 |
| 2021/05/12 | −66.91 | −68.47 | −42.17 | −50.92 | −55.75 | −61.02 |
| 2021/05/24 | −59.00 | −70.28 | −36.45 | −52.07 | −52.01 | −62.20 |
| RMSE | ±4.72 (in P1) | ±7.17 (in P2) | ±6.23 (in P3) | |||
| RMSE | ±6.12 | |||||
| Parameter | Value | ||
|---|---|---|---|
| Bedrock | Silty Clay | Silty Mudstone | |
| Modulus of compression, Es (Mpa) | 500 | 4.0 | 45.0 |
| Poisson’s ratio, v | 0.2 | 0.35 | 0.25 |
| Cohesion, C(Kpa) | 40 | 36 | 70 |
| Internal friction angle, (°) | 40 | 15 | 35 |
| Nature bulk density (KN/m3) | 24.1 | 19.8 | 21.6 |
| Key Point | Subsidence (m) | ||||||
|---|---|---|---|---|---|---|---|
| Depth of Fill (m) | |||||||
| 0 | 5 | 10 | 15 | 20 | 25 | 27 | |
| Real point value | 0 | −0.081 | −0.226 | −0.243 | −0.292 | −0.368 | −0.393 |
| Point prediction value | 0 | −0.073 | −0.145 | −0.218 | −0.291 | −0.363 | −0.392 |
Publisher’s Note: MDPI stays neutral with regard to jurisdictional claims in published maps and institutional affiliations. |
© 2022 by the authors. Licensee MDPI, Basel, Switzerland. This article is an open access article distributed under the terms and conditions of the Creative Commons Attribution (CC BY) license (https://creativecommons.org/licenses/by/4.0/).
Share and Cite
Wang, T.; Zhang, R.; Zhan, R.; Shama, A.; Liao, M.; Bao, X.; He, L.; Zhan, J. Subsidence Monitoring and Mechanism Analysis of Anju Airport in Suining Based on InSAR and Numerical Simulation. Remote Sens. 2022, 14, 3759. https://doi.org/10.3390/rs14153759
Wang T, Zhang R, Zhan R, Shama A, Liao M, Bao X, He L, Zhan J. Subsidence Monitoring and Mechanism Analysis of Anju Airport in Suining Based on InSAR and Numerical Simulation. Remote Sensing. 2022; 14(15):3759. https://doi.org/10.3390/rs14153759
Chicago/Turabian StyleWang, Ting, Rui Zhang, Runqing Zhan, Age Shama, Mingjie Liao, Xin Bao, Liu He, and Junyu Zhan. 2022. "Subsidence Monitoring and Mechanism Analysis of Anju Airport in Suining Based on InSAR and Numerical Simulation" Remote Sensing 14, no. 15: 3759. https://doi.org/10.3390/rs14153759