Article

Future Risk of Tourism Pressures under Climate Change: A Case Study in the Three-River-Source National Park

Institute of Geographic Sciences and Natural Resources Research, Chinese Academy of Sciences, Beijing 100101, China
*
Author to whom correspondence should be addressed.
Remote Sens. 2022, 14(15), 3758; https://doi.org/10.3390/rs14153758
Submission received: 29 June 2022 / Revised: 31 July 2022 / Accepted: 3 August 2022 / Published: 5 August 2022
(This article belongs to the Topic Climate Change and Environmental Sustainability)

Abstract

:
Tourism is considered one of the main sources of pressure on the global ecosystem, which is being increasingly affected by climate change. Few studies have evaluated the spatial patterns of tourism pressure that ecosystems will suffer under the changing climate in the future. Considering the Three-River-Source National Park, China, as the study area, we applied statistical and remote sensing techniques to examine the spatial pattern of the risk of tourism pressure in 2070 and 2100 under two climate scenarios: the representative concentration pathway of radiative forcing levels of 8.5 W/m2 (RCP8.5) and RCP4.5. The results indicate that regions at high risk of tourism pressure in the study area will expand in the future. Areas with a high risk of tourism pressure in 2100 under the RCP8.5 scenario accounted for 6.75% of the entire study area, with the largest area under impact being in the Lancang-River-Source Park, accounting for 20.61% of the sub-park. The distribution density of areas with a high risk of tourism pressure in 2100 is also the highest under RCP8.5 (5.3 points/km2), and the average density of Lancang-River-Source Park will be the highest (16.58 points/km2) among the three sub-parks, suggesting that larger areas of the Three-River-Source National Park will face an increased risk of tourism pressure in the context of future climate change, with the greatest change poised to be in the Lancang-River-Source Park. Tourism pressure management strategies must be implemented in these areas with an increased risk of tourism pressure. This study provides useful insights for managing tourism pressures and improving adaptability under climate change.

Graphical Abstract

1. Introduction

Climate change, characterized by warming, has affected every region of the planet in several ways, and changes in human experience will intensify with continued global warming [1,2]. The global average surface temperature in 2011–2020 was 1.09 ℃ higher than that in pre-industrialization (1850–1900), and in 2001–2020 was 0.99 °C warmer than that in pre-industrialization (IPCC, 2021). Moreover, global warming is expected to reach or exceed 1.5 °C in the next 20 years, with climate change-related risks to humans and ecosystems further increasing [3].
Intensified climate change has significantly affected recreational ecosystem services (RES) [4,5]. RES is the non-material benefit people derive from ecosystems through recreational activities [6,7]. The delivery of RES refers to the ability of an ecosystem to support aesthetic experiences, outdoor recreation opportunities, and a suitable tourism climate [6,8,9]. Climate change affects the RES delivery by changing natural resources, visual landscapes, and the climatic suitability of tourism [10,11].
Changes in RES due to climate change affect the composition of visitors [12] since different tourists have different preferences for the delivery of RES. Environmental concerns have been proven as one of the factors influencing visitor preferences for RES. Tourists with different environmental concerns tended to have different RES preferences. Generally, environmentally friendly tourists hold higher value for natural resources than non-environmentally friendly tourists do [13]. Tourists with a high moral obligation to the environment (who generally feel most morally obliged to behave in an environmentally friendly manner) are more enthusiastic towards natural beauty and aesthetics [14]. Environmentally-friendly tourists pay more attention to natural aesthetic experiences than individual physical comfort. They are often willing to travel to areas to appreciate natural beauty even when the destination has less comfortable climates [15].
In contrast, non-environmentally friendly tourists have a lower tolerance for uncomfortable natural conditions; they focus on personal comfort and prefer to carry out recreational activities under comfortable climatic conditions [16]. Consequently, the composition of visitors formed by regions with different RES delivery structures is different. It can be seen that as the RES changes under global warming, the composition of the visitor may also vary. For example, as the aesthetic quality of natural landscapes declines, the amount of environmentally friendly tourists, who are nature lovers, is likely to be significantly reduced [14].
Climate change-driven alterations in visitor composition may adversely affect the ecosystem [4]. However, only a few studies have reported the related findings [12,17], and these studies did not consider the spatial distribution of tourism pressure derived from the impacts of changing visitor compositions on the ecosystem. Different spaces suffer different tourism pressures since the changes experienced by them are different. Identifying areas with a high risk of tourism pressures can help provide spatial information for decision-making on improving adaptability and reducing vulnerability to climate change. As climate change is projected to significantly impact recreational ecosystem services under the scenarios of the Intergovernmental Panel on Climate Change (IPCC) [18], it is necessary to study the spatial pattern of tourism pressure under climate change.
This study aims at revealing the spatial pattern of the risk of the tourism pressure as a result of alteration in RES delivery and tourist composition under two climate change scenarios proposed by IPCC, namely the representative concentration pathway of radiative forcing levels of 8.5 W/m2 (RCP8.5) and RCP4.5. We compared the spatial patterns for 2070 (2041–2070) and 2100 (2071–2100). The Three-River-Source National Park was used as the study area, and a combination of statistics and remote sensing techniques was used for the empirical analysis.
This paper has the following structure: In Section 2, we review related work. In Section 3, we introduce our methodological approach. In Section 4, we describe the results of our analysis. In Section 5, we discuss those results and derive a future research and management agenda. Finally, in Section 6, the implications of the findings are briefly summarized, and the limitations of our approach are mentioned.

2. Literature Review
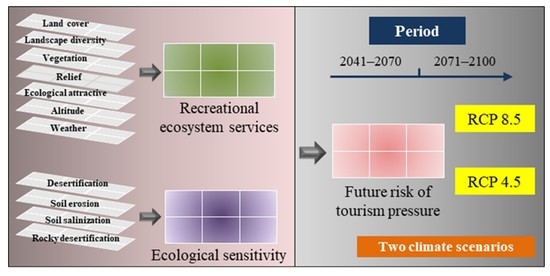
The impacts of climate change on RES delivery and its related ecological risk have been examined previously (Table 1). Climate change has led to a decline in RES delivery to certain regions. For example, Mameno et al. [10] studied a mountainous national park in Japan and found that climate change substantially deteriorated visitors’ perceived aesthetic benefits from alpine landscapes. Webster et al. [19] revealed that as a result of rising seas, coral reef bleaching along the Great Barrier Reef in Australia has drastically reduced the aesthetic quality of this region. Oliveira et al. [20] reported on water quality degradation in Ubatuba, Brazil, due to climate change, which reduced the ability of ecosystems to provide water-based recreational opportunities. In contrast, climate change has enhanced RES delivery in certain areas. For instance, climate change has led to warmer temperatures at higher latitudes and cooler regions, gradually increasing the suitability of these areas to tourism, such as in the Nordic countries [21]. Warming has also accelerated sea ice melting at high latitudes, resulting in optimized sailing conditions for cruise vessels on the Antarctic Peninsula and an improved ability to provide recreational opportunities.
Changes in RES delivery alter the composition of tourists, leading to challenges and ecological risk at tourists destination. However, few studies have reported on this topic. Coombes et al. [12] and Coombes and Jones [17] studied the changes in the types of beach tourists in the UK under climate change and suggested that increasing temperatures will lead to an increase in the number of sunbathers and a decrease in the number of bird watchers. They analyzed the impact of this change on local vegetation coverage, vegetation diversity, and the number of sword plovers, emphasizing that sword plovers may be under greater tourism pressure in the future. This study emphasized the importance of considering the ecological risk generated by the impacts of climate change on tourists. However, the spatial distribution of such risk has not been extensively evaluated.

3. Methodology

3.1. Study Area

The Three-River-Source National Park is located on the Qinghai-Tibet Plateau, with an average altitude of over 4500 m (Figure 1), covering a total area of 12.31 × 10⁴ km2 between 89°50′57″E–99°14′57″E, 32°22′36″N–36°47′53″N. It contains three sub-parks, namely the Yangtze-River–Source Park, the Yellow-River–Source Park, and the Lancang-River–Source Park, and four counties, namely Maduo, Zhiduo, Zaduo, and Qumalai.
The Three-River-Source National Park was the focus of this study due to its ecological attractiveness, the high importance and sensitivity of the ecosystem, and the significant impacts of climate change. The Three-River-Source National Park has many ecotourism attractions, including the source of the three Rivers (the Lancang River, Yangtze River, and Yellow River), the world natural heritage Hoh Xil, the Kunlun Mountains, Zhaling Lake, and Eling Lake. These ecological resources have attracted increasing numbers of tourists to the park [22]. For example, in 2015, the number of visitors to Maduo was 54.2, an increase of 28.02% from 2014 [23]. The core areas in the Three-River-Source National Park (Figure 1) were forbidden from carrying out recreational activities [24]. Thus, the core areas were excluded from the study area. Such regions account for 73.55% of the Three-River-Source National Park, occupying 83.64% of the Yangtze-River-Source Park, 45.13% of the Yellow-River-Source Park, and 46.54% of the Lancang-River-Source Park.
The ecosystem of the Three-River-Source National Park is highly sensitive. The park is where the Yangtze, Yellow, and Lancang-Mekong Rivers originate, and their waters sustain farms and cities across Asia. Maintaining the ecosystem health of this park is crucial for 4.5 billion people in Asia [25]. However, the ecosystem of this park is sensitive to human activity. Inappropriate human activities may cause serious ecological problems such as desertification, soil erosion, soil salinization, and rocky desertification [26,27]. As the number of tourists increases, the adverse effects of tourism on ecosystems become more pronounced, and studies on tourism pressure on ecosystems have been emphasized [28,29,30,31].
Moreover, the Three-River-Source National Park shows a noticeable trend of rising temperatures, which significantly affect local ecosystems and ecotourism attractions [32,33]. These changed attractions may have far-reaching influences on local tourism development. Considering that climate change will intensify further, studying the spatiotemporal patterns of tourism pressure under future climate change scenarios is necessary.

3.2. Analytic Framework

We predicted the risk of tourism pressure in 2070 and 2100 under two climate scenarios [34]: (1) RCP8.5, which does not apply any mitigation policy to human greenhouse gas emissions, reaching a global radiative forcing of about 8.5 Wm−2 by the end of the century. Under RCP8.5, warming of 2 °C is attained by mid-century, eventually exceeding 3 °C by 2100; and (2) RCP4.5, which does impose stringent mitigation measures and thus limits the forcing to approximately 4.5 Wm−2. The global mean temperature is projected to reach approximately 2 °C above its 1986–2005 baseline value at the end of the 21st century under RCP4.5.
The analytical framework includes three steps (Figure 2). First, we analyzed the RES salience of different types of tourists and measured the delivery of RES for different types of tourists using statistical methods. Second, we calculated the delivery of RES under two climatic scenarios by applying remote sensing and statistical techniques. Areas with a high risk of tourism pressure were identified based on the delivery of RES and ecological sensitivity. Finally, the spatial patterns of the areas with an increased risk of tourism pressure were analyzed using spatial statistical methods.

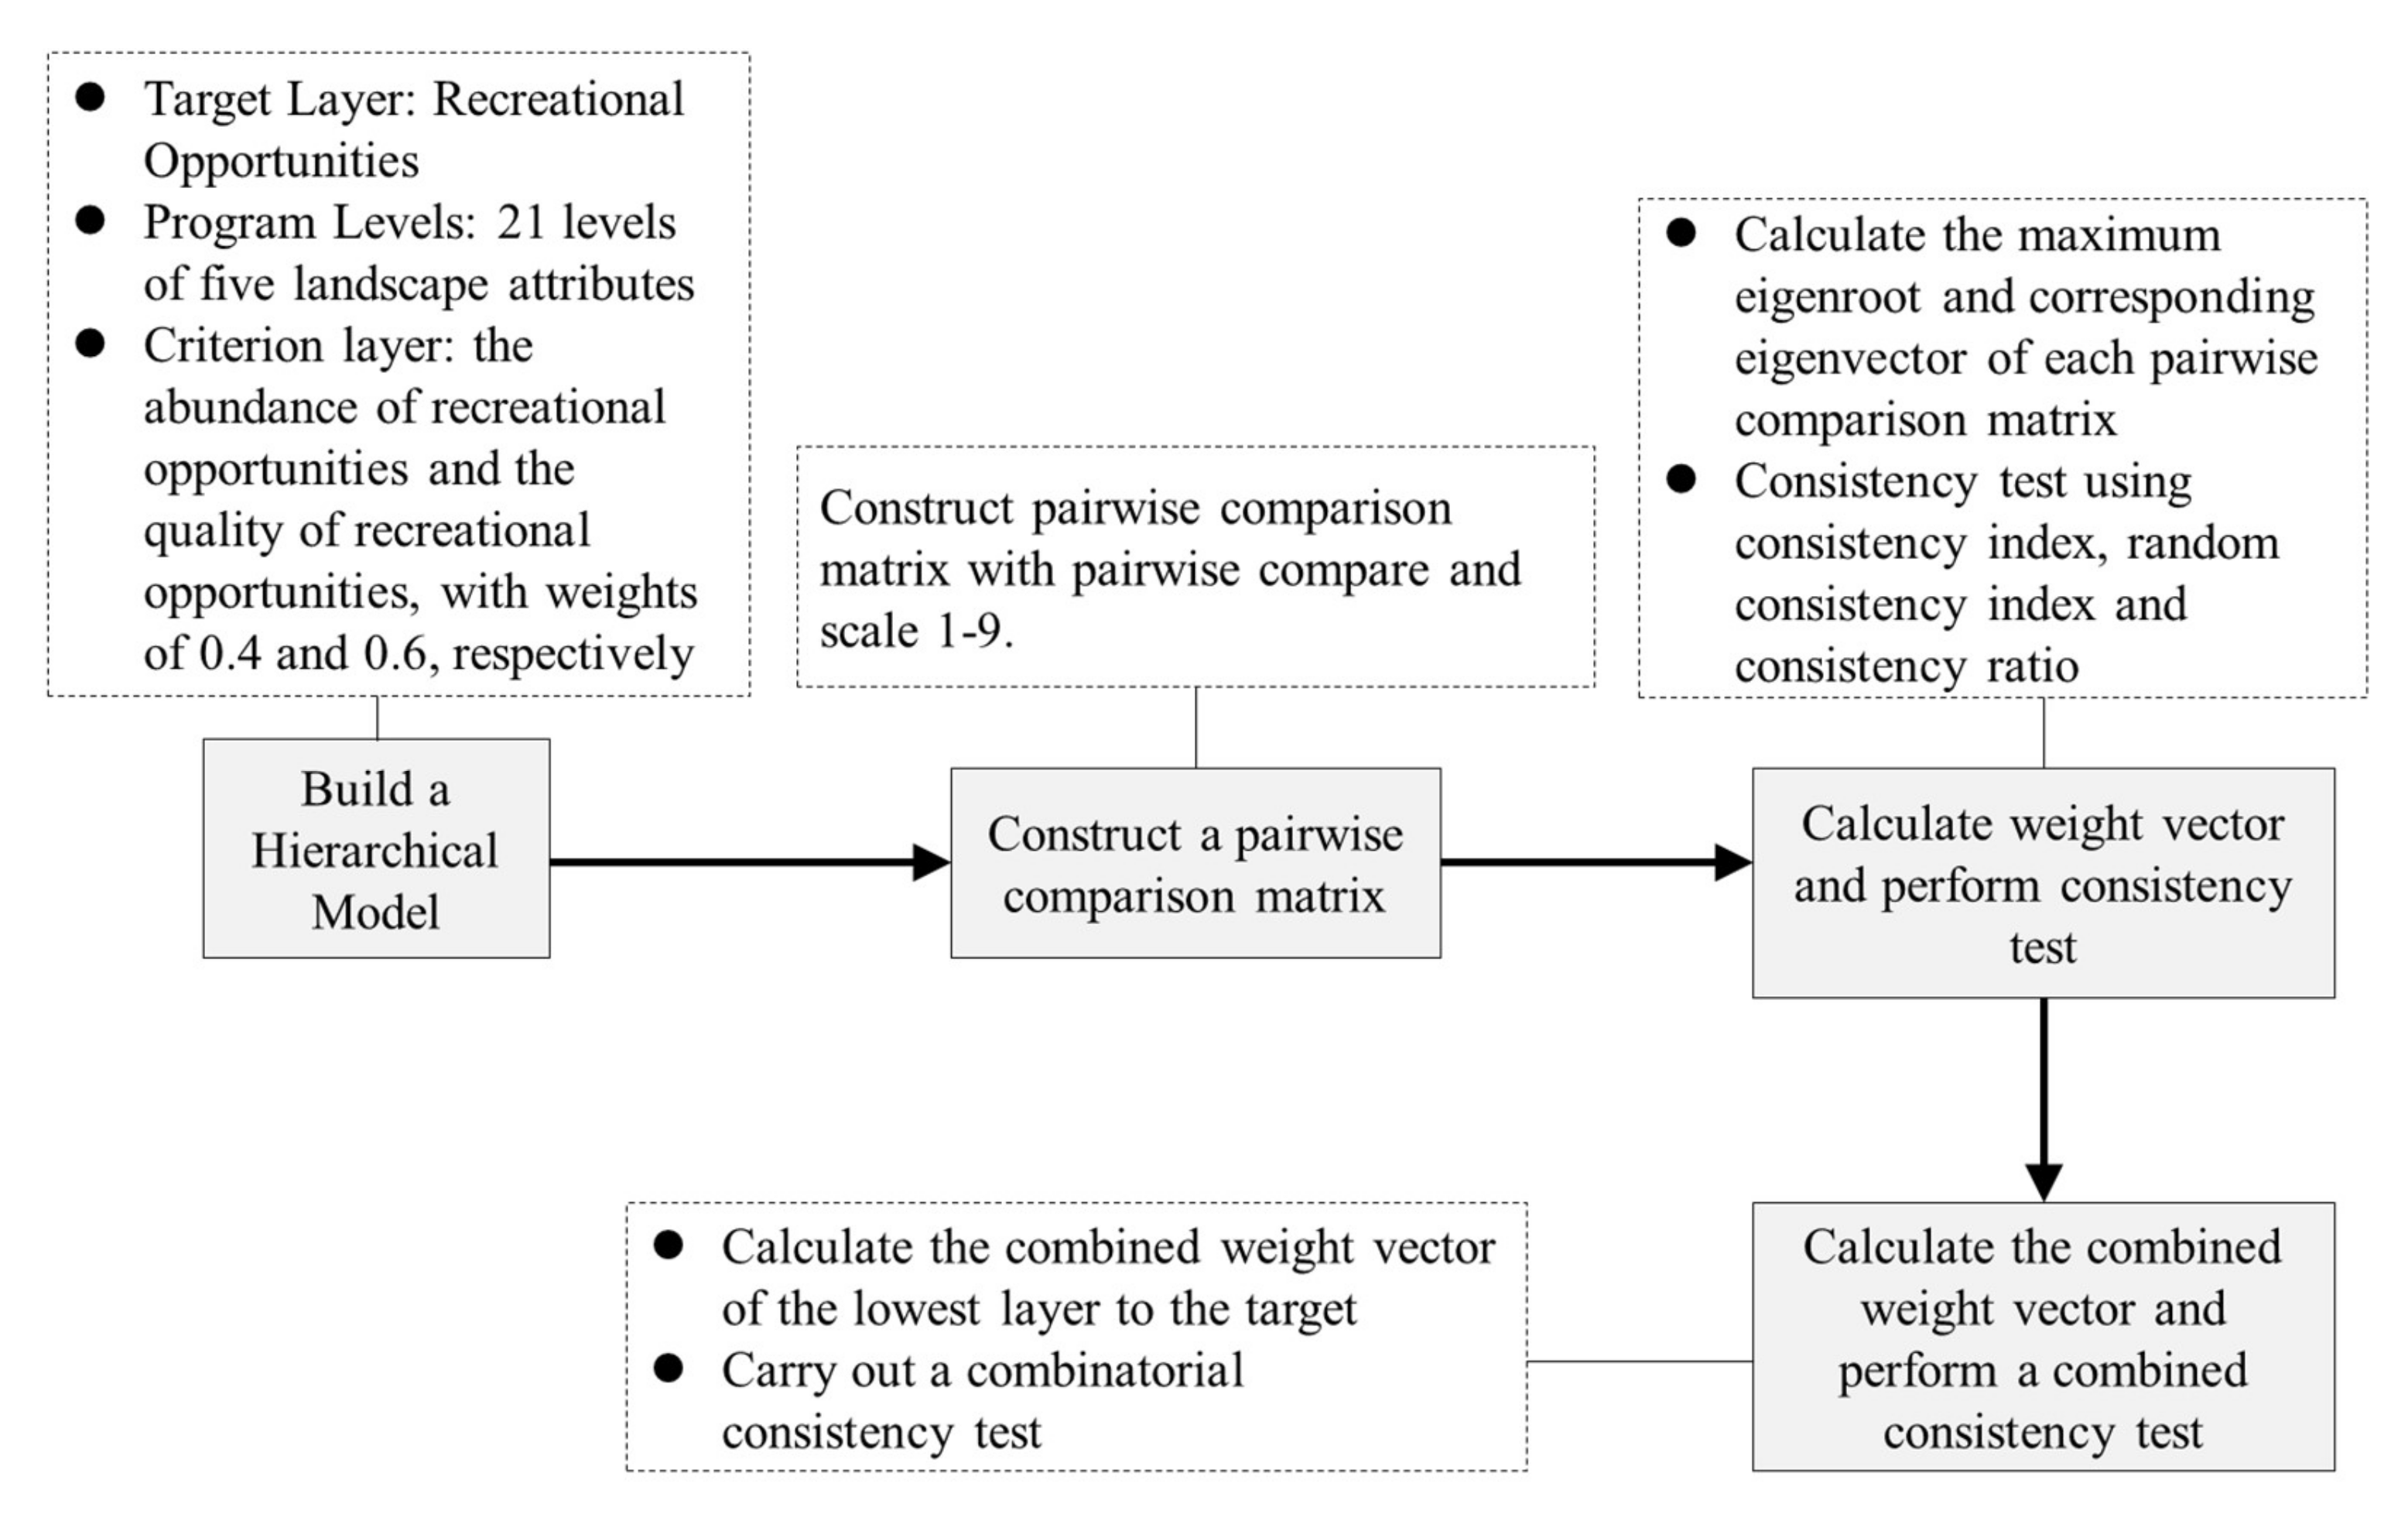
3.2.1. Step 1: Assessing the Delivery of RES Based on the Type of Tourists

This step aimed to measure the delivery of RES to different tourists with different environmental concerns (environmentally friendly tourists vs. non-environmentally friendly tourists). The data required for this step included the environmental concerns and RES salience of tourists, which were collected through questionnaires that included 14 items (Appendix A). Environmental concern was investigated with five items derived from the New Ecological Paradigm Scale, which has been proven to identify environmentally friendly and non-environmentally friendly tourists [35,36]. RES salience was measured through nine items adjusted from the study of Jeuring (2017) [37], and each kind of RES delivery was measured through three items (Appendix A). The questionnaire data were collected through an on-site survey in the Three-River-Source National Park. The survey was conducted from August to October 2019 using convenience sampling [38]. Seven hundred questionnaires were distributed, and 509 valid questionnaires were returned, having a response rate of 72.7%.
The data were processed as follows. First, mclust (model-based clustering) and k-means clustering methods were applied to distinguish environmentally friendly tourists from non-environmentally friendly tourists according to their environmental concerns. Second, factor analysis was used to analyze the RES salience of environmentally friendly and non-environmentally friendly tourists. Finally, the weights of the three kinds of RES delivery (aesthetic, outdoor recreation opportunities, and suitable environment) were calculated. Specifically, the mean value of the measurement items of the three kinds of RES delivery were calculated, and the mean value of each type was divided by the sum of the three mean values of the three kinds and the weight of each kind of RES delivery of RES. All of the results of the data pre-processing are presented in Appendix B.
According to the results of the data pre-processing, the delivery of RES for environmentally friendly tourists and non-environmentally friendly tourists was assessed using the following formulas:
R F V i = 0.507 A i + 0.191 O i + 0.302 E i ,
R N F V i = 0.335 A i + 0.187 O i + 0.478 E i ,
where R F V i is the RES of the unit i for environmentally friendly tourists, and R N F V i is the RES of unit i for non-environmentally friendly tourists. A i is the aesthetic quality of unit i, O i is the outdoor recreation opportunities of unit i, and E i is the suitable environment for unit i. The calculation of the A i ,   O i ,   and   E i were calculated using the following formulas:
A i = j = 1 5 a i j ,
O i = j = 1 5 o i j ,
  E i = j = 1 2 e i j ,
where the a i j is the ability of various ecosystem elements to support the aesthetic experience of unit i, j is the number of elements, referring to land cover type, landscape diversity, vegetation, relief, and ecologically attractive sites. o i j is the ability of various ecosystem elements to provide outdoor recreation opportunities of unit i, j is the number of elements, referring to land cover type, landscape diversity, vegetation, relief, and ecologically attractive sites.   e i j is the ability of various ecosystem elements to provide a suitable tourism environment for unit i, j is the number of elements referring to altitude and weather. The following sections detail the elements, and the data sources are presented in Table 2.
  • Land cover type: Land cover type affects aesthetic and outdoor recreation [39,40]. Generally, natural land cover, such as forests and water bodies, has a high aesthetic value. Conversely, the types of land with higher human interference, such as industrial and mining land, and residential areas, have lower aesthetics. Land-cover type also influences the suitability of recreational activities. For example, grasslands are more suitable for grass skiing and horse riding, whereas wetlands are more suitable for watching and rowing birds. This study adopted the land cover type scheme proposed by Xu et al. (2008) [41]. According to this scheme, the Three-River-Source National Park identified six types of land cover: forest, grassland, water and wetland, farmland, desert, and others.
  • Landscape diversity: More diverse landscapes are perceived as recreational and visually attractive [42], appealing to a wider variety and a larger number of visitors [43]. Landscape diversity can be measured using land cover diversity [43]. The landscape diversity index was calculated using Focus Statistics in ArcGIS 10.2 software, with a rectangular window of “3 × 3” size and a statistical type of “variety” as used by Tang and Yang (2012) [44] was employed.
  • Vegetation: Areas with more vegetation usually have healthy ecosystems and natural environments and are often considered attractive by visitors [45,46,47,48]). Vegetation conditions can be measured using the Normalized Difference Vegetation Index (NDVI), which reflects plant growth and vegetation coverage and has become popular in recreation potential assessments [48].
  • Relief is a macroscopic index describing the topographic features of a region and referring to the difference between the elevation of the highest and lowest point in a specific area. On the one hand, terrain relief impacts the aesthetic experience. Generally, moderately undulating terrain is beneficial for increasing beauty [49]. On the other hand, as terrain relief changes, opportunities for participation vary. For example, for most tourists, the number of participation opportunities provided by flat land is relatively large, and the number of participation opportunities provided by the undulating mountains is relatively small. The relief calculation was based on the methods proposed by Feng et al. (2007) [50] and Hao and Ren (2009) [51]. The specific formula used is as follows:
    R = max H m i n H × 1 P A / A / 500 ,
    The R is relief, max(H) and min(H) represent the highest and lowest elevations in the area (in m), P(A) represents the flatland area, that is, the area with a slope of less than 5°, A represents the total surface area. The window size setting in the neighborhood analysis was based on Tang and Yang (2012) [44].
  • Ecological attractive sites refer to specific objects that can attract visitors, and the concentrated areas of attractions often have a high potential to develop ecotourism [52]. The Three-River-Source National Park has many ecotourism attractions, including unique geological landforms, rivers, lakes, and wild animals. Kernel density was applied to measure the density of attraction distribution, and max-min normalization was performed to obtain the index of ecotourism attraction for each spatial unit.
  • Altitude is an important factor affecting the preference, comfort, and safety of visitors [53], especially in high-altitude destinations. Altitudes above 2000 m can lead to altitude sickness, and altitudes above 5000 m will cause severe altitude sickness, which is not conducive to recreational activities [54]. Thus, for the Three-River-Source National Park, which has an average altitude higher than 4500 m, altitude is critical to its recreational potential. The lower the altitude, the more favorable the RES utilization. The altitude of each unit space unit was divided by the minimum altitude in that area and the normalized value of max-min.
  • Weather: The importance of weather and climate for recreation has long been emphasized and measured through various indices [55]. The tourism climatic index (TCI) proposed by Mieczkowski (1985) [56] is a well-established index that has been applied in North America [57], Australia [58], Spain [59], South Africa [60,61], Sypruce [62], DPR Korea [63] and Namibia [64]. This study used TCI to measure weather and climate, which was calculated following Mieczkowski (1985), using the following equation:
    T C I = 8 C I D + 2 C I A + 4 R + 4 S + 2 W
    where CID is the daytime comfort index (consisting of maximum daily temperature and minimum daily relative humidity), CIA is the daily comfort index (consisting of mean daily temperature and daily relative humidity), R is the precipitation, S is the daily sunshine, and W is the wind speed. Finally, the TCI was normalized to 0–1, where 1 represented the most suitable climatic conditions for recreation.
The ability of each element to deliver the corresponding kind of RES was assessed by applying a pairwise comparison and analytic hierarchy process, which are presented in Appendix C. The value ranges of a i j ,   o i j   a n d   e i j   is 0–1. Thus, the value ranges of   A i , O i , and E i are 0–5, 0–5, and 0–2, respectively.
Table 2. Datasets for the delivery of RES.
IndicatorsDatasetsOriginal FormatsData Sources and Pre-Processing
Altitude, reliefDEMRasterFrom the International Scientific Data Mirror Website of the Computer Network Information Center of the Chinese Academy of Sciences (http://www.gscloud.cn/ (accessed on 12 March 2022)), with a resolution of 90 m.
VegetationNDVIRasterMODIS-NDVI data comes from the website of the National Aeronautics and Space Administration NASA (https://modis.gsfc.nasa.gov/ (accessed on 15 March 2022)), with a resolution of 250 m. The maximum synthesis method is used to process the NDVI data from April to October 2020 to eliminate cloud interference, atmosphere, and other factors.
Land typeLand coverRasterFrom the Resource and Environment Data Center of the Chinese Academy of Sciences (http://www.resdc.cn/ (accessed on 16 March 2022)). The data is obtained based on Landsat TM remote sensing images acquired in 2020 and human interactive visual interpretation, with a resolution of 100 m.
Landscape diversity
Ecological attractive sitesEcotourism attractionPoint shapefileBased on the data provided by National Catalogue Service for Geographic Information [65] and combined with field investigation, we sorted out 2412 ecotourism attraction points, including mountains, lakes, memorial sites, and historic sites.
Weather Meteorological data StatisticsFollowing Li et al. (2006) [66] and Yi et al. (2011) [67], the data of 11 meteorological stations in the Three-River-Source area was used, namely Wu Daoliang, Xinghai, Tuotuohe, Zaduo, Qumarai, Yushu, Maduo, Qingshuihe, Dari, Jiuzhi, and Nangqian. Since the Three-River-Source area is only suitable for humans to develop recreational activities in the warm season, the daily data from June to September 2020 are selected. The meteorological variables included the maximum daily temperature, daily average temperature, minimum daily relative humidity, daily average relative humidity, precipitation, average daily sunshine time, and wind speed. The meteorological data of surface weather stations are all from the China Meteorological Science Data Sharing Service Network (http://cdc.cma.gov.cn/ (accessed on 30 March 2022)). First, the meteorological data of 11 meteorological stations are sorted daily, and the missing data of individual stations is interpolated by applying the linear regression method [67]. Then, the ANUSPLIN software was used to generate spatial meteorological data.

3.2.2. Step 2: Predicting RES Delivery under Climate Change Scenarios

This step aimed to predict the delivery of RES according to the changed elements under RCP8.5 and RCP4.5, using statistics and remote sensing techniques. The changed elements included land cover type, landscape diversity, and weather (or TCI).
The TCI under RCP8.5 and RCP4.5 were measured by applying the simulated meteorological data obtained from the Coupled Model Inter-comparison Project Phase 5 (https://nex.nasa.gov/nex/projects/1356/ (accessed on 5 April 2022)). Based on simulated meteorological data, the land cover type was predicted according to Yue et al. (2016) [68], Fan et al. (2011) [69], Yue (2011) [70], and Li et al. (2014) [71]. The formula used is as follows:
L P x ,   y k ,   t + 1 = L P x ,   y k ,   t × 1 2 1 + H L Z P x ,   y k , t + 1 H L Z P x ,   y k , t H L Z P x ,   y k , t + 1 + H L Z P x ,   y k , t
L C x ,   y k ,   t + 1 = V a l u e k m a x L P x ,   y k ,   t + 1  
where   x   and   y are the grid cell locations, k is the land cover type, and k = 1, 2, 3,…, 6, t represents the period ( t = 2020, 2070, and 2100). H L Z P x ,   y k ,   t is the probability of land cover type k corresponding to the Holdridge life zone (HLZ) of grid cell x ,   y in period t , L P x ,   y k ,   t represents the probability of land cover type k in grid cell x ,   y in period t , L P x ,   y k ,   t satisfies k = 1 6 L P x ,   y k ,   t = 1 . L P x ,   y k ,   t + 1 is the transition probability of land cover type k in period t + 1 , that is, the probability of occurrence of type k in this grid cell. Following the model simulation approach of Li et al. (2014) [71], land cover type raster data of future climate change scenarios were finally obtained. The climate data used to simulate the future scenarios of land cover included the mean air temperature, mean precipitation, and potential evapotranspiration ratio during the 1991—2020 period at a resolution of 1 × 1 km obtained through High Accuracy Surface Modeling simulation [70] based on data from 11 meteorological observation stations in the Three-River-Source National Park [66,67].
Landscape diversity, aesthetic quality, and outdoor recreation opportunities were calculated based on the simulation of the land cover type. Therefore, although Formulas (1) and (2) were used in Step 1, the delivery of RES for environmentally friendly tourists and non-environmentally friendly tourists was obtained in 2070 and 2100 under RCP8.5 and RCP4.5.

3.2.3. Step 3: Identifying the Areas with a High Risk of Tourism Pressure

This step aimed to identify the areas with an increased risk of tourism pressure by combining tourists’ composition and ecological sensitivity. First, we calculated the tourist composition index according to the RES delivery for environmentally friendly and non-environmentally friendly tourists. The formula used is as follows:
T C i = R N F V i / R F V i ,
T C i is the index of tourists’ composition in unit i. If T C i > 1 , it reflects that the R N F V i is higher than R F V i , indicating that the tourists’ composition tends to be dominated by non-environmentally friendly tourists. In contrast, if T C i < 1 , it indicates that the tourists’ composition tends to be dominated by environmentally friendly tourists.
Second, we calculated the ecological sensitivity of unit i using the following formula:
E S i = m a x S D , S E , S S , S R ,
where   E S i is the ecological sensitivity of unit i,   S D i is the sensitivity of desertification of unit i,   S E i is the sensitivity of soil erosion of unit i, S S i is the sensitivity of soil salinization of unit i, S R i is the sensitivity of rocky desertification of unit i. The sensitivity index ranges from lowest (1) to highest (5). Data on the sensitivity of desertification, soil erosion, soil salinization, and rocky desertification were derived from the China Ecosystem Assessment and Ecological Security Pattern Database (https://ecosystem.csdb.cn/ (accessed on 17 May 2022)). Finally, unit i with   T C i > 1 and E S i > 3 is defined as areas with a high risk of tourism pressure. The kernel density approach was used to analyze the distribution of areas with a high risk of tourism pressure.

4. Results

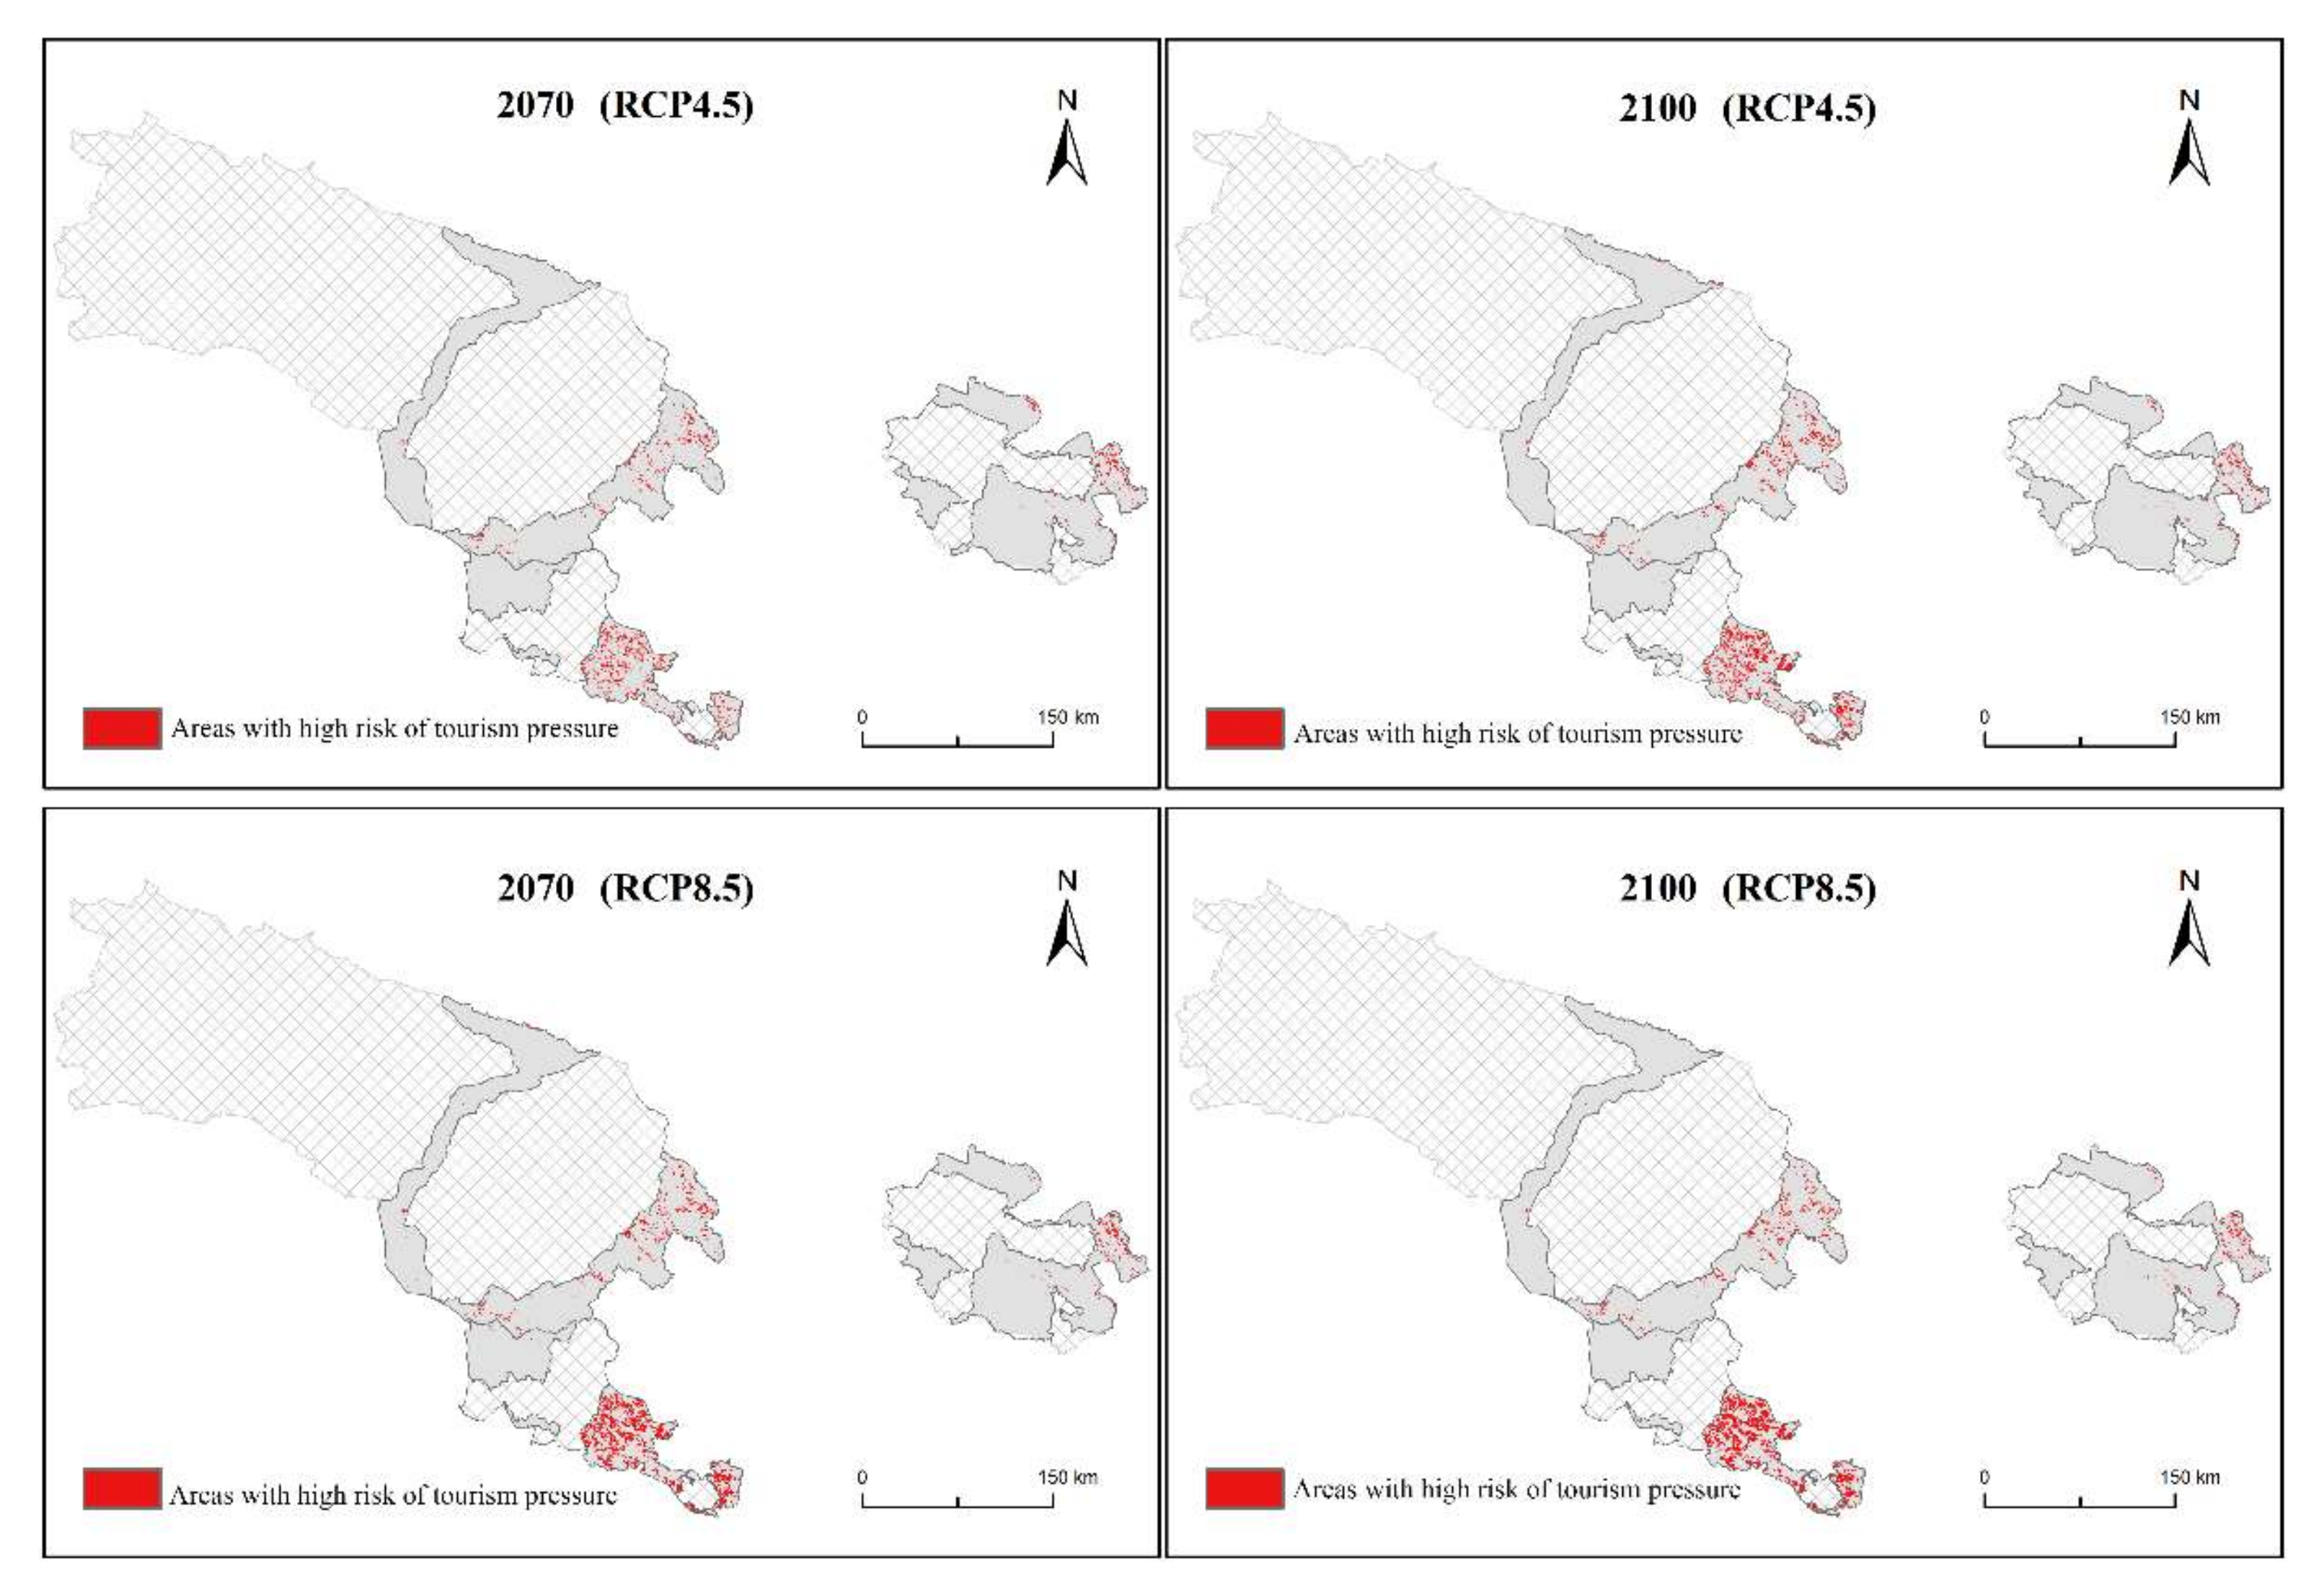
4.1. The General Changes of Areas with a High Risk of Tourism Pressure

Compared with RCP4.5, the areas with a high risk of tourism pressure are larger under RCP8.5 (Figure 3). In 2070, the areas with a high risk of tourism pressure under RCP8.5 accounted for 6.32% of the total area, which was 1.7 times that of RCP4.5. In 2100, the areas with a high risk of tourism pressure accounted for 6.75% of the total area under RCP8.5, 1.3 times that of RCP4.5.
The distribution density of areas with a high risk of tourism pressure is higher under RCP8.5 (Figure 4) than under RCP4.5. In 2070, the average density of areas with a high risk of tourism pressure under the RCP8.5 is 4.9 points/km2, which is 1.7 times that under the RCP4.5. In 2100, the average density of areas with a high risk of tourism pressure under the RCP8.5 is 5.3 points/km2, 1.3 times that under the RCP4.5.
The spatial aggregation of areas with a high risk of tourism pressure is higher under RCP8.5. Specifically, under RCP8.5, the spatial differences in the distribution densities of areas with a high risk of tourism pressure are larger. In 2070, the coefficient of variation of the density of areas with a high risk of tourism pressure under the RCP8.5 scenario was 1.9, which was 1.09 times that of the RCP4.5. In 2100, the coefficient of variation of the density of areas with a high risk of tourism pressure under RCP8.5 was 2.0, which was 1.11 times that of RCP4.5.
Figure 4 shows that the areas with a high risk of tourism pressure under RCP8.5 are mainly concentrated in the central and southern parts of the Lancang-River-Source Park. In addition, the east of the Yangtze-River-Source Park and the northeast of the Yellow-River-Source Park also formed a gathering area. These clusters were larger than those formed under RCP4.5. The agglomeration area of RCP4.5 in 2100 was significantly larger than that in 2070, mainly distributed east of the Lancang-River-Source Park and Yangtze-River-Source Park. Consider the eastern part of the Lancang-River-Source Park as an example. In 2070, the density of areas with a high risk of tourism pressure was mainly between 10 and 15 points/km2. By 2100, the distribution density of areas with a high risk of tourism pressure will be mostly above 20 points/km2.
Fewer regions experienced changes in risk type under RCP8.5 compared to RCP4.5 (Figure 5), indicating high stability of the risk type. In RCP8.5, 6.01% of the total land area was in a high-risk state from 2070 to 2100, and such areas accounted for 3.36% in RCP4.5. The risk type was more dynamic in RCP4.5. From 2070 to 2100, the risk type of land with 2.03% of the total area changed. Among them, 86.37% of the areas changed from non-high-risk to high-risk. The dynamic degree of the risk type in scenario RCP8.5 scenario is low. From 2070 to 2100, there was a change in the risk type of 1.05% of the total land area. Among them, 70.46% of the areas changed from non-high-risk to high-risk. This shows that most regions in which the risk type has changed are transformed from non-high-risk to high-risk. From 2070 to 2100, newly added high-risk areas are mainly distributed in the middle of the Lancang-River-Source Park. In addition, new high-risk areas also appeared northeast of the Yellow-River-Source Park and east of the Yangtze-River-Source Park.
In summary, under the RCP8.5 scenario in 2100, the Three-River-Source National Park has large areas with a high risk of tourism pressure (6.75% of the total area). It has the highest distribution density (average of 5.3 points/km2), with a high degree of aggregation (coefficient of variation is 2.0). Under the RCP8.5 scenario, the area where risk-type changes occurred was smaller. The areas that experience risk changes are dominated by the transition from non-high-risk areas to high-risk areas.

4.2. The Changes of Areas with High Risk of Tourism Pressure in Each Sub-Park

Among the three sub-parks, Lancang-River-Source Park has the largest internal area with a high risk of tourism pressure compared to the other two sub-parks (Table 3). This is especially evident in 2100 under RCP8.5. At this time, the areas with a high risk of tourism pressure inside the Lancang-River-Source Park accounted for 20.61% of the total area of the entire sub-park. The areas with a high risk of tourism pressure inside the Lancang-River-Source Park are 3.47 times that of the Yangtze-River-Source Park and 6.50 times that of the Yellow-River-Source Park.
The expansion of areas with a high risk of tourism pressure inside the Lancang-River-Source Park is the largest among the three sub-parks. From 2070 to 2100, the increase under RCP4.5 (53.51%) is higher than that under RCP8.5 (11.72%). The Yangtze-River-Source Park also showed a larger increase under RCP4.5. However, under scenario RCP8.5, the area with a high risk of tourism pressure in the Yangtze-River-Source Park shrinks. In contrast, the Yellow-River-Source Park slightly decreases under RCP4.5 but shows a slight increase under RCP8.5.
The density of areas with a high risk of tourism pressure is the highest in the Lancang-River-Source Park, especially in 2100 under RCP8.5. At this time, the average density of areas with a high risk of tourism pressure inside the Lancang-River-Source Park is 6.73 times that of the Yangtze-River-Source Park and 9.99 times that of the Yellow-River-Source Park. From 2070–2100, this density showed a larger growth rate, and the growth under RCP4.5 (55.11%) was higher than that under 8.5 (14.13%).
The spatial difference in the density of areas with a high risk of tourism pressure is the largest in the Yellow-River-Source Park. Moreover, this spatial difference in the Yellow-River-Source Park shows an increasing trend from 2070 to 2100, and its growth under RCP4.5 (1.99%) is higher than that under RCP8.5 (1.63%). Under RCP4.5, the spatial differences between the Yangtze River–Source Park and the Lancang-River-Source Park show a downward trend. However, under RCP8.5, the spatial differences between the Yangtze-River-Source and Lancang-River-source parks show an increasing trend.
The change in risk types in the Lancang-River-Source Park is the most dynamic among the three sub-parks (Figure 6), especially under RCP4.5. At this time, the dynamic degree of the Lancang-River-Source Park (5.44%) is higher than that of the Yangtze-River-Source Park (1.48%) and Yellow-River-Source Park (0.37%). Most areas with type change in the Lancang-River-Source Park changed from non-high-risk areas to high-risk areas. Under the RCP4.5 scenario, 92.67% of the areas with changes in risk types within the Lancang-River-Source Park transitioned from non-high-risk areas to high-risk areas.
In summary, the Lancang-River-Source Park will have greater tourism pressure among the three sub-parks, especially in 2100 under the RCP8.5. At this time, the areas with a high risk of tourism pressure in Lancang-River-Source Park are large (accounting for 20.61% of the sub-park). The density of the areas with a high risk of tourism pressure is high (the average value is 16.58 points/km2), much higher than that of the other two sub-parks.

5. Discussion

Using a case study of a national park in China, this study examined the impact of changes in visitor composition caused by climate-driven RES changes on tourism pressure under two scenarios (RCP4.5 and RCP8.5). The Three-River-Source National Park was used as a case study site to demonstrate that climate change may influence future levels of recreational impact that ecosystems will undergo based on modifications in the types of visitors.
This study makes several theoretical contributions to the existing literature. First, this study analyzes the relationship between environmental concerns and the RES salience of tourists. It reveals that environmentally friendly tourists pay more attention to aesthetics while non-environmentally friendly tourists pay more attention to climate comfort. This enriched empirical evidence from previous studies [13,14] and confirms value-based theory [72]. According to value-based theory, environmentally friendly tourists have a strong pro-ecosystem value tendency and low self-interested values. Environment-friendly tourists tend to have a high ecosphere value and attach great importance to undisturbed and authentic ecological landscapes. This value is consistent with the pursuit of aesthetics. Non-environmentally friendly visitors have a strong tendency toward selfishness and emphasize personal comfort. This value is in line with the emphasis placed on comfortable climatic conditions.
On this basis, this study reveals the relationship between RES delivery and tourist composition, highlighting that tourist composition varies with RES delivery, which helps to deepen the understanding of the impact of climate change on tourists. Existing studies have examined the impacts of changed delivery of weather conditions due to climate change on tourist composition [12,17]. Still, the impacts of changed delivery of aesthetics and recreational opportunities on tourist composition have been ignored. This study integrated three kinds of RES delivery into the analysis to comprehensively understand the changes in tourist composition. The proportion of environmentally friendly tourists may decrease due to the aesthetic quality reduction. At the same time, the proportion of non-environmentally friendly tourists may increase as a result of increased climate comfort. This may lead to a smaller change in the overall number of tourists, which differs from previous studies, suggesting an increase in the number of tourists owing to improved climate suitability. The difference is that this study considers both climatic suitability and aesthetics and recreational opportunities. Thus, this study emphasizes the need to pay attention to changes in the number of tourists and changes in tourist composition, which may cause certain environmental effects.
Furthermore, this study proposes an analytical framework for analyzing the changes in the spatial pattern of tourism pressure caused by climate change based on RES theory, which helps explore the ecological impact of climate change on tourism destinations from a spatial perspective. Existing studies have noted tourism pressures on ecosystems caused by changes in tourist composition but have not spatially visualized such pressures [12,17]. According to the analytical framework shown in Figure 2, this study analyzes the changes in the spatial pattern of the risk of tourism pressure, identifies key areas that require tourism pressure management, and provides spatially explicit information on the impact of climate change on the ecosystem of tourism destinations.
This study has several implications for climate change management. First, this study shows the spatial distribution of areas with a high risk of tourism pressure in 2070 and 2100 under different climate scenarios, providing a spatial direction for implementing climate change adaptation strategies. If global carbon emissions continue to rise and the possibility of the RCP8.5 scenario increases, about 6.75% of the Three-River-Source National Park will face large tourism pressure by 2100. The proportion of this area in the Lancang-River-Source Park accounts for 20.61%, the highest among the three sub-parks. Areas with a high risk of tourism pressure are mainly distributed in the middle of the Lancang-River-Source Park. Accordingly, managers should strengthen the management of tourism pressure in this region. For example, park managers need to monitor various tourist behaviors in the park and analyze them using tourism pressure distribution data. This can provide management options such as temporary or permanent restriction behaviors in areas with high visitor pressure [73]. Second, some areas are still non-high-risk by 2070 but will be transformed into high-risk areas by 2100. In these areas, tourism pressure management strategies should be introduced promptly to reduce the negative impacts of tourism on the ecosystem.
Under the RCP8.5 scenario, the high-risk area of the Three-River-Source National Park is large, compared with the RCP4.5 scenario, indicating that reducing carb on emissions can help narrow the area with a high risk of tourism pressure. Therefore, managers should take active measures to reduce the possibility of the RCP8.5. For example, managers must reduce carbon emissions in tourism-related activities by advocating green transportation and promoting the use of clean energy. Additionally, expanding vegetation coverage to increase carbon sinks is an effective way to achieve carbon neutrality.
This study had several limitations. First, this study only considered the differences in environmental effects between environmentally friendly and non-environmentally friendly tourists. Future research can further analyze the differences in the environmental effects of different tourism markets, such as the differences in the environmental effects of tourists with different motivations and tourism consumption levels. Second, this study only analyzes three kinds of RES delivery: aesthetics, recreational opportunities, and a suitable environment. Future research should consider more RES delivery, such as the ability of the ecosystem to support a special tourism activity (such as bird watching tourism) and promote the physical and mental health of tourists.

6. Conclusions

This study proposes an analytical framework for exploring changes in tourism pressure caused by climate change. This framework can be generalized and scaled globally to study different sites and time periods. By applying this framework, we revealed the spatial pattern of the risk of tourism pressure in the Three-River-Source National Park under two climate change scenarios (RCP4.5 and RCP8.5) in 2070 and 2100. Compared with RCP4.5, the area with a high risk of tourism pressure under the RCP8.5 scenario is larger, the distribution density is higher, and the aggregation degree is greater. From 2070 to 2100, the area where the change in risk type occurred was smaller. The areas experiencing changes in risk type are dominated by areas transferring from non-high-risk to high-risk. Among the three sub-parks of the Three-River-Source National Park, the Lancang-River-Source Park is predicted to face greater tourism pressure, especially in 2100, under the RCP8.5 scenario. These findings deepen our understanding of the impacts of climate change on tourism pressure from a spatial perspective and provide spatial guidance for climate change adaptation. This study had several limitations. For example, studies are needed to evaluate the environmental effects of tourists with different motivations and tourism consumption levels, and to consider increased RES delivery.

Author Contributions

Conceptualization, Y.Z. and L.-e.W.; methodology, Y.Z.; software, Y.Z.; validation, Y.Z., L.-e.W. and L.Z.; formal analysis, L.-e.W.; investigation, Y.Z.; resources, L.Z.; data curation, Y.Z.; writing—original draft preparation, Y.Z.; writing—review and editing, L.-e.W.; visualization, L.Z.; supervision, L.Z.; project administration, L.Z.; funding acquisition, L.-e.W. All authors have read and agreed to the published version of the manuscript.

Funding

This study was supported by the National Natural Science Foundation (4217011372); the Second Tibetan Plateau Scientific Expedition and Research Program (2019QZKK1002); Youth Innovation Promotion Association, Chinese Academy of Sciences, the Second Tibetan Plateau Scientific Expedition and Research of MOST of China (2019QZKK0401) and China Postdoctoral Science Foundation (2020M680659).

Data Availability Statement

The data are available on reasonable request from the first author.

Conflicts of Interest

The authors declare no conflict of interest. The funders had no role in the design of the study; in the collection, analyses, or interpretation of data; in the writing of the manuscript; or in the decision to publish the results.

Appendix A

Table A1. Scale of environment concern and RES salience.
ObjectiveCode of ItemsItemsAgreement
Environment concernEC1When humans interfere with nature too often, it produces disastrous consequencesStrongly disagree (1) …Strongly agree (7)
EC2If things continue on their present course, we will soon experience a major ecological catastrophe
EC3Humans are severely abusing the environment
EC4Despite our special abilities, humans are still subject to the laws of nature
EC5Humans have the right to modify the natural environment to suit their needsStrong agree (1) … Strong disagree (7)
The salience of the delivery of aesthetic qualityA1The aesthetic quality is what I most appreciate during this travelStrongly disagree (1) …Strongly agree (7)
A2The aesthetic quality is more important than a suitable environment
A3The aesthetic quality is more important than outdoor recreational opportunities
The salience of the delivery of outdoor recreational opportunitiesO1Outdoor recreational opportunities are what I most appreciate during this travel
O2Outdoor recreational opportunities are more important than aesthetic quality
O3Outdoor recreational opportunities are more important than a suitable environment
The salience of the delivery of suitable environmentE1The suitable environment is what I most appreciate during this travel
E2The suitable environment is more important than aesthetic quality
E3

Appendix B. Results from Pre-Processed Data

The mclust (Model-based clustering) results showed (Figure A1a) that the samples could be clustered into two types. The K-means method was used to identify each sample type (Figure A1b). According to the characteristics of the environment of concern in the two clusters (Table A2), tourists were divided into environmental-friendly tourist and non-environmental-friendly tourist groups.
Figure A1. Clustering results. ((a). Bayesian information criterion(BIC) for model-based clustering; (b). the number of cases in samples).
Remotesensing 14 03758 g0a1
Table A2. Characteristics of environmental concern by the two clusters.
Non-Environmental-Friendly TouristsEnvironmental-Friendly Tourists
MeanStd. DeviationMeanStd. Deviation
EC16.00370.806452.39261.11888
EC26.12360.787402.55791.13359
EC36.07490.800622.66941.08852
EC46.01870.806242.46281.09727
EC56.04490.821382.50831.14595
The results of factor analysis (Table A3 and Table A4) showed that nine items could be extracted from three components (total variance explained by the environmental-friendly tourists was 69.425%, and total variance explained by the non-environmental-friendly tourists was 93.240%), indicating that the scale can identify the three types of salience in the three types of RES delivery. The mean values of the three types of salience of three types of RES delivery were calculated, and Kruskal–Wallis test was used to detect differences between the two groups. There were significant differences in the three groups of data (p < 0.01), indicating that environmental-friendly tourists and non-environmental-friendly tourists have significant differences in salience in the three types of RES delivery.
Table A3. Rotated component matrix of environmental-friendly tourists.
Component
AOE
A10.852−0.2140.067
A20.843−0.2290.041
A30.923−0.1490.041
O1−0.1650.768−0.008
O2−0.1050.865−0.083
O3−0.2590.6010.019
E1−0.014−0.0450.835
E20.0140.0320.796
E30.129−0.0580.814
Extraction method: principal component analysis. Rotation method: Varimax with Kaiser normalization. Rotation converged in five iterations.
Table A4. Rotated component matrix of non-environmental-friendly tourists.
Component
AOE
A10.920−0.0120.132
A20.9290.0270.095
A30.8860.0670.255
O10.0270.983−0.18
O20.0270.983−0.18
O30.0270.983−0.18
E10.275−0.2160.904
E20.123−0.1660.920
E30.138−0.1810.960
Extraction method: principal component analysis. Rotation method: Varimax with Kaiser normalization. Rotation converged in five iterations.

Appendix C. Pairwise Comparison and Hierarchy Analysis

The pairwise comparison approach (Figure A2) was used to evaluate the contribution of eco-geographical elements to aesthetics, and the analytic hierarchy process method (Figure A3) was used to determine the contribution of eco-geographical elements to outdoor recreation opportunities.
The results were linearly transformed using the max-min standardization method and mapped in the [0,1] interval to obtain the contribution of each element to various types of RES delivery (Table A5).
Figure A2. Pairwise comparison procedure.
Remotesensing 14 03758 g0a2
Figure A3. Analytic hierarchy process.
Remotesensing 14 03758 g0a3
Table A5. Contribution of eco-geographical elements to the three types of RES delivery.
ElementsIndicatorsValue/TypesAestheticsOutdoor Recreational OpportunitiesSuitable Environment
WeatherTCI0–1Linear increase
Ecological attractive sitesDensity0–1Linear increaseLinear increase
VegetationNDVIVery low (NDVI < 0.34)0.000.00
Low (0.35 < NDVI < 0.41)0.150.03
Medium (0.42 < NDVI < 0.50)1.000.66
High (0.51 < NDVI < 0.64)0.851.00
Very high (NDVI > 0.65)0.660.34
Land coverTypesForest 0.840.76
Grassland 0.700.37
Water and wetland1.001.00
Farmland 0.090.23
Others0.020.01
Desert0.000.00
DiversityVariety = 10.000.00
Variety = 20.040.07
Variety = 30.180.36
Variety = 40.790.69
Variety = 51.001.00
TerrainRelief0–210.000.52
21–500.711.00
50–851.000.40
85–1300.670.11
130–5980.580.00
Altitude0–1Linear increase

References

  1. Balch, J.K.; Abatzoglou, J.T.; Joseph, M.B.; Koontz, M.J.; Mahood, A.L.; McGlinchy, J.; Cattau, M.E.; Williams, A.P. Warming weakens the night-time barrier to global fire. Nature 2022, 602, 442–448. [Google Scholar] [CrossRef] [PubMed]
  2. Li, J.; Thompson, D.W. Widespread changes in surface temperature persistence under climate change. Nature 2021, 599, 425–430. [Google Scholar] [CrossRef] [PubMed]
  3. IPCC. Climate Change 2021: The Physical Science Basis. Contribution of Working Group I to the Sixth Assessment Report of the Intergovernmental Panel on Climate Change; Masson-Delmotte, V., Zhai, P., Pirani, A., Connors, S.L., Péan, C., Berger, S., Caud, N., Chen, Y., Goldfarb, L., Gomis, M.I., et al., Eds.; Cambridge University Press: Cambridge, UK; New York, NY, USA, 2021; in press. [Google Scholar] [CrossRef]
  4. Cavanagh, R.D.; Melbourne-Thomas, J.; Grant, S.M.; Barnes, D.K.; Hughes, K.A.; Halfter, S.; Meredith, M.P.; Murphy, E.J.; Trebilco, R.; Hill, S.L. Future risk for Southern Ocean ecosystem services under climate change. Front. Mar. Sci. 2021, 7, 615214. [Google Scholar] [CrossRef]
  5. Manley, K.; Egoh, B.N. Mapping and modeling the impact of climate change on recreational ecosystem services using machine learning and big data. Environ. Res. Lett. 2022, 17, 054025. [Google Scholar] [CrossRef]
  6. Millennium Ecosystem Assessment. Ecosystems and Human Well.Being: Our Human Planet: Summary for Decision-Makers; Island Press: Washington, DC, USA, 2005. [Google Scholar]
  7. Costanza, R. Ecosystem services: Multiple classification systems are needed. Biol. Conserv. 2008, 141, 350–352. [Google Scholar] [CrossRef]
  8. Berglihn, E.C.; Gómez-Baggethun, E. Ecosystem services from urban forests: The case of Oslomarka, Norway. Ecosys. Serv. 2021, 51, 101358. [Google Scholar] [CrossRef]
  9. Zeng, Y.; Zhong, L.; Wang, L.E. Spatiotemporal changes in recreation potential of ecosystem services in Sanjiangyuan China. J. Spat. Sci. 2018, 63, 359–377. [Google Scholar]
  10. Mameno, K.; Kubo, T.; Oguma, H.; Amagai, Y.; Shoji, Y. Decline in the alpine landscape aesthetic value in a national park under climate change. Clim. Chang. 2022, 170, 35. [Google Scholar] [CrossRef]
  11. Jaung, W.; Carrasco, L.R. Using mobile phone data to examine weather impacts on recreational ecosystem services in an urban protected area. Sci. Rep. 2021, 11, 5544. [Google Scholar] [CrossRef]
  12. Coombes, E.G.; Jones, A.P.; Sutherland, W.J. The biodiversity implications of changes in coastal tourism due to climate change. Environ. Conserv. 2008, 35, 319–330. [Google Scholar] [CrossRef]
  13. Grilli, G.; Tyllianakis, E.; Luisetti, T.; Ferrini, S.; Turner, R.K. Prospective tourist preferences for sustainable tourism development in Small Island Developing States. Tour. Manag. 2021, 82, 104178. [Google Scholar] [CrossRef]
  14. Dolnicar, S.; Leisch, F. An investigation of tourists’ patterns of obligation to protect the environment. J. Travel Res. 2008, 46, 381–391. [Google Scholar] [CrossRef]
  15. Krider, R.E.; Arguello, A.; Campbell, C.; Mora, J.D. Trait and image interaction: In ecotourism preference. Ann. Tour. Res. 2010, 37, 779–801. [Google Scholar] [CrossRef]
  16. Sheena, B.; Mariapan, M.; Aziz, A. Characteristics of Malaysian ecotourist segments in Kinabalu Park, Sabah. Tour. Geogr. 2015, 17, 1–18. [Google Scholar] [CrossRef]
  17. Coombes, E.G.; Jones, A.P. Assessing the impact of climate change on visitor behaviour and habitat use at the coast: A UK case study. Glob. Environ. Chang. 2010, 20, 303–313. [Google Scholar] [CrossRef]
  18. Sato, M.; Nanami, A.; Bayne, C.J.; Makino, M.; Hori, M. Changes in the potential stocks of coral reef ecosystem services following coral bleaching in Sekisei Lagoon, southern Japan: Implications for the future under global warming. Sustain. Sci. 2020, 15, 863–883. [Google Scholar] [CrossRef]
  19. Webster, J.M.; Braga, J.C.; Humblet, M.; Potts, D.C.; Iryu, Y.; Yokoyama, Y.; Fujita, K.; Bourillot, R.; Esat, T.M.; Fallon, S.; et al. Response of the Great Barrier Reef to sea-level and environmental changes over the past 30,000 years. Nat. Geosci. 2018, 11, 426–432. [Google Scholar] [CrossRef] [Green Version]
  20. Oliveira, B.M.; Boumans, R.; Fath, B.D.; Harari, J. Socio-ecological systems modelling of coastal urban area under a changing climate–Case study for Ubatuba, Brazil. Ecol. Modell. 2022, 468, 109953. [Google Scholar] [CrossRef]
  21. Bujosa, A.; Riera, A.; Torres, C.M. Valuing tourism demand attributes to guide climate change adaptation measures efficiently: The case of the Spanish domestic travel market. Tour. Manag. 2015, 47, 233–239. [Google Scholar] [CrossRef]
  22. Guo, Z. The Development Path of Ecotourism in Three-River-Source National Park. Master’s Thesis, Qinghai Normal University, Xining, China, 2017. [Google Scholar]
  23. Maduo County Government (MCG). Statistical Bulletin of National Economic and Social Development of Maduo County. Available online: https://www.ahmhxc.com/tongjigongbao/3979.html (accessed on 12 May 2022).
  24. Chinese National Development and Reform Commission (CNDRC). The Master Plan of the Three-River-Source National Park. Available online: http://www.gov.cn/xinwen/2018-01/17/content_5257568.htm (accessed on 19 May 2022).
  25. Tan, L.; Guo, G.; Li, S. The Sanjiangyuan Nature Reserve is partially effective in mitigating human pressures. Land 2021, 11, 43. [Google Scholar] [CrossRef]
  26. Gao, H.; Jiang, F.; Chi, X.; Li, G.; Cai, Z.; Qin, W.; Zhang, J.; Wu, T.; Zhang, T. The carrying pressure of livestock is higher than that of large wild herbivores in Yellow River source area, China. Ecol. Modell. 2020, 431, 109163. [Google Scholar] [CrossRef]
  27. Zhai, X.; Yan, C.; Xing, X.; Jia, H.; Wei, X.; Feng, K. Spatial-temporal changes and driving forces of aeolian desertification of grassland in the Sanjiangyuan region from 1975 to 2015 based on the analysis of Landsat images. Environ. Monit. Assess. 2021, 193, 2. [Google Scholar] [CrossRef] [PubMed]
  28. Luo, L.; Duan, Q.; Wang, L.; Zhao, W.; Zhuang, Y. Increased human pressures on the alpine ecosystem along the Qinghai-Tibet Railway. Reg. Environ. Chang. 2020, 20, 33. [Google Scholar] [CrossRef]
  29. Feng, S.; Lu, H.; Yao, T.; Liu, Y.; Tian, P.; Lu, J. Microplastic footprints in the Qinghai-Tibet Plateau and their implications to the Yangtze River Basin. J. Hazard. Mater. 2021, 407, 124776. [Google Scholar] [CrossRef] [PubMed]
  30. Zhang, Z.; Liu, Y.; Li, Y.; Wang, X.; Li, H.; Yang, H.; Ding, W.; Liao, Y.; Tang, N.; He, F. Lake ecosystem health assessment using a novel hybrid decision-making framework in the Nam Co, Qinghai-Tibet Plateau. Sci. Total Environ. 2022, 808, 152087. [Google Scholar] [CrossRef]
  31. Feng, L.; Gan, M.; Tian, F.P. Effects of grassland tourism on Alpine meadow community and soil properties in the Qinghai-Tibetan Plateau. Pol. J. Environ. Stud. 2019, 28, 4147–4152. [Google Scholar] [CrossRef]
  32. Zhai, X.; Liang, X.; Yan, C.; Xing, X.; Jia, H.; Wei, X.; Feng, K. Vegetation dynamic changes and their response to ecological engineering in the Sanjiangyuan Region of China. Remote Sens. 2020, 12, 4035. [Google Scholar] [CrossRef]
  33. Liang, L.; Li, L.; Liu, C.; Cuo, L. Climate change in the Tibetan plateau three rivers source region: 1960–2009. Int. J. Climatol. 2013, 33, 2900–2916. [Google Scholar] [CrossRef]
  34. Tebaldi, C.; Wehner, M.F. Benefits of mitigation for future heat extremes under RCP4. 5 compared to RCP8. 5. Clim. Chang. 2018, 146, 349–361. [Google Scholar] [CrossRef]
  35. Imran, S.; Alam, K.; Beaumont, N. Environmental orientations and environmental behaviour: Perceptions of protected area tourism stakeholders. Tour. Manag. 2014, 40, 290–299. [Google Scholar] [CrossRef]
  36. Veisten, K.; Lindberg, K.; Grue, B.; Haukeland, J.V. The role of psychographic factors in nature-based tourist expenditure. Tour. Econon. 2014, 20, 301–321. [Google Scholar] [CrossRef]
  37. Jeuring, J.H.G. Weather perceptions, holiday satisfaction and perceived attractiveness of domestic vacationing in The Netherlands. Tour. Manag. 2017, 61, 70–81. [Google Scholar] [CrossRef]
  38. Oltean, F.D.; Gabor, M.R. Cross-cultural analysis of the consumer profile of hunting tourism and trophy hunting from tradition to protected areas: Study case on Romania and Spain. Land 2021, 10, 1218. [Google Scholar] [CrossRef]
  39. Colson, V.; Garcia, S.; Rondeux, J.; Lejeune, P. Map and determinants of woodlands visiting in Wallonia. Urban For. Urban Green. 2010, 9, 83–91. [Google Scholar] [CrossRef]
  40. Zoderer, B.M.; Tasser, E.; Erb, K.H.; Stanghellini, P.S.L.; Tappeiner, U. Identifying and mapping the tourists perception of cultural ecosystem services: A case study from an Alpine region. Land Use Policy 2016, 56, 251–261. [Google Scholar] [CrossRef]
  41. Xu, X.L.; Liu, J.Y.; Shao, Q.Q.; Fan, J.W. The dynamic changes of ecosystem spatial pattern and structure in the Three-River Headwaters region in Qinghai Province during recent 30 years. Geogr. Res. 2008, 27, 829–838. [Google Scholar]
  42. Kulczyk, S.; Woźniak, E.; Derek, M. Landscape, facilities and visitors: An integrated model of recreational ecosystem services. Ecosyst. Serv. 2018, 31, 491–501. [Google Scholar] [CrossRef]
  43. Schirpke, U.; Meisch, C.; Marsoner, T.; Tappeiner, U. Revealing spatial and temporal patterns of outdoor recreation in the European Alps and their surroundings. Ecosyst. Serv. 2018, 31, 336–350. [Google Scholar] [CrossRef]
  44. Tang, G.A.; Yang, X. ArcGIS Geographic Information System Spatial Analysis Practice Tutorial, 2nd ed.; Science China Press: Beijing, China, 2012. [Google Scholar]
  45. Bastian, O.; Stein, C.; Lupp, G.; Behrens, J.; Renner, C.; Grunewald, K. The appreciation of nature and landscape by tourism service providers and visitors in the Ore Mountains (Germany). Landsc. Online 2015, 41, 1–23. [Google Scholar] [CrossRef] [Green Version]
  46. Bjerke, T.; Østdahl, T.; Thrane, C.; Strumse, E. Vegetation density of urban parks and perceived appropriateness for recreation. Urban For. Urban Green. 2006, 5, 35–44. [Google Scholar] [CrossRef]
  47. Cheng, Y.; Zhang, J.; Wei, W.; Zhao, B. Effects of urban parks on residents’ expressed happiness before and during the COVID-19 pandemic. Landsc. Urban Plan. 2021, 212, 104118. [Google Scholar] [CrossRef]
  48. Weyland, F.; Laterra, P. Recreation potential assessment at large spatial scales: A method based in the ecosystem services approach and landscape metrics. Ecol. Indic. 2014, 39, 34–43. [Google Scholar] [CrossRef]
  49. Casado-Arzuaga, I.; Onaindia, M.; Madariaga, I.; Verburg, P.H. Mapping recreation and aesthetic value of ecosystems in the Bilbao Metropolitan Greenbelt (northern Spain) to support landscape planning. Landsc. Ecol. 2014, 29, 1393–1405. [Google Scholar] [CrossRef]
  50. Feng, Z.M.; Tang, Y.; Yang, Y.Z.; Zhang, D. The relief degree of land surface in China and its correlation with population distribution. Acta Geogr. Sin. 2007, 62, 1073–1082. [Google Scholar]
  51. Hao, H.M.; Ren, Z.Y. Evaluation of nature suitability for human settlement in Shanxi province based on grid data. Acta Geogr. Sin. 2009, 64, 498–506. [Google Scholar]
  52. Nahuelhual, L.; Carmona, A.; Lozada, P.; Jaramillo, A.; Aguayo, M. Mapping recreation and ecotourism as a cultural ecosystem service: An application at the local level in Southern Chile. Appl. Geogr. 2013, 40, 71–82. [Google Scholar] [CrossRef]
  53. Schirpke, U.; Tasser, E.; Ebner, M.; Tappeiner, U. What can geotagged photographs tell us about cultural ecosystem services of lakes? Ecosyst. Serv. 2021, 51, 101354. [Google Scholar] [CrossRef]
  54. Chang, A.; Ge, Q.S.; Fang, X.Q.; Xi, J.C. Climatic suitability for tourism along the Qinghai-Tibet Railway. Geogr. Res. 2007, 26, 533–540. [Google Scholar]
  55. Becken, S.; Wilson, J. The impacts of weather on tourist travel. Tour. Geogr. 2013, 15, 620–639. [Google Scholar] [CrossRef]
  56. Mieczkowski, Z. The tourism climatic index: A method of evaluating world climates for tourism. Can. Geogr. 1985, 29, 220–233. [Google Scholar] [CrossRef]
  57. Scott, D.; McBoyle, G.; Schwartzentruber, M. Climate change and the distribution of climatic resources for tourism in North America. Clim. Res. 2004, 27, 105–117. [Google Scholar] [CrossRef] [Green Version]
  58. Amelung, B.; Nicholls, S. Implications of climate change for tourism in Australia. Tour. Manag. 2014, 41, 228–244. [Google Scholar] [CrossRef] [Green Version]
  59. Moreno, A.; Amelung, B. Climate change and tourist comfort on Europe’s beaches in summer: A reassessment. Coast. Manag. 2009, 37, 550–568. [Google Scholar] [CrossRef]
  60. Fitchett, J.M.; Robinson, D.; Hoogendoorn, G. Climate suitability for tourism in South Africa. J. Sustain. Tour. 2017, 25, 851–867. [Google Scholar] [CrossRef]
  61. Noome, K.; Fitchett, J.M. An assessment of the climatic suitability of Afriski Mountain Resort for outdoor tourism using the Tourism Climate Index (TCI). J. Mt. Sci. 2019, 16, 2453–2469. [Google Scholar] [CrossRef]
  62. Olya, H.G.; Alipour, H. Risk assessment of precipitation and the tourism climate index. Tour. Manag. 2015, 50, 73–80. [Google Scholar] [CrossRef]
  63. Om, K.C.; Ren, G.; Jong, S.I.; O, K.C.; Ryu, H.C. Tourism climatic condition over PDR Korea. Asia Pac. J. Tour. Res. 2018, 23, 1173–1183. [Google Scholar] [CrossRef]
  64. Noome, K.; Fitchett, J.M. Quantifying the climatic suitability for tourism in Namibia using the Tourism Climate Index (TCI). Environ. Dev. Sustain. 2022, 24, 5094–5111. [Google Scholar] [CrossRef]
  65. National Catalogue Service for Geographic Information (NCSGI). Natural Places Names Dataset at 1:250,000 in Sanjiangyuan Region (2015). National Tibetan Plateau Data Center. 2018. Available online: https://data.tpdc.ac.cn/en/data/eaf02b4a-e7c8-4c9f-a052-814f4c445597/ (accessed on 7 December 2021).
  66. Li, L.; Li, F.X.; Guo, A.-H.; Zhu, X.D. Study on the climate change trend and its catastrophe over “Sanjiangyuan” region in recent 43 years. J. Nat. Resour. 2006, 21, 79–85. [Google Scholar]
  67. Yi, X.S.; Yin, Y.Y.; Li, G.S.; Peng, J.T. Temperature variation in recent 50 years in the Three-River Headwaters region of Qinghai province. Acta Geogr. Sin. 2011, 66, 1451–1465. [Google Scholar]
  68. Yue, T.; Zhao, N.; Fan, Z.; Li, J.; Chen, C.; Lu, Y.; Wang, C.L.; Xu, B.; Wilson, J. CMIP5 downscaling and its uncertainty in China. Glob. Planet. Change 2016, 146, 30–37. [Google Scholar] [CrossRef]
  69. Fan, Z.M.; Yue, T.X.; Chen, C.F.; Sun, X.F. Downscaling simulation of the temperature scenarios in China. Geogr. Res. 2011, 30, 2043–2051. [Google Scholar]
  70. Yue, T.X. Surface Modeling: High Accuracy and High Speed Methods; CRC Press: Boca Raton, FL, USA, 2011; Volume 2. [Google Scholar]
  71. Li, J.; Fan, Z.M.; Yue, T.X. Spatio-temporal simulation of land cover scenarios in southwestern of China. Acta Ecol. Sin. 2014, 34, 3266–3275. [Google Scholar]
  72. Stern, P.C.; Dietz, T. The value basis of environmental concern. J. Soc. Issues 1994, 50, 65–84. [Google Scholar] [CrossRef]
  73. Chun, J.; Kim, C.K.; Kim, G.S.; Jeong, J.; Lee, W.K. Social big data informs spatially explicit management options for national parks with high tourism pressures. Tour. Manag. 2020, 81, 104136. [Google Scholar] [CrossRef]
Figure 1. The location of the Three-River-Source National Park.
Remotesensing 14 03758 g001
Figure 2. Analytic framework of this study.
Remotesensing 14 03758 g002
Figure 3. The areas with a high risk of tourism pressure under two scenarios in 2070 and 2100.
Remotesensing 14 03758 g003
Figure 4. The kernel density of areas with high risk of tourism pressure under two scenarios in 2070 and 2100.
Remotesensing 14 03758 g004
Figure 5. The transfer of areas with various risks of tourism pressure under two scenarios during the 2070–2100 period.
Remotesensing 14 03758 g005
Figure 6. The transfer of areas with various risks of tourism pressure in the three sub-parks under two scenarios during 2070–2100.
Remotesensing 14 03758 g006
Table 1. Previous studies of the impacts of climate change on RES delivery and its related risk.
ThemeStudy RegionConclusionReferences
Impacts of climate change on aesthetic benefitsMountainous national park in JapanClimate change deteriorated visitors’ perceived aesthetic benefits from alpine landscapes[10]
Great Barrier Reef of AustraliaClimate change deteriorated aesthetic quality of Great Barrier Reef[19]
Impacts of climate change on recreational opportunitiesUbatuba, BrazilClimate change reduced the ability of ecosystems to provide water-based recreational opportunities[20]
Impacts of climate change on tourism climate and recreational opportunitiesNordic countriesClimate change has led to a higher suitable climate and more recreational opportunities.[4,21]
Impacts of climate change on tourism pressure (ecological risk)Several beaches in the UKSword plovers and its habitats may be under greater tourism pressure in the future.[12,17]
Table 3. The scale and density of areas with a high risk of tourism pressure in the Three sub-parks under two scenarios during the 2070–2100 period.
Sub-ParksRCP4.5RCP8.5
20702100Growth20702100Growth
High-pressure areas(km2)Yangtze0.0300.04547.39%0.046 0.044 −4.63%
Yellow0.0230.023−2.73%0.023 0.023 2.21%
Lancang0.0640.09853.51%0.136 0.152 11.72%
Kernel density (points/km2)AverageYangtze1.7292.52546.07%2.5532.464−3.47%
Yellow1.6111.601−0.62%1.5991.6603.82%
Lancang6.83710.60455.11%14.53116.58414.13%
Coefficient of VariationYangtze1.6331.609−1.44%1.5341.5430.63%
Yellow2.0762.1181.99%2.0862.1091.09%
Lancang1.0701.053−1.61%1.0241.0411.63%
Publisher’s Note: MDPI stays neutral with regard to jurisdictional claims in published maps and institutional affiliations.

