Communication

Cloud Detection of Remote Sensing Image Based on Multi-Scale Data and Dual-Channel Attention Mechanism

1
Key Laboratory of Intelligent Computing and Signal Processing of Ministry of Education, School of Electrical Engineering and Automation, Anhui University, Hefei 230601, China
2
Key Laboratory of Optical Calibration and Characterization, Chinese Academy of Sciences, Hefei 230601, China
3
Institutes of Physical Science and Information Technology, Anhui University, Hefei 230601, China
*
Author to whom correspondence should be addressed.
Remote Sens. 2022, 14(15), 3710; https://doi.org/10.3390/rs14153710
Submission received: 21 June 2022 / Revised: 22 July 2022 / Accepted: 28 July 2022 / Published: 3 August 2022
(This article belongs to the Special Issue Artificial Intelligence in Remote Sensing of Atmospheric Environment)

Abstract

:
Cloud detection is one of the critical tasks in remote sensing image preprocessing. Remote sensing images usually contain multi-dimensional information, which is not utilized entirely in existing deep learning methods. This paper proposes a novel cloud detection algorithm based on multi-scale input and dual-channel attention mechanisms. Firstly, we remodeled the original data to a multi-scale layout in terms of channels and bands. Then, we introduced the dual-channel attention mechanism into the existing semantic segmentation network, to focus on both band information and angle information based on the reconstructed multi-scale data. Finally, a multi-scale fusion strategy was introduced to combine band information and angle information simultaneously. Overall, in the experiments undertaken in this paper, the proposed method achieved a pixel accuracy of 92.66% and a category pixel accuracy of 92.51%. For cloud detection, the proposed method achieved a recall of 97.76% and an F1 of 95.06%. The intersection over union (IoU) of the proposed method was 89.63%. Both in terms of quantitative results and visual effects, the deep learning model we propose is superior to the existing semantic segmentation methods.

1. Introduction

Approximately 50–70% of the earth’s surface is covered with clouds, which significantly affects the atmospheric radiation budget and climate change [1]. Cloud detection has become an essential topic in remote sensing image processing, cloud climate effect research, weather forecasting, surface energy estimation, and other areas.
At present, the development of remote sensing image technology is gradually maturing. A remote sensing image contains not only rich spatial information, but also spectral information. The multi-dimensional information enables remote sensing data to play a vital role in agriculture and forestry, monitoring natural disasters, environmental pollution, urbanization, and so on.
In May 2018, the China National Space Administration (CNSA) launched the Gaofen-5 satellite with a directional polarimetric camera (DPC) [2,3]. The polarization camera has eight-band channels ranging from 443 nm to 910 nm, among which 490 nm, 670 nm, and 865 nm bands are unpolarized [4]. When the satellite passes over a target, it can obtain the observation results with nine observation angles in each band channel. Therefore, the DPC data describes a certain point from different bands and observation angles, and its spatial resolution is 3.3 km. This paper mainly focuses on cloud detection based on the Gaofen-5 DPC data.
The traditional cloud detection methods mainly include the physical threshold method, cloud texture and spatial characteristics method, atmospheric radiative transfer method, and the statistical method, of which the physical threshold method is the most commonly used. Kriebel et al. [5] and Buriez et al. [6] applied the physical threshold method to the POLDER satellite and developed corresponding cloud detection products. They set the threshold weight, by comparing the reflectivity of different bands on POLDER and the pixel value of atmospheric molecular optical thickness with the historical value, to classify the pixel value into “cloud” and “sunny”. However, meteorological features are complex and changeable. For instance, sometimes, the reflectance of thin clouds is very similar to that of clouds, in numerical value, affected by snow [7]. At this time, the error of the traditional empirical threshold method becomes more significant that the results become less credible. In addition, the influence of surrounding pixels may cause the phenomenon of foreign bodies with the same spectrum, which will also distort the detection results.
Machine learning methods derive a model through an optimization process [8]. However, most approaches based on traditional machine learning treat the input as a single pixel, ignoring the critical feature of spatial correlation in remote sensing images. It will leave alone the information reflected by different band dimensions and observation angle dimensions, which are all of great significance to cloud detection.
The convolutional neural network (CNN) in deep learning has been widely used and has shown good performance in image classification [9,10], which is adept at learning spatial correlation. At present, the mainstream technologies used in cloud detection are semantic segmentation. The semantic segmentation method based on a convolutional neural network, taking into account both pixel-level classification and spatial correlation of images, becomes a good option. A large number of excellent deep learning networks have emerged in the field of semantic segmentation, such as the fully convolutional networks (FCN) [11], deep convolutional nets and fully connected CRFs (Deep-Lab) [12], pyramid scene parsing network (PSP) [13], U-net [14], and so on, which are all end-to-end semantic segmentation networks.
U-net is an outstanding semantic segmentation model proposed by Olaf Ronneberger [14]. It has an encoding and decoding process. The encoding part carries out feature extraction and analysis. The decoding part generates a segmentation result through a series of up-sampling. U-net focuses on global features, but also retains the texture features of shallow networks, which makes it widely used in cloud detection [15] in the form of 2D convolution. Considering the characteristics of DPC data, it is essentially a kind of 3D data, which has not only the spatial dimension reflecting the spatial correlation, but also different observation angles and observation bands for each pixel. Due to structural deficiencies, the network with 2D convolutions has to integrate the observation angle dimension and band dimension into one channel or keep one band or one angle with the inevitable loss of information. The 3D convolutional neural network proposed by Shuiwang Ji et al. could solve this problem well [16]. Three-dimensional convolution is widely used in multi-channel data, such as medical images [17] and remote sensing images [18], to integrate information between channels. The 3D U-net proposed by Ahmed Abdulkadir et al. [19] turns all 2D operations into 3D counterparts based on the U-net, which was initially used in medical imaging segmentation. Before it was proposed, 3D images needed to be input separately for each training slice, and his proposal significantly improved the training efficiency [19]. Furthermore, the test accuracy of fully automated segmentation and semi-automated segmentation is better than 2D U-net.
As mentioned above, there are eight spectrum bands and nine observation angles in DPC data. Both bands and angles information are conducive to cloud detection, while different bands and angles have different contributions. Channel attention reinforces the contribution of more valuable channels to image detection technology [20,21]. They improve classification accuracy by using attention mechanisms to focus the network on more essential features.
In the deep learning field, common attention mechanisms are implemented in squeeze-and-excitation networks (SE-Net) [22], convolutional block attention module (CBAM) [23], efficient channel attention module (ECA) [24], and so on. The SE-net proposed by Jie Hu et al. [22] is a typical implementation of the channel attention mechanism. The advantage of the SE-net module is that it is flexible and can be applied directly to existing network architectures. In addition, it has a small number of parameters.
The critical point is to acquire the weight of each channel in the input feature layer. The CBAM proposed by Sanghyun Woo et al. [23] is a combination of the channel attention mechanism and the spatial attention mechanism. The ECA-net proposed by Qilong Wang et al. [24] is another form of channel attention with cross-channel interactions. The band information and angle information mentioned in this paper are reflected in the form of channels. Considering the control variables, spatial attention is not used here, so we did not consider using the CBAM module.
Considering the intrinsic 3D structure of the DPC data, motivated by the 3D U-net and channel attention mechanism, this paper proposes a 3D convolutional neural network model with a double channel attention mechanism, which considers the influence of different bands and different observation angles information. Firstly, the data is reconstructed as two architectures from the perspective of different channels and bands. Secondly, the data in two forms is fed into two channels to train dual-channel attention models. Finally, the results learned from the two channels are fused to obtain the optimal solution for cloud detection. This scheme conforms to data characteristics and can effectively improve the accuracy of cloud detection. The attention mechanism added from the input layer guarantees the subsequent network is trained more effectively because of the overall extraction of information. In summary, our research contributions are as follows:
-
The band information and angle information provided by the data are fully utilized. The influence of different band information and different observation angle information on experimental accuracy is also considered.
-
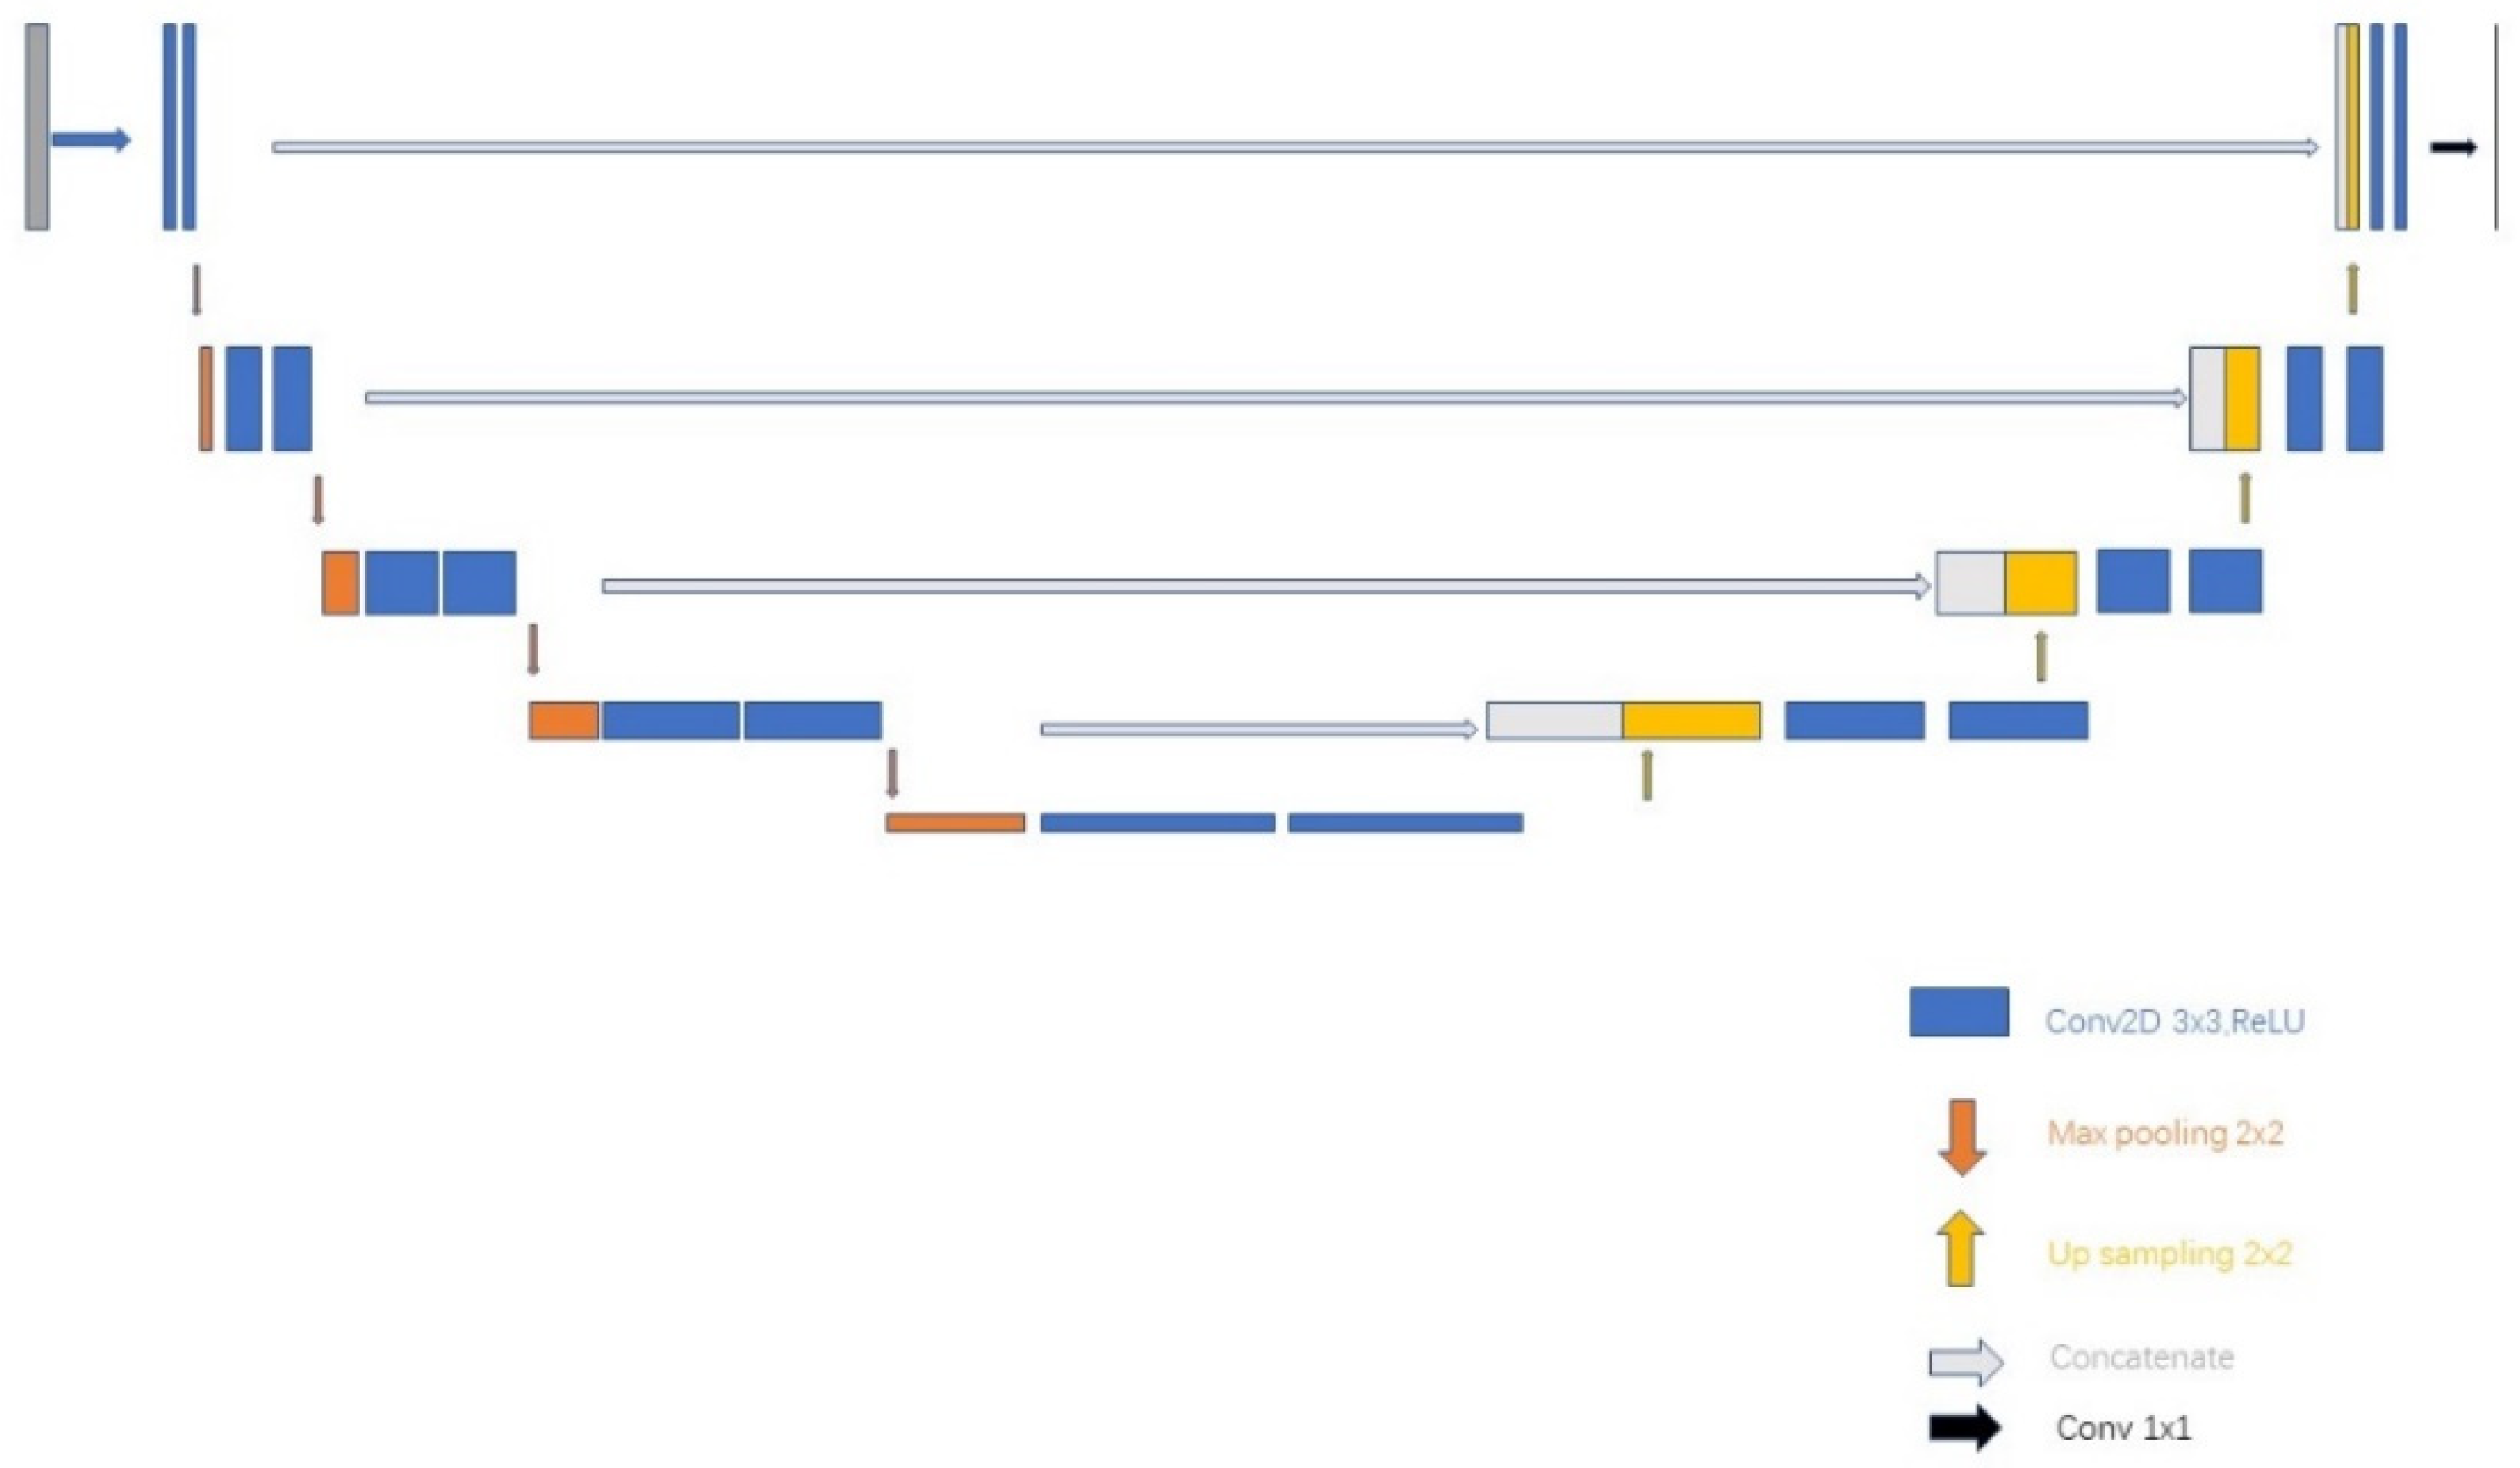
Use 3D U-net as the benchmark network model. While classifying pixels, the texture information of clouds is preserved as much as possible. This benefits from the jump connection structure between the encoder and the decoder.
-
A dual-channel attention mechanism is proposed to extract useful information from band and angle, respectively.
The remainder of this paper is organized as follows. We will introduce the relevant work of this paper in Section 2. The specific experimental data and the model structure are presented in Section 3 and Section 4, respectively. Relevant experimental results and analysis will be discussed in Section 5. Section 6 concludes this paper and outlines future work.

2. Related Work

2.1. Three-Dimensional U-Net

The original U-net network is used for semantic segmentation of two-dimensional images, but DPC data for cloud detection is three-dimensional remote sensing images. Therefore, we need to switch from 2D U-net to 3D U-net.

2.1.1. U-Net

A U-net [14] comprises an encoder, a decoder, and a jump connection structure. Each encoder layer consists of two convolutional layers and one pooling layer, which is used to extract deeper features. Each decoder layer includes two convolution layers and one up-sampling layer, aiming to recover the details of spatial information in the image. The jump connection links the feature layer between the encoder and decoder. The U-net splices the corresponding feature layers of the encoder and the decoder to assist the decoder in recovering details with low-level features. In Figure 1, the left half represents the encoder, the right half is the decoder, and the gray arrow in the middle denotes the jump connection.
U-net is widely used in remote sensing image fields [25,26]. In cloud detection, we only need to distinguish cloud regions from other regions, so shallow features are more meaningful. In U-net, the encoder contains rich shallow information, and the decoder contains rich deep details. It splices shallow features and deep features together using a jump connection structure. Compared with other models, U-net enhances the importance of shallow features in the model. In addition, U-net has a simple structure and a small number of parameters. It has an excellent generalization ability to promote a segmentation effect for different datasets.

2.1.2. Three-Dimensional U-Net

DPC data has many bands and observation angles, providing plenty of information for cloud detection. For such three-dimensional images, the two-dimensional operation is incompetent for feature extraction, and three-dimensional convolution [16] bursts into view. Different from 2D convolution, 3D convolution slides across the width and height of the image, as well as the channel [19].
Figure 2 shows the difference between 3D convolution and 2D convolution. The convolution kernel depth of 2D convolution is consistent with the depth of the input layer. This makes the convolution kernel of 2D convolution move only in width and height. A convolution kernel convolved with an image can produce only one channel of output data. However, in 3D convolution, the depth of the convolution kernel is smaller than the input layer. This allows the convolution kernel to move in three dimensions: width, height, and depth. The output of a 3D convolution is still a 3D feature map. Using 3D convolution, we can not only extract spatial information from the data, but also extract band and angle information (channel information).
U-net is mainly used for semantic segmentation of two-dimensional images. Convolution, pooling, and up-sampling in the model, all adopt a two-dimensional form. Since the 3D data of DPC, the improved 3D version of U-net needs to be considered. The three-dimensional U-net [19] replaces all two-dimensional operations in the original U-net with a three-dimensional structure, but the encoding and the decoding architecture of the model and the jump connection are maintained. Unlike the original 3D U-net, we have added channel attention modules to all of the down-sampling layers. In this way, the attention of the network is focused on the channel, which is beneficial to cloud detection, thus, improving the segmentation accuracy.

2.2. SE-Net

SE-net [22] can weight each feature channel by channel attention mechanism. It increases the weight of essential features and reduces the weight of irrelevant features to improve the effect of feature extraction wisely. Specifically, the importance of each channel is learned automatically.
Figure 3 shows the channel attention mechanism of SE-net. For SE-net, the critical point is to acquire the weights of each channel in the input feature layer. Taking advantage of SE-net, we can make the network pay more attention to crucial channels. The global average pooling is applied to the input, followed by two fully connected (FC) layers. After each full connection, the rectified linear unit (ReLU) and sigmoid are used as the activation functions in the form shown in Equations (1) and (2). ReLU has a faster processing speed than other non-linear activation functions and can reduce the vanishing gradient problem. Sigmoid is a linear function whose range is between 0 and 1, to compute the weight of each channel:
S i g m o i d ( x ) = 1 1 + e x ,
ReLU ( x ) = max ( 0 , x ) = { 0 ,       x < 0 x ,   x 0  
Then, the output is obtained by multiplying the weight of each channel by each feature channel of the input.
SE-net is a self-attention mechanism. It weights each channel with information from the channel itself, reducing the dependence on external data. It gives the model more freedom and allows it to decide which channel is more valuable from the perspective of its importance to the task, so it has better generalization ability.

3. Datasets

3.1. Data Sources and Data Formats

The experimental dataset in the subsequent experiment consists of 14 remote sensing images taken with the directional polarimetric camera (DPC) on the Gaofen-5 satellite, stored in HDF format. Each image is 6084 (height) × 12,168 (width) in spatial size. According to the number of spectrum bands and observation angles of DPC on Gaofen-5, each orbit consists of eight HDF files, including the radiance data of each pixel at nine different observation angles. For observing the multi-band and multi-angle remote sensing images intuitively, the visualization image of DPC is shown in Figure 4 with the help of ENVI, which is a professional remote sensing processing software. This image is part of the data for the seventh observation angle of orbit at the 670 nm band.

3.2. Data Processing

The data used in the experiment is not the original radiance data, but the reflectance of the top of the atmosphere of each pixel in a specific observation angle and specific band, which is obtained through the reflectance calculation formula [27] shown in Equation (3):
R = I cos θ 0 E 0   ,
where I is the normalized radiance, that is, the original data value; E 0   is solar incident irradiance; θ 0   is solar zenith angle. Among them, the values I and E 0 are different in different bands and observation angles. Both I and E 0 are dependent on the band and the observation angle.
As shown in Figure 4, there are many invalid data (black field) in the DPC, which will deteriorate the training precision of the model. Therefore, it is necessary to eliminate some regions containing invalid data. The data needs to be clipped as small enough to make full use of the data. The size of the picture we selected is 32 × 32.
The DPC data has eight bands and nine observation angles, so the data is 3D data containing 72 channels, as shown in Figure 5.
Considering the dual attention channel structure of the proposed model, we split the data by means of integrating the data with the same observation angle and the same band together, as given in Figure 6. The original data is divided into two groups. The upper group is eight 3D-data blocks, representing eight bands with a size of 32 × 32 × 9, in which 32 × 32 denotes the spatial dimension and nine corresponds to nine angles. The lower group has a similar composition. The difference is that the data blocks are organized as nine angles, and each angle has eight bands. Then, the two groups are fed into the proposed network as channel dimensions for training. Figure 6 shows the data preprocessing method.

3.3. Data Augmentation

Due to the recent launch of the Gaofen-5, the related cloud detection products are not mature enough, and manual data annotation is so high, that the data is insufficient for network training. There were only 14 orbits of labeled data in the experiment, so data augmentation [14] was needed to increase the data. In this experiment, horizontal flip, vertical flip, and diagonal mirror images in the data augmentation were used to triple the number of original data, which alleviated over-fitting to some extent and improved the accuracy of the test data.

4. Method

4.1. Overall Framework of Network

In this section, we will introduce our model in detail. The proposed network flow chart is shown in Figure 7. The input data is processed into two shapes the same as shown in Figure 6 We take the band and observation angle as channels, respectively. The encoder-decoder network is an improvement on the 3D U-net, in which a layer of SE-net is added to conduct channel attention mechanism at the beginning, for the purpose of emphasizing crucial channel information in the input data. This channel attention mechanism is also appended before each pooling operation to amplify the characteristic effects offered by each channel. After a series of encoder-decoder operations, the output will be reshaped to a new uniform size for the convenience of the next fusion operation. In the fusion stage, the two-channel reshaped features are merged by maximum. Finally, Softmax is used to classify each pixel for the final detection result.
The proposed network is a dual-channel attention mechanism network that takes band and observation angles as channels, respectively. They are individually fed into the improved 3D U-net network for training. In this way, both the influence of bands and observation angles on cloud detection are concerned. Meanwhile, different bands and angles are assigned different weights with the help of dual-channel attention.

4.2. Improvement of 3D U-Net

The backbone network in this paper is the 3D U-net, developed from the 2D U-net, replacing all 2D operations with 3D operations. Instead of the original 3D U-net, we added a dropout and an SE-net to each down-sampling layer. Dropout regularization is added after each layer of convolution to alleviate the overfitting of the network. After regularization, each layer will be input to SE-net for the channel attention mechanism. The pooling layer is max pooling. Batch normalization is also introduced for the convolutional kernels of up-sampling on each layer. Specific parameter settings for each module are listed in Table 1. Note here that the channel attention mechanism is added to both the input and the down-sampling of each layer.

4.3. Loss

We adopt the binary cross entropy [14] as the loss function, given as follows:
L o s s = i = 1 n x i l o g 2 ( y i ) + ( 1 x i ) l o g 2 ( 1 y i )
where, x represents the label of the sample; cloud area as a positive class is 1; background as a negative class is 0; y is the probability of a positive sample prediction.

5. Experiments

In this section, to evaluate the cloud detection performance of the proposed multi-input dual-attention mechanism network, we conducted extensive experiments on DPC datasets collected by Gaofen-5. Specifically, we first introduce experimental settings and algorithm evaluation indicators. Then the performance of our proposed modules and variants of the network are discussed. Finally, we evaluate its performance compared with some standard methods.

5.1. Experimental Settings

During training, all layers of the entire network were adjusted using the Adam optimizer with a learning rate of 1 × 10⁻⁴. The data batch size and epoch are set to 32 and 100, respectively.
Five indexes were computed to evaluate the model, including pixel accuracy (PA), category pixel accuracy (CPA), recall, F1, and IoU values. The specific calculation formulas are exhibited in Table 2. Where TP represents the number of pixels of positive samples identified, TN represents the number of pixels that identify a positive sample as a negative sample, FP represents the number of pixels to identify a positive sample from a negative sample, and FN represents the number of pixels of negative samples identified. PA can be used to indicate the accuracy of the model, that is, the proportion of the number of correct pixels identified by the model to the total number of pixels. CPA represents the proportion of truly positive samples among the samples recognized as positive by the model. Recall represents how much of an actual positive sample the classifier can predict. F1 believes that CPA and recall are equally important, and F1 is the harmonic mean of CPA and recall. IoU is the proportion of the intersection of the real value and the predicted value to the union of the real value and the predicted value.

5.2. Ablation Experiments

To verify the feasibility of the dual-channel attention mechanism with multi-scale input, the detection precision of different modules and fusion strategies in ablation experiments were performed. The benchmark models and strategies are 3D U-net, 3D U-net + band attention (3D U-net + BA), 3D U-net + angle attention (3D U-net + AA), concatenation fusion, and maximum fusion. The experimental comparison results are shown in Table 3.
Based on the reference network 3D U-net, both the channel attention module based on the band and the channel attention module based on the angle can improve the representation ability of the features extracted from the network. Compared with the benchmark network, the accuracy has been significantly improved. However, the performance of the angle attention module is better than that of the band attention module. In this paper, it is considered that the angle information of remote sensing images is more conducive to improving cloud detection accuracy than the band information due to the extensive imaging range of remote sensing images. Data observed from different viewing angles will lead to cloud boundary deviation due to different viewing angles. Using the channel attention mechanism based on the angle will focus on learning feature channels with a slight deviation from the actual value to improve the accuracy of cloud detection. We can also find that the band attention has the most enormous gap compared with the network we put forward, and the angle attention is close to our performance. This indicates that angle information is more advantageous than band information in this task. The concatenation fusion mechanism weakens the results of angle attention. Therefore, we chose the approach of maximum fusion to obtain more valuable information from the band and angle in subsequent experiments.

5.3. Comparative Experiments with Other Methods

To prove the performance and detection effects, we carried out experiments to compare the proposed model with other well-known models. The numerical results are demonstrated in Table 4, and the visual results are exhibited in Figure 8. Here, cloud pixels correctly detected are marked in gray, while non-cloud pixels are marked in black. Misclassified pixels are marked in red.
As can be seen from Figure 8, the method based on deep learning, FCN produces more misclassified pixels in the overall performance. Seg-net and U-nET have fewer mismarks than FCN and PSP-net. The result of the proposed method is closest to the ground data with fewer misclassifications, especially for the pixels marked with the yellow boxes. Meanwhile, our model keeps more texture features, which is superior to the other methods, visually. By analyzing this experiment, it is found that the comprehensive utilization of various information (bands and angles) makes the proposed method fulfill cloud detection with high performance.
We can verify our observations from Table 4 with quantitative experimental analysis. It can be seen from Table 1, that according to the evaluation indicators with the PA, CPA, recall, F1, and IoU, our method outperformed these benchmarks. It is worth noting that our method has a recall rate of nearly 98%. It shows that our model has outstanding performance in cloud area detection. F1, as the trade-off between recall and CPA, has also been significantly improved, which indicates that the proposed model has a good ability to predict both cloud and non-cloud regions. IoU was numerically 2.4% higher than U-net, the best performing of the other four methods. It shows that we also achieved better results in the model prediction stage compared with other methods. However, for the efficiency of the prediction, we found that our prediction time on the two orbital images was almost twice as long as the other methods. This is because we have two pieces of data on the input side that we put into the network, and 3D convolution is more complicated than 2D convolution in tensor operation. At the same time, we added an attention mechanism. Although the prediction time has increased, it cannot be denied that the prediction accuracy has been greatly improved.
Table 5 shows the detection results of images with large background pixels. We can think of it as the detection effect of small clouds. It can be seen that the value of recall changes greatly because when there are many pixels in the background, pixels that are not in the background are often predicted as the background. Recall means that we have no probability of misjudging. The other values have little overall change because the predicted values are all small clouds. If misjudgment occurs, it is only a few pixels that are misjudged. It can also be seen from the table that our method is still superior to the comparison method for each value.
Compared to the other deep learning models, our method achieves better quantitative performance than the benchmark method, which benefits from our dual-attention focusing on both angle and band information. In comparison, our method is closest to the actual value, which indicates the universality and effectiveness of our method under such data. By analyzing the cloud detection results on the Gaofen-5 dataset, our network can reliably extract cloud information from remote sensing images. At the same time, experimental results show that the performance of our network is better than other basic methods based on CNN. Our method has a powerful semantic segmentation capability for this kind of data, which can be used for remote sensing imagery cloud detection.

6. Conclusions and Future Work

This paper presents a deep learning method for cloud detection of remote sensing images based on multi-scale input and dual attention. It fully utilized the characteristics of data structures and gave enough consideration to band information and angle information. Three-dimensional U-NET was used as the basic network to combine semantic information at a high level and spatial information at a low level to generate cloud boundaries correctly, whose encoding-decoding structure helps to restore the original resolution. The fine detection precision on this dataset indicated that the proposed network could be applied to the same type of remote sensing image data from other satellites.
This experimental result proves the high precision of our method, but it is also limited by the amount of data we had, so we had to augment the data. In future work, we will try to solve the problems of small amounts of data and complex manual annotation of data by using unsupervised learning or semi-supervised learning.

Author Contributions

H.L. designed and completed the experiments and drafted the manuscript. Q.Y. provided the research ideas and modified the manuscript. J.Z. and L.X. put forward the improvement suggestions for the experiment and the manuscript. All the authors assisted in writing and improving the paper. All authors have read and agreed to the published version of the manuscript.

Funding

This research was funded by Key Laboratory of Optical Calibration and Characterization, Chinese Academy of Sciences Open Research Foundation, and the funder is Jingjing Zhang; Anhui Provincial Natural Science Foundation (grant no. 2108085MF232), and this funder is Yi Xia.

Data Availability Statement

Not applicable.

Acknowledgments

The authors want to thank the Key Laboratory of Optical Calibration and Characterization, Chinese Academy of Sciences for supporting the experimental data. In addition, we are grateful to the Key Laboratory of Intelligent Computing and Signal Processing of Ministry of Education, School of Electrical Engineering and Automation, Anhui University who supported the hardware devices used in this research.

Conflicts of Interest

The authors declare no conflict of interest.

References

  1. Zeng, S.; Parol, F.; Riedi, J.; Cornet, C.; Thieuleux, F. Examination of POLDER/PARASOL and MODIS/Aqua Cloud Fractions and Properties Representativeness. J. Clim. 2011, 24, 4435–4450. [Google Scholar] [CrossRef]
  2. Dubovik, O.; Li, Z.; Mishchenko, M.I.; Tanré, D.; Karol, Y.; Bojkov, B.; Cairns, B.; Diner, D.J.; Espinosa, W.R.; Goloub, P.; et al. Polarimetric remote sensing of atmospheric aerosols: Instruments, methodologies, results, and perspectives. J. Quant. Spectrosc. Radiat. Transf. 2019, 224, 474–511. [Google Scholar] [CrossRef]
  3. Yunzhu, S.; Guangwei, J.; Yunduan, L.; Yong, Y.; Haishan, D.; Jun, H.; Qinghao, Y.; Qiong, C.; Changzhe, D.; Shaohua, Z.; et al. GF-5 Satellite: Overview and Application Prospects. Spacecr. Recovery Remote Sens. 2018, 39, 1–13. [Google Scholar]
  4. Li, Z.; Hou, W.; Hong, J.; Zheng, F.; Luo, D.; Wang, J.; Gu, X.; Qiao, Y. Directional Polarimetric Camera (DPC): Monitoring aerosol spectral optical properties over land from satellite observation. J. Quant. Spectrosc. Radiat. Transf. 2018, 218, 21–37. [Google Scholar] [CrossRef]
  5. Saunders, R.W.; Kriebel, K.T. An improved method for detecting clear sky and cloudy radiances from AVHRR dats. Int. J. Remote Sens. 1988, 9, 123–150. [Google Scholar] [CrossRef]
  6. Buriez, J.C.; Vanbauce, C.; Parol, F.; Goloub, P.; Seze, G. Cloud detection and derivation of cloud properties from POLDER. Int. J. Remote Sens. 1997, 18, 2785–2813. [Google Scholar] [CrossRef]
  7. Tengteng, L.; Xinming, T.; Xiaoming, G. Research on Separation of Snow and Cloud in ZY-3 Images Cloud Recognition. Bull. Surv. Mapp. 2016, 2, 46–49. [Google Scholar]
  8. Souri, A.H.; Saradjian, M.R.; Nia, S.S.; Shahrisvand, M. Comparison of Using SVM and MLP Neural Network for Cloud Detection in MODIS Imagery. Int. J. Remote Sens. 2013, 2, 21–31. [Google Scholar]
  9. Lecun, Y.; Bottou, L. Gradient-based learning applied to document recognition. Proc. IEEE 1998, 86, 2278–2324. [Google Scholar] [CrossRef] [Green Version]
  10. Simonyan, K.; Zisserman, A. Very Deep Convolutional Networks for Large-Scale Image Recognition. Comput. Sci. 2014. [Google Scholar] [CrossRef]
  11. Long, J.; Shelhamer, E.; Darrell, T. Fully Convolutional Networks for Semantic Segmentation. IEEE Trans. Pattern Anal. Mach. Intell. 2015, 39, 640–651. [Google Scholar]
  12. Chen, L.C.; Papandreou, G.; Kokkinos, I.; Murphy, K.; Yuille, A.L. Semantic Image Segmentation with Deep Convolutional Nets and Fully Connected CRFs. Comput. Sci. 2014, 357–361. [Google Scholar] [CrossRef]
  13. Zhao, H.; Shi, J.; Qi, X.; Wang, X.; Jia, J. Pyramid Scene Parsing Network. IEEE Comput. Soc. 2016. [Google Scholar] [CrossRef] [Green Version]
  14. Ronneberger, O.; Fischer, P.; Brox, T. U-Net: Convolutional Networks for Biomedical Image Segmentation. Springer Int. Publ. 2015, 9351, 234–241. [Google Scholar]
  15. Haitao, W.; Yichen, W.; Yongqiang, W.; Yurong, Q. Cloud Detection of Landsat Image Based on MS-UNet. Laser Optoelectron. Prog. 2021, 58, 8. [Google Scholar]
  16. Ji, S.; Xu, W.; Yang, M.; Yu, K. 3D Convolutional Neural Networks for Human Action Recognition. IEEE Trans. Pattern Anal. Mach. Intell. 2013, 35, 221–231. [Google Scholar] [CrossRef] [Green Version]
  17. Kamnitsas, K.; Ledig, C.; Newcombe, V.; Simpson, J.P.; Kane, A.D.; Menon, D.K.; Rueckert, D.; Glocker, B. Efficient Multi-Scale 3D CNN with Fully Connected CRF for Accurate Brain Lesion Segmentation. Med. Image Anal. 2016, 36, 61. [Google Scholar] [CrossRef]
  18. Roy, S.K.; Krishna, G.; Dubey, S.R.; Chaudhuri, B.B. HybridSN: Exploring 3-D–2-D CNN Feature Hierarchy for Hyperspectral Image Classification. IEEE Geosci. Remote Sens. Lett. 2020, 17, 277–281. [Google Scholar] [CrossRef] [Green Version]
  19. Çiçek, Ö.; Abdulkadir, A.; Lienkamp, S.S.; Brox, T.; Ronneberger, O. 3D U-Net: Learning Dense Volumetric Segmentation from Sparse Annotation. In Proceedings of the Medical Image Computing and Computer-Assisted Intervention–MICCAI 2016: 19th International Conference, Athens, Greece, 17–21 October 2016; pp. 424–432. [Google Scholar]
  20. Hao, W.; Jingjing, Z.; Yuanyuan, L.; Feng, W.; Lina, X. Hyperspectral Image Classification Based on 3D Convolution Joint Attention Mechanism. Infrared Technol. 2020, 42, 8. [Google Scholar]
  21. Cong’an, X.; Yafei, L.; Xiaohan, Z.; Yu, L.; Chenhao, C.; Xiangqi, G. A Discriminative Feature Representation Method Based on Dual Attention Mechanism for Remote Sensing Image Scene Classification. J. Electron. Inf. Technol. 2021, 43, 683–691. [Google Scholar]
  22. Hu, J.; Shen, L.; Albanie, S.; Sun, G.; Wu, E. Squeeze-and-Excitation Networks. IEEE Trans. Pattern Anal. Mach. Intell. 2020, 42, 2011–2023. [Google Scholar] [CrossRef] [PubMed] [Green Version]
  23. Woo, S.; Park, J.; Lee, J.Y.; Kweon, I.S. CBAM: Convolutional Block Attention Module; Springer: Cham, Switzerland, 2018. [Google Scholar] [CrossRef] [Green Version]
  24. Wang, Q.; Wu, B.; Zhu, P.; Li, P.; Zuo, W.; Hu, Q. ECA-Net: Efficient Channel Attention for Deep Convolutional Neural Networks. In Proceedings of the 2020 IEEE/CVF Conference on Computer Vision and Pattern Recognition (CVPR), Seattle, WA, USA, 13–19 June 2020; pp. 11531–11539. [Google Scholar]
  25. Xiaomin, S.; Lijuan, Z.; Jun, W.; Qian, C.; Chongbin, X.; Yang, M.; Zhen, C. Land Classification of GF-5 Satellite Hyperspectral Images Using U-net Model. Spacecr. Recovery Remote Sens. 2019, 40, 8. [Google Scholar]
  26. Jianmin, S.; Lanxin, Y.; Weipeng, J. U-net Based Semantic Segmentation Method for High Resolution Remote Sensing Image. Comput. Eng. Appl. 2019, 55, 207–213. [Google Scholar]
  27. Yuyang, C.; Bin, S.; Chan, H.; Jin, H.; Yanli, Q. Cloud Detection and Parameter Inversion Using Multi-Directional Polarimetric Observations. Acta Opt. Sin. 2020, 40, 11. [Google Scholar]
Figure 1. U-net structure. In this figure, blue represents the convolution process, and ReLU is used as the activation function. Orange represents the down-sampling process using max pooling. Yellow is the up-sampling process. The gray arrows are the jump connection structure proposed in this paper.
Remotesensing 14 03710 g001
Figure 2. Two-dimensional convolution process and three-dimensional convolution process.
Remotesensing 14 03710 g002
Figure 3. SE-net channel attention network model. FC replies to a fully connected layer.
Remotesensing 14 03710 g003
Figure 4. This figure shows the visualization data recorded by Gaofen-5 DPC from the satellite’s orbit 1457 on 26 July 2018. The observation band is 490 nm, and the angle comes from the 5th observation angle.
Remotesensing 14 03710 g004
Figure 5. The preprocessing data. The dimension of 32 × 32 × 72 represents the size of the data in each dimension. Additionally, 32 × 32 is the size of a single sheet of data in space after cutting data. In addition, 72 represents the number of combinations of data recorded from different observation angles at different bands. The data we used had 8 bands and 9 observation angles, so there were 72 combinations.
Remotesensing 14 03710 g005
Figure 6. Format of the data fed into the network, blue replies bands as the channel and yellow replies angles as the channel.
Remotesensing 14 03710 g006
Figure 7. Network flow chart.
Remotesensing 14 03710 g007
Figure 8. Visual comparison of cloud detection. (ad) are the four images randomly selected by us to show the test results. FCN, PSP-Net, Seg-Net, U-Net and ours respectively represent the cloud detection results of the four groups of comparison experiments we set and the cloud detection results of the proposed method. Gray represents the clouds, black represents the background, and red represents the pixels where the prediction was wrong. In ground truth, white represents the cloud, and black represents the background.
Remotesensing 14 03710 g008
Table 1. Parameter settings.
ModuleParameter Setting
Conv3D3 × 3 × 3,” relu”, padding = same, BatchNormalization
Dropout0.5
Maxpooling3D2 × 2 × 1
UpSampling3D2 × 2 × 1
Conv2D3 × 3,” relu”, padding = same, BatchNormalization
Table 2. Calculation formula of evaluation indicators.
Evaluation IndexComputational Formula
PA TP + TN TP + TN + FP + FN
CPA TP TP + FP
Recall TP TP + FN
F1 2     CPA     Recall CPA + Recall
IoU TP TP + FP + FN
Table 3. Cloud extraction accuracy for modules and variants of the model.
PACPARecallF1IoU
3D U-net86.12%83.97%96.38%89.75%81.13%
3D U-net + BA86.96%85.02%97.17%90.69%82.96%
3D U-net + AA92.53%91.41%96.58%93.92%89.58%
3D U-net + BA + AA (Concatenation Fusion)92.13%90.64%98.08%94.21%89.06%
3D U-net + BA + AA (Maximum Fusion)92.66%92.51%97.76%95.06%89.63%
Table 4. Cloud detection accuracy.
PACPARecallF1IoUEfficiency (Seconds)
Seg-Net88.32%87.91%90.55%89.21%83.56%60.01
FCN86.20%86.62%92.08%89.27%80.61%46.53
PSP-Net90.55%89.43%93.06%91.20%81.96%75.10
U-Net91.26%90.73%95.76%93.18%87.23%49.95
Ours92.66%92.51%97.76%95.06%89.63%132.19
Table 5. Small cloud detection accuracy.
PACPARecallF1IoU
Seg-Net88.18%88.43%58.06%73.04%80.53%
FCN82.59%73.31%57.87%64.68%75.80%
PSP-Net90.62%90.74%76.62%83.08%77.10%
U-Net91.84%93.78%77.30%84.74%83.34%
Ours92.81%93.83%79.12%85.86%86.22%
Publisher’s Note: MDPI stays neutral with regard to jurisdictional claims in published maps and institutional affiliations.

