1. Introduction
The Chang’e-4 mission was the world’s first soft landing on the far side of the Moon and is also China’s second lunar surface soft landing mission [
1,
2,
3]. The lander is equipped with a variety of cameras, capturing in situ field images at different resolutions and positions and providing imagery of impact craters down to centimeter scale. These high-resolution data from the Chang’e-4 landing area provide the possibilities for small-scale (especially centimeter-scale) geomorphological features, such as impact craters and boulders [
4,
5], enabling a more detailed investigation of the morphological features associated with them in the landing area [
5,
6]. Therefore, the analysis of the centimeter-scale geomorphological features of the Chang’e-4 landing area on the lunar far side, especially the impact crater population, is valuable for obtaining statistical characteristics of the centimeter-scale impact crater distribution, and detailed information on their geomorphology.
Craters are among the most common features on the lunar surface and reveal significant information primarily regarding relative and absolute surface chronologies and erosion processes [
7,
8,
9]. Craters after the formation of impacts are affected by the micrometeorite bombardment, emplacement of ejecta from distal larger craters, and stresses associated with geological deformation [
10,
11,
12,
13]. Consequently, the spatial morphology changes and gradually degenerates [
14]. The first lunar image captured by Ranger 7 confirmed the degradation of the lunar surface. Among the factors influencing the degradation of impact craters, direct micrometeorite bombardment and ejecta from other impact craters result in incomplete craters, disappearance of the crater rims, and the infilling of the crater cavities. Additionally, internal geological processes such as geomorphological processes (avalanches, talus slides, landslides, and creep) influence the morphology of impact craters, especially small craters [
10,
13].
From formation to obliteration, impact craters experience different stages of degradation with various morphological characteristics. The degradation of a population of craters reflects the age of the local geological units, providing insights into the processes of lunar geological evolution. The relationship between the degradation of impact crater populations and the age of geological units has been the focus of study. Craddock and Howard [
11] studied the crater degradation process and described the relative age of geological units with the concept of degradation parameters; the degradation pattern of impact craters and the impact history of the region have also been studied in much detail in recent years [
15,
16,
17]. Meanwhile, the evaluation of the impact degradation level is also of interest in the studies. Basilevsky [
10], Wood et al. [
18], and Ivanov and Basilevsky [
19] distinguished the degradation level according to crater morphology; Li [
20] used craters of typical lunar maria acquired from Chang’e-2 digital orthophoto map (DOM) and digital elevation model (DEM) to study crater shape and degradation, and crater depth was used as the critical parameter to evaluate crater degradation. Wood, Head, and Cintala [
19] Ivanov and Basilevsky [
20] Li [
16,
17,
18,
21,
22]. The image-based ray brightness, rim, and terrace sharpness, texture, and digital elevation model (DEM) data-based impact crater depth, profile, and slope are the key elements of impact crater degradation analysis in existing studies. However, considering the high resolution of the Landing Camera (LCAM, cm-level resolution at the center of the landing area), in the absence of a high-resolution DEM, we analyze the degradation of small impact craters mainly using the features obtained from the LCAM images [
13,
15,
16,
17,
21,
22,
23].
Some craters, which we call fresh impact craters, have sharp edges and bright ejecta in optical images, while in the case of other craters, the edges are softened or incomplete, and their walls are even collapsed and discontinuous. The bottoms of these craters, which we call degraded impact craters, are filled, and their reflectance is consistent with the surrounding background [
11,
13,
24]. To better understand crater degradation, an image-based statistical method based on the degradation classification of impact craters is developed. Chapman [
25] defined four levels of lunar impact crater degradation. Based on this work, we classify the degradation of the crater population into four classes based on the features shown in the images, namely (1) the presence of ray patterns around the craters, (2) the clarity of the crater rims, and (3) the contrast between the bright and shadowed regions of the crater interiors. Impact craters that are clear and complete, with sharp contrasting bright and shadowed interiors, are considered fresh impact craters. The impact craters are classified into the following types according to the degree of degradation: fresh craters (C1), slightly degraded craters (C2), moderately degraded craters (C3), and severely degraded craters (C4). Overall, empirical measures of crater degradation levels based on orbiter image data are highly dependent on the appearance of impact craters, and studies of small, degraded craters are subject to the image resolution of the orbital data.
Existing impact crater degradation studies have generally concluded that the smaller the crater is, the more likely it is to be filled or destroyed by subsequent impacts, while large craters are relatively stable and less prone to degradation [
11,
13,
26,
27,
28]. However, few studies have focused on the population degradation of small craters, especially those smaller than one meter. Therefore, in this study, we focus on the analysis of population degradation statistics for impact craters with sizes of centimeters to one meter, which has not been addressed in previous studies. In addition, we do not analyze the effect of secondary impact craters on the degradation of impact craters because the sizes of the craters involved in this study are small and the distribution is dense; thus, it is currently not possible to distinguish primary and secondary craters by their spatial distribution patterns. The main contributions include the following:
- (1)
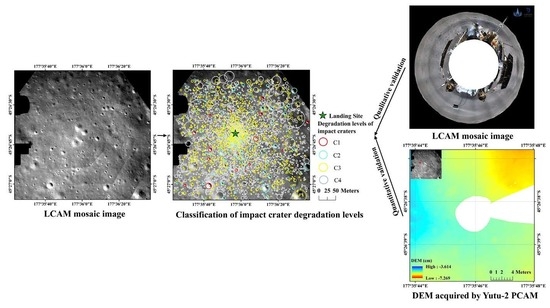
Impact craters of C1, C2, C3, and C4 degradation levels at the centimeter to meter scale in the Chang’e-4 landing area were acquired based on LCAM mosaic imagery.
- (2)
The impact crater degradation level classification was qualitatively verified from a side-view perspective using TCAM images, and the crater depth-to-diameter ratio calculated by DEM using PCAM of Yutu-2 was used to quantitatively verify the impact crater degradation level.
- (3)
The equilibrium state of the centimeter to meter impact crater population in the Chang’e-4 landing area was evaluated. Moreover, the local surface resurfacing was analyzed.
Degradation analysis of lunar impact craters extends and deepens our understanding of crater morphology, crater identification, lunar cratering history, and lunar chronology [
12]. Degradation analysis of small-sized impact crater populations with sizes on the meter to centimeter scale can provide detailed information on the local geological evolution of the lunar surface relative to larger-sized impact craters (hundreds of meters), providing the possibility of obtaining localized surface resurfacing of the lunar surface.
2. Methodology
In this paper, high-resolution descent images are used to explore the distribution and degradation of small impact crater populations in the landing area. The descent images, however, have no geolocation information. Thus, we needed to mosaic and register them based on existing georeferenced data. All the craters in the mosaic images were manually identified based on the crater textures, as the accuracy and completeness of the automatic identification techniques are limited. Craters were manually classified to different degradation levels to permit a quantitative analysis of degradation in the crater population, a multi-vote process to compensate for human subjective factors. The impact crater degradation level classification was verified qualitatively and quantitatively using the side-view morphology of the impact crater from the images of the ground terrain camera (TCAM) and the depth-to-diameter ratio of the DEM acquired by the Yutu-2 panoramic camera (PCAM). The specific flow is shown in
Figure 1. A detailed description of the method is described below.
2.1. The Mosaic and Registration of the Images from the LCAM
Typically, we used the structure from motion (SfM) algorithm [
29] to estimate the photo position and attitude to obtain the normalized image; however, the final stage of the Chang’e-4 lander was the vertical landing, and the images were acquired along the main optical axis direction, leading to large errors in the position and attitude calculated by the SfM algorithm [
30,
31]. Therefore, this paper adopted the mosaic method.
Since the descent images lacked geo-referencing, we registered the descent images before mosaicking, making them have the same coordinate reference as Chang’e-2 DOM. However, the resolution of Chang’e-2 DOM is 7 m/pixel, which is quite different from the first descent image (46 cm/pixel). Therefore, we considered using the lunar reconnaissance orbiter camera (LROC) Narrow-Angle Camera (NAC) image to register with the Chang’e-2 DOM image first and then registered the descent images based on the georeferenced LROC NAC image.
We used ArcGIS for the image registration and applied the spline transformation model to transfer the images. For the registration of the LROC NAC image and the Chang’e-2 DOM, we selected 300 pairs of corresponding points and ensured that they were evenly distributed. For the registration of the descent images and the LROC NAC image, we needed to register 25 images. For each image pair, 100 pairs of corresponding points were selected. Experimentally, 100 pairs of random points were selected to test the registration error and the results showed that the error was less than 2 pixels. Furthermore, the experiments selected larger impact craters (with diameters larger than 50 pixels) and compared their diameters to the LROC NAC image to determine the difference in crater diameter. The maximum diameter difference was no more than 2 pixels. This finding suggested that image distortion due to image registration had little effect on subsequent crater size acquisition. The resolution of the georeferenced LCAM mosaic image is 0.023 m/pixel (center) to 0.46 m/pixel (edge).
2.2. Identification of Impact Craters
As impact craters are the most typical geomorphic structure on the lunar surface, they provide important information on past and present geological processes and have also been applied to age dating of geologic surfaces [
32,
33]. In this paper, impact craters were extracted around the landing site of Chang’e-4 using manual visual identification, as shown in
Figure 2a,b.
Figure 2a illustrates the contrast between the shadowed areas (dark areas, blue outline) and the illuminated areas (light areas, red outline) presented internally along the illumination direction of the impact crater in the image.
Figure 2b shows the circular shape of craters (yellow arrows mark the impact crater boundaries); thus, they can be distinguished from the background.
Therefore, craters can be identified through the combination of contrast and shape attributes. Identifying craters manually means craters can be detected, marked, and verified through human eyes, decreasing the likelihood of incomplete and mistaken identification evident in currently deployed automatic methods.
For the identification of impact craters, a minimum crater diameter of 5 pixels (e.g.,
Figure 3a,b) or more is needed, but for the degradation analysis of impact craters, a minimum crater diameter of 10 pixels (e.g.,
Figure 3c,d) is required due to the detailed information on the shape of the crater, the contrast between bright and dark and the rays around the crater.
2.3. Classification of Degradation Levels of Impact Craters
Once formed, impact craters begin to degrade gradually. As the degradation of the impact crater becomes more severe, the distal ejecta rays (if any) around the fresh impact crater gradually disappear, and the contrast between the bright and dark areas of the impact crater is no longer sharp, while the boundary gradually becomes indistinguishable and nearly blends in the surrounding lunar surface [
2,
13,
28,
34,
35]. Statistical studies of morphological and other related characteristics of their degradation level are important to understand the correlation between the evolution of crater morphology and the age of the corresponding geological units. Unlike existing studies that have targeted larger impact craters (meters and even hundreds of meters), most craters in our study are smaller than 2 m in diameter. Unfortunately, there is no DEM with a resolution higher than 0.5 m/pixel to calculate the exact value of the quantitative classification indicators for craters. Thus, a qualitative classification was applied in this paper based on the traditional method [
25]. As shown in
Figure 4, we used a qualitative identification method to define and determine the degradation levels of impact craters. The latter were divided into four types (C1–C4):
- (1)
C1 type: fresh craters, with obvious rays or clear edges, and a sharp contrast between bright and dark.
- (2)
C2 type: slightly degraded craters, with clear edges, and a relatively clear contrast between bright and dark.
- (3)
C3 type: moderately degraded craters, which show clear signs of degradation with small differences between bright and dark, raised crater floors due to filling, and fuzzy circular outlines.
- (4)
C4 type: severely degraded craters with unclear outlines, shallow crater floors, and a circular outline that can be distinguished when the image is stretched.
The manual qualitative classification of craters usually introduces human subjective factors, so judgment errors are inevitable. For example, the C3-type craters in
Figure 4 are like C4-type craters and may be misclassified; thus, a multi-voting process for all craters was adopted. In the voting process, first, all impact craters were individually classified by three researchers into degradation levels. Then, we summarize the obtained impact crater degradation levels. For a given impact crater, the degradation level of the crater is confirmed only when the number of votes is greater than or equal to 2. Otherwise, the crater is considered to have an uncertain degradation level and needs to be reclassified. Finally, the impact crater degradation level will not be determined until all impact crater degradation levels have obtained 2 or more equal votes. In this process, the number of impact craters with uncertain degradation levels was less than 15% when researchers first independently classified the crater degradation levels, and after two rounds of reclassifying craters with uncertain degradation levels, the degradation levels of all impact craters were determined. The specific crater degradation levels classification results can be downloaded from the Science Data Bank of Beijing, China.
Nevertheless, we are concerned that the very small number of C3 and C4 impact craters may still be misclassified. Therefore, in the subsequent analysis, we also combined the statistical analysis of C3 and C4 impact craters. In addition, the qualitative and quantitative methods for classifying impact crater degradation levels are described in the next section.
2.4. Qualitative and Quantification Analysis of the Degradation Level of Impact Craters Using Ground TCAM Images and DEMs Acquired by Yutu-2 PCAM
We compared craters in images from both the TCAM and LCAM. We manually identified the craters in both types of images and analyzed the degradation of the crater population in the landing area. Then, we verified our results by comparing the identified craters on the LCAM mosaic images and the TCAM images.
Figure 5 shows two impact craters with different degradation levels in the LCAM mosaic image and TCAM image (red circles are C3 type impact craters and blue circles are C4 type impact craters).
As shown in
Figure 5, we show two pairs of corresponding impact craters on TCAM images and LCAM mosaic images, where the blue circles are C4 level impact craters, and the red circles are C3 level impact craters. The TCAM images are obtained from a side view, for the C3 impact crater compared to the C4 impact crater, part of the crater rim can be identified, while the concave interior of the C3 impact crater is also more obvious. We carefully compared the LCAM mosaic image and the corresponding impact crater on the TCAM images from different angles for close-up verification. In the central part of the landing area, the degradation levels and actual spatial forms of craters were checked one by one at close range. This comparison helped us to understand the actual morphology of craters in the descent image.
For the PCAM image of Yutu-2, we used the Context software program to obtain the DOM and DEM of the region. After that, the LCAM mosaic image was used as the reference image for the registration of the DOM and DEM by using ArcGIS.
To quantitatively verify the degradation level of impact craters acquired from LCAM images, a crater diameter-to-depth ratio was used. Considering the variation in the depth-to-diameter ratio of different types and sizes of impact craters, we selected simple impact craters of the similar size (diameter difference less than 1 m) for the calculation of the depth-to-diameter ratio. For the calculation of the impact crater depth, we used the average of the elevations of the eight directions at the edge of the crater to represent the topographic elevation and obtained the crater depth by subtracting this value from the depth at the center of the DEM impact crater.
3. Results and Analysis
The difference in the resolution of different regions of the mosaic image makes the minimum diameter of the impact crater that can be extracted different for each part. Therefore, we divided the study area into four study areas based on the minimum diameter of the impact crater that can be extracted from each area. In addition, the degradation statistics of crater populations in each study area were analyzed. Finally, TCAM and LCAM images were used to analyze the impact crater degradation classification qualitatively and quantitatively.
3.1. Study Area and Data
Chang’e-4 landed on the floor of the Von Kármán crater (186 km in diameter), located in the central part of the northwestern South Polar Aitken (SPA) basin. Recent geological mapping surveys show that this crater is approximately 3.6–3.7 Gyr old (pre-Nectarian) [
36]. The landing site (45.457°S, 177.588°E) [
37] is approximately 350 km northwest of the SPA ellipse center (53°S, 169°W) [
38]. During the landing process, the images captured by the LCAM of Chang’e-4 provided an unprecedented opportunity to study the degradation of the population of small impact craters with diameters of 10 m or less in the area.
We selected 25 images captured at different landing altitudes (600 to 30 m). The ground resolution of the captured images increased gradually as the camera descended, and impact craters of sub-meter size can gradually be identified. Because of their high spatial resolution, descent images are ideal for interpreting the small geological structures in landing areas and analyzing the geological evolution of planetary surfaces. An accurate geographic reference is the foundation for mapping and interpretation of planetary geology using descent images. The images from the LCAM, however, do not have geographic coordinates. Therefore, we must introduce images with geographic references to register descent images.
The Chang’e-2 DOM (7 m/pixel) is the lunar global DOM with the highest ground resolution and is thus used as the reference image when registering the descent images. The great difference in spatial resolution between the Chang’e-2 DOM and the descent images, however, presented a serious challenge when selecting corresponding pixels. Thus, we used the LROC NAC image (M1298916428LR) to bridge the gap in resolutions [
39].
We used full-color mosaic images, captured by the lander, and published by China’s Lunar and Deep Space Exploration (CLEP), containing a high-resolution TCAM image of the landing zone displayed by azimuth and cylindrical projections, for the qualitative comparison of craters found in LCAM and TCAM images. To quantitatively compare the results of the impact crater degradation classification, a DEM was acquired from the Yutu-2 rover’s PCAM image to calculate the diameter-to-depth ratio. Considering that the data around the landing site might be affected by the impact of the lander during the landing process resulting in inaccurate DEM results, we selected the PCAM images of the third lunar day of Yutu-2.
3.2. The Mosaic of the Descent Images
We registered and mosaicked the descent images using the method in
Section 2.1. For the acquired LCAM mosaic image, we selected 100 pairs of homonymous points with a uniform distribution between the LCAM mosaic image and the georeferenced LROC NAC images and 50 pairs of corresponding impact craters with diameters larger than 50× pixels to calculate the registration error of the LCAM mosaic image and the diameter deviation of the corresponding impact craters, respectively. The mean and root mean square error (RMSE) of the homonymous points deviation, as well as the RMSE and mean value of the diameter difference of the corresponding impact craters were calculated separately. The results show that the mean value of the homonymous point deviation is 2 pixels and the RMSE is 1 pixel. Moreover, the mean value of impact crater diameter deviation is 2 pixels and the RMSE is 1 pixel, which satisfies the need for subsequent degradation statistical analysis of the crater population.
Based on the obtained LCAM mosaic image, the study area centered on the landing point was defined, covering an area of 146,687 m
2 (408 m from east to west and 386 m from north to south), as shown in
Figure 5b. The resolution is 0.023 m/pixel in the central area and 0.46 m/pixel on the edge. The descent images used in this paper were captured along the optical axis during landing; thus, the size of the extractable impact craters gradually decreased as the ground resolution of the descent images increased, especially in the central landing area where the extractable size could reach the decimeter level. Due to the improved spatial resolution, impact craters as small as 15 cm in diameter could be identified over the central landing area. Therefore, the descent images provided a reliable data source for analyzing impact craters around the landing site.
3.3. Impact Crater Distribution Results
In total, 6316 impact craters were identified and extracted manually. The crater distribution map and the boundaries of craters with different sizes are circled in
Figure 6. As shown in
Figure 6, influenced by the high central resolution and low edge resolution of the LCAM mosaic image, the impact craters are very dense near the center of the landing site and gradually become sparse as they approach the boundary (the pink line of
Figure 6) of the study area. At the same time, smaller size (0.15–0.5 m) impact craters are also distributed around the landing site, while the impact craters become larger at the boundary of the study area. This is because the resolution of the mosaic image obtained from LCAM images is highest around the landing site at 0.023 m/pixel, where the largest number of small impact craters can be identified and decreases to 0.46 m/pixel closer to the boundary of the study area, where only relatively large (>2 m) impact craters can be identified due to resolution limitations. The study data are a mosaic of LCAM images from higher to lower resolution, and the difference in resolution leads to different minimum sizes of impact craters that can be identified in various parts of the study area. As shown in
Figure 6, the study area is divided into four parts, where the area within the red line, the area within the yellow line, the area within the aquamarine line, and the entire mosaic image range corresponds to the minimum diameter of identifiable impact craters of 0.15, 0.5, 1, and 2 m, accordingly. The minimum diameter of identifiable impact craters corresponding to each of the study areas is divided in equal proportion to the total number of impact crater populations, making about 2000 impact craters in each of the four areas. Therefore, the red outlined area, yellow outlined area, aquamarine outlined area, and pink outlined area (the entire area) contain 2341, 2160, 2926, and 2018 craters with diameters of 0.15 m or more, 0.5 m or more, 1 m or more, and 2 m or more, respectively.
The completeness of the impact crater population statistics is mainly limited by the resolution of the images, with impact crater diameters greater than 10× pixels having a high confidence level [
40]. Therefore, to make the statistical analysis of the crater degradation significant, we calculated histograms of the size distribution of the craters above the minimum identified size for the above four study areas and considered the middle 95% of the craters in each area to have a high confidence level. For the four study areas, the minimum statistical diameter of the impact crater is 0.268 m, which is greater than 10× pixels. As shown in
Figure 7, for the red, yellow, aquamarine, and pink outlined areas obtained above, the corresponding diameter intervals of 95% craters in each area are 0.268–1.725 m (contains 2223 impact craters), 0.512–2.612 m (contains 2050 impact craters), 1.026–8.963 m (contains 2781 impact craters), and 2.040–15.449 m, (contains 1916 impact craters). This allows us to perform a degradation analysis of the crater population with crater diameters in the range of 0.268–15.449 m.
3.4. Impact Crater Degradation and Crater Size
All craters in the landing area were classified into degradation levels according to the morphology of the impact craters. The study areas with the classified craters are visualized in
Figure 8. Detailed degradation results for the crater population are provided in
Table 1.
As shown in
Figure 8, the C1 craters (red, fresh craters) in all four study areas are rare, and the distribution is sparse. C2 impact craters (aquamarine, slightly degraded craters) cover more area than C1 craters. C3 craters (yellow, moderately degraded craters) and C4 craters (green, severely degraded craters) extend over a large range of the landing area. Therefore, the craters in the landing area are dominated by C3 and C4 craters, which occupy more than 90% of the craters in the landing area.
In the above, we obtained a 95% confidence interval for the diameter range of impact craters in each study area, and the following statistical analysis of the degradation of the impact crater population was performed using the craters within the diameter range of each study area as a statistical sample. We then calculated the proportion of C1, C2, C3, and C4 in each impact crater statistical diameter interval. The percentage of each degradation level was also calculated for the total number of impact craters in each study area. Additionally, considering that the C3 and C4 types are more likely to be confused and that misclassification may still occur despite the multiple voting method used in the previous section, we also used the C3 + C4 type of impact crater count to represent the more severely degraded craters.
As shown in
Table 1, for the total number of impact craters counted in each study area, C1 craters are the lowest proportion (less than 1%) and C4 craters are the highest (greater than 64%), with C3 + C4 craters accounting for more than 93% of the craters, indicating that the study area is heavily degraded. Furthermore, in those areas, the smaller the impact crater diameter is, the fewer C1–C3 impact craters and the more C4 impact craters there are. In addition, as the crater diameter increases, the proportion of C1–C3 impact craters increases, while the proportion of C4 impact craters decreases (the decrease is 79.46% to 63.67% for the red outlined area and 79.53% to 57.62% for the yellow outlined area). In addition, the proportion of C3 + C4 type impact craters, i.e., more heavily degraded impact craters, decreases as the diameter of the impact craters increases. This finding suggests that the smaller the craters are, the easier they degrade.
For the aquamarine outlined area and the full study area-wide crater population, the 95% crater diameter distribution ranges from 1.026 to 8.963 m and 2.040 to 15.449 m. Overall, the number of craters within the aquamarine outlined area shows an increasing trend for C1, C2, and C3 craters and a decreasing trend for C4 craters as the diameter increases. The percentage of C4 craters decreases from 72.41% to 57.18% for the aquamarine outlined area and from 72.65% to 56.37% for the overall study area. For both areas, overall, the proportion of C3 + C4 craters tends to decrease as the crater diameter increases.
For the population of impact craters within the four study areas in the diameter range of 0.268–15.449 m, the proportion of craters in the C3 + C4 degradation class decreases with increasing diameter.
In the above, we considered 95% of the impact craters in each study area with a high level of confidence, and then we performed statistical analysis on those parts of the impact crater population. The analysis shows a trend of degradation of impact craters on the centimeter to meter scale (0.268–15.449 m). The overall population of impact craters in this size range also shows a trend toward more severe degradation with smaller crater sizes. The specific degradation of these small impact crater populations is summarized as follows:
- (1)
For each study area, the proportion of C4 type impact craters is the highest, exceeding 50% for most areas, while the proportion of fresh impact craters is less than 10%, indicating that impact crater degradation in the Chang’e-4 landing area is severe. The sizes of the craters in the landing area were relatively small (the maximum diameter was 67 m).
- (2)
As the size of the impact craters increased, the proportions of C1, C2, and C3 craters all gradually increased, while the proportion of C4 craters gradually decreased. The C3 + C4 impact craters show the same degradation pattern, which is consistent in all four study areas (for the effective statistical interval, i.e., diameter range corresponding to 95% of the impact crater samples in the study area).
3.5. In Situ Qualitative and Quantitative Validation
We used TCAM images from the Chang’e-4 lander and panoramic camera (PCAM) images from the Yutu-2 Rover for the in-situ cross-check; the results are shown in
Figure 9 and
Figure 10. The TCAM images were used to qualitatively analyze impact craters of different degradation levels from a side-view perspective. The PCAM images are used to obtain the DOM and DEM, where the DEM can be used to calculate the crater depth-to-diameter ratios of impact craters and to quantitatively analyze impact craters of different degradation levels.
For TCAM, we performed a degradation analysis of the impact crater within part of the TCAM panoramic surround image (the region bounded by two white circles in
Figure 9b, corresponding to the area between the two white circles of the LCAM mosaic image in
Figure 9c), which was used to support our classification of the degradation of impact craters. The circular area contains 2371 impact craters in the LCAM mosaic image, representing approximately 36% of all impact craters. Considering the large distortion of the terrain camera data, we compared the morphologies of 100 pairs of more discernible craters and input the results into the classification of the crater degradation levels. In
Figure 9b, we show 12 crater pairs that have been labeled in the image to provide a side-view morphology of the impact craters at different degradation levels from the TCAM.
As shown in
Figure 9b,c, 12 pairs of corresponding craters (four C2, five C3, and three C4 craters) on the ground TCAM image and LCAM mosaic image are linked by red lines. C2 craters (aquamarine) have clear circular shapes, and the inner contrast between bright and dark is clear on the ground TCAM image. C3 craters (yellow) have circular shapes but no discernible rim. C4 craters (green) have hidden circular shapes, the bottoms are infilled, and the crater rims disappear. The classified degradation levels on the LCAM mosaic image are consistent with the TCAM camera images.
Moreover, there are many impact craters of different sizes around the landing point, with varying degrees of degradation. Most craters on the surface are small craters, and their distribution is dispersed across the surface and consistent with their distribution in the descent images. However, only a few small craters have a clear circular shape. Most small impact craters are severely degraded, which is why smaller craters have a higher C4 ratio in the distribution analysis results (
Table 1).
For quantitative validation of impact crater degradation levels, we used the PCAM image of the third lunar day of Yutu-2 and obtained the georeferenced DOM (0.0014 m/pixel) and DEM (0.01 m/pixel) of the region (
Figure 10). The correspondence between the impact crater degradation level and the crater depth-to-diameter ratio in this area was verified. This study area is within the aquamarine outlined area of the LCAM mosaic image, an area where we statistically analyzed craters from 1.026 to 8.963 m in the above section. For the impact craters in this range, a total of 25 craters can be established to correspond to the LCAM mosaic data and the PCAM obtained DOM and DEM (red impact craters in
Figure 10), while compared to the PCAM, two craters are not identified on the LCAM mosaic image in this diameter range. These two impact craters are relatively small, highly degraded, and not identified due to the resolution limitations of this area in the LCAM mosaic image. Thus, the total number of impact craters obtained from the above content impact crater count may be underestimated, but our method identifies at least 92% of the impact craters in the study area and still has a high degree of reliability.
For the relationship between the level of crater degradation and the crater depth-to-diameter ratio, we selected the craters numbered 0–19 in
Figure 10b for the analysis because these craters are in a region with low elevation change and the topography has less influence. However, for the craters numbered 15 and 17, we did not use these two craters for the calculation of the depth-to-diameter ratio because the difference between their sizes and the size of the largest crater in the region exceeded 1 m, considering that the depth-to-diameter ratio was calculated in the case of similar crater sizes. Then, we sorted the diameter-to-depth ratios of the above 18 craters from lowest to highest diameter-to-depth ratio and show the results in
Table 2. Since there are only craters with degradation levels of C3 and C4 in the study area, for these 18 craters, the diameter-to-depth ratios of C4 craters tend to be smaller, while those of C3 craters tend to be larger (
Table 2). Overall, both C3 and C4 impact craters are very shallow, with maximum depths of less than 0.2 cm and impact crater diameter-to-depth ratios of less than 1.121 × 10
−3. Consequently, the DEM-calculated crater depth-to-diameter ratios validate our classification of impact crater degradation levels C3 and C4 as relatively accurate.
4. Discussion
With continued bombardment, the impact crater density of any diameter will eventually reach an upper limit, especially for smaller impact craters [
41,
42]. A crater population smaller than a given diameter is considered to be in equilibrium when the production rate of craters is balanced by the removal rate [
15]. Impact-crater-based lunar surface age determinations should always be performed on impact crater populations larger than the equilibrium onset diameter (
Deq, for a given crater population, the diameter of the largest crater at which the population is in equilibrium), otherwise, misleading dating results will be obtained [
15,
43].
The methods of Gault [
43] and Hartmann [
44] are the widely used methods for evaluating the equilibrium state of impact crater populations, both of which regard certain empirical crater densities as the equilibrium level. Therefore, cumulative size–frequency distribution (SFD) slopes around -2 are often used as empirical equilibrium levels for different impact crater populations. However, reference to the method of Gault and Hartmann can lead to different interpretations of impact crater populations, especially for small-sized impact crater populations in older geological units [
36]. In particular, the age of the geological units in our study area is approximately 3.6–3.7 Gyr old [
36], while the impact craters are mostly below 2 m in diameter and there may also be many secondary impact craters. We used the Craterstats2 [
45] program to plot Hartmann’s equilibrium lines [
44] (black lines in
Figure 11) for the craters in the four study areas and found that the empirical equilibrium levels of Hartmann were not appropriate for our four study areas [
44]. Alternatively, we used a power-law index to obtain the cumulative SFD slope according to Xiao and Werner [
15]. The details are as follows.
In the above, we divided the LCAM mosaic image into four study areas (
Figure 6). In the statistical analysis of impact craters at each degradation level, the small number of impact craters outside the 95% impact crater population, limited by the resolution and size of the study area, will lead to low confidence in the results of the obtained impact crater degradation statistics. Therefore, we performed degradation statistics for 95% of the impact craters in each study area in the above section. However, when analyzing the crater accumulation process, we analyzed the full population of craters to obtain a localized geographical evolution of the four study areas.
For each of the four study areas, the equilibrium state of their impact crater populations was evaluated. We fitted power laws to craters in each study area using the technique by Clausi et al. [
46] to obtain the cumulative SFD slope (the power law exponent is less than the cumulative SFD slope by 1) and the equilibrium onset diameter
Deq (as shown in
Table 3) [
10,
15,
16,
47]. The results show that the crater populations in equilibrium have a cumulative SFD slope of <−2 for both the red and yellow outlined areas (−2.696 and −2.392 for the red and yellow regions, respectively), while the crater populations in equilibrium have a cumulative SFD slope of about −2 for both the aquamarine and pink outlined areas (−1.952 and −1.917 for the red and yellow regions, respectively).
In previous studies, the cumulative SFD slope of decimeters to hundreds of meters in equilibrium for the crater population was −2, while the production SFD slope was −3 [
15,
43,
49]. In contrast, only the cumulative SFD slopes of crater populations in the equilibrium of the pink outline area and aquamarine outline area were approximately −2, a parameter that has been considered to represent equilibrium in previous studies, while the equilibrium onset diameters of the craters in those areas are 3 and 2 m. For impact crater populations with higher resolution and smaller diameter ranges, the red outlined area and the yellow outlined area are found to have the highest resolution areas with steeper cumulative SFD slopes (of −2.696 and −2.392, respectively). In previous studies, smaller diameter impact crater populations were more likely to reach equilibrium [
15]; thus, the red outlined area should be the most likely of the study areas to be in equilibrium. However, this area has the highest cumulative SFD slopes; it seems that the statistical area is far from equilibrium, while the large areas easily reach equilibrium.
Regarding the inconsistency of our findings relative to previous impact crater population equilibrium studies, we also suggest that it is possible that the Chang’e-4 landing area is old with a thick regolith layer [
24], and thus may have a large distribution of secondary impact craters. Such secondary impact craters may be more widely distributed in the centimeter diameter range. A large distribution of secondary impact craters would result in a steeper cumulative SFD slope [
50], resulting in a higher resolution area with a steeper cumulative SFD slope.
Surface resurfacing may also be causing the red and the yellow outlined areas to not be in equilibrium.
Figure 11 shows the cumulative SFDs for four statistical areas.
Figure 11a,b show inflection points, it seems that some magma resurfacing events occurred in the landing area, resulting in some small craters being infilled and thus disappearing in the crater counting results. However, recent research [
51] shows that the landing area is 70 m higher than the surrounding lunar basalt and that the surface materials were mainly ejecta from the Finsen and Alder craters. Therefore, the surface may have not been resurfaced by lava flows.
As shown in
Figure 9a, the ejecta from C3 type crater a1′ infilled and partly resurfaced the neighboring C4 type crater a’ and caused a lower crater density in
Figure 9d. The corresponding crater diameters at the inflection points of
Figure 11a,b are 3 and 8 m, respectively, and the crater excavation depths can be scaled by diameters (0.084:1 for a simple lunar crater [
41,
52]); thus, the initial depth for craters with diameters of 3 and 8 m are 25.3 and 67.2 cm. The depth results show that the smaller the craters, the easier they are infilled by ejecta, while the larger craters show bigger depths to resist this influence.
Considering the existence of five craters with diameters of 15–22 m in the red statistical area and their different degradation levels, these five impact craters formed at different times due to the different degradation statuses. During the impact formation process, the materials were ejected into the surrounding area, thereby covering the neighboring tiny craters and producing an effect like magma resurfacing events.
This ejecta reshaping process may have caused the reduction in the number of craters smaller than 3 m in diameter in the red statistical area. Then, the cumulative SFD of the crater population was reset, and the process of crater accumulation restarted. As the statistical area gradually becomes larger, the crater size corresponding to the inflection points gradually becomes larger (8 m shown in
Figure 11b) and nearly disappears in
Figure 11c,d. This shows that the surface is increasingly difficult to resurfaced by ejecta materials as the craters become larger, and this is likely the reason that the inflection points of the statistical curve of impact craters gradually increase until it disappears.
Unlike previous works [
15,
42,
43], small craters (diameter smaller than 3 m in this work) show an unusual cumulative SFD slope in equilibrium that smaller craters could be resurfaced by the ejecta from neighboring craters and uneasily reach equilibrium [
16]. Considering that, the smaller the impact crater mentioned above is, the more severe the degradation is, the smaller the size of the impact crater is, and the more difficult it is for them to achieve crater equilibrium due to secondary craters and the local resurfacing events caused by ejecta from neighboring craters.


 ,
, 


