Article

Bayesian Sea Ice Detection Algorithm for CFOSAT

Royal Netherlands Meteorological Institute, 3731 GA De Bilt, The Netherlands
*
Author to whom correspondence should be addressed.
Remote Sens. 2022, 14(15), 3569; https://doi.org/10.3390/rs14153569
Submission received: 12 May 2022 / Revised: 18 July 2022 / Accepted: 21 July 2022 / Published: 25 July 2022
(This article belongs to the Special Issue Remote Sensing Applications in Ocean Observation)

Abstract

:
This paper describes the adaptation of the Bayesian sea ice detection algorithm for the rotating fan-beam scatterometer CSCAT onboard the China–France Oceanography Satellite (CFOSAT). The algorithm was originally developed and applied for fixed fan-beam and rotating pencil-beam scatterometers. It is based on the probability of the wind and ice backscatter distances from the measurements to their corresponding geophysical model functions (GMFs). The new rotating Ku-band fan-beam design introduces very diverse geometry distributions across the swath, which leads to three main adaptations of the algorithm: (1) a new probability distribution function fit for the backscatter distances over open sea; (2) a linear ice GMF as a function of incidence angle; (3) the separation of outer swath wind vector cells ((WVCs) number 1, 2, 41, 42) from the other WVCs to form two sets of probability distribution function fits for these two WVC groups. The results are validated against sea ice extents from the active microwave ASCAT and the passive microwave SSMI. The validation shows good agreement with both instruments, despite the discrepancies with SSMI during the melting season, and this discrepancy is caused by the lower sensitivity of the passive microwave to detect the ice at a low concentration with a mixed water/ice state, while the scatterometer is more tolerant regarding this situation. We observed that the sea-ice GMF regression between HH and VV sea-ice backscatter at low and high incidence angles decorrelates at around −12 dB (28 ° ) and −20 dB (50 ° ) and an experiment with truncated backscatter values at these incidence angles is executed, which significantly improves the year-long average sea ice extents. In conclusion, the adapted algorithm for CSCAT works effectively and yields consistent sea ice extents compared with active and passive microwave instruments. As such, it can, in principle, contribute to the long-term global scatterometer sea ice record, and as the algorithm was adapted for a rotating fan-beam scatterometer, it also can serve as a guideline for the recently launched, dual-frequency, rotating fan-beam scatterometer WindRAD.

1. Introduction

Sea ice plays an important role in global climate change, and the polar regions are a central focus of climate studies due to the significant changes that have been observed by satellites over time [1,2,3,4]. Satellite observations have been supporting the growing interest in polar regions in recent decades and the daily long-term historical sea ice extent records have been assessed and mediated by passive microwave sensors [5]. Active microwave scatterometer methods have also been developed to map sea ice extents, etc., and proven to be powerful [6,7,8,9]. The Bayesian sea ice detection algorithm developed for scatterometer was first applied on C-band fixed fan-beam European Remote Sensing satellite (ERS) data [10], then on Ku-band rotating pencil-beam Quick Scatterometer (USA QuikSCAT) data [9] and finally on the European C-band fixed fan-beam Advanced Scatterometer (ASCAT) data [11]. An independent record of sea ice extents has been produced from intercalibrated scatterometer data from 1992 to 2016 with ERS, QuikSCAT and ASCAT [12,13]. Bayesian sea ice detection, applied using the above scatterometers, demonstrated excellent agreement with passive microwave records during freezing seasons, and more sensitivity during melting seasons, as compared to passive microwave [9]. This is caused by a low concentration and mixed water/ice conditions [14,15,16]. In this context, Bayesian sea ice detection for scatterometers can serve as a nice complement to passive microwave products, especially for mixed and saturated water/ice surface states.
In late 2018 the China-France Oceanography SATellite (CFOSAT) was launched with a new type Ku-band scatterometer, CFOSAT Scatterometer (CSCAT), with a unique design of a rotating fan-beam antenna [17,18,19]. The aim of this paper is to adapt the Bayesian sea ice detection algorithm to the rotating fan-beam CSCAT, investigate sea ice mapping capabilities, generate sea ice extents and validate these using both active and passive microwave radiometers. The adapted Bayesian sea ice detection algorithm for CSCAT provides the possibility of continuous scatterometer sea ice records and more diverse ice backscatter information and can also serve as a guideline for another recently launched dual-frequency rotating fan-beam Wind Radar scatterometer (WindRAD) on board FY-3E (Feng Yun-3E) [20].
Section 2 describes the details of the Bayesian algorithm adaptation. Section 3 describes the sea ice detection results of CSCAT, including a discussion and cross-validation of the sea ice extent and sea ice edges among CSCAT, ASCAT, and the Special Sensor Microwave/Imager (SSMI). Conclusions are given in Section 4.

2. Algorithm Description and Adaptation

Ocean-surface wind speed and wind-direction retrieval are the prime purpose of scatterometers. However, they have also been used to detect and characterize sea ice [7,21]. The sea ice detection method we propose here is an adapted version of the existing algorithm developed for pencil-beam scatterometers such as QuikSCAT [9]. CSCAT and QuikSCAT both have rotating beams at the Ku-band radar frequency. The differences are as follows: CSCAT has a rotating fan-beam, emitting alternating HH/VV polarized pulses, whereas QuikSCAT has two rotating pencil or spot beams, one with HH polarization and the other with VV polarization. CSCAT flies in a sun-synchronous near-circular orbit at an altitude of 519 km. It can provide global wind field coverage within 3 days. The rotating fan-beam design results in multiple overlapping views with diverse incidence and azimuth angles in each individual Wind Vector Cell (WVC). At the same time, this design also yields unbalanced geometry diversity across the swath: outer-swath WVCs contain little diversity, where only side-looking azimuth angles and high incidence angles are available; sweet-swath WVCs contain the most diverse geometries and nadir-swath WVCs contain mainly fore/aft-looking azimuth angles, together with a large range of incidence angles [19]. A rotating pencil-beam scatterometer, such as QuikSCAT, on the other hand, has two fixed incidence angles of 46° for the HH polarization beam and 54° for the VV polarization beam and yields four views for each WVC in most parts of the swath. In the outer swath, only VV polarization measurements are available.
Section 2.1 provides a summary of the Bayesian algorithm for the pencil-beam scatterometer QuikSCAT, which is followed by a description of the adaptation made for CSCAT in Section 2.2. A detailed description of the QuikSCAT algorithm and its validation can be found in [9].

2.1. The Bayesian Sea Ice Detection Algorithm for QuikSCAT

The distribution of the backscatter values, from open water on the one hand and from the sea ice surface on the other hand, occupies distinct sectors in the backscatter measurement space with fore and aft HH and VV backscatter values serving as an axis in a 4-dimensional (4D) measurement space. The surface scattering caused by the wind over open water shows azimuthal anisotropy and a conical surface [10] in 4D, whereas the scattering from the sea ice slab is azimuth-invariant with stronger returns, particularly for HH, and the ice backscatter geophysical model function (GMF) is a linear model of HH and VV backscatter values as a function of sea ice age, thickness or roughness [9,11,12]. The Bayesian ice probability p ( i c e | σ ° ) algorithm combines the prior knowledge of the sea ice probability for a specific location, p 0 ( i c e ) , with the newly available satellite information, based on conditional probabilities and modelled as a function of the distance to the ocean-wind GMF or sea-ice GMF, respectively:
p ( i c e | σ ° ) = p ( σ ° | i c e ) p 0 ( i c e ) p ( σ ° | i c e ) p 0 ( i c e ) + p ( σ ° | w i n d ) p 0 ( w i n d )
where p ( σ ° | w i n d ) is the conditional probability of σ ° s given wind (in the case where we would measure wind over open sea), i.e., following the wind σ ° distribution around the ocean GMF; p ( σ ° | i c e ) is the conditional probability of σ ° given ice (in the case where we would measure over ice), i.e., following the typical ice σ ° distribution around the sea-ice GMF in measurement space. Note that p 0 ( w i n d ) = 1 p 0 ( i c e ) . The normalized measures of distance between the observed backscatter values and GMFs are derived by maximum likelihood estimates (MLEs):
p ( σ ° | w i n d ) = p ( M L E w i n d )  
p ( σ ° | i c e ) = p ( M L E i c e )  
p 0 ( i c e ) and p 0 ( w i n d ) are a-priori probabilities; they are initialized as p 0 ( i c e ) = 0.50 and p 0 ( w i n d ) = 1 p 0 ( i c e ) and updated after every orbital pass with the previous posterior p ( i c e | σ ° ) . The posterior sea ice probability is spatially smoothed once a day and p 0 ( i c e ) is relaxed for the next day’s processing a priori:
p 0 ( ice ) = { 0.50           i f   p ( i c e | σ ° ) > 0.30 0.15           i f   p ( i c e | σ ° ) < 0.30
The relaxation setting aims to avoid saturation in the Bayesian filter. These settings maximize the quality of the prior information regarding sea ice detection and suppress the rain contamination effect. A sea ice coverage map is produced daily on a 12.5 km polar stereographic grid with a 55% threshold to the posterior probability p ( i c e | σ ° ) , i.e., each pixel with a posterior probability above 55% is considered to be covered with ice. The 55% threshold is chosen to have the best match with the 15% sea ice concentration edge derived from passive microwave radiometers during the sea ice growing season. The sea-ice backscatter normalized values are plotted in the sea ice maps, indicating the sea ice roughness, age, or thickness.

2.2. The Adapted Bayesian Ice Detection for CSCAT

As described at the beginning of Section 2, CSCAT differs from QuikSCAT by its rotating fan-beam. This important feature leads to the diverse geometries distributed across the swath, and this diversity also causes the probability distribution of M L E w i n d and M L E i c e to differ from QuikSCAT. New probability distribution fits for p ( M L E w i n d ) and p ( M L E i c e ) are needed to derive p ( σ ° | w i n d ) (Equation (2)) and p ( σ ° | i c e ) (Equation (3)).
Liu et al. [22] describe a sea ice detection method for CSCAT as well, but in comparison to this work it is simplified by only using HH and VV polarized beams from two azimuth angles and an incidence angle of 40 degrees, which is a rather direct adaptation from the method as applied for pencil-beam scatterometers. Our implementation includes all the measurements and classifies them into different groups to find corresponding and suitable probability distribution functions, and it also diagnoses the incidence angle dependency influences, which is a tailor-made version for CSCAT. Our method thereby follows earlier implementations of the Bayesian sea ice detection method for ERS and ASCAT, which [22] did not consider.

2.2.1. Probability Distribution of p ( σ ° | wind )

The wind inversion computes the minimum squared distances, called the maximum likelihood estimator (MLE) [23], and this is implemented in the CFOSAT Wind Data Processor (CWDP):
M L E w i n d = i = 1 N ( σ ° o b s , i σ ° w i n d , i ) 2 v a r [ σ ° w i n d , i ]
where σ ° o b s , i is the measured σ ° , and σ ° w i n d , i is computed from the Ku-band GMF for a given wind speed, wind direction, azimuth and incidence angle, i is the view number, N is the number of views in a WVC, and v a r [ σ ° w i n d , i ] is the expected Gaussian observation noise for view i.  M L E w i n d is normalized with v a r [ σ ° w i n d , i ] to make sure that the variance in backscatter values around the GMF equals unity. In this way, M L E w i n d is expressed as a sum of the squares of N standard normal random variables. For QuikSCAT, the number of views is four for all the WVCs; hence, M L E w i n d , Q u i k S C A T is the squared distance of the four-dimensional wind backscatter vector from a two-dimensional ocean GMF, varying with wind speed and direction. Therefore, the probability of M L E w i n d , Q u i k S C A T can be expressed as a chi-square distribution with two independent degrees of freedom [9]. However, for CSCAT, the number of views is variable across the swath [19]. Hence, the probability distribution of the M L E w i n d is multi-dimensional, with two degrees of freedom, and cannot be simply classified into a chi-square distribution, although it can be empirically derived. The probability of M L E w i n d as a function of WVC has been tested and the distribution per WVC looks very similar, so it is not necessary to perform p ( M L E w i n d ) per WVC. Figure 1 shows the observed probability distribution of M L E w i n d in blue. The best analytical fit is an inverse gamma distribution, as in Equation (6):
p ( M L E w i n d ) = x α 1 Γ ( α ) e 1 x 1 s c a l e
where x = M L E w i n d l o c s c a l e ,   l o c = 0.22 , α = 0.44 , s c a l e = 4.81 , Γ ( α ) is the gamma function. The observed distribution of M L E w i n d to the ocean GMF closely agrees with this inverse gamma distribution, as shown in Figure 1. Thus, p ( σ ° | w i n d ) can be expressed with the function proposed in Equation (6).

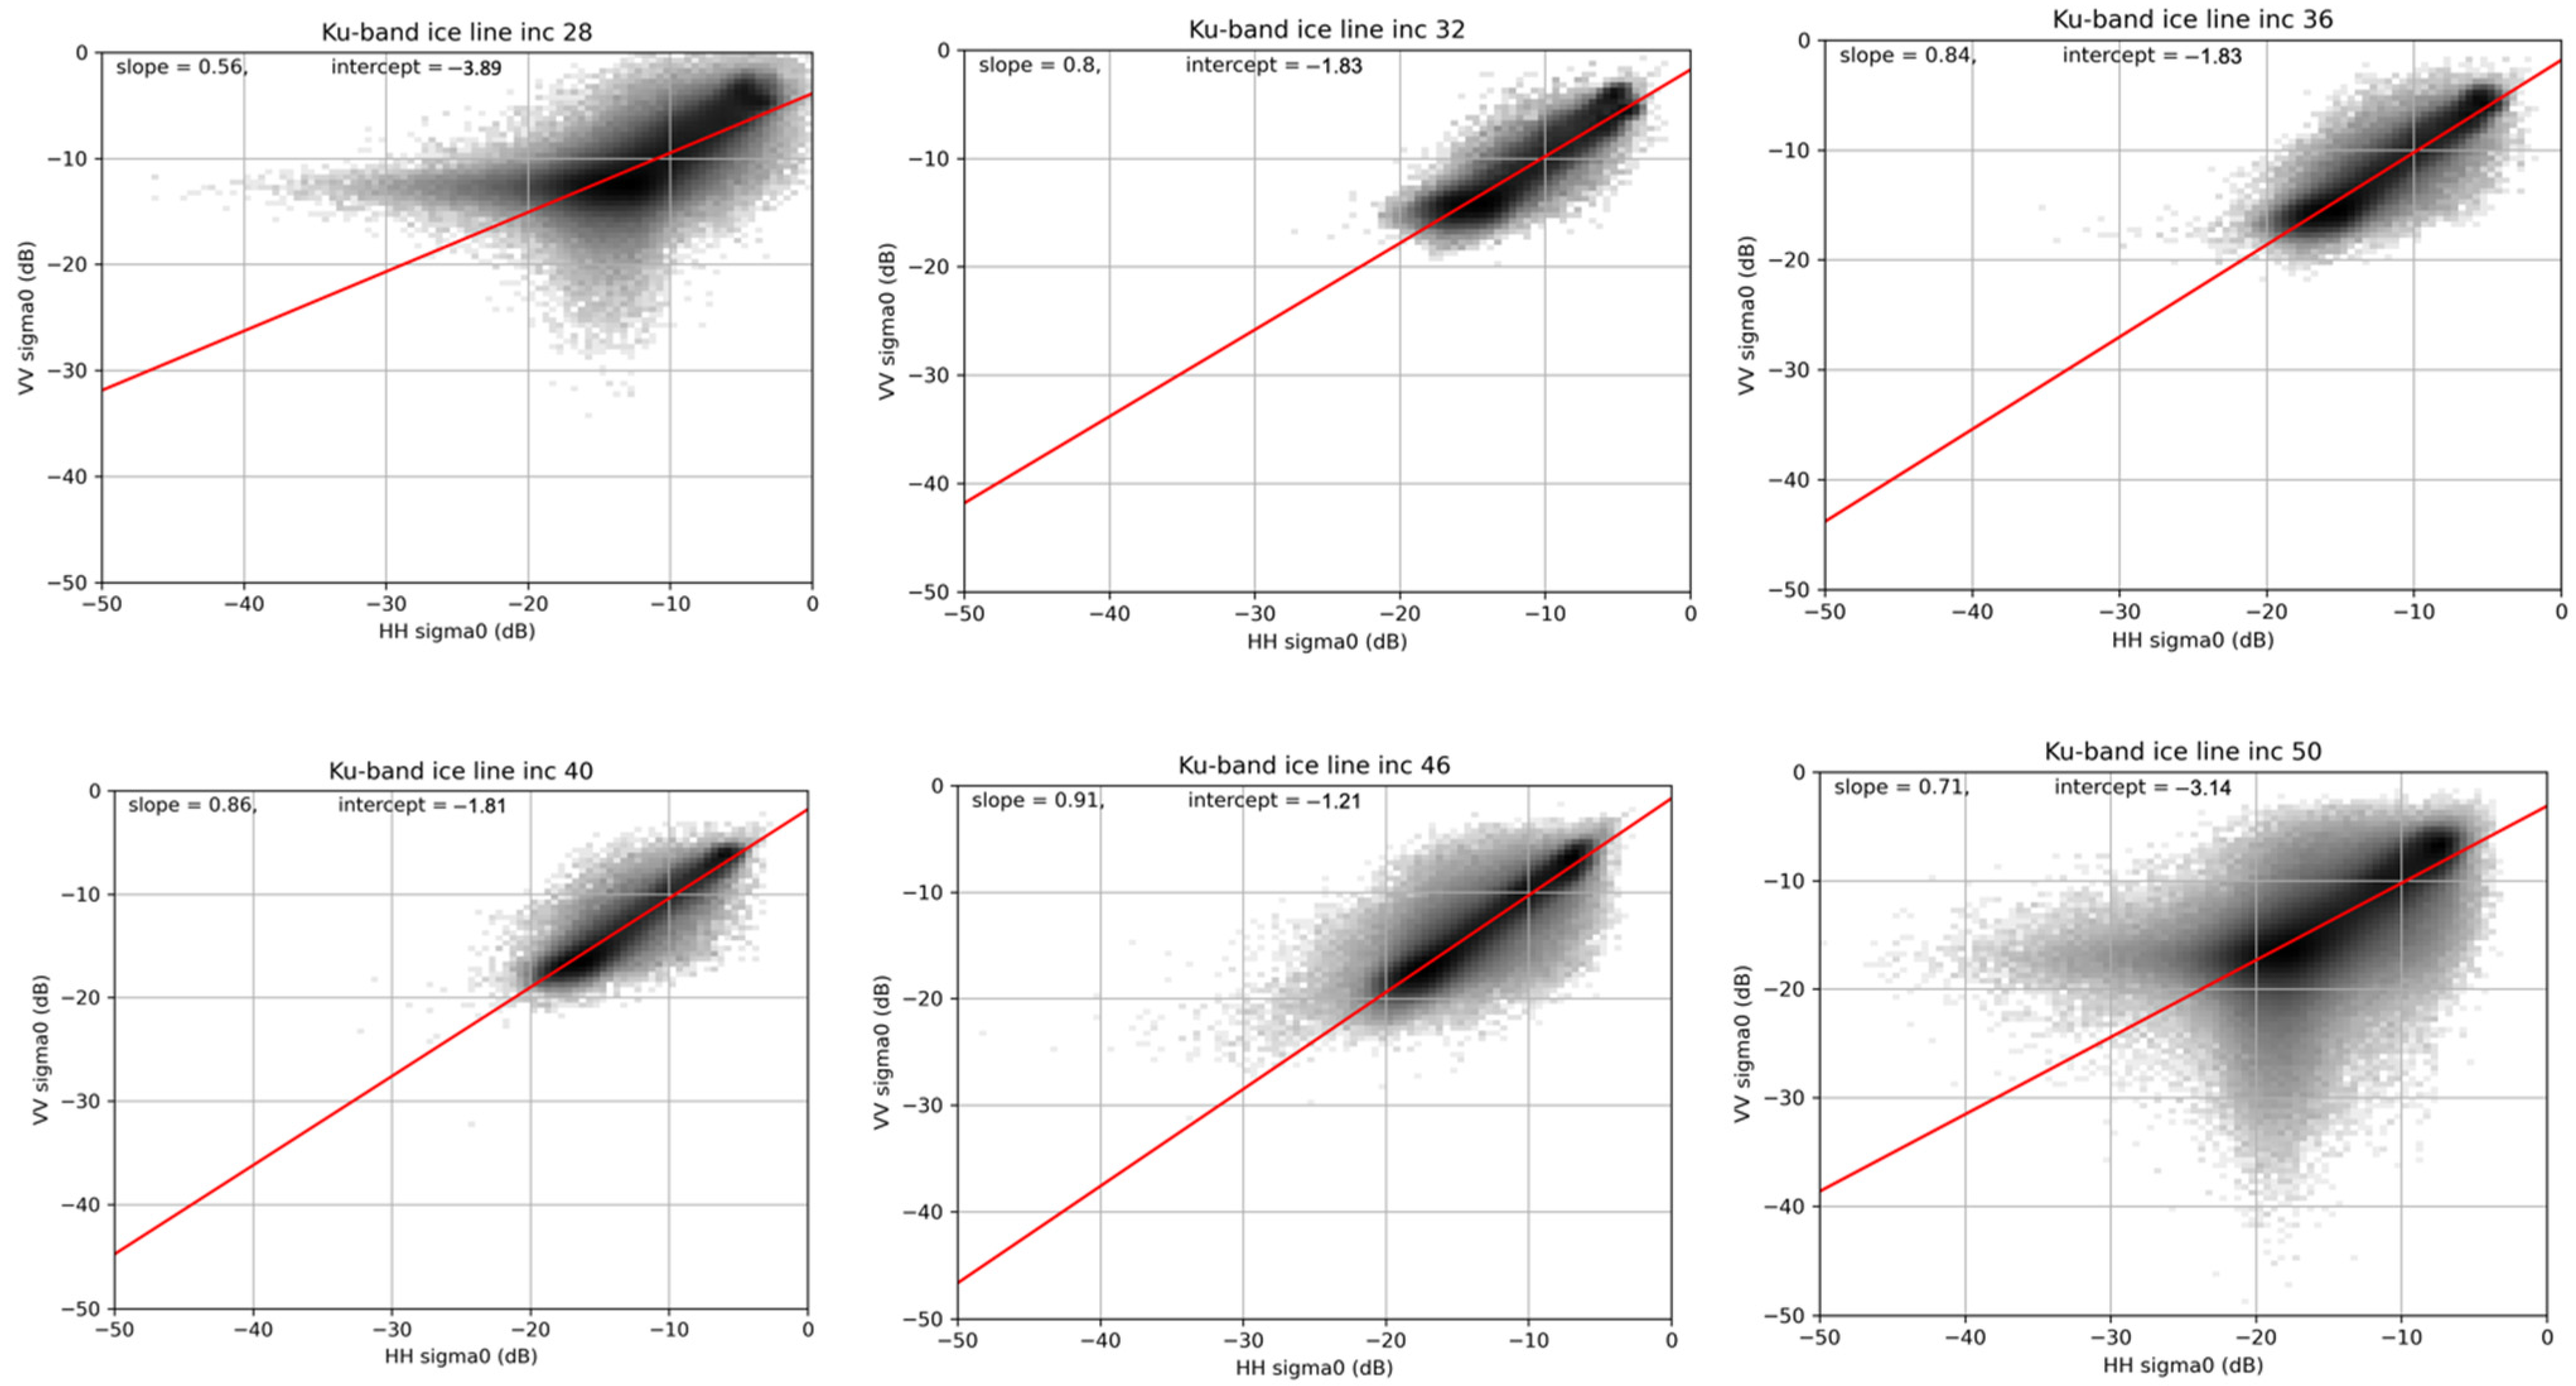
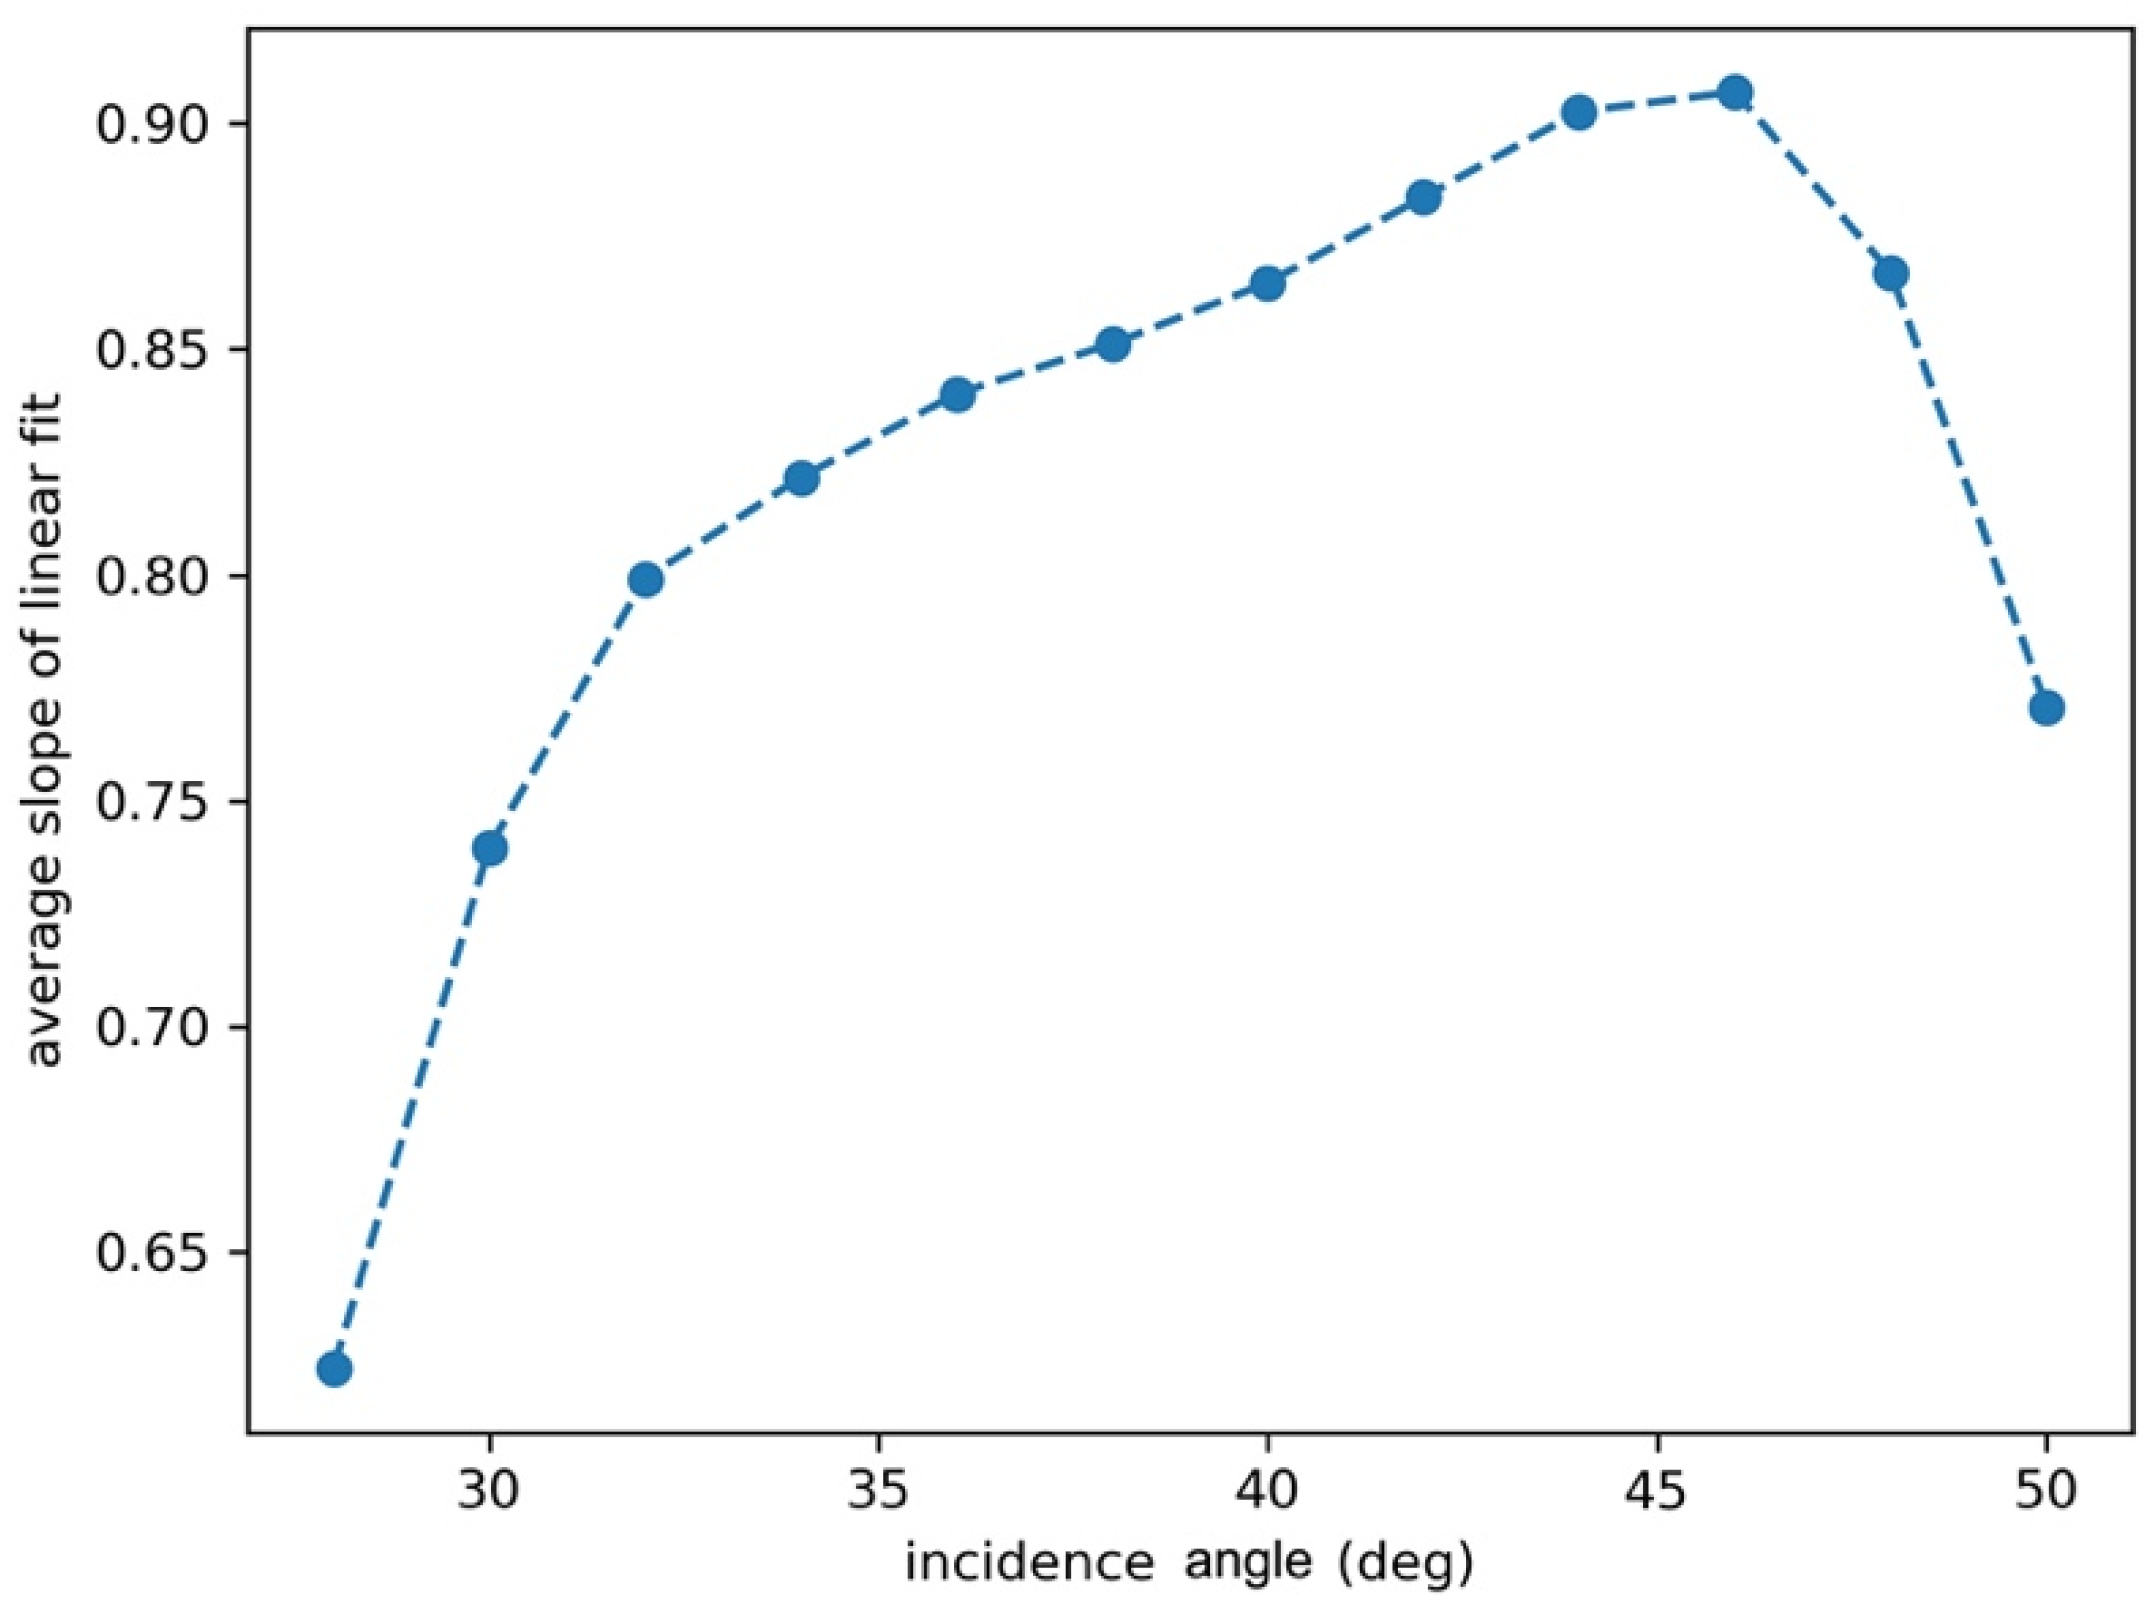
2.2.2. Probability Distribution of p ( σ ° | ice )

Statistical knowledge is needed to derive the Ku-band sea-ice GMF for CSCAT as a function of incidence angle; hence, the actual distribution of the sea-ice backscatter values in the measurement space is derived by selecting the data located over the Arctic ice shelf with a latitude larger than 70°, a Sea Surface Temperature (SST, from ECMWF) lower than −1 °C and ice flags from the level-1b dataset if applicable. As described in Section 2.1, the sea-ice GMF is a linear function, which we can write as:
σ ° V V , i c e = σ ° H H , i c e × s l o p e + o f f s e t
The slope and offset are estimated using a 2D symmetric regression with VV against HH. Note that this symmetric regression only provides a reasonable result when VV and HH have similar noise characteristics, which might lead to inaccurate regression at incidence angles with different noise characteristics (particularly at low and high incidence angle). The σ ° s over sea ice (as described at the beginning of 2.2.2) are binned into incidence angle bins, with a 1° interval for VV and HH, respectively, and then 1-degree Polyfit is applied on the VV and HH σ ° s in the same incidence angle bin to derive the slope and offset in Equation(7) for every incidence angle bin (this method is referred to as all_inc from now on). Figure 2 shows the seasonal dependence of the sea-ice GMF slopes over the year 2019 in the Arctic. There is an obvious dispersion among different incidence angles (note that there was an instrument restart in July and a change to a redundant channel by the end of the year). The seasonal dependence is caused by the presence of mixed ice-water areas during the melting season in the summer, which negatively biases the slopes for all incidence angles. The slopes generally increase with increasing incidence angle, except around the incidence angle bin of 50°, most probably due to the much higher noise level in the backscatter values and the unsymmetric noise characteristics between VV and HH at a high incidence angle, as we described earlier. The dispersion of the slopes for different incidence angles becomes much narrower after the instrument restarted in July. One possible reason for this is that it is the melting season, meaning that the regression results are not the same as in the January to March period due to the water/ice mixture. Another reason is that σ ° s, on average, started to drift after the instrument restarted. At the beginning of November, the slope dispersion among the different incidence angles returns and the values become generally larger than at the beginning of the year because the level 1b data processing version was updated. Fortunately, the data were stable when the sea ice was formed and stable in the Arctic from January to March, we can use this period to derive the sea-ice GMF.
The mean slopes per incidence angle from the Arctic winter (from January to March) are taken as representative of pure-ice backscatter for the sea-ice GMF (Equation (7)). The scatter plots of the sea-ice backscatter values, together with the corresponding sea-ice GMF per selected incidence angle, are shown in Figure 3. The distribution of the distances between sea-ice backscatter values and the corresponding GMF is Gaussian, which is shown per selected incidence angle in Figure 4. The standard deviations are the largest at the lowest incidence angle of 28° and the highest incidence angle of 50°, where the standard deviation is around 2. The values at the other incidence angles are mainly between 1.0 and 1.2. This can also be observed in Figure 3: the regressions at 28° and 50° do not follow the scatter plot’s highest density at high σ° values due to the decorrelation of the VV and HH backscatter at around −12 dB (28° and −20 dB (50°). These limits are most pronounced in VV and a broader decorrelated cloud of points is visible in HH, which suggests that the noise is more disturbing for HH. As we described earlier, the regression might provide inaccurate results if the VV and HH beams are uncorrelated and contain asymmetric noise characteristics, as shown here at 28° and 50°. Hence, we exclude dB values below −10 dB for 28° and 50° (referred to as truncated_inc). Figure 5 gives the averaged slope as a function of the incidence angle for truncated_inc with an increased slope at 28° (from 0.56 to 0.62) and 50° (from 0.71 to 0.77), and Figure 6 illustrates the sea-ice GMF with truncated_inc as a function of incidence angle. For pencil-beam instruments (e.g., SeaWinds), as the VV beam has a fixed incidence angle of 46° and the HH beam has a fixed incidence angle of 54°, its sea-ice GMF has a slope of around 1. The slope for CSCAT increases with increasing incidence angle, reaches saturation at a higher incidence angle 46° with value 0.91, and then goes down. In comparison with SeaWinds, it seems that the slope saturates at higher incidence angles and then tends to go downward.
The sea-ice GMFs (slope and offset) are constructed as a function of incidence angle (bin size is 1°) from the HH and VV backscatter measurements over sea ice (Figure 6). Therefore, the minimum squared distance from sea-ice backscatter to sea-ice GMF in each WVC can be expressed as follows:
M L E i c e = i = 1 N ( σ ° o b s , i σ ° i c e , i ) 2 v a r [ σ ° i c e , i ]
where σ ° o b s , i is the measured σ ° HH and VV pair, i is the pair number, N is the number of pairs in one WVC and σ ° o b s , i σ ° i c e , i is the distance from the HH and VV pair to the sea-ice GMF. v a r [ σ ° i c e , i ] is the squared standard deviation of the corresponding sea-ice backscatter distances’ distribution against the sea-ice GMF, as described above.
For QuikSCAT, the probability distribution of M L E i c e is modelled as a chi-square distribution with three independent degrees of freedom, since four backscatter measurements are present in all WVCs and the sea-ice GMF is one-dimensional. For CSCAT, the probability distribution of M L E i c e cannot be modelled in the same way due to the varying number of views and HH/VV pairs in different WVCs across the swath. Probability distributions of M L E i c e in some selected WVCs are shown in Figure 7. The selected WVCs are representative across the swath for an outer-swath WVC, a sweet-swath WVC and a nadir-swath WVC. The distribution of M L E i c e in outer-swath WVCs is quite different from the distributions in sweet and nadir WVCs; thus, the WVCs across the swath are grouped into two: one is the ‘outer group’ of numbers 1, 2, 41 and 42; the other one is the ‘rest group’ of numbers 3 to 40. The outer group contains only high-incidence-angle observations (Figure 8a) due to the incidence angle distribution across the swath (Figure 8b). The incidence angles become more mixed for WVCs closer to the sweet and nadir swath; this causes the quite different p ( M L E i c e ) distributions in the outer group as compared to the rest group. Thus, the p ( M L E i c e ) is empirically and separately fitted for the outer group and the rest group (Figure 9). The best probability distribution fit for both groups is a chi-square distribution, but with different parameter values:
p ( M L E i c e ) = ( M L E i c e l o c ) k 2 1 2 k 2 Γ ( k / 2 ) e M L E i c e l o c 2
for the outer group: k = 3.35 , l o c = 0.1 and for the rest group: k = 1.5 , l o c = 0.2 . The observed distribution of M L E i c e closely agrees with the chi-square distribution, as shown in Figure 9. Thus, p ( σ ° | i c e ) can be expressed as in Equation (9). Note: the fittings shown here are for all_inc., while p ( M L E i c e ) for truncated_inc: outer group is equal to Equation (9) + 0.01; while the rest group is the same setting as Equation (9).
The Bayesian sea ice detection algorithm in Equation (1) can now be solved with the newly constructed p ( σ ° | w i n d ) , p ( σ ° | i c e ) and the prior p 0 ( i c e ) and p 0 ( w i n d ) .

3. Results and Discussion

Two data sources from the year of 2019 were applied to validate the adapted Bayesian sea ice detection algorithm for CSCAT. One data source is the sea ice extent produced from ASCAT with the KNMI (Royal Netherlands Meteorological Institute) Bayesian sea ice detection algorithm [11]. The other data source is the sea ice extent derived from the ice concentration data generated by the NASA team’s NT algorithm from the passive microwave radiometer SSMI using a 15% isoline [24]. The all_inc method was first used for the validation, and then the truncated_inc method was applied for comparison.
Figure 10 shows the sea ice maps filled with normalized sea-ice backscatter values, which proxies as ice age or thickness, as well as the geographical behavior of sea ice extent on 10 January 2019 for CSCAT, SSMI (15% concentration threshold), and ASCAT in the Arctic (winter) and Antarctic (summer). All maps are masked with the same land and polar gap mask. As expected, the contrast between multi-year ice (bright) and first-year ice (dimmer) is stronger for CSCAT than ASCAT, while ASCAT gives a stronger response at the edge of the ice area. These are caused by their different frequencies. CSCAT operates at Ku-band, with a shorter wavelength than the ASCAT C-band. The shorter wavelength has a lower response on the rafted sea ice on the edge and is more responsive to rough multi-year ice. The three datasets in general agree well with each other in the Arctic (winter), while there are more disagreements in the Antarctic (summer) between the scatterometer instruments (CSCAT and ASCAT) on the one hand and passive microwave SSMI on the other hand. The ice edges of the three instruments (Figure 11) clearly show the discrepancy between active scatterometer and passive microwave in summer (Antarctic) because the sea ice state is mixed with open water and the passive microwave instrument has difficulties detecting this.
Daily Arctic and Antarctic ice extents were produced over the year 2019 (Figure 12). We observe a large increase in sea ice extent in the Arctic from mid-July to Aug for CSCAT (indicated in Figure 12 with a rectangular box), which was caused by an instrument restart in mid-July. The restart was necessary to correct a mis-registration of the time in the level0 data and a stabilization period was needed afterwards as we learned from communication with National Satellite Ocean Application Service (NSOAS), China. This restart did not have the same impact in the Antarctic because it was wintertime. Thus, the sea ice formed solidly and the wind speed was much higher than in the Arctic. A lower wind speed corresponds to lower backscatter values, which causes a noisier M L E w i n d , and can reduce the ice screening skill in the Arctic summer; thus, together with the instrument restart incident, the impact was obverse in the Arctic. Apart from this interruption, CSCAT and ASCAT in general agree with each other well throughout the year. Both in the Arctic and the Antarctic, the two scatterometers show better agreement in summer than in winter. The agreement between CSCAT and ASCAT in winter (starting from spring) is less as compared to QuikSCAT and ASCAT [11]. A possible reason for this is that CSCAT data are much noisier than QuikSCAT due to the rotating fan-beam design and the CSCAT asymmetric noise characteristics, not fitting the sea-ice GMF well at both low and high incidence angles, which might lead to misdetection during the high ice extents season. However, the average difference (excluding the instrument restart period) is relatively small, 0.18 million km2 in the Arctic and 0.13 million km2 in the Antarctic, and the truncated_inc method further improves the agreement between CSCAT and ASCAT (Figure 13). The result shows the capability of the newly developed Bayesian sea ice detection algorithm for rotating fan-beam scatterometers and the possibility of adding new, consistent data to the existing scatterometer sea ice record. The difference between CSCAT and SSMI was smallest during the autumn and winter months for both the Arctic and Antarctic, whereas the larger discrepancies begin from spring’s rapid sea ice melting and summer’s rapid sea ice advance period. This is a typical discrepancy between the active and passive radiometers, associated with the low sensitivity of the passive microwave radiometer to melting/mixed sea ice conditions [14]. This discrepancy also indicates that the active microwave scatterometers are more sensitive and proficient at detecting or distinguishing the sea ice in mixed sea ice and water states during the spring and summer seasons.
As we describe in Section 2, the regressions at 28° and 50° do not follow the highest density of scattered data points at high σ° values due to the decorrelation of the VV and HH at around −12 dB (28°) and −20 dB (50°). Hence, the truncated_inc test is proposed and applied. The sea ice extents are similar to those from the all_inc method and agree well with ASCAT and SSMI. If we take ASCAT as a reference, the difference in the year-long average sea ice extent (excluding the instrument restart period) between truncated_inc and ASCAT is 0.05 million km2 in the Arctic and 0.01 million km2 in the Antarctic, which reduces the differences by 72% and 92%, respectively, as compared to all_inc (Table 1).
The sea ice retrieval at outer-swath WVCs is only influenced by high incidence angles of around 50°, and corresponds to a larger standard deviation in the backscatter values against the linear ice model. This may cause more uncertainty in the retrieval. We simply exclude incidence angles larger than 49° from the sea ice retrieval and refer to this as exclude_inc. This leads to a narrower usable swath width by about two WVCs (i.e., 50 km). However, the swath width is still wide enough to obtain daily coverage in the polar regions. The sea ice extent results show that the year-long average sea ice extent difference (excluding the instrument restart period) between exclude_inc and ASCAT is 0.13 million km2 in the Arctic and 0.08 million km2 in the Antarctic, which reduces the differences by 28% and 38%, respectively, as compared to all_inc (Table 1).
This indicates that the sea ice algorithm skill improves when using the truncated_inc and exclude_inc methods. The truncated_inc method shows results that are more consistent with ASCAT as compared to exclude_inc, without reducing the usable swath width. Figure 13 shows the daily ice extents of all_inc, truncated_inc and ASCAT in 2019, excluding the instrument restart period (exclude_inc is not shown because the difference between exclude_inc and all_inc is smaller than the difference between truncated_inc and all_inc, which makes it difficult to see), and truncated_inc is usually closer and more consistent to ASCAT than all_inc. Thus, we suggest applying the truncated_inc method as the final Bayesian sea ice detection algorithm.

4. Conclusions

In this paper, the details of the Bayesian sea ice detection algorithm’s adaptation to CSCAT onboard CFOSAT are exploited. The main adaptations include: (1) a new fit for the probability distribution of p ( σ ° | w i n d ) ; (2) the introduction of an incidence angle dependency to the linear ice model; (3) the identification of the distinct probability distribution p ( σ ° | i c e ) difference between the outer swath WVCs (number 1, 2, 41, 42) and the other WVCs, and the construction of different probability fits for these two groups. The performance of the new algorithm is validated against active (ASCAT) and passive (SSMI) microwave data at a global and seasonal level. CSCAT provides consistent sea ice extents, which agree well with ASCAT and SSMI, despite the instrument restart and stabilization period after late July, 2019. There was a larger discrepancy between CSCAT and SSMI during the sea ice’s fast advancing and retreat episodes, caused by the well-known passive microwave issue of identifying mixed sea-ice and open-water conditions. The scatterometer appears again more sensitive to the detection of low ice concentration and water/ice mixed situations as compared to passive microwave instruments. We observed a larger standard deviation in the ice backscatter compared to the linear ice model for both the lowest and highest incidence angles. Therefore, two extra experiments were conducted: truncating the sea-ice backscatter values below −10 dB at incidences of 28° and 50° (truncated_inc) and excluding high-incidence angles (>49°, exclude_inc). Both tests reduce the year-long average difference in sea ice extents between CSCAT and ASCAT, and the truncated_inc method shows the largest improvement, with 72% and 92% reductions in the difference in the Arctic and the Antarctic, respectively. The truncated_inc test did not reduce the usable swath width, whereas the exclude_inc filter reduces the usable swath width by about 50 km. We recommend using the exclude_inc mode, as swath width is not critical for CSCAT. Overall, the adapted Bayesian sea ice detection for the Ku-band rotating fan-beam CSCAT instrument shows consistency with other active and passive microwave instruments. The active instrument shows more inclusive ice detection at water/ice mixed seasons compared to the passive microwave instruments, as expected. The Bayesian sea ice detection algorithm has now been successfully implemented for all scatterometer types; its performance appears consistent and of high quality. As CSCAT is the first rotating fan-beam scatterometer in orbit, the adapted algorithm can also serve as a guideline for the recently launched dual-frequency rotating fan-beam Wind Radar scatterometer (WindRAD). For future elaboration, CSCAT has the potential to further identify sea ice types: first-year ice and multi-year ice and to explore/inter-compare with the sea ice product from the SWIM instrument, which is also onboard CFOSAT. In addition, it is possible to provide a long-term global scatterometer sea ice record in the case of a stable CSCAT instrument.

Author Contributions

Conceptualization, Z.L. and A.V.; methodology, Z.L. and A.V.; software, Z.L. and A.V.; validation, Z.L.; formal analysis, Z.L.; investigation, Z.L.; resources, A.S.; data curation, Z.L.; writing—original draft preparation, Z.L.; writing—review and editing, A.V. and A.S.; visualization, Z.L.; supervision, A.S. and A.V.; project administration, A.S., Z.L. and A.V.; funding acquisition, A.S., A.V. and Z.L. All authors have read and agreed to the published version of the manuscript.

Funding

This research was supported by EUMETSAT OSI SAF CDOP4 (Darmstadt, Germany) and CNES CF-GSFR-CR-2410-CNES (Toulouse, France).

Data Availability Statement

The data used in the paper are available with the permeant URLs: (the URLs will be obtained upon the paper acceptance from KNMI data platform), which can be accessed via API through KNMI open data platform. There is an introduction on the webpage showing how to connect and download the data through API; it is also possible to browse the dataset and retrieve specific files. The CFOSAT Wind Data Processor (CWDP) used in the study is available at EUMETSAT NWP SAF website: https://nwp-saf.eumetsat.int/site/software/scatterometer/cwdp/(accessed on 23 April 2022), registration is needed to access the software.

Acknowledgments

We acknowledge the support of the CFOSAT team, CNES and NSOAS in providing the data, status and mission information. The support from the EUMETSAT Ocean and Sea Ice Satellite Application Facility is further much appreciated.

Conflicts of Interest

The authors declare no conflict of interest.

References

  1. Comiso, J.C.; Parkinson, C.L.; Gersten, R.; Stock, L. Accelerated decline in the Arctic sea ice cover. Geophys. Res. Lett. 2008, 35, 1–6. [Google Scholar] [CrossRef] [Green Version]
  2. Stroeve, J.C.; Serreze, M.C.; Holland, M.M.; Kay, J.E.; Malanik, J.; Barrett, A.P. The Arctic’s rapidly shrinking sea ice cover: A research synthesis. Clim. Change 2012, 110, 1005–1027. [Google Scholar] [CrossRef] [Green Version]
  3. Stroeve, J.; Notz, D. Changing state of Arctic sea ice across all seasons. Environ. Res. Lett. 2018, 13, 103001. [Google Scholar] [CrossRef]
  4. Parkinson, C.L. A 40-y record reveals gradual Antarctic sea ice increases followed by decreases at rates far exceeding the rates seen in the Arctic. Proc. Natl. Acad. Sci. USA 2019, 116, 14414–14423. [Google Scholar] [CrossRef] [PubMed] [Green Version]
  5. Cavalieri, D.J.; Parkinson, C.L.; Gloersen, P.; Comiso, J.C.; Zwally, H.J. Deriving long-term time series of sea ice cover from satellite passive-microwave multisensor data sets. J. Geophys. Res. Ocean. 1999, 104, 15803–15814. [Google Scholar] [CrossRef]
  6. Haarpaintner, J.; Tonboe, R.T.; Long, D.G.; Van Woert, M.L. Automatic detection and validity of the sea-ice edge: An application of enhanced-resolution QuikScat/SeaWinds data. IEEE Trans. Geosci. Remote Sens. 2004, 42, 1433–1443. [Google Scholar] [CrossRef]
  7. Anderson, H.S.; Long, D.G. Sea ice mapping method for SeaWinds. IEEE Trans. Geosci. Remote Sens. 2005, 43, 647–657. [Google Scholar] [CrossRef] [Green Version]
  8. Haarpaintner, J.; Spreen, G. Use of enhanced-resolution QuikSCAT/SeaWinds data for operational ice services and climate research: Sea ice edge, type, concentration, and drift. IEEE Trans. Geosci. Remote Sens. 2007, 45, 3131–3137. [Google Scholar] [CrossRef]
  9. Belmonte Rivas, M.; Stoffelen, A. New bayesian algorithm for sea ice detection with QuikSCAT. IEEE Trans. Geosci. Remote Sens. 2011, 49, 1894–1901. [Google Scholar] [CrossRef]
  10. Stoffelen, A.; Verspeek, J.; Haan, S. De C-Band Sea Ice Model. In 2004 Envisat & ERS Symposium; Lacoste, H., Ouwehand, L., Eds.; European Space Agency: Paris, France, 2005; Volume ESA SP-572, p. 143.1. [Google Scholar]
  11. Belmonte Rivas, M.; Verspeek, J.; Verhoef, A.; Stoffelen, A. Bayesian sea ice detection with the advanced scatterometer ASCAT. IEEE Trans. Geosci. Remote Sens. 2012, 50, 2649–2657. [Google Scholar] [CrossRef]
  12. Otosaka, I.; Rivas, M.B.; Stoffelen, A. Bayesian sea ice detection with the ERS scatterometer and sea ice backscatter model at C-band. IEEE Trans. Geosci. Remote Sens. 2018, 56, 2248–2254. [Google Scholar] [CrossRef]
  13. Belmonte Rivas, M.; Otosaka, I.; Stoffelen, A.; Verhoef, A. A scatterometer record of sea ice extents and backscatter: 1992–2016. Cryosphere 2018, 12, 2941–2953. [Google Scholar] [CrossRef] [Green Version]
  14. Markus, T.; Cavalieri, D.J. An Enhancement of the NASA Team Sea Ice Algorithm. IEEE Trans. Geosci. Remote Sens. 2000, 38, 1387–1398. [Google Scholar] [CrossRef] [Green Version]
  15. Cavalieri, D.J.; Markus, T.; Hall, D.K.; Ivanoff, A.; Glick, E. Assessment of AMSR-E antarctic winter sea-ice concentrations using aqua MODIS. IEEE Trans. Geosci. Remote Sens. 2010, 48, 3331–3339. [Google Scholar] [CrossRef]
  16. Meier, W.N.; Stroeve, J. Comparison of sea-ice extent and ice-edge location estimates from passive microwave and enhanced-resolution scatterometer data. Ann. Glaciol. 2008, 48, 65–70. [Google Scholar] [CrossRef] [Green Version]
  17. Li, Z.; Stoffelen, A.; Verhoef, A. A Generalized Simulation Capability for Rotating Beam Scatterometers. Atmos. Meas. Tech. 2019, 12, 3573–3594. [Google Scholar] [CrossRef] [Green Version]
  18. Liu, J.; Lin, W.; Dong, X.; Lang, S.; Yun, R.; Zhu, D.; Zhang, K.; Sun, C.; Mu, B.; Ma, J.; et al. First Results from the Rotating Fan Beam Scatterometer Onboard CFOSAT. IEEE Trans. Geosci. Remote Sens. 2020, 58, 8793–8806. [Google Scholar] [CrossRef]
  19. Li, Z.; Stoffelen, A.; Verhoef, A.; Verspeek, J. Numerical Weather Prediction Ocean Calibration for the Chinese-French Oceanography Satellite Wind Scatterometer and Wind Retrieval Evaluation. Earth Sp. Sci. 2021, 8, e2020EA001606. [Google Scholar] [CrossRef]
  20. Zhang, P.; Hu, X.; Lu, Q.; Zhu, A.; Lin, M.; Sun, L.; Chen, L.; Xu, N. FY-3E: The First Operational Meteorological Satellite Mission in an Early Morning Orbit. Adv. Atmos. Sci. 2022, 39, 1–8. [Google Scholar] [CrossRef]
  21. Remund, Q.P.; Long, D.G. Sea ice extent mapping using Ku band scatterometer data. J. Geophys. Res. Ocean. 1999, 104, 11515–11527. [Google Scholar] [CrossRef] [Green Version]
  22. Liu, L.; Dong, X.; Lin, W.; Lang, S.; Wang, L. Polar Sea Ice Detection with the CFOSAT Scatterometer. In Proceedings of the 2021 IEEE International Geoscience and Remote Sensing Symposium IGARSS, Brussels, Belgium, 11–16 July 2021; pp. 5645–5648. [Google Scholar] [CrossRef]
  23. Stoffelen, A.; Portabella, M. On Bayesian Scatterometer Wind Inversion. IEEE Trans. Geosci. Remote Sens. 2006, 44, 1523–1533. [Google Scholar] [CrossRef]
  24. Cavalieri, D.J.; Parkinson, C.L.; Gloersen, P.; Zwally, H.J. Sea Ice Concentrations from Nimbus-7 SMMR and DMSP SSM/I-SSMIS Passive Microwave Data, Version 1; [NSIDC-0051]; National Snow & Ice Data Center: Boulder, CO, USA, 1996. [Google Scholar]
Figure 1. Probability distribution of M L E w i n d (normalized to unit area): blue is the observed p ( M L E w i n d ) , orange is the fitted probability function derived from an inverse gamma distribution as in Equation (6).
Remotesensing 14 03569 g001
Figure 2. Daily slopes in the linear ice model in the Arctic per incidence angle in the year 2019 (a 2° incidence interval is used for a clearer look).
Remotesensing 14 03569 g002
Figure 3. The distribution of the sea-ice backscatter measurements and the corresponding sea-ice GMF (red line). Selected incidence angles from low to high are shown.
Remotesensing 14 03569 g003
Figure 4. Gaussian distribution of the distance between sea-ice backscatter and the corresponding sea-ice GMF per incidence angle with standard deviation (red to blue indicates incidence angle from low, 28°, to high, 50°).
Remotesensing 14 03569 g004
Figure 5. The average slopes from Jan to March in the Arctic as a function of incidence angle (truncated_inc).
Remotesensing 14 03569 g005
Figure 6. Illustration of the sea-ice GMFs as a function of incidence angle (truncated_inc).
Remotesensing 14 03569 g006
Figure 7. The probability distribution of M L E i c e in the selected WVCs across the swath: outer WVCs number 1 and 42; sweet WVCs number 6 and 36; nadir WVC number 21.
Remotesensing 14 03569 g007
Figure 8. (a) the number of incidence angle HH/VV pairs across the swath (the number is logarithmic to make the plot clearer); (b) the distribution of the incidence angle across the swath.
Remotesensing 14 03569 g008
Figure 9. Probability distribution of M L E i c e (normalized to unit area): blue is the observed p ( M L E i c e ) , orange is the fitted probability function derived from chi-square distribution Equation (9). (a) p ( M L E i c e ) of outer group (WVC numbers 1, 2, 41 and 42); (b) p ( M L E i c e ) of rest group (WVC numbers from 3 to 40).
Remotesensing 14 03569 g009
Figure 10. Sea ice extents in the Arctic (upper panel) and Antarctic (lower panel) on 10 January 2019 with the same land mask and polar gap mask: (a) CSCAT; (b) SSMI; (c) ASCAT; the gray scale for (a) and (c) indicates sea ice age/brightness. The grey scale for (a) and (c) represents sea ice normalized VV backscatter and map griding is 12.5 km.
Remotesensing 14 03569 g010
Figure 11. Ice-edge map on the 10 January 2019 for the (a) Arctic and (b) Antarctic, CSCAT black line, SSMI blue line, ASCAT red line.
Remotesensing 14 03569 g011
Figure 12. Daily Arctic (solid lines) and Antarctic (dashed lines) sea ice extents in 2019 from CFOSAT (blue), ASCAT (orange), and SSMI (green); the red rectangular area marks the period when CSCAT instrument restarted.
Remotesensing 14 03569 g012
Figure 13. Daily Arctic (solid lines) and Antarctic (dashed lines) sea ice extents in 2019 from CFOSAT all_inc (black), CFOSAT truncated_inc (blue), ASCAT (orange), CSCAT instrument restart period is excluded here.
Remotesensing 14 03569 g013
Table 1. Sea ice extent year-long average difference between ASCAT and all_inc, truncated_inc and exclude_inc, respectively, in the Arctic and Antarctic (during the sea-ice GMF construction, all_inc: all the sea-ice backscatter values are included; truncated_inc: sea-ice backscatter values below −10 dB are not considered at incidence 28° and 50°; exclude_inc: sea-ice backscatter values at incidence 50° are excluded).
Average Sea Ice Extent Difference Compared to
ASCAT Sea Ice Extent
All_IncTruncated_IncExclude_Inc
Arctic (million km2)0.180.050.13
Antarctic (million km2)0.130.010.08
Publisher’s Note: MDPI stays neutral with regard to jurisdictional claims in published maps and institutional affiliations.

