Article

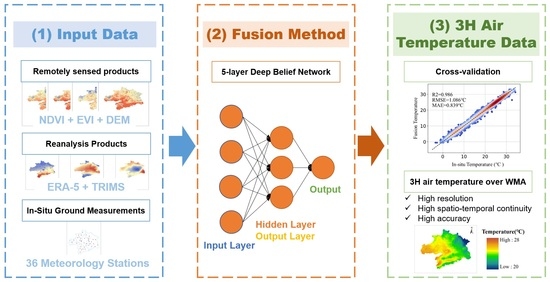
Deep Learning-Based 500 m Spatio-Temporally Continuous Air Temperature Generation by Fusing Multi-Source Data

1
National Engineering Research Center of Geographic Information System, School of Geography and Information Engineering, China University of Geosciences, Wuhan 430074, China
2
State Key Laboratory of Remote Sensing Science, Aerospace Information Research Institute, Chinese Academy of Sciences, Beijing 100101, China
3
Research Center of Ecology and Environment in Central Asia, Xinjiang Institute of Ecology and Geography, Chinese Academy of Sciences, Urumqi 830011, China
4
Institute of Water Problems, Hydropower and Ecology of the National Academy of Sciences of Tajikistan, Dushanbe 734042, Tajikistan
5
Department of Atmospheric Science, School of Environmental Studies, China University of Geosciences, Wuhan 430074, China
6
Centre for Severe Weather and Climate and Hydro-Geological Hazards, Wuhan 430074, China
7
School of Geography and the Environment, University of Oxford, Oxford OX1 3QY, UK
8
State Key Laboratory of Information Engineering in Surveying, Mapping, and Remote Sensing (LIESMARS), Wuhan University, Wuhan 430079, China
9
School of Social Safety and Systems Engineering, Institute of Agricultural Environmental Science, National Agricultural Water Research Center, Hankyong National University, 327 Jungang-ro, Anseong-si 17579, Korea
10
Hubei Luojia Laboratory, Wuhan 430079, China
11
Department of Geological Sciences, Jackson School of Geosciences, University of Texas at Austin, Austin, TX 78712, USA
12
Department of Civil, Architecture, and Environmental Engineering, Cockrell School of Engineering, University of Texas at Austin, Austin, TX 78712, USA
*
Author to whom correspondence should be addressed.
Remote Sens. 2022, 14(15), 3536; https://doi.org/10.3390/rs14153536
Submission received: 30 May 2022 / Revised: 10 July 2022 / Accepted: 18 July 2022 / Published: 23 July 2022
(This article belongs to the Special Issue Urban Ecophysiology: A Remote Sensing Perspective)

Abstract

:
The all-weather high-resolution air temperature data is crucial for understanding the urban thermal conditions with their spatio-temporal characteristics, driving factors, socio-economic and environmental consequences. In this study, we developed a novel 5-layer Deep Belief Network (DBN) deep learning model to fuse multi-source data and then generated air temperature data with 3H characteristics: High resolution, High spatio-temporal continuity (spatially seamless and temporally continuous), and High accuracy simultaneously. The DBN model was developed and applied for two different urban regions: Wuhan Metropolitan Area (WMA) in China, and Austin, Texas, USA. The model has a excellent ability to fit the complex nonlinear relationship between temperature and different predictive variables. After various adjustments to the model structure and different combinations of input variables, the daily 500-m air temperature in Wuhan Metropolitan Area (WMA) was initially generated by fusing remote sensing, reanalysis and in situ measurement products. The ten-fold cross-validation results indicated that the DBN model achieved promising results with the RMSE of 1.086 °C, MAE of 0.839 °C, and R2 of 0.986. Compared with conventional data fusion algorithms, the DBN model also exhibited better performance. In addition, the detailed evaluation of the model on spatial and temporal scales proved the advantages of using DBN model to generate 3H temperature data. The spatial transferability of the model was tested by conducting a validation experiment for Austin, USA. In general, the results and fine-scale analyses show that the employed framework is effective to generate 3H temperature, which is valuable for urban climate and urban heat island research.

Graphical Abstract

1. Introduction

Temperature is an essential variable in most biological and physical processes, which acts as an important parameter in various Earth system models [1]. Global warming has resulted in drastic changes in the global environment [2,3,4], leading to frequent occurrence of extreme weather and climate events, which have significant impacts on human living and economic development. With the acceleration of urbanization, the urban heat island (UHI) has been discovered, where temperatures in urban areas is generally higher than rural areas [5,6,7]. In order to understand UHI, high spatio-temporal resolution temperature data sets are needed investigate urban thermal conditions and their spatio-temporal characteristics [8,9,10]. Therefore, it is critical to obtain air temperature data with high temporal resolution and wide temporal coverage [11,12]. However, the sparse distribution of in situ stations makes it difficult to analyze the UHI in continuous space, thus many UHI effects can only be studied by land surface temperature (LST) measurements from remote sensors (e.g., MODIS) [13]. While the commonly used MODIS data is not adequate for finer urban analysis [14]. Considering the above issue, the establishment of an all-weather high-resolution temperature dataset is important for understanding the urban thermal conditions in urban areas with the spatio-temporal characteristics, driving factors, socio-economic, and environmental consequences.
Temperature data is usually measured by the meteorological stations 2 m above the ground. Worldwide meteorological stations have provided long-term, stable and accurate temperature data [15]. Due to the heterogeneity of spatial distribution of air temperature and the sparse distribution of meteorological stations, the application of station measured air temperature is limited in regional or global earth science research. Another way to obtain temperature data is from the large-scale assimilated products which can provide global coverage data, such as the Japanese 55-year Reanalysis Project (JRA-55), the Global Land Data Assimilation System (GLDAS), the NCEP/DOE Reanalysis 2 Project (NNRP-2) and ERA-5 reanalysis products [16,17,18]. However, the spatial resolutions of these reanalysis products are still coarse for detailed urban heat analysis. In addition, reanalysis data products generally have systematic bias (high or low) compared with ground measurements [19,20]. Therefore, it is urgently required to explore downscaling and fusion techniques to obtain air temperature data with 3H characteristics: High resolution, High spatio-temporal continuity (i.e., spatially seamless and temporally continuous) and High accuracy simultaneously [21,22].
Current studies have mainly proposed dynamical downscaling and statistical downscaling methods to generate 3H air temperature data [23,24]. Dynamical downscaling captures high-resolution climate data by simulating physical processes. Statistical downscaling method establishes statistical relationships between temperature and other relevant climate or geographic variables, ranging from simple linear regression models to complex models, such as neural networks, random forests, support vector machines and super-resolution deep residual network [24,25,26]. For example, Xu et al. [27] used MODIS data, Shuttle Radar Topography Mission (SRTM) digital Elevation Model (DEM) data and some topographic index data to extract 11 variables, and compared the monthly air temperature estimation from 10 machine learning algorithms on the Tibetan Plateau. The results showed that the machine learning algorithm had great potential in air temperature estimation. Machine learning algorithms have the ability to deal with nonlinear relationships, but they still have some limitations in downscaling air temperature data to generate 3H air temperature data [28]. This is due to the pre-defined relationships or features in the modeling process, which rarely make full use of their temporal and spatial dependences [29]. Moreover, some commonly used remote sensing variables (such as LST and NDVI) are not always spatially seamless and temporally continuous due to the influence of atmospheric conditions.
As a common statistical downscaling method, multi-source data fusion is often used to generate temperature, precipitation and snow depth data with high spatial and temporal resolution [30,31,32]. It integrates remote sensing data and reanalysis data with different spatial and temporal resolutions to make up for the shortcomings of low spatial or temporal resolution or low precision of single data source. Furthermore, the existing research usually takes the ground site data for final surface result verification and lacks the method of direct fusion of them [27,33]. As the ground observation is recognized as the most accurate data, it should be a good choice to generate 3H air temperature data by fusing multi-source point-surface monitoring data based on deep learning approach. For example, Shen et al. [34] constructed a 5-layer deep belief network (DBN) to establish the relationship between in situ air temperature data, remote sensing data, socioeconomic data, and assimilation data. R. Li et al. [21] proposed a temperature downscaling framework based on point–surface data fusion to generate 3H air temperature data with a resolution of 1 km in the Yangtze River Basin in 2019. However, for urban agglomerations with more significant spatial heterogeneity, there is still a lack of satellite-ground data fusion method to obtain 3H air temperature data.
Aiming to solve the above problems, we intended to design a downscaling method by integrating multi-source data for two different urban locales: Wuhan Metropolitan Area (WMA), China and Austin, Texas, USA. Remote sensing data, reanalysis data and in situ ground station data are fused by this method to generate daily, 500 m 3H air temperature data. In this analysis, the generated 3H air temperature product will help the detailed understanding of urban climate assessment, solutions, and urban heat island effect.

2. Study Area and Data

2.1. Study Area

This study initially develops the modeling framework using WMA as the research area, as shown in Figure 1. WMA is centered on Wuhan city and covers eight cities around it, namely Huangshi city, Ezhou City, Xiantao City, Xianning City, Xiaogan City, Huanggang City, Qianjiang City and Tianmen City. It is located in the central and eastern part of Hubei Province, with 29°1′~31°51′ north and 112°29′~116°8′ East. It has the advantages of north-south and east-west transportation. WMA officially became the “two-oriented society” pilot area approved by The State Council since December 2007. It is the core development area of Hubei province, China and plays an strategic role in promoting the rise of central China. The permanent resident population in this region is 30,871,000, accounting for 53.1% of the total population of the Hubei province. GDP reached CNY 1726.5 billions, accounting for 63.1% of the total GDP of Hubei province [35,36]. It is the most intensive and dynamic area of industry and production in Hubei province. The WMA belongs to the north subtropical monsoon climate, with 15~17 °C annual average temperature. There are various landforms, including mountains, hills, and plains. Due to the impact of topography and global warming, floods and droughts often occurred in this region. Chen et al. [37] concluded that both the occurrence frequency and severity of droughts under global warming of 1.5 °C and floods under global warming of 2 °C indicated upward trends. In 2015, the total built-up area of Wuhan urban agglomeration was 479 411.61 hm2, which increased by 384 947.81 hm2 compared with 2005. WMA experienced drastic urban expansion in the past 10 years [38]. K. Wang et al. [39] considered one of the environmental consequences of urbanization is the UHI effect. Furthermore, Shen et al. [40] conducted a long-term and fine-scale analysis of summer UHI in Wuhan over 26 years and found that urbanization caused the UHI to continue to increase but the trend gradually slowed down. Therefore, it is important to investigate detail variations of air temperature in WMA.
The model development over Wuhan region is then transferred over a different geographical urban domain in Austin, Texas. Similar to WMA, Austin has been witnessing dramatic urban growth and development. As a result, the city managers, and the community groups are actively looking for developing urban heat mapping and heat mitigation strategies.

2.2. Data

In this study, we choose three kinds of data to generate 3H air temperature data, including remotely sensed products, reanalysis products and in situ measurements, as shown in Table 1.

2.2.1. Remotely Sensed Product

The Moderate Resolution Imaging Spectroradiometer (MODIS) on Terra and Aqua is a major instrument used by the Earth Observing System (EOS) program to observe biological and physical processes around the world. In this study, we selected NDVI and EVI as the predictors for the satellite–ground data fusion model [41,42]. Vegetation indicators are used to monitor global vegetation environmental conditions and display land cover changes [43,44]. The MODIS VEGETATION index product (MOD13Q1) used in this study is derived from Application for Extracting and Exploring Analysis Ready Samples (AppEEARS) published by LP DAAC. Based on this application, MODIS data are captured, processed and analyzed online. MOD13Q1 data is a 3-level grid data product using Sinusoidal projection. The vegetation index value provided by MOD13Q1 has a spatial resolution of 250-m and temporal resolution of 16 days. Additionally, we also collected global resampled Shuttle Radar Topography Mission (SRTM) digital elevation product [45] with 30 m spatial resolution.

2.2.2. Reanalysis Products

We also selected ERA5-Land reanalysis product to provide 2 m model-based air temperature, albedo, wind speed and soil moisture [46,47,48]. ERA5-land is a 0.1° spatial resolution dataset produced by the ECMWF ERA5 climate reanalysis, making it more accurate for all types of land applications [49].
It is well established that there is an energy exchange between the surface and near-surface atmosphere. In other words, there is a strong physical link between land surface temperature (LST) and near-surface air temperature [50]. In recent years, satellite LST products with high spatial and temporal resolution have been widely used to estimate air temperature, and thus we chose LST as the variable to generate 3H air temperature. We adopted 1-km all-weather Thermal and Reanalysis Integrating Moderate-resolution Spatial-seamless (TRIMS) LST product [51,52], which covers China mainland and its neighboring areas. It uses a multi-scale Kalman filter to fuse the land surface temperature obtained by remote sensing inversion and downscaling with MODIS land surface temperature to generate a 1 km seamless land surface temperature dataset.

2.2.3. In Situ Measurement

The meteorological air temperature observations used in initially developing the model were primarily obtained from the China Meteorological Data Service Center (CMDC). As shown in Figure 1, a total of 36 meteorological stations were distributed in WMA evenly. After removing some missing data, 13,131 lines of daily mean temperature and the day of year (DOY) for 2019 obtained from these sites were used for the study. (Details for the Austin region data are provided ahead).

3. Methods

The proposed high resolution spatially seamless and temporally continuous temperature downscaling framework is shown in Figure 2. Generally, the methodology can be divided into three parts: (1) data collection and preprocessing; (2) deep learning based 3H air temperature generating; (3) fine-scale spatiotemporal analysis. Firstly, a series of preprocessing methods, such as resampling, clipping and grid computing were carried out for remote sensing products and reanalysis products to made sure they all had 500 m and daily resolutions. The pre-processing of remote sensing data and reanalysis data, such as resampling, is the initial downscaling. Reanalysis data with high temporal resolution but coarse spatial resolution can be used to obtain high spatial resolution input data after grid calculation and resampling-processing. However, its inherited deviation has not been corrected at this time [53]. Therefore, remote sensing data with high spatial resolution but low temporal resolution is introduced into the model. The values of the ground stations where they are located were also extracted as input variables for improving the accuracy of 3H air temperature. Then, input variables were input into DBN model for training and generated a 3H temperature. Finally, the newly generated 3H air temperature was analyzed at a fine scale.
We employed the 5-layer DBN model by fusing in situ ground observations with remotely sensed data and reanalysis data. The model has one input layer, one output layer and three hidden layers. After experimental comparison, the number of neurons in each hidden layer was determined to be 25, 15 and 10, respectively. A total of eight variables were used as the predictors for the DBN model including ERA5-Land temperature, surface soil moisture (SW), wind speed, albedo, LST, NDVI, EVI, DEM and a time variable (i.e., DOY). The structure of the model can be given:
3 H   T e m p e r a t u r e = f ( E R A 5   T , S W , W i n d , A l b e d o , L S T , N D V I , E V I , D E M , D O Y )
where f ( ) is the model. The study period was selected as the whole year of 2019 and there was a total of 36 meteorological stations in the study area.

3.1. Deep Belief Network Model

Deep learning as a new generation of machine learning methods has been proved to be very promising in many research fields. With the advent of the era of big data, deep learning with its powerful non-linear simulation ability has a great influence in many fields but its application in the field of climate, hydrology and earth systems science is still in its infancy [54]. In this study, DBN, as a Bayesian probability generation model was used to generate 3H air temperature by fusing multi-source data. The classic DBN consists of multiple restricted Boltzmann machines (RBM) layers and one back-propagation (BP) layer. The Figure 3 shows the complete structures of DBN model with input layer, output layer and hidden layer. The training procedure of DBN can be treated as an efficient unsupervised layer-wise fashion. Each RBM is a two-layers neural network, which consists of one hidden layer to input data and one visible layer to extract features. The neurons between the two layers of RBM are fully connected, but there are no connections inside each layer.
Then the equation of energy function of RBM can be given as follows:
E ( v , h / θ ) = i = 1 m a i v i j = 1 n b j h j i = 1 m j = 1 n v i W i j h j
v and h represent the state of the visible and hidden layers, respectively. v i and h i represent the ith neuron of the corresponding layers, respectively. Where θ = { W i j , a i , b j } means the parameters to be estimated. To be specific, W represents the weight matrix, while a and b denote the bias of visible neurons and hidden neurons, respectively. The process of the DBN model can be summarized as pre-training, fine-tuning and prediction [33], as shown in Figure 2. All variables are first entered into the model as the visible layer of the first RBM for pre-training. Then feature optimization algorithm is used to extract the temperature-related features from the input data layer by layer from top to bottom without supervision until the last RBM parameter of the hidden layer approaches the ideal value. Then, BP algorithm is used to fine-tune the ownership value parameters of the DBN model until the estimation error is small enough to obtain acceptable prediction result. Besides that, we adopted ten-fold cross-validation to ensure accuracy of results. Based on this method, the 3H air temperature was successfully generated by the trained model.

3.2. Model Validation

To better evaluate the performance of each model, the ten-fold cross-validation [55] approach was conducted to test the model predictive ability and overfitting problems. The dataset was divided into 10 parts, nine of which were used as training data and one as test data in turn, and the experiment was conducted. The Pearson correlation coefficient (PCC) was calculated to verify the correlation between input variables and in situ observation data. The coefficient of multiple determination (R2), mean absolute error (MAE), root mean square error (RMSE) and bias were calculated, and the estimation results were compared with the corresponding observation data to evaluate the accuracy of the model. Table 2 lists the calculation methods of these five indicators.

4. Results

4.1. Correlation Analysis of Input Variables

The PCC was adopted to investigate the linear or non-linear relationship between each variable and average air temperature of in situ stations. The results of R values are presented in Figure 4. It can be observed that the in-situ air temperature has a strong correlation with Temperature_2 m from ERA5-Land and land surface temperature (R > 0.95). It can be inferred that the inputs of LST and ERA5-Land temperature are beneficial to the improvement of accuracy for the multi-source data fusion. The NDVI and EVI have relatively strong and positive relationships with in-situ air temperature (0.6 < R < 0.9). Moreover, in-situ temperature also showed moderate negative correlations with SW (R = −0.323). Those absolute R values below 0.3 indicate that Elevation, wind speed, Albedo and DOY have relatively weak correlations with in-situ air temperature.

4.2. Evaluation of Multi-Source Data Fusion Algorithm

4.2.1. Evaluation of the Overall Accuracy of the DBN Model

The variables mentioned above were input into the model to generate the 3H air temperature in WMA. The overall performance of DBN versus other three comparative models is shown in Figure 5. In general, all these methods achieved acceptable results to generate air temperature data. The points of the four models are concentrated near the black dotted line in this figure. Among these four models, the lowest accuracy were achieved by multiple linear regression (MLR) and back propagation artificial neural network (BPNN) with R2 of 0.983. The MLR model has the sparsest distribution of points, indicating that using the linear model to derive air temperature produced larger errors in this condition due to the complex relationships between various variables and air temperature. Unlike MLR, traditional BPNN is based on non-linear fitting, but the result is not better than MLR due to the relatively simple structure of the model. In addition, compared with RBM model, parameters are initialized before training, traditional BPNN random initialization makes the model easy to fall into trouble, such as local optimization and long training time. Support vector regression (SVR), as a machine learning model, improves the generalization ability of learning machine, so as to achieve good statistical laws in the case of small statistical sample size. The SVR model performed better than MLR and BPNN, with a denser distribution of points. Especially, owing to the best capabilities of fitting nonlinear relationships, deep learning method achieved the most accurate estimations with most of the scatter dots close to the black dotted line than MLR, BPNN and SVR.
A more comprehensive analysis was conducted by comparing each model with the evaluation index results obtained by ten-fold cross-validation. As a whole, all these models have good performance with RMSE from 1.086 °C to 1.198 °C, MAE from 0.839 °C to 0.917 °C, and R2 from 0.983 to 0.986. The best performance is achieved in DBN model with the highest R2 value and the lowest RMSE and MAE, followed by the SVR. By contrast, the worst performance derived from the BPNN with the RMSE increased by 0.112 °C (from 1.086 °C to 1.198 °C), MAE increases by 0.078 °C (from 0.839 °C to 0.917 °C) and R2 is reduced by 0.003 (from 0.986 to 0.983). It confirms that DBN model has great potential capabilities in generating 3H air temperature data. This is because DBN model can better analyze the characteristics of variables that are only weakly correlated with air temperature than traditional algorithms, such as MLR, BPNN and SVR. Overall, the comparative analysis further confirms the superior performance of DBN model in generating 3H air temperature data.

4.2.2. Spatial Evaluation of Model Performance

In this study, the entire sample set was divided into a training set, validation set and test set as a 7:2:1 ratio. Four weather stations were randomly selected to verify the performance of the model. To evaluate the predictive power of DBN model in generating 3H air temperature data, we plotted the density scatter plots for these four validation sites, as shown in Figure 6. In general, the scattered points of all verification points are concentrated near the 1:1 line, indicating fusion temperature has a high consistency with the in situ ground measurements. Specifically, the fusion temperature exhibited strong correlation with in situ ground observations with R2 values generally higher than 0.975 for all validation stations while RMSE was ranging from 0.971 °C to 1.357 °C. The average R2, RMSE, MAE and bias for these validation sites achieved 0.984, 1.146 °C, 0.880 °C and −0.129 °C, respectively. Results demonstrated that DBN model showed excellent performance in downscaling temperature with 500 m spatial resolution.
It can be observed that there are still differences in the density scatter distribution and performance accuracy of each station. To further investigate the spatial patterns of the statistical metrics and downscaling accuracy in all meteorological stations, the distributions of four metrics are presented in Figure 7. Prominent spatial variations of these statistical metrics can be clearly observed. For R2, RMSE and MAE, the stations located in the middle and west of WMA exhibited significantly higher R2 values and lower RMSE and MAE than that of south area. The station 57489 located in the middle of Wuhan has the highest R2 (0.991) and the lowest RMSE (0.904 °C) and MAE (0.707 °C). The central and southern part of Wuhan is dominated by the alluvial plain of Yangtze River and Han River, with flat and open terrain. Stations with high accuracy are also distributed in Wuhan and its surrounding area at low elevation (9~21 m). However, station 57596 located in the south of Xianning has the lowest R2 (0.974) and the highest RMSE (1.450 °C) and MAE (1.117 °C). The south area of Xianning is a steep-sloped, dome-shaped, folded and faulted mountain composed of granite and metamorphic rocks, which is obviously more complex than Wuhan and its surrounding flat areas. Previous studies have found that the accuracy of some existing temperature products is low in areas with large elevation differences, such as mountains and hills, which is consistent with our research results (Dutra et al., 2020).

4.2.3. Temporal Evaluation of Model Performance

To examine the capability of the fusion temperature in capturing the temporal dynamics of ground measurements, a total of four validation stations were randomly selected. The temporal variations of fusion air temperature were represented by orange dots, in situ observations represented by black dots and ERA5-Land temperature represented by blue lines at these stations, as shown in Figure 8. In general, the fusion air temperature and ERA5-Land temperature are highly consistent with the in situ ground observations. However, ERA5-Land temperature fluctuates more than fusion temperature with more overestimations and underestimations, as clearly observed in station 57595 and 58501. It is mainly attributed to the fact that the spatial scale heterogeneity between ground measurement and satellited data existed. Although some errors also existed in fusion temperature at some time, the overall trend of temperature variations could be well reconstructed and captured by applying DBN model. These results further demonstrate the effectiveness of the framework for generating high quality temperature data.
We mapped the spatial distributions of average fusion air temperature in each month in 2019 to evaluate the performance of this model at monthly scale, as shown in Figure 9. We also calculated the annual mean temperature and elevation of WMA in 2019 in Table 3. The overall temperature ranged from 0 to 35 °C in 2019. The temperature shows a spatially downward trend from the center to the sub-urban area. In Huanggang and Xianning the annual average temperature is relatively low with high average elevation. The lowest temperature was found in the northeast of Huanggang, and the area with the highest elevation only has 13.8 °C annual average temperature. Due to the small span of the study area, there is not much difference in the regional distribution of monthly mean temperature. Figure 10 shows the temporal variation of fusion temperature in each month. Average temperature was significantly higher in summer (June to August) and lower in winter (December to February). Temporally, the average temperature in summer is significantly higher than that in winter, while the average temperature in spring and autumn is similar, which accords with the seasonal variation law of WMA.
Moreover, we compared the spatial distribution of fusion temperature data with that of ERA5-Land temperature, as shown in Figure 11. It is clear that the spatial distribution of temperature data generated by DBN model is basically the same as that of ERA5-Land temperature. Meanwhile, DBN model successfully captured the overall spatial variation trend of temperature in WMA and showed more subtle spatial details. For example, the spatial variation of fusion temperature data in the northeast and central parts of WMA is more detailed than that of ERA5-Land temperature products, as we can see in the red rectangles. We compared the actual temperature at the station 57485 and 57595 on October 1st with these two temperature values. The actual temperature of station 57485 was 25.4 °C. The fusion temperature and ERA5-Land temperature were 26.1 °C and 27.3 °C, respectively. The actual temperature of station 57595 was 26.3 °C. The fusion temperature and ERA5-Land temperature were 25.9 °C and 26.8 °C, respectively. The fusion temperature is obviously closer to the actual value than the ERA5-Land temperature. In summary, the temperature fusion framework in this study successfully generated 500-m 3H air temperature by applying point–surface data fusion method and DBN model.

5. Discussion

5.1. DBN Structure Comparison

To find the best DBN model structure, the hidden layers of DBN and the number of neurons in each layer were adjusted and compared as shown in Table 4. As the number of DBN layers and neurons increase, the accuracy of the model increases obviously. When the hidden layer of DBN reaches 4, the model performance tends to be stable. In addition, when there are three hidden layers, the structure with 25, 15 and 10 neurons have better accuracy than the structure with 25, 20 and 15 neurons. This result suggests that more neurons in the hidden layer is not always better. Moreover, as the number of hidden layers and neurons increase, so does the time of model calculations. Therefore, in this study, we employed a 5-layer DBN model, including three hidden layers, one input layer and one output layer, and the number of neurons in each hidden layer was 25, 15 and 10, respectively.

5.2. DBN Performance with Different Variables

Because different types of data were selected during model training, some variables only had weak linear correlations or even no linear relationships with air temperature values. To better find the optimal combination of variables to maximize the fitting ability of DBN model, we evaluated the performance of the proposed model under different combinations of variables. The accuracy evaluation indexes of each combination are shown in Table 5. When only ERA5-Land data was used as input variables of the model, RMSE was 1.219 °C, MAE was 0.922 °C, and R2 was 0.982, respectively. By contrast, as more variables were used in the model, the accuracy increased. After LST was added, RMSE and MAE increased to 1.244 °C and 0.941 °C but the gap was small. For remotely sensed data, the RMSE and MAE decreased to 1.124 °C and 0.876 °C, respectively. In addition, the accuracy of the model was significantly improved after time parameters were input into the model. However, the linear correlation between temporal parameters and in situ air temperature were not that high, as shown in Section 4.1. This result shows that DBN model has superior ability to simulate a nonlinear relationship between in situ air temperature and prediction variables. Overall, the combination of different input variables confirms that they are meaningful in generating 3H air temperature.

5.3. Spatio-Temporal Evaluation of the Fusion Accuracy

To investigate the performance of fusion model in different months, Figure 12 presents the variations of statistical metrics for all validation sites at monthly scale. Generally, the variations of model accuracy also represented distinct differences in different months. Specifically, fusion temperature in summer (July to August) and autumn (September to November) showed lower errors rather than that in spring and winter. Results for July and August have the best performances with average RMSE of 0.824 °C and 0.843 °C, respectively. Results in January and April indicated relatively low accuracy with the highest error with average RMSE of 1.195 °C and 1.437 °C, respectively. Notably, the model has better precision performance in months with higher average temperature, which is inconsistent with our expectations. Because relevant studies show that the correlation coefficient between LST and temperature in these months is lower than that in other months [56,57]. Overall, the above findings highlight the necessity of considering temporal factors in air temperature fusion model.
Previous studies have shown that land cover type affects the correlation between LST and air temperature [58]. Hence, we also examined the model accuracy in diverse land cover types, including grassland, water, forest, farmland and buildings. As shown in the left part of Figure 13, radar maps show the average accuracy of all sites with different land cover types. It can be observed that the performance of DBN model is different under different land cover types, and the model has high precision in these types. More precisely, the DBN model has relatively poor performances in grassland and forest with an RMSE of 1.15 °C and 1.19 °C, respectively. For the stations near buildings, water and farmland, the performance of the model is relatively good with an RMSE down to 1.13 °C, 0.90 °C and 1.04 °C, respectively. In addition to study the impact of land cover types on the model, we also evaluated the accuracy performance of the model at different elevation ranges. The figure on the right of Figure 13 classifies the elevation into four levels. The statistical metrics varied in different ranges of elevation. Generally, the performance of DBN worsened with the increase of elevation.

5.4. Role of Point-Surface Fusion in Generating 3H Temperature Data

In this study, we applied point–surface data fusion to generate 3H air temperature, because the air temperature data observed from ground is the most accurate, which is higher than remote sensing data or reanalysis data. Some previous studies used remotely sensed or reanalysis products as model outputs [59], which failed to take fully advantages of in situ ground observations. To determine and evaluate the role of point–surface data fusion in improving the model accuracy, we set a comparative experiment by applying surface–surface fusion method in temperature downscaling. In this case, the output of the DBN model was ERA5-Land temperature instead of in situ measurements. The scatter density plots for 32 validation stations are presented in Figure 14. Compared to the downscaled temperature using model-based temperature as output, the accuracy of the fusion temperature by adopting ground observations as output was substantially improved. The average R2 increased from 0.973 to 0.986 while the RMSE, MAE rose from 1.479 °C, 1.146 °C to 1.086 °C and 0.839 °C, which decreased about 26.57% and 26.79%, respectively. Although fusion temperature in the case of surface–surface fusion still maintained high correlation with in-situ measurements, it is mostly attributed to the originally high correlation between ERA5-Land temperature and ground observations. In summary, the application of point–surface data fusion was proved to enhance the overall performance of DBN model in generating 3H temperature.

5.5. Spatial Transferability of the Model

To verify the spatial transferability of temperature fusion framework proposed in this study, a comparative experiment was conducted at Austin, TX, USA. Austin is in south-central Texas, at the same latitude as WMA, and has a subtropical climate. However, it is in the Western hemisphere and close to the Gulf of Mexico, while WMA is inland. Therefore, using the Austin area as a comparative area reflects the geographical heterogeneity and could test the spatial transferability. We selected 17 ground-based monitoring sites in Austin to capture its average daily temperature for 2019. After processing a series of remote sensing data and reanalysis data of Austin, including ERA5-Land temperature, Surface Soil Moisture (SW), Wind speed, Albedo, LST, NDVI and DEM. The performance of the modelis shown in the Figure 15. It was found the proposed method also showed good performance at Austin area with the RMSE of 1.173 °C, MAE of 0.851 °C and R2 of 0.981.
It is known that Austin’s summer is long and hot while winter is short, cold and windy. There is variable weather pattern throughout the year. During the experimental year, the temperature varied between 6 °C and 36 °C, rarely falling below −1 °C or above 39 °C. The hottest month in Austin is August, with an average high temperature of 35 °C and an average low temperature of 24 °C. We developed the map of Austin’s average temperature in August 2019, as shown in Figure 16. In August, the maximum temperature of 42 °C with an average temperature of 29.6 °C was recorded, consistent with previous studies [60].
In summary, the temperature fusion framework in this study can be applied to other urban agglomerations to generate 3H air temperature.

6. Conclusions

In this study, we employed a 5-layers DBN model to generate 3H air temperature. The daily air temperature at 500 m resolution taking WMA as an example was successfully generated by integrating remote sensing products, reanalysis products and in situ temperature measurements. Compared to the conventional data fusion algorithms (e.g., MLR, BPNN), deep learning method exhibited excellent performance in generating air temperature and could better consider non-linear relationship and achieved the best performance with the RMSE of 1.086 °C, MAE of 0.839 °C and R2 of 0.986. In addition, the detailed evaluation of the model on spatial and temporal scales proved the feasibility of using DBN model to generate 3H air temperature. The performance of DBN model was verified by adjusting different combinations of variables, and the results showed that the model performed better with more effective variables. Spatio-temporal air temperature by the proposed method showed more detailed spatial variations than reanalysis temperature data. The comparison between point–surface fusion and surface–surface fusion also indicated that the combination of station-based data could greatly improve the model accuracy, which decreased the RMSE and MAE by about 26.57% and 26.79%. The method is proven to have spatial transferability by validating it at Austin, US, with the RMSE of 1.173 °C, MAE of 0.851 °C and R2 of 0.981. The results and comparative analysis confirmed that the multi-source data fusion model had the potential to generate 3H temperature data. This has important implications for urban climate assessment and urban heat island mapping and management.

Author Contributions

Conceptualization, X.Z. and T.H.; methodology, X.Z., T.H. and Y.S.; software, T.H., Y.S. and S.H.; Validation, W.-H.N., J.Z. and D.N.; formal analysis, X.Z. and T.H.; investigation, X.Z., T.H. and Y.S.; resources, X.Z. and X.G.; data curation, T.H. and Y.S.; writing—original draft preparation, X.Z. and T.H.; writing—review and editing, W.-H.N., X.G., J.Z., S.H., N.C., A.G. and D.N.; visualization, X.Z. and T.H.; supervision, X.Z.; project administration, X.Z. All authors have read and agreed to the published version of the manuscript.

Funding

This work was supported by grants from the Open Fund of State Key Laboratory of Remote Sensing Science (Grant No. OFSLRSS202114). D.N. acknowledges support from John E. “Brick” Elliott endowment at the Jackson School of Geosciences, University of Texas at Austin.

Data Availability Statement

The NDVI and EVI from MOD13Q1 can be obtained at https://lpdaac.usgs.gov/products/mod13a2v006/ (accessed on 15 October 2021). TRIMS LST is available at https://data.tpdc.ac.cn/en/data/05d6e569-6d4b-43c0-96aa-5584484259f0/ (accessed on 15 October 2021). ERA5-Land reanalysis product can be accessed at https://www.ecmwf.int/en/forecasts/datasets/reanalysis-datasets/era5/ (accessed on 16 October 2021). The SRTM data can be obtained at https://lpdaac.usgs.gov/tools/appeears/ (accessed on 16 October 2021). The in situ meteorological data is available at http://data.cma.cn/ (accessed on 12 October 2021).

Acknowledgments

The authors would like to thank the editors and two anonymous reviewers for their constructive suggestions and comments. Thanks to Samuel Fung, University of Texas at Austin for providing the experimental data of Austin, US.

Conflicts of Interest

The authors declare no conflict of interest.

References

  1. Osborn, T.J.; Jones, P.D.; Lister, D.H.; Morice, C.P.; Simpson, I.R.; Winn, J.P.; Hogan, E.; Harris, I.C. Land surface air temperature variations across the globe updated to 2019: The CRUTEM5 data set. J. Geophys. Res.-Atmos. 2021, 126, e2019JD032352. [Google Scholar] [CrossRef]
  2. Cox, P.M.; Huntingford, C.; Williamson, M.S. Emergent constraint on equilibrium climate sensitivity from global temperature variability. Nature 2018, 553, 319. [Google Scholar] [CrossRef] [PubMed]
  3. Niaz, R.; Zhang, X.; Iqbal, N.; Almazah, M.M.A.; Hussain, T.; Hussain, I.; Li, F. Logistic regression analysis for spatial patterns of drought persistence. Complexity 2021, 2021, 3724919. [Google Scholar] [CrossRef]
  4. Wang, S.; Zhang, X.; Chen, N.; Wang, W. Classifying diurnal changes of cyanobacterial blooms in Lake Taihu to identify hot patterns, seasons and hotspots based on hourly GOCI observations. J. Environ. Manag. 2022, 310, 114782. [Google Scholar] [CrossRef]
  5. Yu, X.; Gu, X.; Kong, D.; Zhang, Q.; Cao, Q.; Slater, L.J.; Ren, G.; Luo, M.; Li, J.; Liu, J.; et al. Asymmetrical shift toward less light and more heavy precipitation in an urban agglomeration of East China: Intensification by urbanization. Geophys. Res. Lett. 2022, 49, e2021GL097046. [Google Scholar] [CrossRef]
  6. Zhao, L.; Lee, X.; Smith, R.B.; Oleson, K. Strong contributions of local background climate to urban heat islands. Nature 2014, 511, 216–219. [Google Scholar] [CrossRef]
  7. Zhao, Z.; Sharifi, A.; Dong, X.; Shen, L.; He, B.-J.J.R.S. Spatial variability and temporal heterogeneity of surface urban heat island patterns and the suitability of local climate zones for land surface temperature characterization. Remote Sens. 2021, 13, 4338. [Google Scholar] [CrossRef]
  8. Huang, S.; Zhang, X.; Chen, N.; Li, B.; Ma, H.; Xu, L.; Li, R.; Niyogi, D. Drought propagation modification after the construction of the three gorges dam in the Yangtze river basin. J. Hydrol. 2021, 603, 127138. [Google Scholar] [CrossRef]
  9. Li, X.; Zhou, Y.; Asrar, G.R.; Zhu, Z. Developing a 1 km resolution daily air temperature dataset for urban and surrounding areas in the conterminous United States. Remote Sens. Environ. 2018, 215, 74–84. [Google Scholar] [CrossRef]
  10. Yang, J.; Xin, J.; Zhang, Y.; Xiao, X.; Xia, J.C. Contributions of sea–land breeze and local climate zones to daytime and nighttime heat island intensity. Npj Urban Sustain. 2022, 2, 1–11. [Google Scholar] [CrossRef]
  11. Schwarz, N.; Lautenbach, S.; Seppelt, R. Exploring indicators for quantifying surface urban heat islands of European cities with MODIS land surface temperatures. Remote Sens. Environ. 2011, 115, 3175–3186. [Google Scholar] [CrossRef]
  12. Lu, Y.; Yue, W.; He, T.; Shan, Z.J. Urban form centrality and thermal environment: An empirical study of Chinese megacities. Sustain. Cities Soc. 2022, 83, 103955. [Google Scholar]
  13. Lu, Y.; Yue, W.; Liu, Y.; Huang, Y. Investigating the spatiotemporal non-stationary relationships between urban spatial form and land surface temperature: A case study of Wuhan, China. Sustain. Cities Soc. 2021, 72, 103070. [Google Scholar] [CrossRef]
  14. Sobrino, J.A.; Oltra-Carrió, R.; Sòria, G.; Bianchi, R.; Paganini, M. Impact of spatial resolution and satellite overpass time on evaluation of the surface urban heat island effects. Remote Sens. Environ. 2012, 117, 50–56. [Google Scholar] [CrossRef]
  15. Ma, H.; Zeng, J.; Zhang, X.; Fu, P.; Zheng, D.; Wigneron, J.-P.; Chen, N.; Niyogi, D. Evaluation of six satellite- and model-based surface soil temperature datasets using global ground-based observations. Remote Sens. Environ. 2021, 264, 112605. [Google Scholar] [CrossRef]
  16. Decker, M.; Brunke, M.A.; Wang, Z.; Sakaguchi, K.; Zeng, X.B.; Bosilovich, M.G. Evaluation of the reanalysis products from GSFC, NCEP, and ECMWF using flux tower observations. J. Clim. 2012, 25, 1916–1944. [Google Scholar] [CrossRef]
  17. Hersbach, H.; Bell, B.; Berrisford, P.; Hirahara, S.; Horanyi, A.; Munoz-Sabater, J.; Nicolas, J.; Peubey, C.; Radu, R.; Schepers, D.; et al. The ERA5 global reanalysis. Q. J. R. Meteorol. Soc. 2020, 146, 1999–2049. [Google Scholar] [CrossRef]
  18. Kobayashi, S.; Ota, Y.; Harada, Y.; Ebita, A.; Moriya, M.; Onoda, H.; Onogi, K.; Kamahori, H.; Kobayashi, C.; Endo, H.; et al. The JRA-55 reanalysis: General specifications and basic characteristics. J. Meteorol. Soc. Jpn. Ser. II 2015, 93, 5–48. [Google Scholar] [CrossRef] [Green Version]
  19. Zhang, S.Q.; Ren, G.Y.; Ren, Y.Y.; Sun, X.B. Comparison of surface air temperature between observation and reanalysis data over eastern china for the last 100 years. J. Meteorol. Soc. Jpn. 2019, 97, 89–103. [Google Scholar] [CrossRef] [Green Version]
  20. Chen, Z.; Zhou, Z.J.; Liu, Z.Q.; Li, Q.L.; Zhang, X.L. Bias adjustment and analysis of chinese daily historical radiosonde temperature data. J. Meteorol. Res. 2021, 35, 17–31. [Google Scholar] [CrossRef]
  21. Li, R.; Huang, T.; Song, Y.; Huang, S.; Zhang, X. Generating 1 km spatially seamless and temporally continuous air temperature based on deep learning over Yangtze river basin, China. Remote Sens. 2021, 13, 3904. [Google Scholar] [CrossRef]
  22. Zhang, F.; Zhang, H.; Hagen, S.C.; Ye, M.; Wang, D.; Gui, D.; Zeng, C.; Tian, L.; Liu, J. Snow cover and runoff modelling in a high mountain catchment with scarce data: Effects of temperature and precipitation parameters. Hydrol. Process. 2015, 29, 52–65. [Google Scholar] [CrossRef]
  23. Shi, Y.; Jiang, Z.; Dong, L.; Shen, S. Statistical estimation of high-resolution surface air temperature from MODIS over the Yangtze river delta, China. J. Meteorol. Res. 2017, 31, 448–454. [Google Scholar] [CrossRef]
  24. Wang, F.; Tian, D.; Lowe, L.; Kalin, L.; Lehrter, J. Deep learning for daily precipitation and temperature downscaling. Water Resour. Res. 2021, 57, e2020WR029308. [Google Scholar] [CrossRef]
  25. Huang, S.; Zhang, X.; Chen, N.; Ma, H.; Fu, P.; Dong, J.; Gu, X.; Nam, W.H.; Xu, L.; Rab, G.; et al. A novel fusion method for generating surface soil moisture data with high accuracy, high spatial resolution, and high spatio-temporal continuity. Water Resour. Res. 2022, 58, e2021WR030827. [Google Scholar] [CrossRef]
  26. Zeng, L.; Hu, Y.; Wang, R.; Zhang, X.; Peng, G.; Huang, Z.; Zhou, G.; Xiang, D.; Meng, R.; Wu, W.; et al. 8-Day and Daily Maximum and Minimum Air Temperature Estimation via Machine Learning Method on a Climate Zone to Global Scale. Remote Sens. 2021, 13, 2355. [Google Scholar] [CrossRef]
  27. Xu, L.; Chen, N.; Zhang, X.; Moradkhani, H.; Zhang, C.; Hu, C. In-situ and triple-collocation based evaluations of eight global root zone soil moisture products. Remote Sens. Environ. 2021, 254, 112248. [Google Scholar] [CrossRef]
  28. Immerzeel, W.W.; Petersen, L.; Ragettli, S.; Pellicciotti, F. The importance of observed gradients of air temperature and precipitation for modeling runoff from a glacierized watershed in the Nepalese Himalayas. Water Resour. Res. 2014, 50, 2212–2226. [Google Scholar] [CrossRef] [Green Version]
  29. Lin, S.; Moore, N.J.; Messina, J.P.; DeVisser, M.H.; Wu, J. Evaluation of estimating daily maximum and minimum air temperature with MODIS data in east Africa. Int. J. Appl. Earth Obs. Geoinf. 2012, 18, 128–140. [Google Scholar] [CrossRef]
  30. Chen, H.R.; Qin, H.W.; Dai, Y.W. FC-ZSM: Spatiotemporal downscaling of rain radar data using a feature constrained zooming slow-mo network. Front. Earth Sci. 2022, 10, 887842. [Google Scholar] [CrossRef]
  31. Zhang, G.Q.; Zheng, W.; Yin, W.J.; Lei, W.W. Improving the resolution and accuracy of groundwater level anomalies using the machine learning-based fusion model in the north China plain. Sensors 2021, 21, 46. [Google Scholar] [CrossRef] [PubMed]
  32. Zhu, L.L.; Zhang, Y.H.; Wang, J.G.; Tian, W.; Liu, Q.; Ma, G.Y.; Kan, X.; Chu, Y. Downscaling snow depth mapping by fusion of microwave and optical remote-sensing data based on deep learning. Remote Sens. 2021, 13, 584. [Google Scholar] [CrossRef]
  33. Li, T.; Shen, H.; Yuan, Q.; Zhang, X.; Zhang, L. Estimating ground-level PM2.5 by fusing satellite and station observations: A geo-intelligent deep learning approach. Geophys. Res. Lett. 2017, 44, 11985–11993. [Google Scholar] [CrossRef] [Green Version]
  34. Shen, H.; Jiang, Y.; Li, T.; Cheng, Q.; Zeng, C.; Zhang, L. Deep learning-based air temperature mapping by fusing remote sensing, station, simulation and socioeconomic data. Remote Sens. Environ. 2020, 240, 111692. [Google Scholar] [CrossRef] [Green Version]
  35. Gao, X.; Zhang, A.L.; Sun, Z.L. How regional economic integration influence on urban land use efficiency? A case study of Wuhan metropolitan area, China. Land Use Policy 2020, 90, 104329. [Google Scholar] [CrossRef]
  36. Zhang, J.F.; Zhang, A.L.; Dong, J.J.R.; Basin, E.I.T.Y. Carbon emission effect of land use and influencing factors decomposition of carbon emission in Wuhan urban agglomeration. Yangtze Basin 2014, 23, 595–602. [Google Scholar]
  37. Chen, J.; Gao, C.; Zeng, X.; Xiong, M.; Wang, Y.; Jing, C.; Krysanova, V.; Huang, J.; Zhao, N.; Su, B. Assessing changes of river discharge under global warming of 1.5 °C and 2 °C in the upper reaches of the Yangtze River Basin: Approach by using multiple-GCMs and hydrological models. Quat. Int. 2017, 453, 63–73. [Google Scholar] [CrossRef]
  38. Su, L.L.; Gao, X.Y.; Liu, Y.F. Study on dynamic change of land utilization in Wuhan metropolitan area. In Proceedings of the 1st International Workshop on Database Technology and Applications, Wuhan, China, 25–26 April 2009; p. 642. [Google Scholar]
  39. Wang, K.; Wang, J.; Wang, P.; Sparrow, M.; Yang, J.; Chen, H. Influences of urbanization on surface characteristics as derived from the moderate-resolution imaging spectroradiometer: A case study for the Beijing metropolitan area. J. Geophys. Res. 2007, 112, D22S06. [Google Scholar] [CrossRef]
  40. Shen, H.; Huang, L.; Zhang, L.; Wu, P.; Zeng, C. Long-term and fine-scale satellite monitoring of the urban heat island effect by the fusion of multi-temporal and multi-sensor remote sensed data: A 26-year case study of the city of Wuhan in China. Remote Sens. Environ. 2016, 172, 109–125. [Google Scholar] [CrossRef]
  41. Amiri, R.; Weng, Q.H.; Alimohammadi, A.; Alavipanah, S.K. Spatial-temporal dynamics of land surface temperature in relation to fractional vegetation cover and land use/cover in the Tabriz urban area, Iran. Remote Sens. Environ. 2009, 113, 2606–2617. [Google Scholar] [CrossRef]
  42. Goward, S.N.; Xue, Y.K.; Czajkowski, K.P. Evaluating land surface moisture conditions from the remotely sensed temperature/vegetation index measurements-An exploration with the simplified simple biosphere model. Remote Sens. Environ. 2002, 79, 225–242. [Google Scholar] [CrossRef]
  43. Huete, A.; Didan, K.; Miura, T.; Rodriguez, E.P.; Gao, X.; Ferreira, L.G. Overview of the radiometric and biophysical performance of the MODIS vegetation indices. Remote Sens. Environ. 2002, 83, 195–213. [Google Scholar] [CrossRef]
  44. Du, L.T.; Song, N.P.; Liu, K.; Hou, J.; Hu, Y.; Zhu, Y.G.; Wang, X.Y.; Wang, L.; Guo, Y.G. Comparison of two simulation methods of the temperature vegetation dryness index (TVDI) for drought monitoring in semi-arid regions of China. Remote Sens. 2017, 9, 177. [Google Scholar] [CrossRef] [Green Version]
  45. Long, M.; Ying, L.; IEEE. Evaluation of SRTM DEM over China. In Proceedings of the IEEE International Geoscience and Remote Sensing Symposium (IGARSS), Denver, CO, USA, 31 July–4 August 2006; pp. 2977–2980. [Google Scholar]
  46. Liu, G.; Chen, J.M.; Ji, L.R.; Sun, S.Q. Relationship of summer soil moisture with early winter monsoon and air temperature over eastern China. Int. J. Climatol. 2012, 32, 1513–1519. [Google Scholar] [CrossRef]
  47. Zhang, Y.F.; Wang, X.P.; Pan, Y.X.; Hu, R. Diurnal relationship between the surface albedo and surface temperature in revegetated desert ecosystems, northwestern China. Arid. Land Res. Manag. 2012, 26, 32–43. [Google Scholar] [CrossRef]
  48. He, B.J.; Ding, L.; Prasad, D. Wind-sensitive urban planning and design: Precinct ventilation performance and its potential for local warming mitigation in an open midrise gridiron precinct. J. Build. Eng. 2020, 29. [Google Scholar] [CrossRef]
  49. Sun, Z.Y.; Zhang, B.; Yao, Y.B. An ERA5-based model for estimating tropospheric delay and weighted mean temperature over China with improved spatiotemporal resolutions. Earth Space Sci. 2019, 6, 1926–1941. [Google Scholar] [CrossRef]
  50. Meyer, H.; Katurji, M.; Appelhans, T.; Muller, M.U.; Nauss, T.; Roudier, P.; Zawar-Reza, P. Mapping daily air temperature for antarctica based on MODIS LST. Remote Sens. 2016, 8, 732. [Google Scholar] [CrossRef] [Green Version]
  51. Zhang, X.D.; Zhou, J.; Gottsche, F.M.; Zhan, W.F.; Liu, S.M.; Cao, R.Y. A method based on temporal component decomposition for estimating 1-km all-weather land surface temperature by merging satellite thermal infrared and passive microwave observations. IEEE Trans. Geosci. Remote Sens. 2019, 57, 4670–4691. [Google Scholar] [CrossRef]
  52. Zhang, X.D.; Zhou, J.; Liang, S.L.; Wang, D.D. A practical reanalysis data and thermal infrared remote sensing data merging (RTM) method for reconstruction of a 1-km all-weather land surface temperature. Remote Sens. Environ. 2021, 260, 112437. [Google Scholar] [CrossRef]
  53. Du, L.T.; Tian, Q.J.; Yu, T.; Meng, Q.Y.; Jancso, T.; Udvardy, P.; Huang, Y. A comprehensive drought monitoring method integrating MODIS and TRMM data. Int. J. Appl. Earth Obs. Geoinf. 2013, 23, 245–253. [Google Scholar] [CrossRef]
  54. Reichstein, M.; Camps-Valls, G.; Stevens, B.; Jung, M.; Denzler, J.; Carvalhais, N.; Prabhat. Deep learning and process understanding for data-driven Earth system science. Nature 2019, 566, 195–204. [Google Scholar] [CrossRef]
  55. Wong, T.T.; Yeh, P.Y. Reliable accuracy estimates from k-fold cross validation. IEEE Trans. Knowl. Data Eng. 2020, 32, 1586–1594. [Google Scholar] [CrossRef]
  56. Song, J.; Wang, Z.H.; Myint, S.W.; Wang, C.Y. The hysteresis effect on surface-air temperature relationship and its implications to urban planning: An examination in Phoenix, Arizona, USA. Landsc. Urban Plan. 2017, 167, 198–211. [Google Scholar] [CrossRef]
  57. Tomlinson, C.J.; Chapman, L.; Thornes, J.E.; Baker, C.J.; Prieto-Lopez, T. Comparing night-time satellite land surface temperature from MODIS and ground measured air temperature across a conurbation. Remote Sens. Lett. 2012, 3, 657–666. [Google Scholar] [CrossRef]
  58. Marzban, F.; Sodoudi, S.; Preusker, R. The influence of land-cover type on the relationship between NDVI-LST and LST-T-air. Int. J. Remote Sens. 2018, 39, 1377–1398. [Google Scholar] [CrossRef]
  59. Zhang, X.; Chen, N.C. Reconstruction of GF-1 soil moisture observation based on satellite and in situ sensor collaboration under full cloud contamination. IEEE Trans. Geosci. Remote Sens. 2016, 54, 5185–5202. [Google Scholar] [CrossRef]
  60. Deng, K.Q.; Ting, M.F.; Yang, S.; Tan, Y.H. Increased frequency of summer extreme heat waves over Texas area tied to the amplification of pacific zonal SST gradient. J. Clim. 2018, 31, 5629–5647. [Google Scholar] [CrossRef]
Figure 1. The geographical location of WMA. The points represent the meteorological stations.
Remotesensing 14 03536 g001
Figure 2. The 3H urban temperature mapping methodology of this study.
Remotesensing 14 03536 g002
Figure 3. The structure of the proposed DBN model used for generating temperature data.
Remotesensing 14 03536 g003
Figure 4. Pearson correlation coefficients among the input variables and in situ temperature.
Remotesensing 14 03536 g004
Figure 5. The density scatter plots of the in-situ temperature and 3H air temperature for the cross-validation results. (ad) represent the results for DBN, MLR, BPNN and SVR models, respectively. The x and y axes represent in-situ ground measurements and fusion temperature, respectively. The red color represents dense concentration of scatters.
Remotesensing 14 03536 g005
Figure 6. The density scatter plots and statistical metrics for four randomly selected validation stations. The x and y axes represent in-situ ground measurements and fusion temperature, respectively. The red color represents dense concentration of scatters.
Remotesensing 14 03536 g006
Figure 7. The spatial distribution of statistical metrics all sites in WMA. (ad) represent the distribution of R2, RMSE, MAE and BIAS.
Remotesensing 14 03536 g007
Figure 8. The temporal variations of the temperature data in 2019 at four randomly selected stations.
Remotesensing 14 03536 g008
Figure 9. The spatial distributions of average fusion temperature during each season in 2019.
Remotesensing 14 03536 g009
Figure 10. The temporal variation of fusion temperature in each month 2019, The black dots represent outliers.
Remotesensing 14 03536 g010
Figure 11. The spatial distribution of ERA5-Land temperature and fusion temperature on October 1st in WMA. (a,b) represent the fusion temperature and ERA5-Land temperature, respectively. The Red Boxes showed the detail difference between these two air temperature data in the same subarea.
Remotesensing 14 03536 g011
Figure 12. The temporal variations of R2, RMSE, MAE and BIAS in each month. The black dots represent outliers.
Remotesensing 14 03536 g012
Figure 13. Model performance in different land cover types (on the left) and ranges of elevation (on the right).
Remotesensing 14 03536 g013
Figure 14. The density scatter plots for 32 validation stations based on point–surface data fusion (a) and surface–surface data fusion (b). The x and y axes represent in-situ ground measurements and fusion temperature, respectively. The red color represents dense concentration of scatters.
Remotesensing 14 03536 g014
Figure 15. The density scatter plots of the 3H air temperature for the Austin, Texas area for the cross-validation results.
Remotesensing 14 03536 g015
Figure 16. Average temperature distribution for August in Austin, Texas using the Deep Learning model.
Remotesensing 14 03536 g016
Table 1. Detailed information of three categories of datasets used in this study.
CategoryProductVariableSpatial ResolutionTemporal ResolutionTemporal Span
Remotely Sensed ProductsMOD13Q1NDVI250 m16 Days
EVI
SRTMDEM30 m-
Reanalysis ProductsERA5-Land2 m Temperature0.1°Hourly2019
Soil moisture
Wind Speed
Albedo
TRIMS LSTLST1 kmDaily
In Situ MeasurementsIn Situ StationMean Temperature-Daily
Table 2. The equations and detailed information of PCC, R2, RMSE, BIAS, and MAE. P i and M i represent the ith fusion value and ground measurement, respectively. P ¯ and M ¯ indicate the average values of fusion temperature and in situ measurements. n is the number of the sample.
MetricEquationUnit
PCC PCC = i = 1 n ( P i P ¯ ) ( M i M ¯ ) i = 1 n ( P i P ¯ ) 2 ( M i M ¯ ) 2 -
R2 R 2 = 1 i = 1 n ( P i M i ) 2 i = 1 n ( M i M ¯ ) 2 -
RMSE RMSE = i = 1 n ( P i M i ) 2 n °C
MAE MAE = 1 n i = 1 n | P i M i | °C
BIAS BIAS = 1 n i = 1 n ( P i M i ) °C
Table 3. Elevation and annual mean temperature statistics for WMA cities.
CityMax Elevation (m)Mean Elevation (m)Min Temperature (°C)Max Temperature (°C)Mean Temperature (°C)
Wuhan72637.0016.4018.2417.42
Huangshi776108.9816.4017.8817.10
Ezhou44531.4116.9218.1817.48
Xiaogan81875.3715.5917.8416.81
Huanggang1674174.6913.8218.0516.65
Xianning1555189.7215.6217.9416.79
Xiantao8326.2616.8317.8417.41
Qianjiang12728.0914.2817.5217.13
Tianmen14431.1915.0417.5316.95
Table 4. DBN model performance for different layers and neurons.
DBN Hidden LayerHidden Layer NeuronsRMSE (°C)MAE (°C)R2
225, 201.1170.8640.985
325, 15, 101.0860.8390.986
325, 20, 151.0870.8440.986
425, 20, 15, 101.0850.8390.986
Table 5. Model accuracy for different combinations of datasets. E: ERA5-Land data; L: TRIMS LST; R: Remotely Sensed Products; T: Temporal parameters.
Dataset CombinationsRMSE (°C)MAE (°C)R2
E1.2190.9220.982
E + L1.2440.9410.982
E + R1.1240.8760.985
E + R + T1.1060.8580.986
E + L + R1.1340.8750.985
E + L + R + T1.0860.8390.986
Publisher’s Note: MDPI stays neutral with regard to jurisdictional claims in published maps and institutional affiliations.

