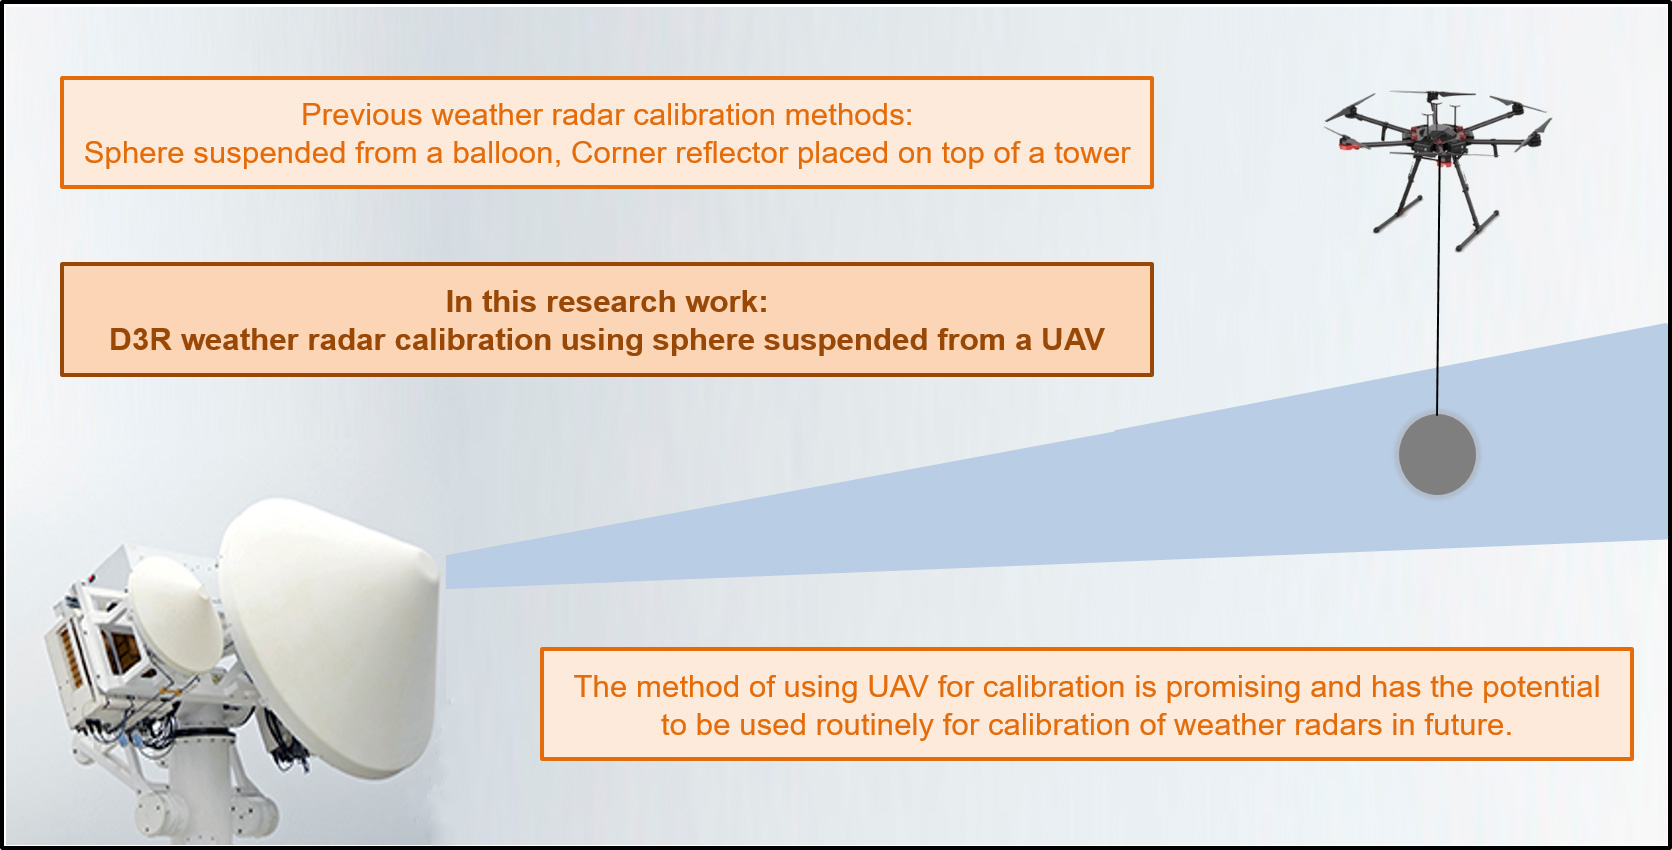
1. Introduction
Remote-sensing observations are used in various meteorological and hydrological models. Maintaining the quality of the remote-sensing data is required to ensure accurate information is obtained from the remote-sensing instruments. The calibration of the remote-sensing instruments are necessary to obtain accurate data from them. Having the advantage of obtaining data over a large spatial area, weather radars play an important role in the remote sensing of the atmosphere. The weather radars have to be calibrated periodically to ensure that quality data are delivered to the end user. The calibration of the weather radar has a direct impact on the accuracy of the radar moments, such as reflectivity (Z) and differential reflectivity (. The derived products obtained from the radar data, such as the hydrometeor classification, are sensitive to the radar moments, such as . A small bias in the values will affect the hydrometeor classification outputs.
There are various methods which are used for calibrating the weather radars. One of the traditional methods is to use a weather balloon with a tethered sphere. The end-to-end weather radar reflectivity calibration using a metal sphere is widely known and long practiced [
1]. The differential reflectivity can also be calibrated using a metal sphere [
2]. For the calibration procedure, a clear day with no precipitation is required. The weather balloon calibration experiment usually requires a day in which the wind speeds are very low, along with a clear day. If the wind speeds are significant, the weather balloon might be influenced by the wind and the calibration exercise will turn out to be difficult, as the sphere will not hold a constant position. The theoretical radar cross section (RCS) of the sphere is determined, and then the returned power is computed accordingly. The RCS of a sphere is obtained using Equation (1):
where
r is the radius of the sphere. From this equation, it can be seen that the RCS only depends on the radius/diameter of the sphere. The return power when using a sphere is not affected by the rotation of the sphere in any axis; this is because the RCS does not change as the sphere rotates. From the radar’s perspective, the RCS is the same even if the axis of the sphere is different. Using a sphere for calibration, we obtain good polarization to the linear polarized waves. Another advantage of using a weather balloon with a tethered sphere is that the calibration exercise can be adjusted according to the terrain around the radar, i.e., we have the flexibility to manage the weather balloon’s location so that the calibration exercise is not constrained by beam blockage due to buildings or structures around the radar.
Another well-known and frequently used calibration technique for weather radars is using a corner reflector. A corner reflector of a known dimension is considered and is usually placed on top of a tall tower or a tall building. The expected RCS of a trihedral corner reflector can be computed with the help of the dimensions of the corner reflector, using Equation (2):
where
λ is the wavelength of the radar and
L is the inside length dimension of the trihedral corner reflector. From this equation, it can be seen that the RCS is dependent on the wavelength of the radar and the dimensions of the corner reflector. It should be noted that a corner reflector of suitable dimensions should be chosen, according to the frequency of the radar to be calibrated. The corner reflector should be adjusted so that the line of sight is towards the radar and a strong return signal is obtained. The return power is compared with the expected power level and the radar parameters are tuned to obtain a perfect match. The installation of the corner reflector can be made permanent, which will then enable the opportunity to frequently calibrate the weather radar.
Some of the other notable methods of calibration of weather radars are accomplished with the use of a disdrometer, radar profiler, or another well calibrated weather radar; the calibration is usually carried out by comparing the radar moments between the two instruments [
3,
4,
5]. In the past, many radars were calibrated with the help of the CSU-CHILL S-band radar, which is known for its calibration standard [
6,
7].
Although the calibration methods discussed above are widely used, there are a few disadvantages associated with them. For the weather balloon with the tethered sphere calibration exercise, the balloon and the sphere must hold a constant location for the calibration to be successful; if the sphere is not steady, due to various reasons such as wind, the received power at the radar might not be correct and we may obtain an incorrect calibration. There is always an uncertainty in the actual position of the sphere while using this method. It is difficult to obtain a target centered within both the beam-width and along-range receiver filter response and it may take a long time to adjust the radar parameters [
8]. The corner reflector calibration methods has its own disadvantages. If the corner reflector is not adjusted correctly, only a part of the signal will be reflected back to the radar and the calibration will be incorrect. A strong return signal will be obtained at the radar once the corner reflector is correctly adjusted, which is dependent on the experience of the radar engineer/operator [
9]. The corner reflector calibration will be difficult in cases where the radar is located on top of a tall building or a mountain, so the terrain around the radar plays an important role, since a line of sight is required between the radar and the corner reflector. Both of these calibration methods require detailed planning and can be costly. Efficient and feasible calibration techniques which overcome the above-mentioned disadvantages are a topic of research in weather radars.
The technology and design of the UAVs have rapidly progressed in the last few years. Some of the factors which drive the research into the design of the UAV are the weight of the UAV, the size of the UAV, and the material to be used for building the body of the UAV. As for the technological aspects, UAVs having multiple sensors are commonly used in various applications. Various sensors, such as cameras and GPS, can be found in most of the UAVs. There are a wide variety of UAVs available in the market today, which can suit a specific application. The UAVs have made such a positive impact in today’s world that they are also being used for aiding firefighters in emergency rescue purposes [
10].
As seen earlier, the accurate calibration of weather radars is always a challenging task and involves a fair amount of resources and manpower. With UAVs making remarkable progress in other domains, the potential of using UAVs for weather radar calibration is explored in this work. UAVs will be widely used in the remote-sensing domain in the future [
11,
12]. We have worked on the idea of calibrating weather radars with the help of UAVs over the past few years and have successfully calibrated many radars.
Using UAVs for the calibration of weather radars has many advantages over the traditional methods of calibration which were previously mentioned. One of the limiting factors for the weather radar calibration is the terrain in which the instrument is deployed. Frequently, weather radars are deployed on the roof of multi-story buildings or on top of mountains to avoid the blockage of the radar beam. The X-band weather radar deployed at the University of Texas at Arlington is situated on the top of a tall building. In addition, it is complicated to calibrate a weather radar when the radar is deployed for field campaigns or experiments in which the radar is located on a tall tower or a ship. The calibration of weather radars will be much easier using UAVs in such complex scenarios. In future, calibration using UAVs for weather radars can be extended to radars deployed on ships, such as the SEA-POL radar. The SEA-POL radar was on a campaign in the Pacific Ocean collecting data for more than two months [
13]; therefore, if calibration was required on-board, using a UAV would be a good option and can be considered for future.
Unlike a corner reflector mounted on a tower, the UAV-based calibration process can be repeated when needed, without the need of a permanent setup for the calibration. This gives an advantage that the equipment used for the UAV experiment can be easily transported to a different location for the calibration of other radars. Since system calibration is not carried out on a daily basis, many radars can use the same UAV and the sphere to perform the calibration experiments. Thus, the UAV-based radar calibration is repeatable and cost effective, compared to the other methods.
Many researchers around the world are currently working on the calibration of radars with the help of UAVs. A drone-based external calibration of a heterodyne FMCW radar which operates at the Ku-band is shown in [
14]. In their calibration experiment, the metal sphere was attached to the drone itself, i.e., there was no separation between the metal sphere and the UAV. This results in backscattering contamination from the drone. The researchers at the Delft University of Technology have carried out a drone-based calibration for a S-band TARA radar [
15]. In their experiment, the radar antenna was kept in a constant position and the UAV from which the sphere was suspended was moved in a zigzag pattern. They used two GPS to check that the sphere and the UAV were in separate range bins to reduce the backscattering contamination from the UAV. The results from their study effectively mapped the antenna pattern of the radar, and the calibration results look promising. The authors of [
16] performed the radar calibration by mounting a corner reflector on a UAV. They performed the experiment using an X-band outdoor measurement system. They used a high resolution image to reduce the RCS error from the UAV; this was because the corner reflector was attached to the drone itself. The results discussed in these prior works complement the results shown in this paper.
The practical aspects of calibrating the dual frequency, dual-polarization Doppler radar (D3R) radar using a metallic sphere suspended from a UAV is discussed in this work; this paper is structured as follows: In this section, a brief introduction to the calibration of weather radars using well-known techniques was provided. This section also explained the benefits of using UAV-based radar calibration. In
Section 2, a brief introduction to D3R weather radar is given. The calibration experiment, which was conducted on 28th March 2019, for calibrating the D3R radar is explained in detail in this section.
Section 3 shows the expected values and the measured values of the signal levels from the D3R radar and the output of the calibration exercise. Finally,
Section 4 gives a summary of this work.
2. Calibration Experiment Using UAV and Metal Sphere
The weather radar calibration using UAVs is an emerging technology. There are various factors which must be considered when using this calibration method. Unlike a weather balloon or a corner reflector calibration experiment, an appropriate UAV, along with a dedicated UAV pilot, is needed. The calibration for the D3R, using a UAV and metal sphere, was carried out on 28 March 2019. The practical considerations for the calibration experiment using UAVs, along with the description of the calibration experiment for the D3R, are discussed next.
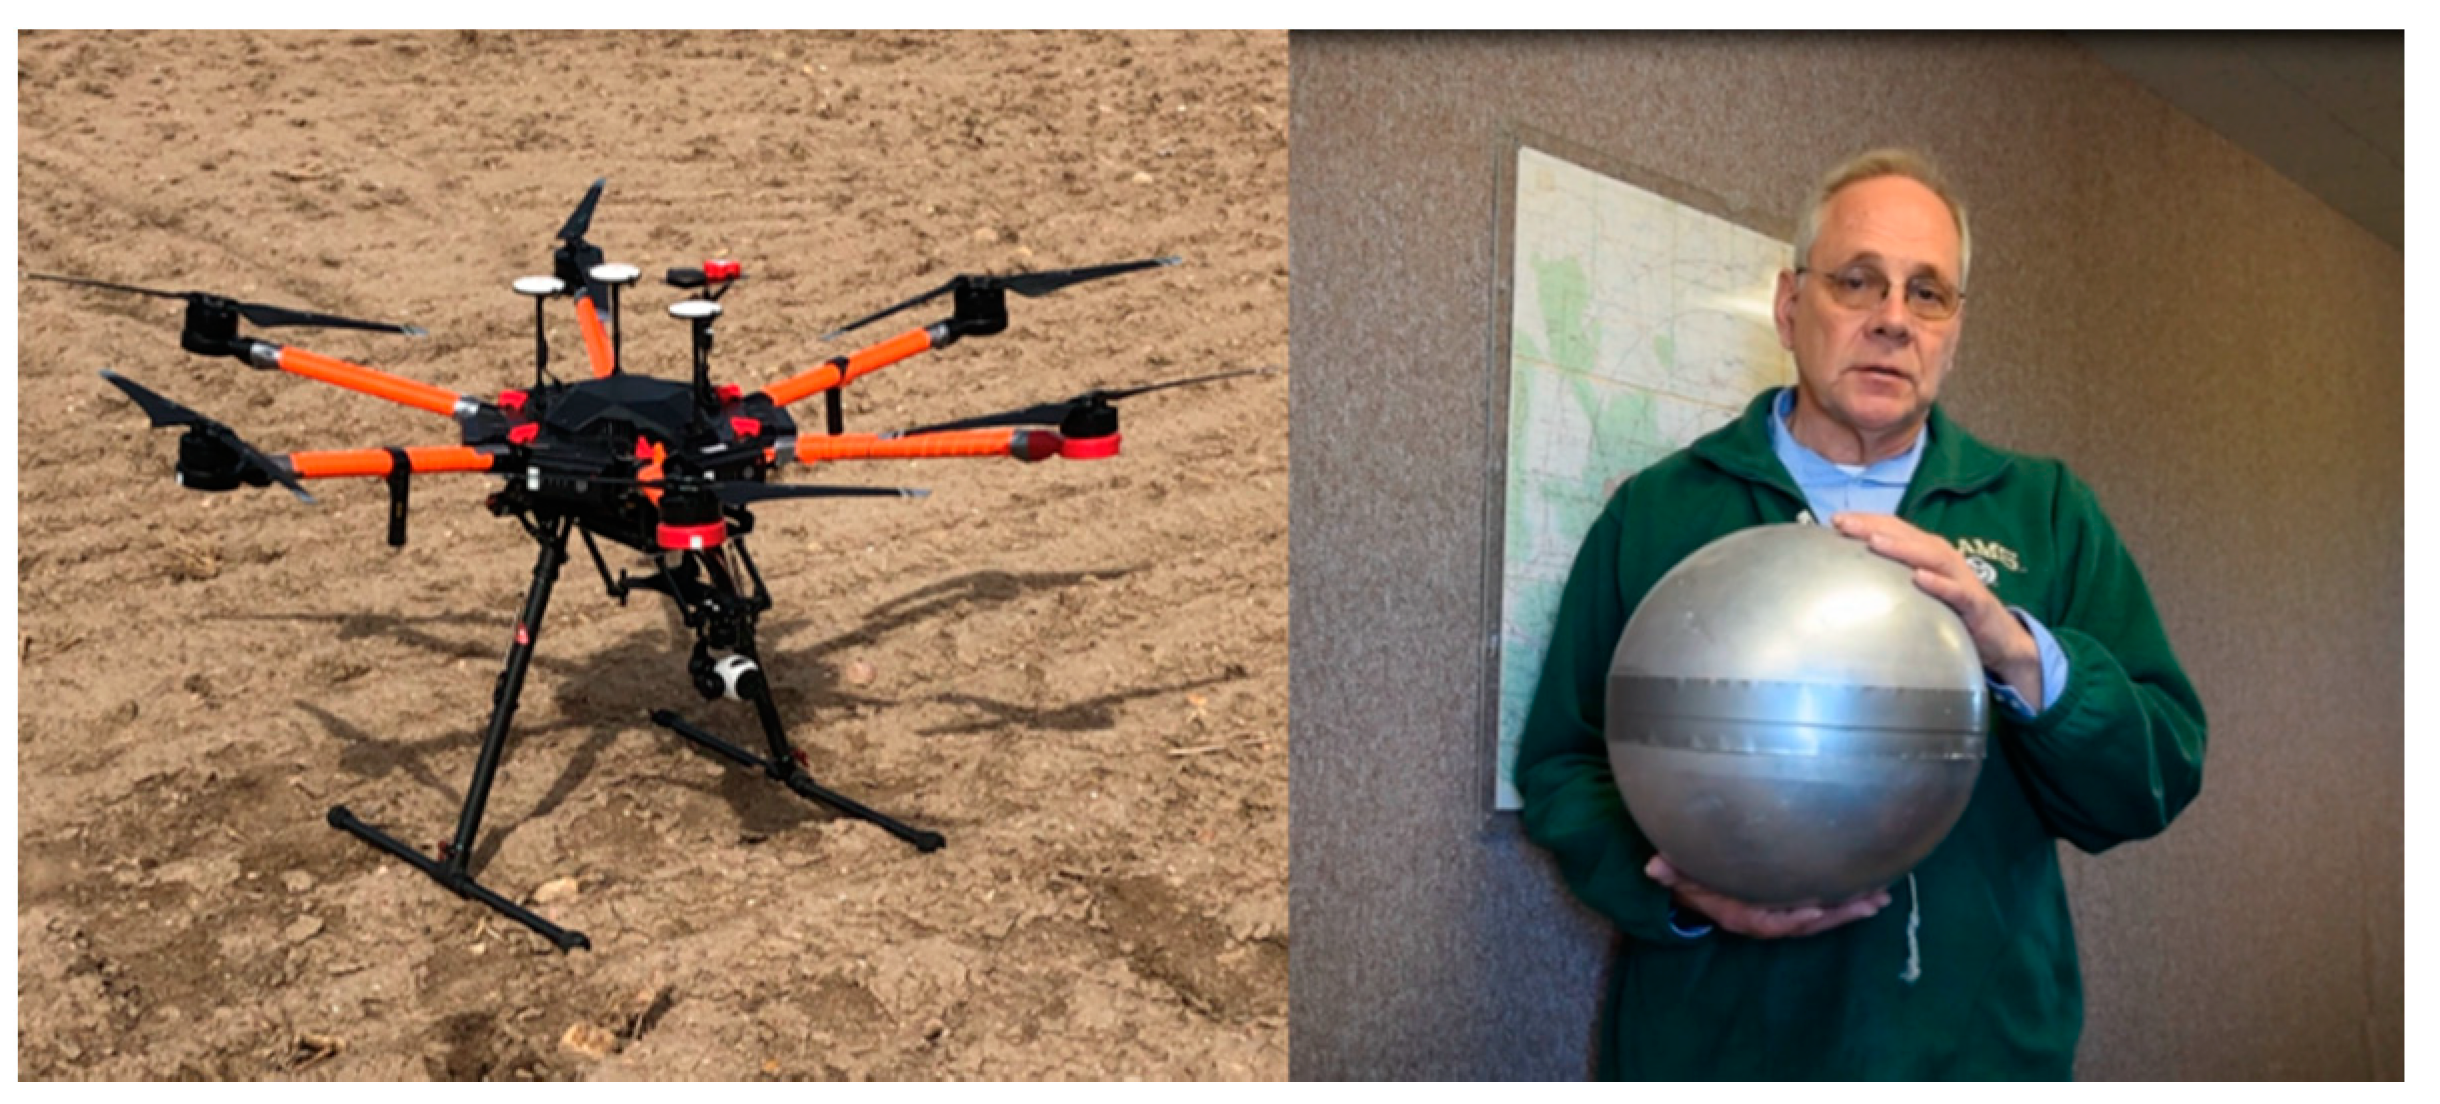
Although a wide variety of UAVs are available on the market, not all of the UAVs are capable of hosting a payload from them. A subset of UAVs can accommodate a payload, and targets can be suspended from them. For the D3R radar calibration experiment, the DJI Matrice 600 Pro with lift swing and drop switch was used. The specifications of this UAV are given in
Table 1. A picture of the UAV used, along with the metal sphere which was suspended from the UAV, is shown in
Figure 1. A hollow aluminum metal sphere, which was 20.48 cm (12 inches) in diameter and weighed 771 g, was used for this experiment. However, suspending the sphere only used less than 20 percent of the maximum take-off weight. If a heavier sphere is suspended from the UAV, care should be taken that the maximum recommended take-off weight is not exceeded. Hence, the maximum weight for the payload depends on the UAV used. The UAV size is defined based on the maximum take-off weight; the UAV used falls in the medium UAV category. Another criterion for the UAV, which should be carefully chosen, is the hovering accuracy of the UAV. It is desirable to have a very small hovering accuracy of within a few centimeters. If the UAV has a bad hovering accuracy, there is a possibility that the sphere will not be present in the desired resolution volume during the calibration.
Another factor to be considered for a UAV-based weather radar calibration is that only trained and certified UAV pilots can operate non-recreational UAVs. The UAV pilot should maintain the position of the UAV and move the UAV as required for the calibration experiment. The D3R calibration experiment was supported by the Colorado State University Drone Center. A certified UAV pilot and two additional people were present during the day of the experiment, handling the UAV.
In this work, we have discussed weather radar calibration using a sphere attached to a UAV. The sphere can be replaced by other targets, such as a corner reflector for the calibration experiment. When using a sphere, as the UAV hovers around, the roll, pitch, and yaw of the UAV does not affect the calibration experiment, because the sphere’s RCS will be the same from the radar’s perspective. When using a corner reflector, care should be taken so that the corner reflector is aligned towards the radar and maximum power is returned back from the reflector. It depends on how the corner reflector is suspended from the UAV; further research into the use of a corner reflector suspended from a UAV is currently ongoing.
The D3R is a weather radar which operates at the frequency bands of Ku and Ka. The radar which operates at these high frequencies is beneficial in observing light rain and ice hydrometeors. A picture of the D3R radar located at the CSU-CHILL radar facility is shown in
Figure 2. In this figure, the larger radome corresponds to the Ku band antenna and the smaller radome corresponds to the Ka band antenna. The specifications of the D3R are given in
Table 2. Maintaining the calibration of the D3R radar is important; many researchers around the world use the D3R radar data for different pieces of research, such as the microphysical study of rain and ice hydrometeors. The D3R weather radar has operated in several field campaigns in the past, providing accurate remote sensing observations; these could not be achieved without regularly calibrating the radar. The dual-frequency ratio for the D3R, which is defined as the ratio of reflectivity at the Ku and Ka band, will be affected by any calibration offset present in the Ku or Ka radars. In the past, the D3R radar was calibrated using a sphere suspended from a weather balloon, or a corner reflector placed on top of a tall tower at a known distance, and comparing the D3R data with the other instruments. The pointing direction of the D3R is calibrated by considering the sun as the reference and correcting the D3R position with respect to true North.
The D3R radar is a polarimetric matched-beam scanning weather radar system. Being a dual-frequency radar, the radar operates in 13.9 GHz (Ku frequency band) and 35.5 GHz (Ka frequency band). Both the Ku and the Ka radars are mounted on a common positioner and adjusted so that they scan the same resolution volume during operations. The radar has a maximum unambiguous range of 40 km and employs a two-pulse strategy (short and long pulse) for signal transmission. The short pulse extends up to 4.3 km in range. The UAV was located approximately 2 km distant; this corresponds to the data received from the short pulse. At 2 km, the sphere is located at the far-field for both the D3R Ku and Ka radars. The minimum distance satisfying the far-field can be obtained using the equation
, where D is the diameter of the antenna used. The minimum distance for the signal to be considered in the far field is approximately 310 m for the D3R Ku radar and 120 m for the D3R Ka radar, respectively. More details about the D3R radar can be found in [
17,
18].
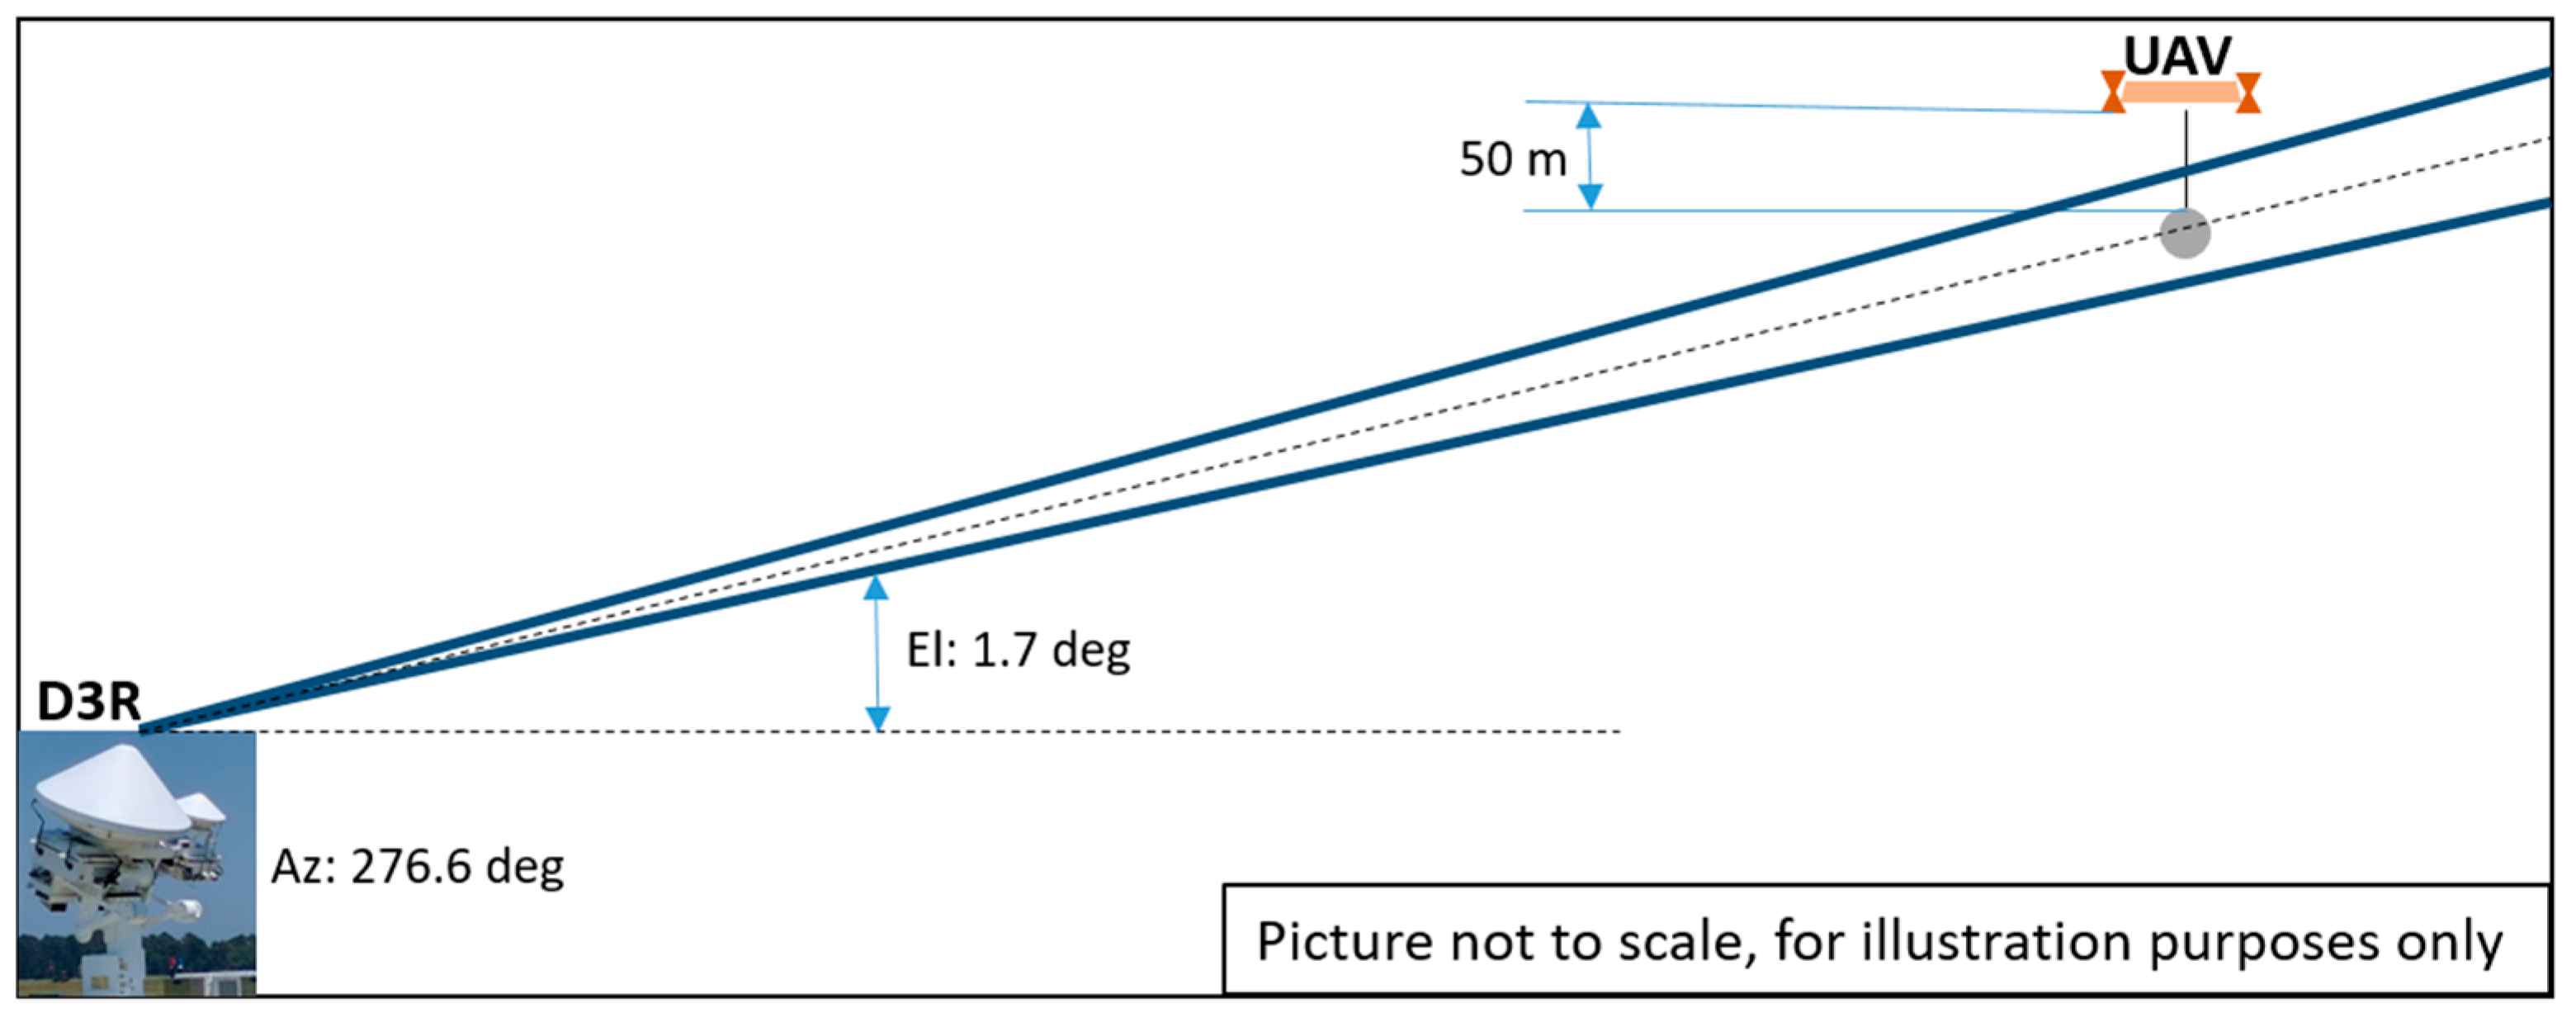
The D3R was located at the CSU-CHILL radar facility during this calibration experiment. The drone was placed at a distance of about 2 km, which is far enough to be in the far-field of the D3R radar but close enough to reduce ground clutter. The location of the D3R radar, the location of the UAV, and the terrain around the radar are shown in
Figure 3. The advantage of calibrating the radar using a UAV is that the location of the UAV can be changed easily to accommodate the calibration requirements. This is very convenient, especially when the radar is deployed in a complex environment as discussed in the last section.
As seen in
Figure 3, the location of the D3R was very close to the Greeley-Weld County airport in Colorado, USA. There are a large number of restrictions on flying a UAV this close to the airport, so the appropriate permissions were obtained for this drone experiment from the airport authorities. The UAV was flown at an altitude of 121 m from the ground to avoid increased regulatory complications from the Federal Aviation Administration (FAA). This is another factor which needs to be considered when performing a calibration experiment using a UAV. Because the calibration experiment was carried out close to the airport it involved prior permission and paperwork which took a few days for processing, that should be considered when designing the experiment.
Figure 4 shows the geometry of the scene of the experiment. The metallic sphere was attached to the UAV with the help of a cord. As mentioned before, the UAV was at a height of 121 m, and the separation between the UAV and the metallic sphere was 50 m; this allowed a sufficient distance for the radar to distinguish the return signals from the UAV and the sphere. The UAV/sphere was geo-located at an azimuth angle of 276.6 degrees with respect to the D3R radar. The elevation angle to the sphere was 1.7 degrees.
The schedule for the UAV flights was designed such that the D3R had enough time to collect data from the UAV and the sphere. Four flights were scheduled, each flight having 15 min fly time. The UAV hovered over its location, while the D3R radar performed different scans to perform the calibration experiment. The first couple of flights were used to accurately locate the UAV and the sphere in relation to the radar. Since the D3R has a user-friendly graphical user interface (GUI), the process of collecting the scans and visualizing the data is easy. The D3R collected raster scans around the UAV and sphere region. The scans were collected at a high scan resolution which will be useful for determining the characteristics of the UAV and sphere. The raster scans were collected for 2 degrees in azimuth and 2 degrees in elevation around the sphere. Some difficulties were encountered during the calibration experiment; the wind conditions changed, causing the flight patterns at Greeley-Weld County Airport to fly over the location, which affected the fourth flight schedule of the experiment. The observations and results of this calibration experiment are explained in detail in the next section.
3. D3R Calibration Results
Before the UAV calibration experiment, the D3R was deployed in the ICE-POP field campaign in South Korea. The systems were well calibrated for the field campaign and a small offset value was expected from the UAV calibration experiment.
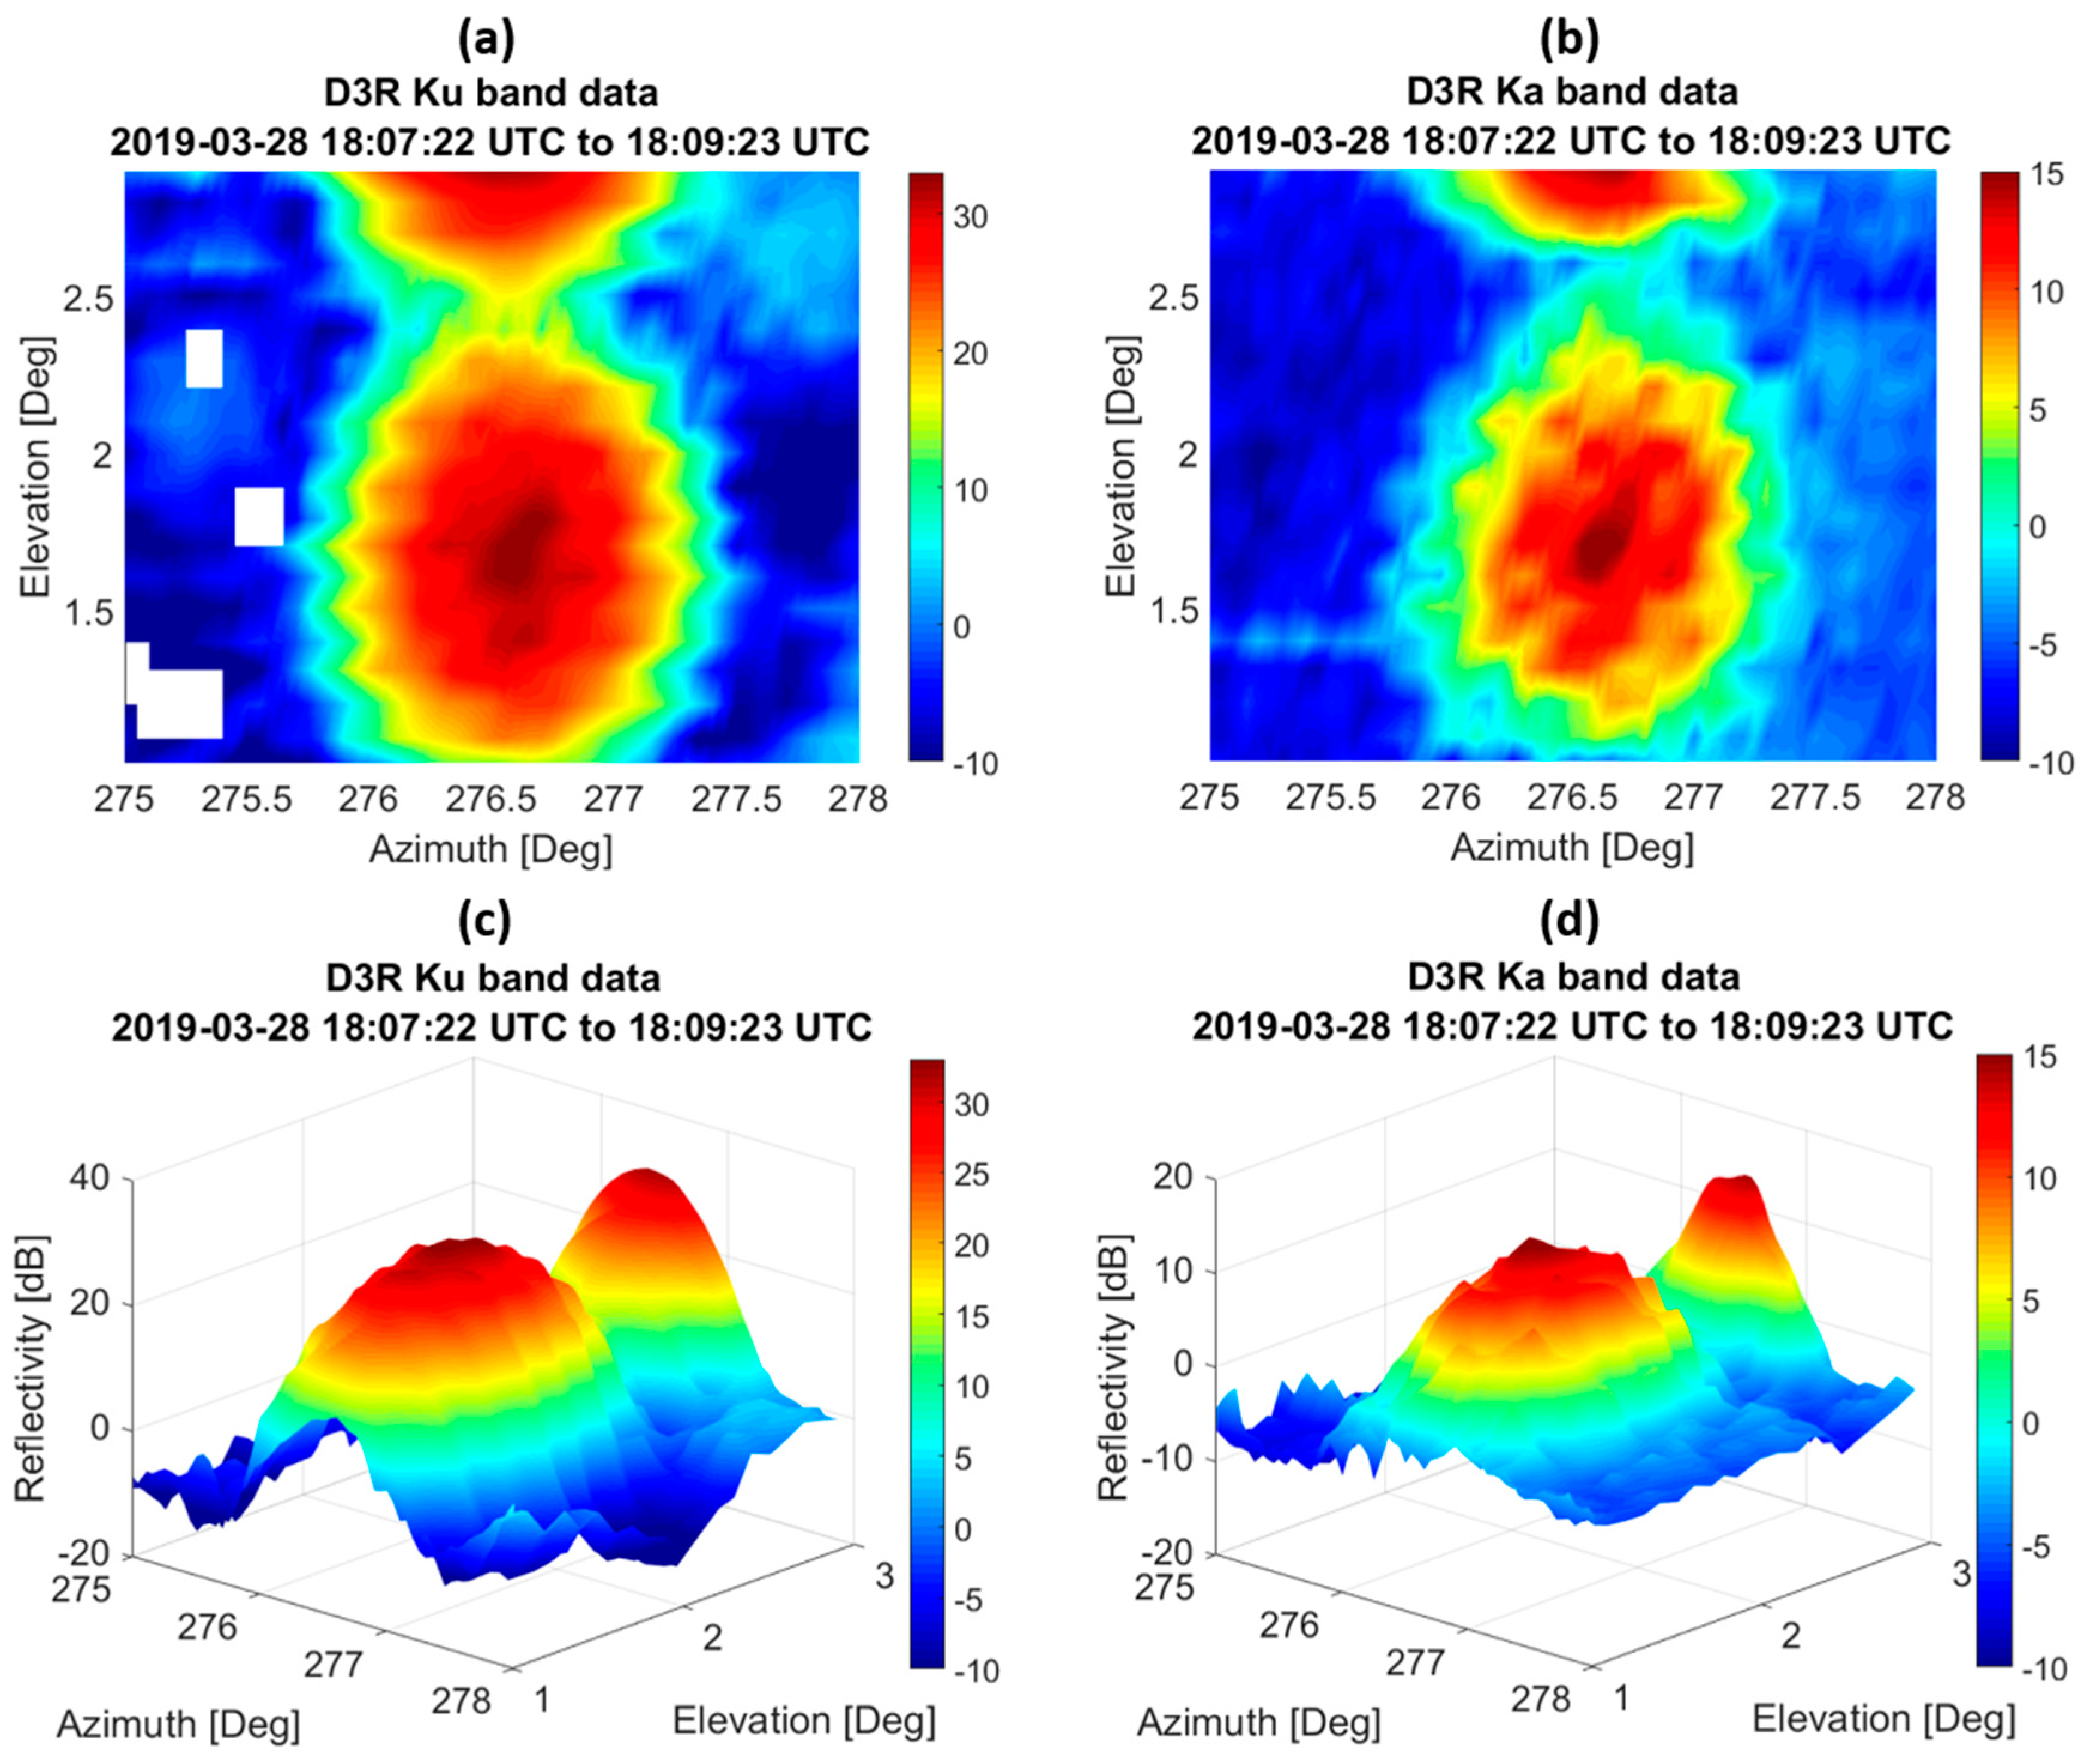
Figure 5 shows the reflectivity plot from one of the raster scans during the calibration experiment, both the Ku and Ka band data are shown in this figure. The data were taken at 18:07 UTC.
Figure 5a,b shows the raster scan outputs for the D3R Ku and Ka data, respectively. From these figures the separation between the UAV and sphere is clearly noticeable. The raster scans of the D3R were centered around the metal sphere and was not scanning for the UAV, hence, the UAV signatures are cut off at the top of the figures.
Figure 5c,d show the 3-D plots of reflectivity for the D3R Ku and Ka data, respectively. The power return from the sphere can be clearly seen from this scan set, and the peak values of the reflectivity from the data were considered for the calibration.
Figure 6a,b show a PPI of the raster scan Ku and Ka data, respectively, for the peak reflectivity corresponding to the sphere. We can see from this figure that there is a clear peak of reflectivity value in the resolution volume where the sphere was present.
Figure 6c,d show the line plot of reflectivity at 276.6 degree azimuth considered for the scan, this corresponds to the line of sight of the UAV, sphere, and the region between the UAV and the sphere. From these two plots, it can be seen that the reflectivity values peak when the radar resolution volume has the sphere or the UAV, but drops in the region between them. This shows that separating the UAV and the sphere will yield correct computations of the calibration with respect to the sphere.
The received power of a metal sphere located on the antenna boresight direction and located in the far-field is computed using the Equation (3) [
19]:
where
is the transmit power;
G is the gain of the antenna;
λ is the wavelength of the radar;
lwg is the waveguide loss factor;
R(ms) is the distance to the metal sphere; and
σ(ms) is the radar cross section of the metal sphere.
The expected reflectivity from the sphere is computed considering the received power of the metal sphere, the radar constant of the D3R Ku and Ka radars, and the distance to the target. Since the range resolution of the D3R is 150 m, the sphere is located at 1.95 km from the radar data scans. For the sphere at 1.95 km, both the Ku H and V pol expected reflectivities are 32.85 dBZ, and both the Ka H and V pol expected reflectivities are 13.34 dBZ.
The scan corresponding to the maximum reflectivity in the raster scan set is considered for obtaining the measured reflectivity value from the sphere.
Figure 7 shows the reflectivity values obtained from the radar for Ku and Ka H and V pol, respectively. The Ku H and V Pol reflectivities are 30.64 dBZ and 32.85 dBZ, respectively. The Ka H and V Pol reflectivities are 15.28 dBZ and 14.67 dBZ, respectively. The expected and measured values of the reflectivities are summarized in
Table 3. Comparing the expected and measured reflectivity values, the Ku H Pol is down by 2.21 dBZ, the Ku V Pol is well calibrated, the Ka H Pol is down by 1.94 dBZ, and the Ka V Pol is down by 1.33 dBZ. Necessary corrections were accounted for and corrected in the radar system parameters. The radar constant was modified, based on the calibration offset measured from the experiment. This correction was carried out in the processing stage of the radar. The accuracy of the methodology can be obtained by considering multiple measurements of the sphere from the radar. In our experiment, the calibration was accurate within 1 dB after many runs.
4. Summary
The use of UAVs for weather radar calibration is an emerging technology. Some of the prior research works have shown the potential of using UAVs for radar calibration. In our study, suspension of a metallic sphere as a calibration target under a hovering UAV was found to provide a viable method of obtaining power calibration for the D3R weather radar. Various practical aspects of the calibration experiment were discussed in detail.
The sphere was placed in the far-field of the D3R, and the raster scans in azimuth were performed around the sphere. From the calibration experiment data, we were able to find a significant return power from the sphere, which was then used to calibrate the D3R Ku and Ka radars. With a separation of 50 m between the UAV and sphere, minimal contamination from the UAV was found in the scans collected for the sphere. The UAV signatures in the dataset were also significant and were detected as a separate peak.
Currently, we are working on the design of calibration experiments using UAVs for other radars present at the CSU-CHILL radar facility. For future experiments, a corner reflector will be suspended from the UAV, to see if it is a viable method of calibration. Suspending a corner reflector from a UAV is tricky, because, for accurate calibration, the orientation of the corner reflector should be aligned so that it is facing towards the radar. In addition, we would like to fly our UAV at higher altitudes; this would require permission from the Greeley-Weld County Airport. The observations of the UAV signatures from the radar will be researched further and presented in a future work.


