Article

Remote Sensing and Mineralogical Analyses: A First Application to the Highly Active Hydrothermal Discharge Area of Pisciarelli in the Campi Flegrei Volcanic Field (Italy)

1
Istituto Nazionale di Geofisica e Vulcanologia, Sezione di Napoli Osservatorio Vesuviano, Via Diocleziano 328, 80125 Napoli, Italy
2
Dipartimento Ingegneria Civile, Edile e Ambientale Università degli Studi di Napoli Federico II, P.le Tecchio, 80125 Napoli, Italy
3
Dipartimento di Scienze della Terra, dell’Ambiente e delle Risorse, Università degli Studi di Napoli Federico II, 80126 Napoli, Italy
4
Istituto per i Polimeri Compositi e Biomateriali (IPCB), CNR-Via Campi Flegrei, 34, 80078 Pozzuoli, Italy
*
Author to whom correspondence should be addressed.
Remote Sens. 2022, 14(15), 3526; https://doi.org/10.3390/rs14153526
Submission received: 10 June 2022 / Revised: 18 July 2022 / Accepted: 19 July 2022 / Published: 22 July 2022

Abstract

:
This paper explored the relationship between acidic sulfate alteration, geostructural frameworks, and geomorphological changes that can be observed in active volcanic hydrothermal systems. The target area was Pisciarelli in the Campi Flegrei volcano, where diffuse acidic sulfate alteration and hydrothermal dynamics have been growing since 2012, causing a progressive deterioration of landscapes. Terrestrial Laser Scanner (TLS), photogrammetry of proximity survey, geological field work, mineralogical and geochemical analysis with Optical Microscopy (OM), electron microscopy, and energy dispersive micro-analysis (BSEM-EDS) and X-ray Powder Diffraction (XRPD) to characterize (and monitor) altered rock outcrops were repeatedly carried out in the area. We present the multi-temporal acquisition and analysis referring to Terrestrial Laser Scanning (TLS) datasets (2014 survey) with 3D-point clouds obtained from the Structure for Motion (SfM) photogrammetry (2021 survey) with a high-resolution digital camera aimed at evaluating volumetric changes on the mostly damaged and altered fault scarp. For each survey, we obtained a vertical Digital Elevation Model (DEM) and a true color RGB orthomosaic that provided the setting of the area at the different times and its evolution through their comparison. Changing sites were examined in the field and characterized for mineralogical and geochemical purposes. The investigated slope lost up to about 4 m3 of deposits between 2014 and 2021, mostly related to hydrothermal alteration induced by gas emissions and meteoric infiltration. Our methodological approach appears promising to evaluate evolution and rock-fall susceptibility of solfataric terrains subjected to hydrothermal dynamics.

Graphical Abstract

1. Introduction

Pisciarelli and the neighboring Solfatara crater are the most active districts within the Campi Flegrei volcanic field (CF; Figure 1), hosting a low to locally high sulfidation system supported by intense hydrothermal activity [1,2]. Since 2006, especially in the district of Pisciarelli, the degassing dynamics strongly increased and changed in the following ways:
(a) the formation and expansion of boiling pools and water springs (started in March 2009) with the opening of energetic geyser-type vents (November 2010) that are increasingly active (Available online: https://www.ov.ingv.it/index.php/monitoraggio-e-infrastrutture/bollettini-tutti/campi-flegrei (accessed on 30 May 2022)); (b) The decrease of temperature measured at fumaroles and pools: in 2011, the average temperature was up to 115 °C, but decreased gradually to the present widespread value of ~95 °C [2,3,4,5,6]; (c) Temporal and spatial variability of the emitted gases with a general dominance of H2O and CO2, subordinate H2S, N2, H2, CH4, He, Ar, CO, and hydrocarbon species, and traces of HCl and HF, but progressively higher CO2 and CO: the most recent CO2 flux from the main Pisciarelli fumarolic vent [7] has shown an increment by a factor > 3 since 2012 (300–400 tons/day) [8,9], reaching, in 2018–2019, levels > 600 tons/day; (c) and enlargement of the CO2-diffuse soil degassing area, well documented by analytical data [3,5]. Since 2016, the authors estimated an increase of ca. 1500 in 2001 to 3000 tons/day, and enlargement of the acid-sulfate alteration zones, as can be easily recognized from the prevalent whitish, yellowish, and grayish color of terrains in proximity to the water pools and springs with greater mutation in relation to wet-dry conditions (Figure 1, [2,6]). Notably, a genuine mud vent replaced the main water pool during several months in 2020–2021. There was also increasing number of the local seismicity, often occurring in seismic swarms just in Pisciarelli [10], and ground uplift (now above the 3.5 m measured after the main 1982–1984 unrest in the central sector of the caldera; [11]) with extension dynamics also in the Pisciarelli zone, recorded by tiltmeter and GPS networks [12].
In seasonal periodicities, some of the abovementioned variations can be amplified or reduced. In particular, various authors correlated the type and occurrence of hydrothermal mineralization and/or efflorescence to seasonal factors changing the physico-mechanical properties of the affected rocks, particularly in volcanic and geothermally active areas (e.g., refs. [13,14,15,16]). According to Hicks et al. (2009) [17], dry seasons facilitate oxidizing conditions and the precipitation of a variety of sulfates (mostly alunogen, iron sulfates, (K)alum, and jarosite) along with alunite and native sulfur. On the contrary, wet seasons facilitating reducing conditions stimulate the dissolution of the above-cited oxidation products and the sulfides’ (mostly pyrite) stability. Furthermore, meteoric water abundance can modify the aquifer emergency and the geometry of pools. Piochi et al., 2019 [6] recently signaled pool enlargement due to hydration consequent of the highly rainy season. Similarly, Fedele et al. 2020 [18] observed a positive correlation between rainfall rate and CO2 soil flux, with the expansion and the edge erosion of the water pool during the wet season.
Overall, these factor changes can induce surface erosion (with a mutual cause–effect amplification) and consequent slope instability, especially in the area where the main Pisciarelli faults network coincides with a nearly vertical wall (fault L1, in Figure 1b) acting as a chief path for fluid/gas ascent. Here, the faulted rocks can show an increased morphological vulnerability. Actually, the literature indicates the hydrothermal alteration as a mechanism that significantly contributes to the volcano and flank instability [19,20,21,22,23,24], changing both mechanical and geotechnical properties of the rocks [25,26,27], particularly in those areas shacked by earthquakes and affected by ground deformation [24,28,29]. The alteration is furthermore able to decrease the rock permeability, which can lead to phreatic eruptions [30,31].
In the hydrothermally active and highly populated Pisciarelli area, studying geomorphological changes and their possible relationships with rock alteration appears, therefore, fundamental for the mitigation of volcanic hazards, as well as the monitoring of the volcano (e.g., ref. [19]).
Despite the importance of the slope stability related to hydrothermal alteration, it is generally neglected and/or poorly discussed. In this regard, integrating remote sensing and mineralogical studies are crucial in an active volcanic area, in which altered materials modify the rock mass properties, promoting large deformations, ground water, and hydrothermal fluid circulation.
Here, we presented integrated mineralogical, geochemical, and geomorphological results taking into account the acid–sulfate environment developed in relation to the fractured settings that facilitate the gas emissions from deeper levels and the meteoric infiltration from surface to depth. For this purpose, multi-temporal acquisition and analysis referred to Terrestrial Laser Scanning (TLS) and photogrammetric proximity survey, the Structure for Motion (SfM) methodology was carried out on the main damaged fault scarp. The faulted rock deposits were described in terms of original and altered textural, mineral and compositional features, with the final aim to unravel relations among rock type, hydrothermal alteration, and morphological evolution in a highly dynamic volcanic area.

2. Volcanic and Geomorphological Setting

CF (Figure 1) is a densely inhabited volcanic field located west of Naples, developing since 39 ka BP within a nested caldera generated by catastrophic eruptions (see refs. [32,33,34] for a review). Since the collapse at ca. 15 ka (Neapolitan Yellow tuff; [35]), and up to 1538 AD, the intra caldera volcanism has produced more than 70 dominantly phreato-magmatic eruptions, separated by periods of rest of variable duration (e.g., ref. [36]). These eruptions determined several tuff cones, such as Solfatara that formed at ca. 3.8 ka and tuff rings, whilst lava domes subordinately occur, two of which (Monte Olibano and Accademia) near to the Solfatara cone [36].
Currently, CF hosts an intense hydrothermal activity and an acid sulfate alteration environment that can be observed on pyroclastic deposits (e.g., Agnano Monte Spina, Astroni, and Solfatara tephra) and lava domes (Monte Olibano, and Solfatara cryptodome) constituting the Solfatara vent structure [1,2,6,37,38]. In particular, hot fumaroles, thermal springs, mud pools, and diffuse degassing both occur inside the crater as well as on the eastern flanks such as at Pisciarelli ([3,9,37,39,40,41] (and references therein [2,3,9,37,39,41,42,43])). Indeed, the acid–sulfate environment has developed under steam-heated and magmatic-steam conditions and thins outwards, moving away from the discharge area above deeper argillitic facies [2].
Pisciarelli (Figure 1b) is characterized by valleys with ephemeral streams separated by hilly terrains located at 170 m a.s.l. that delimit the fumarole field west and south [18]. It manifests an impressive and powerful hydrothermal activity with a combination of various hot and acidic environments [2,6] determined in relation to fumaroles at temperatures up to 110 °C, vigorous boiling pools, and diffuse soil degassing that have been changing and growing since at least 2006 under the effect of the endogenous engine and the meteoric agents [2,3,6,9,42]. The main discharges and pool in Pisciarelli occur along the intersection of the NW–SE and ENE–WSW faults traveling through the Agnano plain and the Solfatara crater, respectively (e.g., refs. [44,45]). Here, CO2 flux has recently shown an abrupt increment (maximum values of 600 tons/d, [7]), and in the meantime significant morphological changes, i.e., rock fall, pool enlargement, and drying-driven mud vent formation, have been occurring. The Pisciarelli hydrothermalism intensely altered the faulted slopes and the solfataric landscapes have replaced the original pyroclastic sequences (Figure 1b). Altered volcanic products can be easily recognized from their prevalent whitish, yellowish, and grayish color that principally affects the original Astroni, Solfatara, Agnano Monte Spina, and older Paleo-Astroni and Monte Sant’Angelo deposits from top to bottom [46] (Figure 1b site 1). The only walls in the highest part of the valley have a distinct dark red alteration level that develops on incoherent pyroclastic deposits. The main alteration minerals are native sulfur, alunite, and other types of sulfate and sulfide with SiO2 species and high concentrations of amorphous, anomalous enrichment of selected elements (As, Ni, Co, Cu, and S) [6,47]. The whitish hydrothermally altered zone becomes either grayish in proximity of the water pools and springs, or yellowish close to emissive vents. The water pool is gray to black in color and is characterized by vigorous boiling (Figure 1b site 3) that locally triggers a geyser-type activity (Figure 1b site 2); it is characterized by amorphous alunite dominating on sulfur, pyrite, barite, and rare illite. The floor of the Pisciarelli valley additionally shows various sulfates that can disappear as the stability conditions changes, such as alum-(K), alunogen, NH4-sulfates, alunite, jarosite, and pickeringite. Locally, the altered rocks, soil, and water show a greenish color due to organic growth that generally happens in wet, middle-acidic conditions at ca. 45–55 °C (i.e., Pseudococcomyxa simplex, Chlorella, Galderia; [41,48]).
Figure 1. (a) Digital terrain map of the Campi Flegrei volcanic field (modified by ref. [49]) showing major structures. The red star indicates location of the Campi Flegrei volcano in Italy. The red box delineates the investigated and populated Pisciarelli area. (b) Google map of Pisciarelli showing main tectonic structures [44,45] and the relevant geomorphological features with location of: (1) the studied scarp; (2) main gas discharges; (3) main boiling water pool (view from the east). (c) View of site 1 in panel (a) showing the studied vertical fault wall and the perpendicular L1 fault (indicated by the arrow) limiting the pyroclastic deposits of Paleo-Astroni and Monte Sant’Angelo on the left, and Solfatara on the right; in (d) vigorous gas discharges and geyser vent of site (2).
Remotesensing 14 03526 g001

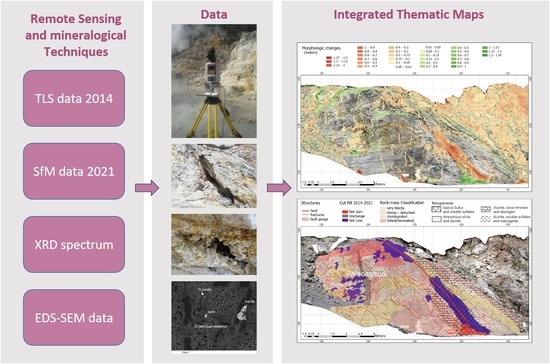
3. Materials and Methods

This research was based on the integration of geomorphological, mineralogical, and geochemical studies in order to enlarge the existing information (see for a review refs. [6,7,18,45,50]) on the acid sulfate alteration zone of the Pisciarelli area, in particular on fault L1 (Figure 1b site 1). Indeed, fault L1 is the most adequate site for image data collection due to the good exposure, the straight surface, the absence of vegetation, the minor presence of both fumarolic vapor and bogging down, and a roughly hydrothermal mineralogical stability.
This geomorphological study was carried out with the support of instruments and innovative techniques which allow the development of digital orthophotos in vertical projection of the target, the damaged fault scarp. We present the results of the Terrestrial Laser Scanner (TLS) analysis of the area performed on data acquired in 2014. We applied the TLS technique based on the Time of Flight (TOF) method in order to recover an accurate (at scale < 1 cm) 3D digital model for detailed observations and structural analysis of the area. The TLS uses a narrow infrared pulsed laser beam, with pulse repetition rate in the range from 70 to 300 kHz. The point cloud acquired from the laser also contains geometry information on coordinate systems. Ten scans were acquired from different points of view or scan-positions in the Pisciarelli area. Therefore, we ensured a good coverage of the area avoiding shaded areas, focusing on the mostly damaged fault scarp (L1 fault). During the data collection, many problems occurred due to the presence of fumaroles. The dense cloud, in fact, limits the ability of penetration of the laser scanner and different scan-positions were also necessary. The result of each scan is a cloud of points characterized by its own coordinate system. The instrument is also equipped with an external reflex digital camera mounted on the top. This allows it to provide high-resolution images simultaneously to scans. The aim was to acquire, in addition to the 3D point cloud, RGB images of the area. The pixel colors acquired by the camera are fused on the point cloud. In this way, each point of the cloud is attributed to its correct color from the digital image. The goal of this study with the TLS was to provide a Digital Terrain Model (DTM) from the point cloud reconstruction.
In May 2021, with the purpose of topographic reconstructions of the impervious area, we acquired 83 high resolution images with the Structure for Motion (SfM) technique following Westoby, M.J. (2012) [43] by using a digital camera, FUJIFILM X-H1, 24 MP, handheld.
A 3D model of fault scarp (dense point cloud) was accurately reconstructed by using the SfM technique, combining parallel streaks to the front, acquired at different distances and heights. The image acquisitions were carried out in the accessible points due to the site and the morphology. A significant number of images were taken in order to ensure good coverage of the investigated area. Moreover, the images were sequentially acquired with a side overlapped at least 80% to obtain a ground sample distance (GSD) comparable to the spacing value derived from the TLS survey (<10 mm). Automatic procedures were conducted both for the orientation of the images [51] and the 3D reconstruction [52,53] using a bundle adjustment algorithm implemented in the photogrammetric software package (AGISOFT METASHAPE PRO® software (version 1.8.3, Agisoft LLC, Saint Petersburg, Russian) [54]). When the environmental conditions allowed it, which means good lighting and poor vegetal cover, the SfM was used, and is fast, cheap, and often used instead of the expensive TLS for the DTM reconstruction [55]. For the purpose of multi-temporal monitoring of an area, a 3D model starting from a laser scanner or with other photogrammetric techniques supported by GNSS/RTK systems can be integrated and compared over time with more expeditious photogrammetric surveys for data acquisition. The SfM survey, when a previous TLS survey is available, allows the creation of subsequent 3D models of the same area, scaled and geo-referenced, through the acquisition and recognition of a series of homologous points of known coordinates belonging to the starting relief [56].

3.1. Preprocessing of TLS and SfM Survey

The workflow of TLS data pre-processing consists of the following steps: (1) processing of the point cloud data (filtering, registration, and decimation); (2) Geographic Information System GIS processing the development of a 2.5D DEM (Digital Elevation Model) from the TIN Triangular Irregular Network in a vertical orthometric projection.
TLS raw data were processed using the RiSCAN Pro® software (RIEGL, Horn, Austria, 2020). Filtering of the dataset consisted of the removal of non-ground points. Typically, these latter ones are given by vegetation, steel nets, and by everything that is not ground; moreover, in our case study, the points of the cloud to be were are relative to the activity of fumarolic gas diffusion. The removal was mainly performed by manual editing. This careful cleaning of the cloud allows for noise reduction in order to obtain a correct rock surface morphology for a derived 3D model. The decimation is necessary for simple data processing, as the large amount of information makes it difficult to integrate and merge multiple clouds. Subsequently, all scans acquired were registered, including the union of the contiguous scans and its georeference, in a unique dataset [57,58,59]. The alignment of individual scans was therein obtained by using the ICP algorithm of RiSCAN Pro® software, with consequent reduction of occlusion effects, as already performed in Caputo et al. 2018 [60].
The point cloud obtained was then imported in GIS for further processing to obtain a 2.5 D TIN in a vertical orthometric projection. Based on the TIN, a raster DEM was derived with a fixed cell size of 5 mm.
The workflow of SfM data pre-processing consists of the following steps: (1) image alignment; (2) import marker coordinates with the specified valid coordinate system derived from laser scanner survey; (3) dense cloud yield; (4) processing for DEM; (5) processing for orthomosaic construction.
The 83 acquired images were processed using the AGISOFT METASHAPE PRO® software (version 1.8.3, Agisoft LLC, Saint Petersburg, Russian), with the processing of alignment based on the fundamental principles of stereoscopic photogrammetry (bundle adjustment algorithm) for determining camera internal and external parameters and the tridimensional coordinates of the object. A 3D structure was therefore reconstructed by a series of superimposed images through an algorithm that identifies common elements in each analyzed image. These common elements were identified in each image, allowing an initial estimate of the coordinates of the object, which were subsequently refined through the identification of a series of points of known coordinates, in our case chosen from the point cloud obtained from the TLS survey. A pre-existing calibration file of the camera lens was used for the internal orientation. Successively, a roto-translation matrix was applied to project the dense cloud parallel to the fault slope. Then, 5 markers on the TLS point cloud of known coordinates for the external orientation were recognized and identified on images acquired such as ground control points (GCP). The errors calculated are 0.012 m on X, 0.005 m on Y, 0.006 m on Z, 0.013 m on XY, and 0.014 m on RMSE. The elaboration for the alignment is based on a non-linear iterative minimization of the least squares method [43]. The obtained sparse cloud was filtered using AGISOFT METASHAPE PRO by using specified criteria, such as reprojection error and reconstruction uncertainly to improve accuracy of the dense cloud [54]. Finally, the SfM methodology provides a point cloud (dense cloud) very similar to the TLS survey (Figure 2) and in this case in the same reference system. Subsequently, a DEM with a vertical projection from the point cloud with a resolution of 3 mm was extracted.
The SfM technique was also applied to obtain a vertical orthophoto, then used as a cartographic layer in the GIS software (version 10.4.1, Esri, Redlands, CA, USA). Starting from the vertical DEM, an orthophoto with a geometric resolution of 3 mm was obtained.
Subsequently, we validated the goodness of the alignment between the two acquisitions (SfM data on TLS data) by using the M3C2 plugin included in the CloudCompare open-source software [61,62]. The M3C2 was computed on peculiar points called core points in order to speed up the computations; moreover, we set the diameter of the spherical neighborhood (Normal Scale parameter) extracted around each core point at 0.02 m to better constrain our results [62]. With M3C2 plugin, we obtained a third-point cloud representative of the distance between the acquisitions. Selecting the cloud portions, we estimated the noise distribution of the alignment. The M3C2 distance allowed us to obtain a scalar-field, useful to indicated morphological change and/or unstable portions [62]. Scalar field values equal to zero correspond to the absence of the morphological change; differently, they are indicative of morphologically unstable portions. In Figure 3 we show the six selected areas where the noise distribution was calculated and in Figure 4 the segmented significant areas and their fit distribution are also represented. In particular, for morphologically stable areas, the fit distribution perfectly followed a Gaussian curve with mean values close to zero, while where collapses/erosions occurred the mean values were far from zero and the fit distribution was not Gaussian. The results of the noise distribution of the alignment confirmed the reliability of the align-and-scale procedure. To assess the quality of the processing, we also calculated Root Mean Square Error (RMSE = 0.018 m) and Mean Absolute Error (MEA = 0.181 m) to assess the quality of the processing (see Table 1 for details). Moreover, we calculated the Confidence Interval (C.I. = +/−1.96 × RMSE = 0.04 m) to establish the interval within which no changes were observed between TLS and SfM data. Our results highlight that volume changes < 0.04 m are not detectable. Therefore, we are confident that volume change values > 0.04 m are representative of a real change with 95% C.I.

3.2. Mineralogical Analyses

In order to evaluate the mineralogical/compositional evolution of the landscape, hydrothermal alteration, and secondary encrustation, a combination of polarizing optical microscopy, X-ray powder diffraction (XRPD), and Backscattered scanning electron microscopy equipped with an energy-dispersive spectrometer (BSEM-EDS) were carried out on rock products sampled along the fault scarp at the labs of the Osservatorio Vesuviano, Istituto Nazionale di Geofisica e Vulcanologia, Naples, Italy. The sampling was conducted at the points shown in Figure 2, considering the variability of texture, colors, and mineral appearance in the field, aimed at recording main mineralogy changes, based on our previous studies [2,6,63]. Samples were dried at lab conditions and preliminarily observed under a binocular to assess the general textural and mineralogical features.
XRPD was conducted on powdered samples using a X’Pert Powder diffractometer by PANalytical, equipped with a high-speed PIXcel detector, Ni-filtered, CuKa radiated (40 kV and 40 mA in the 3–70 2θ range, 0.02° steps at 8 s/step) and PANalytical B.V. software HIGHScore Plus version 3.0e (Almelo, The Netherlands) was used to process the diffraction profiles.
B-SEM examination of the mineralogical associations was carried out on stubs and polished thin sections using a SIGMA Field Emission Scanning Electron Microscope (FE-BSEM) by ZEISS SpA (Milan, Italy). equipped with a XMAN Electron Diffusive Scanning micro-analysis by Oxford (Cornwall, VT, USA); the instruments were controlled by SMARTSEM 5.09 (Carl Zeiss, Oberkochen, Germany) and AZTEC 3.0 (Oxford Instruments, High Wycombe, UK) softwares. Operating conditions were 15–20 kV accelerating voltage, 50–100 mA filament current, 8.5–9.5 working distance, 5–10 nm spot size, and variable acquisition time (several to tens of seconds).

4. Results

4.1. Geomorphological Change and Geostructural Characterization

This section reports a first analysis of the temporal change of the fault L1 between point clouds in order to identify volumetric and morphological changes. For this purpose, we used an open-source software CloudCompare (version 2.12, 2021 retrieved from available online: http://www.cloudcompare.org/ (accessed on 1 May 2021)), particularly its M3C2 plugin. This was used compute distances directly between two point clouds in the input, yielding a third point cloud expressed as the distance between points of different clouds in a 3D space [61]. Further, additional scalar fields could be generated and on which cloud the measurements should be re-projected. Figure 5 shows the result of the M3C2 plugin as the distance between the point clouds acquired in 2014 by TLS and 2021 by SfM. The maximum changes in cloud distance points were ca. +/−0.7 m.
Subsequently, a multitemporal comparison in environmental GIS (ArcGIS Map 10.4.1 (Esri, Redlands, CA, USA) [64]) allowed us to highlight the significant morphologic variation obtained from subtracting the value of the raster DEM 2021 from the value of raster DEM 2014 on a cell-by-cell basis. The map provides the differences between the two DEMs in terms of meters, showing the areas where there was a loss of material deposits, for example, due to collapse, and the areas where they were accumulated, for example, at the foot of the slope. The difference of the two DEMs, 2014–2021, is shown in Figure 6. It highlights that there are zones showing significant changes, although the inner fault zone is affected by intense fumarolic activity which unfortunately could make it difficult to recognize variations. On the map, the values of +/−0.05 m (=5 cm) fell into mean error and are therefore shown as transparent. In the significant areas the volume eroded/accumulated was calculated (see Table 2) using the CUTFILL algorithm implemented in the Esri ArcGIS Map Pro (GIS environment). Focusing on the eroded area, the values allowed us to highlight the feasible correlation with superficial alteration. The map in Figure 7 shows the main areas where the material has been removed or added from the slope, for which the volume changes were calculated. Furthermore, the high resolution of DEM at 5 mm and the orthophoto at 3 mm allowed the recognition of the main structural lineaments such as faults, fractures, and disturbed areas of the fault due to widespread fumarolic activity.
On the basis of the structural lineaments map, we documented a rock-mass classification, reproduced in Figure 8 in accordance with Cai et al., 2004 [65]. In particular, following the Geological Strength Index GSI chart quantification, an accurate visual analysis on the orthophoto with 2 mm resolution was realized. Based on the joint spacing in 1 m2, we identified four rock-mass classes: very blocky (10–30 cm), blocky-disturbed (3–10 cm), disintegrated (<3 cm), and foiled/laminated/sheared (<1 cm).
Finally, an overall structural thematic map was created, as shown in Figure 9, which summarizes the main structures, the CUTFILL 2014–2021, and rock-mass classification.

4.2. Mineralogy

Figure 10 and Table 3 show representative mineralogical features at the L1 fault as recorded by detailed XRPD and BSEM-EDS analyses. The detected authigenic minerals of relevance in this study for the possible effect on the mechanic proprieties of rocks belong to the following groups: (1) native sulfur of high and low (95 °C and <70 °C, respectively) temperature; (2) insoluble K-Na alunite group, with dominant alunite; (3) variable soluble sulfate minerals (mostly alunogen, K-alum and mascagnite, with subordinate pickeringite and gypsum); and (4) amorphous silica and quartz, very abundant. Other secondary minerals are barite, which occurs as widely disseminated minute grains, and clay minerals (illite and illite/montmorillonite interlayers). Except mascagnite, precipitated from chemically peculiar water pool evaporation, most of these minerals are commonly present as volcanic fumarolic encrustations, sublimates, and efflorescences [2,6,66].
Native sulfur forms yellow encrustations at the NNE–SSW trending fracture scarp (such as at the various Pisciarelli discharging vents; see Piochi et al., 2019 [6]), whilst it lacks in the rest of the investigated perpendicular exposure. Sulfur developed as acicular crystals around gas emission vents, producing a brittle yellow to orange efflorescence (Figure 10a) with a low cohesion behavior. Under the microscopic scale (Optical Microscope), these tiny crystals, often highly elongated, were generally clustered within rock voids and/or veins (Figure 10b,c and Figure 11a–c). The BSEM provides details at higher magnification. Locally, sulfur lacked a proper crystal habit, appearing as irregularly shaped nodules under the BSEM, possibly in relation to the loss stability condition during runoff, feebler soil degassing, or chemical gas changes (Figure 11a,b). This type of sulfur was found at low-temperature vents, at the base of the L1 scarp, and differs from the sulfur sampled at higher-temperature fumaroles related to a timely observable stable gas pathway escaping the inner scarp, which showed a tabular habit (Figure 11c) and a brighter yellow color. The presence of native sulfur allows identifying the outflow zones able to scrub the ascending gases, as observed by Rouwet et al. (2020) [67].
Alunite is the most abundant hydrothermal species, followed by alunogen. They form the whitish downy encrustations mainly in association with or located near yellow (i.e., sulfur and pickeringite) mineralizations. At BSEM, alunite mostly appears as euhedral crystals and fine-grained laths (Figure 11d); the figure shows that euhedral bladed alunite tends to cluster in the host rock, producing cohesive agglomerate and it is generally stable except for high dehydration conditions (ref. [63]; see later on). Another sulfate is the alunogen that presents acicular shape and commonly grows on the greenish encrustations (organic formation) together with opal spherules, or it occurs in the fluffy, whitish encrustation together with K-alum as a product of dehydration and decomposition of alunite (Figure 10a and Figure 11e). Amorphous SiO2 (i.e., opal; Figure 11f) and quartz were observed in all investigated samples: amorphous SiO2 showed a broad ‘hump’ in XRPD spectra (Figure 11g) and commonly formed compact and/or anhedral masses (i.e., opal; Figure 11f); instead, quartz was well crystallized (Figure 11b). Locally, alunite and alunogen can occur together with pickeringite in dehydrated lenses. This latter mineral was very subordinate in our samples and mainly developed as matted aggregates (Figure 11h).
Clay mineral phase varies from illite to illite/montmorillonite interlayers away from the main fumaroles, in the grayish and whitish area. The BSEM images showed clays as flakes developed in microfractures and dissolution voids of altered feldspar and devitrified glass shards and at the edge of platy mica via dissolution and precipitation. The sizes of flaky clays mostly increased from the center of the fractures towards their margins (Figure 11f).
The amorphous silica appears particularly relevant in this study, forming a rigid network matrix that matches with the cohesive behavior of rocks observed along the imaged vertical wall (Figure 12a). This matrix was fairly porous and voids were commonly nearly empty. However, some voids could host euhedral alunite, opal spheres, pyramidal quartz, and sulfide grains (Figure 12b,c). The alunite can also fill voids in association with the clays developed along borders of the voids at the expense of the matrix (Figure 12d). In thin section, it is possible to observe the alunite abundance particularly in some veins, where it is often the unique mineral species, and the dense packing that those grains produce (Figure 12b,e). Based on EDS data, the amorphous matrix composition is mostly pure hydrous silica, although Al impurities could be also detected. This hydrous silica must be the residue left by the intense leaching operating by the hydrothermal fluids on the local pyroclastic deposits. In fact, the original rocks were made of a dominant amorphous glass matrix rich in SiO2 (59–61 wt%) and Al2O3 (18–19 wt%) with minor alkalies (ca. 8–9 wt% K2O and 4–5 wt% Na2O), with other elements being less than a few percent (e.g., refs. [34,68]). Rare glass shards were found (Figure 12b), but, due to the virtual absence of alkalies likely caused by the extensive hydrothermal alteration, they could not be used to ascertain the original deposits. The relatively immobile CaO and MgO contents in these shards are compatible with the Paleo–Astroni series that, in agreement with other studies [36,44], stratigraphically lies below the Agnano Monte Spina, Solfatara, Astroni that outcrops elsewhere at Pisciarelli.

5. Discussion

The Pisciarelli area is representative of a solfataric extreme environment with recent geochemical, seismological, and morphological changes linked to a relatively increased hydrothermal dynamic (e.g., [5,6,7,18,69,70,71]). It shows an intense hydrothermal alteration due to aggressive sulfurous water vapor emissions in form of boiling pools and diffuse effluxes and localized vents with temperatures ranging from 63.9 to 94.3 °C, except for the ca. 115 °C of the main geyser-like fumarole.
On the basis of previous studies (ref. [6] and references therein), the mineral neogenesis, which variably develops on sub-millimeter to decimeter to meter scales (in relation to the outgassing dynamics, runoff, weather conditions, structural lineament, fractures, fault, and outcropping substrate), seems to be locally comparable and recurrent since 2013. This sort of steadiness is an important basis for studies (as also for the present research) aimed at understanding the role of weathering on the physico-mechanical properties of rocks, i.e., weakening and/or strengthening.
Here, the investigated slope can be considered paradigmatic of the mineral assemblage distribution variation moving away from a main fumarolic venting fracture at 95 °C (Figure 1b) and was used to unravel the role of the hydrothermal alteration on the volcanic deposits failure and rocky slope stability as reported at other active volcanoes [20,25,72,73,74].
The results of mineralogical, geochemical, geomorphological, and structural investigations are integrated in the thematic map of Figure 13. Therefore, this map allows us to appreciate the relations among the distribution of mineral species, original tephra, structure lineaments, and volume changes (CUTFILL 2014–2021).
The map shows that the secondary alunite and amorphous silica are ubiquitous, whereas the alunogen, native sulfur, alum(K), sulfides, and remaining soluble sulfates are concentrated in some specific zones, i.e., essentially at the L1 fault structure where fumarolic vapors have gained their preferred ascent pathway and are more strongly venting. This distribution of the hydrothermal minerals cannot depend on the original composition of tephra, which is very similar in both the bulk rock and glass chemistry (Figure 14). In addition, the small chemical differences among the outcropping protolith deposits do not justify the variation detected in the secondary assemblage and this eliminates an important parameter allowing to better evaluate the others.
In regards to alunite, its high spread is very common in acidic solfataric environments [75,76], although the phase would reflect the potassium enrichment deriving from feldspar-rich rock substrate on which alunite has developed under the H2S-rich fumarolic vapors above the boiling zone (refs. [2,34] and references therein). Notably, the limited occurrence of illites and illite/montmorillonite interlayers [41,42] suggests that intermediate argillic alteration zones [77] can be present at Pisciarelli, but are not fully compatible with the steam-heated settings. Moreover, the abundance, and particularly the local prevalence, of silica-rich phases suggests an extreme leaching of rocks by circulating fluids that has left onsite only the refractory (namely residual) element.
As a matter of fact, the neogenesis coincides with geomechanic characteristics of rocks and this could have implications on slope stability.
The amorphous silica skeleton, which has remained in place of the original trachytic glass matrix (Figure 12), can explain the hard compactness and the rough volume stability of the investigated slope (see Figure 6 and Figure 8). The secondary mineralogical assemblages that locally develop and fill voids, i.e., crystalline silica and alunite (Figure 11f), can further harden the rocks. Most of the rocks are classified as blocky to very blocky (the pink-to-yellowish zone in Figure 13). Rocks (Paleo–Astroni tephra) outcropping on the left (west) of the L1 fault are particularly fractured, showing a network of fractures spaced 10–30 cm on average that can determine rock-fall and justify the (although limited) volume change. Unlike Solfatara deposits (on the right, eastern fault side), that are similarly made of alunite and amorphous silica but least fractured, the investigated Paleo–Astroni deposits appear harder and more rigid, almost entirely preserving their stratification likely as a consequence of the leaching-induced opalization. However, we infer that their highest fracturation degree and rockfall features were produced by the dynamics of the nearby pool (i.e., waves, boiling, tremors), although the tectonics are mainly responsible for the increment of fractures and then disaggregation towards the L1 fault.
Native sulfur precipitates as sublimates directly from the hottest vapors innermost into the fault, whilst alunogen, alum (K), and remaining soluble sulfates form efflorescences along the exposed fragile fault wall planes. Based on observations at the macroscopic scale (Figure 2), these efflorescences are the drying products of fluids feebly permeating the rock voids. In fact, alunogen crystallizes under sulfurous vapor under acidic and dry conditions [13,16,80]; moreover, acid pH and dehydration and decomposition of alunite promote alum-(K) mineralization [16,63,81,82]. In particular, white alunogen crystals emerge from the rock pores along the fault scarp in two morphologies: common fibrous (L1 site, Figure 1b) and, secondly, thin, platy habits (Figure 10), both often corroded [6]. Its crystallization relies on the abundance of Al3+ in the thermal waters that has formed in the geothermal reservoir [41,68], but its corrosion suggests instability following crystallization consequent to the lack of fluids permanence. Alunogen abundantly associates with alunite and sometimes sulfur on the right (east) fault plane, i.e., mostly in Solfatara tephra, where they produce a very brittle encrustation and a weakening of the outermost portions. On the left (west) plane inner the L1 fault (Paleo–Astroni deposits), sulfur associates with the other hydrated sulfates and sulfide (mostly baryte, including crypto-crystalline micro-pyrite) and all together seems to be an integrated part of the rock, filling and replacing the rock voids and the matrix (Figure 11), possibly with a hardening effect that in turn allows the fracturing. Moreover, sulfur, detected by XRPD, but not visible at BSEM, can justify the yellow ductile patina observed on the Solfatara deposits.
Overall, we can suggest that the fluid permeation process leading to crystallization of sulfur and soluble sulfates, the instability of neogenesis due to changes in temperatures and vapor chemistry and percentage, and the fragility of these same sulfur-efflorescence in the L1 vent make the outermost part of the rocks vulnerable, with an increased effect on the rock weakness, and contribute to the deterioration of the rock fault planes (Figure 6 and Figure 7). At the L1 fragile fault plane, since the temperature of <60 °C, algal mats can develop and likely act on the fault rocks favoring the disaggregation and the gouge, as recorded by geomorphological investigations; the occurrence of low temperature native sulfur crystals on these mats is emblematic, which acts to concentrate this native element in specific sites.
From the morphological change detection analysis, we observed a consistent loss of rock material mainly from the Paleo–Astroni deposits and in correspondence along the L1 fault. A volume variation of ca. −0.97 m3 could be therefore attributed to the co-operation of a greater fracturing of the rocks (area that is within the blocky/very blocky of the rock-mass classification inner the fault), the superficial circulation of fluids through the fracturing system, and the neogenesis crystallization-to-breakdown (and vice versa). These phenomena enhance the disaggregation of fault rocks affected by fumarolic activity at the L1 site (Figure 6, Figure 7 and Figure 13). The precursor conditions for these phenomena are well displayed in Figure 15 (net loss area in Paleo–Astroni deposits, Figure 1c). The panel shows a neogenesis set in a narrow (decimetric in size) vertical arrangement within the wall rocks. Here, fluids are making their way to the surface through the Paleo–Astroni deposits, creating a persistent uprising channel (perhaps through a pre-existing fault) venting a new fluid ascent path. The composition of this neogenesis (alunite, mascagnite, alunogen, alum (K), and amorphous) allows us to suggest that it is linked with sulfurous fluids coming from the nearby mud pool, likely as a consequence of SO2 setting disproportionation [75]. These fluids impregnate the rock substratum and supply elements to the formation of a variety of alkali sulfates and crypto-pyrite. We detected a high abundance of those phases around the pool as desiccation during the summer season. Vapor emission outflow and the conditions of hydrothermal steam stagnation in fact are dependent on meteoric weather with implications on atmospheric pressure and wind conditions.
Rarely, other efflorescent phases, for example, Al and Mg sulfates (pickeringite), have been identified near the Pisciarelli L1 fault as crust-like aggregates, deriving from oxidation of sulfides (mainly pyrite) and arid conditions.
As a whole, our study supports the evidence that intense fumarolic discharge, recognized at the Pisciarelli slope, and the consequent widespread hydrothermal neogenesis produce slope instability in accordance with previous studies worldwide [20,22,74,83,84,85]. Extensive fumarole activity and hydrothermal alteration on the unstable flanks of Casita volcano (Nicaragua) was documented by van Wyk de Vries et al. (2000) [86], a volcano that experienced a partial flank collapse in 1998 with associated debris avalanches that killed about 2500 people [86]. Similarly, Reid et al. (2001) [72] recognized, using a geotechnical method of 3D column limit-equilibrium, an intensive alteration on the flanks and summit of Mt Rainer, attributing the influence of alteration to the volcano slope’s stability. Here, the main Pisciarelli L1 fault showed fall rock susceptibility and volume changes with a net loss of ca. −3 m3 (Table 2) in a 7-year time interval (2014–2021). The volume variations are mainly associated with the gas venting and the consequent deterioration by hydrothermal alterations (Figure 13). At the foot of the fault, indeed, blocks have collapsed and accumulated (1.4 m3, in Table 2).

6. Conclusions

The main focus of the present study was to investigate the role of the hydrothermal alteration on the volcanic edifice steadiness and rocky slope stability. To this purpose, we selected a well exposed faulted slope in the area of Pisciarelli in the Campi Flegrei volcano, Italy, where the hydrothermal dynamics have increased since 2006 and the acidic sulfate hydrothermal alteration has been monitored since 2012 (e.g., refs. [2,3,6,9]).
The Terrestrial Laser Scan plus Structure for Motion survey integrated with mineralogical and geochemical analyses allowed us to identify the relations between the distribution of mineral species, original tephra, structure lineaments, and volume changes. The neogenesis does not depend on the original deposits. At the studied site, tectonic settings and fault venting dynamics influence the efficient drainage of sulfureous fluids, the compartmentalization of supergene alteration, and the fragility vs. rigid slope behavior. In particular, permeability conditions and flow energy are main factors to be considered with persistent fluid ascent channelings that require localized lowered permeability conditions and continuous flows. Two extreme examples can be made: (1) locally and slightly lowered permeability conditions where feeble flows interact and modify the wall rocks and (2) high-permeability zones and energic flow that erode the wall rocks. We can conclude that:
(a)
a hydrothermal steam-heated environment has preferentially developed along tectonic discontinuities favoring the hottest and acidic fluid circulation;
(b)
the fault and gas venting dynamics have led to the formation of disaggregated gouge zones characterized by higher possibility of fluids permeation and crystallization of soluble sulfate minerals, native sulfur and sulfides, both co-operating in a looped disaggregation process;
(c)
the hydrothermal alteration determines a leaching of deposits so extreme so as to leave a rigid silica amorphous matrix that has hardened the slope around the fault rocks. The rock fall and/or erosion is particularly favored in the weakened fault zones, where deeper hydrothermal facies below the water table can be exposed and supergene oxidation and erosion can deepen [20,22,25,72,73,74,83,84,85,86].
(d)
the association of native S, pyrite with sulfates as alunite is indicative of timely redox state and temperature variations, as well as fluid availability, with enhanced changes observed in dry vs. wet seasons, favoring oxidizing conditions [6].
The investigated slope lost up to about 4 m3 of deposits between 2014 and 2021, most of which (Figure 7) from the L1 fault planes (about 3 m3). The absence of a comparable volume gain at the foot slope suggests that the loss can be due to (natural and/or anthropic) drainage, although we cannot exclude the role of the extensional dynamics induced by the ground uplift and local seismicity [12].
In conclusion, the Pisciarelli site appears suitable for a better understanding of the spatio-temporal evolution of hydrothermal alteration and the structural setting, and how they can influence volcano stability and its geomorphological evolution. Based on the comparable chemistry of the different original deposits and the good exposition of the slope, this is a special context to investigate the mechanical response of a rock to a differential stress in relation with neogenesis, hydrothermal alteration facies and processes, hydrothermal dynamics, and tectonics [87]. In other words, the Pisciarelli site could be considered a case of study for investigating the complex mineral alteration and setting evolution through a multidisciplinary approach that will help improving the assessment and mitigation of volcanic hazards at active volcanic hydrothermal systems worldwide.

Author Contributions

Conceptualization, methodology, software, validation, T.C., E.M., A.M.; formal analysis, T.C., E.M., A.M., M.P.; data curation, T.C., E.M., A.M.; writing—original draft preparation, T.C., A.M., E.M., G.B.; writing—review and editing, T.C., E.M., A.M., M.P., G.B.; funding acquisition, M.P. All authors have read and agreed to the published version of the manuscript.

Funding

This research was funded by the Istituto Nazionale di Geofisica e Vulcanologia, Italy, through the grant to M.P.: Ricerca Libera 2019 9999.534 RL2019.

Acknowledgments

EPOS Research Infrastructure through the contribution of the Italian Ministry of University and Research (MUR) provided financially supports to Istituto the Nazionale di Geofisica e Vulcanologia electron microscope and XRD laboratories at the Osservatorio Vesuviano. The authors are grateful to Claudia Troise, Giuseppe De Natale and Renato Somma of the National Institute of Geophysics and Volcanology-Vesuvius Observatory (INGV-OV) for allowing the use of Terrestrial Laser Scanner data. Teacher Lele Di Maso, Caldicott School (Farnham Royal, UK) for his help with English language. Finally, we thank three anonymous reviewers for useful comments and suggestions on the manuscript.

Conflicts of Interest

The authors declare no conflict of interest.

References

  1. Rosi, M.; Sbrana, A. Phlegrean Fields. Quad. Ric. Sci. 1987, 9, 175. [Google Scholar]
  2. Piochi, M.; Mormone, A.; Balassone, G.; Strauss, H.; Troise, C.; Natale, G.D. Native Sulfur, Sulfates and Sulfides from the Active Campi Flegrei Volcano (Southern Italy): Genetic Environments and Degassing Dynamics Revealed by Mineralogy and Isotope Geochemistry. J. Volcanol. Geotherm. Res. 2015, 304, 180–193. [Google Scholar] [CrossRef]
  3. Chiodini, G.; Caliro, S.; Cardellini, C.; Granieri, D.; Avino, R.; Baldini, A.; Donnini, M.; Minopoli, C. Long-Term Variations of the Campi Flegrei, Italy, Volcanic System as Revealed by the Monitoring of Hydrothermal Activity. J. Geophys. Res. Solid Earth 2010, 115, B03205. [Google Scholar] [CrossRef] [Green Version]
  4. Chiodini, G.; Avino, R.; Caliro, S.; Minopoli, C. Temperature and Pressure Gas Geoindicators at the Solfatara Fumaroles (Campi Flegrei). Ann. Geophys. 2011, 54, 151–160. [Google Scholar] [CrossRef]
  5. Chiodini, G.; Paonita, A.; Aiuppa, A.; Costa, A.; Caliro, S.; De Martino, P.; Acocella, V.; Vandemeulebrouck, J. Magmas near the Critical Degassing Pressure Drive Volcanic Unrest towards a Critical State. Nat. Commun. 2016, 7, 13712. [Google Scholar] [CrossRef] [Green Version]
  6. Piochi, M.; Mormone, A.; Strauss, H.; Balassone, G. The Acid Sulfate Zone and the Mineral Alteration Styles of the Roman Puteoli (Neapolitan Area, Italy): Clues on Fluid Fracturing Progression at the Campi Flegrei Volcano. Solid Earth 2019, 10, 1809–1831. [Google Scholar] [CrossRef] [Green Version]
  7. Tamburello, G.; Caliro, S.; Chiodini, G.; Martino, P.D.; Avino, R.; Minopoli, C.; Carandente, A.; Rouwet, D.; Aiuppa, A.; Costa, A.; et al. Escalating CO2 Degassing at the Pisciarelli Fumarolic System, and Implications for the Ongoing Campi Flegrei Unrest. J. Volcanol. Geotherm. Res. 2019, 384, 151–157. [Google Scholar] [CrossRef]
  8. Chiodini, G.; Caliro, S.; Martino, P.D.; Avino, R.; Gherardi, F. Early Signals of New Volcanic Unrest at Campi Flegrei Caldera? Insights from Geochemical Data and Physical Simulations. Geology 2012, 40, 943–946. [Google Scholar] [CrossRef]
  9. Cardellini, C.; Chiodini, G.; Frondini, F.; Avino, R.; Bagnato, E.; Caliro, S.; Lelli, M.; Rosiello, A. Monitoring Diffuse Volcanic Degassing during Volcanic Unrests: The Case of Campi Flegrei (Italy). Sci. Rep. 2017, 7, 12815. [Google Scholar] [CrossRef] [Green Version]
  10. Bellucci Sessa, E.; Castellano, M.; Ricciolino, P. GIS Applications in Volcano Monitoring: The Study of Seismic Swarms at the Campi Flegrei Volcanic Complex, Italy. Adv. Geosci. 2021, 52, 131–144. [Google Scholar] [CrossRef]
  11. Gaudio, C.D.; Aquino, I.; Ricciardi, G.P.; Ricco, C.; Scandone, R. Unrest Episodes at Campi Flegrei: A Reconstruction of Vertical Ground Movements during 1905–2009. J. Volcanol. Geotherm. Res. 2010, 195, 48–56. [Google Scholar] [CrossRef]
  12. Ricco, C.; Petrosino, S.; Aquino, I.; Del Gaudio, C.; Falanga, M. Some Investigations on a Possible Relationship between Ground Deformation and Seismic Activity at Campi Flegrei and Ischia Volcanic Areas (Southern Italy). Geosciences 2019, 9, 222. [Google Scholar] [CrossRef] [Green Version]
  13. Browne, P.R.L. Hydrothermal Alteration in Active Geothermal Fields. Ann. Rev. Earth Planet. Sci 1978, 6, 229–250. [Google Scholar] [CrossRef]
  14. Chalres, R.W.; Buden, R.J.V.; Goff, F. An Interpretation of the Alteration Assemblages at Sulphur Springs, Valles Caldera, New Mexico. J. Geophys. Res. Solid Earth 1986, 91, 1887–1898. [Google Scholar] [CrossRef]
  15. Sillitoe, R.H.; Hedenquist, J.W. Linkages between Volcanotectonic Settings, Ore-Fluid Compositions, and Epithermal Precious Metal Deposits. Volcan. Geotherm. Ore-Form. Fluids 2005, 10, 315–343. [Google Scholar] [CrossRef]
  16. Zimbelman, D.R.; Rye, R.O.; Breit, G.N. Origin of Secondary Sulfate Minerals on Active Andesitic Stratovolcanoes. Chem. Geol. 2005, 215, 37–60. [Google Scholar] [CrossRef] [Green Version]
  17. Hicks, W.S.; Bowman, G.M.; Fitzpatrick, R.W. Effect of Season and Landscape Position on the Aluminium Geochemistry of Tropical Acid Sulfate Soil Leachate. Soil Res. 2009, 47, 137–153. [Google Scholar] [CrossRef]
  18. Fedele, A.; Somma, R.; Troise, C.; Holmberg, K.; Natale, G.D.; Matano, F. Time-Lapse Landform Monitoring in the Pisciarelli (Campi Flegrei-Italy) Fumarole Field Using UAV Photogrammetry. Remote Sens. 2020, 13, 118. [Google Scholar] [CrossRef]
  19. Finn, C.A.; Sisson, T.W.; Deszcz-Pan, M. Aerogeophysical Measurements Reveal Collapseprone Hydrothermally Altered Zones At Mount Rainier Volcano, Washington. In Proceedings of the 14th EEGS Symposium on the Application of Geophysics to Engineering and Environmental Problems. European Association of Geoscientists & Engineers, Denver, CO, USA, 4–7 May 2001; Volume 409. [Google Scholar] [CrossRef]
  20. Heap, M.J.; Farquharson, J.I.; Baud, P.; Lavallée, Y.; Reuschlé, T. Fracture and Compaction of Andesite in a Volcanic Edifice. Bull. Volcanol. 2015, 77, 55. [Google Scholar] [CrossRef] [Green Version]
  21. John, D.A.; Sisson, T.W.; Breit, G.N.; Volcanology, R.R.-J. Characteristics, Extent and Origin of Hydrothermal Alteration at Mount Rainier Volcano, Cascades Arc, USA: Implications for Debris-Flow Hazards and Mineral Deposits; Elsevier: Amsterdam, The Netherlands, 2008. [Google Scholar]
  22. López, D.L.; Williams, S.N. Catastrophic Volcanic Collapse: Relation to Hydrothermal Processes. Science 1993, 260, 1794–1796. [Google Scholar] [CrossRef]
  23. Norini, G.; Bustos, E.; Arnosio, M.; Baez, W.; Zuluaga, M.C.; Roverato, M. Unusual Volcanic Instability and Sector Collapse Configuration at Chimpa Volcano, Central Andes. J. Volcanol. Geotherm. Res. 2020, 393, 106807. [Google Scholar] [CrossRef]
  24. Schaefer, L.N.; Kennedy, B.M.; Villeneuve, M.C.; Cook, S.C.W.; Jolly, A.D.; Keys, H.J.R.; Leonard, G.S. Stability Assessment of the Crater Lake/Te Wai-ā-Moe Overflow Channel at Mt. Ruapehu (New Zealand), and Implications for Volcanic Lake Break-out Triggers. J. Volcanol. Geotherm. Res. 2018, 358, 31–44. [Google Scholar] [CrossRef]
  25. del Potro, R.; Hürlimann, M. The Decrease in the Shear Strength of Volcanic Materials with Argillic Hydrothermal Alteration, Insights from the Summit Region of Teide Stratovolcano, Tenerife. Eng. Geol. 2009, 104, 135–143. [Google Scholar] [CrossRef]
  26. Pola, A.; Crosta, G.B.; Fusi, N.; Castellanza, R. General Characterization of the Mechanical Behaviour of Different Volcanic Rocks with Respect to Alteration. Eng. Geol. 2014, 169, 1–13. [Google Scholar] [CrossRef]
  27. Kereszturi, G.; Schaefer, L.N.; Miller, C.; Mead, S. Hydrothermal Alteration on Composite Volcanoes: Mineralogy, Hyperspectral Imaging, and Aeromagnetic Study of Mt Ruapehu, New Zealand. Geochem. Geophys. Geosyst. 2020, 21, e2020GC009270. [Google Scholar] [CrossRef]
  28. Capra, L. Abrupt Climatic Changes as Triggering Mechanisms of Massive Volcanic Collapses. J. Volcanol. Geotherm. Res. 2006, 155, 329–333. [Google Scholar] [CrossRef]
  29. Procter, J.N.; Cronin, S.J.; Zernack, A.V.; Lube, G.; Stewart, R.B.; Nemeth, K.; Keys, H. Debris Flow Evolution and the Activation of an Explosive Hydrothermal System; Te Maari, Tongariro, New Zealand. J. Volcanol. Geotherm. Res. 2014, 286, 303–316. [Google Scholar] [CrossRef]
  30. Mayer, K.; Scheu, B.; Yilmaz, T.I.; Montanaro, C.; Gilg, H.A.; Rott, S.; Joseph, E.P.; Dingwell, D.B. Phreatic Activity and Hydrothermal Alteration in the Valley of Desolation, Dominica, Lesser Antilles. Bull. Volcanol. 2017, 79, 82. [Google Scholar] [CrossRef]
  31. Pardo, N.; Cronin, S.J.; Németh, K.; Brenna, M.; Schipper, C.I.; Breard, E.; White, J.D.L.; Procter, J.; Stewart, B.; Agustín-Flores, J.; et al. Perils in Distinguishing Phreatic from Phreatomagmatic Ash; Insights into the Eruption Mechanisms of the 6 August 2012 Mt. Tongariro Eruption, New Zealand. J. Volcanol. Geotherm. Res. 2014, 286, 397–414. [Google Scholar] [CrossRef]
  32. Orsi, G. Volcanic and Deformation History of the Campi Flegrei Volcanic Field, Italy. In Campi Flegrei: A Restless Caldera in a Densely Populated Area; Orsi, G., D’Antonio, M., Civetta, L., Eds.; Springer: Berlin/Heidelberg, Germany, 2022; pp. 1–53. ISBN 978-3-642-37060-1. [Google Scholar]
  33. Piochi, M.; Mastrolorenzo, G.; Pappalardo, L. Magma Ascent and Eruptive Processes from Textural and Compositional Features of Monte Nuovo Pyroclastic Products, Campi Flegrei, Italy. Bull. Volcanol. 2005, 67, 663–678. [Google Scholar] [CrossRef]
  34. Piochi, M.; Kilburn, C.R.J.; Vito, M.A.D.; Mormone, A.; Tramelli, A.; Troise, C.; Natale, G.D. The Volcanic and Geothermally Active Campi Flegrei Caldera: An Integrated Multidisciplinary Image of Its Buried Structure. Int. J. Earth Sci. 2014, 103, 401–421. [Google Scholar] [CrossRef]
  35. Deino, A.L.; Orsi, G.; De Vita, S.; Piochi, M. The Age of the Neapolitan Yellow Tuff Caldera-Forming Eruption (Campi Flegrei Caldera—Italy) Assessed by 40Ar/39Ar Dating Method. J. Volcanol. Geotherm. Res. 2004, 133, 157–170. [Google Scholar] [CrossRef]
  36. Di Vito, M.A.; Isaia, R.; Orsi, G.; Southon, J.; De Vita, S.; D’Antonio, M.; Pappalardo, L.; Piochi, M. Volcanism and Deformation since 12,000 Years at the Campi Flegrei Caldera (Italy). J. Volcanol. Geotherm. Res. 1999, 91, 221–246. [Google Scholar] [CrossRef]
  37. Valentino, G.M.; Cortecci, G.; Franco, E.; Stanzione, D. Chemical and Isotopic Compositions of Minerals and Waters from the Campi Flegrei Volcanic System, Naples, Italy. J. Volcanol. Geotherm. Res. 1999, 91, 329–344. [Google Scholar] [CrossRef]
  38. Mayer, K.; Scheu, B.; Montanaro, C.; Yilmaz, T.I.; Isaia, R.; Aßbichler, D.; Dingwell, D.B. Hydrothermal Alteration of Surficial Rocks at Solfatara (Campi Flegrei): Petrophysical Properties and Implications for Phreatic Eruption Processes. J. Volcanol. Geotherm. Res. 2016, 320, 128–143. [Google Scholar] [CrossRef] [Green Version]
  39. Allard, P.; Maiorani, A.; Tedesco, D.; Cortecci, G.; Turi, B. Isotopic Study of the Origin of Sulfur and Carbon in Solfatara Fumaroles, Campi Flegrei Caldera. J. Volcanol. Geotherm. Res. 1991, 48, 139–159. [Google Scholar] [CrossRef]
  40. Chiodini, G.; Frondini, F.; Cardellini, C.; Granieri, D.; Marini, L.; Ventura, G. CO2 Degassing and Energy Release at Solfatara Volcano, Campi Flegrei, Italy. J. Geophys. Res. Solid Earth 2001, 106, 16213–16221. [Google Scholar] [CrossRef]
  41. Valentino, G.M.; Stanzione, D. Geochemical Monitoring of the Thermal Waters of the Phlegraean Fields. J. Volcanol. Geotherm. Res. 2004, 133, 261–289. [Google Scholar] [CrossRef]
  42. Valentino, G.M.; Stanzione, D. Source Processes of the Thermal Waters from the Phlegraean Fields (Naples, Italy) by Means of the Study of Selected Minor and Trace Elements Distribution. Chem. Geol. 2003, 194, 245–274. [Google Scholar] [CrossRef]
  43. Westoby, M.J.; Brasington, J.; Glasser, N.F.; Hambrey, M.J.; Reynolds, J.M. ‘Structure-from-Motion’ Photogrammetry: A Low-Cost, Effective Tool for Geoscience Applications. Geomorphology 2012, 179, 300–314. [Google Scholar] [CrossRef] [Green Version]
  44. Petrosino, S.; Damiano, N.; Cusano, P.; Di Vito, M.A.; de Vita, S.; Del Pezzo, E. Subsurface Structure of the Solfatara Volcano (Campi Flegrei Caldera, Italy) as Deduced from Joint Seismic-Noise Array, Volcanological and Morphostructural Analysis. Geochem. Geophys. Geosyst. 2012, 13, Q07006. [Google Scholar] [CrossRef] [Green Version]
  45. Isaia, R.; Di Giuseppe, M.G.; Natale, J.; Tramparulo, F.D.; Troiano, A.; Vitale, S. Volcano-Tectonic Setting of the Pisciarelli Fumarole Field, Campi Flegrei Caldera, Southern Italy: Insights Into Fluid Circulation Patterns and Hazard Scenarios. Tectonics 2021, 40, e2020TC006227. [Google Scholar] [CrossRef]
  46. Isaia, R.; Vitale, S.; Giuseppe, M.G.D.; Iannuzzi, E.; Tramparulo, F.D.A.; Troiano, A. Stratigraphy, Structure, and Volcano-Tectonic Evolution of Solfatara Maar-Diatreme (Campi Flegrei, Italy). GSA Bull. 2015, 127, 1485–1504. [Google Scholar] [CrossRef] [Green Version]
  47. Aulitto, M.; Gallo, G.; Puopolo, R.; Mormone, A.; Limauro, D.; Contursi, P.; Piochi, M.; Bartolucci, S.; Fiorentino, G. Genomic Insight of Alicyclobacillus Mali FL18 Isolated From an Arsenic-Rich Hot Spring. Front. Microbiol. 2021, 12, 669. [Google Scholar] [CrossRef]
  48. Pinto, G.; Ciniglia, C.; Cascone, C.; Pollio, A. Species Composition of Cyanidiales Assemblages in Pisciarelli (Campi Flegrei, Italy) and Description of Galdieria Phlegrea SP. NOV. In Algae and Cyanobacteria in Extreme Environments; Seckbach, J., Ed.; Cellular Origin, Life in Extreme Habitats and Astrobiology; Springer: Dordrecht, The Netherlands, 2007; pp. 487–502. ISBN 978-1-4020-6112-7. [Google Scholar]
  49. Bellucci Sessa, E.; Borriello, G.; Cirillo, F. NAPLES (moNitoring mAps of camPania voLcanoES). 2022. Available online: https://zenodo.org/communities/naples_cartografia?page=1&size=20 (accessed on 1 May 2022).
  50. Biagi, R.; Tassi, F.; Caliro, S.; Capecchiacci, F.; Venturi, S. Impact on Air Quality of Carbon and Sulfur Volatile Compounds Emitted from Hydrothermal Discharges: The Case Study of Pisciarelli (Campi Flegrei, South Italy). Chemosphere 2022, 297, 134166. [Google Scholar] [CrossRef] [PubMed]
  51. Remondino, F.; Pizzo, S.D.; Kersten, T.P.; Troisi, S. Low-Cost and Open-Source Solutions for Automated Image Orientation—A Critical Overview. In Progress in Cultural Heritage Preservation, Proceedings of the 4th International Conference, EuroMed 2012, Lemessos, Cyprus, 29 October–3 November 2012; Springer: Berlin/Heidelberg, Germany, 2012; Volume 7616, pp. 40–54. [Google Scholar] [CrossRef]
  52. Lafarge, F.; Mallet, C. Creating Large-Scale City Models from 3D-Point Clouds: A Robust Approach with Hybrid Representation. Int. J. Comput. Vis. 2012, 99, 69–85. [Google Scholar] [CrossRef]
  53. Haala, N.; Cramer, M.; Rothermel, M. Quality of 3D Point Clouds from Highly Overlapping UAV Imagery Semantic Segmentation of Urban Scenes View Project Quality of 3d Point Clouds from Highly Overlapping Uav Imagery. Int. Arch. Photogramm. Remote Sens. Spat. Inf. Sci. 2013, XL-1/W2, 183–188. [Google Scholar] [CrossRef] [Green Version]
  54. Agisoft Metashape User Manual—Professional Edition, Version 1.7. Available online: https://www.agisoft.com/pdf/metashape-pro_1_7_en.pdf (accessed on 1 April 2022).
  55. Pesci, A.; Teza, G.; Kastelic, V.; Carafa, M.M.C. Resolution and Precision of Fast Long-Range Terrestrial Photogrammetric Surveying Aimed at Detecting Slope Changes. J. Surv. Eng. 2020, 146, 04020017. [Google Scholar] [CrossRef]
  56. James, M.R.; Robson, S.; d’Oleire-Oltmanns, S.; Niethammer, U. Optimising UAV Topographic Surveys Processed with Structure-from-Motion: Ground Control Quality, Quantity and Bundle Adjustment. Geomorphology 2017, 280, 51–66. [Google Scholar] [CrossRef] [Green Version]
  57. Abellán, A.; Oppikofer, T.; Jaboyedoff, M.; Rosser, N.J.; Lim, M.; Lato, M.J. Terrestrial Laser Scanning of Rock Slope Instabilities. Earth Surf. Processes Landf. 2014, 39, 80–97. [Google Scholar] [CrossRef]
  58. Somma, R.; Caputo, T.; Carlino, S.; Troise, C.; Natale, G.D.; Matano, F.; Esposito, G.; Caccavale, M.; Iuliano, S.; Mazzola, S.; et al. Application of Laser Scanning for Monitoring Coastal Cliff Instability in the Pozzuoli Bay, Coroglio Site, Posillipo Hill, Naples. In Engineering Geology for Society and Territory—Volume 5 Urban Geology, Sustainable Planning and Landscape Exploitation; Springer: Cham, Switzerland, 2015; pp. 687–690. [Google Scholar] [CrossRef]
  59. Matano, F.; Pignalosa, A.; Marino, E.; Esposito, G.; Caccavale, M.; Caputo, T.; Sacchi, M.; Somma, R.; Troise, C.; Natale, G.D. Laser Scanning Application for Geostructural Analysis of Tuffaceous Coastal Cliffs: The Case of Punta Epitaffio, Pozzuoli Bay, Italy. Eur. J. Remote Sens. 2015, 48, 615–637. [Google Scholar] [CrossRef] [Green Version]
  60. Caputo, T.; Marino, E.; Matano, F.; Somma, R.; Troise, C.; Natale, G.D. Terrestrial Laser Scanning (TLS) Data for the Analysis of Coastal Tuff Cliff Retreat: Application to Coroglio Cliff, Naples, Italy. Ann. Geophys. 2018, 61, SE110. [Google Scholar] [CrossRef]
  61. Lague, D.; Brodu, N.; Leroux, J. Accurate 3D Comparison of Complex Topography with Terrestrial Laser Scanner: Application to the Rangitikei Canyon (N-Z). ISPRS J. Photogramm. Remote Sens. 2013, 82, 10–26. [Google Scholar] [CrossRef] [Green Version]
  62. Girardeau-Montaut, D. CloudCompare Version 2.6.1 User Manual. 2015. Available online: http://www.cloudcompare.org/doc/qCC/CloudCompare%20v2.6.1%20-%20User%20manual.pdf (accessed on 20 February 2022).
  63. Photos-Jones, E.; Christidis, G.E.; Piochi, M.; Keane, C.; Mormone, A.; Balassone, G.; Perdikatsis, V.; Leanord, A. Testing Greco-Roman Medicinal Minerals: The Case of Solfataric Alum. J. Archaeol. Sci. Rep. 2016, 10, 82–95. [Google Scholar] [CrossRef] [Green Version]
  64. GIS Mapping Software, Location Intelligence & Spatial Analytics|Esri. Available online: https://www.esri.com/en-us/home (accessed on 25 May 2022).
  65. Cai, M.; Kaiser, P.K.; Tasaka, Y.; Maejima, T.; Morioka, H.; Minami, M. Generalized Crack Initiation and Crack Damage Stress Thresholds of Brittle Rock Masses near Underground Excavations. Int. J. Rock Mech. Min. Sci. 2004, 41, 833–847. [Google Scholar] [CrossRef]
  66. Stoiber, R.E.; Rose, W.I. Fumarole Incrustations at Active Central American Volcanoes. Geochim. Cosmochim. Acta 1974, 38, 495–516. [Google Scholar] [CrossRef]
  67. Rouwet, D.; Tamburello, G.; Ricci, T.; Sciarra, A.; Capecchiacci, F.; Caliro, S. CO2 and H2S Degassing at Fangaia Mud Pool, Solfatara, Campi Flegrei (Italy): Origin and Dynamics of the Pool Basin. Minerals 2020, 10, 1051. [Google Scholar] [CrossRef]
  68. Pignatelli, A.; Piochi, M. Machine Learning Applied to Rock Geochemistry for Predictive Outcomes: The Neapolitan Volcanic History Case. J. Volcanol. Geotherm. Res. 2021, 415, 107254. [Google Scholar] [CrossRef]
  69. Giudicepietro, F.; Chiodini, G.; Avino, R.; Brandi, G.; Caliro, S.; De Cesare, W.; Galluzzo, D.; Esposito, A.; La Rocca, A.; Lo Bascio, D.; et al. Tracking Episodes of Seismicity and Gas Transport in Campi Flegrei Caldera Through Seismic, Geophysical, and Geochemical Measurements. Seismol. Res. Lett. 2020, 92, 965–975. [Google Scholar] [CrossRef]
  70. Caputo, T.; Cusano, P.; Petrosino, S.; Sansivero, F.; Vilardo, G. Spectral Analysis of Ground Thermal Image Temperatures: What We Are Learning at Solfatara Volcano (Italy). Adv. Geosci. 2020, 52, 55–65. [Google Scholar] [CrossRef]
  71. Cusano, P.; Caputo, T.; De Lauro, E.; Falanga, M.; Petrosino, S.; Sansivero, F.; Vilardo, G. Tracking the Endogenous Dynamics of the Solfatara Volcano (Campi Flegrei, Italy) through the Analysis of Ground Thermal Image Temperatures. Atmosphere 2021, 12, 940. [Google Scholar] [CrossRef]
  72. Reid, M.E.; Sisson, T.W.; Brien, D.L. Volcano Collapse Promoted by Hydrothermal Alteration and Edifice Shape, Mount Rainier, Washington. Geology 2001, 29, 779–782. [Google Scholar] [CrossRef] [Green Version]
  73. Ball, J.L.; Calder, E.S.; Hubbard, B.E.; Bernstein, M.L. An Assessment of Hydrothermal Alteration in the Santiaguito Lava Dome Complex, Guatemala: Implications for Dome Collapse Hazards. Bull. Volcanol. 2013, 75, 676. [Google Scholar] [CrossRef] [Green Version]
  74. Heap, M.J.; Baumann, T.S.; Rosas-Carbajal, M.; Komorowski, J.C.; Gilg, H.A.; Villeneuve, M.; Moretti, R.; Baud, P.; Carbillet, L.; Harnett, C.; et al. Alteration-Induced Volcano Instability at La Soufrière de Guadeloupe (Eastern Caribbean). J. Geophys. Res. Solid Earth 2021, 126, e2021JB022514. [Google Scholar] [CrossRef]
  75. Rye, R.O.; Bethke, P.M.; Wasserman, M.D. The Stable Isotope Geochemistry of Acid Sulfate Alteration. Econ. Geol. 1992, 87, 225–262. [Google Scholar] [CrossRef]
  76. Arribas, A.J. Characteristics of High-Sulfidation Epithermal Deposits, and Their Relation to Magmatic Fluid. Mineral. Assoc. Can. Short Course 1995, 23, 419–454. [Google Scholar]
  77. Pirajno, F.; Mao, J.; Zhang, Z.; Zhang, Z.; Chai, F. The Association of Mafic–Ultramafic Intrusions and A-Type Magmatism in the Tian Shan and Altay Orogens, NW China: Implications for Geodynamic Evolution and Potential for the Discovery of New Ore Deposits. J. Asian Earth Sci. 2008, 32, 165–183. [Google Scholar] [CrossRef]
  78. Smith, V.C.; Isaia, R.; Pearce, N.J.G. Tephrostratigraphy and Glass Compositions of Post-15 Kyr Campi Flegrei Eruptions: Implications for Eruption History and Chronostratigraphic Markers. Quat. Sci. Rev. 2011, 30, 3638–3660. [Google Scholar] [CrossRef]
  79. Forni, F.; Degruyter, W.; Bachmann, O.; De Astis, G.; Mollo, S. Long-Term Magmatic Evolution Reveals the Beginning of a New Caldera Cycle at Campi Flegrei. Sci. Adv. 2018, 4, eaat9401. [Google Scholar] [CrossRef] [Green Version]
  80. Martin, R.; Rodgers, K.A.; Browne, P.R.L. The Nature and Significance of Sulphate-Rich, Aluminous Efflorescences from the Te Kopia Geothermal Field, Taupo Volcanic Zone, New Zealand. Mineral. Mag. 1999, 63, 413–419. [Google Scholar] [CrossRef]
  81. Fink, W.L.; Horn, K.V.; Pazour, H.A. Thermal Decomposition of Alunite1. Ind. Eng. Chem. 1931, 23, 1248–1250. [Google Scholar] [CrossRef]
  82. Kristóf, J.; Frost, R.; Palmer, S.; Horváth, E.; Jakab, E. Thermoanalytical Studies of Natural Potassium, Sodium and Ammonium Alunites. J. Therm. Anal. Calorim. 2010, 100, 961–966. [Google Scholar] [CrossRef] [Green Version]
  83. Cox, M.E.; Browne, P. Hydrothermal Alteration Mineralogy as an Indicator of Hydrology at the Ngawha Geothermal Field, New Zealand. Geothermics 1998, 27, 259–270. [Google Scholar] [CrossRef]
  84. Pola, A.; Crosta, G.; Fusi, N.; Barberini, V.; Norini, G. Influence of Alteration on Physical Properties of Volcanic Rocks. Tectonophysics 2012, 566–567, 67–86. [Google Scholar] [CrossRef]
  85. Wyering, L.D.; Villeneuve, M.C.; Wallis, I.C.; Siratovich, P.A.; Kennedy, B.M.; Gravley, D.M.; Cant, J.L. Mechanical and Physical Properties of Hydrothermally Altered Rocks, Taupo Volcanic Zone, New Zealand. J. Volcanol. Geotherm. Res. 2014, 288, 76–93. [Google Scholar] [CrossRef]
  86. Van Wyk de Vries, B.; Kerle, N.; Petley, D. Sector Collapse Forming at Casita Volcano, Nicaragua. Geology 2000, 28, 167–170. [Google Scholar] [CrossRef]
  87. Wong, T.; Baud, P. The Brittle-Ductile Transition in Porous Rock: A Review. J. Struct. Geol. 2012, 44, 25–53. [Google Scholar] [CrossRef]
Figure 2. Overview of the point cloud, with RGB color, of the fault L1 object of this study. The image shows the good quality of geomatic data at the main surface and across the L1 fault (compare with Figure 1b). The orange scale bar is 5 m.
Remotesensing 14 03526 g002
Figure 3. The selected areas where the noise distribution was calculated on M3C2 distance.
Remotesensing 14 03526 g003
Figure 4. Fit distribution on morphologically stable areas: (a) the first three selected area; (b) the second three selected area, both shown in Figure 3; all stats values are in meters.
Remotesensing 14 03526 g004aRemotesensing 14 03526 g004b
Figure 5. Distances between 2014 TLS and 2021 SfM point clouds as computed by CloudCompare.
Remotesensing 14 03526 g005
Figure 6. Morphologic changes in the time span 2014–2021. Negative values (reddish to orange areas) represent loss of material; positive values (greenish areas) indicate material gain.
Remotesensing 14 03526 g006
Figure 7. Map of CUTFILL volume change in the time span 2014–2021 showing only the main areas of interest where the material has been removed or added to the surface and overlapped the main structural lineament (faults in bold red, fractures in thin red, and disturbed areas of the fault are dotted).
Remotesensing 14 03526 g007
Figure 8. Map of rock-mass classification and main structural lineament (fault and fractures in red and stratification of volcanic deposits in pink).
Remotesensing 14 03526 g008
Figure 9. Integrated map of rock-mass classification and main structural lineament and CUTFILL 2014–2021.
Remotesensing 14 03526 g009
Figure 10. Focus within the investigated L1 scarp area (a,b). Sulfur incrustation coexisting with alunite and alunogen efflorescences; (c) alunite, alunogen, and sulfur under a binocular microscope forming flower-type efflorescences. The green portions include relevant organic material that can be associated with the Galderia algae [48].
Remotesensing 14 03526 g010
Figure 11. Optical microscopy and BSEM (Backscatter Scanning Electron Microscope) images of selected samples on the left and right, respectively. (a) Sulfur incrustation (low temperature); (b) Sulfur in grain developed within the fracture scarp together with quartz and NH4 sulfates; (c) sulfur in crystals with dipyramid shapes and (d) tabular habit; (e) encrustations of alunite and alunogen; (f) alunite finely intergrown with clay, crystallizing at the expense of the glass and ashy matrix; (g) diffraction pattern of common L1 encrustation; (h) Pickeringite aggregates.
Remotesensing 14 03526 g011
Figure 12. BSEM images and EDS data on a representative thin section showing the textural and mineralogical features of the cohesive whitish Paleo–Astroni deposits on the left of the L1 fault in Figure 1. (a) Strongly interconnected skeletal structure made of amorphous silica composition forming the matrix of faulted deposits, with scarce opal, barite, oxide grains set within the matrix voids. (b) Alunite grains that tend to agglomerate locally within the voids of the amorphous skeleton; (c) The reticular texture of the amorphous skeleton and the relations with the alunite and quartz grains and rare glass shards; (d) the voids of the amorphous matrix showing the border altered by hair-like clays and filled by alunites; (e) EDS maps showing the distribution of Si, Al, S, and K in the investigated area of image c allowing a further inspection of textural relations between various mineral and amorphous phases.
Remotesensing 14 03526 g012
Figure 13. Integrated thematic map showing the distribution of the main hydrothermal mineralogical alteration, structure lineaments, and volume changes (CUTFILL 2014–2021). The hydrothermal mineralogical alteration area was depicted considering abundance (namely relevance) of recovered minerals.
Remotesensing 14 03526 g013
Figure 14. Content of hydrothermal neogenesis-related elements in tephra outcropping along the investigated slope according to the stratigraphic position. Bars are maximum standard deviation values; where lacking the error is within the symbol size. Glass matrices overlap to the shown bulk rock compositions, except for MgO and CaO that can be half of the bulk rock; K2O and N2O are higher in the glass (<1% of difference). Chemical data in Pignatelli and Piochi (2021) [68]. Stratigraphic reconstruction agrees with Di Vito et al. (1999), Smith et al. (2011), and Forni et al. (2018) [36,78,79]. Red dashed line indicates the fault position.
Remotesensing 14 03526 g014
Figure 15. Image (net loss area in Paleo–Astroni deposits, Figure 1c) showing the structural lineament within the Paleo–Astroni deposits filled by alunite, mascagnite, alunogen, alum(K), and amorphous.
Remotesensing 14 03526 g015
Table 1. Tables of mean and standard deviations noise of the distribution of the alignment.
AreaMean (m)St. Dev. (m)
1−0.0072−0.1016
20.00550.1815
3−0.01720.1586
40.00360.1581
5−0.03680.2089
6−0.01770.2247
Table 2. Tables of synthesis of the material fall vs. accumulated 2014–2021.
Volume (m3)Area (m2)
Gain1.4222.163
Loss−4.32418.245
Table 3. Ideal chemical formula (IMA database, available online) of minerals detected in the studied samples.
MineralComposition
AluniteKAl3(SO4)2(OH)6
AlunogenAl2(SO4)3•17(H2O)
Alum-(K)KAl(SO4)2•12(H2O)
AmorphousSiO2
BaryteBa(SO4)
GypsumCaSO4•2(H2O)
HaliteNaCl
HalotrichiteFe++Al2(SO4)4•22(H2O)
Illite *(K,H3O)(Al,Mg,Fe)2(Si,Al)4O10[(OH)2,(H2O)]
JarositeKFe+++3(SO4)2(OH)6
KaoliniteAl2Si2O5(OH)4
Mascagnite(NH4)2(SO4)4
Montmorillonite(Na,Ca)0,3(Al,Mg)2Si4O10(OH)2•n(H2O)
OpalSiO2•nH2O
PickeringiteMgAl2(SO4)4•22(H2O)
PyriteFeS2
QuartzSiO2
SulfurS
* Available online: www.webmineral.com (accessed on 20 March 2022).
Publisher’s Note: MDPI stays neutral with regard to jurisdictional claims in published maps and institutional affiliations.

