1. Introduction
The center position and size of a tropical cyclone (TC) are essential parameters required by vortex initialization for numerical TC forecasts [
1,
2] and estimation of TC intensity [
3,
4]. Studies on the dynamics of TC structural and intensity changes also require an accurate center position and size of a TC [
5,
6,
7,
8,
9,
10,
11]. For example, verifying the propagation mechanism of vortex Rossby waves by observations is usually achieved by measuring the radial scale and velocity of the TC inner spiral rainbands which rotate counterclockwise and move outward radially [
7,
12,
13]. Guo and Tan [
8] defined a TC intensity-related parameter called TC fullness, which is defined as the ratio of the difference between the radius of 17 m s
−1 near-surface wind speed (R17) and the radius of maximum wind (RMW) divided by R17. The RMW and R17 are used to describe the sizes of the TC eye and inner-core region, respectively. Therefore, accurate TC center positions and sizes can also be applied to the calculation of TC fullness. Since TCs occur and intensify mostly over the oceans, where only a handful of in situ measurements are available, meteorological satellites have become the primary data sources for investigating TCs. Geostationary satellite imagers’ brightness temperature (TB) observations in the infrared and visible channels have sufficient temporal and horizontal spatial resolution to reveal many structural features of TCs [
3,
4,
14].
The TC center-positioning methods in numerical studies were reviewed by Ryglicki and Hart [
15], who roughly divided all the methods into three categories. The first category is called the local extreme method, which defines a TC center as the geographic location where the surface pressure or the potential vorticity within the TC inner-core region reaches its minimum or maximum, respectively [
16,
17]. The second category is called the weighted grid points method, which takes the centroid of the properly weighted pressure or potential vorticity field as the TC center [
18,
19,
20]. The third category is called the minimum azimuthal variance method, which takes the center of an annulus meeting the following conditions as the TC center: inside the annuli with varying widths centered on the position of RMW, the azimuthal variance is minimized, or the azimuthal mean of pressure or wind speed is maximized [
21,
22,
23]. The last method assumes that the symmetric component of a pressure field or wind field containing a TC always dominates the asymmetric components. Observational studies of TCs mainly used reflectivity observations and derived wind field products from ground and airborne radars, as well as wind field observations from reconnaissance aircraft [
13,
24]. Therefore, many TC center-positioning methods are based on wind field observations around a TC, seeking a TC center position to maximize the azimuthal average tangential wind speed [
24,
25,
26,
27,
28] or the symmetric component of the tangential wind [
7] inside the annuli with different widths centered at the RMW. In addition, Corbosiero et al. [
12] used the dynamical center of the vortex determined by Willoughby and Chelmow [
29] as the TC center when decomposing the symmetric and asymmetric components of a TC. Guimond et al. [
13] directly used the TC center position observed by the Air Force and NOAA reconnaissance aircraft when verifying the vortex Rossby waves by radar observations.
In operational analysis and forecast of TCs, abundant infrared, visible, and microwave observations provided by meteorological satellites are mainly used to locate the TC center [
3,
4,
30,
31,
32,
33,
34]. The most famous TC center-positioning methods are the Advanced Dvorak Technology (ADT) for determining TC intensity and the Automated Rotational Center Hurricane Eye Retrieval (ARCHER) algorithm [
33,
34]. The ARCHER algorithm employs multiple data sources to locate the TC center, including TB observations at infrared, visible, 85–92-, and 37-GHz microwave channels and wind vectors from scatterometer retrievals. Hu and Zou [
35] tried to locate TC centers by an azimuthal spectral analysis method using microwave TB observations at a single channel of the Advanced Technology Microwave Sounder (ATMS) and the Microwave Humidity Sounder (MHS) onboard polar-orbiting operational environmental satellites (POESs). Since a single polar-orbiting satellite can only observe the same TC twice daily at most, even during times with three possible polar orbits (morning, afternoon, and early morning) of all POESs, there would be six times global observations per 24 h. In this study, the infrared TB observations with 15 min temporal and 2 km horizontal resolutions provided by the Advanced Baseline Imager (ABI) onboard the U.S. 16th Geostationary Operational Environmental Satellite (GOES-16) are used to determine TC centers and radii of the inner and outer rainbands. Being capable of better resolving cloud top distributions than microwave radiations, GOES infrared TB observations can better capture small-scale cloud structures of TCs from space.
Aside from TC motion and intensity, TC sizes, which determine the potential impacts of TCs [
36,
37,
38], as well as arial coverages and distributions of TC-induced cloud and rainfall [
39,
40], have received a lot of attention in research. We may name a few size parameters employed in past research: the radius of the 34 kt near-surface wind speed (R34) [
8,
41]; the radius of 15 m s
−1 near-surface wind speed (R15) [
42,
43]; the radius of outermost closed isobar (ROCI) [
44,
45]; the average radius of 5 kt tangential wind (R5) at 850 hPa [
46]; the average radius of 1 × 10
−5 s
−1 relative vorticity [
47]; the radius of the maximum radial gradient of sea level pressure (SLP) [
1]. The lack of in situ measurements makes routine operational wind radii estimation heavily dependent upon satellite observations [
48]. Liu and Chan [
47] measured the average radius of 1 × 10
−5 s
−1 relative vorticity as the TC size using the European Remote-Sensing Satellites-1 and wind scatter observations. Using the Quick Scatterometer (QuickSCAT) surface wind speed, Lee et al. [
43] and Chan and Chan [
49] measured the TC sizes as R15 and R34, respectively. Knaff et al. [
46] indirectly measured the TC size (R5) by establishing a relationship between the azimuthally averaged 850 hPa tangential winds from model analyses and the radial distribution of azimuthally averaged infrared (~11
m) TB. Lu et al. [
50] measured the TC size (R34) by establishing a relationship between the R34 and the TB radial profiles derived from satellite imagery. In summary, TC sizes were generally quantified by wind or SLP data.
A TC is essentially a rotating, organized system of clouds and thunderstorms. It is natural to describe its size based on TC cloud structures. The TC size, determined from near-surface wind speeds and/or SLP data, cannot fully represent TC cloud structures. Since TC spiral rainbands are usually shown as banded low-valued TB regions, spatial variations in GOES infrared TB observations can reflect the cloud structures and cloud convection intensity of TCs [
3,
51,
52,
53,
54]. A TC is usually regarded as an axisymmetric vortex [
55], but asymmetric structures (non-circular TC eye, spiral rainbands, etc.) are also very important for its movement and development. The spiral rainbands are spiral band structures of convection or precipitation that occur outside the hurricane eyewall. In this study, the rainband near the TC center and of strong azimuthal symmetry in GOES infrared TB observations is called the inner core rainband, and the spiral rainband farther from the TC center often has an asymmetry distribution called the outer spiral rainband [
56,
57]. The TC inner-core region is typically defined as an axisymmetric region 100–200 km away from the TC center [
57] or as a dynamically controlled region by cyclonic vortex circulation [
58]. Since there are huge differences in TB values between the TC cloud area and its surrounding environment [
59], this study, in addition to determining TC center positions, also attempts to derive the radii from the boundaries of the TC cloud area to the TC center at different azimuthal angles. Considering that the outer spiral rainbands are usually distributed in the periphery of a TC (the upwind end lies outside the TC inner-core region and the downwind end lies within the TC inner-core region), and the inner core rainbands are located within the TC inner-core region [
57], it is hypothesized that the minimum and maximum radii from the TC cloud boundaries at 24 azimuthal angles of 15
to the TC center represent the radii of the inner and outer spiral rainbands from the TC center, respectively, which are called the radius of inner core rainband (R
IR) and the radius of outer spiral rainband (R
OR), respectively. Thus, R
IR describes the size of the TC inner-core region, and R
OR reflects the maximum radial extent of TC rainbands.
The article is organized as follows:
Section 2 provides the instrument characteristics of ABI, the National Hurricane Center (NHC) best track data, and TC cases.
Section 3 briefly describes an azimuthal spectral analysis method for TC center positioning and a step-by-step procedure for determining radii R
IR and R
OR. In
Section 4, ABI-derived results on center position, R
IR and R
OR of Hurricanes Irma and Jose (2017) are given, and the relationships among the moving track, the steering flow, and TC cloud convections during the time period when Jose made a circled track are discussed. In
Section 5, spatial distributions and amplitudes of symmetric and asymmetric components centered at the ABI-determined center and the best track are compared.
Section 6 presents conclusions.
3. Methods of Determining TC Center and Rainband Size
The azimuthal spectral analysis method proposed by Hu and Zou [
35] was used to determine the center positions of Irma and Jose based on ABI channel-13 TB observations. It aims at obtaining a center position for which the symmetric component encompassing the center is the largest. Two steps are included in this method. The first step is to determine an initial first-guess position. Based on the fact that there is usually a region of low TB values within the eyewall and the inner core rainband close to the TC center, the first-guess position is determined as the position with the minimum value of TB observations averaged over a coarse grid of 1.5° × 1.5°. The second step is to carry out a set of azimuthal spectral analyses within circular areas of the radius R
i centered at different tryout centers. The subscript “i” of R
i is an index representing the tryout centers, which are distributed at 0.05° × 0.05° resolution and are contained in a 2° × 2° square area centered at the first-guess position. A detailed description of how to determine R
i is described in the next paragraph. Among all the tryout centers, the one which produces the largest value of the radially-mean amplitude of wavenumber 0 component (symmetric component) within the radial distance of R
i is taken as the TC center. A detailed explanation of the azimuthal spectral analysis method can be found in [
35].
The azimuthal spectral analysis method for TC center positioning requires that the symmetric component of a TC within the radius R
i is always dominant. In a previous study [
35] using POES microwave humidity sounder’s observations, R
i was empirically set to 360 km. Taking an advantage of GOES infrared TB observations of high resolution and high cloud sensitivity, this study attempts to determine objectively the largest radial distance over the circumferences of radius R
i and smaller radii where the spectral analysis is carried out. An example is given in
Figure 2 to illustrate such a procedure.
Figure 2a shows the spatial distributions of ABI channel-13 TB observations at about 1200 UTC September 4, 2017, around Irma as well as the first-guess position determined from it. Variations of the observed TB values along the northwest-southeast (NW-SE) line passing through the first-guess position and the radial gradients of TB values along the NW-SE line are shown in
Figure 2b. Within the radial distance of about 400 km, the TB values are relatively low and fluctuate greatly radially, reflecting the impacts of TC cloud distributions on TB. Beyond the 400 km radial distance, the TB values are relatively high and stable, which represents the variations of environmental TB distributions. Considering these features in TB observations, we propose the following method to determine objectively the largest radial distance (R
fg) from the first-guess position to the boundary of the TC-related cloud area. We firstly determine the inflection points where the radial gradient of TB switches from positive to negative from the center outward. If the average TB within 100 km on the radially outward side of the inflection point is greater than or equal to the average TB of the surrounding environment of a TC, the radial distance of the inflection point is regarded as the radius from the TC center to the boundary of TC related cloud area along the NW or SE direction. The average TB of the surrounding environment refers to the average TB between 800–1000 km away from the center [
64]. The purpose of using average TB within the range of 100 km rather than the TB at a certain radial distance is to avoid the situation where a long and narrow high-valued TB region generated between the outer spiral rainbands is taken as the circumference separating TC from the surrounding environmental region. It can be seen from
Figure 2b that the radius of the TC cloud area boundary in the northwest direction is determined as the radial distance where the inflection point of TB gradient is caused by the small-scale disturbance of TB. Obviously, the radial distance where the high-valued environment TB becomes stable is larger than the radial distance of the inflection point caused by the small-scale disturbance of TB. In order to avoid such incidents, a 50 km low pass Lanczos filter proposed by [
65] was applied to obtain the filtered TB and its radial gradient, which are also shown in
Figure 2b. The final radius R
fg is determined based on the filtered TB sequences. The two radii determined by the filtered TB observations along the NW and SE directions in
Figure 2b are about 363.0 and 424.5 km, respectively. The radii of the boundaries of the TC cloud area at 24 azimuthal angles of 15° are determined by the same method mentioned above. Considering that the TC structure in the outer-core region is generally more asymmetric than that in the inner-core region [
53], the smallest radius of the TC cloud area at 24 azimuthal angles is taken as the radius R
i to ensure the symmetric component is a dominant feature within R
i.
Having the first-guess position and the radius R
i, an azimuthal spectral analysis is conducted at all tryout centers located in a 2° × 2° square area centered on the first-guess position. The tryout center corresponding to the maximum value of the wavenumber-0 amplitude averaged over radial distances from 20 km to R
i was taken as the TC center. There are not very many TB observations along the circumferences within a radius of less than 20 km.
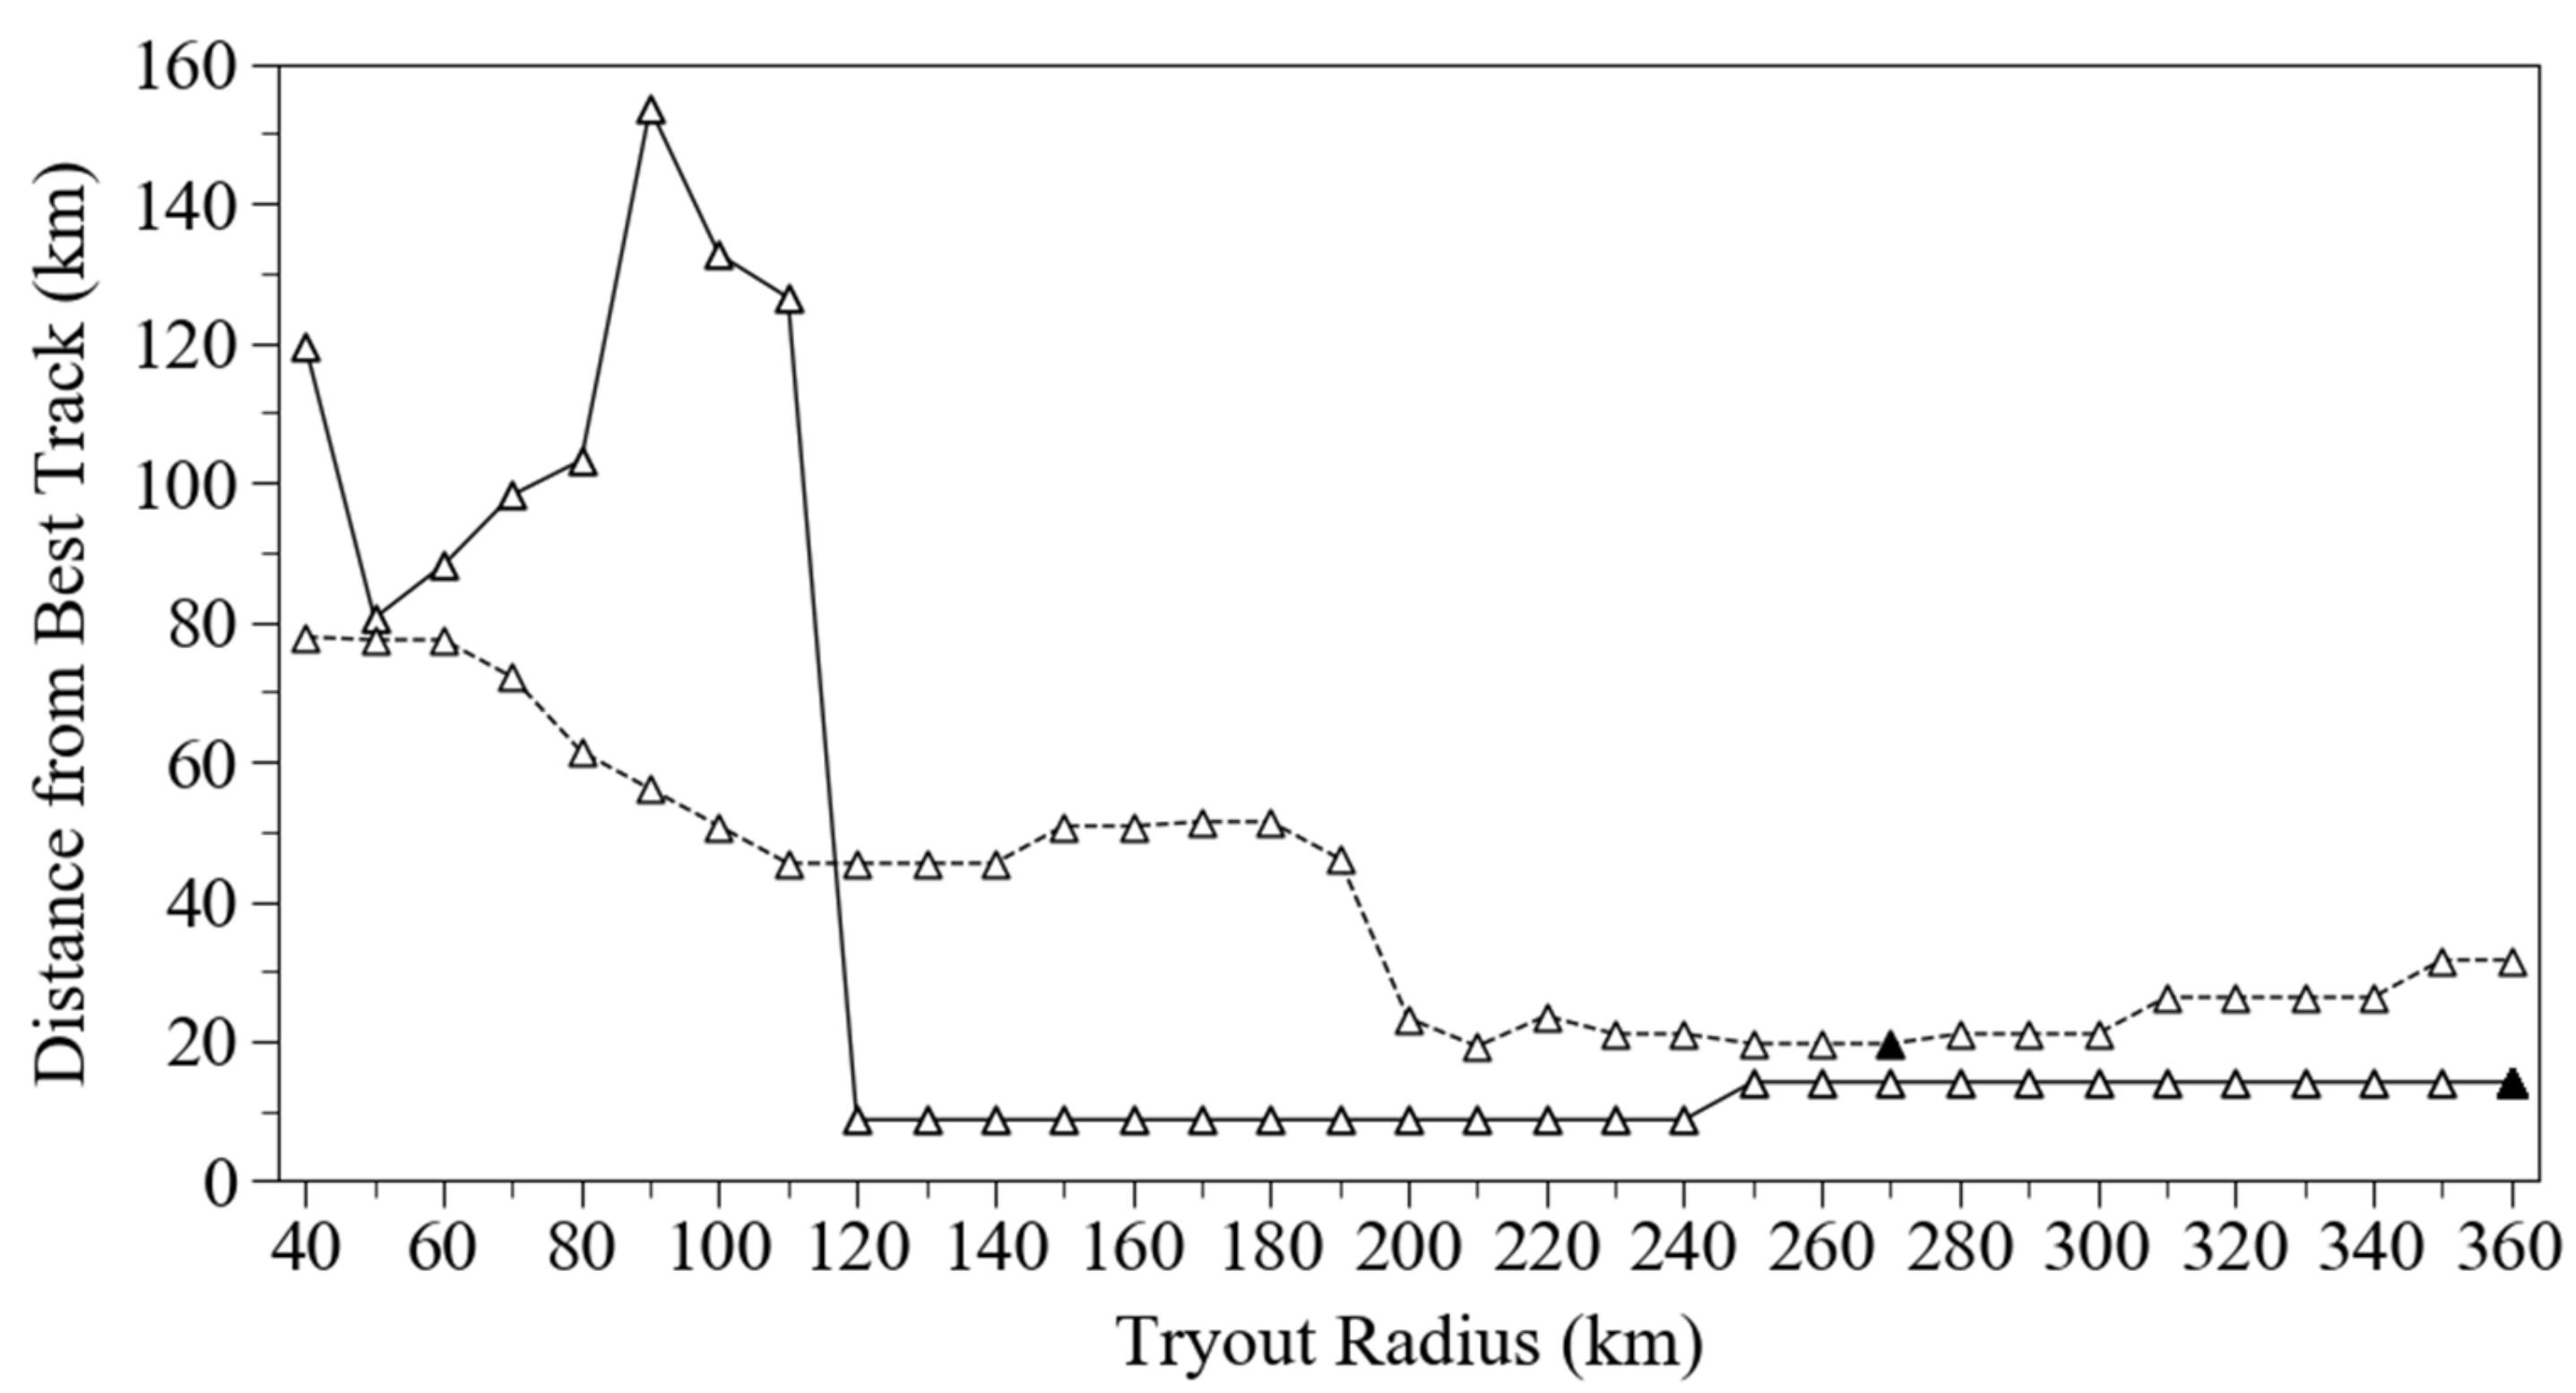
Figure 3 shows variations of the distance between the best track center and the ABI-determined center with varying values of the largest radius for calculating the largest mean wavenumber-0 amplitude at about 1200 UTC September 4 and 1800 UTC August 30, 2017. We can see that the distance between the best track center and the ABI-determined center using the radius R
i, which is determined objectively by the ABI channel-13 TB observations, is reasonably small. At 1800 UTC August 30, 2017, the current result of the distance between the best track and the center using the objectively determined radius of R
i in this study is smaller than that of Hu and Zou [
35] who used an empirical value of 360 km for R
i.
Having the TC center determined from TB observations, we proceeded to determine TC rainband sizes using the same method for determining the radius R
i. The only difference is using the TC center, instead of the first-guess position. The smallest and largest radii of the TC cloud area at 24 azimuthal angles are taken as the radius of the inner core rainband (R
IR) and the radius of the outer spiral rainband (R
OR). Two examples are provided to show the results of R
IR and R
OR for Irma at about 1200 UTC September 4, 2017, and 1800 UTC August 30, 2017.
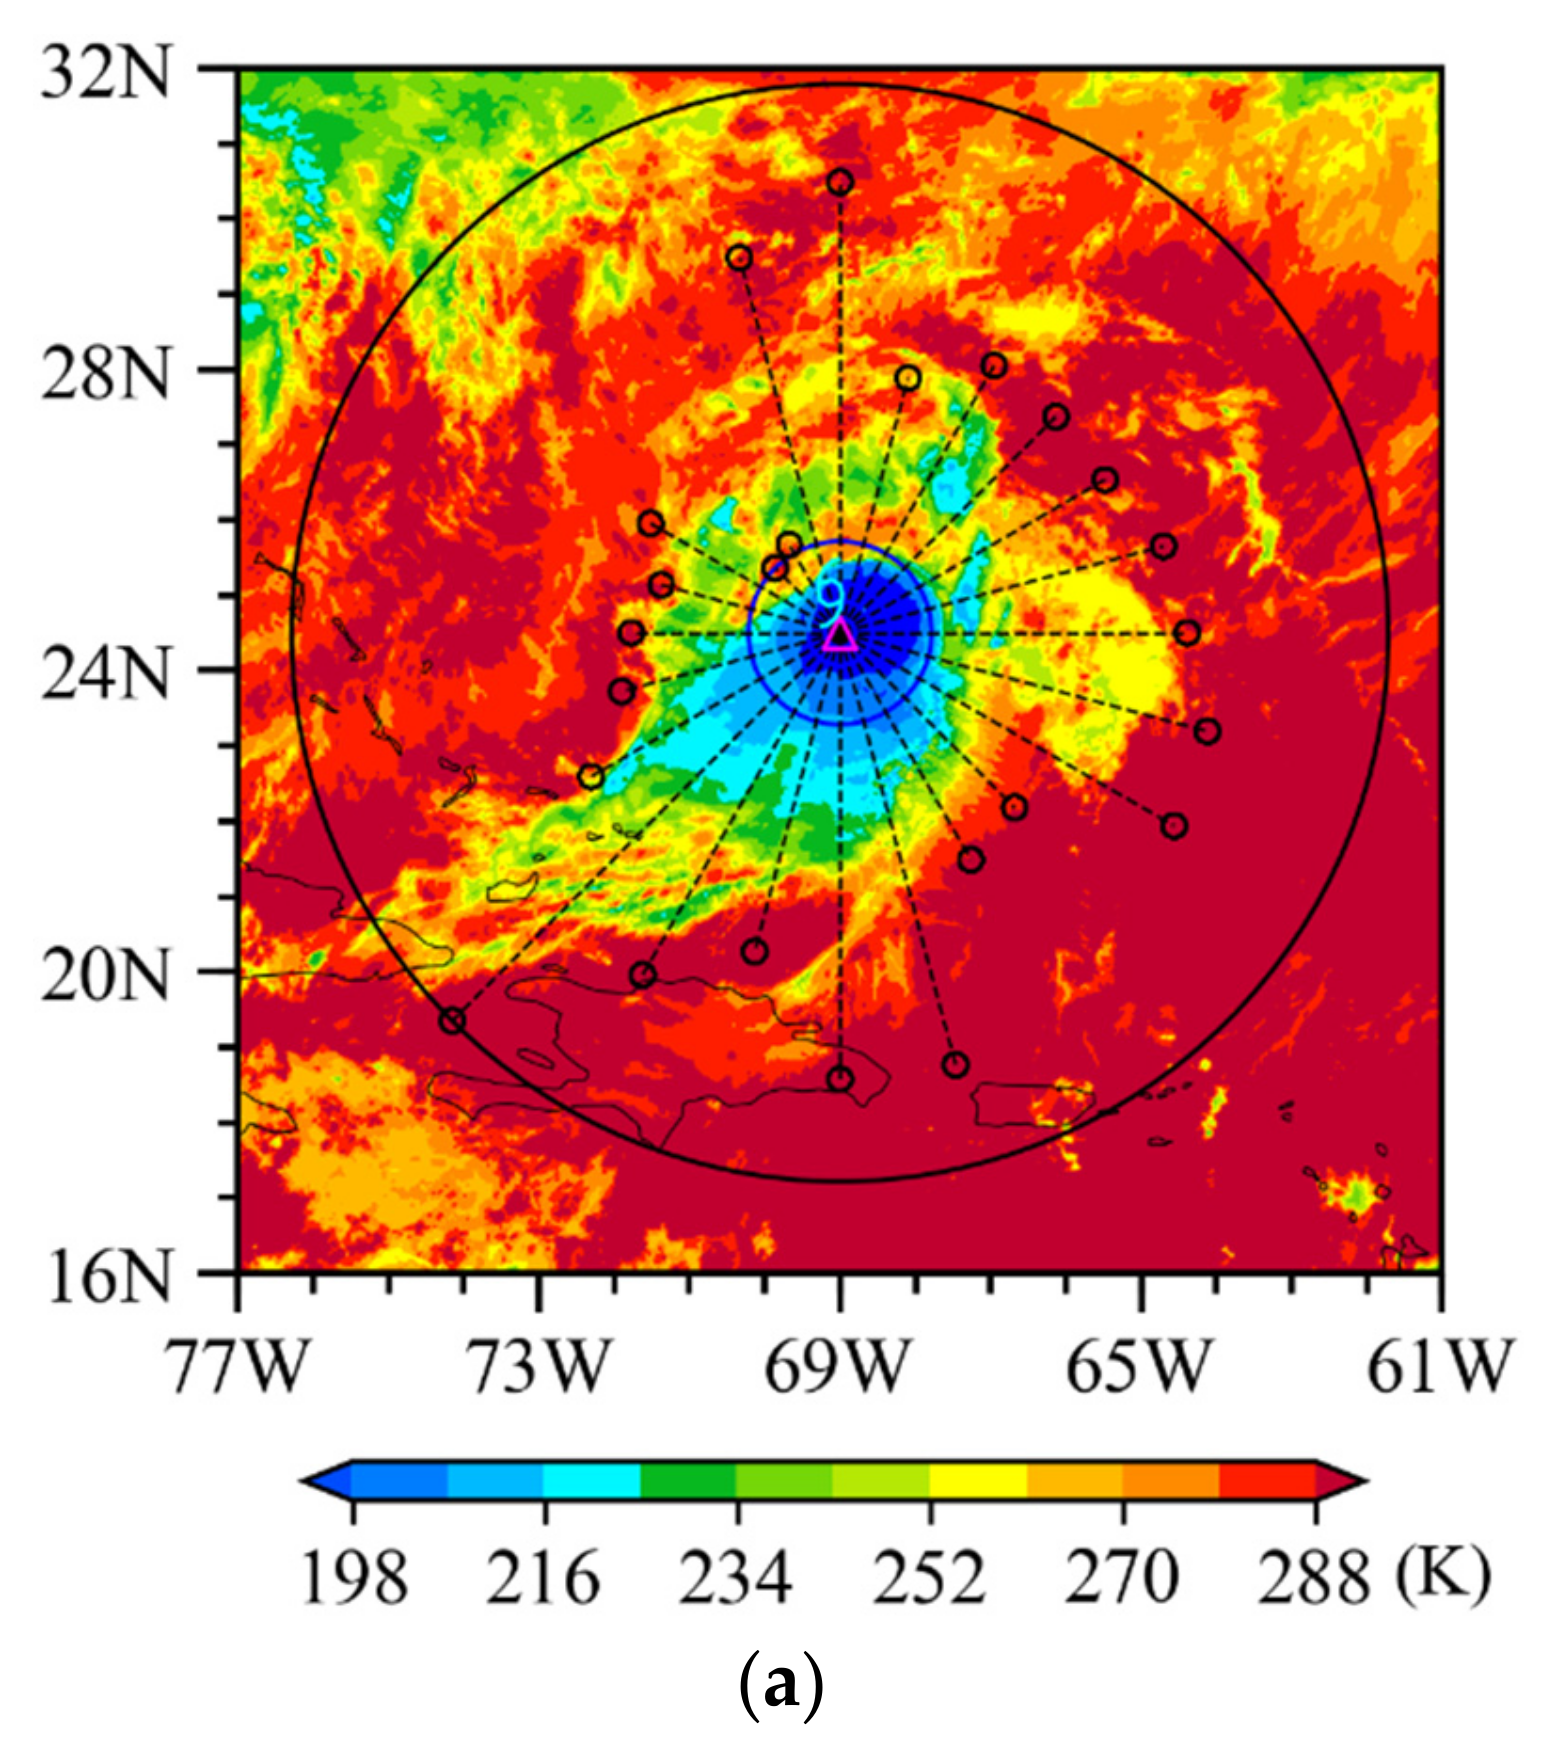
Figure 4a,b show the spatial distributions of TB observations within and around Irma, locations of the ABI-determined boundaries of the TC cloud area at 24 azimuthal angles of 15°, and two circles with radii of R
IR and R
OR at both times. It can be seen that almost all TC structures, including the outer spiral rainbands, are contained within the circumference of the radius of R
OR. The circle with a radius of R
IR describes mainly the nearly axisymmetric region with an inner core rainband. Therefore, R
IR describes approximately the size of the nearly axisymmetric TC inner-core region, and the R
OR reflects the maximum radial extent of TC rainbands.
Figure 4c,d show the original and filtered TB observations and the radial gradients of filtered TB sequences along the directions in which the values of R
IR and R
OR are generated at about 1200 UTC September 4 and 1800 UTC August 30, 2017, respectively. Results from ABI-determined TC centers and the values of R
IR and R
OR at all times of Irma and Jose at 6 h intervals will be given and discussed in
Section 4.
4. Results of TC Center and Rainband Size
The TC center from the best track data refers to the center position near the surface, which usually is the location of minimum wind or minimum pressure. Although the definition of center position from the best track is quite different from the azimuthal symmetric center determined by the ABI channel-13 TB observations in this study, the best track is still the only reliable and available dataset to be compared for showing the accuracy of the ABI-determined center. The center-positioning results for Irma and Jose from ABI were compared with those from MHS/ATMS TB observations of microwave channel 18 (183.31 ± 7.0 GHz) of ATMS onboard S-NPP satellite and microwave channel 5 (190.31 GHz) of MHS onboard MetOp-A satellite using the same azimuthal center positioning method.
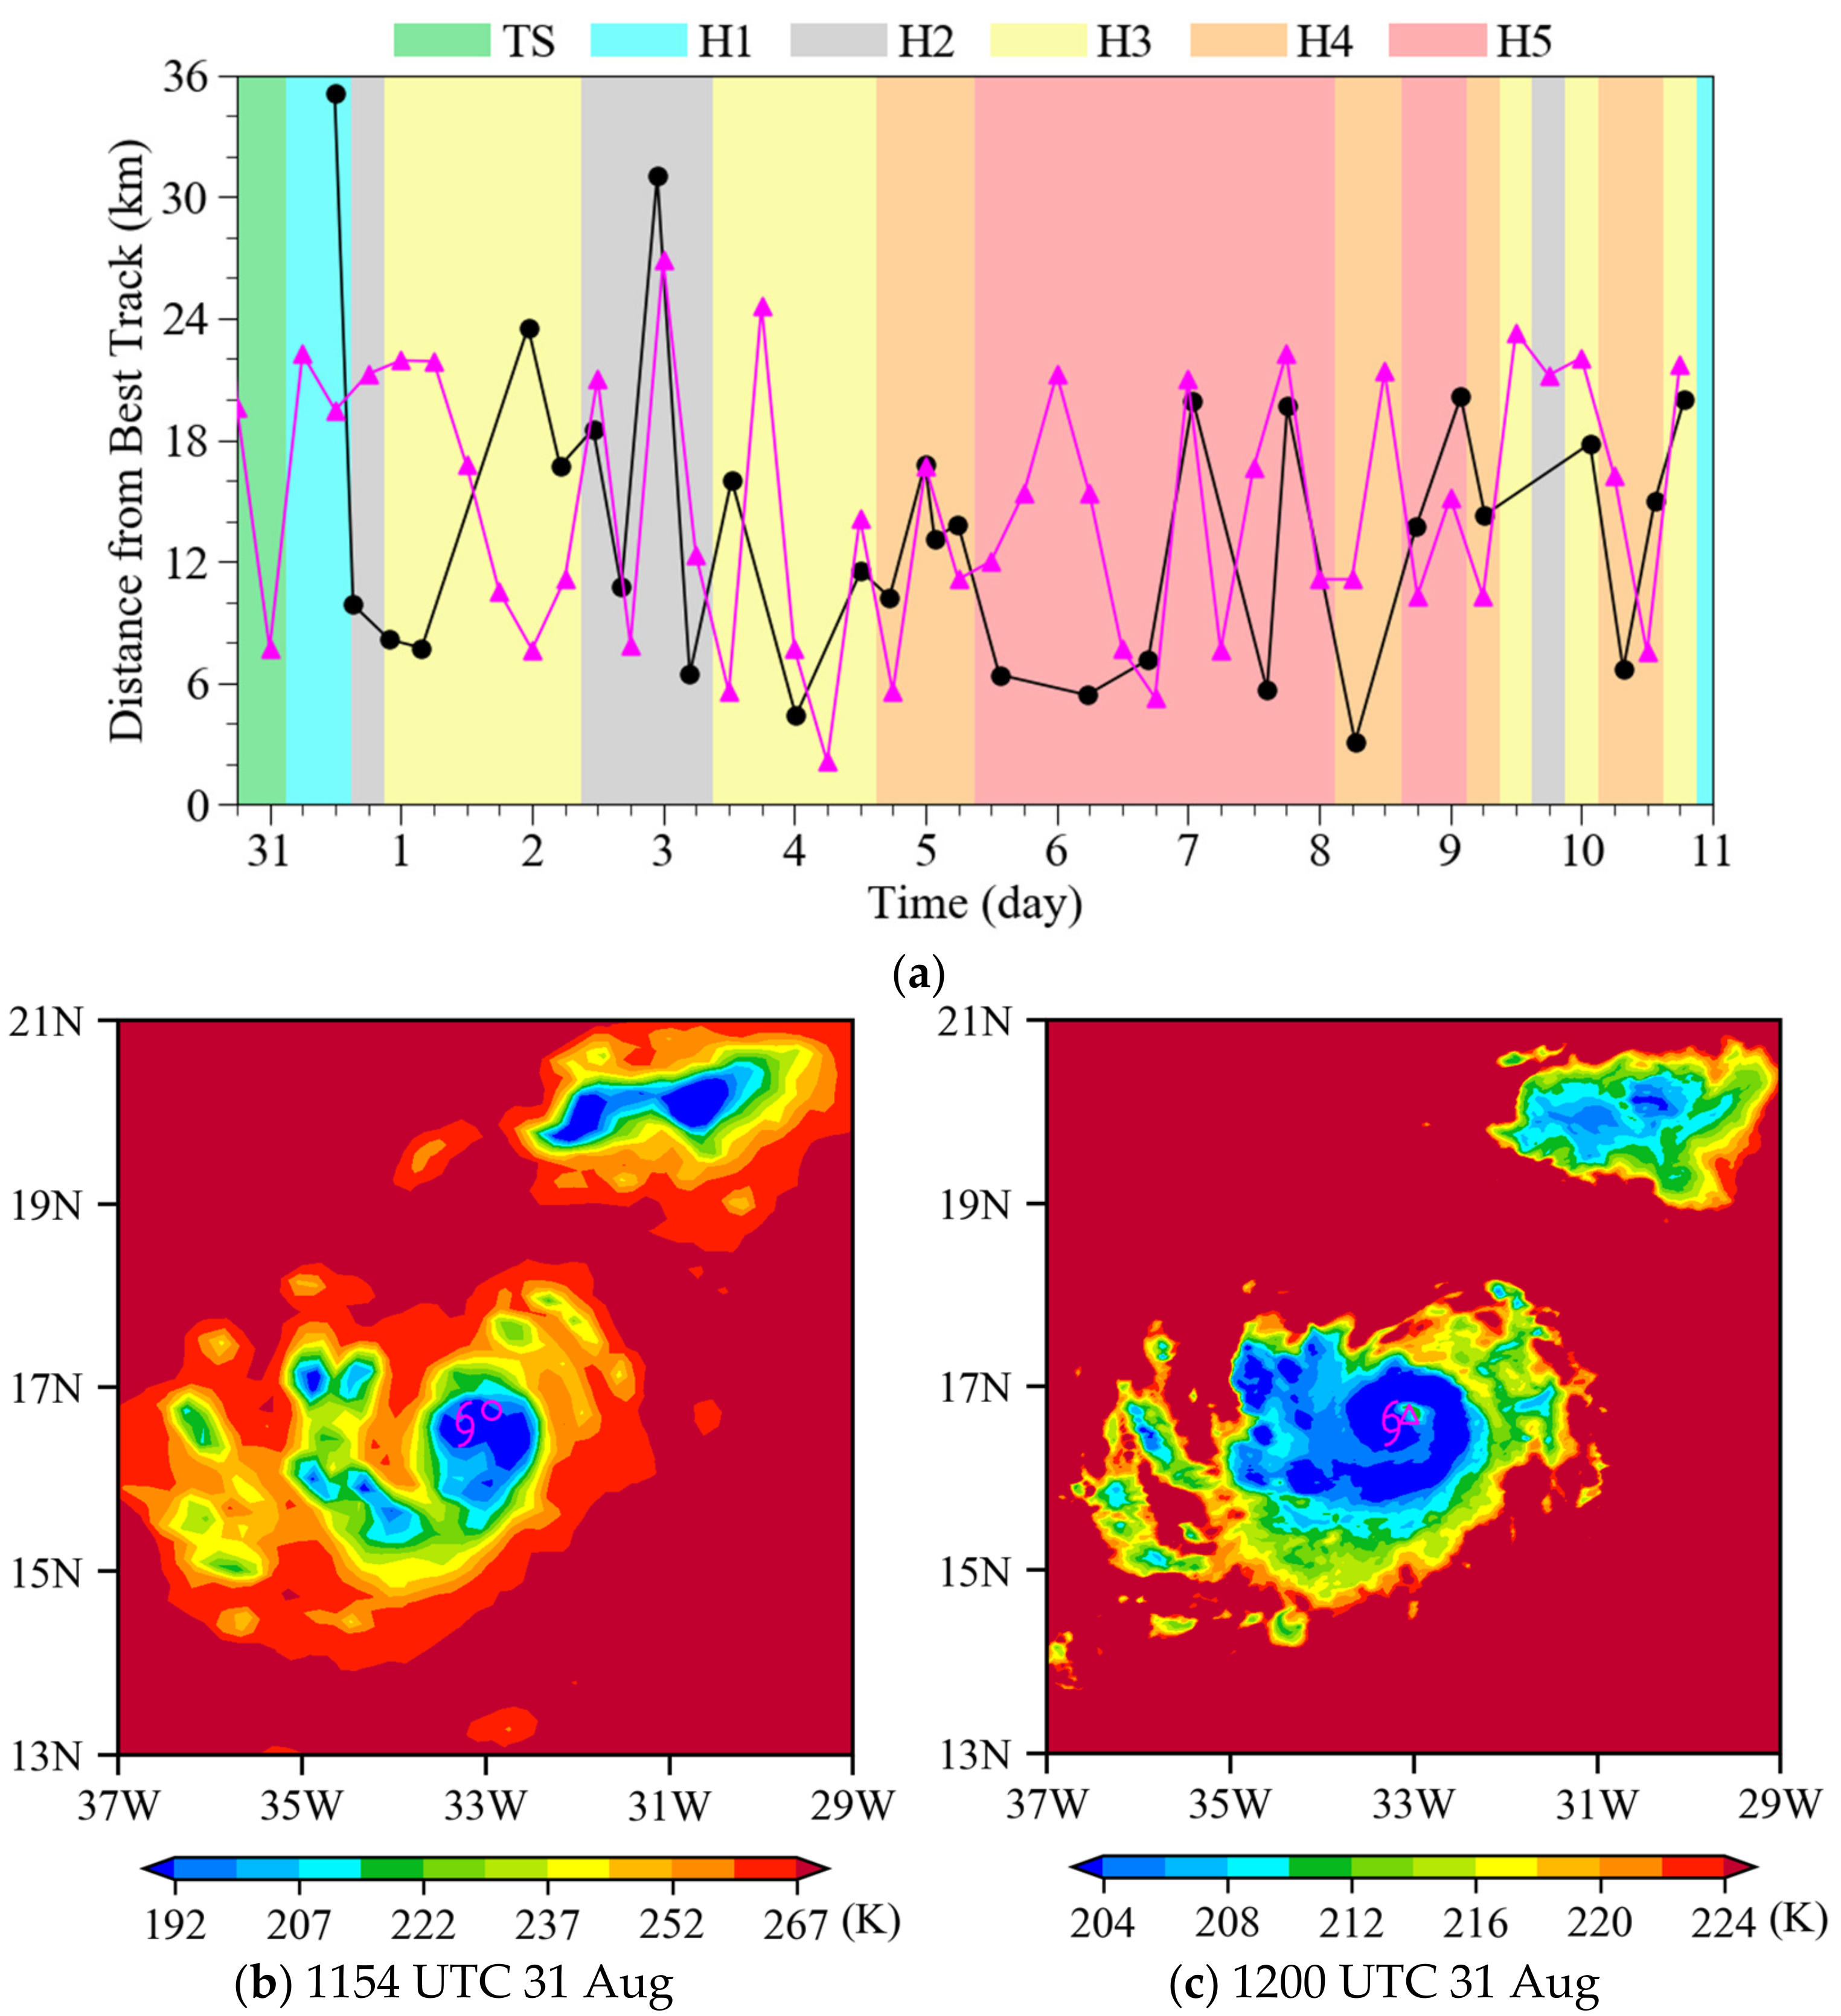
Figure 5a shows the distances between the ABI-determined centers and ATMS channel 18- or MHS channel 5-determined TC centers from the best track centers of Irma during the time period from 1800 UTC on August 30 to 1800 UTC on September 10, 2017. Hurricane Irma was observed 31 times by the S-NPP and MetOp-A satellites. The mean distance from the best track center for the ABI-determined centers and ATMS- or MHS-determined centers are about 14.9 and 13.8 km, respectively. Therefore, compared with the best track data, the TC center-positioning differences of ABI channel-13 determined TC centers are similar to those of ATMS channel-18 or MHS channel-5 determined TC centers.
However, a single polar-orbiting satellite can only observe the same TC twice daily at most, but a geostationary satellite can continuously observe it at 15 min or shorter time intervals. The horizontal resolution of ABI channel 13 is about 2 km, which is eight times higher than that of MHS/ATMS channels. This means that ABI can capture more detailed TC structures than MHS/ATMS. For example,
Figure 5b,c show the spatial distributions of MHS channel-5 and ABI channel-13 TB observations around Irma, the ABI-determined center, MHS-determined center, and the best track center at about 1154 and 1200 UTC on August 31, 2017, respectively. It is seen that a clear TC eye was observed in the ABI channel-13 TB observations but not in the MHS channel-5 TB observations. The ABI-determined center is just located at the position of the TC eye and is close to the best track center. Unlike ABI infrared channel 13, microwave radiation from ATMS channel 18 and MHS channel 5 can penetrate cirrus and discern TC structures in the middle and lower troposphere [
35]. To sum up, although TB observations of ABI channel 13 and ATMS channel 18/MHS channel 5 can all determine the TC centers by the azimuthal spectral analysis method, the ABI TB observations with high spatial-temporal resolutions have an advantage for the continuous center-positioning of TC.
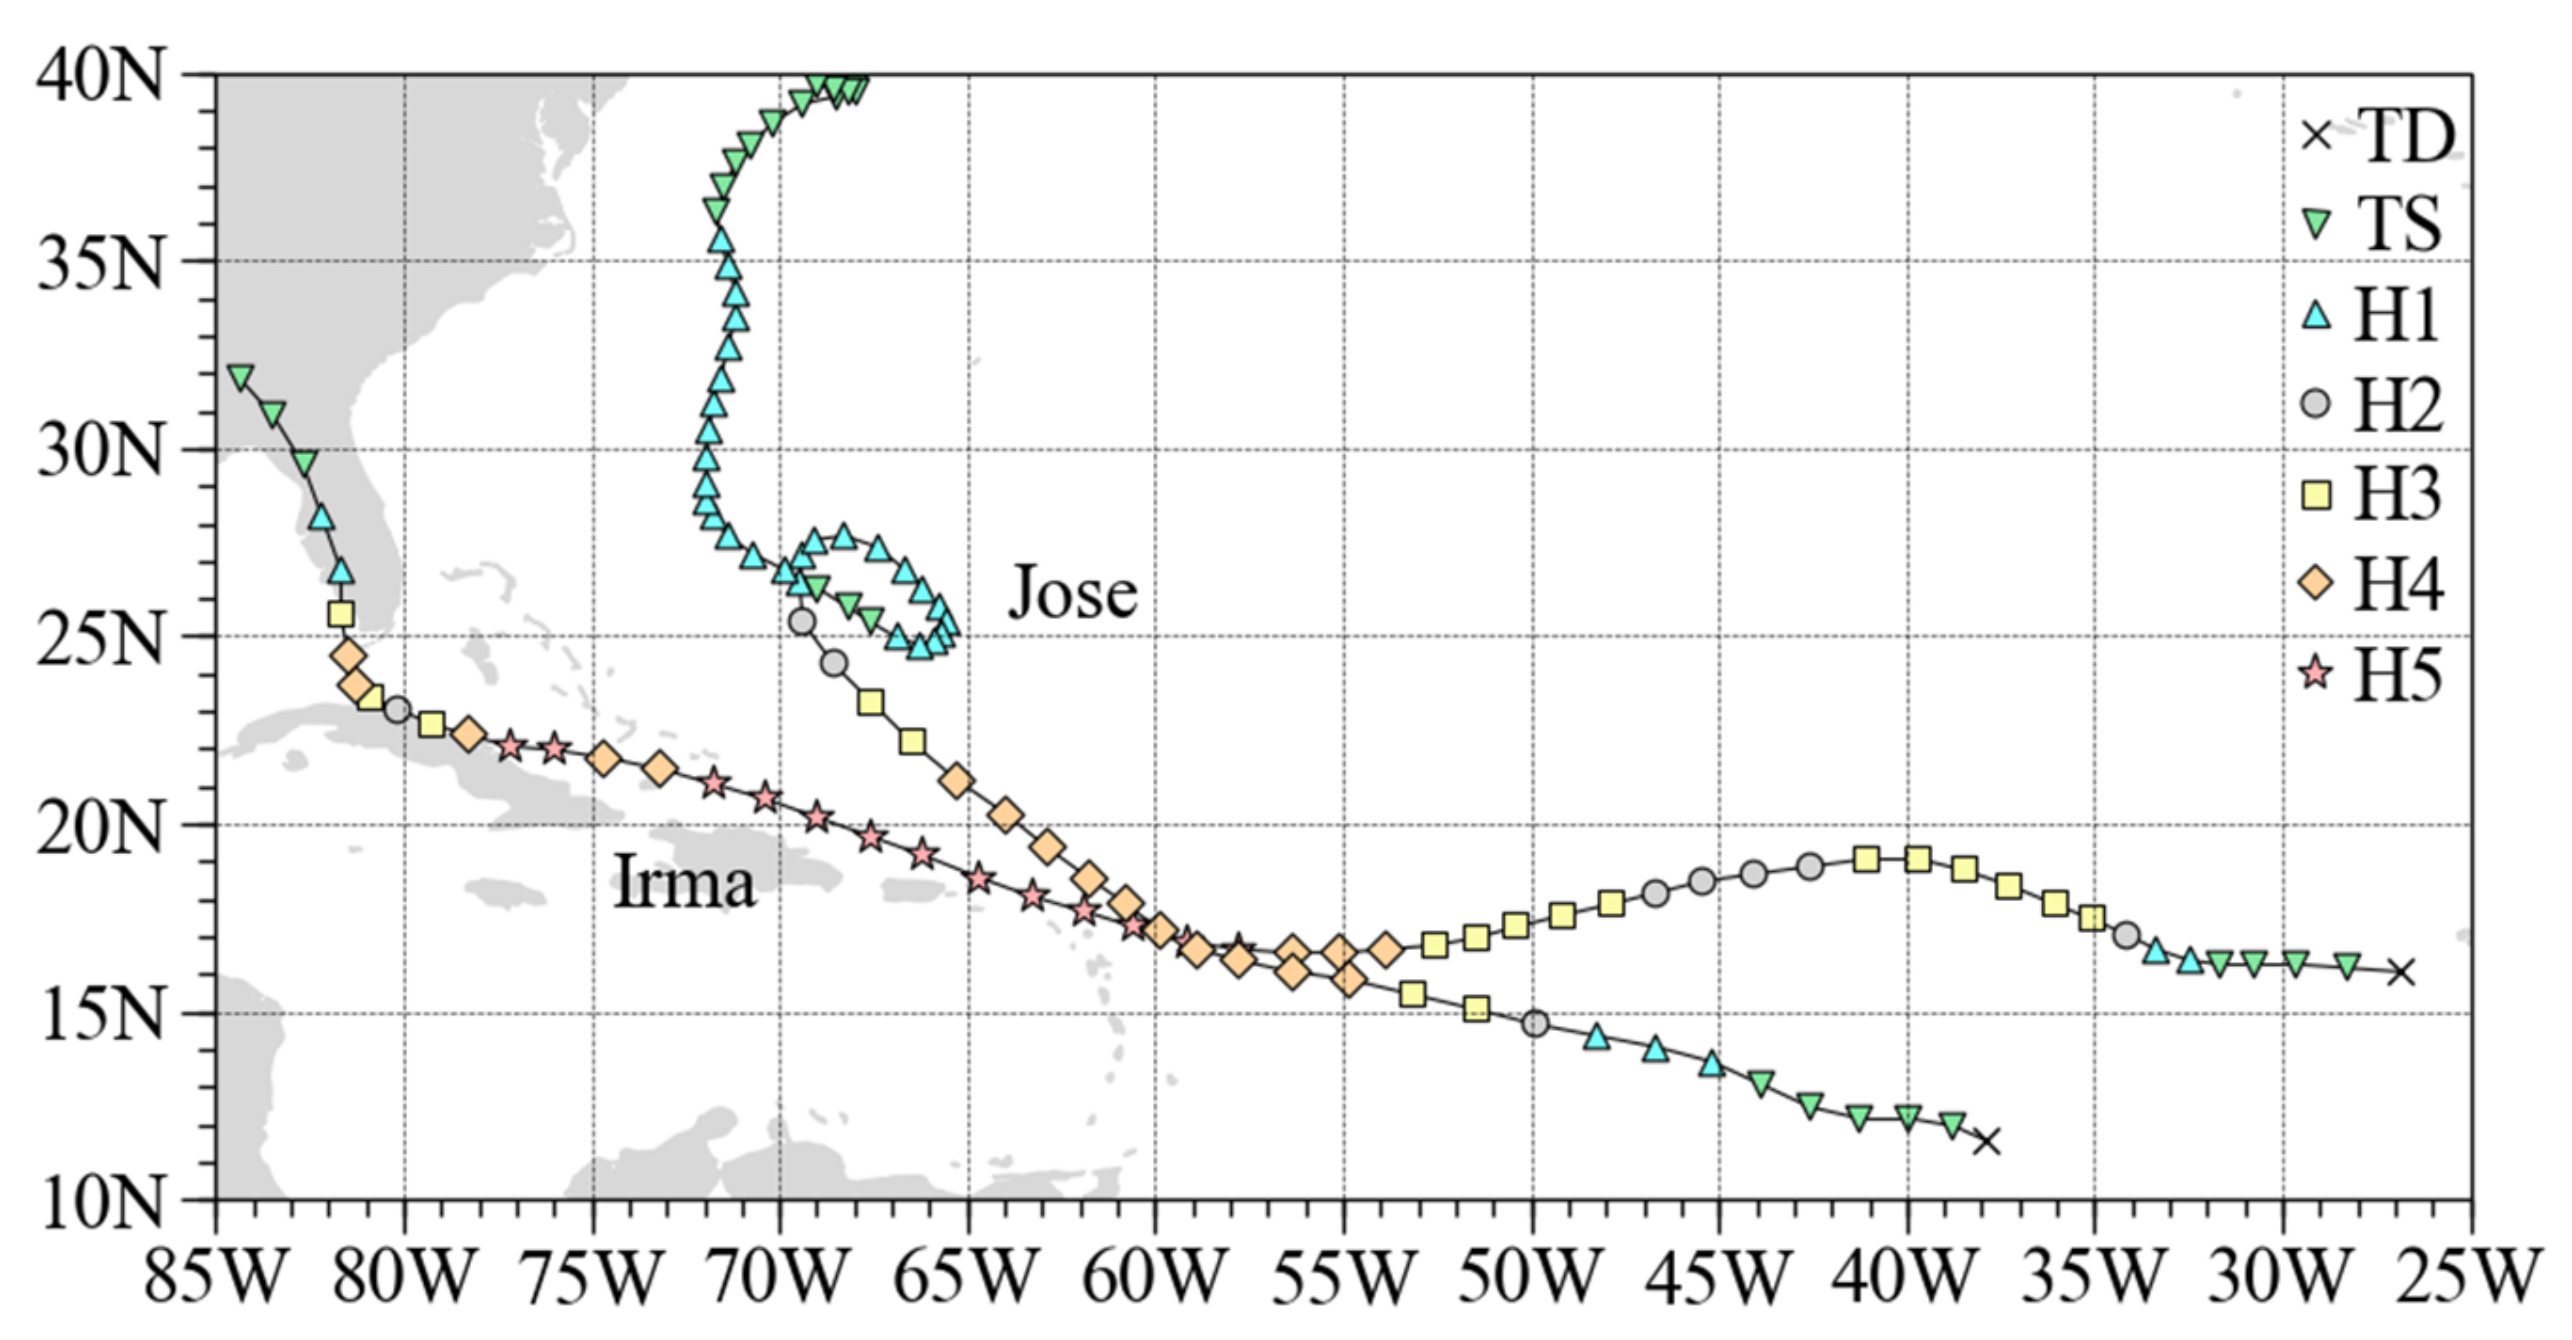
The ABI-determined track and the best track of Irma from 1800 UTC August 30 to 1800 UTC September 10, 2017, are provided in
Figure 6a. It is seen that these two tracks are quite close. Variations of R
OR, R
IR and R
OR −R
IR for hurricane Irma are shown in
Figure 6b. The mean values of R
IR and R
OR are about 348 and 877 km, respectively. The difference between R
IR and R
OR can be used to describe roughly the radial extent of the ring within which strong asymmetric outer spiral rainbands are located.
Hurricane Jose made a clockwise loop over the southwestern Atlantic during an overall northwest movement. It was a weaker hurricane than Irma on the whole.
Figure 7 shows the distances between the ABI-determined centers and ATMS channel 18- or MHS channel 5-determined TC centers from the best track centers of Jose during the time period from 0600 UTC September 6 to 1800 UTC September 21, 2017. Jose was observed 42 times by the S-NPP and MetOp-A satellites. The mean distances from the best track center for the ABI-determined center and ATMS- or MHS-determined center are about 37.4 and 34.2 km, respectively. The mean distances are smaller when Jose was a category-2 or stronger hurricane than at weaker intensities. Compared with the best track, the mean distance of the ABI-determined center of Jose is larger than that of Irma, as shown in
Figure 5a. Therefore, it can be inferred preliminarily that the higher the TC intensity, the smaller the difference between the ABI-determined center and the best track. Of course, a larger dataset is needed in order to confirm this.
Figure 8a,b show the spatial distributions of TB observations around Jose, the locations of the ABI-determined boundaries of the hurricane cloud area at 24 azimuthal angles, R
IR and R
OR at about 1200 UTC September 12, 2017, and 1200 UTC September 15, 2017, respectively. It is seen that there is a large TB depression zone near the center of Jose without an obvious TC eye and spiral rainband structures, and the whole structure of Jose is strongly asymmetric. The circular area of radius R
OR contains almost all TC structures.
Figure 8c shows the ABI-determined TC track and the best track of Irma from 0600 UTC September 6 to 1800 UTC September 21, 2017. Temporal variations of R
OR and R
IR and the difference between them are shown in
Figure 8d. The average value of R
IR of Jose is about 243 km, which is smaller than the average value of R
IR (348 km) of a stronger hurricane like Irma. The average R
OR of Jose is about 873 km.
Tables S1 and S2 list the best track centers, ABI-determined centers, R
IR and R
OR for Irma from 1800 UTC August 30 to 1800 UTC September 10, 2017 and Jose from 0600 UTC September 6 to 1800 UTC September 21, 2017 at 6 h intervals (a total of 108 TC times), respectively. Compared with the best track, the root mean square differences of ABI-determined centers for tropical storms and hurricanes are 45.35 and 29.06 km, respectively.
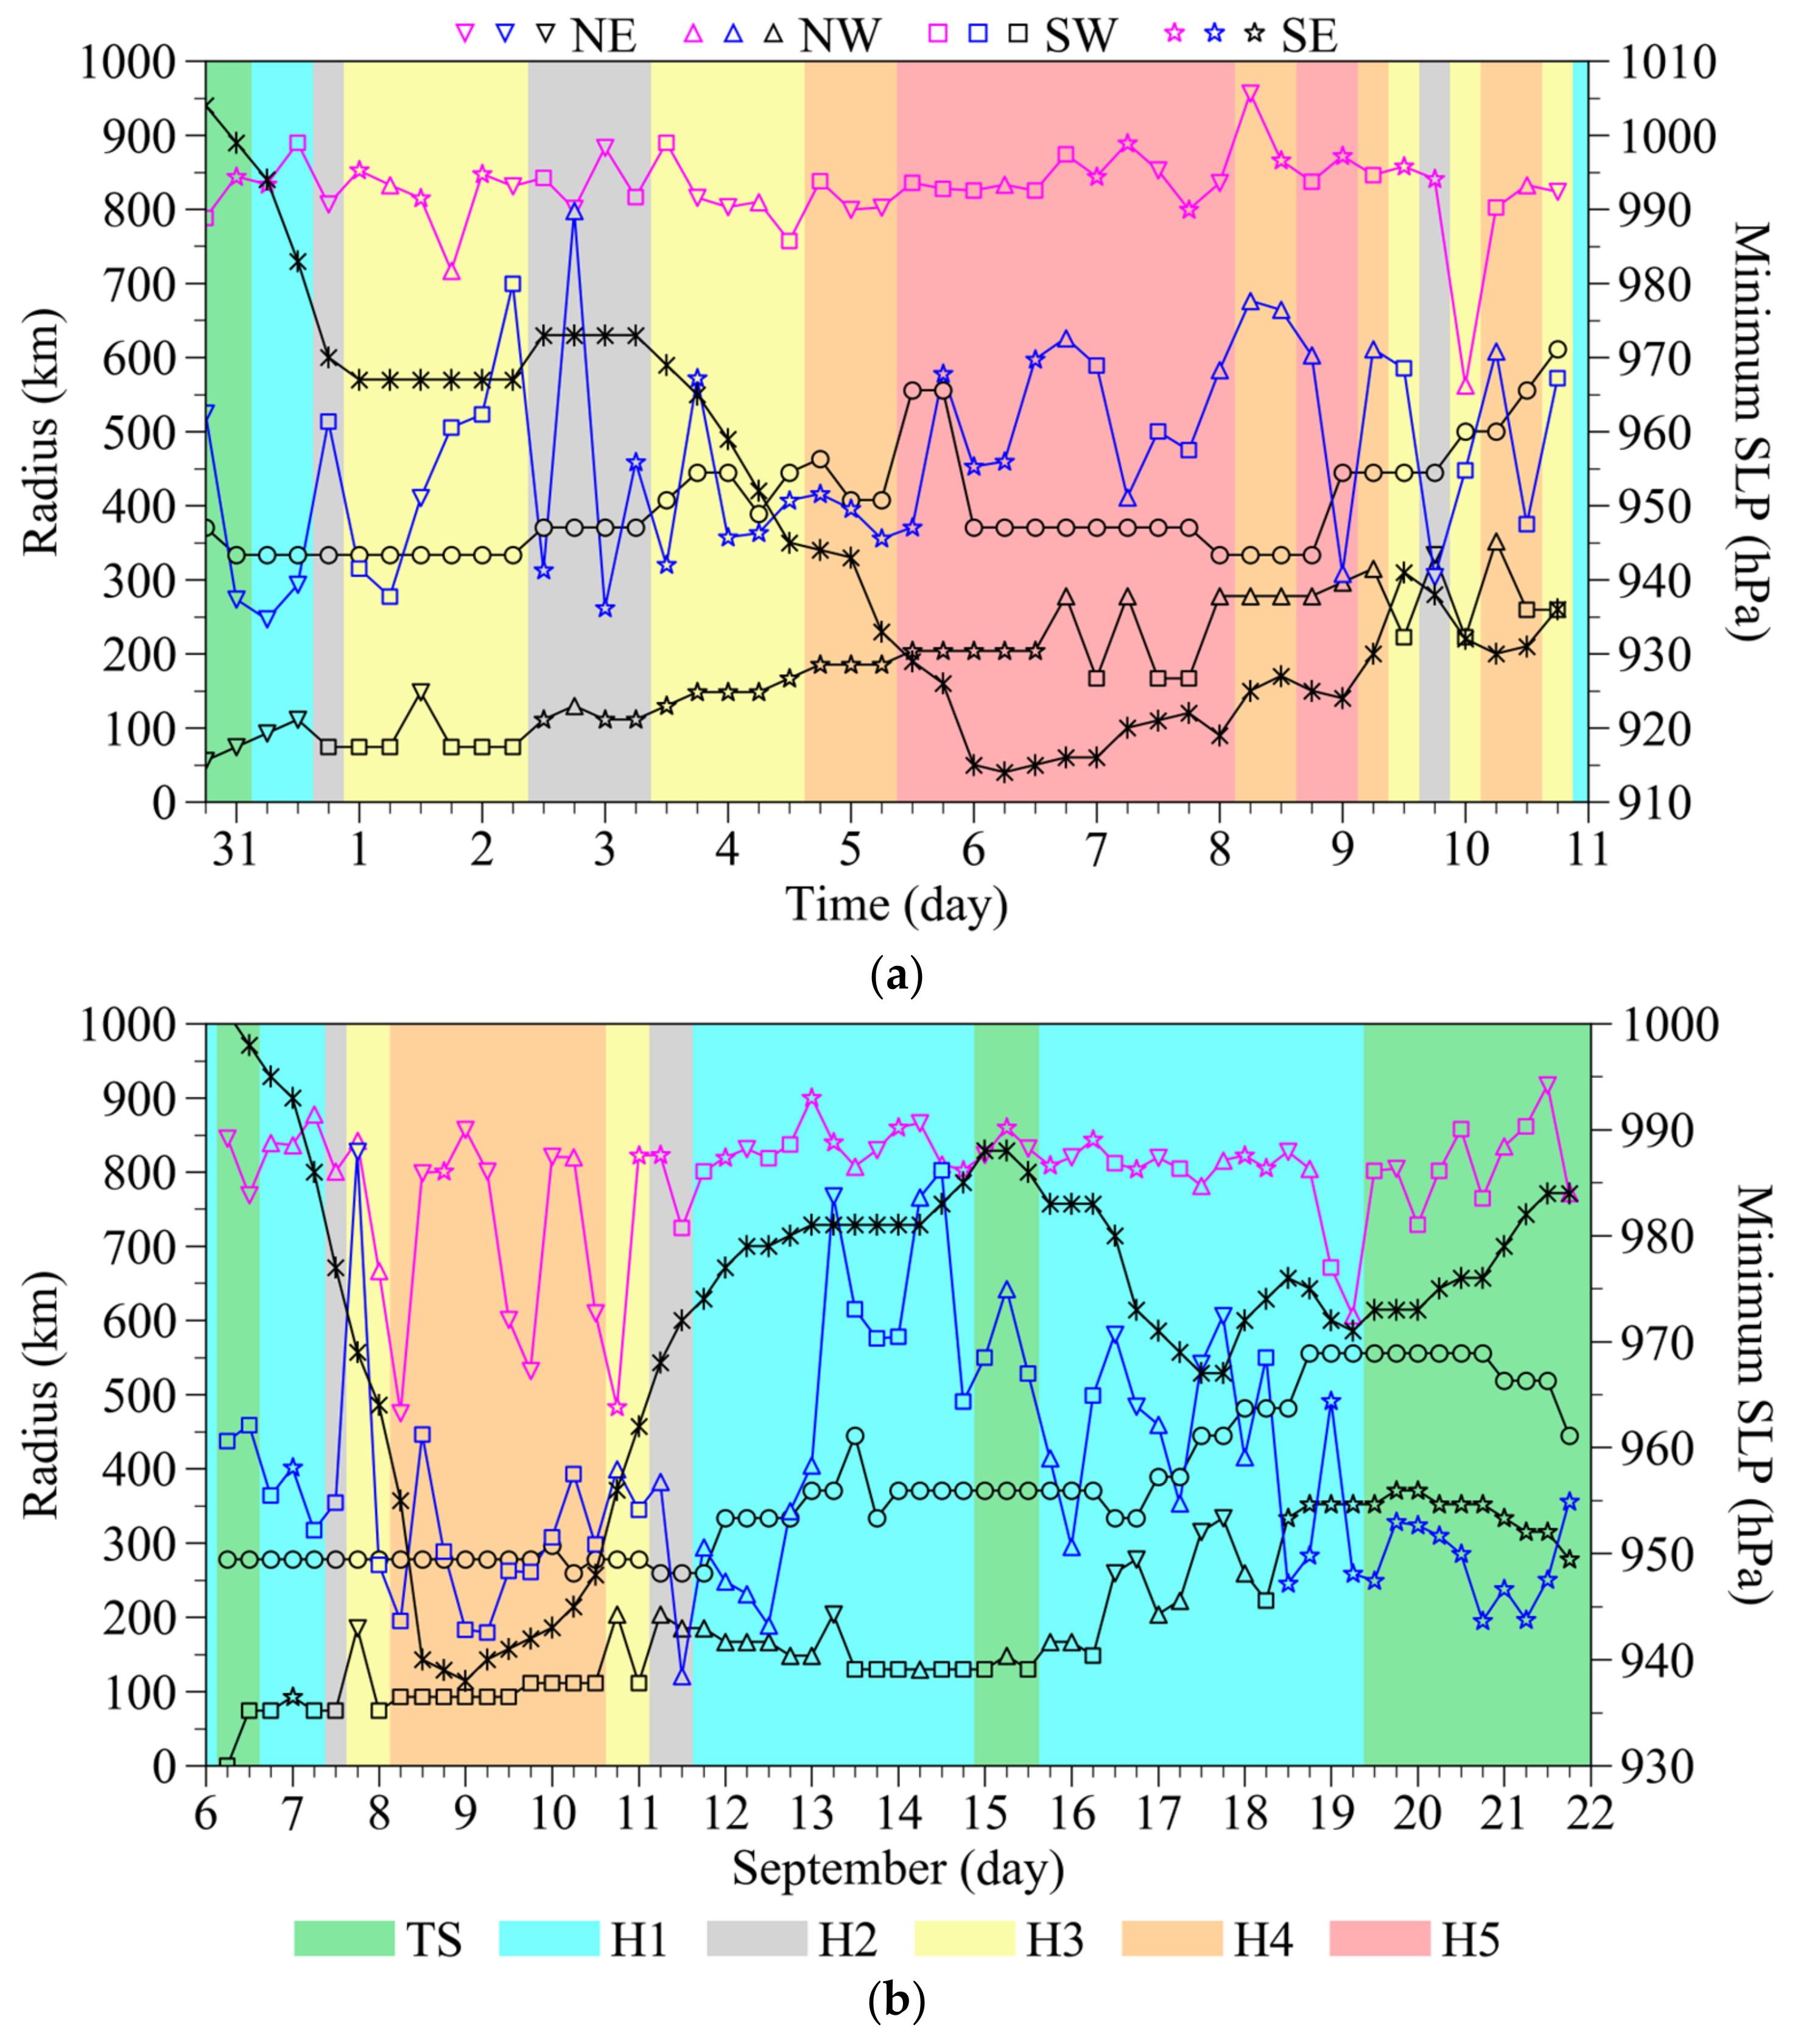
We may compare R
OR and R
IR with R34 and ROCI from the best track data. The temporal evolutions of R
OR, R
IR, R34 and ROCI are shown in
Figure 9a,b for Irma and Jose, respectively. Since the best track data only provides R34 in the four quadrants of northeast, northwest, southwest, and southeast, R
OR and R
IR in
Figure 9 refer to the maximum and minimum radii of the boundaries of the TC cloud area from the ABI-determined TC center in the same four quadrants. It can be seen that the R
OR is much larger than R34 and ROCI. For Irma (
Figure 9a), R
IR and ROCI are nearly the same, but not identical. Both R
IR and ROCI are greater than R34. For Jose (
Figure 9b), R
IR varies greatly with time and is close to ROCI and larger than R34 before 0000 UTC September 13, and then increases rapidly and is larger than R34 and ROCI between 0000 UTC September 13 and 1800 UTC September 15, and then decreases gradually and is smaller than R34 and ROCI after 1200 UTC September 18. The R34 and ROCI are measured based on near-surface wind and SLP, respectively. They are essentially different from R
IR and R
OR, which are estimated by ABI infrared TB observations of GOES-16 to describe the radial extents of TC cloud structures. Therefore, the relationship between them is not necessarily straightforward.
The track of ABI-determined centers at 1 h intervals and the best track at 6 h intervals from 0600 UTC 11 to 0600 UTC September 16, 2017, when Jose made a clockwise loop over the southwestern Atlantic are shown in
Figure 10. The ABI-determined centers and the best track at 1800 UTC 13, 0000 UTC 14, 0600 UTC 14 and 1200 UTC 14 September are indicated for clarity purposes. It is seen that Jose oscillated around the mean path and swung occasionally in a small region, which may be related to the trochoidal oscillation of the TC track pointed out by previous studies [
53,
66,
67,
68,
69,
70,
71]. The environmental steering flow, which is calculated as the deep-layer mean wind [
72,
73] based on the ERA5 winds within a circular area of 500 km radius centered at the ABI-determined center, is also shown in
Figure 10. It is seen that Jose made a clockwise loop mainly under the control of the steering flow, while the small-scale oscillations are not consistent with the direction of the steering flow. Wu and Chen [
74] pointed out that trochoidal oscillations associated with TC motion cannot be explained by the steering flow. Of course, the causes of the hourly oscillations of Jose require further investigation.
In order to further explore relationships among the track, the steering flow, and cloud distributions during the time period when Jose made a clockwise looping track, the spatial distributions of the ABI channel-13 TB observations, and the ERA5 geopotential height at 500 hPa within and around Jose at six selected times, along with the ABI-determined track and the steering flow of Jose at 6 h intervals, are put together in
Figure 11. We see a large area of TB depression and a 500 hPa geopotential low near Jose’ s center. The moving direction of Jose is consistent with the environmental steering flow. Actually, Jose became trapped between the large cyclonic circulation associated with Irma and the flow on the back side of a large mid-latitude closed low system centered off the coast of Atlantic Canada by September 12, 2017. The resulting steering pattern caused Jose to slow down considerably and make a clockwise loop over the southwestern Atlantic through September 16. Before 1200 UTC September 11, Jose moved northwest with a large area of TB depression around the TC center. After 0600 UTC September 12, there is a relatively small region of TB depression, indicating the isolated convection zone appeared northeast of the main TB depression zone. Afterward, Jose began to move northeastward. At 0000 UTC September 13, small discrete convections were separated from the southeast and south sides of the main TB depression zone, and the motion of Jose shifted from going east to southeast. At 1200 UTC September 13, an isolated convection appeared on the south side of the main TB depression zone, and Jose began to move southward. By 0600 UTC September 14, discrete small convections around the south side of the main TB depression zone dissipated, and the motion direction of Jose shifted from southward to westward. After 1800 UTC September 14, Jose restored a large TB depression around its center and kept moving northwest. Thus, it can be seen that the asymmetric convective activities within the TC circulation are associated with the TC movement to some extent, which is consistent with previous studies [
75,
76,
77]. Willoughby et al. [
75] and Holland and Lander [
76] pointed out that the mesoscale convective systems rotating within the TC core can have an impact on the short-term motion of TC. Ritchie and Elsberry [
77] acknowledged the possibility that significant changes of TC track in the order of tens to even hundreds of kilometers over several days could result from an interaction of TC with a persistent mesoscale convective system rotating within TC circulation.
5. Discussions of Symmetric and Asymmetric Components in ABI TB Observations
In order to compare the spatial distributions and amplitudes of symmetric and asymmetric components centered at either the ABI-determined center or the best track center, we selected a case of a 60 km distance between the ABI-determined center and the best track center.
Figure 12a shows the spatial distribution of ABI channel-13 TB observations within and around Hurricane Jose, the ABI-determined cloud boundaries, the ABI-determined center, and the best track at 1000 UTC September 11, 2017. The distance between the ABI-determined center and the best track center is highlighted in
Figure 10.
Figure 12b compares radial variations of percentage amplitude of wavenumbers 0–3 over the sum of wavenumbers 0–10 amplitudes with the ABI-determined center and best track as assumed by Jose’s centers at about 1000 UTC September 11, 2017. Taking the ABI-determined center for spectral analysis, the wavenumber-0 amplitude always accounts for the largest proportion (over 50%) of all wavenumbers’ amplitudes within the 20–300 km radial distance, indicating that the symmetric component dominates the whole pattern of the TC within the 300 km radial distance. The wavenumber-1 amplitude is more than 10% beyond the radial distance of 120 km and keeps a stable value of about 20%. If the best track is used as the center, wavenumber-0 amplitudes are more than 40% larger than that of wavenumber 1 within a 20–100 km radial distance. However, the wavenumber-1 amplitude exceeds the wavenumber-0 amplitude beyond the radial distance of 100 km and keeps a stable value of about 45%. The surpassing of wavenumber-1 to wavenumber-0 amplitudes indicates that the wavenumber-1 asymmetric component dominates the entire pattern of the TC within the corresponding radial distance. By comparison, the amplitude of the wavenumber 0 component (symmetric component) centered on the ABI-determined center is always larger than that of the wavenumber 0 component centered on the best track center, but it is just the opposite for wavenumbers 1 and 3. The amplitude of the wavenumber-2 asymmetric component centered on the ABI-determined center is smaller than that of the wavenumber-2 component centered on the best track center within the radial distance of 100 km, but the amplitudes of the two are very similar outside the radial distance of 100 km.
Figure 13 shows the original TB, filtered TB, and radial gradients of the filtered TB observations along the directions where R
IR and R
OR are determined using the ABI-determined center (
Figure 13a) or the best track center (
Figure 13b) at about 1000 UTC September 11, 2017.
Figure 14 shows the spatial distributions of wavenumbers 0–3 components of ABI channel-13 TB observations around Jose, centered on the ABI-determined center and the best-track center at 1000 UTC 11 September 2017. Also indicated in
Figure 14 are two circles of radii of R
IR and R
OR determined in
Figure 13. For wavenumbers 1–3 asymmetric components centered on the ABI-determined TC center, it is seen that R
IR coincides with the radius where the strongest wavenumber 1 asymmetry is located, and the annulus defined by the two circles of radii of R
OR and R
IR contains the main asymmetries of wavenumbers 1–3, which mainly reflect the asymmetric outer spiral rainbands. Weak wavenumbers 1–3 asymmetries also appear inside the circle at the radius of R
IR, which may be related to the propagation of vortex Rossby waves within the TC inner-core region [
12,
13]. For wavenumbers 1–3 asymmetric components centered on the best track center, the circular region with the radius of R
IR contains the main strong wavenumber 1 asymmetries and some strong wavenumbers 2 and 3 asymmetries. When R
IR is determined based on the ABI-determined TC center, the innermost azimuthal waves of wavenumbers 1–3 are nicely distributed along or within the radial distance R
IR. However, if R
IR is determined based on the best track, the azimuthal waves of wavenumbers 1–3 are found at several radial distances less than R
IR.
The average value of wavenumber-0 amplitudes and maximum wavenumbers 1, 2, and 3 amplitudes from 20 km to the outermost radius R
i of the azimuthal spectral analysis with the ABI-determined center and the best track center as the center of spectral analysis for 45 times of Hurricane Irma and 63 times of Hurricane Jose are shown in
Figure 15. The distances between the ABI-determined center and the best track center are also indicated in
Figure 15. It is seen that the average wavenumber-0 amplitude with the ABI-determined center are consistently larger than or equal to those with the best track center. The larger the average wavenumber-0 amplitude, the smaller center positioning difference. Specifically, the difference is less than 35 km when the average amplitude percentage of the wavenumber 0 component centered on the ABI-determined center (the best-track center) is greater than 60% (50%). The maximum amplitude of the wavenumber-1 component centered at the ABI-determined center is mostly less than or equal to that centered at the best track. Most maximum amplitudes of wavenumbers-2 or -3 components centered on the ABI-determined center and those centered on the best-track center have no obvious difference. Therefore, the amplitudes of wavenumbers 0 and 1 are sensitive to the location of the TC center, while wavenumbers 2 and 3 are fairly robust, which is consistent with the research result of [
7].
6. Conclusions
TB observations on infrared channel 13 (10.3 ) of ABI are used for determining the center positions and rainband sizes of Hurricanes Irma and Jose (2017). The azimuthal spectral analysis method is employed to determine the azimuthally symmetric center of TCs. With the ABI-determined azimuthally symmetric center as the TC center, the radii of inner core rainbands and outer spiral rainbands, namely RIR and ROR, are determined objectively based on radial gradients of TB values at different azimuthal angles in the infrared TB field observed by geostationary satellites, which describe the size of the TC inner-core region and the maximum radial extent of TC rainbands, respectively. The ABI-determined center positions of Hurricane Irma and Jose at 6 h intervals are compared with the best track in order to verify the accuracy of the azimuthal spectral analysis method for TC center positioning. The center position of Jose is determined hourly by the ABI during the period when Jose made a clockwise loop, and the hourly track is found to oscillate around the mean path and swing occasionally in a small region. The moving track, the steering flow, and TC cloud convections during the time period when Jose made a circled track are discussed, suggesting that the turning track of Jose is mainly under the control of steering flow, and mesoscale convective systems rotating within TC circulation can also influence the direction of TC movement to some extent. The ROR determined by TB observations is found to be much larger than the radii of 34 kt near-surface wind and the outermost closed isobar, and RIR is close but not identical to the radius of the outermost closed isobar and usually coincides with the radius where the strongest wavenumber 1 asymmetry is located. The annulus defined by the two circles with radii of RIR and ROR is the asymmetric area of rainbands described by azimuthal wavenumbers 1–3. Finally, the spatial distributions and amplitudes of symmetric and asymmetric components centered at the ABI-determined center and the best-track center are compared. The innermost azimuthal waves of wavenumbers 1–3 are well distributed along or within the circumference of RIR that is determined based on the ABI-determined TC center. If RIR is calculated using the best track, the azimuthal waves of wavenumbers 1–3 can be found at several radial distances less than RIR. Besides, it is found that the larger the average wavenumber-0 amplitude, the smaller the difference between the ABI-determined center and the best-track center. The average amplitude of the wavenumber-0 (wavenumber-1) component centered on the ABI-determined center is always greater (smaller) than or equal to that centered on the best-track center.
The center position and rainband sizes of TCs estimated by the infrared TB observations from GOES-16 in this study can be used as the parameters required by specifying a bogus vortex for hurricane initialization and meeting the requirements of verifying the propagation mechanism of vortex Rossby waves by satellite observations. The azimuthal spectral analysis method for TC center positioning requires a TC intensity of 25 m s
−1 or above in this study to ensure that the whole pattern of a TC is dominated by the symmetric component. The scenario where the asymmetric component dominates the whole pattern of a TC needs further study. The relationship between the radius of the inner core rainband measured in this study and the TC intensity has not been explored. Considering that TC intensity is usually not closely related to a single TC size parameter [
8], more parameters that can describe the size of a TC, such as the TC eye diameter, should be estimated by geostationary satellites to explore the relationship between TC size and intensity in the future. The TB observations provided by geostationary satellites with high temporal and horizontal spatial resolution can fully reveal the horizontal spatial structures of TCs and the evolution of TC cloud structures over time, which lays the observation foundation for our future focus on the verification of the propagation mechanism of vortex Rossby waves in TCs by geostationary satellite observations.


