Article

Contributions of Climatic and Anthropogenic Drivers to Net Primary Productivity of Vegetation in the Mongolian Plateau

1
College of Geographical Science, Inner Mongolia Normal University, Hohhot 010022, China
2
Inner Mongolia Key Laboratory of Remote Sensing and Geographic Information Systems, Inner Mongolia Normal University, Hohhot 010022, China
*
Author to whom correspondence should be addressed.
Remote Sens. 2022, 14(14), 3383; https://doi.org/10.3390/rs14143383
Submission received: 25 May 2022 / Revised: 25 June 2022 / Accepted: 12 July 2022 / Published: 14 July 2022

Abstract

:
Global warming and intense human activity are altering the net primary productivity (NPP) of vegetation in arid and semi-arid regions where vegetation ecosystems are sensitive to climate change, including the Mongolian Plateau (MP). To deepen the understanding of the dynamics of vegetation and its driving factors on the MP, the actual NPP (ANPP) of the MP from 2000 to 2019 was estimated based on a modified Carnegie–Ames–Stanford Approach (CASA) model. The Thornthwaite Memorial and Guangsheng Zhou models were applied concurrently to estimate the potential NPP of the vegetation, and different scenarios were constructed to evaluate quantitatively the impact of climate change and human activity on the vegetation productivity of our study area. The results showed that the carbon sequestration capacities of various vegetation types in the MP differ, with forest > cropland > grassland > wetland. The NPP increased significantly during 2000–2019. Most areas showed a continuous and stable change in vegetation ANPP, with the current trend in variation mainly reflected in the continuous improvement of vegetation. In general, restoration of vegetation was prominent in the MP, and human activities affected more than 30% of vegetation restoration. The ANPP was positively correlated with temperature and precipitation, the latter of which had a more significant effect. Desertification management, restoration of cropland to forest and grassland, afforestation and reasonable grazing activities were the main human activities performed to restore vegetation. This study is expected to advance the theoretical understanding of ecological protection and sustainable development in the MP.

Graphical Abstract

1. Introduction

The net primary productivity (NPP) of vegetation is expressed as the difference between the total amount of organic matter generated by the photosynthesis of vegetation in the ecosystem and amount of autotrophic respiration carried out by vegetation [1]. Vegetation NPP represents the carbon sequestration by an amount of vegetation per unit of time and space, directly reflecting the nutrient and energy storage potential of the terrestrial ecosystem [2], and is a key factor for estimating the carbon storage of vegetation. Vegetation NPP is a critical element of climate change studies [3] and ecosystem carbon balance, and is used to assess the health status and degree of sustainable development within an ecosystem. Currently, due to the dual influence of global warming and human intervention, the degree of surface greening and the extent of the carbon sink has increased [4]. Accordingly, studying the spatiotemporal evolution characteristics of vegetation NPP and its influencing factors can provide an important theoretical reference for ecological environment protection and the rational development and utilization of natural resources.
Direct observation and model estimation are the main requirements for estimating the NPP of vegetation [5,6]. In research, model estimations have frequently been used because they are able to better describe the dynamics of NPP in large areas [7]. Models commonly employed for estimating NPP include the climate model, light use efficiency model and ecological process model. Among these, the Miami model, Thornthwaite Memorial (TM) model and Guangsheng Zhou (ZGS) model [8,9] are realized by simulating the ideal environment of vegetation growth and identifying relationships between temperature, precipitation and vegetation NPP. Thus, the estimated value is usually considered the potential NPP (PNPP) of vegetation. The Carnegie–Ames–Stanford Approach (CASA) model, as one of the most representative models of light use efficiency, has been widely applied for simulating the actual NPP (ANPP) of vegetation. This model is achieved by introducing photosynthetically active radiation (PAR) and maximum light use efficiency of vegetation, which are two important factors affecting vegetation photosynthesis [10,11].
Meanwhile, various scholars have investigated the spatiotemporal changes in vegetation NPP and its influencing factors in different regions of the world [12,13,14]. Temperature and precipitation are closely related to ecological activities including photosynthesis and the respiration of vegetation [12]. These two factors have been analyzed in the study of the effect of climate change on NPP [12,13]. Recently, residual statistics have been obtained and model analysis performed to distinguish quantitatively the impact of climate change and human activity on vegetation NPP. Jiang et al. [14] obtained and interpreted residual statistics to quantify the impact of climate factors and human activities on vegetation NPP in Xinjiang. However, when analyzing the impact of climate change on NPP, this method did not exclude areas affected by mainly human activities [15,16]. The latest studies show that the construction of models for determining vegetation ANPP and PNPP and indicating their relationship can better reflect the impact of climate change and human activities on vegetation NPP [17]. Compared with simple linear statistical methods such as residual statistics, model analysis can quantitatively distinguish the impact of human activities and climate change on vegetation NPP, in addition to considering additional factors affecting vegetation growth [18]. For example, Abdelrahim et al. [19], by analyzing the PNPP and the Moderate Resolution Imaging Spectroradiometer (MODIS) NPP differences simulated by the TM model, found that human activities were the main driving force of vegetation degradation in eastern Sudan. In addition, assessment scenarios based on the relationship between PNPP and ANPP have been widely applied to differentiate between the contributions of human factors and climate change towards vegetation change [10]. By establishing the relationship between ANPP and PNPP, Tian et al. [17] clarified that grassland restoration in the Altay region has been caused primarily by human activities. Chen et al. [20] estimated vegetation NPP based on the CASA and ZGS models, and quantified the contribution of human activities to the NPP of vegetation in China.
The Mongolian Plateau (MP) is located in a typical arid and semi-arid region, and has a fragile ecological environment and poor stability in its ecosystem structure. Therefore, it is very sensitive to environmental changes. Studies have shown that arid and semi-arid areas are likely to experience more obvious warming, more frequent droughts and increasingly serious water scarcity, resulting in more fragile ecosystems and decreased vegetation productivity [21]. Therefore, given global warming and the increasing impact of human activities, it is particularly important to analyze the changes in vegetation NPP in the MP, and also the NPP response mechanism to the changing environment. Zhao et al. [22] used residual analysis and a linear regression model to identify the impact of climate and non-climate factors on vegetation NPP in the MP from 2000 to 2015. They clarified the positive effect of climate change on vegetation NPP and highlighted the importance of human activities for vegetation restoration. Based on a modified CASA model and partial correlation analysis, Bao et al. [23] explored the changes in the characteristics of vegetation NPP in Mongolia from 1982 to 2015, as well as vegetation NPP response to precipitation and temperature changes. They suggested that the modified CASA model has better applicability in this region.
Although some progress has been achieved in the study of vegetation NPP and its influencing factors in the MP, relatively few studies have compared different models to quantitative analyze the impact of climate change and human activities on vegetation NPP in the region. In this study, to evaluate quantitatively the impact of climate change and human activities on the dynamics of NPP in the MP, the ANPP of vegetation in the MP from 2000 to 2019 was estimated using the modified CASA model. The TM and ZGS models were employed to estimate the PNPP. Furthermore, different scenarios were constructed to delineate the domains of climate change and human activity. Specifically, the objectives of this current study were (1) to simulate the ANPP using an improved CASA model and explore its spatiotemporal variations; (2) to delineate areas where variations in vegetation are caused by human activities and climate change, respectively; and (3) to quantify the effects of climate change and human activities on vegetation ANPP. Additionally, consideration was given to differences among vegetation types. This study helps to reveal the contributions of climate change and human activity to variations in vegetation, and to provide a theoretical reference for ecological protection and sustainable development in the MP.

2. Study Area

The MP, a typical arid and semi-arid region, is located in the hinterland of Eurasia (87°43′–126°04′E, 37°22′–53°23′N). It covers Mongolia and the Inner Mongolia Autonomous Region of China (hereafter, Inner Mongolia) and has an area of about 2.75 × 10⁶ km2 [24]. The MP is surrounded by the Altay Mountains and Hangay Uul in the west, Sajan and Kente Mountains in the north, Greater Khingan Mountains in the east, and the Yin Shan in the south. The overall terrain is high in the west and low in the east (Figure 1a), with altitude ranging between 92 and 3971 m and an average altitude of 1291 m. The study area has a temperate continental climate, with an average annual precipitation of 50–400 mm, mainly concentrated between June and August. The average annual temperature ranges from −10.9 to 11.4 °C, and the temperature in the north is lower than that in the south. Abundant land cover types are present in our study area (Figure 1b). These are divided into nine cover types, according to the global 30 m land cover products released by the Aerospace Information Research Institute, Chinese Academy of Sciences. The main land cover types include cropland, grassland, broad-leaved forest, coniferous forest, mixed forest, shrubland and wetland, which account for 7.1%, 70%, 6.7%, 9.4%, 0.1% and 5.7%, respectively, of the vegetated areas of the MP.

3. Data and Methodology

3.1. Data

Normalized difference vegetation index (NDVI) data was used in this study, from the MOD13A1 dataset provided by NASA (https://lpdaacsvc.cr.usgs.gov/appears/ (accessed on 8 March 2021)), with a spatial and temporal resolution of 500 m/16 days, respectively. Monthly and annual NDVI datasets of the MP have been generated by the maximum synthesis method since 2000. Solar radiation data (https://www.environment.snu.ac.kr/bess-rad (accessed on 26 March 2021)) is PAR data produced by the Breathing Earth System Simulator (BESS), referred to as BESS PAR for short, with a spatiotemporal resolution of 0.05°/day. Previous studies have verified the global and Inner Mongolia data by using station data, and the results demonstrated that the product had high accuracy (R > 0.80) [25] and can be applied to related studies on different scales. For classification of vegetation type, GLC_FCS-2015 was adopted, a fine classification product of global 30 m land cover (http://data.casearth.cn/sdo/detail/5d904b7a0887164a5c7fbfa0 (accessed on 8 March 2021)), which was released by the Aerospace Information Research Institute, Chinese Academy of Sciences, in 2015. This provides land cover status for all continents in the world except Antarctica [26]. Temperature and precipitation data were taken from the ERA5 reanalysis product provided by the European Center for Medium-Range Weather Forecasts (https://cds.climate.copernicus.eu/cdsapp#!/search?Type=dataset (accessed on 7 March 2021)), with spatial and temporal resolution of 0.1°/month. This data has high accuracy and a good application foundation in arid and semi-arid areas [27]. Mask processing was conducted for the non-vegetation coverage area (NDVI < 0.1), as shown in the final results.
Additionally, to verify the accuracy of the simulated ANPP, the biomass data of 264 sample sites, obtained from field investigation in Inner Mongolia from 2002 to 2011 [28], were used to verify the simulation results. The samples were 1 m × 1 m in size, and the sampled point coordinates, timing and attribute information were imported into ArcGIS to generate the sampled points’ vector files. Figure 1b presents the distribution of sample points. Concurrently, MCD12Q1 vegetation classification data for 2000 and 2019 (with spatial and temporal resolution of 500 m/year (accessed on 8 March 2021)), gathered by the International Geosphere-Biosphere Programme (IGBP), were selected and redivided into five types, i.e., forest, grassland, cropland, city and sandy land, to reflect the change in direction of the plateau’s land-cover types. Using the biomass density data for cattle, horse, sheep and goats with a spatial resolution of 0.08° published in 2010 by the Livestock System of the Food and Agriculture Organization of the United Nations (UN FAO, https://data.apps.fao.org/ (accessed on 13 March 2021)), the distribution of grazing activities was analyzed.

3.2. Methodology

3.2.1. Data Pre-Processing

The various data gathered for the MP had different spatial and temporal resolutions. To ensure consistency between different data sources, we pre-processed the NDVI, BESS PAR, vegetation type, temperature, and precipitation data. The maximum value synthesis method was used to generate the monthly maximum NDVI data. Daily solar radiation data were obtained as cumulative values to extract the monthly total solar radiation dataset. The 2000 and 2019 MCD12Q1 data were analyzed by overlaying using a raster calculator tool in ArcGIS 10.5, to obtain a map depicting the change in land-cover types in the MP. To compare the density of live animals during grazing activities, we converted the livestock numbers provided by the FAO into cattle units to generate a spatial distribution map of livestock cattle (head/ha), with corresponding conversion factors for other animals: one horse = 1.25 cattle, one goat = 0.2 cattle and one sheep = 0.25 cattle. These data were pre-processed through format conversion, projection transformation, clipping and resampling (nearest neighbor method) to generate data in the TIFF format. Subsequently, they were unified into the WGS84 coordinate system in accordance with the BESS PAR spatial resolution (0.05°) to obtain the input parameters of each model and to analyze the results of the study.

3.2.2. ANPP Estimation

The modified CASA model has been widely used in arid and semi-arid regions as the main method for estimating the ANPP of vegetation [5,23]. The model was constructed based on vegetation type, NDVI, temperature, precipitation and solar radiation data, mainly determined by the PAR absorbed by vegetation and the light use efficiency. The following equation describes the model-derived ANPP:
A N P P ( x , t ) = P A R ( x , t ) × ε ( x , t )
where A N P P ( x , t ) , P A R ( x , t ) and ε ( x , t ) represent the actual NPP of vegetation (gCm−2), PAR absorbed by vegetation, and the actual light use efficiency of pixel x at time point t, respectively. From these, P A R ( x , t ) is calculated as follows:
P A R ( x , t ) = S O L ( x , t ) × F P A R ( x , t ) × 0.5
F P A R ( x , t ) = min [ S R S R m i n S R m a x S R m i n , 0.95 ]
S R ( x , t ) = 1 + N D V I ( x , t ) 1 N D V I ( x , t )
where S O L ( x , t ) and F P A R ( x , t ) represent the absorption ratios of total solar radiation and PAR by vegetation, respectively; S R represents the ratio vegetation index; S R m i n and S R m a x represent the percentiles of the NDVI of a certain vegetation type at 5% and 95%, respectively.
ε ( x , t ) = T ε 1 ( x , t ) × T ε 2 ( x , t ) × W ε ( x , t ) × ε m a x
where T ε 1 ( x , t ) and T ε 2 ( x , t ) represent the influence of temperature on the utilization rate of light energy; W ε ( x , t ) reflects the effect of water stress on light use efficiency; ε m a x represents the maximum light use efficiency that vegetation can achieve under ideal conditions.

3.2.3. PNPP Estimation

The ZGS and TM models were used to estimate vegetation PNPP. The ZGS model is a comprehensive natural vegetation NPP model devised by Guangsheng Zhou and Zhang Shixin, based on 23 groups of natural vegetation data and corresponding meteorological data obtained by Efimova during the International Biology Program [20]. The calculation method is as follows:
P N P P Z G S = R D I r R n ( r 2 + R n 2 + r R n ) ( R n + r ) ( R n 2 + r 2 ) exp [ ( 9.87 + 6.25 R D I ) 0.5 ] × 100
R D I = 0.629 + 0.237 p e r 0.00313 p e r 2
R n = R D I × r × l × 2.38 × 10 4
p e r = p e t r = 58.93 × B T r
B T = { 30 12 ,   T > 30 T 12 , 0 < T < 30 0 , T < 0
where P N P P Z G S represents the potential NPP of vegetation (gCm−2) estimated by the ZGS model; R D I represents radiation dryness; Rn represents the net amount of radiation obtained from the land surface, its unit being Jm−2a−1; p e r represents the ratio of average annual potential evapotranspiration p e t to average annual precipitation r ; l represents latent heat evapotranspiration 2503 J/g; B T represents the average annual biological temperature; T represents the monthly average temperature between 0 and 30 °C.
The TM model is based on the Miami model by Lieth, which provides an improved description of the relationship between evapotranspiration, temperature, precipitation and vegetation, thereby offering a more accurate estimation of the PNPP [29]. The equation that describes the model is as follows:
P N P P T M = 3000 × [ 1 + e 0.0009695 ( E 20 ) ]
E = 1.05 r 1 + ( 1 + 1.05 r L ) 2
L = 2000 + 25 T + 0.05 T 3
where represents the potential NPP of vegetation estimated by the TM model, its unit being gCm−2; E represents annual actual evapotranspiration, its unit being mm; r and L represent annual precipitation and maximum evapotranspiration, respectively, their units being mm; T represents the annual average temperature, its unit is °C.

3.2.4. Trend Analysis

In this study, the slope of the regression equation was used to express the changing trends of different elements in the study period, analyze the changing trend of vegetation NPP, and build a scenario analysis model. The equation is as follows:
s l o p e = n × i = 1 n i × X i i = 1 n i i = 1 n X i n × i = 1 n i 2 ( i = 1 n i ) 2
where s l o p e represents the slope of the trend line; n represents the cumulative number of years of the study time series; X i represents the value of the element in year i .

3.2.5. Hurst Index

The Hurst exponent was proposed by the hydrologist Hurst, based on the analysis method of the rescaled range (R/S). It can effectively describe the persistence of time series changes [30]. The index is widely used in hydrology, climatology, economics and other fields [31], and the application of the method used in our study was as follows:
(1) The vegetation { N P P ¯ ( τ ) } ( τ = 1 ,   2 ,   ,   n ) in 2000–2019 was divided into τ subsequences X ( t ) ; t = 1, 2, …, τ.
(2) The mean value of each time series of NPP is defined as follows:
N P P ¯ ( τ ) = 1 τ t τ N P P ( τ )   τ = 1 ,   2 ,   ,   n
(3) The cumulative deviation of the pixel-by-pixel NPP was calculated, and the range of range R ( τ ) and standard deviation sequence S ( τ ) are defined:
X ( t ) = t = 1 t ( N P P ( t ) N P P ¯ ( τ ) )
R ( τ ) = max 1 t τ X ( t ,   τ ) max 1 t τ X ( t ,   τ )     τ = 1 ,   2 ,   ,   n
S ( τ ) = [ 1 τ t τ ( N P P ( t ) N P P ( τ ) 2 ) ] 1 / 2     τ = 1 ,   2 ,   ,   n
(4) The Hurst exponent H was calculated as follows:
R ( τ ) S ( τ ) = c τ H
An H of >0.5 indicates a sustainable change in the NPP time series; an H of <0.5 indicates that in the future the NPP may show an opposite trend to the current one; H = 0.5 indicates a random trend in NPP. In combination with the slope obtained, the sustainability of NPP changes was classified as a sustainable and significant increase (H > 0.5, slope > 0, p < 0.05), a sustainable and slight increase (H > 0.5, slope > 0, p > 0.05), a reversely sustainable increase (H < 0.5, slope > 0), a sustained and significant decrease (H > 0.5, slope < 0, p < 0.05), a sustained and slight decrease (H > 0.5, slope < 0, p > 0.05) or a reversely sustainable decrease (H < 0.5, slope < 0).

3.2.6. Quantification of the Impacts of Climate Change and Human Activities on ANPP

To clarify the contribution of climate change and human activities to vegetation NPP in the MP from 2000 to 2019, this study defined HNPP as vegetation NPP under the influence of human activities. The difference between ANPP and PNPP caused by human activities is calculated as follows:
H N P P = P N P P A N P P
Determining the change in trends of ANPP, PNPP and HNPP helps to distinguish the relative effects of climate change and human activities on vegetation restoration and degradation, and the impacts of human activities and climate change on vegetation NPP. Table 1 presents the assessment scenarios. SANPP > 0 indicates that ANPP increases and vegetation recovers, whereas SANPP < 0 indicates that ANPP decreases and vegetation degenerates; SPNPP > 0 means that climate change is beneficial to vegetation restoration, and SPNPP < 0 means that climate change results in vegetation degradation; SHNPP > 0 indicates that human activities lead to vegetation degradation, and SHNPP < 0 indicates that human activities are beneficial to vegetation growth.

3.2.7. Partial Correlation Analysis

After excluding vegetation in the MP affected by human activities, partial correlation analysis was performed to calculate the partial correlation coefficient between climate change and vegetation ANPP, and to explore their relationship in the MP. First, the correlation coefficients between ANPP and climate factors were calculated as follows:
R x y = i = 1 n [ ( x i x ¯ ) ( y i y ¯ ) ] i = 1 n ( x i x ¯ ) 2 i = 1 n ( y i y ¯ ) 2
where Rxy represents the correlation coefficient between vegetation ANPP and temperature and precipitation; xi represents the ANPP value of vegetation in the first year, and yi represents the average temperature or accumulated precipitation in the corresponding year; x ¯ represents the average ANPP of vegetation in 2000 and 2019; y ¯ represents the average temperature or accumulated precipitation in the corresponding period; n represents the length of the study period. The partial correlation coefficient is calculated as follows:
R A N P P , P , T = R A N P P , P R A N P P , T R P T ( 1 R A N P P , T 2 ) + ( 1 R P T 2 )
R A N P P , T , P = R A N P P , T R A N P P , P R P T ( 1 R A N P P , P 2 ) + ( 1 R P T 2 )
where RANPP,P,T represent the partial correlation coefficient of vegetation ANPP and precipitation P after removing the influence of temperature, and RANPP,P,T represent the partial correlation coefficient between vegetation ANPP and temperature T after removing the influence of precipitation; RANPP,T, RANPT,P and RP,T represent the correlation coefficients between vegetation ANPP and precipitation, vegetation ANPP and temperature, and temperature and precipitation, respectively.

4. Results and Discussion

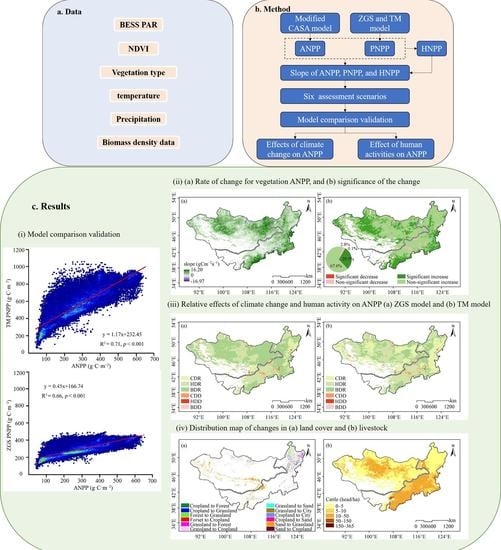
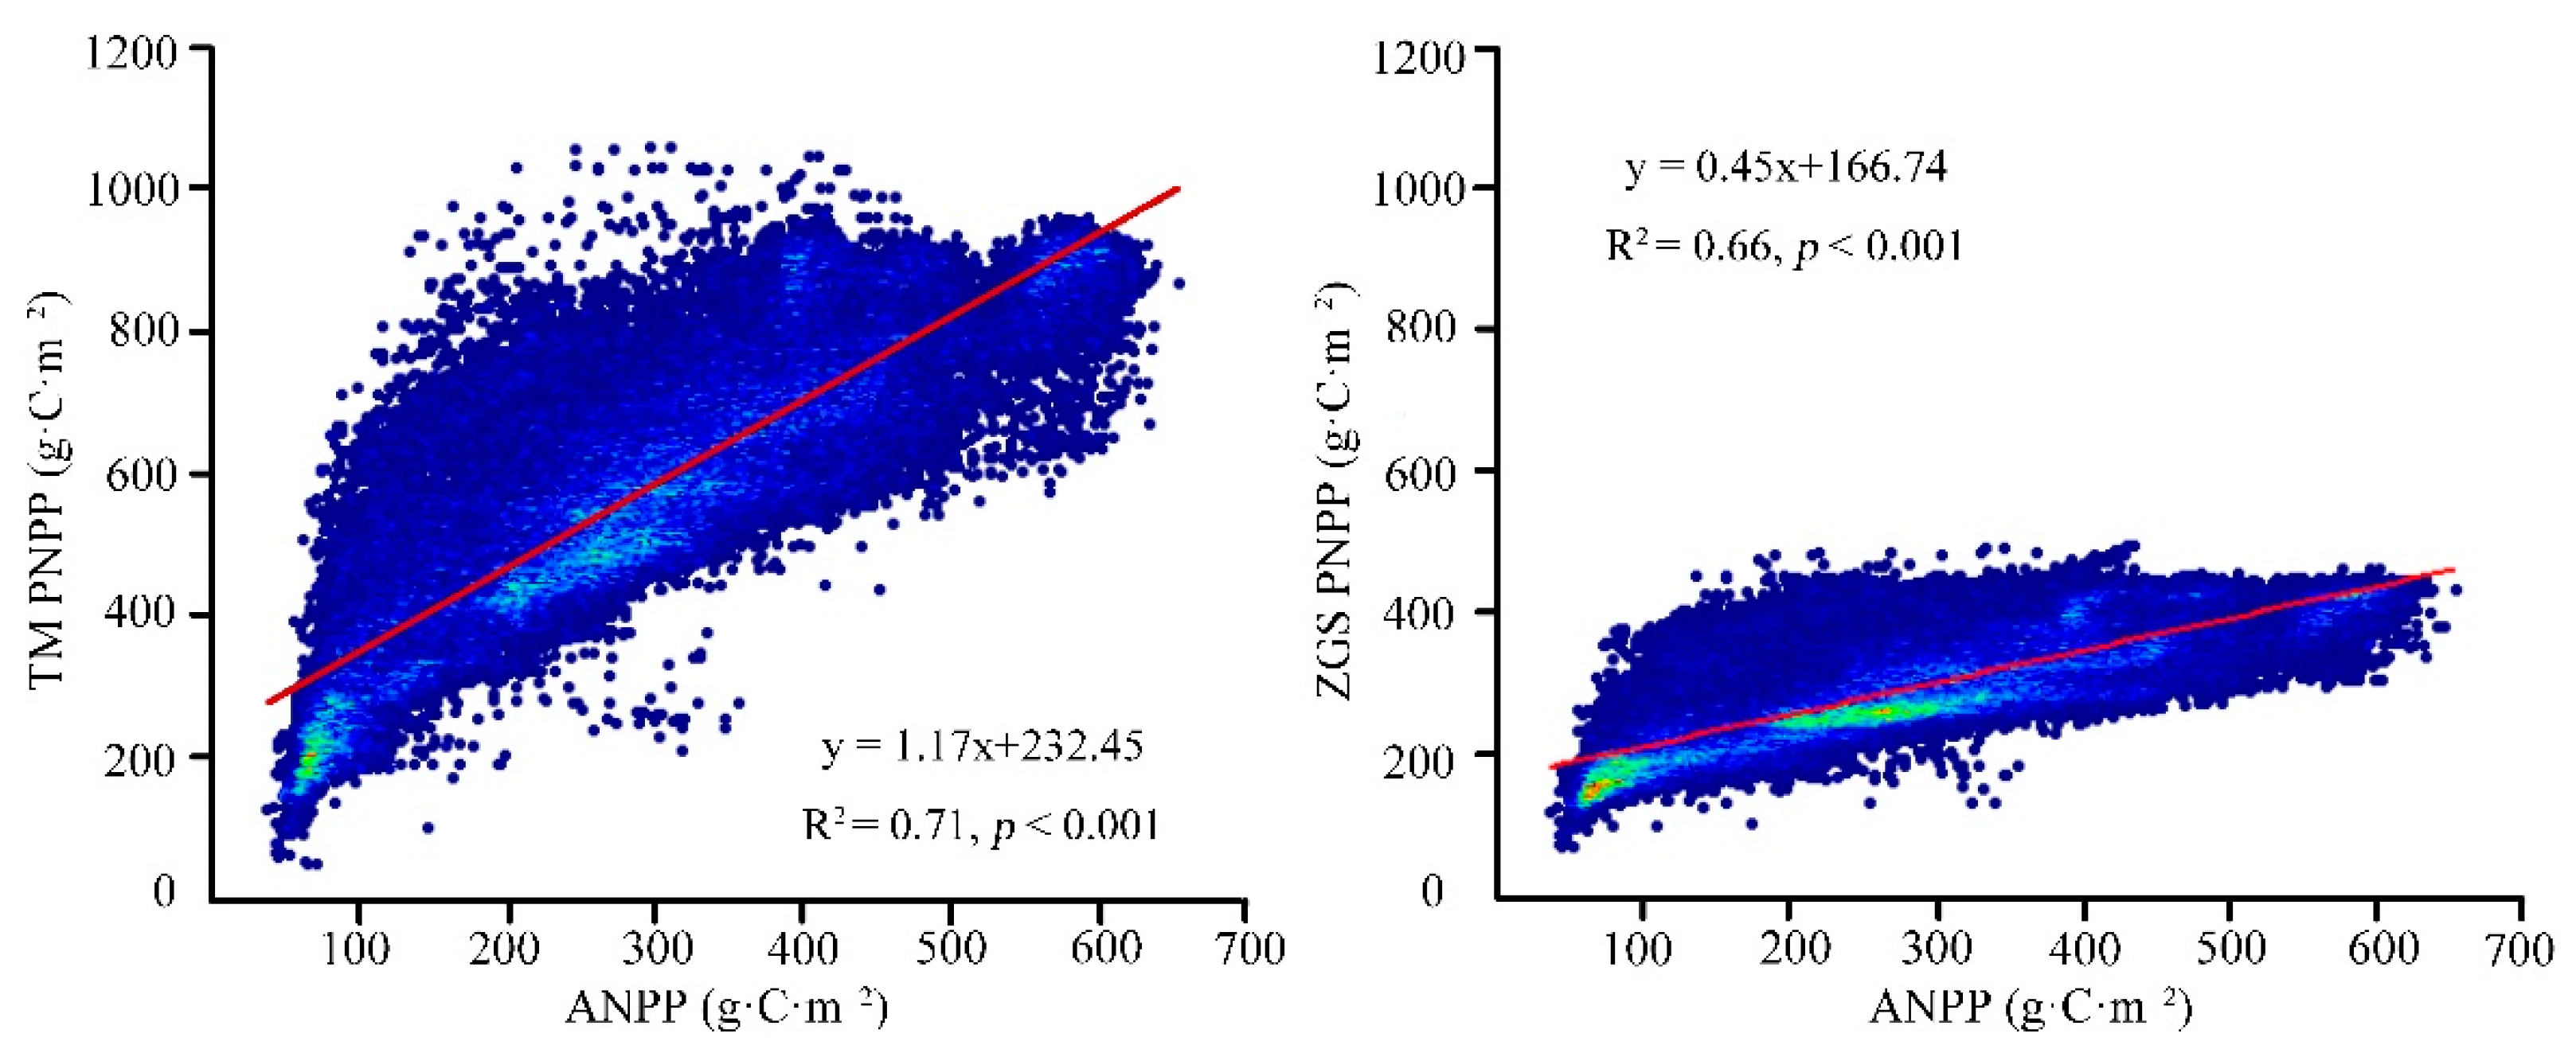
4.1. Verification of the Simulation Accuracy of ANPP and PNPP

To verify the accuracy and applicability of the modified CASA model in the MP, the data for 2002 to 2011 from 264 sampling points [28] were selected and compared with the simulated data for corresponding points. The results showed that the coefficient of the correlation between observed data and simulated data was 0.76 (Figure 2), and it also passed the significance test (p < 0.01). This indicates that the modified CASA model has good applicability in the MP, and the simulated value can reflect the distribution of and change in vegetation ANPP in this area. Therefore, the vegetation ANPP simulated by the modified CASA model can be further used in this current study to analyze the relationships between ANPP, climate change and human activity. Importantly, ANPP was generally underestimated by the modified CASA model, which may be due to the mismatch between the measured sample size and the remote sensing data pixels [13]. Additionally, unifying the remote sensing data input to a spatial resolution of 0.05° may diminish some details of the data and make the simulation results less certain. Therefore, evaluation and screening of the accuracy of multi-source data used in the ANPP simulation was necessary, to reduce the uncertainty of the simulation results.
Comparison of the PNPP and ANPP in areas of climate change-induced vegetation change revealed that the correlation coefficients of the TM PNPP with ANPP was 0.71, and that of the ZGS PNPP with ANPP was 0.66 (Figure 3). The simulated PNPP of the TM model showed a noticeably better fit to the ANPP than the simulated PNPP of the ZGS model. Because the temperature parameter used in the ZGS model for simulating the PNPP was 0–30 °C, that model underestimated the PNPP in its simulation. The PNPP simulated by the TM model was more in line with the actual situation. Thus, the simulation results of the TM model were used to determine the relative impact areas of climate change and human activity.

4.2. Characteristics of the Spatiotemporal Variation in Vegetation NPP

The annual average ANPP of the MP showed obvious spatial heterogeneity, with a spatial distribution pattern that increased from southwest to northeast in general (Figure 4). Additionally, obvious differences in ANPP were found to exist in different vegetation areas of the MP (Figure 5a). These were observed as follows: broad-leaved forest (562.43 gCm−2) > mixed forest (492.98 gCm−2) > coniferous forest (357.96 gCm−2) > cropland (316.67 gCm−2) > grassland (271.66 gCm−2) > wetland (203.14 gCm−2) > shrub (99.11 gCm−2). These differences were consistent with the existing findings in the literature [5]. The NPP of vegetation in the Sajan Mountains, Hangay Uul, Kente Mountains, and Greater Khingan Mountains in the north and northeast of the study region was above 350 gCm−2, in excess of the annual average ANPP of the plateau (263.46 gCm−2). The forests distributed in these areas are affected by a marine climate, receive water supply, and have higher vegetation coverage, a complex ecosystem, stronger photosynthesis and the highest ANPP values [32,33]. Meanwhile, cropland located in the east and southeast of Inner Mongolia is a flat area with low altitude. The hydrothermal conditions are relatively good, which is conducive to irrigated agriculture. Cropland ANPP has been greatly affected by human activity. Although the capacity of cropland for carbon sequestration is not as high as that of forest, it is stronger than that of grassland [33]. In the transitional zone of the desert steppe, shrubs, and grassland in the west, middle, and south of the study area, the NPP of sparse vegetation was found to be relatively low, less than 150 gCm−2. Impacted by dry conditions, the coverage of grassland vegetation is low; its growing season is short, and vegetation productivity is low [34]. Shrub is mostly located in the border zone between bare land and grassland, and has the lowest productivity, which may be due to its unstable living environment and fragile ecosystem.
From 2000 to 2019, the annual average ANPP of the vegetation in the MP varied between 215.15 gCm−2 and 297.33 gCm−2. The significant overall increase in vegetation ANPP involved a change of 2.12 gCm−2a−1 (p < 0.05). the highest annual average vegetation ANPP was in 2018, when it reached 297.33 gCm−2, and it was the lowest in 2001, reaching 263.46 gCm−2 (Figure 5c). Increasing ANPP trends were found for different vegetation types (Figure 5b). Except for broad-leaved forest and mixed forest, the increase trends of ANPP for different vegetation types passed the significance test (p < 0.05). The following are the rates of change for other vegetation types, ordered from high to low: cropland (3.07 gCm−2a−1) > grassland (2.44 gCm−2a−1) > broad-leaved forest (2.35 gCm−2a−1) > coniferous forest (1.78 gCm−2a−1) > wetland (1.69 gCm−2a−1) > mixed forest (1.57 gCm−2a−1) > shrub (1.05 gCm−2a−1). Croplands are the most vulnerable to human activities; thus, their ANPP showed the greatest fluctuation [35]. Forest ecosystems have many species, with complex and complete community structures, which may differ according to the forest type. Additionally, forest ecosystems are stable and resistant to external disturbances, and annual changes in their vegetation productivity are also relatively stable [32,36].
Spatially, the rate of change of ANPP in the MP ranged from −16.97 to 16.20 gCm−2a−1, and the spatial differences were distinct (Figure 6a). Areas with increasing trends of vegetation ANPP significantly outnumbered those with decreasing trends, indicating that most vegetation was in a state of recovery. Earlier studies have shown that vegetation productivity will continue to increase with climate change in the high latitudes of the Northern Hemisphere, verifying our findings [37]. Similar results have been found in other arid zones [12]. The area where vegetation was restored was about 2.40 × 10⁵ km2, accounting for 97.1% of the vegetated area. Additionally, 29.5% of the regional vegetation restoration trends passed the 95% significance test (Figure 6b). Only 3% of the vegetation was degraded, which was scattered in the middle and to the east of Inner Mongolia and to the north of Mongolia, and only 0.1% of the area was significantly degraded. These results indicate that the ecological environment in the MP area has been restored.
Using the results of the Hurst analysis, future trends in vegetation ANPP were predicted (Figure 7). The results showed that the Hurst exponent of most areas (78%) of the MP was greater than 0.5, indicating that the change in the ANPP of vegetation was sustainable and stable (Figure 7a). In addition to the change in the trend of ANPP, the results showed that in future, 76.2% of the vegetated area in the MP would be continuously improved, of which 28.9% would improve significantly (Figure 7b). The area of sustained decrease accounted for 1.8% of the vegetated area, and the area of significant sustained decrease was only 0.1% and was mainly concentrated in the northern part of the Kente Mountains. The regions with reversely sustainable change accounted for 22%, with the regions of reversely sustainable increase and decrease accounting for 20.9% and 1.1%, respectively. A reversely sustainable increase indicates that the ANPP of vegetation might increase now and decrease in the future, while a reversely sustainable decrease indicates that the ANPP might decrease now but increase in the future. Most reversely sustainable regions were distributed in the central and western mountainous areas of Mongolia, and in the grassland, coniferous forest, and shrub ecosystems in central Inner Mongolia. These areas have the potential to experience permafrost degradation and glacial melt in the context of future global warming, which could alter the moisture conditions of the plateau and lead to the degradation of fragile ecosystems that are currently recovering in arid areas [31,38]. Human activity in these areas may also become increasingly intensive. Under the dual influence of drought and intensified human activity, vegetation ANPP may show an opposite trend in the future [31].

4.3. Quantification of the Impact Areas of Climate Change and Human Activities on the ANPP

Based on the assessment scenarios of the impact of climate change and human activity on vegetation restoration and degradation in Table 1, the impacts of different factors on vegetation ANPP were analyzed. In the ZGS model, CDR, HDR, and BDR accounted for 11.8%, 31.9%, and 53.3% of the total vegetated area, respectively; the simulation results of the TM model showed that the proportions were 34.5%, 35.7%, and 26.8%, respectively (Table 2). Importantly, in the evaluation scenarios constructed by the two models, more than 30% of vegetation was restored under the influence of human activity. Moreover, the spatial distribution was also consistent, as shown in Figure 8. Vegetation restoration was mainly concentrated between the Hangay Uul and Kente Mountains in northern Mongolia, and on both sides of the Yin Shan in Inner Mongolia, indicating that mainly human activities have affected vegetation restoration in these areas. This finding may be related to the ecological management policies of China and Mongolia [7]. Conversely, vegetation restoration induced by climate change was mainly concentrated on the eastern side of the Greater Khingan Mountains. In the ZGS model, human activity and climate change led to an increase in vegetation ANPP across large areas. Contrarily, in the TM model, the areas affected by human activity and climate change were distributed around the areas dominated by human activity; these areas would gradually transition into areas in which changes in ANPP are climate-induced.
Few areas of vegetation degradation were present on the plateau, and were distributed across the Altay Mountains, the Kente Mountains, and central Inner Mongolia. The area ratios of CDD, HDD, and BDD were 1.5%, 1%, and 0.5% in the ZGS model and 1.9%, 0.9%, and 0.2% in the TM model, respectively (Table 2). Both models revealed that climate change was the primary cause of vegetation degradation in the plateau. However, different PNPP estimation models simulated different relative impacts of climate change and human activity on vegetation ANPP dynamics, which might be due to the vegetation ANPP being affected by multiple factors. Furthermore, the determination of the PNPP depended mainly on meteorological data. Different models considered different parameters, and the simulated results varied [37].

4.4. Relationship between Changes in Vegetation ANPP and Meteorological Factors

Figure 8 shows the changes in average annual precipitation and temperature in the study area from 2000 to 2019. During the study period, temperature and precipitation in the Mongolia Plateau demonstrated an insignificant upward trend, with growth rates of 0.03 °C·a−1 and 0.72 mm·a−1, respectively. The rate of increase in temperature ranged from −0.06 to 0.08 °C·a−1, and the temperature showed an upward trend in 96.96% of the regions (Figure 9a). The areas in which temperature decreases were noted were all concentrated in Mongolia, distributed mainly in the Sajan Mountains area in northwest Mongolia. The precipitation change had an obvious spatial heterogeneity, with a change rate of −5.37 to 8.74 mm·a−1 (Figure 9b). The areas of increased precipitation accounted for 60.6% of the study area and were concentrated between Hangay Uul, Sajan and the Kente Mountains, the Kente Mountains to the Greater Khingan Mountains, and the eastern side of the Greater Khingan Mountains. Precipitation all showed a decreasing trend in the northern Altay Mountains, Kente Mountains, northwestern Greater Khingan Mountains, and the north of Yin Shan.
The results of the TM model were employed to analyze the relationship between vegetation ANPP and meteorological variables, except in the areas affected by human activity. The results showed that the partial coefficient of the relationship between ANPP and temperature ranged from −0.49 to 0.81, and the partial correlation coefficient with precipitation ranged from −0.57 to 0.94. Thus, both had obvious spatial heterogeneity (Figure 10). The area of positive correlation between vegetation ANPP and temperature was much larger than the area of negative correlation, accounting for about 80.3% (Figure 10a). This indicates that the increase in annual temperature can alleviate the restriction of low temperatures on the initial stages of vegetation growth, prolong the growing season, and improve vegetation productivity [39]. However, except for some pixels to the north of the Kente Mountains, the east of Inner Mongolia, and the south of Yin Shan, most areas failed to pass the significance test. The areas of negative correlation between ANPP and temperature were mainly found in the northern regions of the Sajan Mountains and Hangay Uul, the eastern region of the Kente Mountains in Mongolia, and eastward to the western parts of the Greater Khingan Mountains in Inner Mongolia. Rising temperatures will lead to more wildfires, insect attacks, and the expansion of invasive species, among other disturbances that inhibit vegetation growth by weakening the stability of ecosystems [40]. Correlation analysis showed that although the temperature positively affected the ANPP of vegetation in most areas of the MP, the effect on an annual scale was not significant. This is because, against the background of global warming, most vegetation in the MP showed improved adaptation to the arid environment, and vegetation growth following rises in temperatures in the northern hemisphere gradually became less sensitive to temperature [41]. However, in central Inner Mongolia and a few areas along its border with Mongolia, the ANPP of vegetation decreased, which may result from the increase in evapotranspiration and the decrease in soil moisture due to the increased temperature. To reduce transpiration, the stomata of vegetation closed, resulting in a decrease in the photosynthetic rate of vegetation [34].
Compared with temperature, vegetation is more sensitive to precipitation change on an annual scale, and the correlation between ANPP and precipitation was relatively large and significant in most areas. The positive correlation between vegetation ANPP and precipitation accounted for 96.5% of the whole vegetated area, and 71.4% of the regions passed the significance test (p < 0.05) (Figure 10b). This correlation significance further demonstrates that moisture is a determining factor for vegetation growth in the MP. This finding is consistent with the results of existing studies [42]. Only 3.5% of regional vegetation ANPP was negatively correlated with precipitation, in an area distributed in the northern Sajan Mountains and Greater Khingan Mountains. The change in water condition seems to be the main meteorological factor restricting vegetation growth in areas not dominated by human activity. In arid and semi-arid ecosystems with scarce water resources, increase in precipitation can add to the water content of the surface soil layer, provide more water for vegetation growth, and appropriately alleviate the stress of insufficient water on vegetation growth [43]. Moreover, increased precipitation can also boost the activity of soil microorganisms to a certain extent, promote the absorption of nutrients by vegetation, affect the respiration and photosynthesis of vegetation, and enhance its carbon sequestration capacity [40].
Noticeably, the positive correlation coefficients of vegetation ANPP with both temperature and precipitation were nonsignificant in forested areas in the northeastern and northern parts of the study area. This might be attributed to the more complex structure and higher productivity of forest ecosystems, and their increased resilience to climate change [2]. As the major vegetation cover type in the study area, grassland had poor ecosystem stability, which became more pronounced under long-term arid conditions. This led to a strong dependence on precipitation and a significant relationship with precipitation changes [41,42]. The cropland area in the southeastern MP showed a significant positive correlation with both temperature and precipitation. This was mainly because areas with better water and heat conditions were used as cropland, while both temperature and precipitation increased the photosynthesis of the vegetation [28].

4.5. Relationship between Changes in Vegetation ANPP and Human Activities

Under the assessment scenario constructed by the TM model, vegetation restoration during the study period in more than 30% of areas was related to human activity (Figure 8a). Precipitation in these areas mostly showed a decreasing trend, indicating that human activities including fertilization, irrigation, and livestock management could have compensated to a certain extent for the adverse effects of precipitation deficit on vegetation [44]. To maintain the sustainable development of the ecosystem and prevent land desertification, Mongolia and Inner Mongolia have taken corresponding prevention measures. According to the Outline of the Ecological Fragile Area Protection Plan and other documents published by the government of Inner Mongolia, the core task is to maintain the integrity of the ecosystem. As such, policies have been implemented including planting trees, reducing livestock, stopping grazing, banning grazing, and promoting fenced grazing, which reduces the burden on grasslands and reduces the human–environment conflict [45]. Nevertheless, 1% of the vegetation was found to have been degraded by human activities, which could have been caused by excessive cultivation, increasing the conflict between human land use and vegetation growth [35].
The areas with shifting land-cover types were most likely to be affected by human disturbances, although these activities included ecological restoration measures such as afforestation, reforestation and grass restoration, as well as recultivation and urban expansion [46]. Figure 11a shows the variations in the land cover across the MP from 2000 to 2019, and the spatial distribution of the changed areas. For the areas where land-cover types had shifted, 58% overlapped with the areas of vegetation change caused by human activities in the TM model. These changes mainly occurred in those regions dominated by human activity, and those affected jointly by human activities and climate change, which further proved the accuracy of the results simulated by the TM model. During the study period, the surface coverage of grassland in the MP increased, showing that more land was converted into grassland, as presented in Figure 11a. The transformations of forest area into grassland, grassland into forest area, and sandy soil area to grassland were obvious, accounting for 15.5%, 16.4%, and 40.4% of the vegetation transfer area, respectively. This increased the vegetation ANPP by 14.0%, 16.2%, and 32.2% in the vegetation transfer area, mainly distributed between the Kente Mountains and Sajan Mountains in northern Mongolia, the Greater Khingan region, and the transition zone between bare land and grassland (Figure 11a). These results indicate that afforestation projects have been conducted in northern Mongolia and the Greater Khingan region. Moreover, the increase in the ANPP suggests that the Greenbelt project in Mongolia and the Sand Source Control project in Inner Mongolia have expanded grassland into land that was previously bare, and have achieved the ecological restoration of desertified land [7]. Desertification management has also resulted in a significant increase in the ANPP of vegetation. Areas of cropland converted back into forest and grassland were 0.3% and 8.9%, respectively. These were distributed in the Greater Khingan region, and in eastern and southeastern Inner Mongolia, where the ANPP of vegetation increased by 8.2%. Soil erosion was alleviated, and the carbon sequestration capacity of vegetation was enhanced. To the east of the Greater Khingan Mountains and the southeast of Inner Mongolia, 15.7% of grassland was transformed into cropland, and the carbon sequestration capacity of vegetation increased 14.1% due to human irrigation. In general, during the land-type transfer process, vegetation in the MP was restored conspicuously, and only 3.7% of the area where land cover changed exhibited a decreasing trend in vegetation ANPP.
Figure 11b shows the spatial distribution of 2010 livestock data on the plateau, and indicates the trajectory of human grazing activities to a certain extent. The density of cattle grazing was less than 50 head/ha in most areas of the MP, and grazing activities tended to occur in areas with live cattle densities ranging from 5 to 50 head/ha. Areas with higher grazing density were mainly concentrated in the center of Mongolia and Inner Mongolia, and overlapped with 58.8% of the vegetation change dominated by human activities. This reflects those grazing activities are one of the leading human activities causing vegetation change in the MP. Studies have shown that a positive correlation exists between livestock numbers and NPP in most grazing areas in Mongolia and Inner Mongolia [44], with an increase in vegetation cover of 0.04–0.09% for each percentage point increase in animal density [47]. Such a change resulted in an increase in vegetation NPP, which may be attributed to the nutrients provided by animal fecal matter for vegetation growth. Nevertheless, studies have suggested that while increased grazing intensity can promote vegetation NPP, it only manifests when the grazing intensity increases from very light to moderate grazing [48]. Therefore, the development of appropriate grazing policies for the improved management of pastoral vegetation is an issue that cannot be ignored.

5. Conclusions

In this study, based on simulated ANPP, PNPP, and HNPP, the relative contributions of climate change and human activities to vegetation ANPP in the MP from 2000–2019 have been quantitatively evaluated. The main conclusions are as follows:
(1) The ANPP of the MP showed obvious spatial heterogeneity, with a spatial distribution pattern that increased from the southwest to the northeast. The averages from large to small for different types of vegetation ANPP were as follows: broad-leaved forest > mixed forest > coniferous forest > cropland > grassland > wetland > shrub.
(2) During the study period, the ANPP of the MP showed a significant upward trend, and the vegetation restoration area was conspicuously larger than the degradation area. The ANPP of different vegetation types increased, and except for broad-leaved forest and mixed forest, the increasing trends for other vegetation types passed the significance test. Most areas showed a continuous and stable change in vegetation ANPP, sustainable with current trends in variation, and reflected in the continuous improvement of vegetation.
(3) Vegetation restoration in the MP was dominated by human activity, and vegetation degradation was mainly dominated by climate change. Desertification management, restoration of cropland to forested areas and grassland, afforestation, and reasonable grazing activities were the main human activities performed to restore vegetation.
(4) From 2000 to 2019, the plateau climate showed a trend towards warmth and humidity, and ANPP was positively correlated with temperature and precipitation. However, precipitation affected ANPP more significantly, which was the main limiting climate-related factor affecting the change in vegetation ANPP.
Overall, the study found that vegetation has been restored in most areas of the MP since 2000, and the carbon sequestration capacity of vegetation has improved. Additionally, this study identified regions in which vegetation has been affected by climate change and human activities, which can provide further insight into the causes of vegetation changes in different regions. Importantly, however, the PNPP model used in the study only simulated the relationships between vegetation productivity, temperature and precipitation. The model simulated the maximum vegetation productivity that could be achieved under ideal conditions; however, the growth of vegetation is inevitably influenced by other natural factors. The difference between PNPP and ANPP was not caused only by human activity, which has made the research results uncertain. Thus, in the future, studies should consider further quantifying the impact of various climatic factors and specific human activities on the dynamics of vegetation growth, to better predict PNPP and ANPP.

Author Contributions

Conceptualization, methodology, writing—original draft preparation, C.Y.; conceptualization, supervision, inspection, M.L.; review, editing, F.M.; investigation, validation, C.S.; investigation, validation, Z.Y.; investigation, Y.B. All authors have read and agreed to the published version of the manuscript.

Funding

This research was funded by the Talent Project of Science and Technology in Inner Mongolia (Grant No. NJYT22027), the Natural Science Foundation of Inner Mongolia (Grant No. 2020BS04009 and 2020BS03042), Innovation and Entrepreneurship Start-up Support Plan Programs for the Returned Overseas Chinese Scholars (Grant No. 5909002124), and Inner Mongolia normal university graduate students’ research & Innovation fund (Grant No. CXJJS21150).

Data Availability Statement

Not applicable.

Acknowledgments

The authors would like to thank the editors and anonymous reviewers for their valuable comments and suggestions which improved the quality of the manuscript.

Conflicts of Interest

The authors declare no conflict of interest.

References

  1. Linger, E.; Hogan, J.A.; Cao, M.; Zhang, W.F.; Yang, X.F.; Hu, Y.H. Precipitation influences on the net primary productivity of a tropical seasonal rainforest in Southwest China: A 9-year case study. For. Ecol. Manag. 2020, 467, 118153. [Google Scholar] [CrossRef]
  2. Sun, H.Z.; Chen, Y.B.; Xiong, J.N.; Ye, C.C.; Yong, Z.W.; Wang, Y.; He, D.; Xu, S.C. Relationships between climate change, phenology, edaphic factors, and net primary productivity across the Tibetan Plateau. Int. J. Appl. Earth Obs. Geoinf. 2022, 107, 102708–102718. [Google Scholar] [CrossRef]
  3. Alton, P.B. Representativeness of global climate and vegetation by carbon-monitoring networks; implications for estimates of gross and net primary productivity at biome and global levels. Agric. For. Meteorol. 2020, 290, 108017–108031. [Google Scholar] [CrossRef]
  4. Chi, C.; Taejin, P.; Wang, X.H.; Piao, S.L.; Xu, B.D.; Chaturvedi, R.K.; Richard, F.; Victor, B.; Philippe, C.; Rasmus, F.; et al. China and India lead in greening of the world through land-use management. Nat. Sustain. 2019, 2, 122–129. [Google Scholar]
  5. Bao, G.; Chen, J.Q.; Chopping, M.; Bao, Y.H.; Bayarsaikhan, S.; Dorjsuren, A.; Tuya, A.; Jirigala, B.; Qin, Z.H. Dynamics of net primary productivity on the Mongolian Plateau: Joint regulations of phenology and drought. Int. J. Appl. Earth Obs. Geoinf. 2019, 81, 85–97. [Google Scholar] [CrossRef]
  6. Xiao, X.; Melillo, J.M.; Kicklighter, D.W.; Pan, Y.; Iii, J. Net primary production of terrestrial ecosystems in China and its equilibrium response to changes in climate and atmospheric CO concentration. Acta Phytoecol. Sin. 1996, 22, 97–118. [Google Scholar]
  7. Zhang, Y.; Wang, Q.; Wang, Z.; Yang, Y.; Li, J. Impact of human activities and climate change on the grassland dynamics under different regime policies in the Mongolian Plateau. Sci Total Environ. 2020, 698, 134304. [Google Scholar] [CrossRef]
  8. Lieth, H.; Robert, H. Whittaker, Primary Productivity of the Biosphere; Springer: Berlin/Heidelberg, Germany, 1975. [Google Scholar]
  9. Mao, D.H.; Wang, Z.M.; Wu, C.S.; Song, K.S.; Ren, C.Y. Examining forest net primary productivity dynamics and driving forces in northeastern China during 1982–2010. Chin. Geogr. Sci. 2014, 24, 631–646. [Google Scholar] [CrossRef] [Green Version]
  10. Liu, Y.Y.; Yang, P.Z.; Zhang, Z.X.; Zhang, W.; Wang, Z.Q.; Zhang, Z.Y.; Ren, H.Y.; Zhou, R.L.; Wen, Z.M.; Hu, T.M. Diverse responses of grassland dynamics to climatic and anthropogenic factors across the different time scale in China. Ecol. Indic. 2021, 132, 108341–108356. [Google Scholar] [CrossRef]
  11. Li, J.G.; Wang, Y.; Liu, L.L. Responses of the Terrestrial Ecosystem Productivity to Droughts in China. Front. Earth Sci. 2020, 8, 59. [Google Scholar] [CrossRef] [Green Version]
  12. Wu, L.; Ma, X.; Dou, X.; Zhu, J.; Zhao, C. Impacts of climate change on vegetation phenology and net primary productivity in arid Central Asia. Sci. Total Environ. 2021, 796, 149055–149070. [Google Scholar] [CrossRef] [PubMed]
  13. Yin, L.; Dai, E.F.; Zheng, D.; Wang, Y.H.; Ma, L.; Tong, M. What drives the vegetation dynamics in the Hengduan Mountain region, southwest China: Climate change or human activity? Ecol. Indic. 2020, 112, 106013–106024. [Google Scholar] [CrossRef]
  14. Jiang, Y.; Guo, J.; Peng, Q.; Guan, Y.; Zhang, R. The effects of climate factors and human activities on net primary productivity in Xinjiang. Int. J. Biometeorol. 2020, 64, 765–777. [Google Scholar] [CrossRef]
  15. Wessels, K.J.; Prince, S.D.; Malherbe, J.; Small, J.; Frost, P.E.; Vanzyl, D. Can human-induced land degradation be distinguished from the effects of rainfall variability? A case study in South Africa. J. Arid Environ. 2007, 68, 271–297. [Google Scholar] [CrossRef]
  16. Evans, J.; Geerken, R. Discrimination between climate and human-induced dryland degradation. J. Arid. Environ. 2004, 57, 535–554. [Google Scholar] [CrossRef]
  17. Tian, J.; Xiong, J.N.; Zhang, Y.C.; Cheng, W.M.; He, Y.C.; Ye, C.C.; He, W. Quantitative Assessment of the Effects of Climate Change and Human Activities on Grassland NPP in Altay Prefecture. J. Resour. Ecol. 2021, 12, 743–756. [Google Scholar]
  18. Sun, Q.L.; Li, B.L.; Zhou, C.H.; Fei, L.; Zhang, Z.J.; Ding, L.L.; Zhang, T.; Xu, L.L. A systematic review of research studies on the estimation of net primary productivity in the Three-River Headwater Region, China. J. Geogr. Sci. 2017, 27, 161–182. [Google Scholar] [CrossRef]
  19. Abdelrahim, E.J.; Wu, W.C.; Boloorani, A.D.; Salem, H.M.; Nazeer, M.; Fadoul, S.M.; Khan, M.S. Assessment the Influence of Climate and Human Activities in Vegetation Degradation using GIS and Remote Sensing Techniques. Contemp. Probl. Ecol. 2020, 13, 685–693. [Google Scholar] [CrossRef]
  20. Chen, A.F.; Li, R.Y.; Wang, H.L.; He, B. Quantitative assessment of human appropriation of aboveground net primary production in China. Ecol. Model. 2015, 312, 54–60. [Google Scholar] [CrossRef] [Green Version]
  21. Gang, C.C.; Zhang, Y.Z.; Wang, Z.Q.; Chen, Y.Z.; Yang, Y.; Li, J.L.; Cheng, J.M.; Qi, J.G.; Odeh, I. Modeling the dynamics of distribution, extent, and NPP of global terrestrial ecosystems in response to future climate change. Glob. Planet. Chang. 2017, 148, 153–165. [Google Scholar] [CrossRef]
  22. Zhao, C.L.; Yan, Y.; Ma, W.Y.; Shang, X.; Chen, J.G.; Rong, Y.J.; Xie, T.; Yuan, Q. RESTREND-based assessment of factors affecting vegetation dynamics on the Mongolian Plateau. Ecol. Model. 2021, 440, 109415–109420. [Google Scholar] [CrossRef]
  23. Jin, H.; Bao, G.; Chen, J.Q.; Chopping, M.; Jin, E.; Mandakh, U.; Jiang, K.; Huang, X.J.; Bao, Y.H.; Vandansambuu, B. Modifying the maximal light-use efficiency for enhancing predictions of vegetation net primary productivity on the Mongolian Plateau. Int. J. Remote Sens. 2020, 41, 3740–3760. [Google Scholar] [CrossRef]
  24. Luo, M.; Meng, F.H.; Sa, C.L.; Duan, Y.C.; Bao, Y.H.; Liu, T.; De, M.P. Response of vegetation phenology to soil moisture dynamics in the Mongolian Plateau. Catena 2021, 206, 105505–105515. [Google Scholar] [CrossRef]
  25. Ryu, Y.; Jiang, C.Y.; Kobayashi, H.; Detto, M. MODIS-derived global land products of shortwave radiation and diffuse and total photosynthetically active radiation at 5 km resolution from 2000. Remote Sens. Environ. Interdiscip. J. 2018, 204, 812–825. [Google Scholar] [CrossRef]
  26. Zhang, X.; Liu, L.Y.; Chen, X.D.; Xie, S.; Gao, Y. Fine Land-Cover Mapping in China Using Landsat Datacube and an Operational SPECLib-Based Approach. Remote Sens. 2019, 11, 1056. [Google Scholar] [CrossRef] [Green Version]
  27. Xue, C.D.; Wu, H.; Jiang, X.G. Temporal and Spatial Change Monitoring of Drought Grade Based on ERA5 Analysis Data and BFAST Method in the Belt and Road Area during 1989–2017. Adv. Meteorol. 2019, 2019, 1–10. [Google Scholar] [CrossRef]
  28. Xu, L.; Yu, G.; He, N.; Wang, Q.; Gao, Y.; Wen, D.; Li, S.; Niu, S.; Ge, J. Carbon storage in China’s terrestrial ecosystems: A synthesis. Sci. Rep. 2018, 8, 2806–2819. [Google Scholar] [CrossRef]
  29. Lieth, H. Modeling the primary productivity of the world. Nat. Resour. 1975, 14, 237–263. [Google Scholar]
  30. Li, H.; Zhang, H.; Li, Q.; Zhao, J.; Guo, X.; Ying, H.; Deng, G.R.; Wu, R.H.; Wang, S. Vegetation Productivity Dynamics in Response to Climate Change and Human Activities under Different Topography and Land Cover in Northeast China. Remote Sens. 2021, 13, 975. [Google Scholar] [CrossRef]
  31. Jiapaer, G.; Liang, S.L.; Yi, Q.X.; Liu, J.P. Vegetation dynamics and responses to recent climate change in Xinjiang using leaf area index as an indicator. Ecol. Indic. 2015, 58, 64–76. [Google Scholar]
  32. Dong, G.; Zhao, F.Y.; Chen, J.Q.; Zhang, Y.Q.; Shao, C.L. Non-climatic component provoked substantial spatiotemporal changes of carbon and water use efficiency on the Mongolian Plateau. Environ. Res. Lett. 2020, 15, 095009–095025. [Google Scholar] [CrossRef]
  33. Groisman, P.; Shugart, H.; Kicklighter, D.; Henebry, G.; Tchebakova, N.; Maksyutov, S.; Monier, E.; Gutman, G.; Gulev, S.; Qi, J. Northern Eurasia Future Initiative (NEFI): Facing the challenges and pathways of global change in the twenty-first century. Prog. Earth Planet. Sci. 2017, 4, 41–88. [Google Scholar] [CrossRef] [Green Version]
  34. Lei, T.J.; Feng, J.; Juan, L.; Wang, J.B.; Song, H.Q.; Song, W.L.; Gao, X.F. Net Primary Productivity Loss under different drought levels in different grassland ecosystems. J. Environ. Manag. 2020, 274, 111144–111155. [Google Scholar] [CrossRef]
  35. Medková, H.; Vačkář, D.; Weinzettel, J. Appropriation of potential net primary production by cropland in terrestrial ecoregions. J. Clean. Prod. 2017, 150, 294–300. [Google Scholar] [CrossRef]
  36. Liu, F.H.; Ye, X.H.; Guo, Q.; Li, X.H.; Liu, J. Spatio-temporal variation of carbon and water use efficiency of different landcover in the Poyang Lake Basin and their correlations with climate factors. Acta Ecol. Sin. 2021, 41, 694–706. [Google Scholar]
  37. Yuan, M.; Zhu, Q.; Zhang, J.; Liu, J.; Chen, H.; Peng, C.; Li, P.; Li, M.; Wang, M.; Zhao, P. Global response of terrestrial gross primary productivity to climate extremes. Sci. Total Environ. 2021, 750, 142337–142350. [Google Scholar] [CrossRef]
  38. Tu, Y.; Jiang, L.L.; Liu, R.; Xiao, Z.L.; Min, J. Spatiotemporal change of vegetation NDVI and its driving forces in China during 1988–2015. Trans. Chin. Soc. Agric. Eng. 2021, 37, 75–84. [Google Scholar]
  39. Batunacun; Claas, N.; Hu, Y.; Tobia, L. Land-use change and land degradation on the Mongolian Plateau from 1975 to 2015—A case study from Xilingol, China. Land Degrad. Dev. 2018, 29, 1595–1606. [Google Scholar] [CrossRef]
  40. Liu, X.D.; Ma, Q.H.; Yu, H.Y.; Li, Y.B.; Li, L.; Miao, Q.; Wu, W.J.; Zhang, F.; Wang, Y.H.; Zhou, G.S.; et al. Climate warming-induced drought constrains vegetation productivity by weakening the temporal stability of the plant community in an arid grassland ecosystem. Agric. For. Meteorol. 2021, 307, 108526–108536. [Google Scholar] [CrossRef]
  41. Piao, S.L.; Nan, H.J.; Huntingford, C.; Ciais, P.; Friedlingstein, P.; Sitch, S.; Peng, S.S.; Ahlstrom, A.; Canadell, J.G.; Cong, N.; et al. Evidence for a weakening relationship between interannual temperature variability and northern vegetation activity. Nat. Commun. 2014, 5, 5018. [Google Scholar] [CrossRef] [Green Version]
  42. Wu, N.T.; Liu, G.X.; Yang, Y.; Song, X.Y.; Bai, H.H. Daynamic monitoring of net primary productivity and its response toclimate factors in native grassland in Inner Mongolia using a light-use efficiency model. Acta Partaculture Sin. 2020, 29, 1–10. [Google Scholar]
  43. Jiang, H.; Xu, X.; Guan, M.; Wang, L.; Huang, Y.; Jiang, Y. Determining the contributions of climate change and human activities to vegetation dynamics in agro-pastural transitional zone of northern China from 2000 to 2015. Sci. Total Environ. 2020, 718, 134871. [Google Scholar] [CrossRef] [PubMed]
  44. Wang, J.; Brown, D.G.; Chen, J.Q. Drivers of the dynamics in net primary productivity across ecological zones on the Mongolian Plateau. Landsc. Ecol. 2013, 28, 725–739. [Google Scholar] [CrossRef]
  45. Environmental Protection Department. Ministry of Environmental Protection issues Outlines of National Ecological Vulnerability Protection Plan. Chin. Geogr. Sci. 2009, 22, 1–25. Available online: http://www.gov.cn/gzdt/2008-10/09/content_1116192.htm (accessed on 26 March 2021).
  46. Guo, E.L.; Wang, Y.F.; Wang, C.L.; Sun, Z.Y.; Bao, Y.L.; Mandula, N.; Jirigala, B.; Bao, Y.H.; Li, H. NDVI Indicates Long-Term Dynamics of Vegetation and Its Driving Forces from Climatic and Anthropogenic Factors in Mongolian Plateau. Remote Sens. 2021, 13, 688. [Google Scholar] [CrossRef]
  47. Miao, L.J.; Sun, Z.L.; Ren, Y.J.; Schierhorn, F.; Müller, D. Grassland greening on the Mongolian Plateau despite higher grazing intensity. Land Degrad. Dev. 2020, 32, 792–802. [Google Scholar]
  48. Schönbach, P.; Wan, H.W.; Gierus, M.; Bai, Y.F.; Müller, K.; Lin, L.J.; Susenbeth, A.; Taube, F. Grassland responses to grazing: Effects of grazing intensity and management system in an Inner Mongolian steppe ecosystem. Plant Soil 2010, 340, 103–115. [Google Scholar] [CrossRef]
Figure 1. Topography (a) and land cover type (b) of the Mongolian Plateau.
Remotesensing 14 03383 g001
Figure 2. Comparison diagram between the observed NPP and the ANPP simulated by the modified CASA model.
Remotesensing 14 03383 g002
Figure 3. Diagram comparing the PNPP and the ANPP.
Remotesensing 14 03383 g003
Figure 4. Spatial distribution of the multi-year average ANPP in the Mongolian Plateau from 2000 to 2019.
Remotesensing 14 03383 g004
Figure 5. (a) The annual average ANPP of different vegetation types; (b) the slope of vegetation ANPP; (c) the time series of ANPP in the Mongolian Plateau from 2000 to 2019. (* p < 0.05).
Remotesensing 14 03383 g005
Figure 6. (a) Rate of change for vegetation ANPP, (b) and significance of the change, in the Mongolian Plateau from 2000 to 2019.
Remotesensing 14 03383 g006
Figure 7. The Hurst index (a) and sustainability of the changing trend (b) of the ANPP in the Mongolian Plateau from 2000 to 2019.
Remotesensing 14 03383 g007
Figure 8. Relative effects of climate change and human activity on vegetation restoration and degradation: (a,b) represent the results of ZGS model and TM model, respectively.
Remotesensing 14 03383 g008
Figure 9. Spatial variation in temperature (a) and precipitation (b) in the Mongolian Plateau.
Remotesensing 14 03383 g009
Figure 10. Significance of the partial correlation between ANPP and temperature (a), and precipitation (b), excluding the area affected by human activities.
Remotesensing 14 03383 g010
Figure 11. Distribution map of changes in land cover (a) and livestock (b) in the Mongolian Plateau.
Remotesensing 14 03383 g011
Table 1. Assessment scenarios of the impact of climate change and human activity on vegetation.
ScenariosSANPPSPNPPSHNPPThe Relative Impact of Climate Change and Human Activities
1+++Climate change dominates vegetation recovery (CDR)
2++Climate change and human activities dominate vegetation recovery (BDR)
3+Human activities dominate vegetation recovery (HDR)
4Climate change dominates vegetation degradation (CDD)
5+Climate change and human activities dominate vegetation degradation (BDD)
6++Human activities dominate vegetation degradation (HDD)
Table 2. Area and percentage of vegetation restoration and degradation under the influence of different factors, as simulated by the ZGS and TM models.
Model Evaluation ScenariosZGS Model Area km2 (Proportion)TM Model Area km2 (Proportion)
CDR2.92 × 105 (11.8%)8.54 × 10⁵ (34.5%)
HDR7.91 × 105 (31.9%)8.84 × 10⁵ (35.7%)
BDR1.32 × 106 (53.3%)6.64 × 10⁵ (26.8%)
CDD3.63 × 104 (1.5%)4.68 × 10⁴ (1.9%)
HDD2.48 × 104 (1%)2.20 × 10⁴ (0.9%)
BDD1.27 × 104 (0.5%)5.07 × 10³ (0.2%)
Publisher’s Note: MDPI stays neutral with regard to jurisdictional claims in published maps and institutional affiliations.

