
Using Multi-Source Geospatial Information to Reduce the Saturation Problem of DMSP/OLS Nighttime Light Data


Abstract
:
1. Introduction
2. Materials and Methods
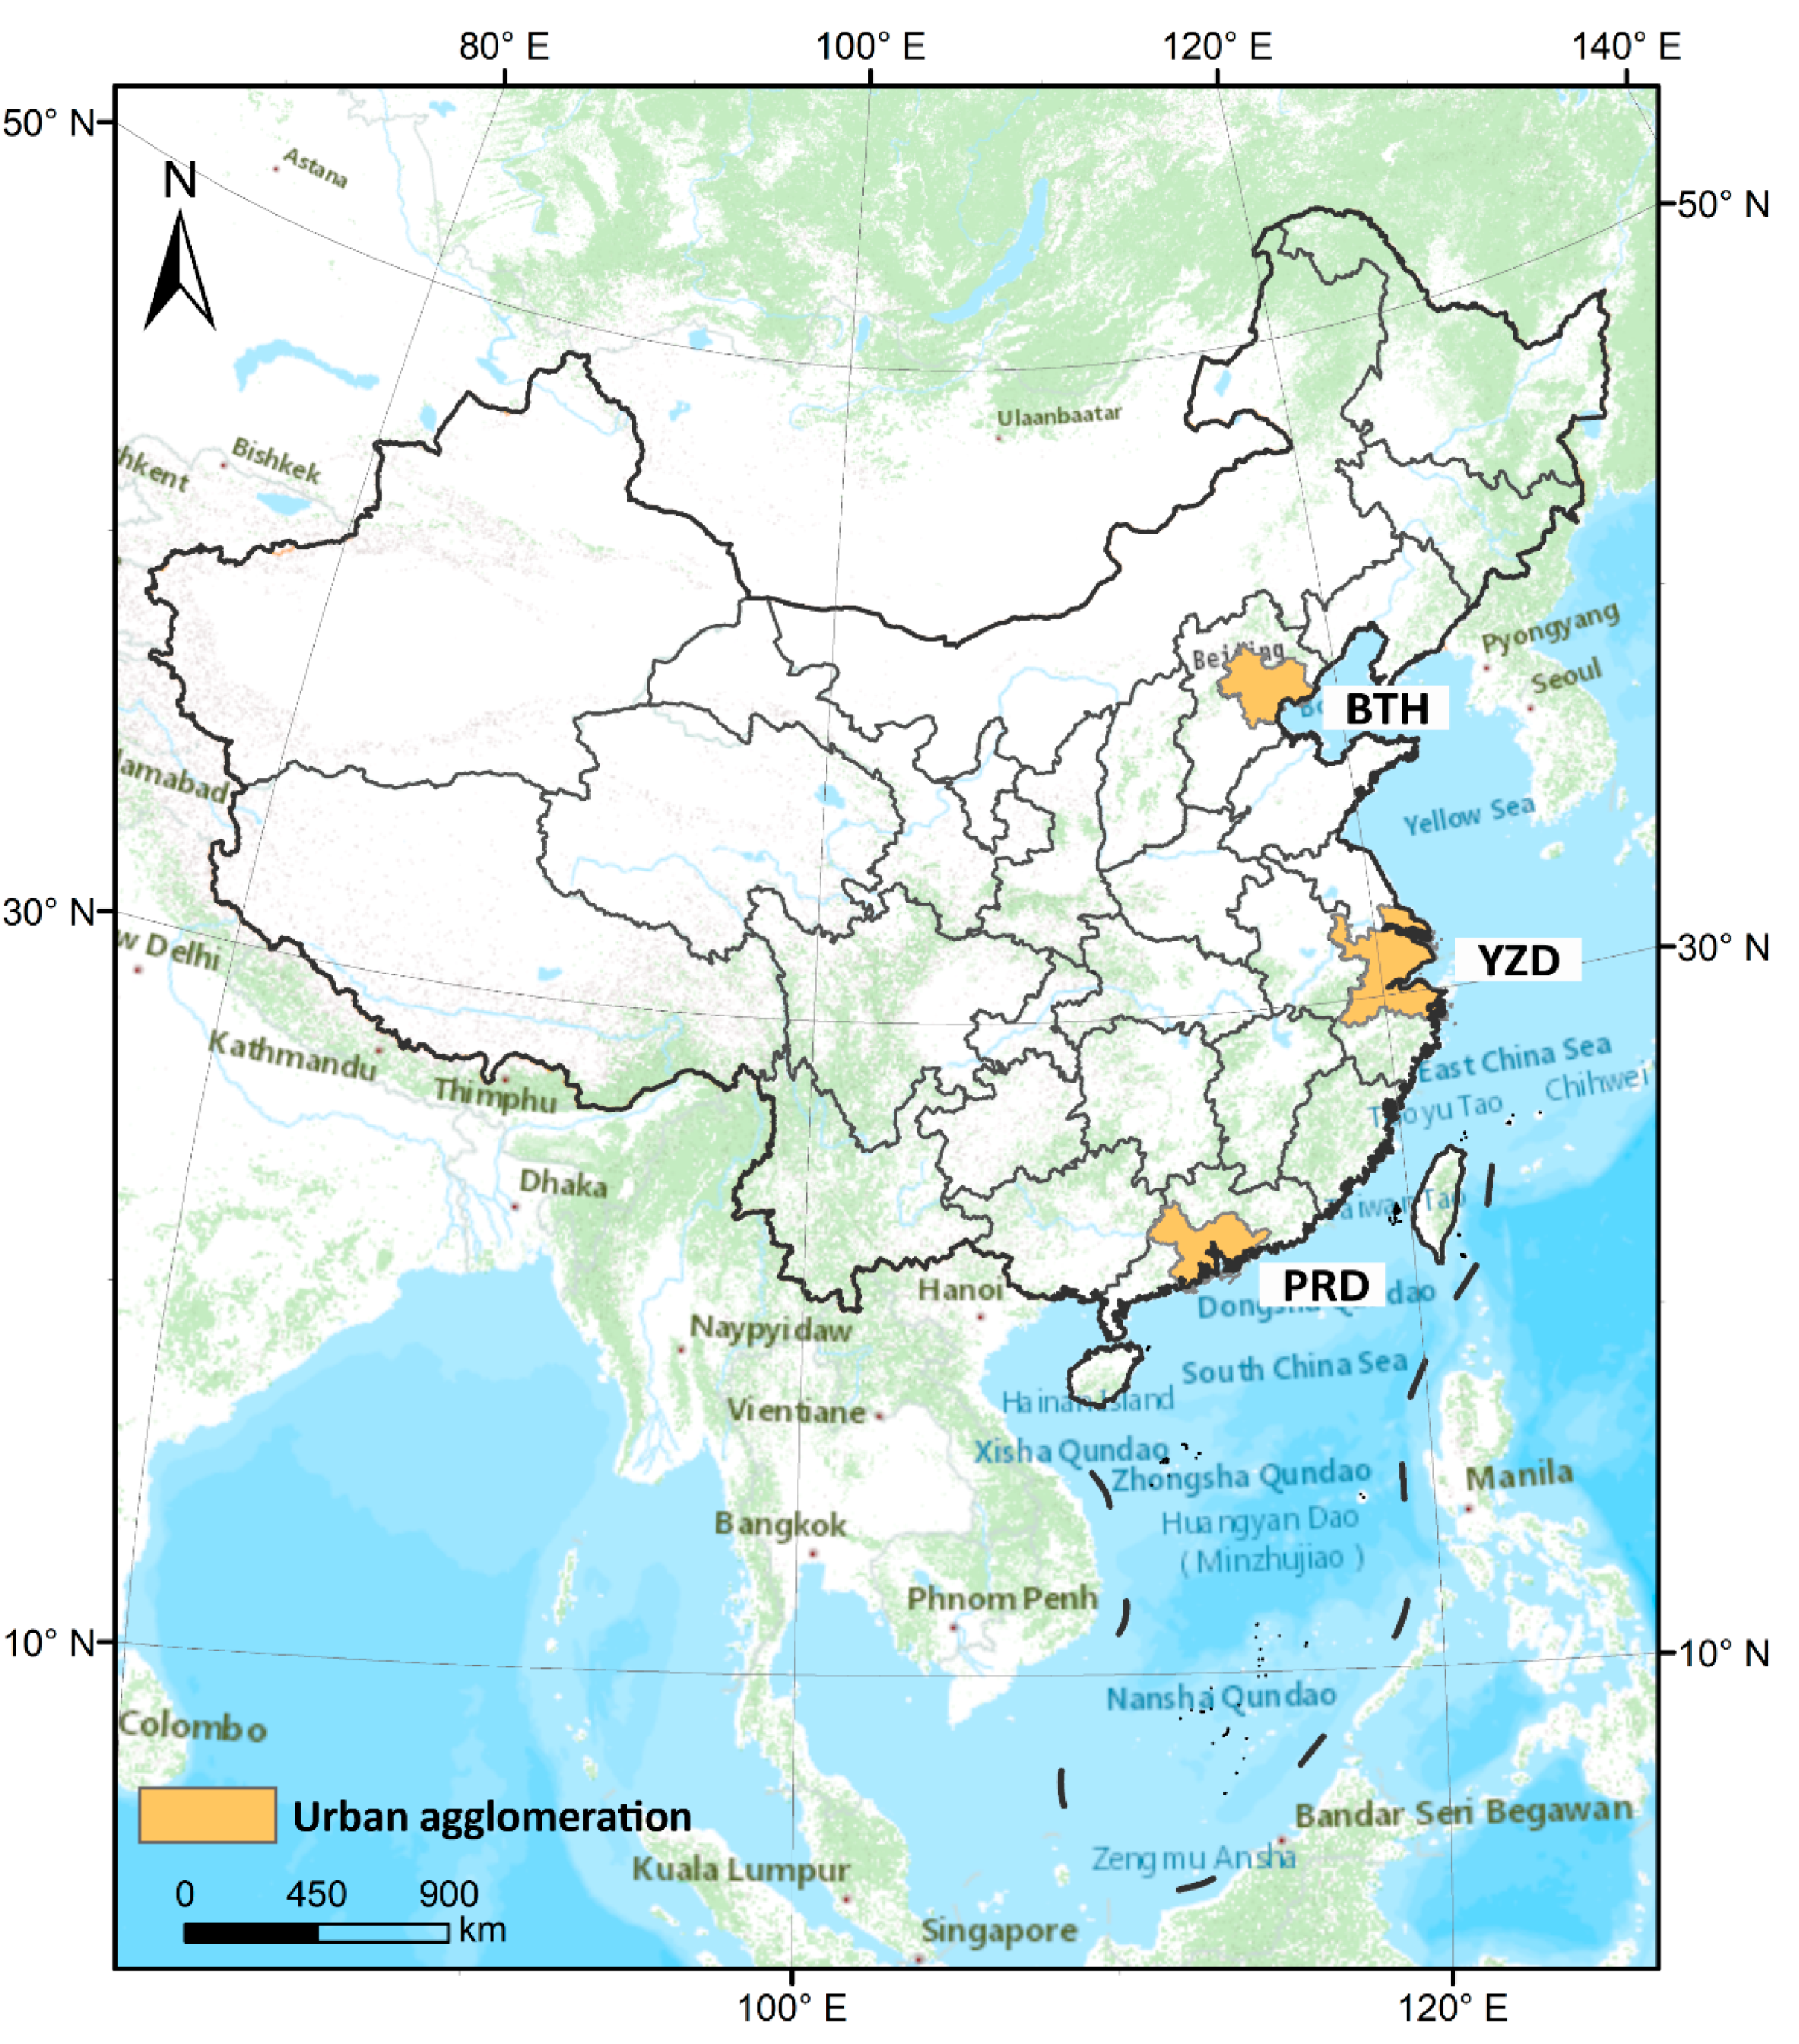
2.1. Study Area
2.2. Data
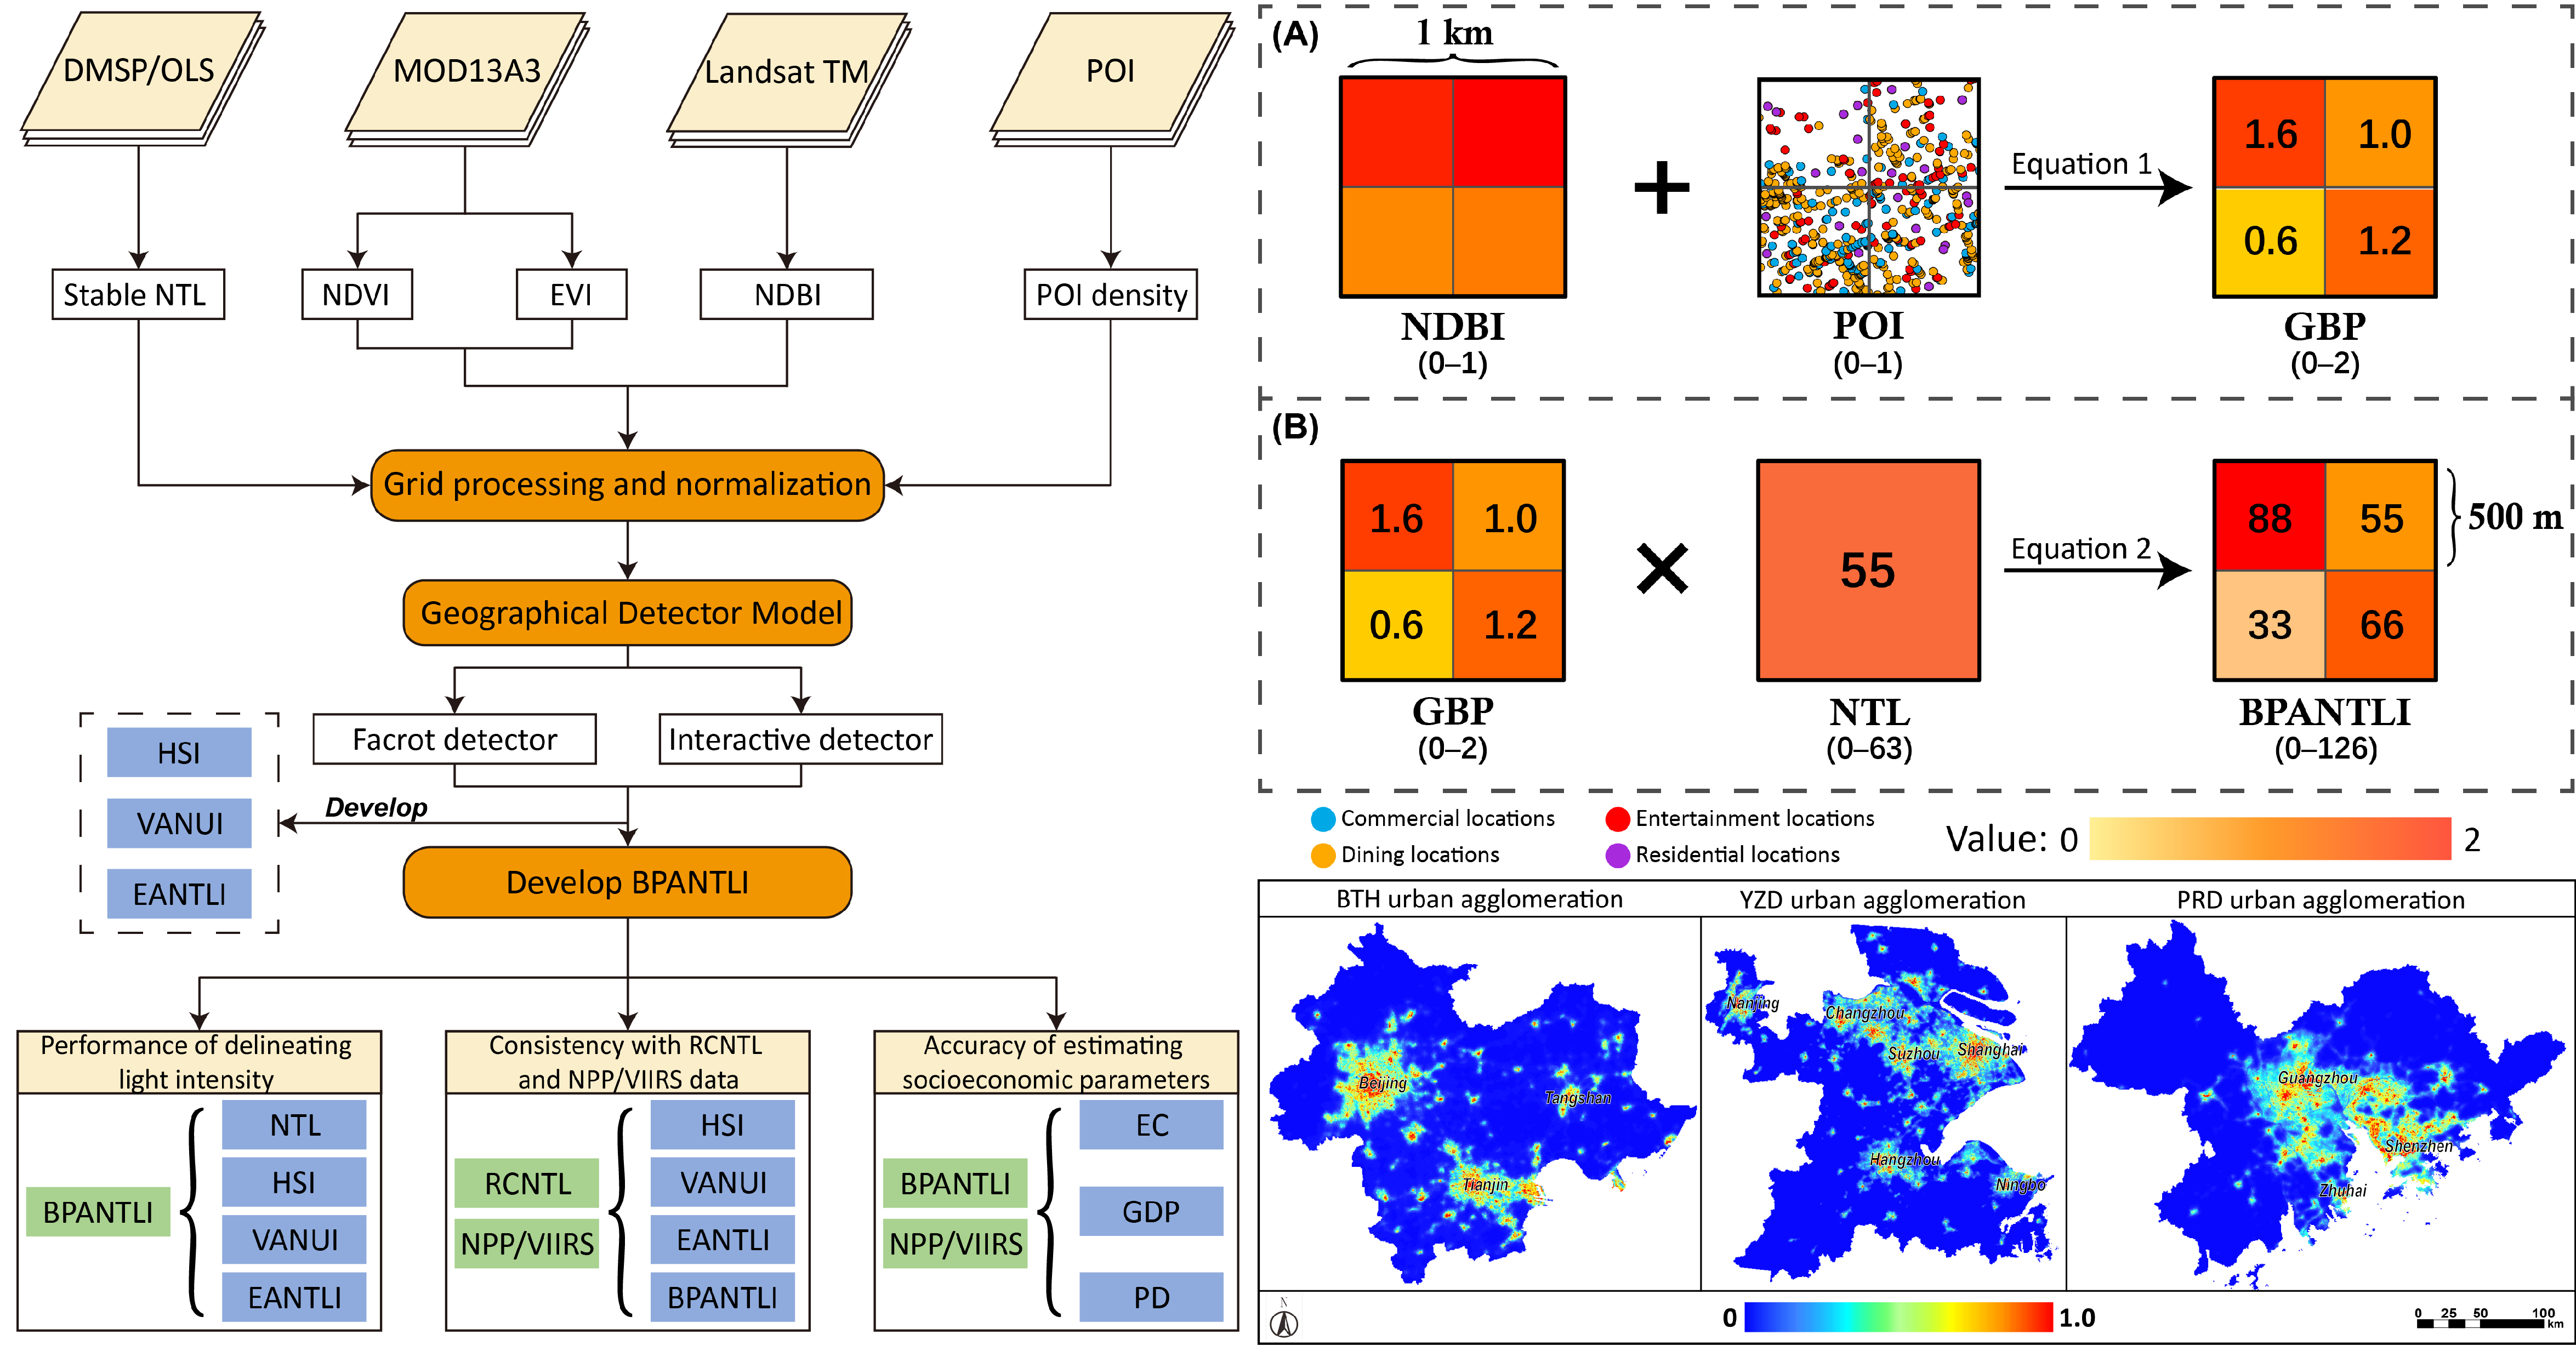
2.3. Methods
2.3.1. Data Normalization and Grid Processing
2.3.2. Geographical Detector Model
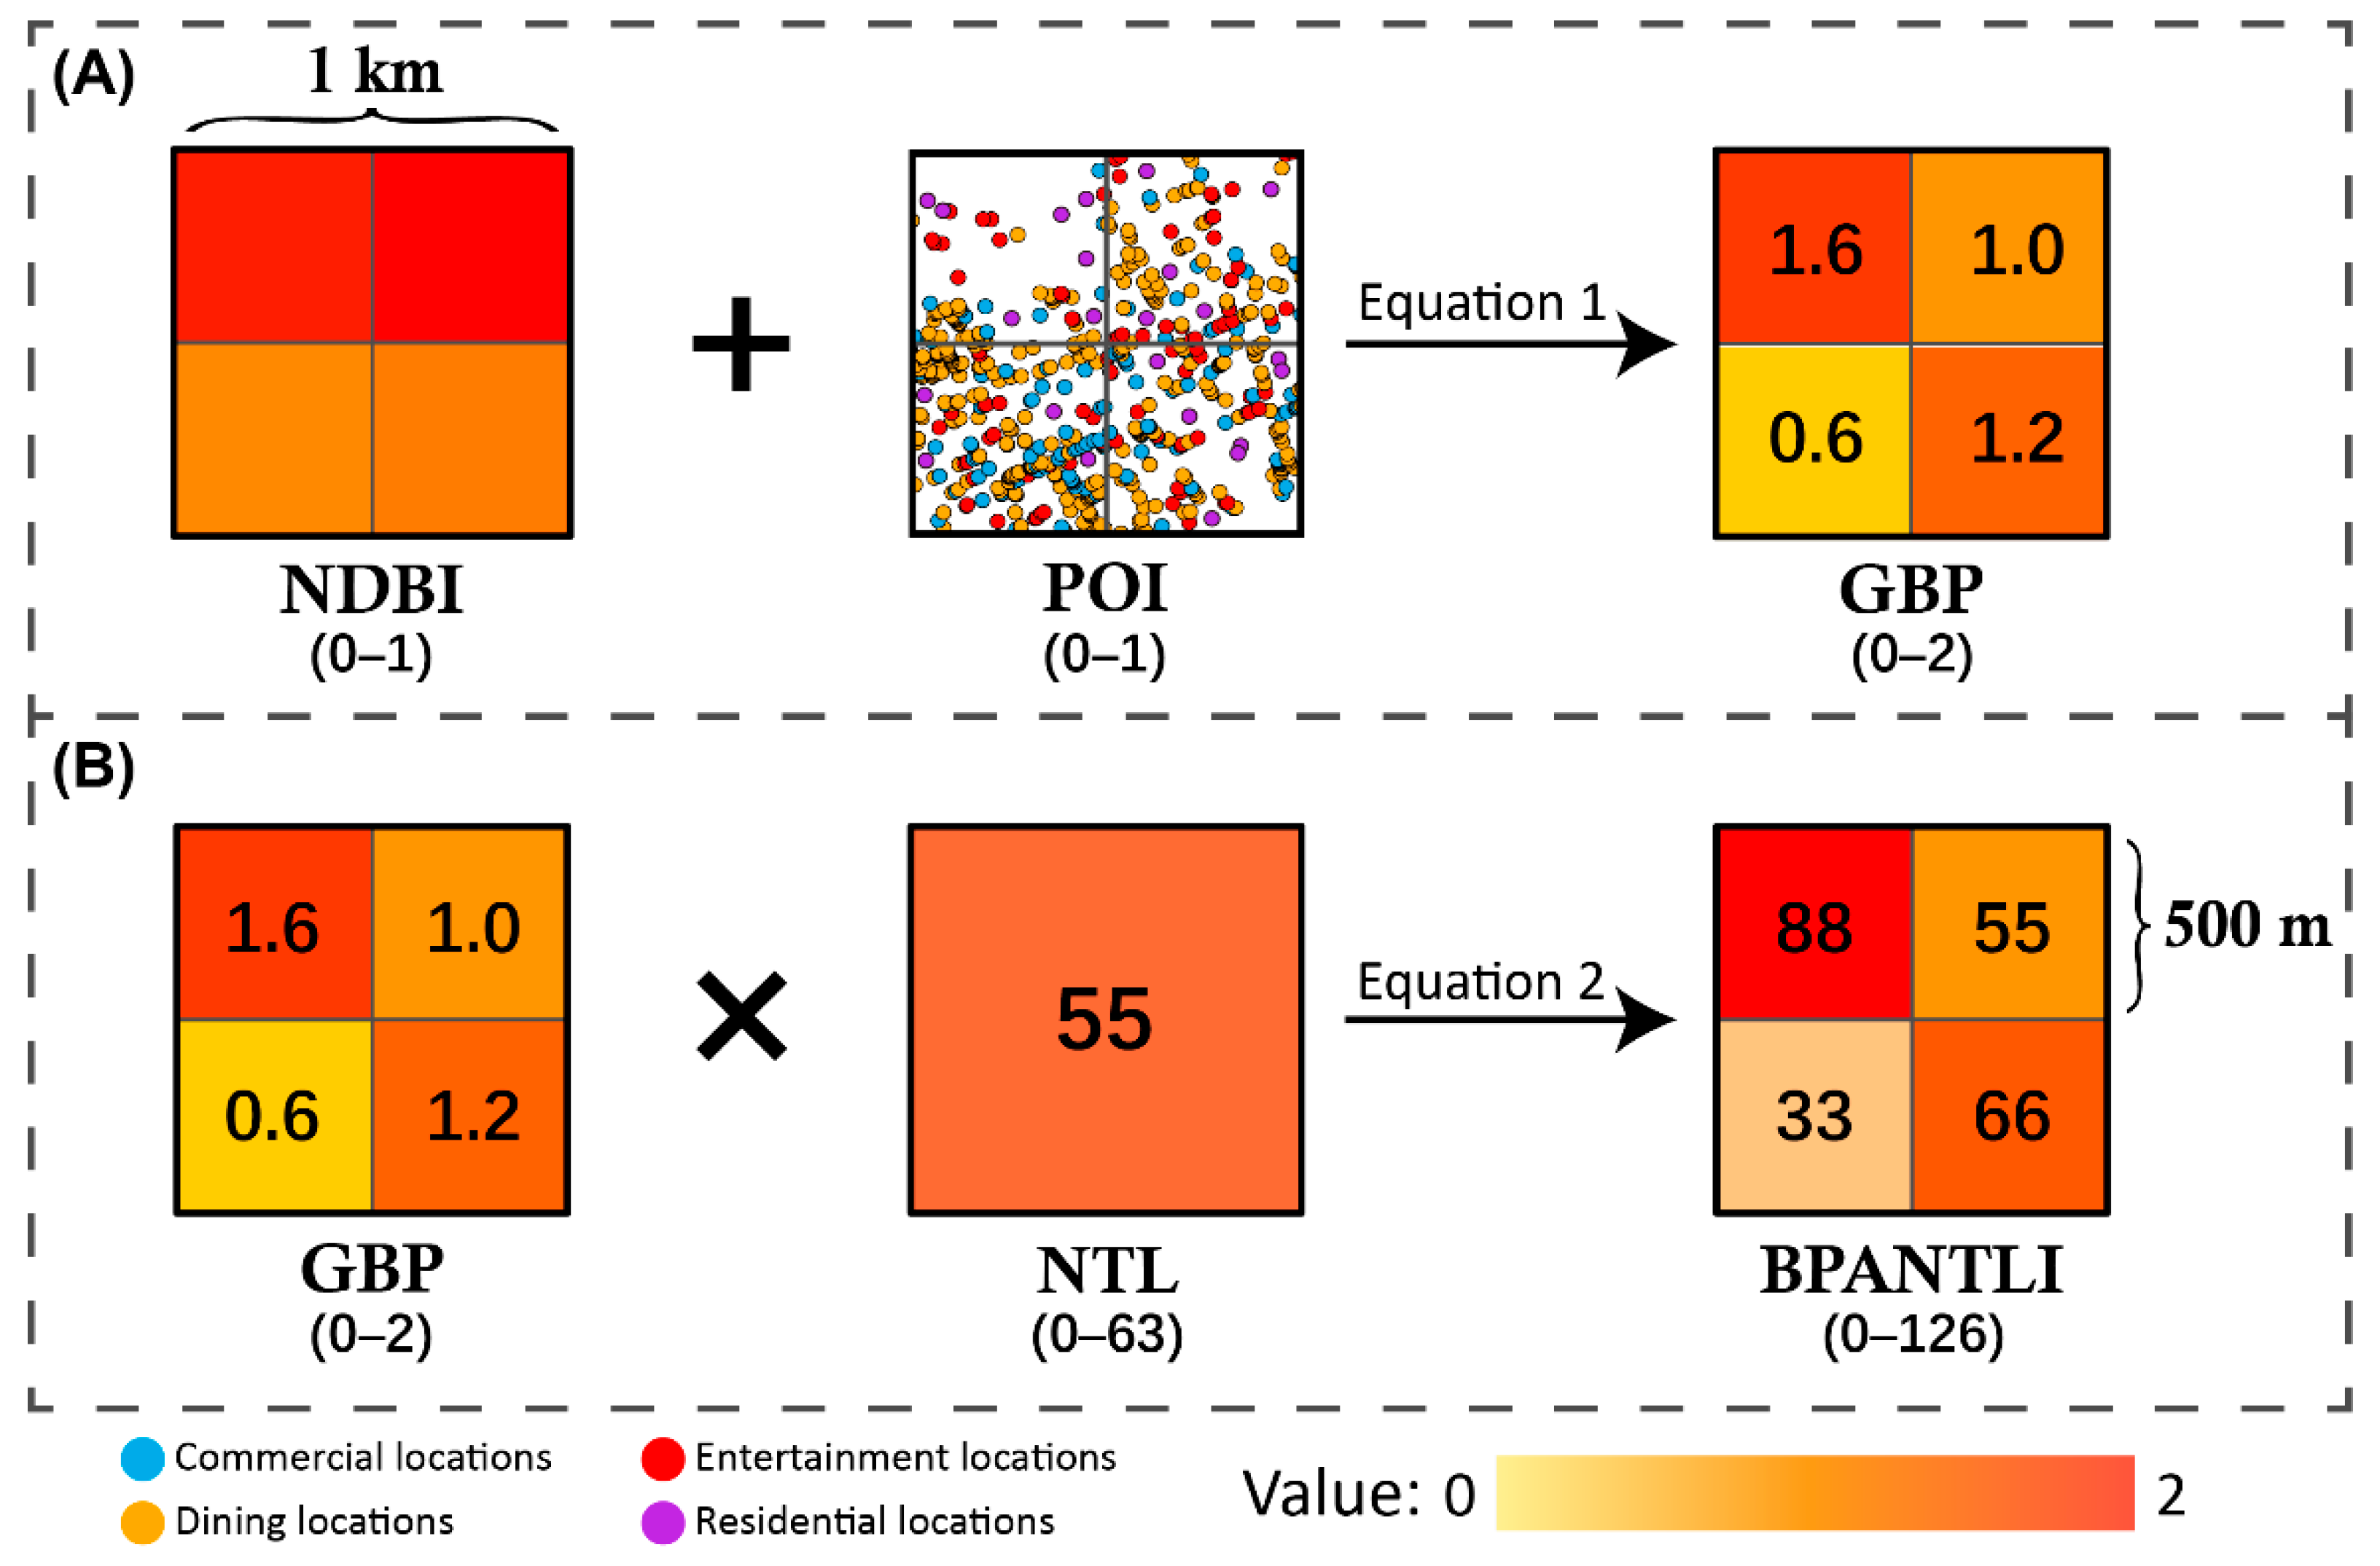
2.3.3. Developing BPANTLI
2.3.4. BPANTLI Validation
- (1)
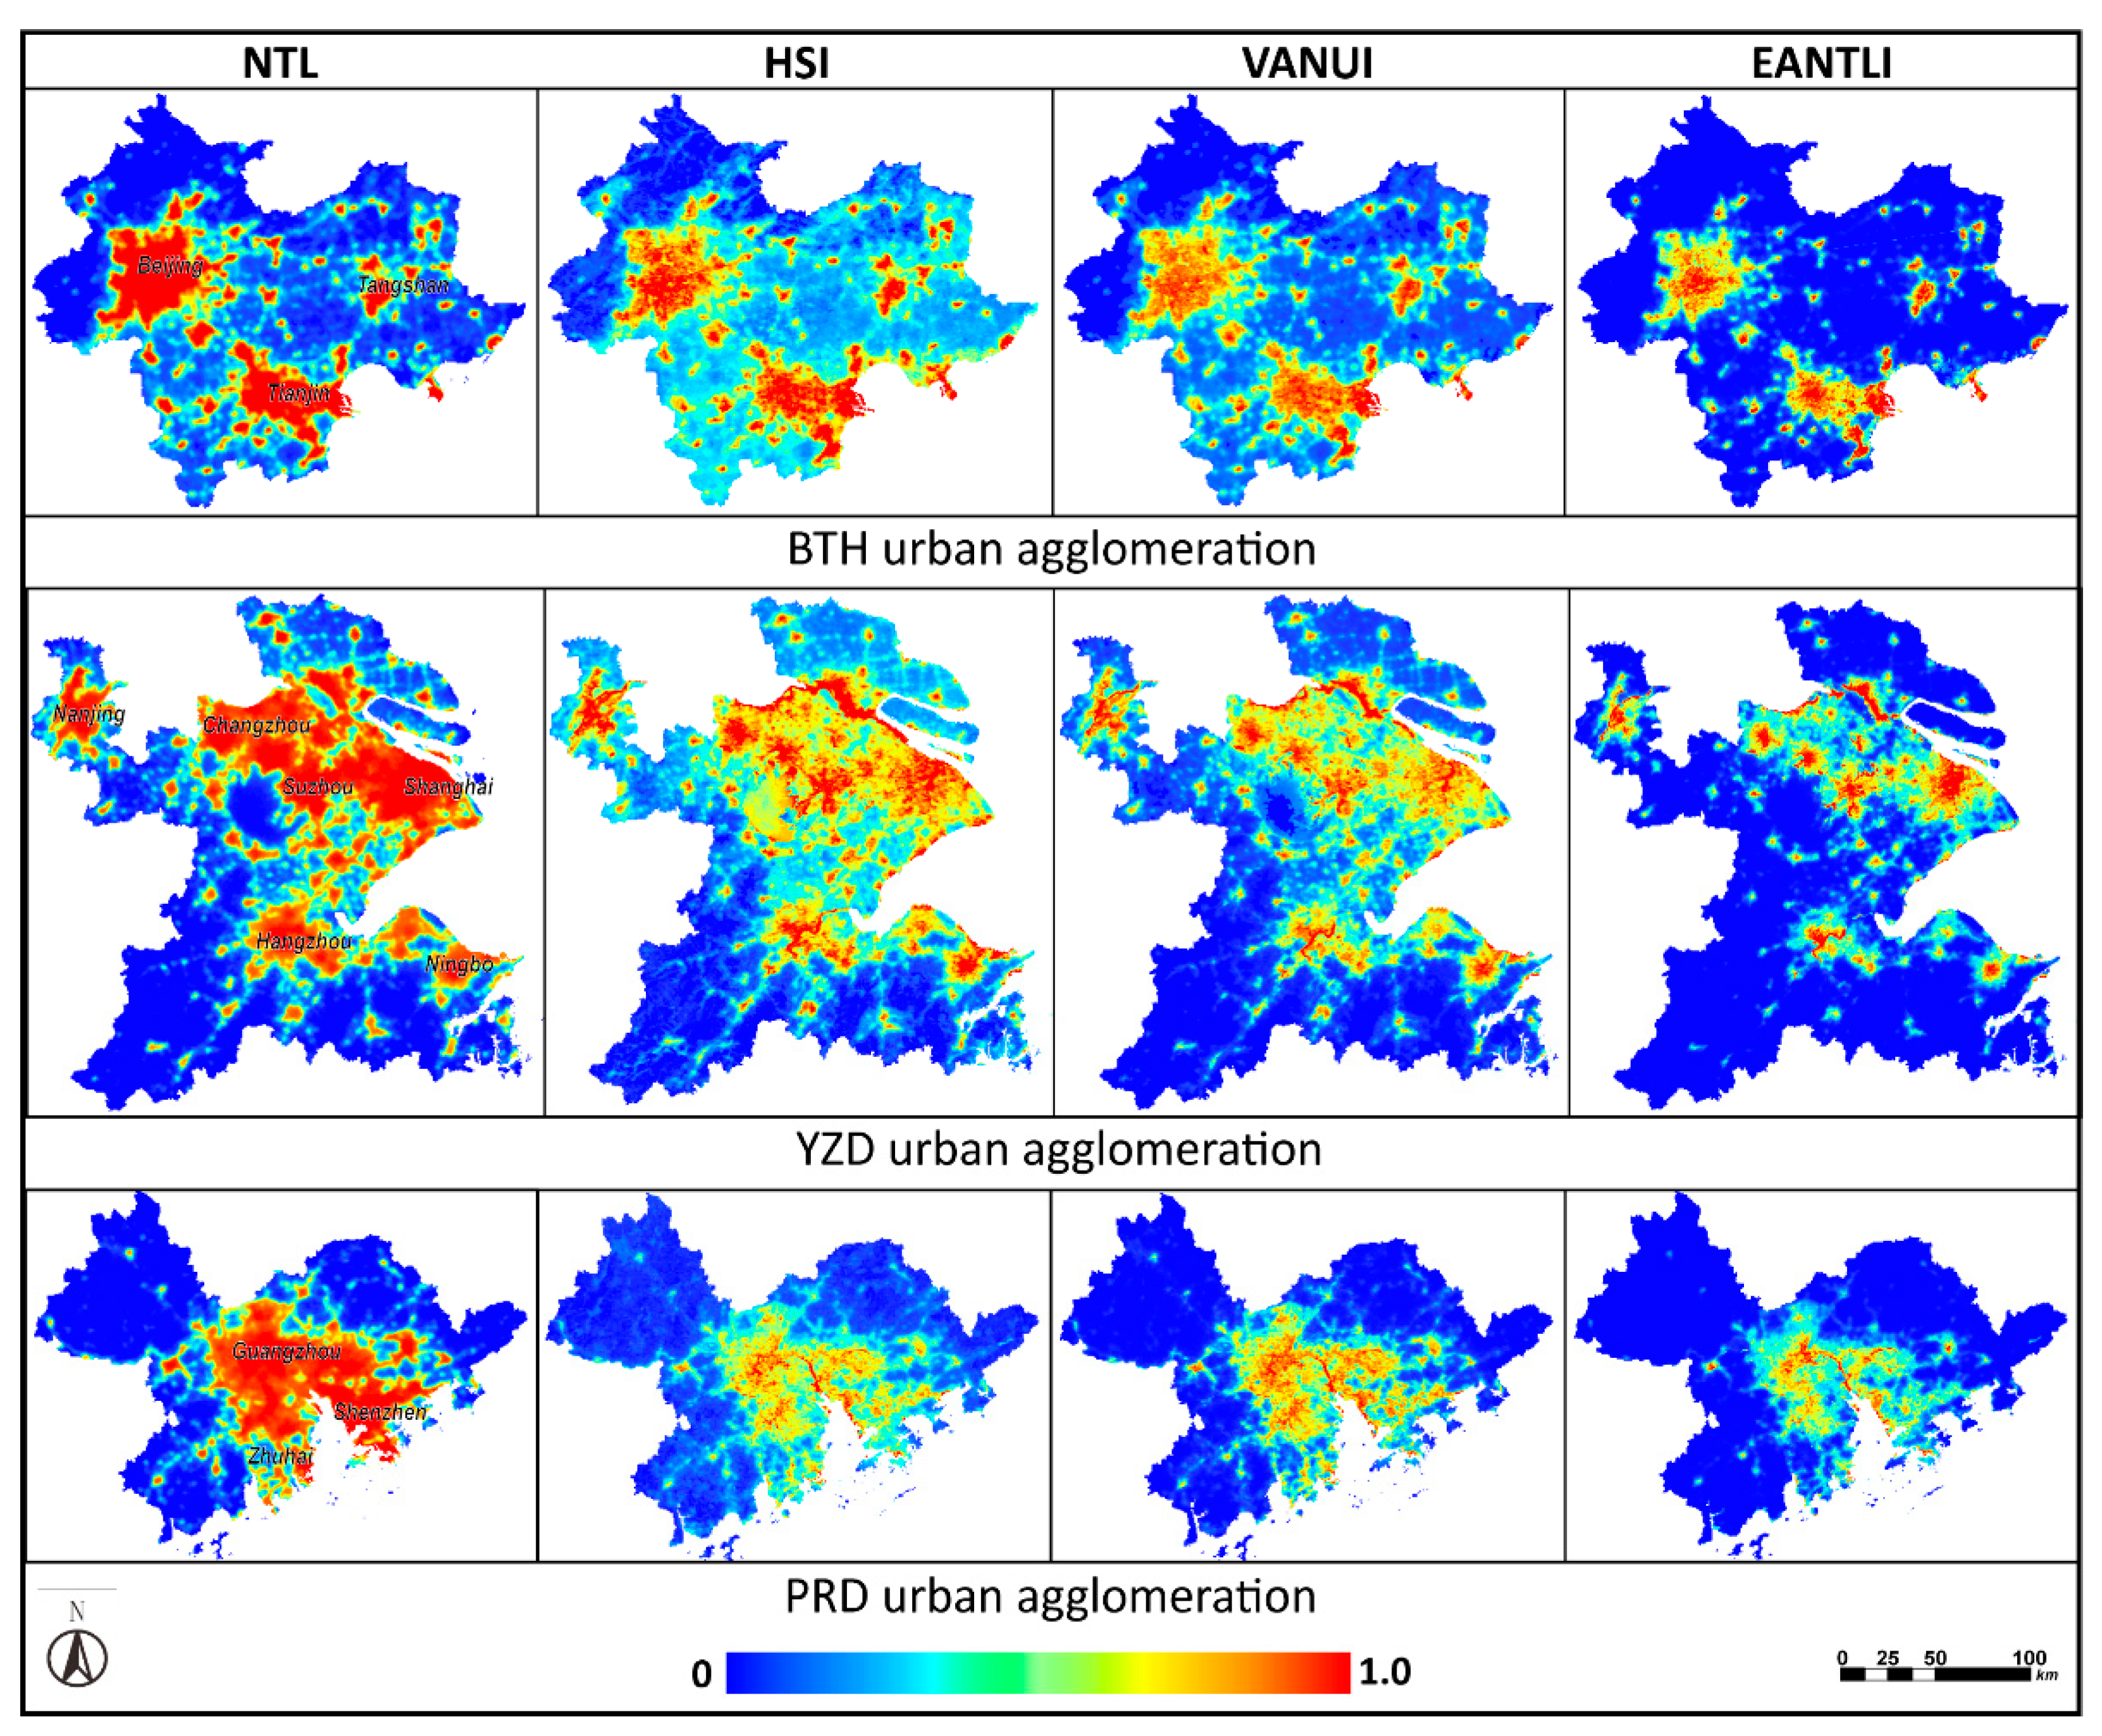
- Comparison between HSI, VANUI, EANTLI, and BPANTLI
- (2)
- Similarity with RCNTL and NPP/VIIRS data
- (3)
- Capacity to estimate electricity consumption, GDP, and population density
3. Results
3.1. Effectiveness of NDVI, EVI, NDBI, and POI in Reflecting NTL Distribution
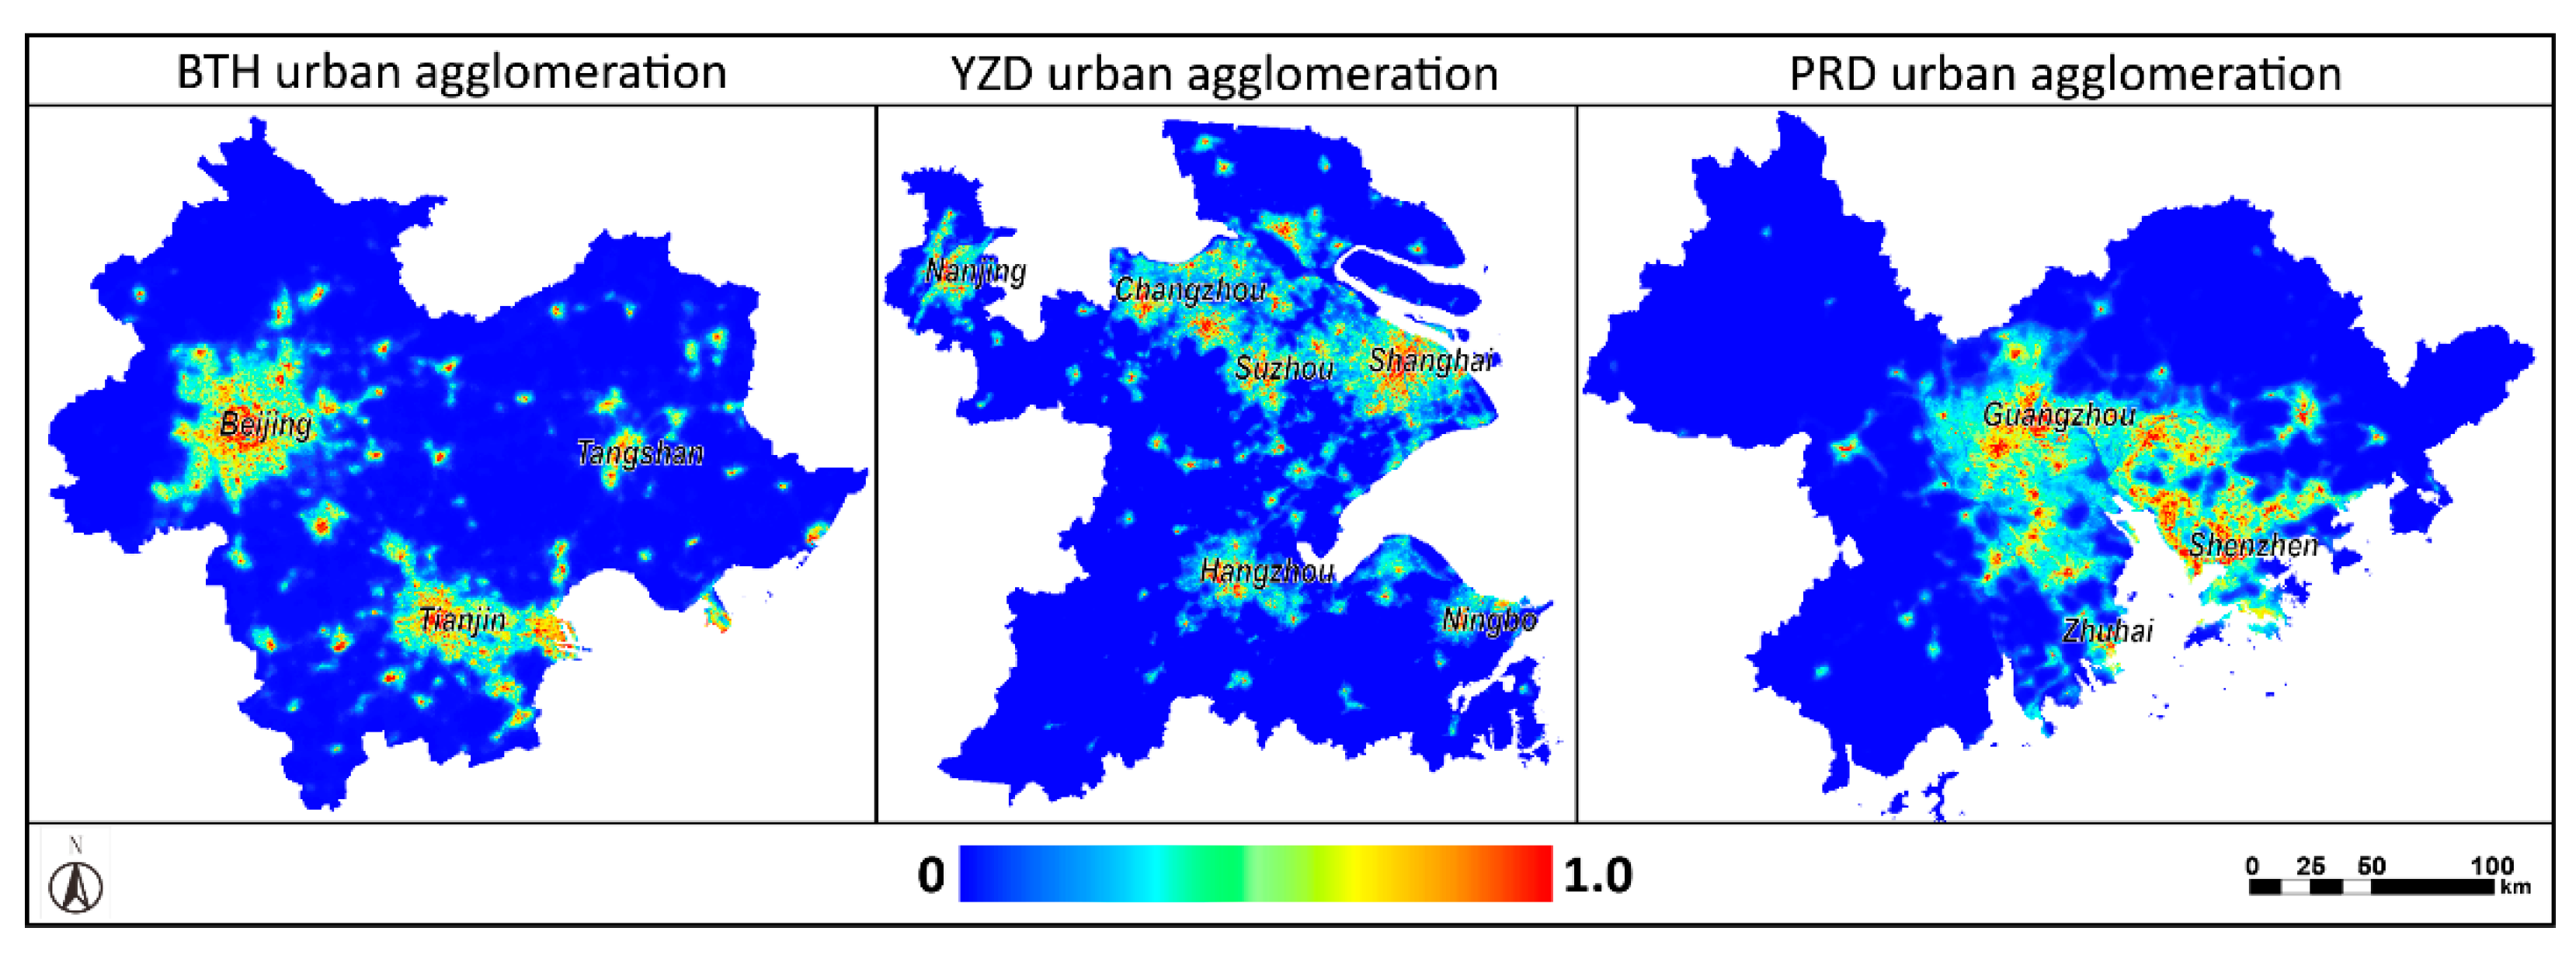
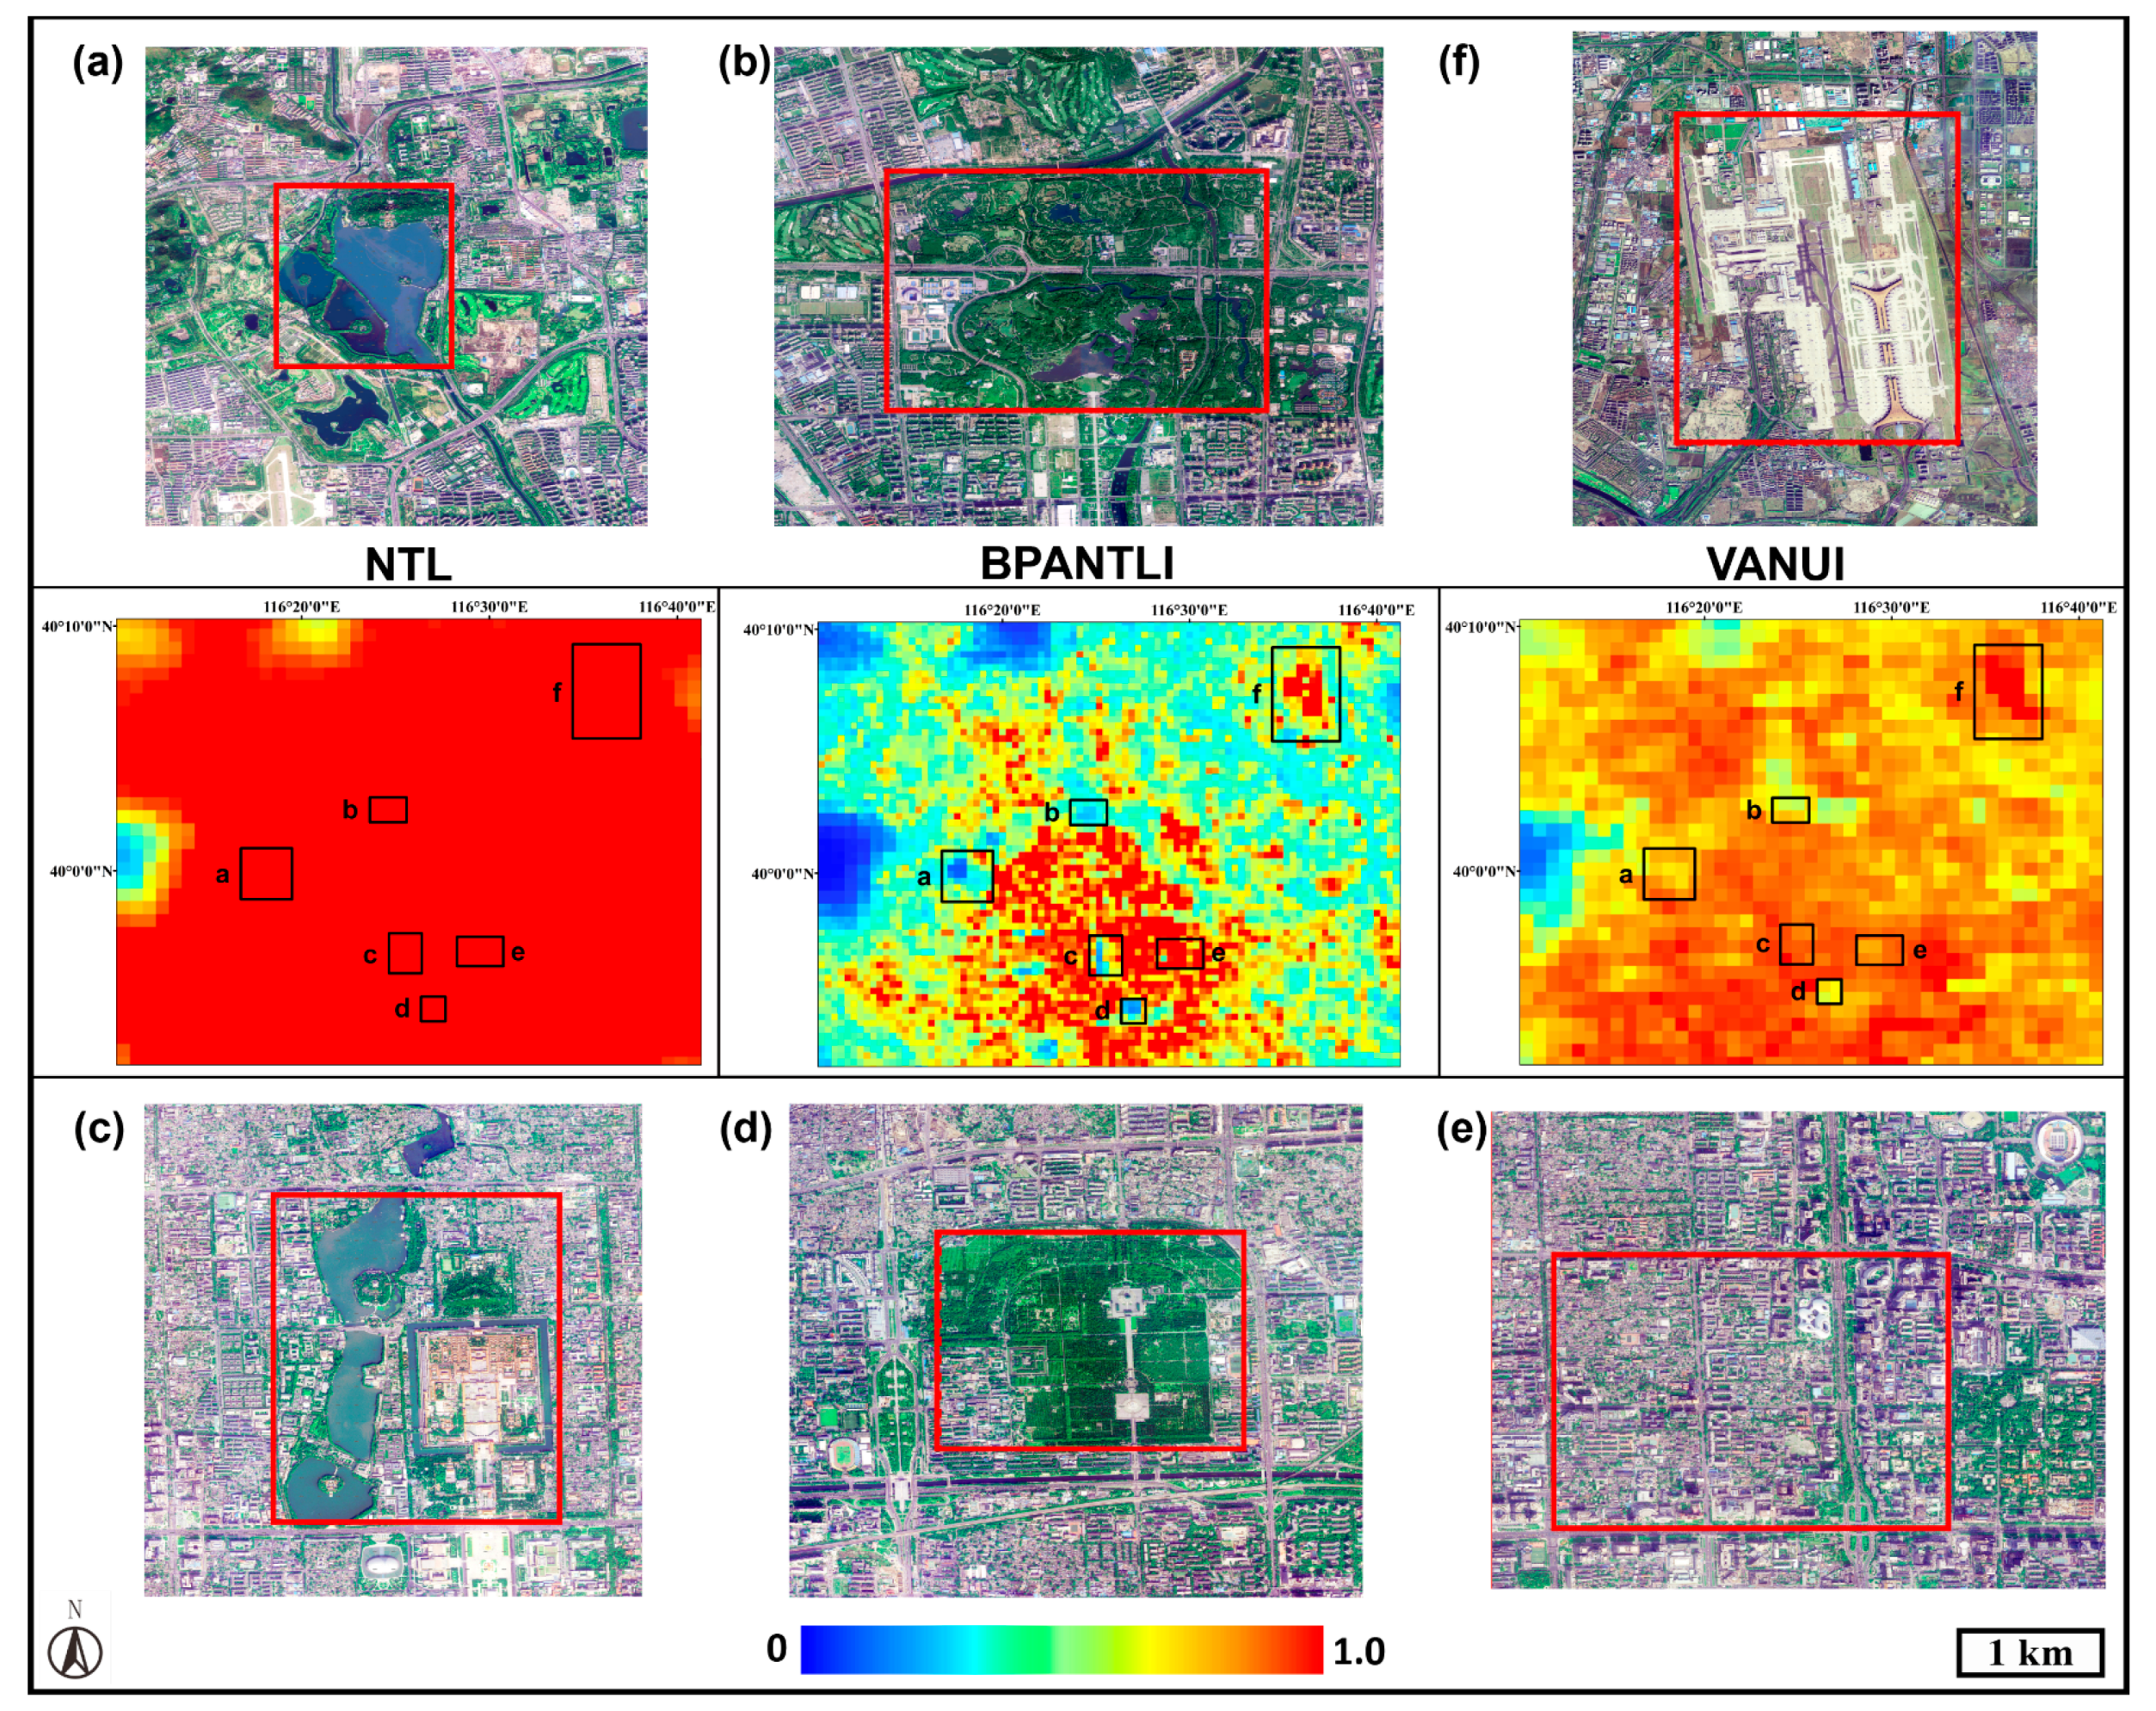
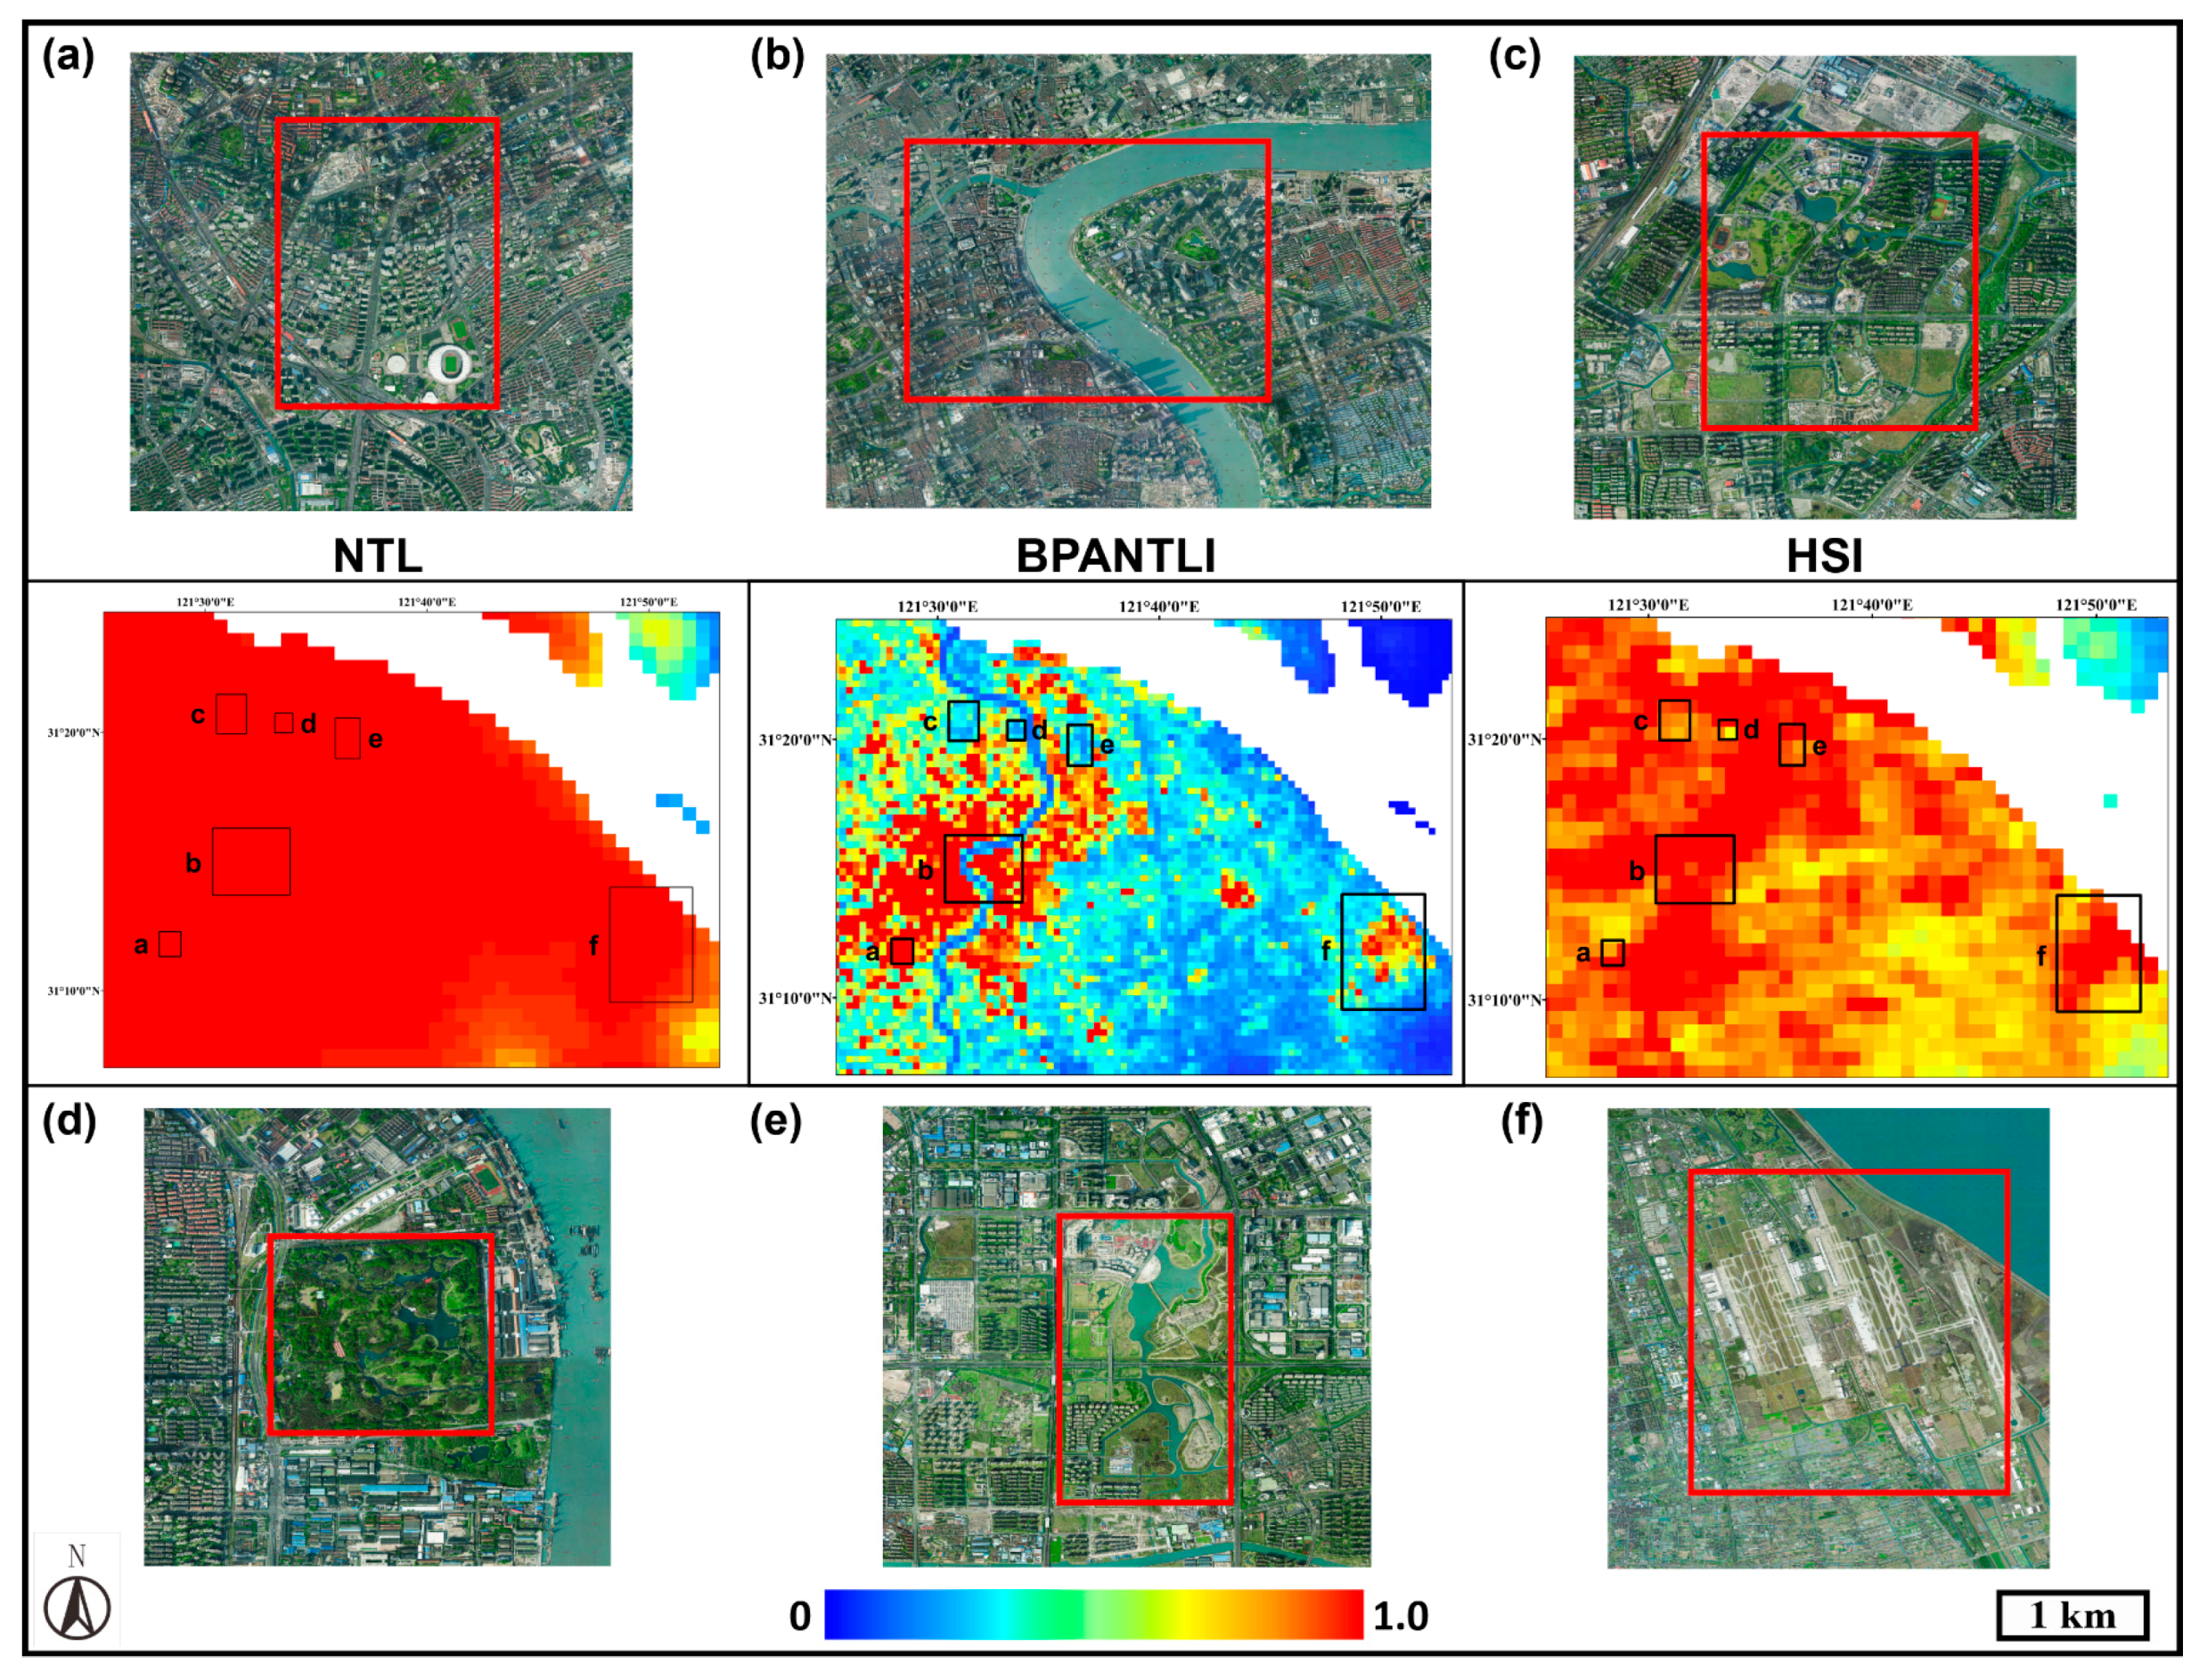
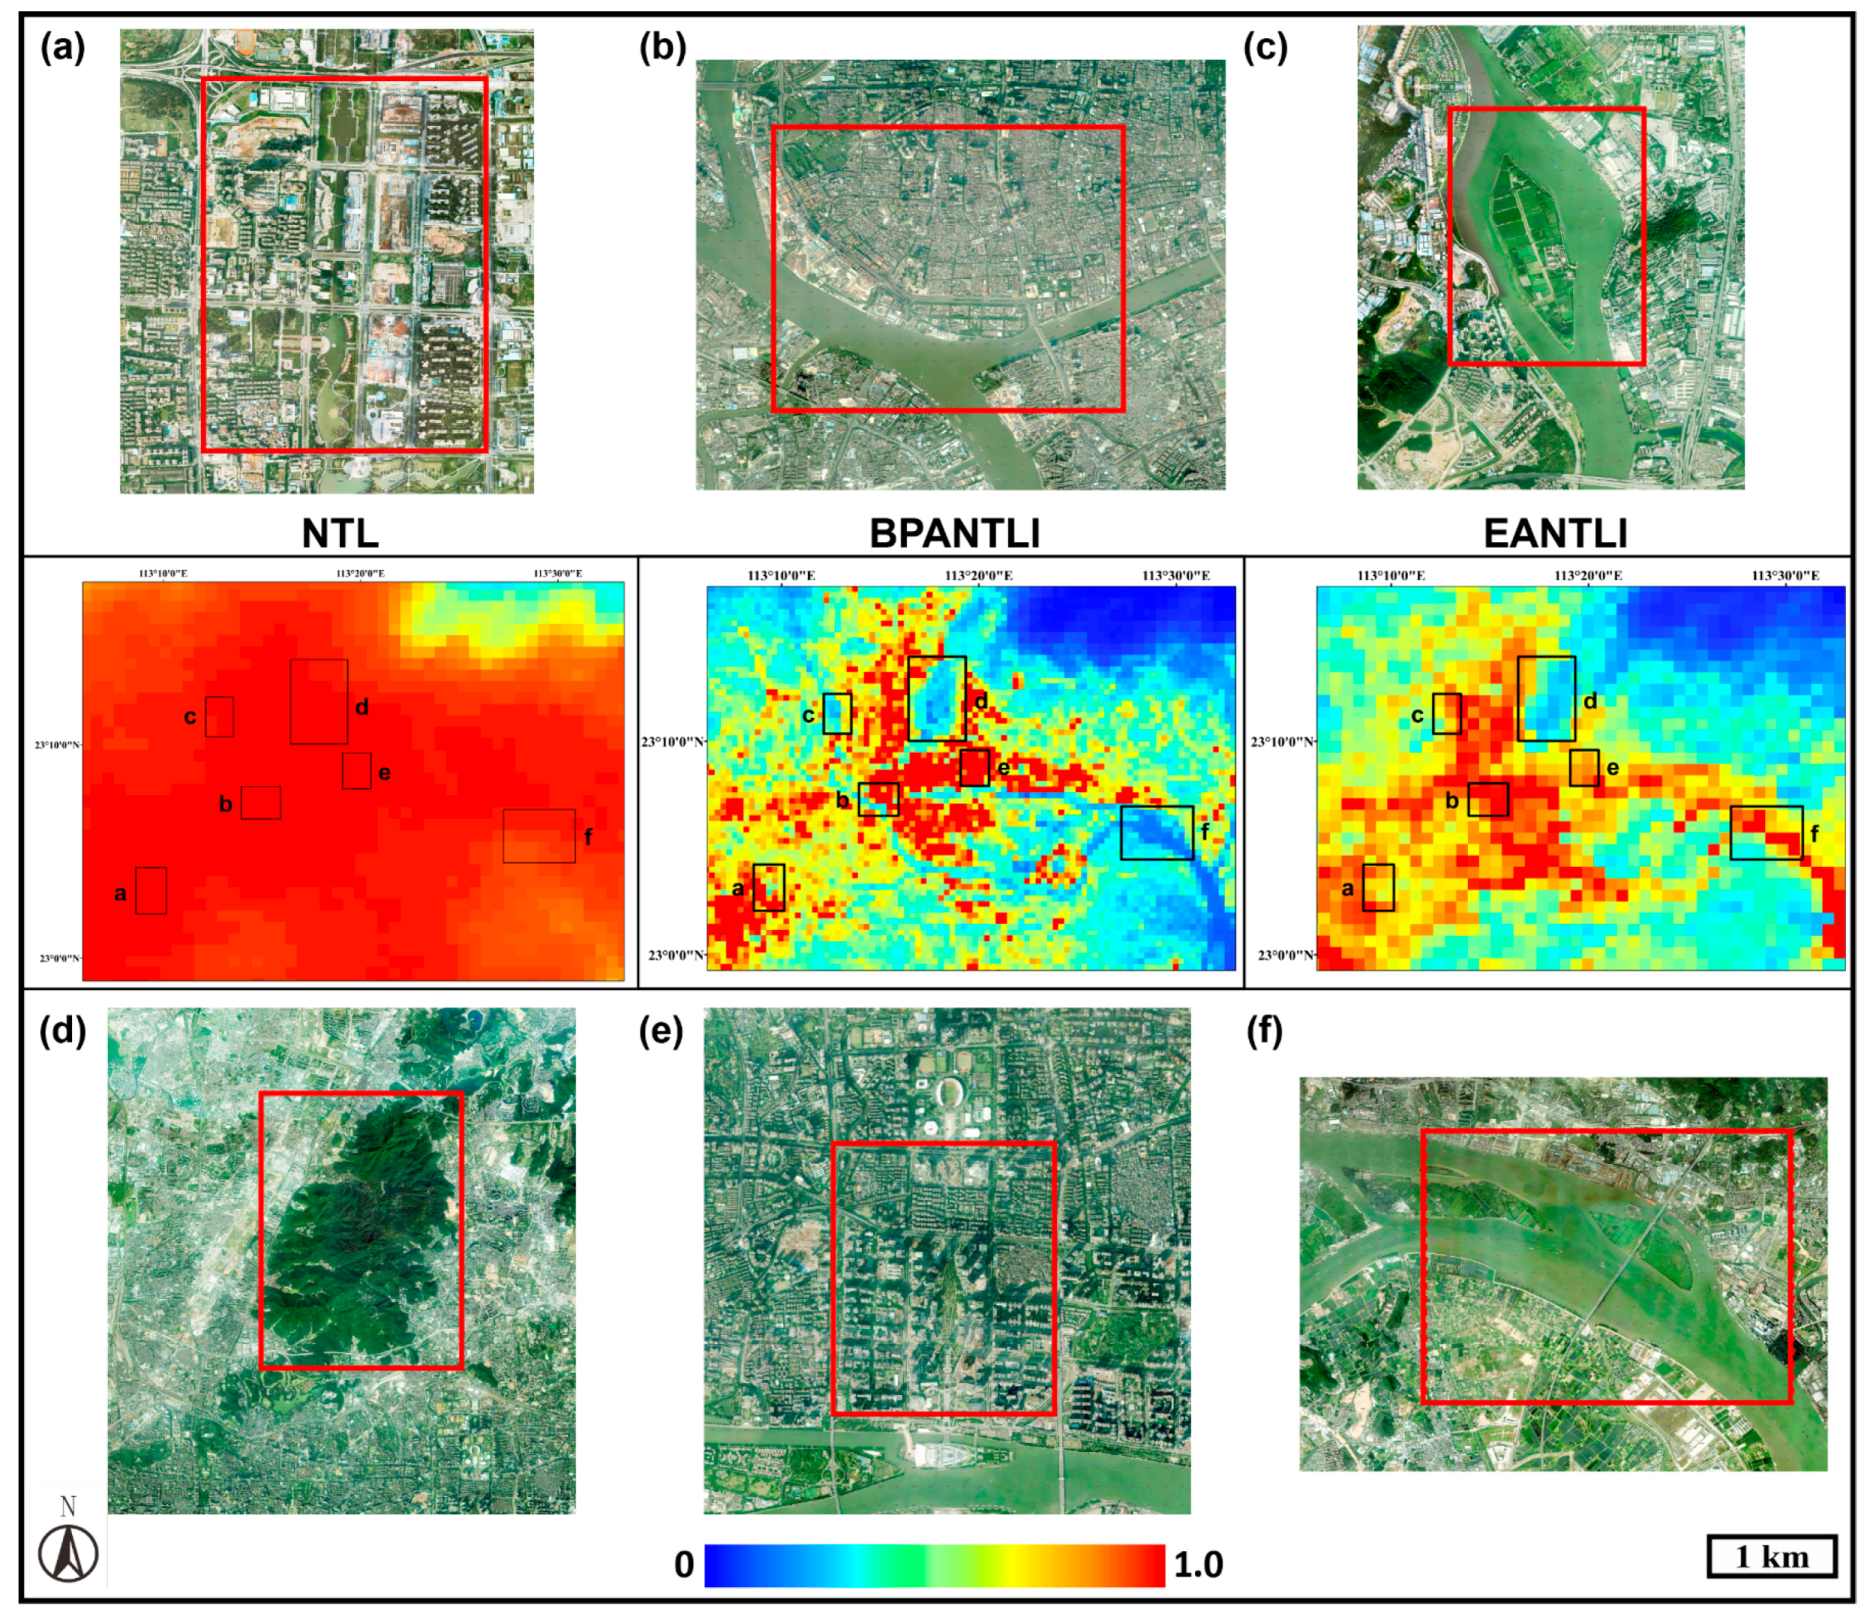
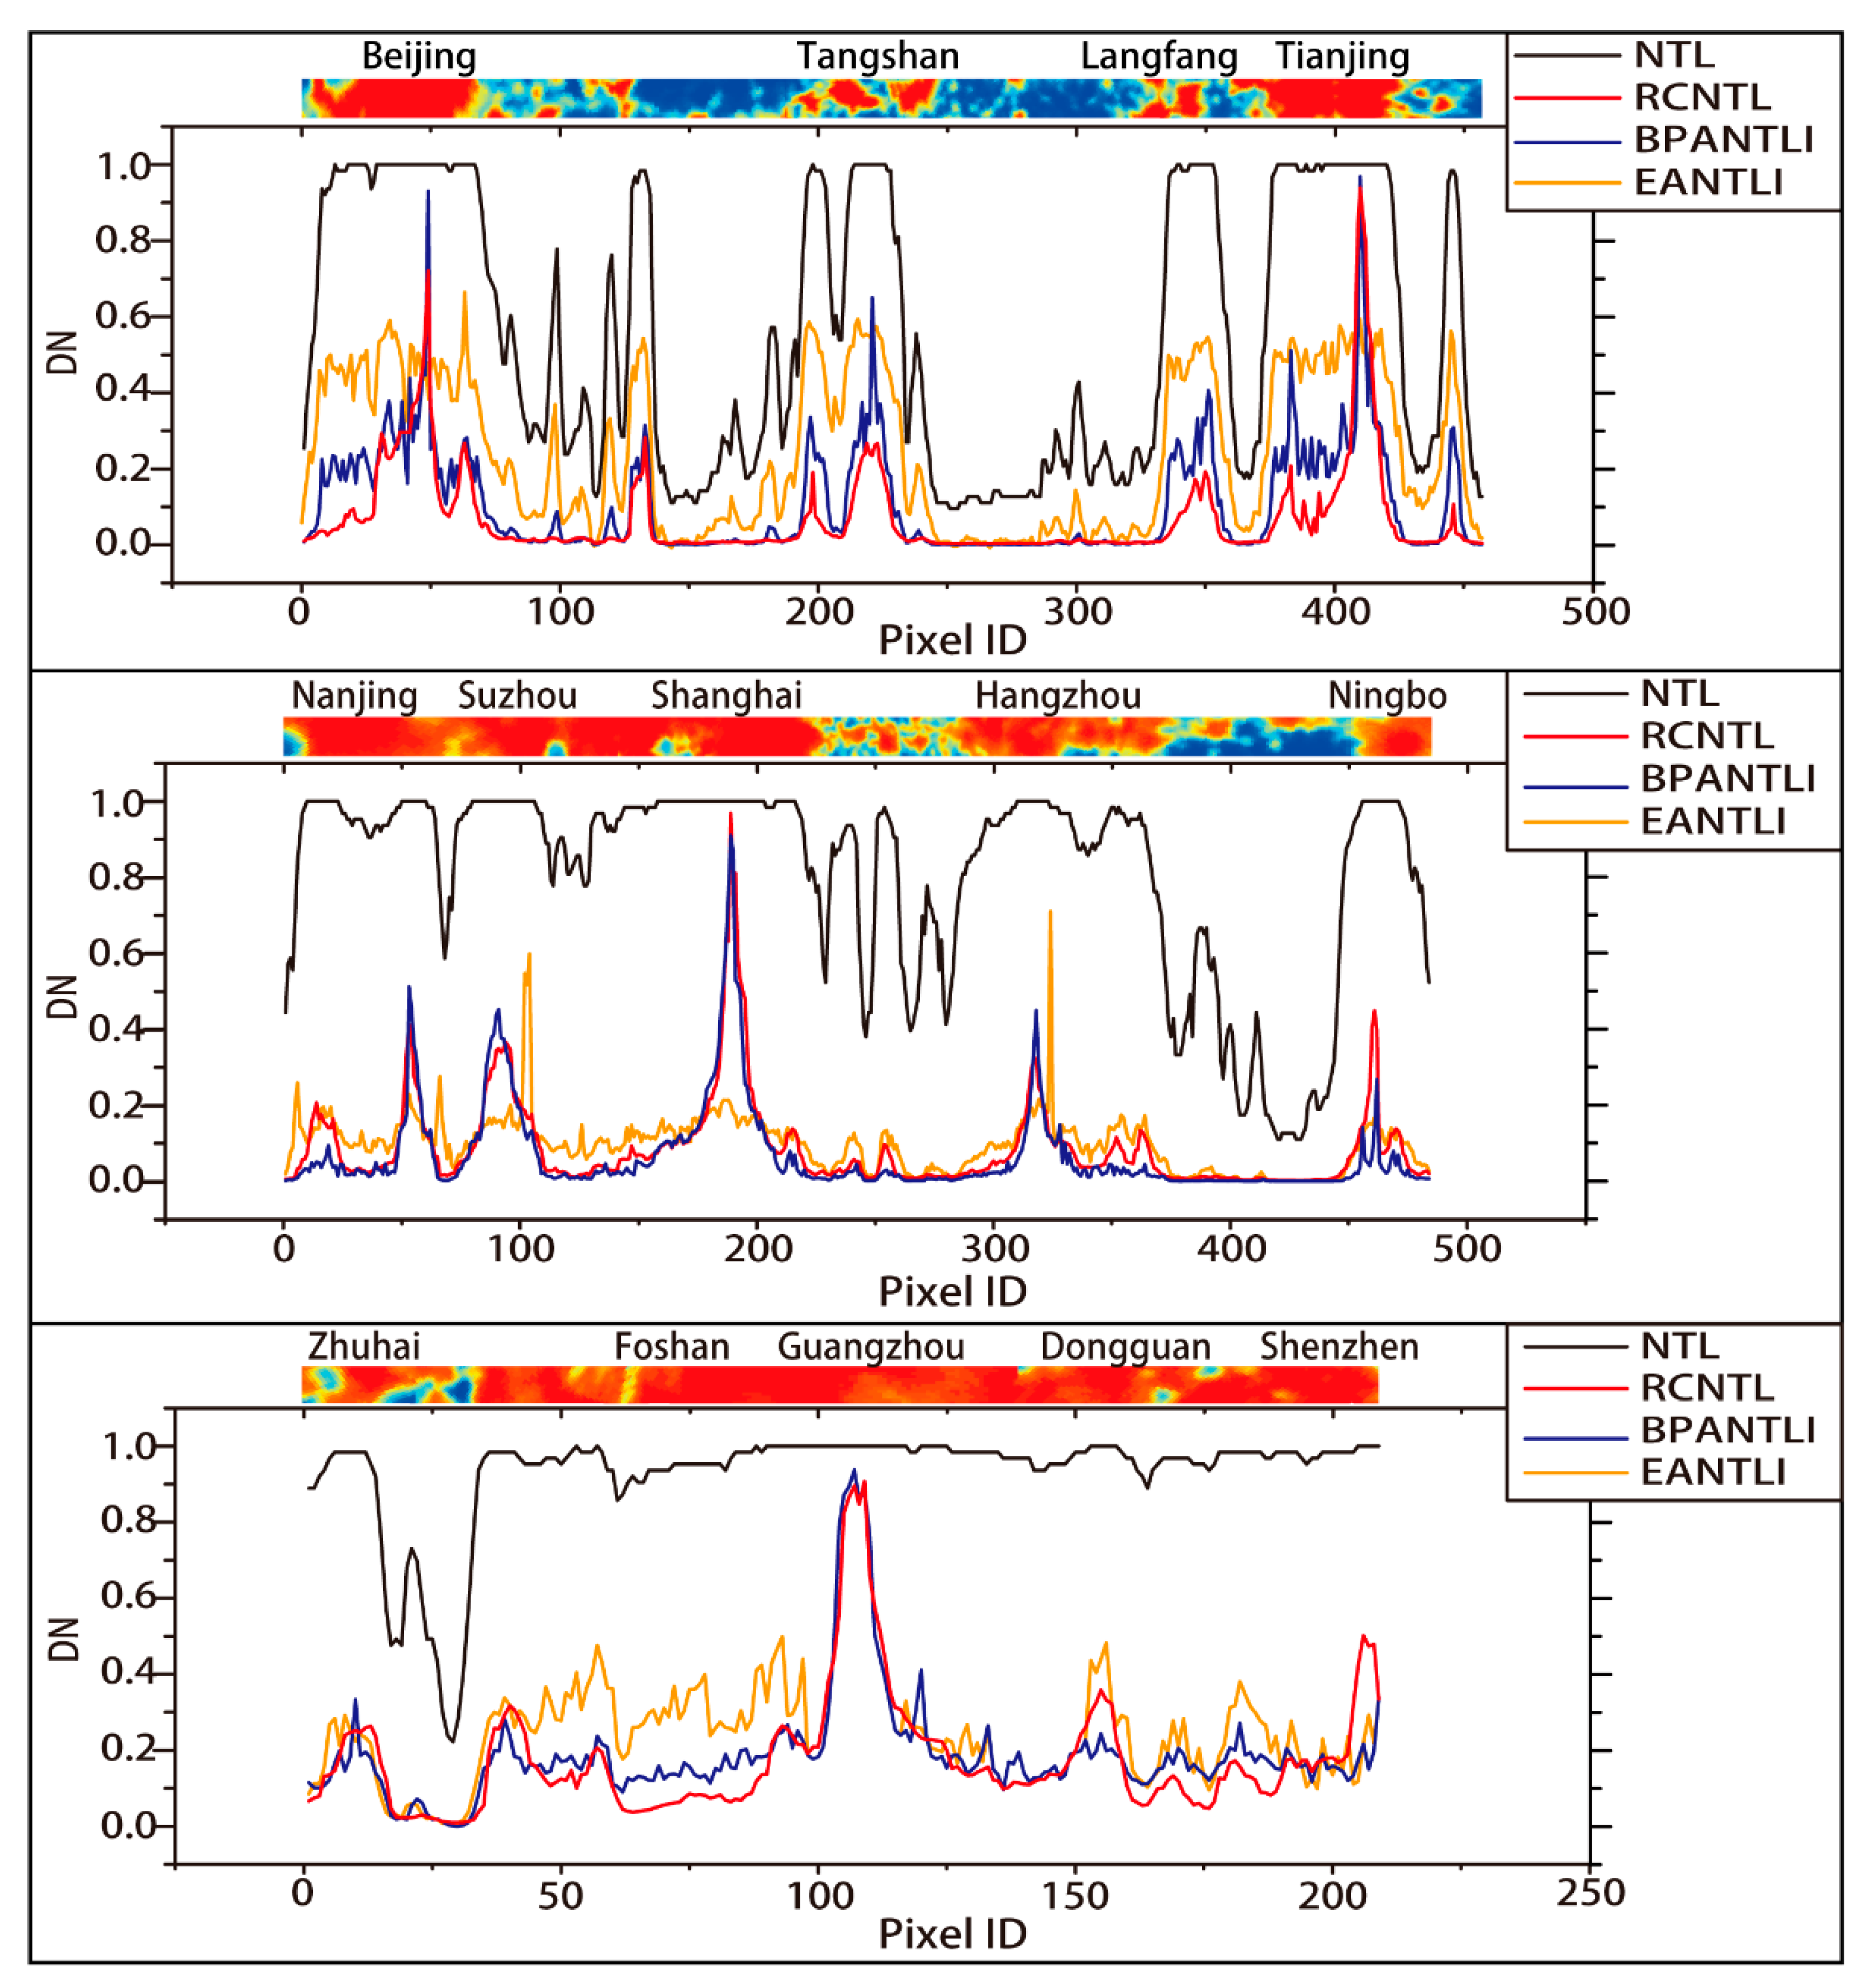
3.2. Desaturation Capacity of BPANTLI
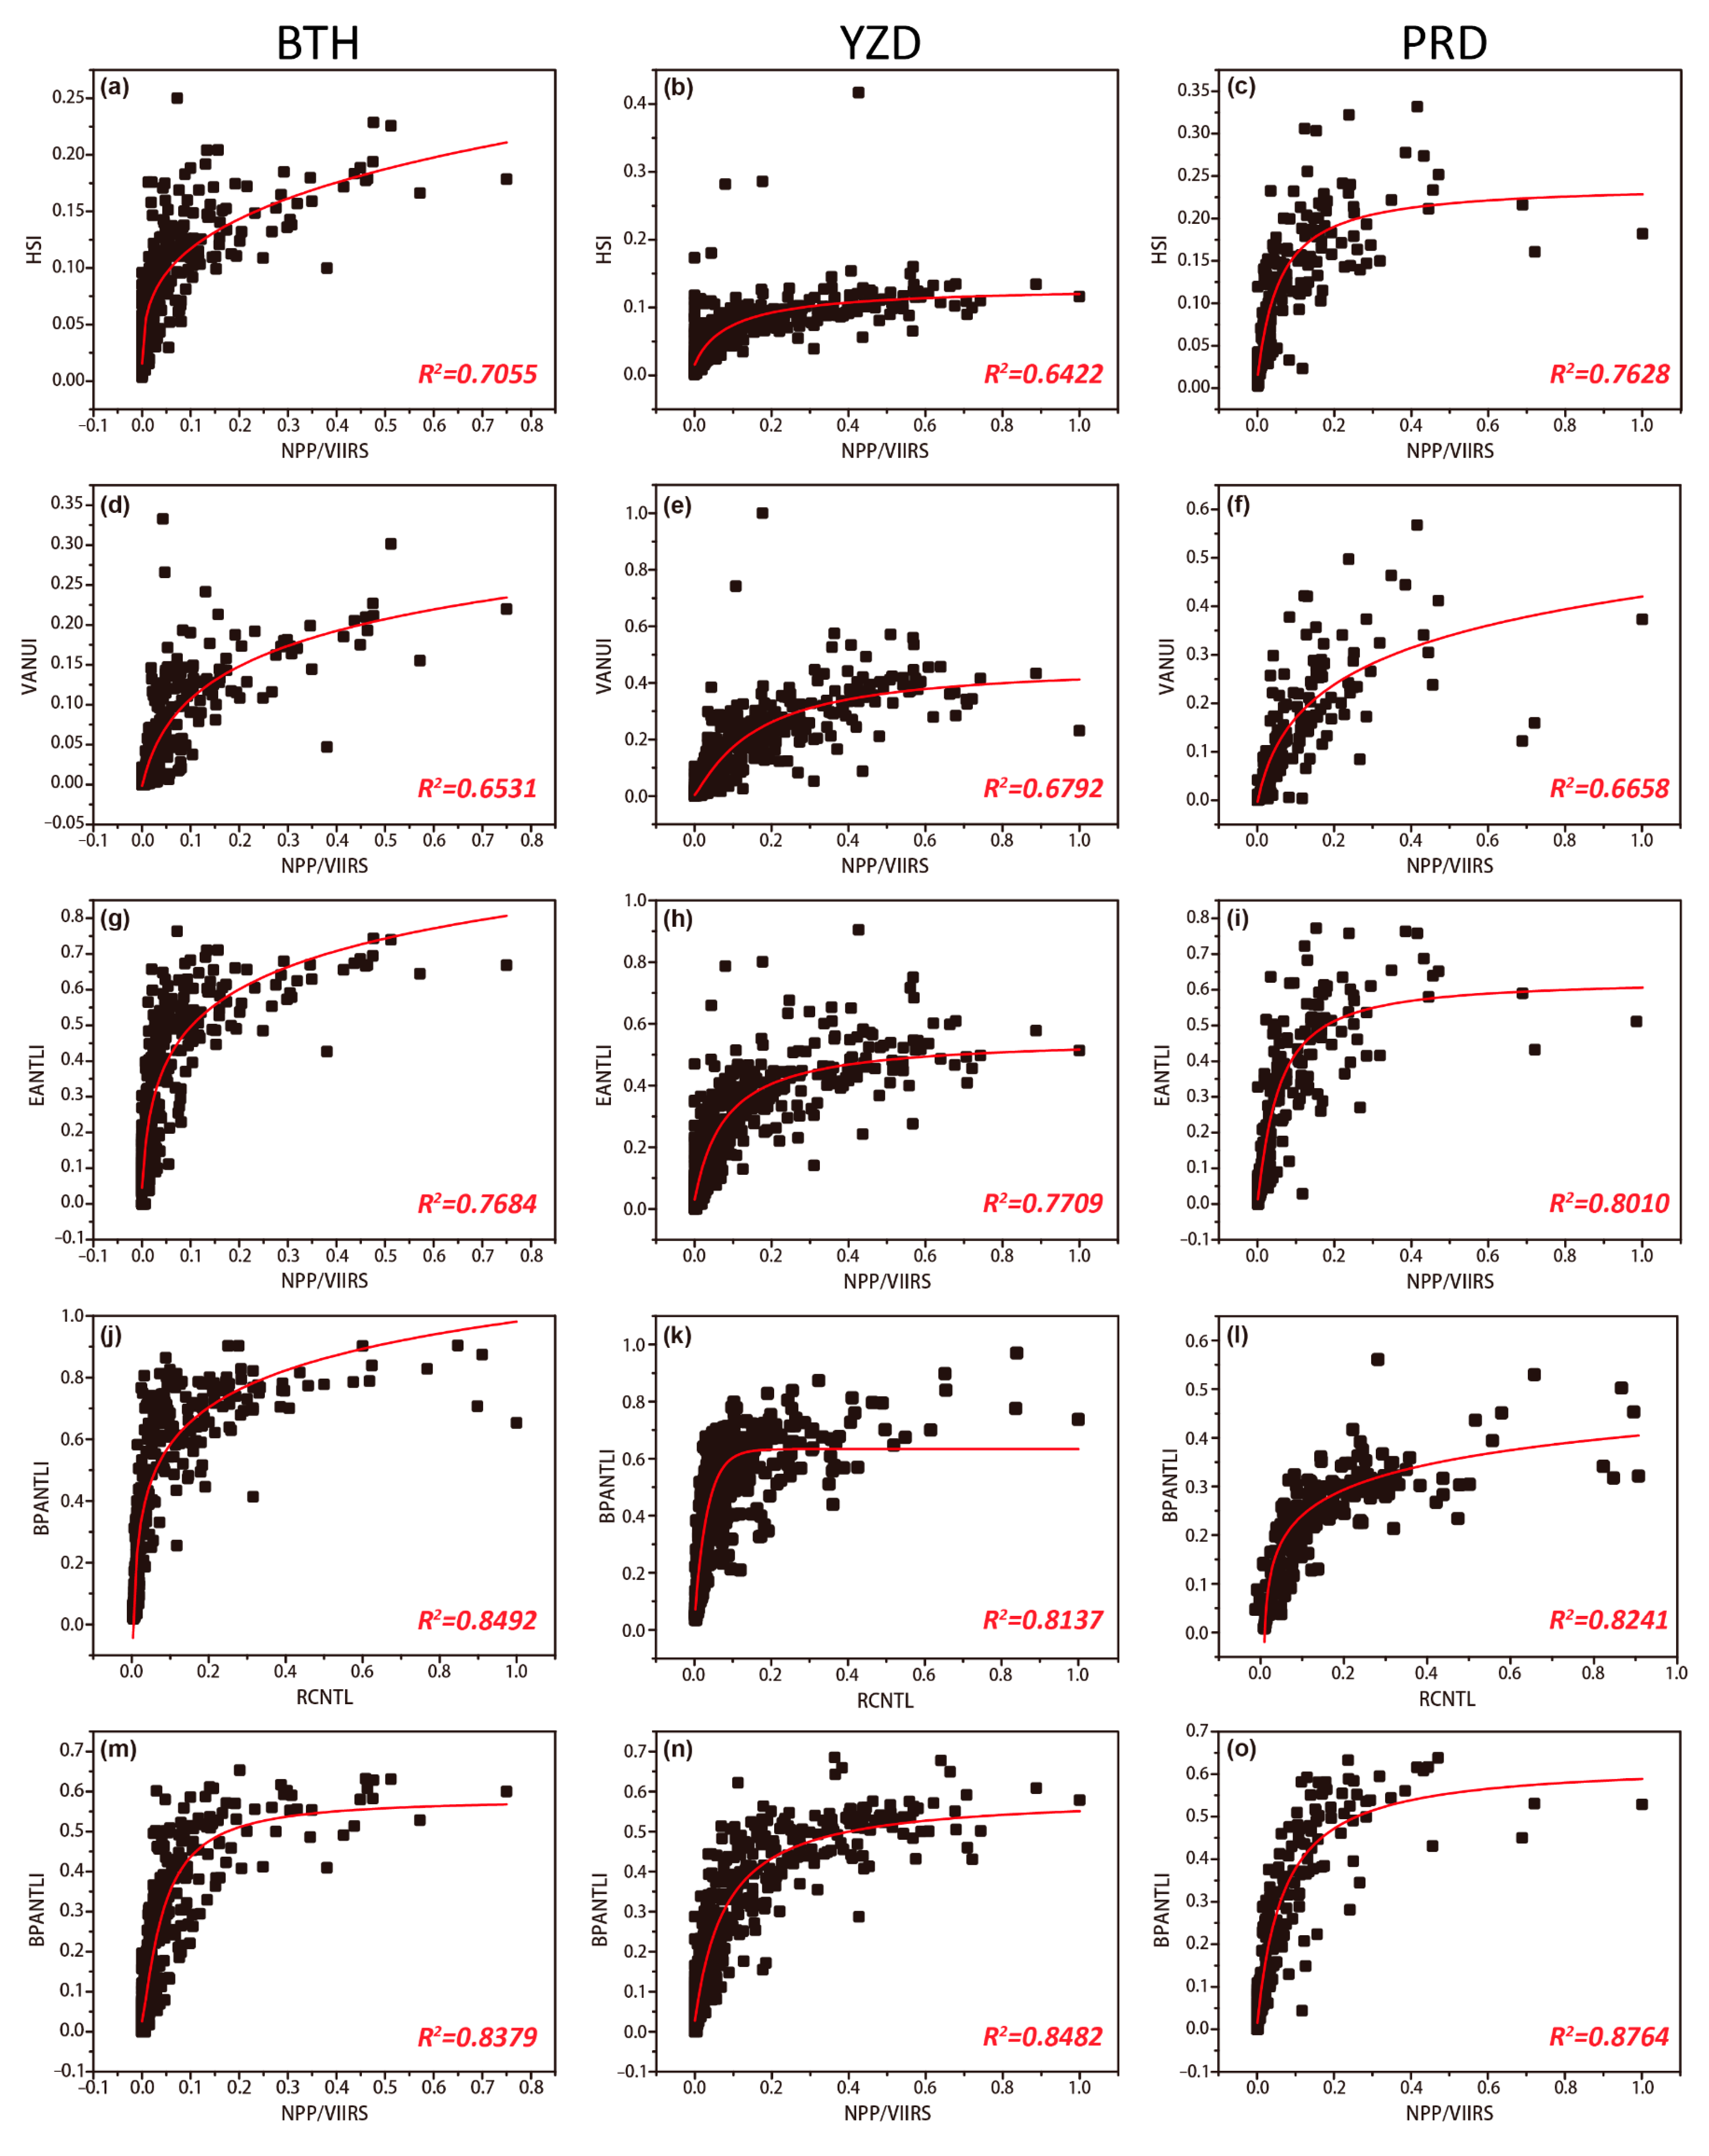
3.3. Similarity between BPANTLI and RCNTL and NPP/VIIRS Data
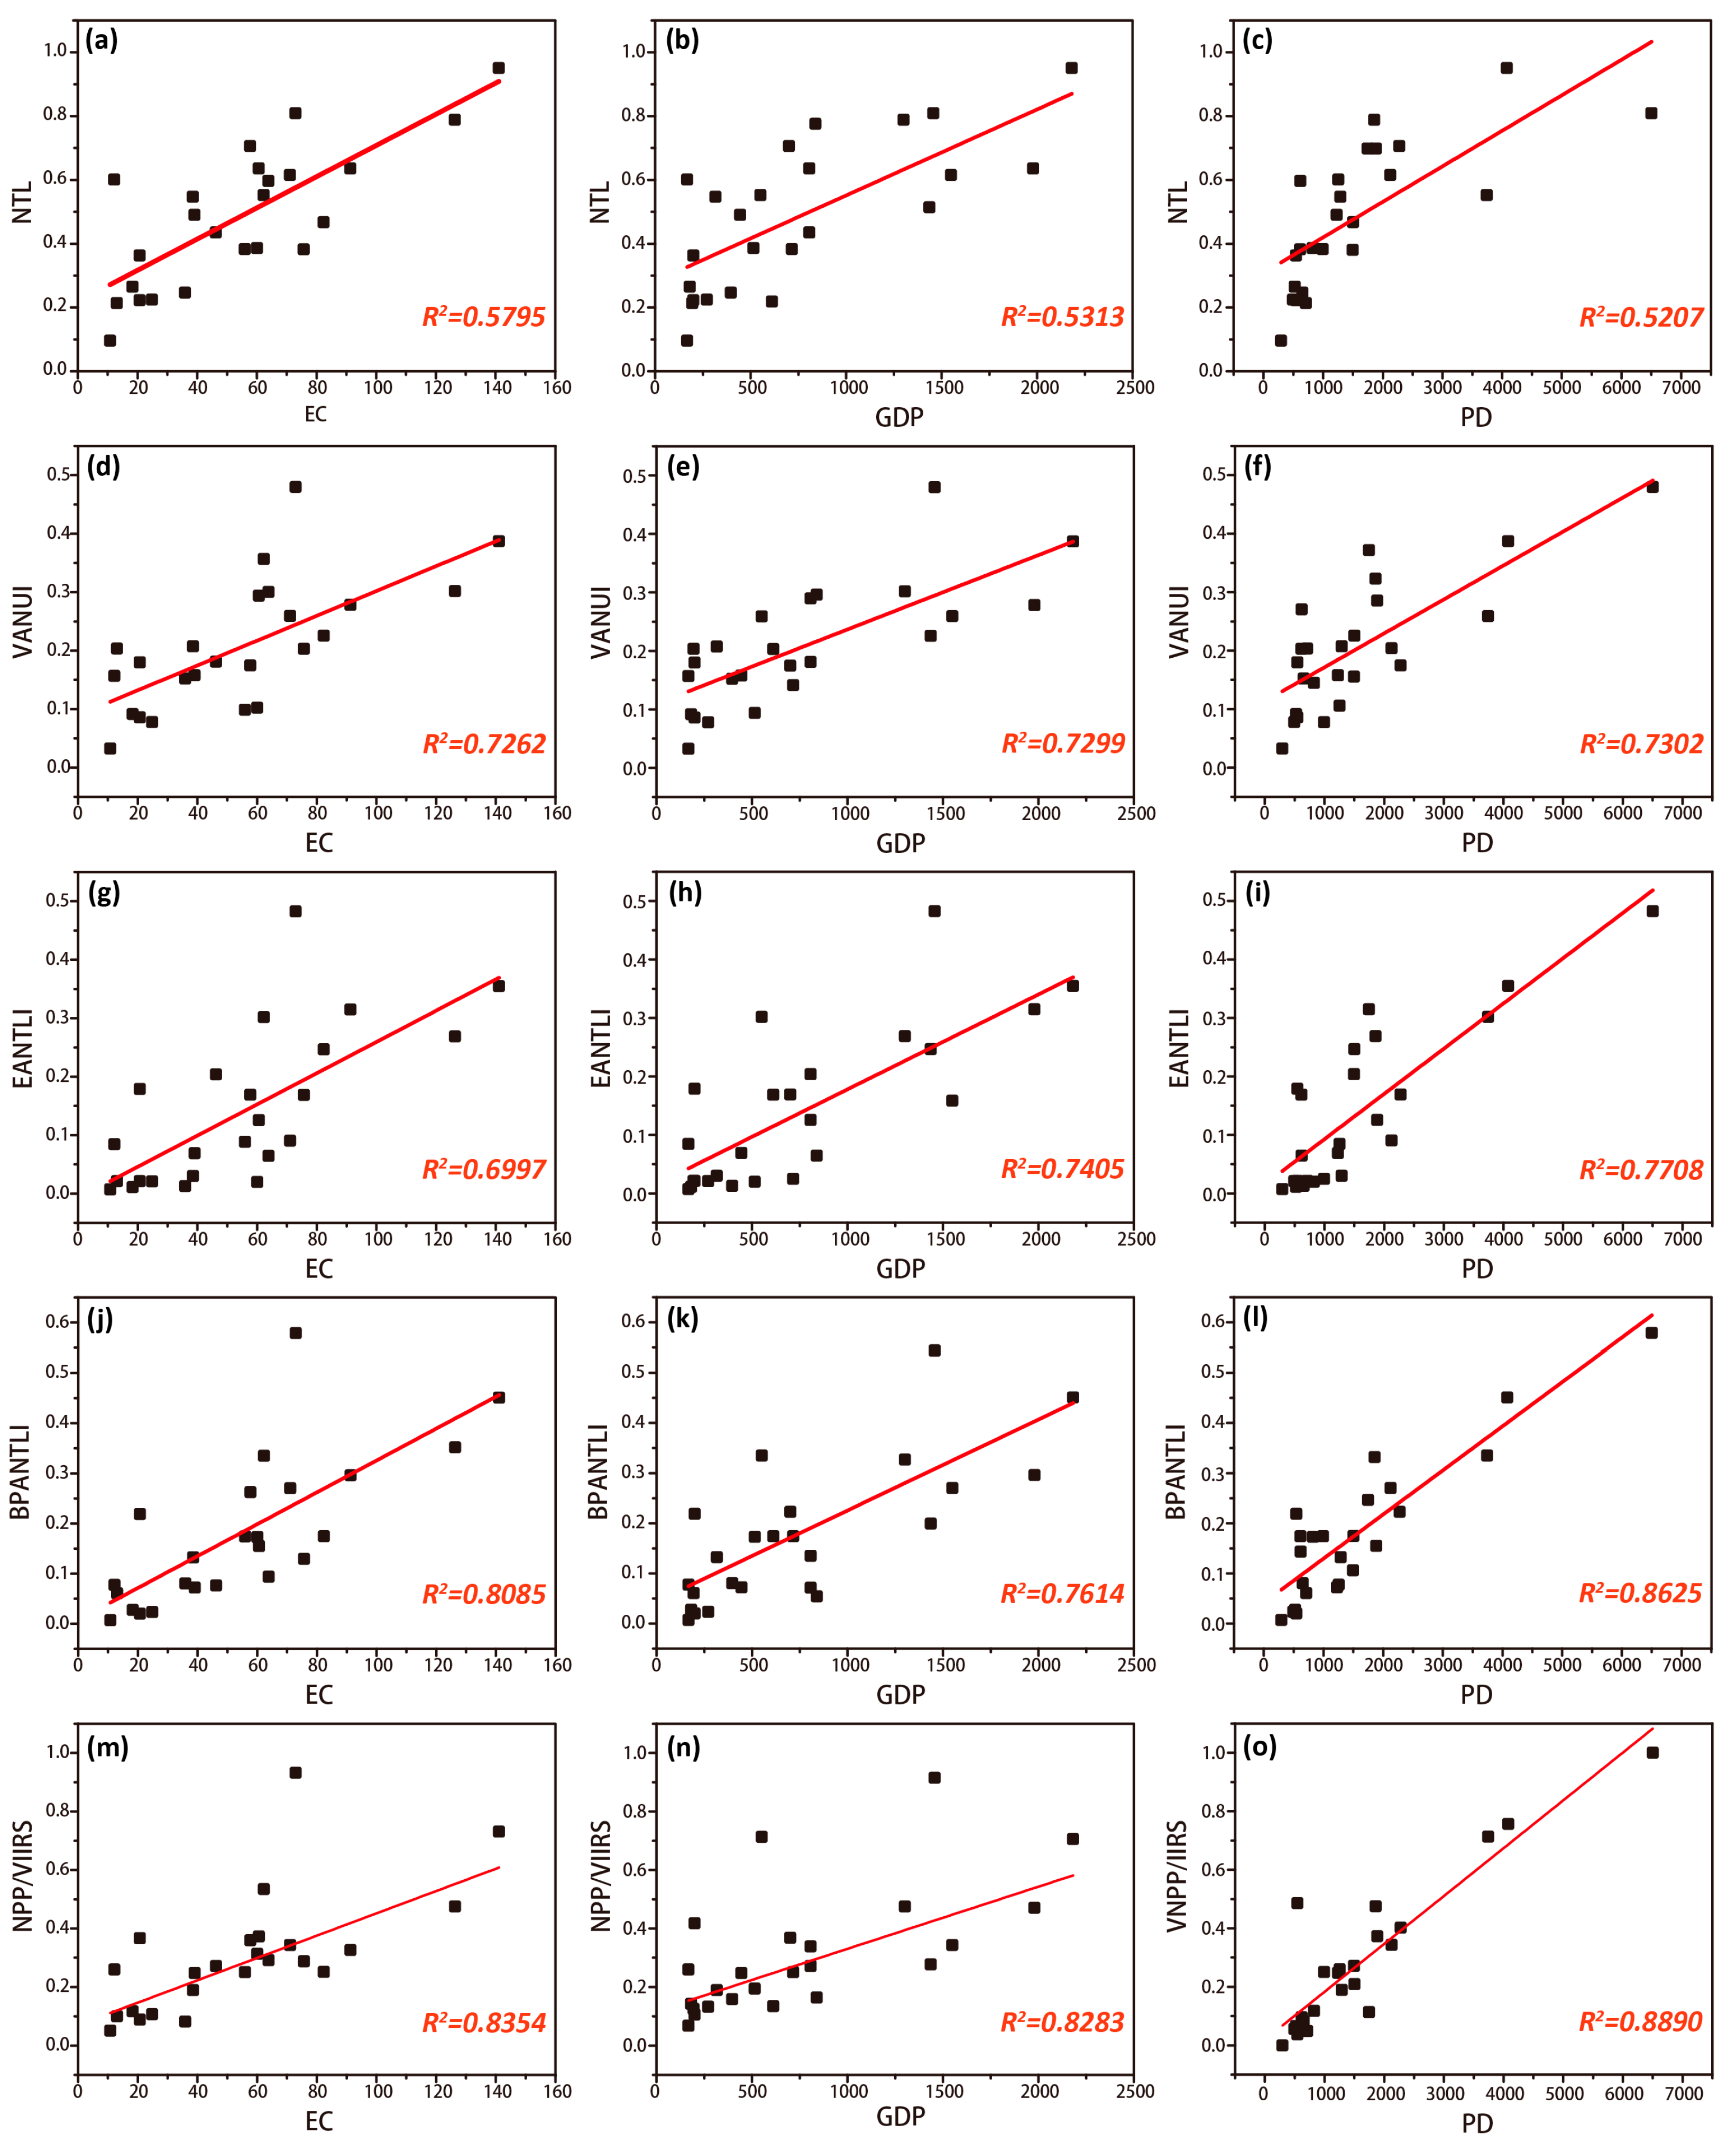
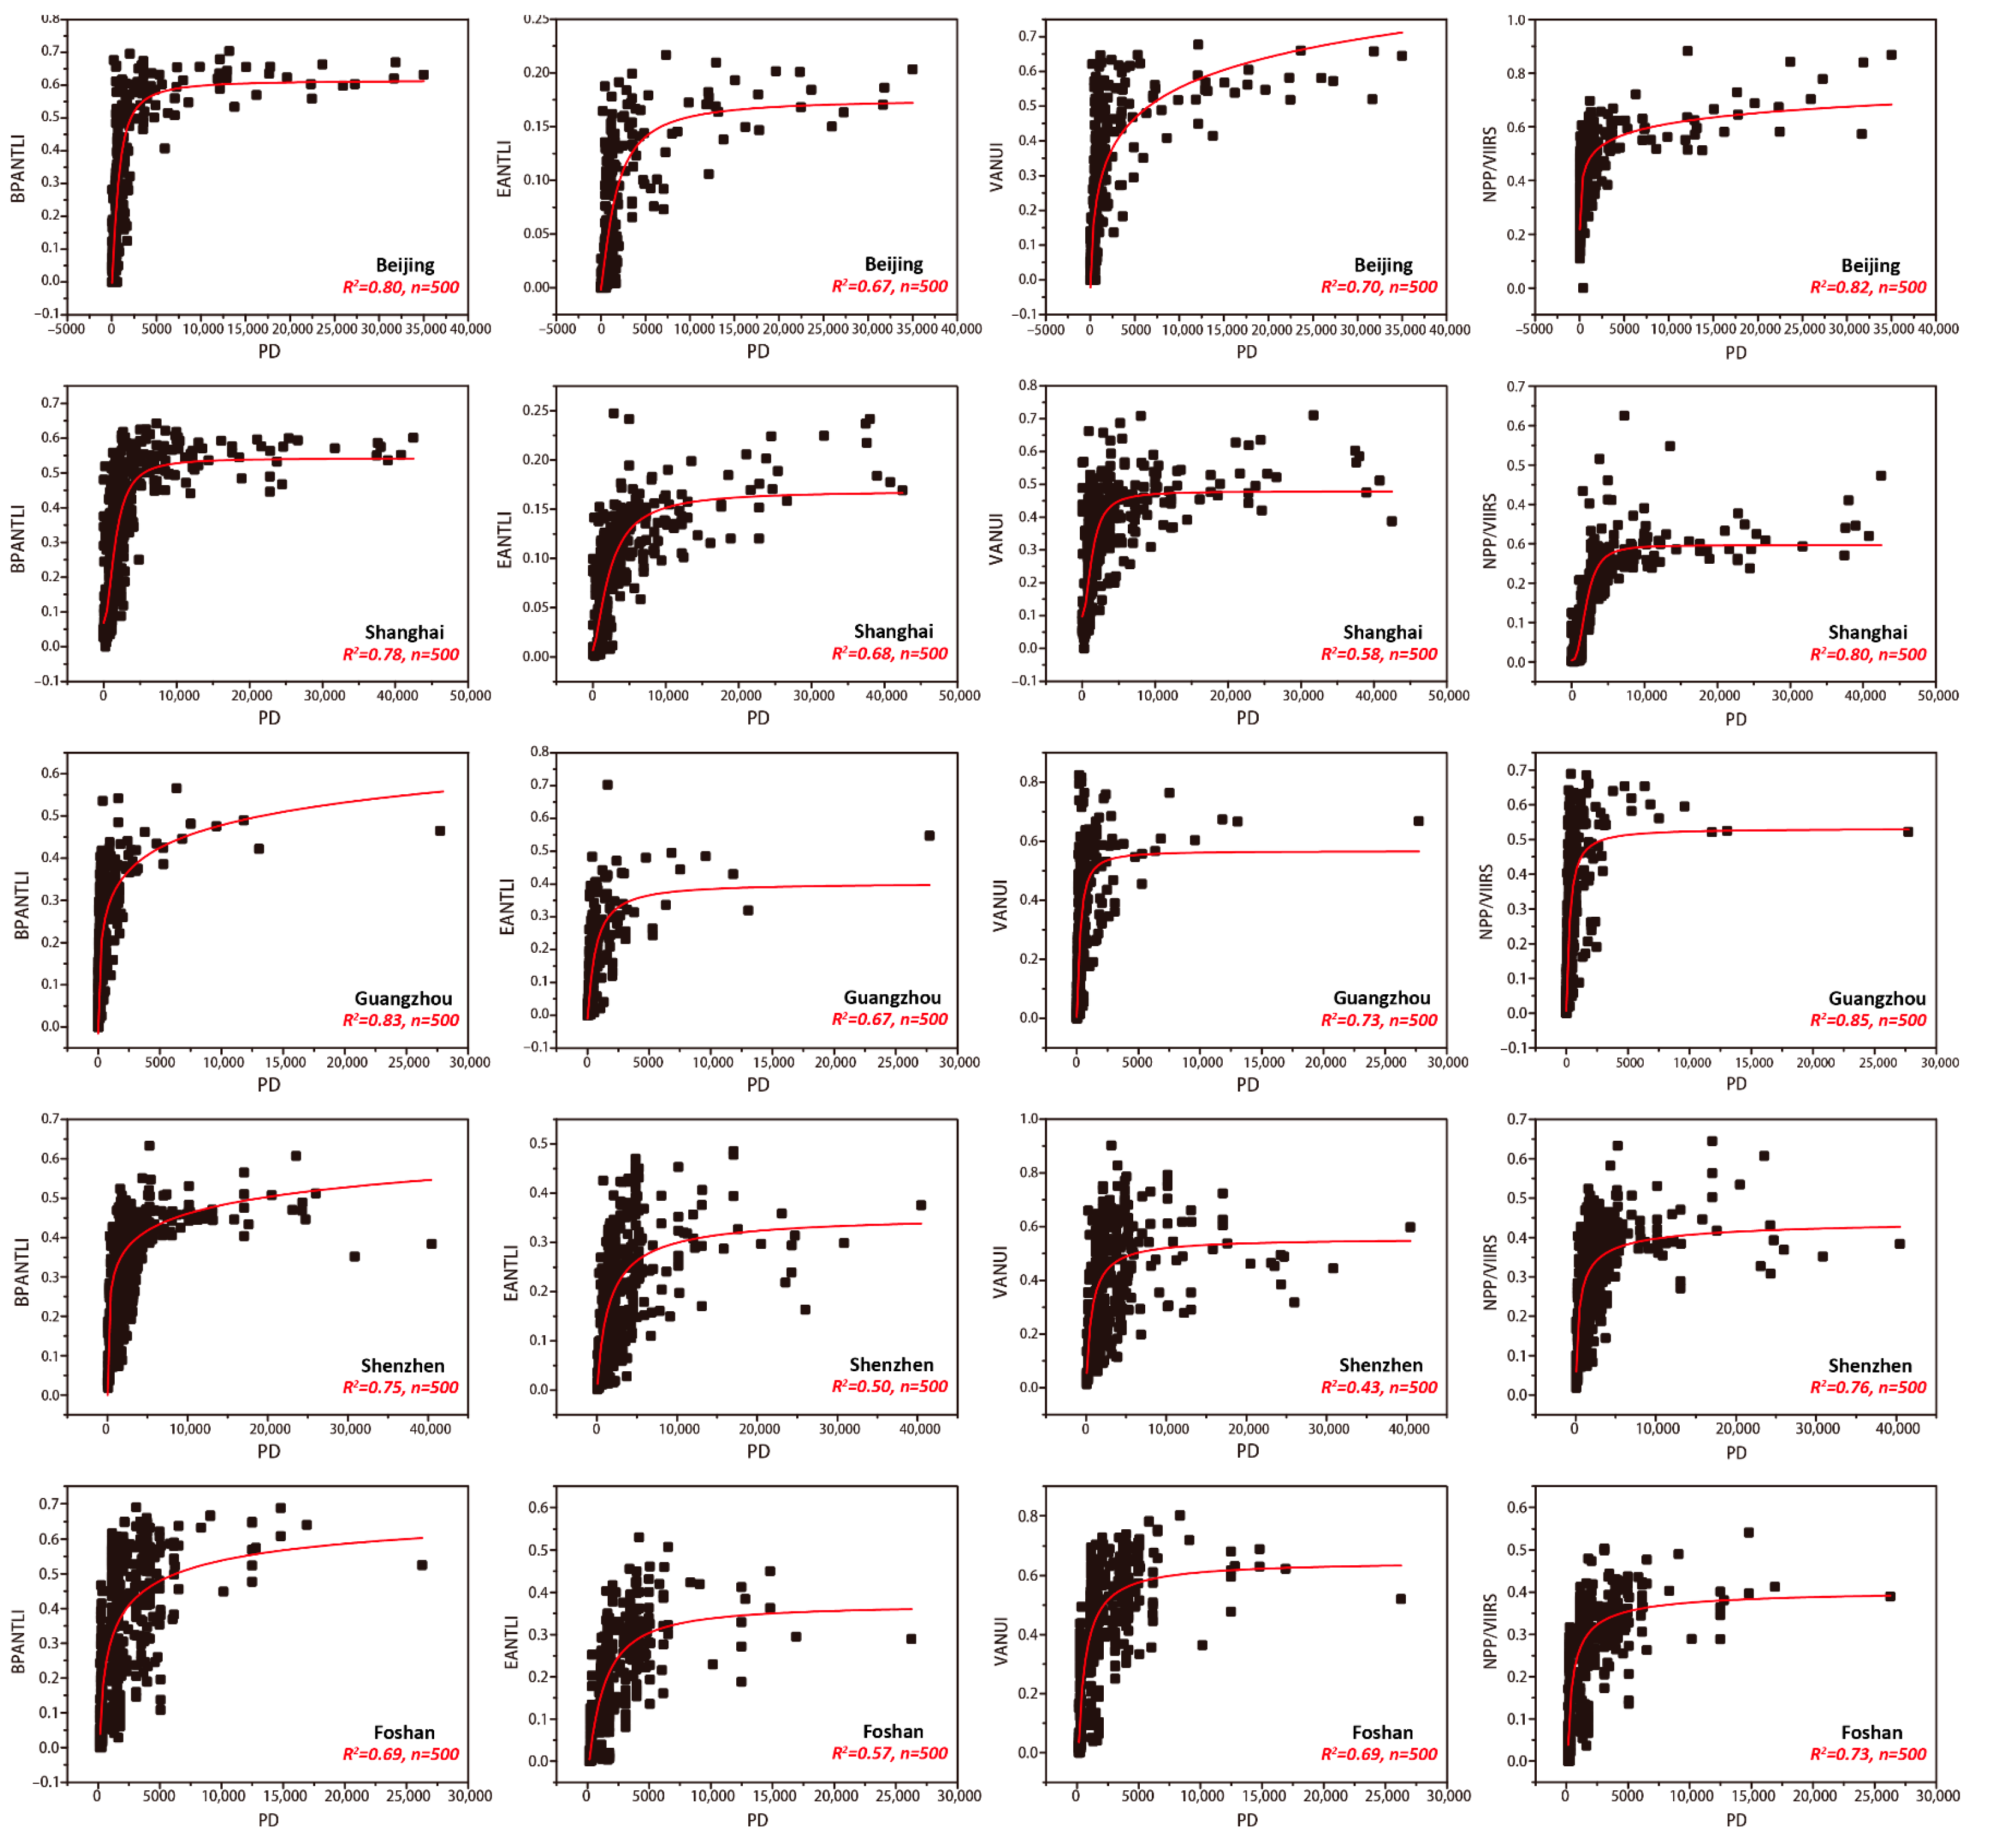
3.4. Electricity Consumption, GDP, and Population Density Estimation
4. Discussion
4.1. Evaluate the Desaturation Effect of Each Indicator
4.2. Overcoming the Spatial Resolution of NTL Data
4.3. Limitations
5. Conclusions
Author Contributions
Funding
Data Availability Statement
Acknowledgments
Conflicts of Interest
References
- Ma, T.; Zhou, C.; Pei, T.; Haynie, S.; Fan, J. Quantitative estimation of urbanization dynamics using time series of DMSP/OLS nighttime light data: A comparative case study from China’s cities. Remote Sens. Environ. 2012, 124, 99–107. [Google Scholar] [CrossRef]
- Gao, B.; Huang, Q.; He, C.; Ma, Q. Dynamics of urbanization levels in China from 1992 to 2012: Perspective from DMSP/OLS nighttime light data. Remote Sens. 2015, 7, 1721–1735. [Google Scholar] [CrossRef] [Green Version]
- Zhao, M.; Cheng, W.; Zhou, C.; Li, M.; Huang, K.; Wang, N. Assessing spatiotemporal characteristics of urbanization dynamics in Southeast Asia using time series of DMSP/OLS nighttime light data. Remote Sens. 2018, 10, 47. [Google Scholar] [CrossRef] [Green Version]
- Xu, Z.; He, X.; Chen, L.; Hu, X.; Tang, W.; Li, J. How does the urbanization level change in the Yangtze River economic belt, China? A Multi-Scale Evaluation Using DMSP/OLS Nighttime Light Data. In IOP Conference Series: Earth and Environmental Science; IOP Publishing: Bristol, UK, 2021; Volume 675, p. 012112. [Google Scholar]
- Xu, P.; Lin, M.; Jin, P. Spatio-temporal Dynamics of Urbanization in China Using DMSP/OLS Nighttime Light Data from 1992–2013. Chin. Geogr. Sci. 2021, 31, 70–80. [Google Scholar] [CrossRef]
- Hu, Y.N.; Peng, J.; Liu, Y.; Du, Y.; Li, H.; Wu, J. Mapping development pattern in Beijing-Tianjin-Hebei urban agglomeration using DMSP/OLS nighttime light data. Remote Sens. 2017, 9, 760. [Google Scholar] [CrossRef] [Green Version]
- Xu, T.; Ma, T.; Zhou, C.; Zhou, Y. Characterizing spatio-temporal dynamics of urbanization in China using time series of DMSP/OLS night light data. Remote Sens. 2014, 6, 7708–7731. [Google Scholar] [CrossRef] [Green Version]
- Zhang, Q.; Seto, K.C. Mapping urbanization dynamics at regional and global scales using multi-temporal DMSP/OLS nighttime light data. Remote Sens. Environ. 2011, 115, 2320–2329. [Google Scholar] [CrossRef]
- Liu, Y.; Wang, Y.; Peng, J.; Du, Y.; Liu, X.; Li, S.; Zhang, D. Correlations between urbanization and vegetation degradation across the world’s metropolises using DMSP/OLS nighttime light data. Remote Sens. 2015, 7, 2067–2088. [Google Scholar] [CrossRef] [Green Version]
- Xie, Y.; Weng, Q. World energy consumption pattern as revealed by DMSP-OLS nighttime light imagery. Gisci. Remote Sens. 2016, 53, 265–282. [Google Scholar] [CrossRef]
- Lv, Q.; Liu, H.; Wang, J.; Liu, H.; Shang, Y. Multiscale analysis on spatiotemporal dynamics of energy consumption CO2 emissions in China: Utilizing the integrated of DMSP-OLS and NPP-VIIRS nighttime light datasets. Sci. Total Environ. 2020, 703, 134394. [Google Scholar] [CrossRef]
- Yue, Y.; Tian, L.; Yue, Q.; Wang, Z. Spatiotemporal variations in energy consumption and their influencing factors in China based on the integration of the DMSP-OLS and NPP-VIIRS nighttime light datasets. Remote Sens. 2020, 12, 1151. [Google Scholar] [CrossRef] [Green Version]
- Shi, K.; Yu, B.; Huang, Y.; Hu, Y.; Yin, B.; Chen, Z.; Chen, L.; Wu, J. Evaluating the ability of NPP-VIIRS nighttime light data to estimate the gross domestic product and the electric power consumption of China at multiple scales: A comparison with DMSP-OLS data. Remote Sens. 2014, 6, 1705–1724. [Google Scholar] [CrossRef] [Green Version]
- Wu, J.; Wang, Z.; Li, W.; Peng, J. Exploring factors affecting the relationship between light consumption and GDP based on DMSP/OLS nighttime satellite imagery. Remote Sens. Environ. 2013, 134, 111–119. [Google Scholar] [CrossRef]
- Fu, H.; Shao, Z.; Fu, P.; Cheng, Q. The dynamic analysis between urban nighttime economy and urbanization using the DMSP/OLS nighttime light data in China from 1992 to 2012. Remote Sens. 2017, 9, 416. [Google Scholar] [CrossRef] [Green Version]
- Tripathy, B.R.; Tiwari, V.; Pandey, V.; Elvidge, C.D.; Rawat, J.S.; Sharma, M.P.; Prawasi, R.; Kumar, P. Estimation of urban population dynamics using DMSP-OLS night-time lights time series sensors data. IEEE Sens. J. 2016, 17, 1013–1020. [Google Scholar] [CrossRef]
- Kumar, P.; Sajjad, H.; Joshi, P.K.; Elvidge, C.D.; Rehman, S.; Chaudhary, B.S.; Tripathy, B.R.; Singh, J.; Pipal, G. Modeling the luminous intensity of Beijing, China using DMSP-OLS night-time lights series data for estimating population density. Phys. Chem. Earth 2019, 109, 31–39. [Google Scholar] [CrossRef]
- Shi, K.; Huang, C.; Yu, B.; Yin, B.; Huang, Y.; Wu, J. Evaluation of NPP-VIIRS night-time light composite data for extracting built-up urban areas. Remote Sens. Lett. 2014, 5, 358–366. [Google Scholar] [CrossRef]
- Yu, B.; Shi, K.; Hu, Y.; Huang, C.; Chen, Z.; Wu, J. Poverty evaluation using NPP-VIIRS nighttime light composite data at the county level in China. IEEE J. Sel. Top. Appl. Earth Observ. Remote Sens. 2015, 8, 1217–1229. [Google Scholar] [CrossRef]
- Sahoo, S.; Gupta, P.K.; Srivastav, S.K. Comparative analysis between VIIRS-DNB and DMSP-OLS night-time light data to estimate electric power consumption in Uttar Pradesh, India. Int. J. Remote Sens. 2020, 41, 2565–2580. [Google Scholar] [CrossRef]
- Zheng, Y.; He, Y.; Zhou, Q.; Wang, H. Quantitative Evaluation of Urban Expansion using NPP-VIIRS Nighttime Light and Landsat Spectral Data. Sustain. Cities Soc. 2022, 76, 103338. [Google Scholar] [CrossRef]
- Pok, S.; Matsushita, B.; Fukushima, T. An easily implemented method to estimate impervious surface area on a large scale from MODIS time-series and improved DMSP-OLS nighttime light data. ISPRS J. Photogramm. 2017, 133, 104–115. [Google Scholar] [CrossRef] [Green Version]
- Cao, X.; Hu, Y.; Zhu, X.; Shi, F.; Zhuo, L.; Chen, J. A simple self-adjusting model for correcting the blooming effects in DMSP-OLS nighttime light images. Remote Sens. Environ. 2019, 224, 401–411. [Google Scholar] [CrossRef]
- Shen, Z.; Zhu, X.; Cao, X.; Chen, J. Measurement of blooming effect of DMSP-OLS nighttime light data based on NPP-VIIRS data. Ann. GIS 2019, 25, 153–165. [Google Scholar] [CrossRef] [Green Version]
- Elvidge, C.D.; Baugh, K.E.; Dietz, J.B.; Bland, T.; Sutton, P.C.; Kroehl, H.W. Radiance calibration of DMSP-OLS low-light imaging data of human settlements. Remote Sens. Environ. 1999, 68, 77–88. [Google Scholar] [CrossRef]
- Guo, W.; Lu, D.; Kuang, W. Improving fractional impervious surface mapping performance through combination of DMSP-OLS and MODIS NDVI data. Remote Sens. 2017, 9, 375. [Google Scholar] [CrossRef] [Green Version]
- Hsu, F.C.; Baugh, K.E.; Ghosh, T.; Zhizhin, M.; Elvidge, C.D. DMSP-OLS radiance calibrated nighttime lights time series with intercalibration. Remote Sens. 2015, 7, 1855–1876. [Google Scholar] [CrossRef] [Green Version]
- Hu, Y.; Chen, J.; Cao, X.; Chen, X.; Cui, X.; Gan, L. Correcting the Saturation Effect in DMSP/OLS Stable Nighttime Light Products Based on Radiance-Calibrated Data. IEEE Trans. Geosci. Remote Sens. 2021, 60, 5602011. [Google Scholar] [CrossRef]
- Huang, X.; Shi, K.; Cui, Y.; Li, Y. A saturated light correction method for DMSP-OLS nighttime stable light data by remote and social sensing data. IEEE J. Sel. Top. Appl. Earth Observ. Remote Sens. 2021, 14, 1885–1894. [Google Scholar] [CrossRef]
- Cao, Z.; Wu, Z.; Kuang, Y.Q.; Huang, N. Correction of DMSP/OLS night-time light images and its application in China. J. Geo-Inf. Sci. 2015, 17, 1092–1102. [Google Scholar]
- Letu, H.; Hara, M.; Yagi, H.; Naoki, K.; Tana, G.; Nishio, F.; Shuhei, O. Estimating energy consumption from night-time DMPS/OLS imagery after correcting for saturation effects. Int. J. Remote Sens. 2010, 31, 4443–4458. [Google Scholar] [CrossRef]
- Letu, H.; Hara, M.; Tana, G.; Nishio, F. A saturated light correction method for DMSP/OLS nighttime satellite imagery. IEEE Trans. Geosci. Remote Sens. 2011, 50, 389–396. [Google Scholar] [CrossRef]
- Lu, D.; Tian, H.; Zhou, G.; Ge, H. Regional mapping of human settlements in southeastern China with multisensor remotely sensed data. Remote Sens. Environ. 2008, 112, 3668–3679. [Google Scholar] [CrossRef]
- Zhang, Q.; Schaaf, C.; Seto, K.C. The vegetation adjusted NTL urban index: A new approach to reduce saturation and increase variation in nighttime luminosity. Remote Sens. Environ. 2013, 129, 32–41. [Google Scholar] [CrossRef]
- Zhuo, L.; Zhang, X.; Zheng, J.; Tao, H.; Guo, Y. An EVI-based method to reduce saturation of DMSP/OLS nighttime light data. Acta Geogr. Sin. 2015, 70, 1339–1350. [Google Scholar]
- Meng, X.; Han, J.; Huang, C. An improved vegetation adjusted nighttime light urban index and its application in quantifying spatiotemporal dynamics of carbon emissions in China. Remote Sens. 2017, 9, 829. [Google Scholar] [CrossRef] [Green Version]
- Liu, Y.; Yang, Y.; Jing, W.; Yao, L.; Yue, X.; Zhao, X. A new urban index for expressing inner-city patterns based on MODIS LST and EVI regulated DMSP/OLS NTL. Remote Sens. 2017, 9, 777. [Google Scholar] [CrossRef] [Green Version]
- Zheng, Z.; Chen, Y.; Wu, Z.; Ye, X.; Guo, G.; Qian, Q. The desaturation method of DMSP/OLS nighttime light data based on vector data: Taking the rapidly urbanized China as an example. Int. J. Geograph. Inf. Sci. 2019, 33, 431–453. [Google Scholar] [CrossRef]
- He, D.; Shi, Q.; Liu, X.; Zhong, Y.; Zhang, L. Generating 2 m fine-scale urban tree cover product over 34 metropolises in China based on deep context-aware sub-pixel mapping network. Int. J. Appl. Earth Obs. 2022, 106, 102667. [Google Scholar] [CrossRef]
- Zha, Y.; Gao, J.; Ni, S. Use of normalized difference built-up index in automatically mapping urban areas from TM imagery. Int. J. Remote Sens. 2003, 24, 583–594. [Google Scholar] [CrossRef]
- Varshney, A.; Rajesh, E. A comparative study of built-up index approaches for automated extraction of built-up regions from remote sensing data. J. Indian Soc. Remote Sens. 2014, 42, 659–663. [Google Scholar] [CrossRef]
- Guha, S.; Govil, H.; Dey, A.; Gill, N. Analytical study of land surface temperature with NDVI and NDBI using Landsat 8 OLI and TIRS data in Florence and Naples city, Italy. Eur. J. Remote Sens. 2018, 51, 667–678. [Google Scholar] [CrossRef]
- Li, K.; Chen, Y. A Genetic Algorithm-based urban cluster automatic threshold method by combining VIIRS DNB, NDVI, and NDBI to monitor urbanization. Remote Sens. 2018, 10, 277. [Google Scholar] [CrossRef] [Green Version]
- Jamei, Y.; Rajagopalan, P.; Sun, Q.C. Spatial structure of surface urban heat island and its relationship with vegetation and built-up areas in Melbourne, Australia. Sci. Total Environ. 2019, 659, 1335–1351. [Google Scholar] [CrossRef]
- Guha, S.; Govil, H.; Gill, N.; Dey, A. A long-term seasonal analysis on the relationship between LST and NDBI using Landsat data. Quat. Int. 2021, 575, 249–258. [Google Scholar] [CrossRef]
- Bakillah, M.; Liang, S.; Mobasheri, A.; Jokar Arsanjani, J.; Zipf, A. Fine-resolution population mapping using OpenStreetMap points-of-interest. Int. J. Geogr. Inf. Sci. 2014, 28, 1940–1963. [Google Scholar] [CrossRef]
- McKenzie, G.; Janowicz, K.; Gao, S.; Gong, L. How where is when? On the regional variability and resolution of geosocial temporal signatures for points of interest. Comput. Environ. Urban Syst. 2015, 54, 336–346. [Google Scholar] [CrossRef]
- Novack, T.; Peters, R.; Zipf, A. Graph-based matching of points-of-interest from collaborative geo-datasets. ISPRS Int. J. Geoinf. 2018, 7, 117. [Google Scholar] [CrossRef] [Green Version]
- Wang, J.F.; Li, X.H.; Christakos, G.; Liao, Y.L.; Zhang, T.; Gu, X.; Zheng, X.Y. Geographical detectors-based health risk assessment and its application in the neural tube defects study of the Heshun Region, China. Int. J. Geogr. Inf. Sci. 2010, 24, 107–127. [Google Scholar] [CrossRef]
- Zhang, L.; Liu, W.; Hou, K.; Lin, J.; Song, C.; Zhou, C.; Huang, B.; Tong, X.; Wang, J.; Rhine, W.; et al. Air pollution exposure associates with increased risk of neonatal jaundice. Nat. Commun. 2019, 10, 3741. [Google Scholar] [CrossRef]
- Song, Y.; Wang, J.; Ge, Y.; Xu, C. An optimal parameters-based geographical detector model enhances geographic characteristics of explanatory variables for spatial heterogeneity analysis: Cases with different types of spatial data. Gisci. Remote Sens. 2020, 57, 593–610. [Google Scholar] [CrossRef]
- Luo, W.; Jasiewicz, J.; Stepinski, T.; Wang, J.; Xu, C.; Cang, X. Spatial association between dissection density and environmental factors over the entire conterminous United States. Geophys. Res. Lett. 2016, 43, 692–700. [Google Scholar] [CrossRef] [Green Version]
- Wang, J.F.; Zhang, T.L.; Fu, B.J. A measure of spatial stratified heterogeneity. Ecol. Indic. 2016, 67, 250–256. [Google Scholar] [CrossRef]
- He, D.; Zhong, Y.; Zhang, L. Spatiotemporal subpixel geographical evolution mapping. IEEE Trans. Geosci. Remote 2018, 57, 2198–2220. [Google Scholar] [CrossRef]
- Gibson, J.; Boe-Gibson, G. Nighttime lights and county-level economic activity in the United States: 2001 to 2019. Remote Sens. 2021, 13, 2741. [Google Scholar] [CrossRef]
- Bluhm, R.; McCord, G.C. What can we learn from nighttime lights for small geographies? measurement errors and heterogeneous elasticities. Remote Sens. 2022, 14, 1190. [Google Scholar] [CrossRef]
- Huang, Q.; Yang, X.; Gao, B.; Yang, Y.; Zhao, Y. Application of DMSP/OLS nighttime light images: A meta-analysis and a systematic literature review. Remote Sens. 2014, 6, 6844–6866. [Google Scholar] [CrossRef] [Green Version]
- Ma, J.; Guo, J.; Ahmad, S.; Li, Z.; Hong, J. Constructing a new inter-calibration method for DMSP-OLS and NPP-VIIRS nighttime light. Remote Sens. 2020, 12, 937. [Google Scholar] [CrossRef] [Green Version]
- Li, X.; Zhan, C.; Tao, J.; Li, L. Long-term monitoring of the impacts of disaster on human activity using DMSP/OLS nighttime light data: A case study of the 2008 Wenchuan, China Earthquake. Remote Sens. 2018, 10, 588. [Google Scholar] [CrossRef] [Green Version]
- Xia, C.; Yeh AG, O.; Zhang, A. Analyzing spatial relationships between urban land use intensity and urban vitality at street block level: A case study of five Chinese megacities. Landsc. Urban Plan. 2020, 193, 103669. [Google Scholar] [CrossRef]
- Zhuo, L.; Ichinose, T.; Zheng, J.; Chen, J.; Shi, P.J.; Li, X. Modelling the population density of China at the pixel level based on DMSP/OLS non-radiance-calibrated night-time light images. Int. J. Remote Sens. 2009, 30, 1003–1018. [Google Scholar] [CrossRef]
- Cao, X.; Wang, J.; Chen, J.; Shi, F. Spatialization of electricity consumption of China using saturation-corrected DMSP-OLS data. Int. J. Appl. Earth Obs. 2014, 28, 193–200. [Google Scholar] [CrossRef]
- Pan, J.H.; Li, J.F. Estimate and spatio-temporal dynamics of electricity consumption in China based on DMSP/OLS images. Geogr. Res. 2016, 35, 627–638. [Google Scholar]
- He, C.; Ma, Q.; Li, T.; Yang, Y.; Liu, Z. Spatiotemporal dynamics of electric power consumption in Chinese Mainland from 1995 to 2008 modeled using DMSP/OLS stable nighttime lights data. J. Geogr. Sci. 2012, 22, 125–136. [Google Scholar] [CrossRef]
- Wang, Q.; Yuan, T.; Zheng, X.Q. GDP gross analysis at province-level in China based on night-time lightsatellite imagery. Urban Dev. Stud. 2013, 20, 44–48. [Google Scholar]


| City | Administrative Areas (km2) | Population (Million) | Electricity Consumption (Billion kwh) | GDP (Billion RMB) |
|---|---|---|---|---|
| Beijing | 15,863.29 | 13.16 | 91.31 | 1950.06 |
| Tianjin | 11,916.85 | 14.72 | 82.34 | 1437.02 |
| Tangshan | 13,471.92 | 7.47 | 75.73 | 612.12 |
| Langfang | 6429.31 | 5.46 | 13.09 | 194.31 |
| Shanghai | 6340.50 | 24.15 | 141.06 | 2160.21 |
| Nanjing | 6587.02 | 6.43 | 46.27 | 801.17 |
| Hangzhou | 16,596.75 | 8.84 | 63.85 | 834.35 |
| Changzhou | 4372.15 | 4.69 | 39.10 | 436.09 |
| Ningbo | 9816.28 | 5.80 | 55.94 | 712.88 |
| Wuxi | 4627.46 | 4.72 | 60.64 | 807.02 |
| Suzhou | 8488.42 | 6.53 | 126.32 | 1301.57 |
| Huzhou | 5819.85 | 2.62 | 18.29 | 180.31 |
| Shaoxing | 8279.02 | 4.94 | 35.96 | 396.73 |
| Jiaxing | 3915.34 | 3.46 | 38.55 | 314.76 |
| Nantong | 8001.11 | 7.66 | 60.05 | 503.88 |
| Guangzhou | 7434.40 | 8.32 | 71.07 | 1542.01 |
| Shenzhen | 1996.78 | 10.62 | 72.98 | 1450.02 |
| Foshan | 3797.72 | 7.29 | 57.76 | 701.07 |
| Dongguan | 2459.85 | 8.31 | 62.25 | 549.02 |
| Zhuhai | 1724.32 | 1.59 | 12.17 | 166.23 |
| Huizhou | 11,343.12 | 3.43 | 24.84 | 267.83 |
| Zhongshan | 1800.14 | 3.17 | 21.71 | 263.89 |
| Jiangmen | 9505.42 | 3.93 | 20.73 | 200.02 |
| Zhaoqing | 14,891.22 | 4.29 | 10.78 | 166.01 |
| Data | Resolution | Time | Data Source |
|---|---|---|---|
| DMSP/OLS nighttime light (NTL) | 30 arc second | 2013 | NOAA/NGDC (http://ngdc.noaa.gov/eog/download.html) accessed on 1 May 2022 |
| Radiometric calibration nighttime light (RCNTL) | 30 arc second | 2013 | |
| National Polar-orbiting Partnership/Visible Infrared Imaging Radiometer Suite (NPP/VIIRS) | 15 arc second | 2013 | Earth Observations Group (https://www.ngdc.noaa.gov/eog/viirs/download_dnb_composites.html) accessed on 1 May 2022 |
| Landsat TM/ETM | 30 m | 2013 | USGS (https://earthexplorer.usgs.gov/) accessed on 1 May 2022 |
| POI | Point data | 2013 | OpenStreetMap (http://download.geofabrik.de/) accessed on 1 May 2022 |
| MODIS MOD13A3 | 1 km | 2013 | MODIS (https://modis.gsfc.nasa.gov/) accessed on 1 May 2022 |
| GPWv4 population density (PD) | 1 km | 2015 | EOSDIS (http://sedac.ciesin.columbia.edu/data/collection/gpw-v4) accessed on 1 May 2022 |
| Gross Domestic Product (GDP) | - | 2013 | China Statistical Yearbooks Database (http://www.shujuku.org/) accessed on 1 May 2022 |
| Annual electricity consumption (EC) | - | 2013 |
| Light Intensity (DN) | Global Scale (DN Value (0, 63)) | NTL Potential Saturation Region (DN Value (53, 63)) | NTL Unsaturation Region (DN Value (0, 52)) |
|---|---|---|---|
| RCNTL | 0.694 | 0.637 | 0.602 |
| NDBI | 0.662 | 0.586 | 0.424 |
| EVI | 0.593 | 0.395 | 0.352 |
| NDVI | 0.531 | 0.303 | 0.371 |
| POI | 0.473 | 0.435 | 0.288 |
| NDBI & EVI | 0.744 | 0.583 | 0.550 |
| NDBI & NDVI | 0.681 | 0.490 | 0.502 |
| NDBI & POI | 0.797 | 0.842 | 0.653 |
| EVI & NDVI | 0.632 | 0.411 | 0.567 |
| EVI & POI | 0.751 | 0.526 | 0.418 |
| NDVI & POI | 0.694 | 0.585 | 0.496 |
| NPP/VIIRS | BPANTLI | ||||
|---|---|---|---|---|---|
| Spatial resolution | 250 m | 200 m | 100 m | 50 m | 30 m |
| Correlation coefficient | 0.75 | 0.78 | 0.67 | 0.62 | 0.54 |
Publisher’s Note: MDPI stays neutral with regard to jurisdictional claims in published maps and institutional affiliations. |
© 2022 by the authors. Licensee MDPI, Basel, Switzerland. This article is an open access article distributed under the terms and conditions of the Creative Commons Attribution (CC BY) license (https://creativecommons.org/licenses/by/4.0/).
Share and Cite
Zhang, Q.; Zheng, Z.; Wu, Z.; Cao, Z.; Luo, R. Using Multi-Source Geospatial Information to Reduce the Saturation Problem of DMSP/OLS Nighttime Light Data. Remote Sens. 2022, 14, 3264. https://doi.org/10.3390/rs14143264
Zhang Q, Zheng Z, Wu Z, Cao Z, Luo R. Using Multi-Source Geospatial Information to Reduce the Saturation Problem of DMSP/OLS Nighttime Light Data. Remote Sensing. 2022; 14(14):3264. https://doi.org/10.3390/rs14143264
Chicago/Turabian StyleZhang, Qifei, Zihao Zheng, Zhifeng Wu, Zheng Cao, and Renbo Luo. 2022. "Using Multi-Source Geospatial Information to Reduce the Saturation Problem of DMSP/OLS Nighttime Light Data" Remote Sensing 14, no. 14: 3264. https://doi.org/10.3390/rs14143264