
MFST: Multi-Modal Feature Self-Adaptive Transformer for Infrared and Visible Image Fusion


Abstract
:
1. Introduction
- The design of the multi-feature fusion strategy is simple and does not make full use of feature information.
- CNN-based methods only consider local features in the fusion process without modeling long-range dependencies, which will lose global context meaningful for the fusion results.
- End-to-end methods lack obvious feature extraction steps, resulting in poor fusion results.
- To fully utilize both local information and global context, a new fusion model that introduces the optimized focal self-attention is constructed.
- To effectively utilize the multi-modal feature, an adaptive fusion strategy is designed according to the representation of different layer features, which makes the fusion results retain more structural features from the source images.
- Experiments show that our method outperforms the existing state-of-the-art fusion methods in both subjective appraisement and objective evaluation on multiple datasets.
2. Related Works
2.1. Auto-Encoder-Based Methods
2.2. Transformer-Based Method
3. Methodology
3.1. The Architecture of the Fusion Model
- (1)
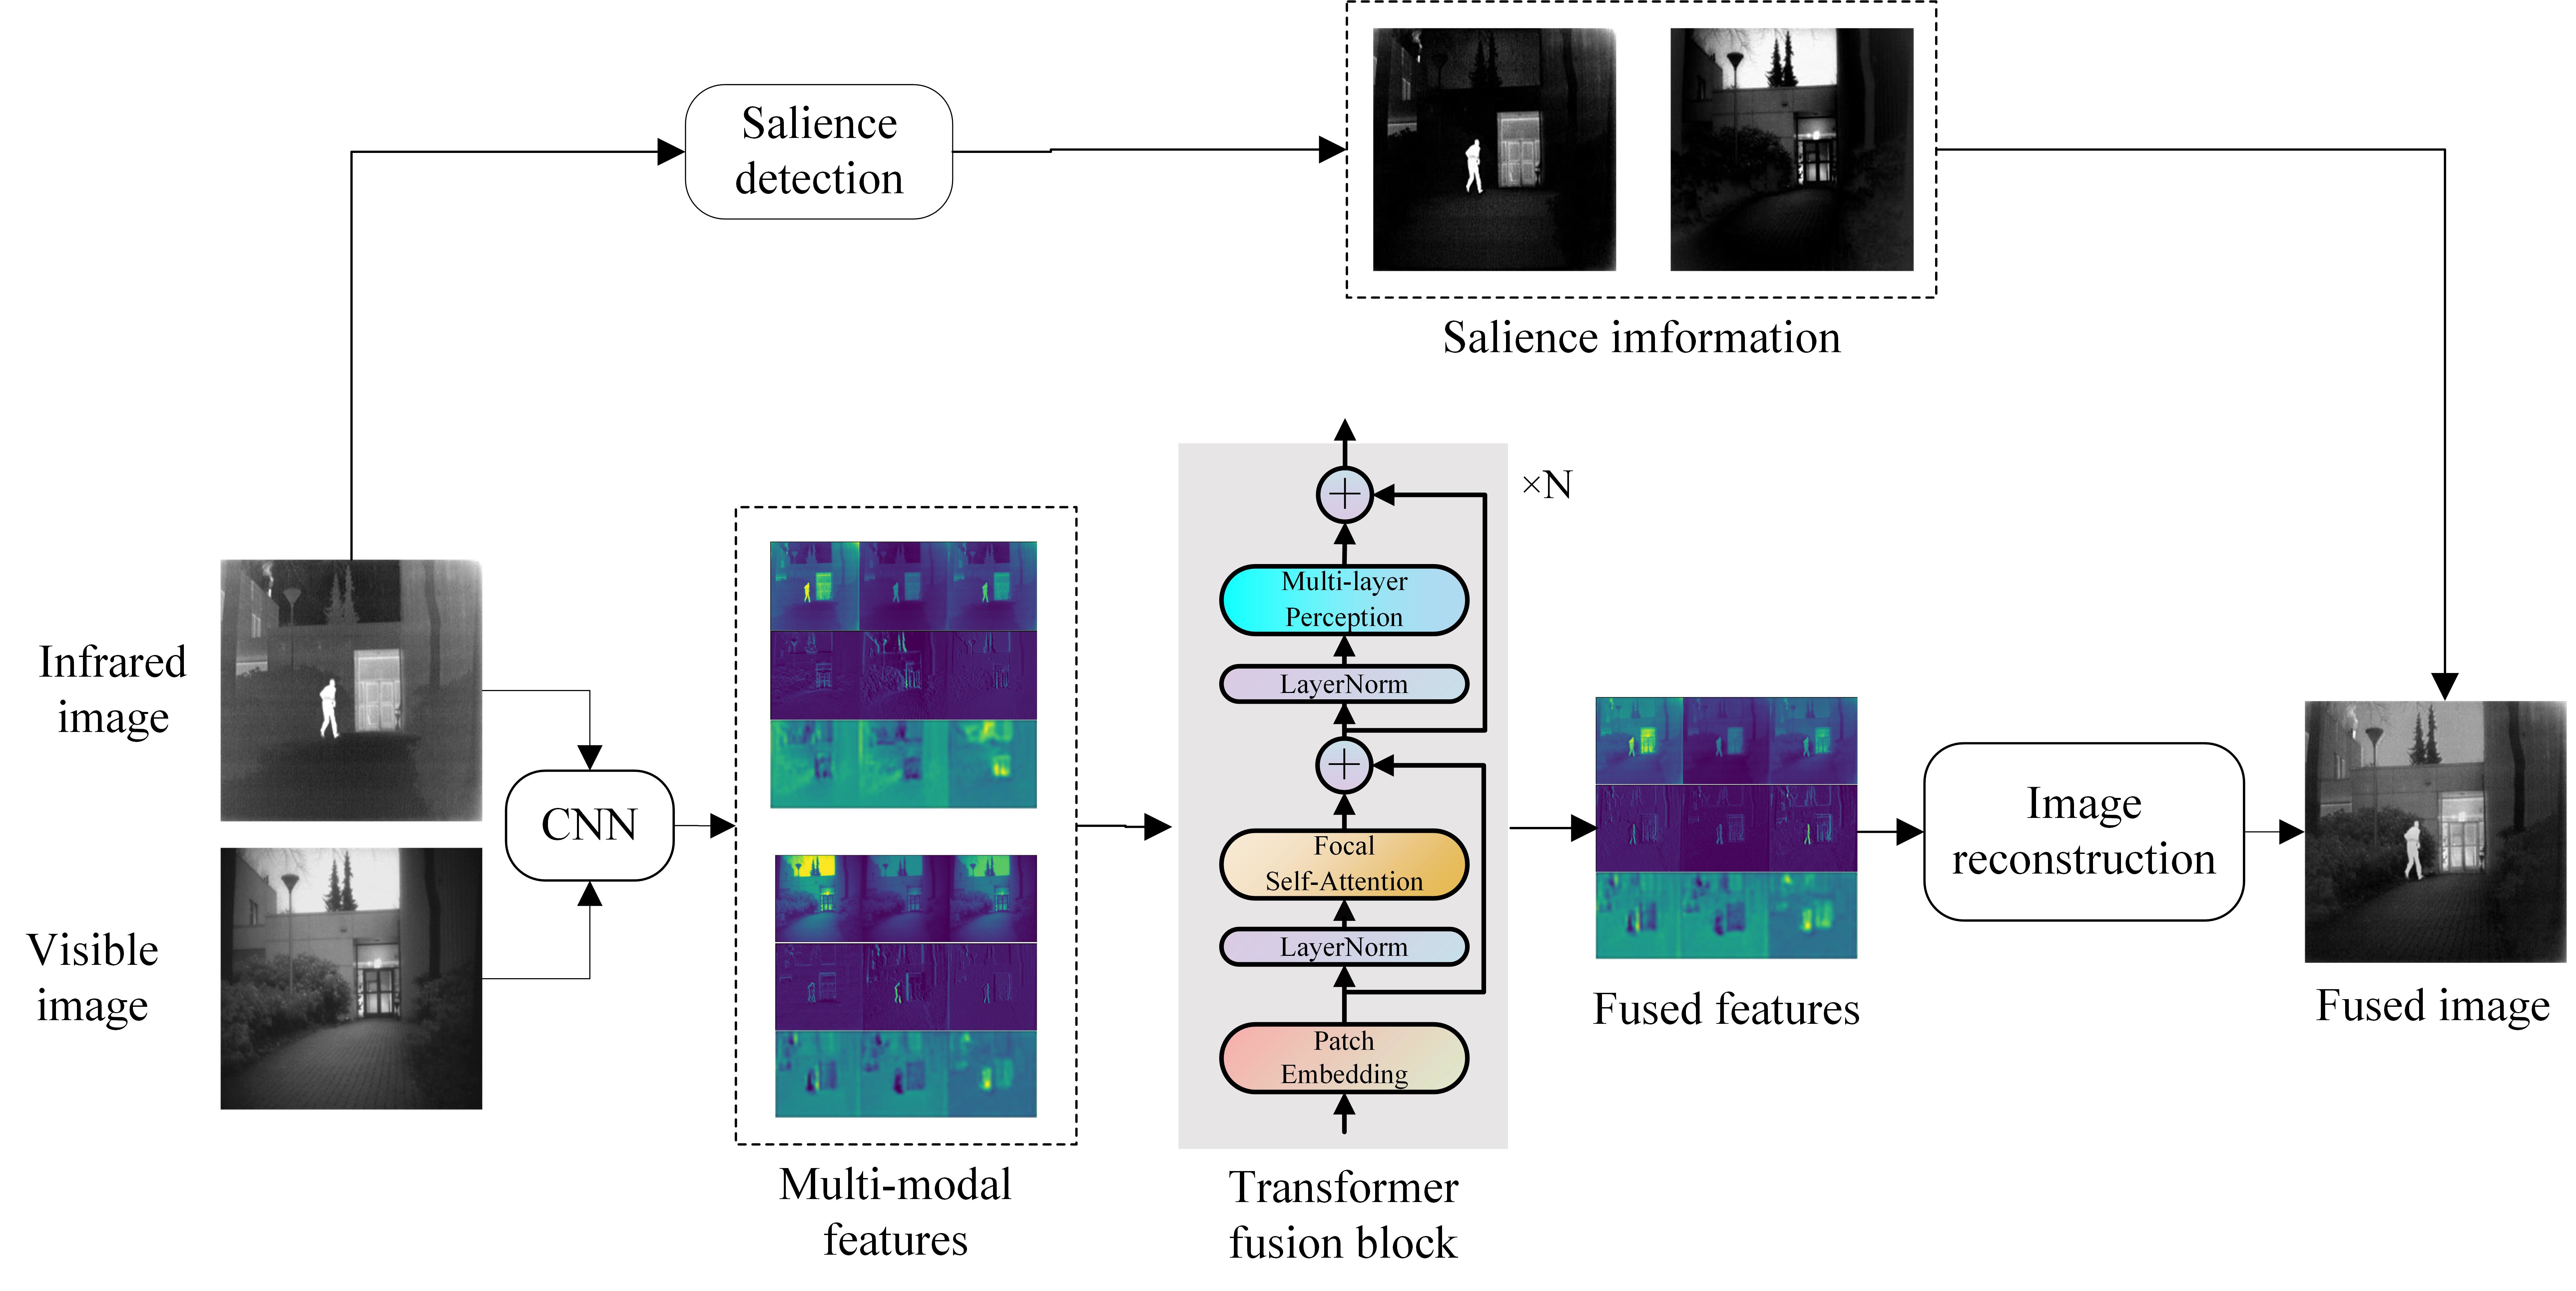
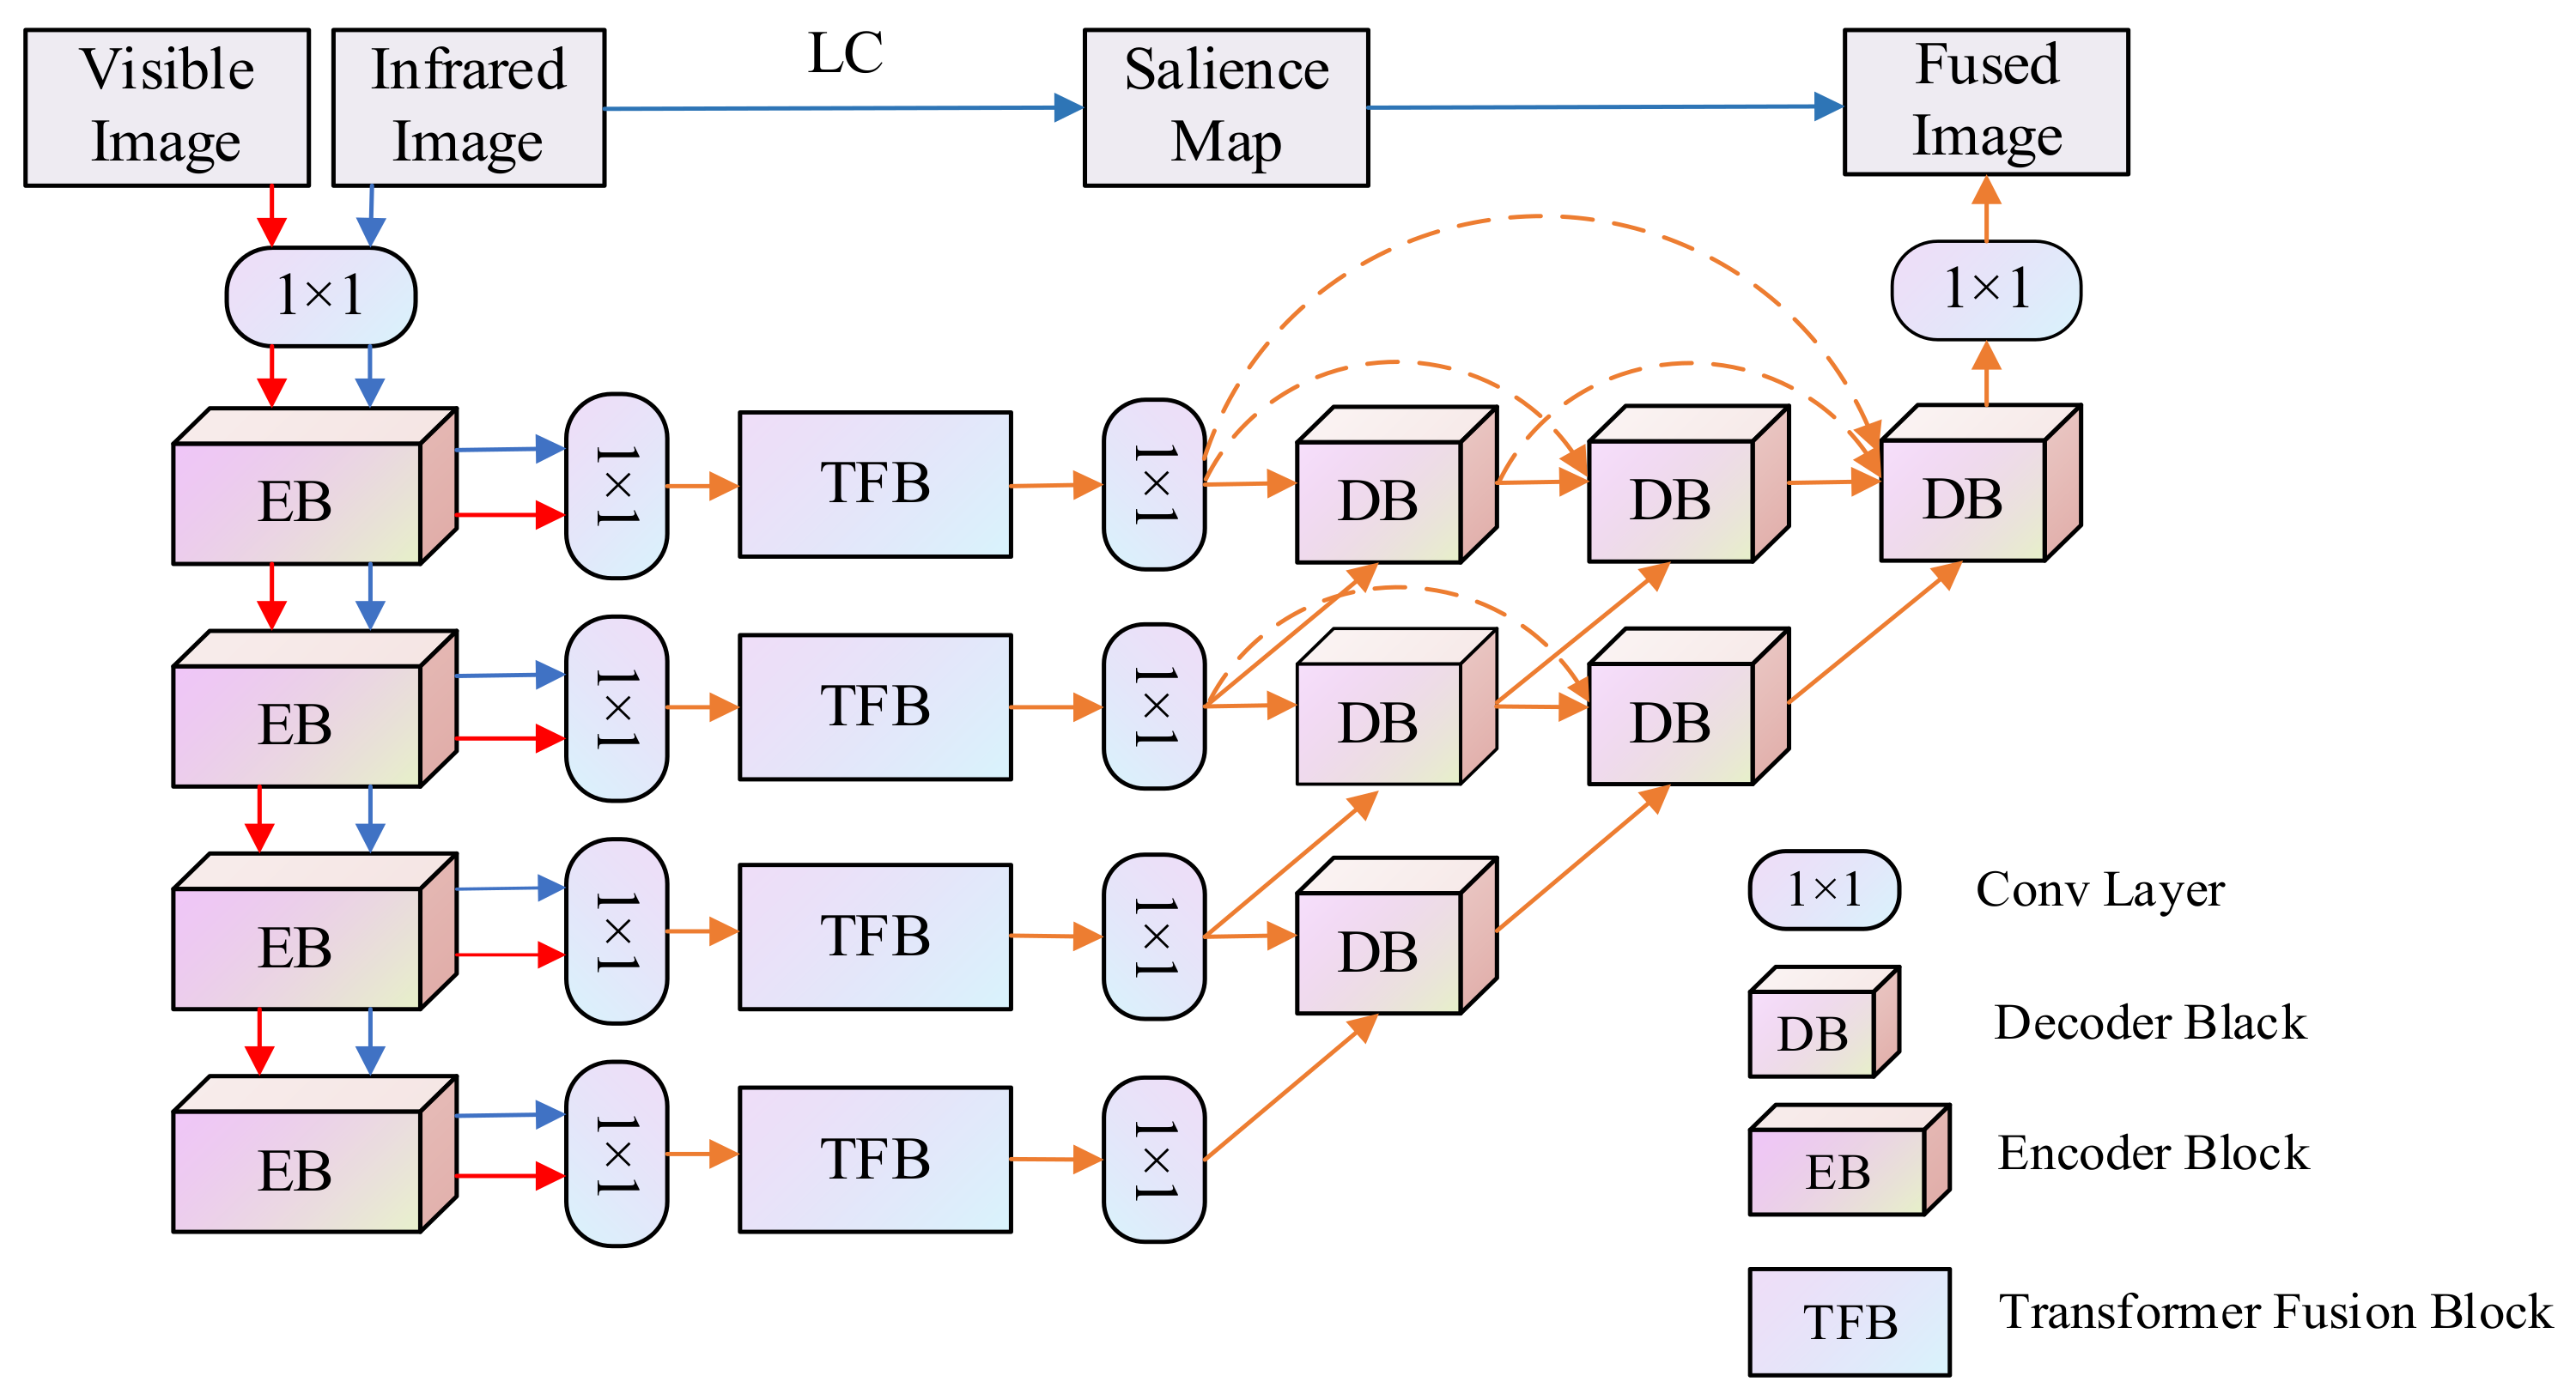
- Encoder network: the multi-scale encoder network accepts one input image (infrared image and visible image ) and generates multi-modal deep features ( and ), which contains one convolution layer and four encoder blocks. Each encoder block contains two convolution layers followed by the ReLU operation and one max-pooling layer.
- (2)
- Transformer fusion block: the multi-modal features ( and ) extracted from different source images are fed to the transformer fusion blocks (TFB) to obtain the fused features (), which carry out fine-grained local fusion and coarse-grained global fusion at the same time, helping the model fuse both local features and global context.
- (3)
- Decoder network: the fused features () are input into the decoder to generate the fusion result (fused image ). The decoder consists of 6 decoder blocks and one convolution layer. As shown in Figure 1, these blocks are combined through nest connection, which greatly improves the image reconstruction ability. The encoder and decoder in this paper are constructed according to the structure in NestFuse.
3.2. Transformer Fusion Strategy
3.2.1. Multi-Modal Features Self-Adaptive Fusion Strategy
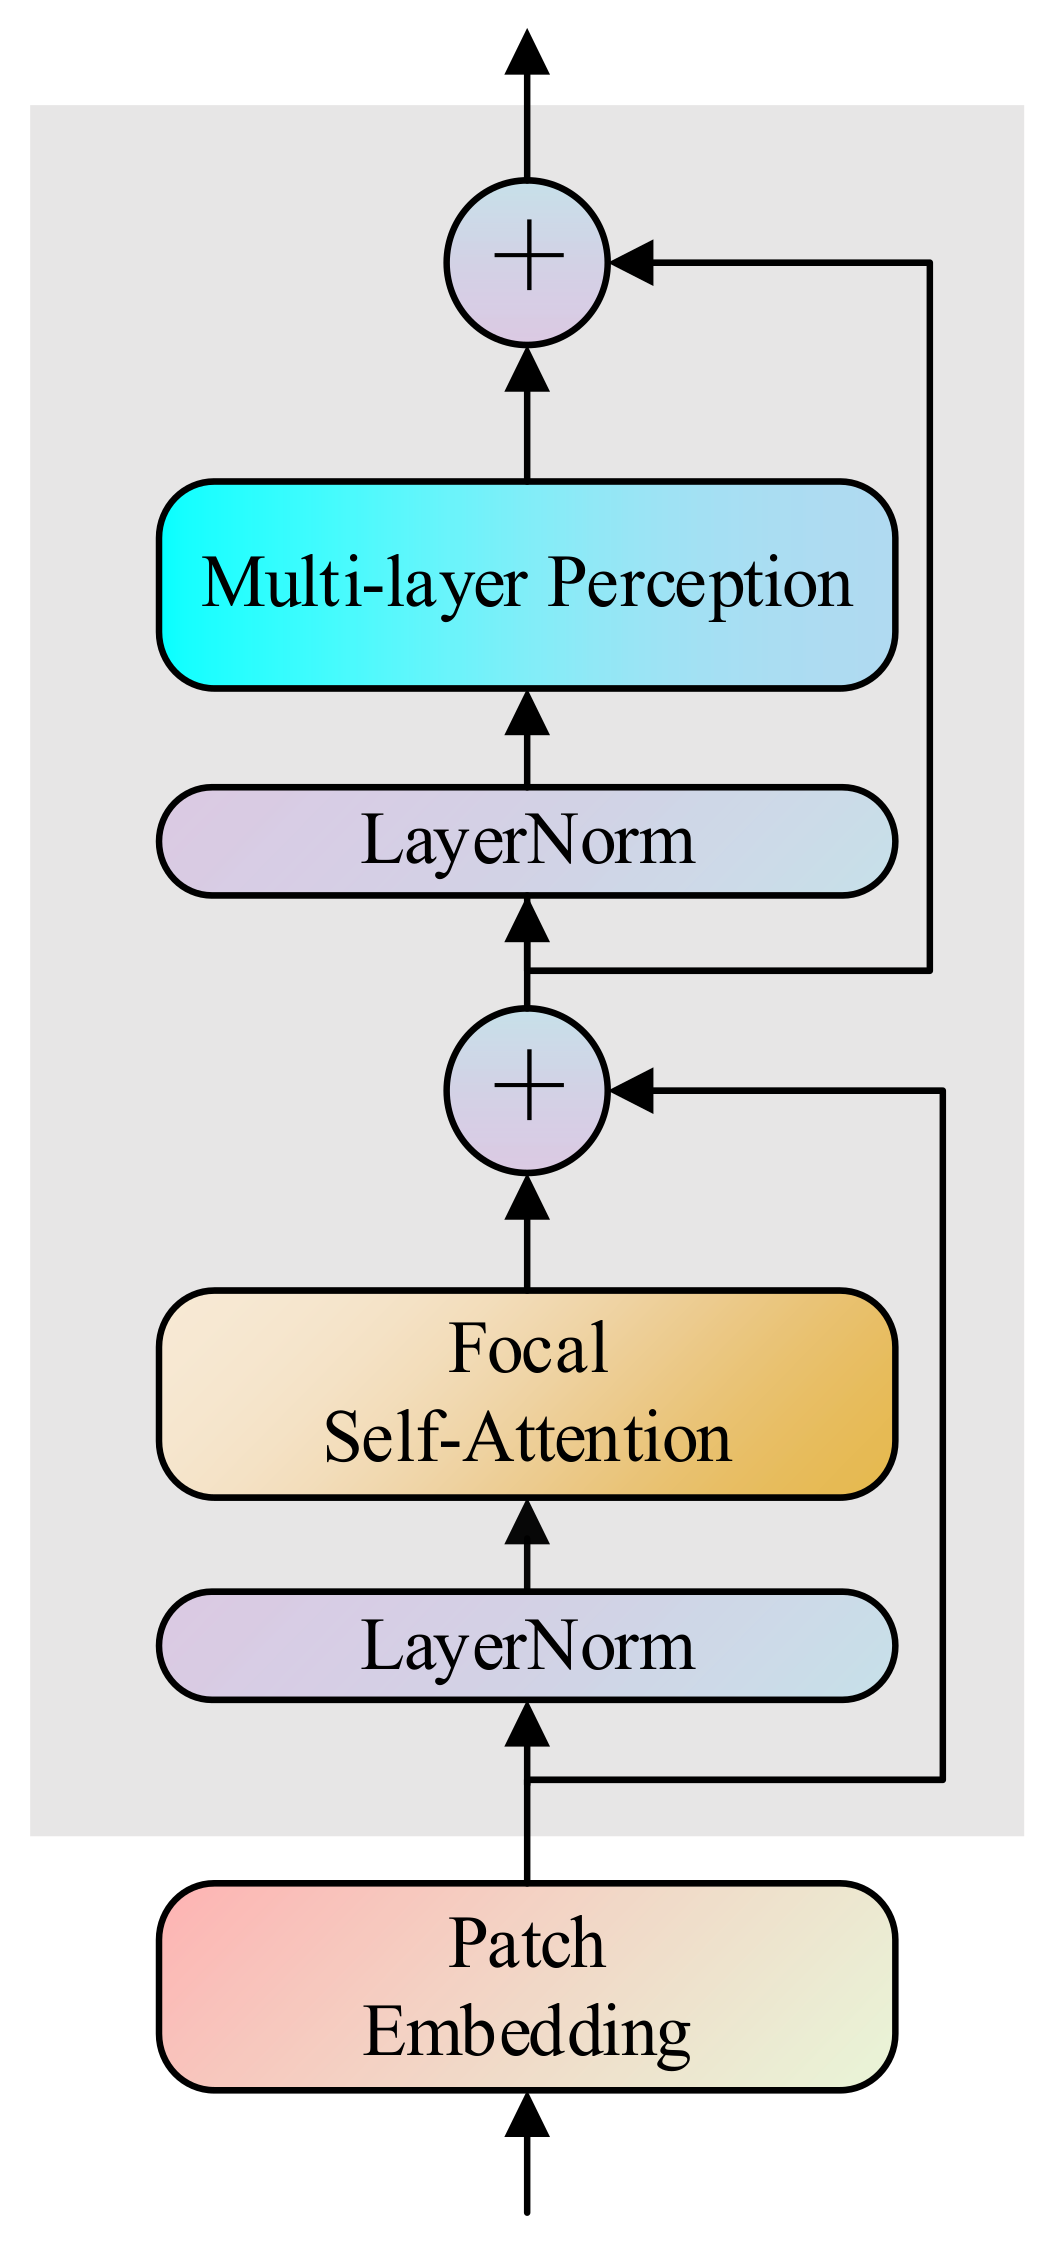
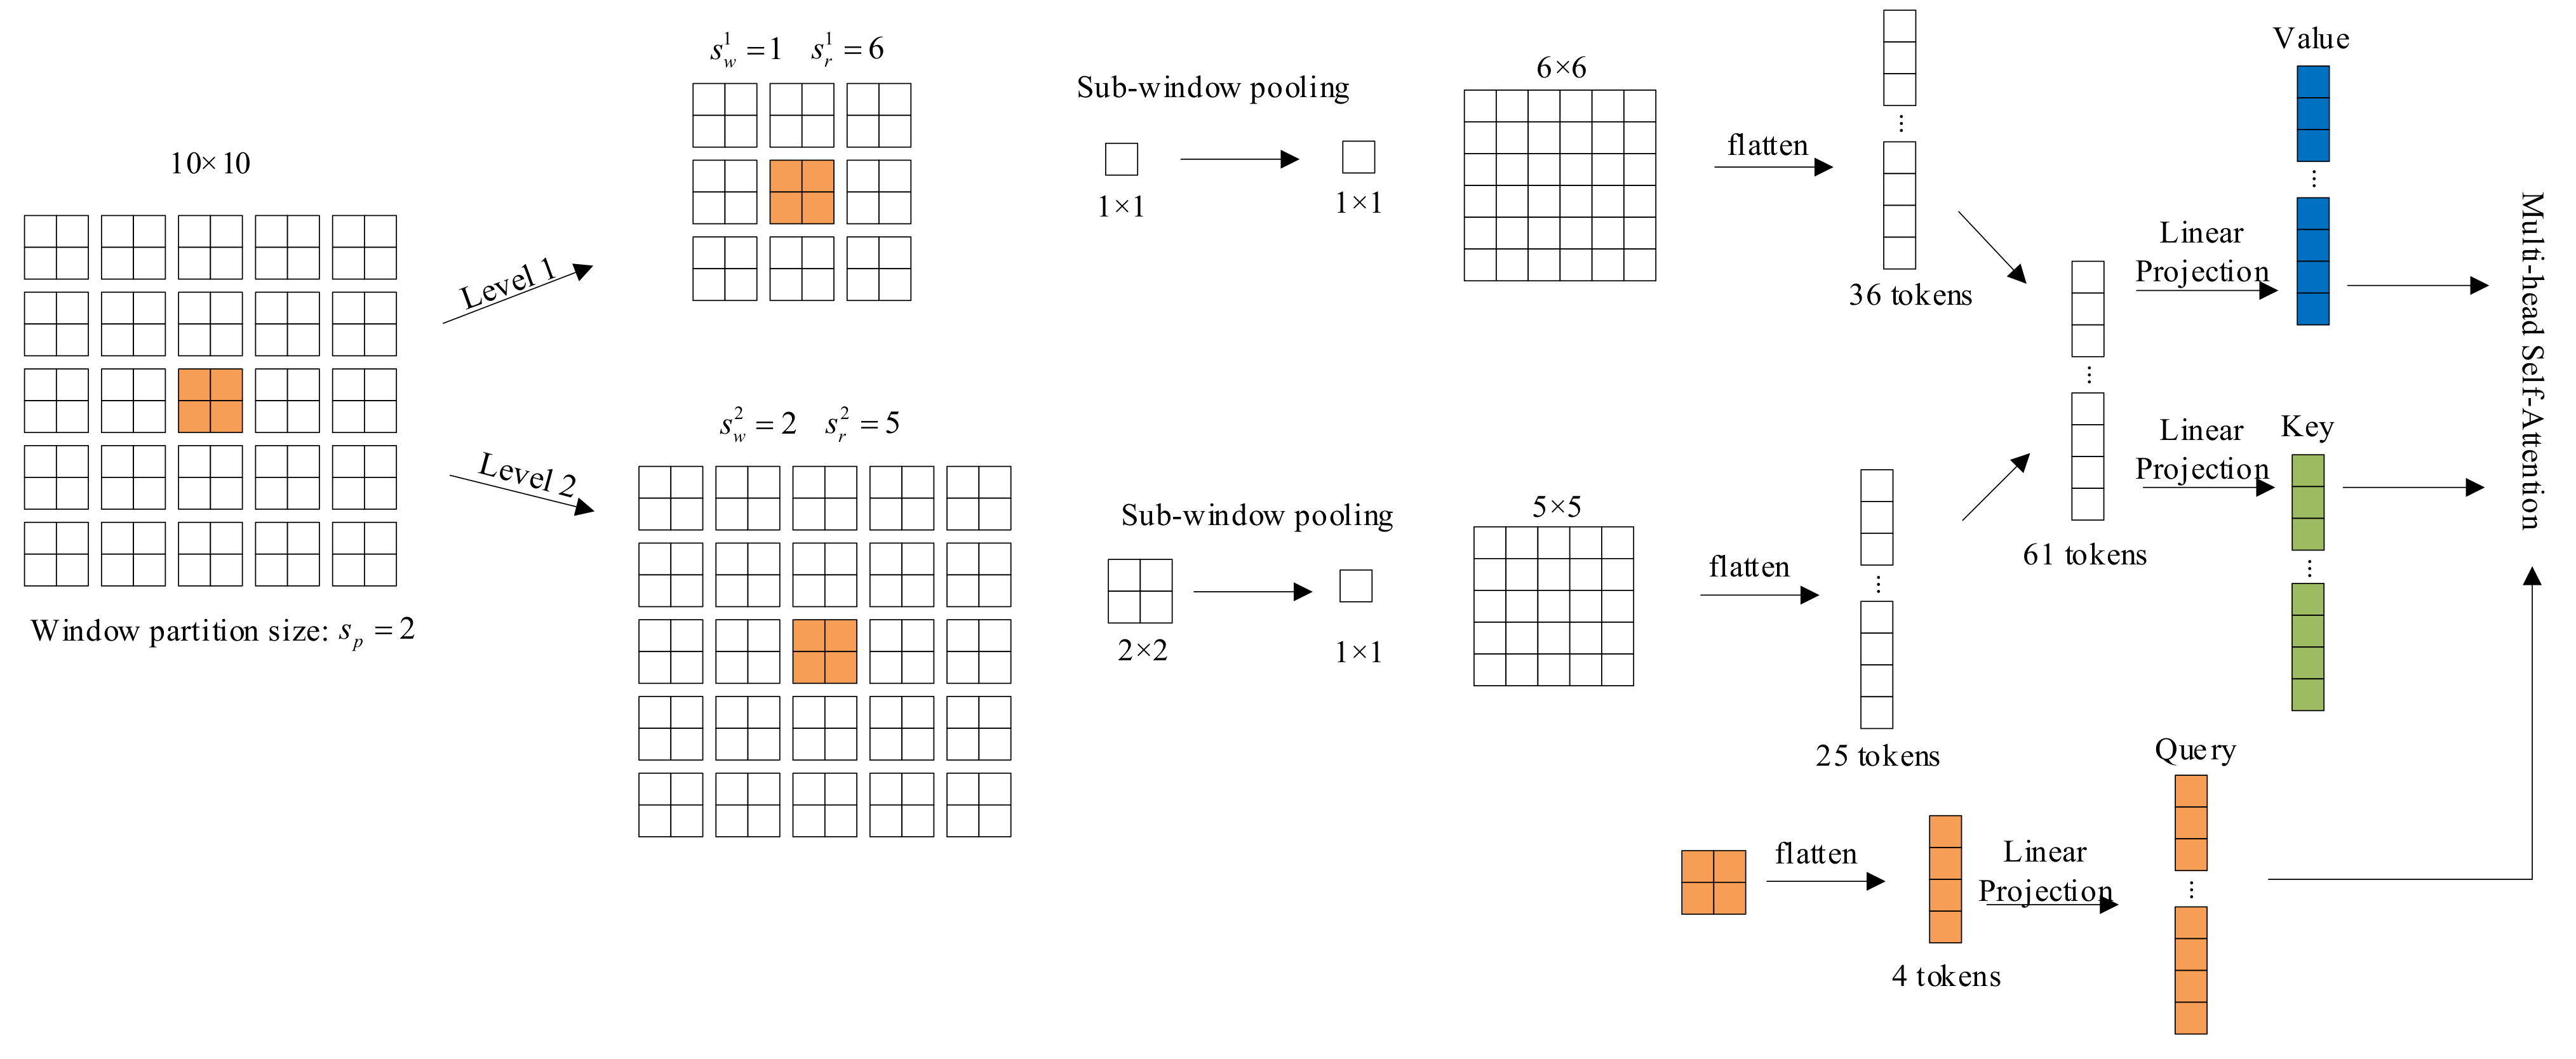
3.2.2. Transformer Fusion Block
- (1)
- The input of all layers is split into sub-window with the size of . After sub-window pooling operation, we can obtain the feature map which provide rich information of both coarse-grained and fine-grained. Where focal level is the number of granularity, focal window size is the size of sub-window at level , focal region size is the number of sub-windows horizontally and vertically at level .
- (2)
- With the three linear projection layers, the query of the first layer and the key and value of all layers are calculated as follows:
- (3)
- Finally, with the learnable relative position bias , the focal self-attention for can be calculated as follows:
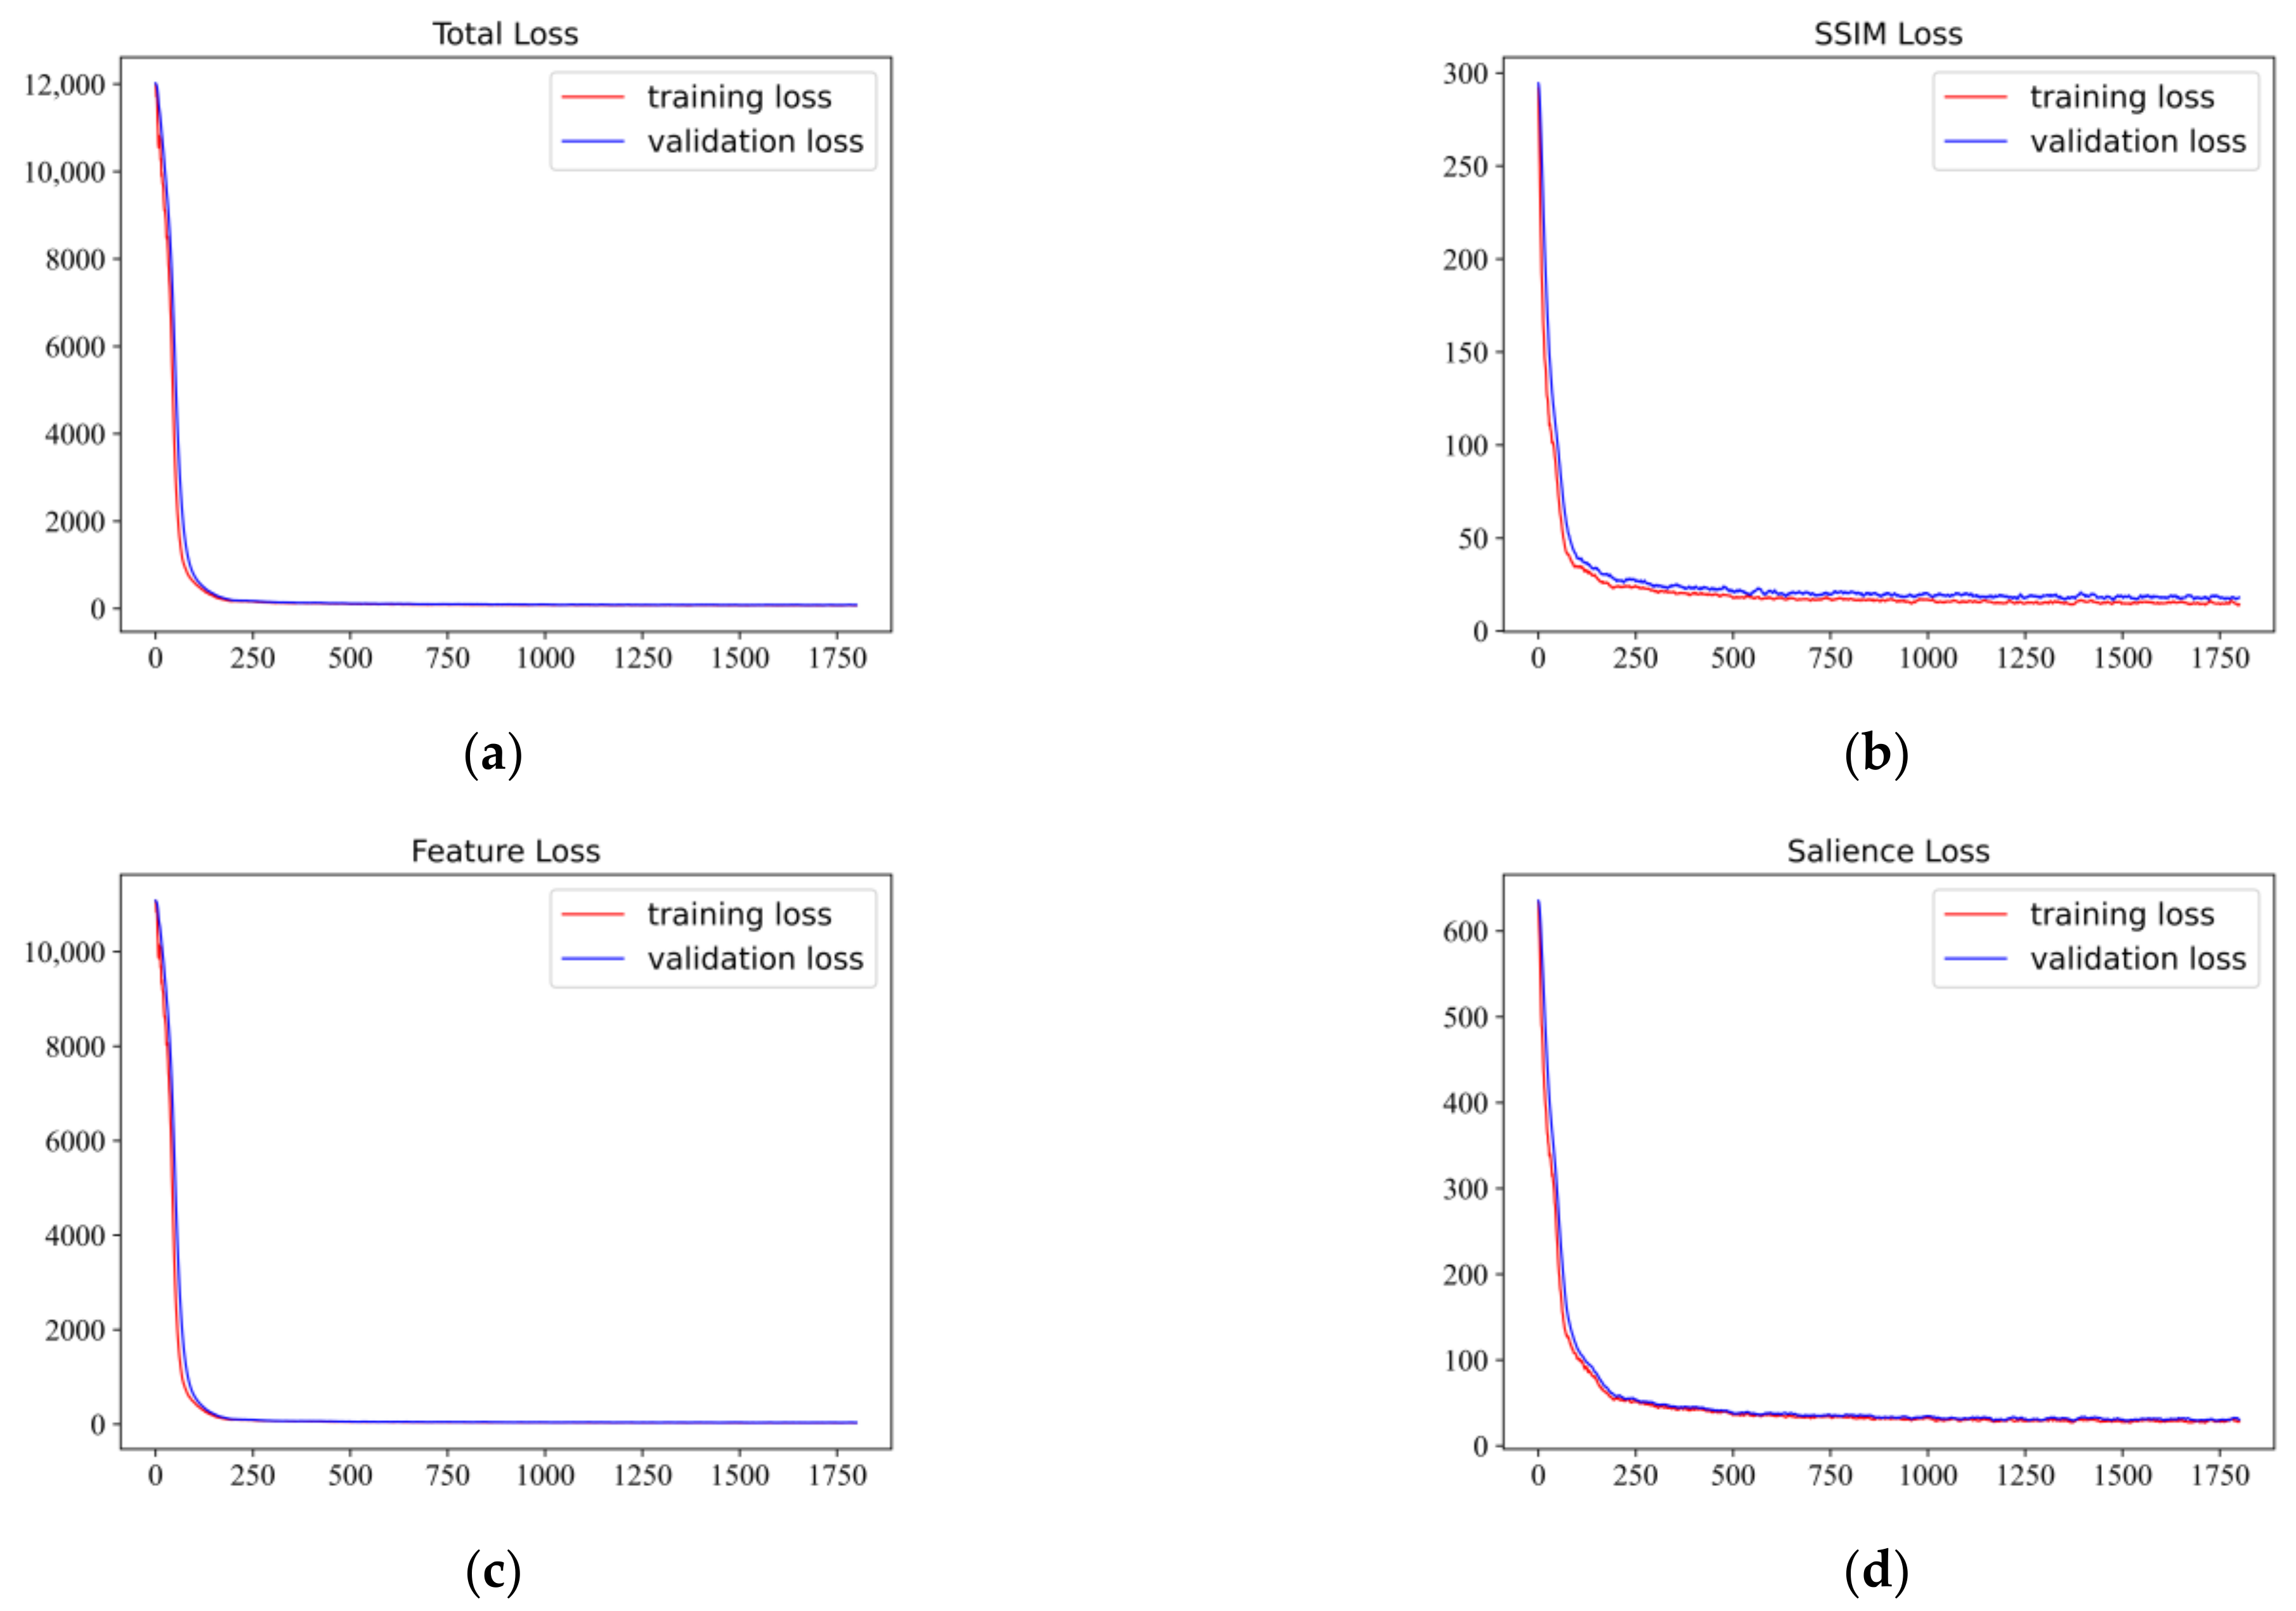
3.3. Loss Function
3.3.1. Loss Function of Encoder
3.3.2. Loss Function of Fusion
4. Experimental Results and Analysis
4.1. Datasets and Training Details
- (1)
- MS-COCO dataset [45]: The COCO dataset has over 330,000 images and is a large, rich dataset for object detection, segmentation, and captioning. The images in COCO are mainly intercepted from daily scenes, with complex backgrounds, a large number of targets, and a small target size.
- (2)
- TNO dataset [46]: The TNO Image Fusion Dataset contains multispectral (intensified visual, near-infrared, and longwave infrared or thermal) nighttime imagery of different military relevant scenarios registered with different multiband camera systems.
- (3)
- FLIR dataset: This dataset provides annotated thermography datasets and corresponding unannotated RGB images. The dataset contains a total of 14,452 infrared images, of which 10,228 are from multiple short videos; 4224 are from a video with a duration of 144 s. All video scenes are streets and highways.
- (4)
- LLVIP dataset [47]: This dataset contains 15,488 pairs of images, most of which were taken at very dark scenes, and all of the images are strictly aligned in time and space.
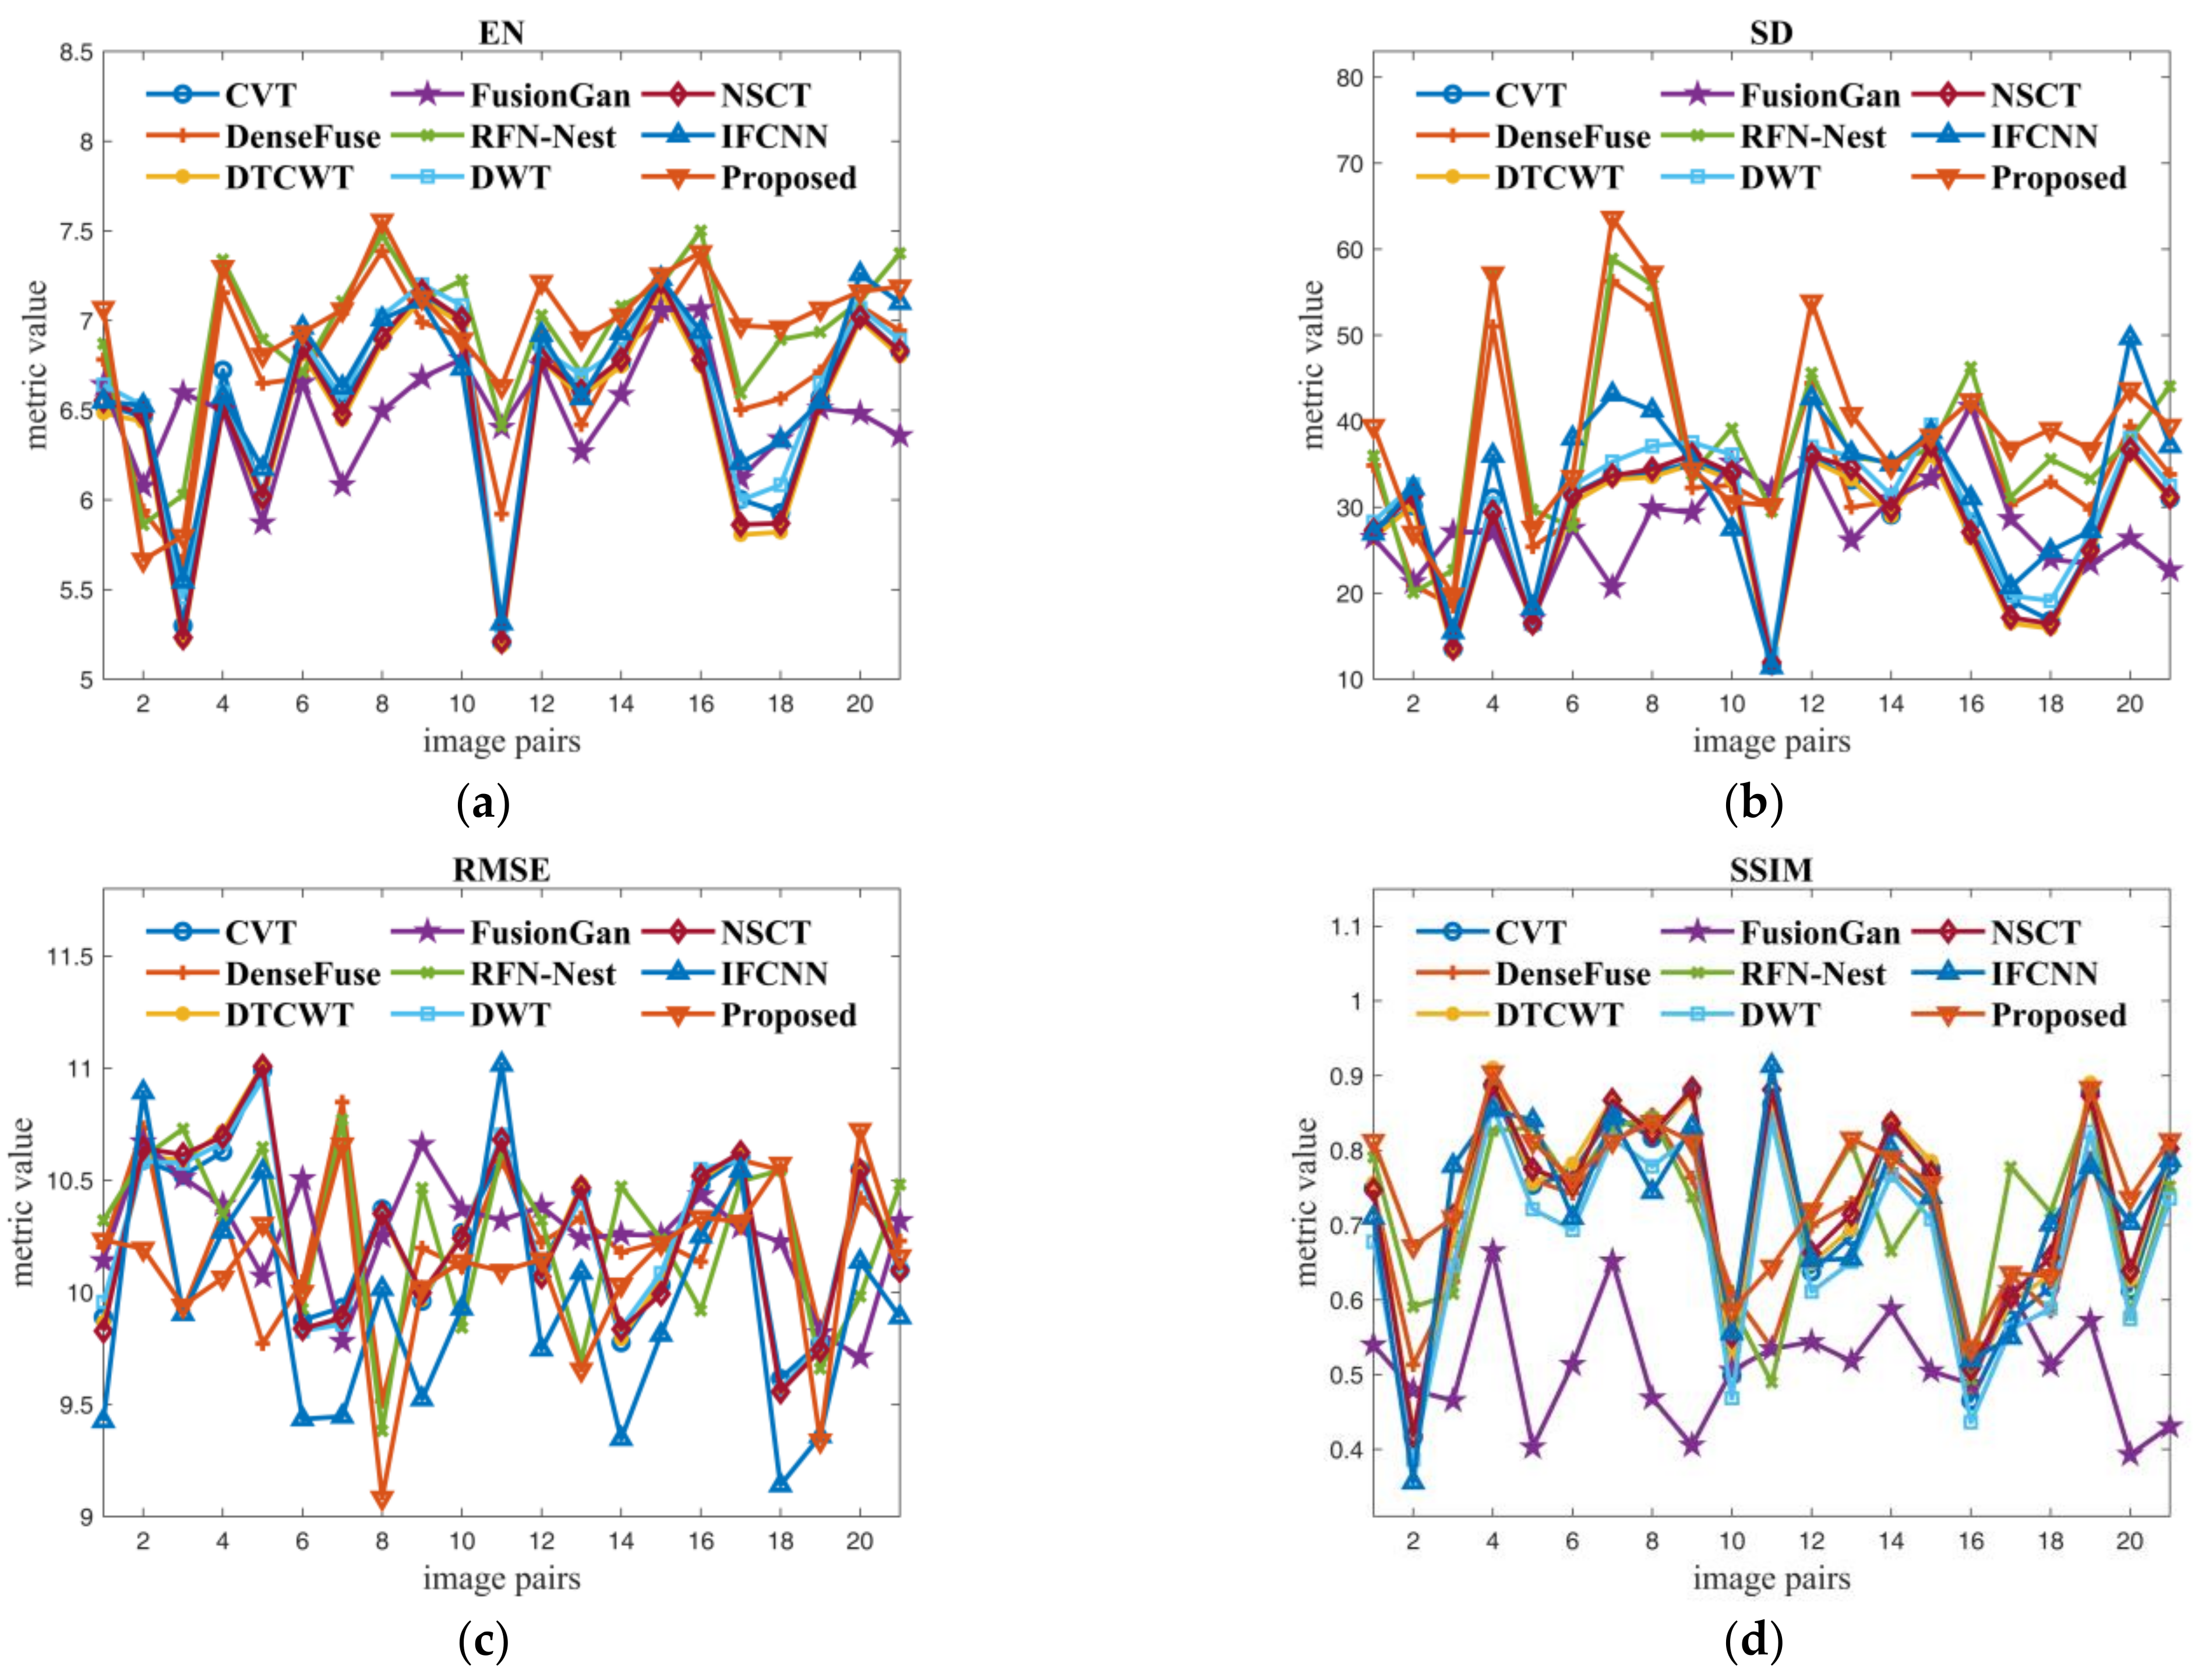
4.2. Evaluation Metrics
4.3. Ablation Study
4.4. Experimental Results Analysis
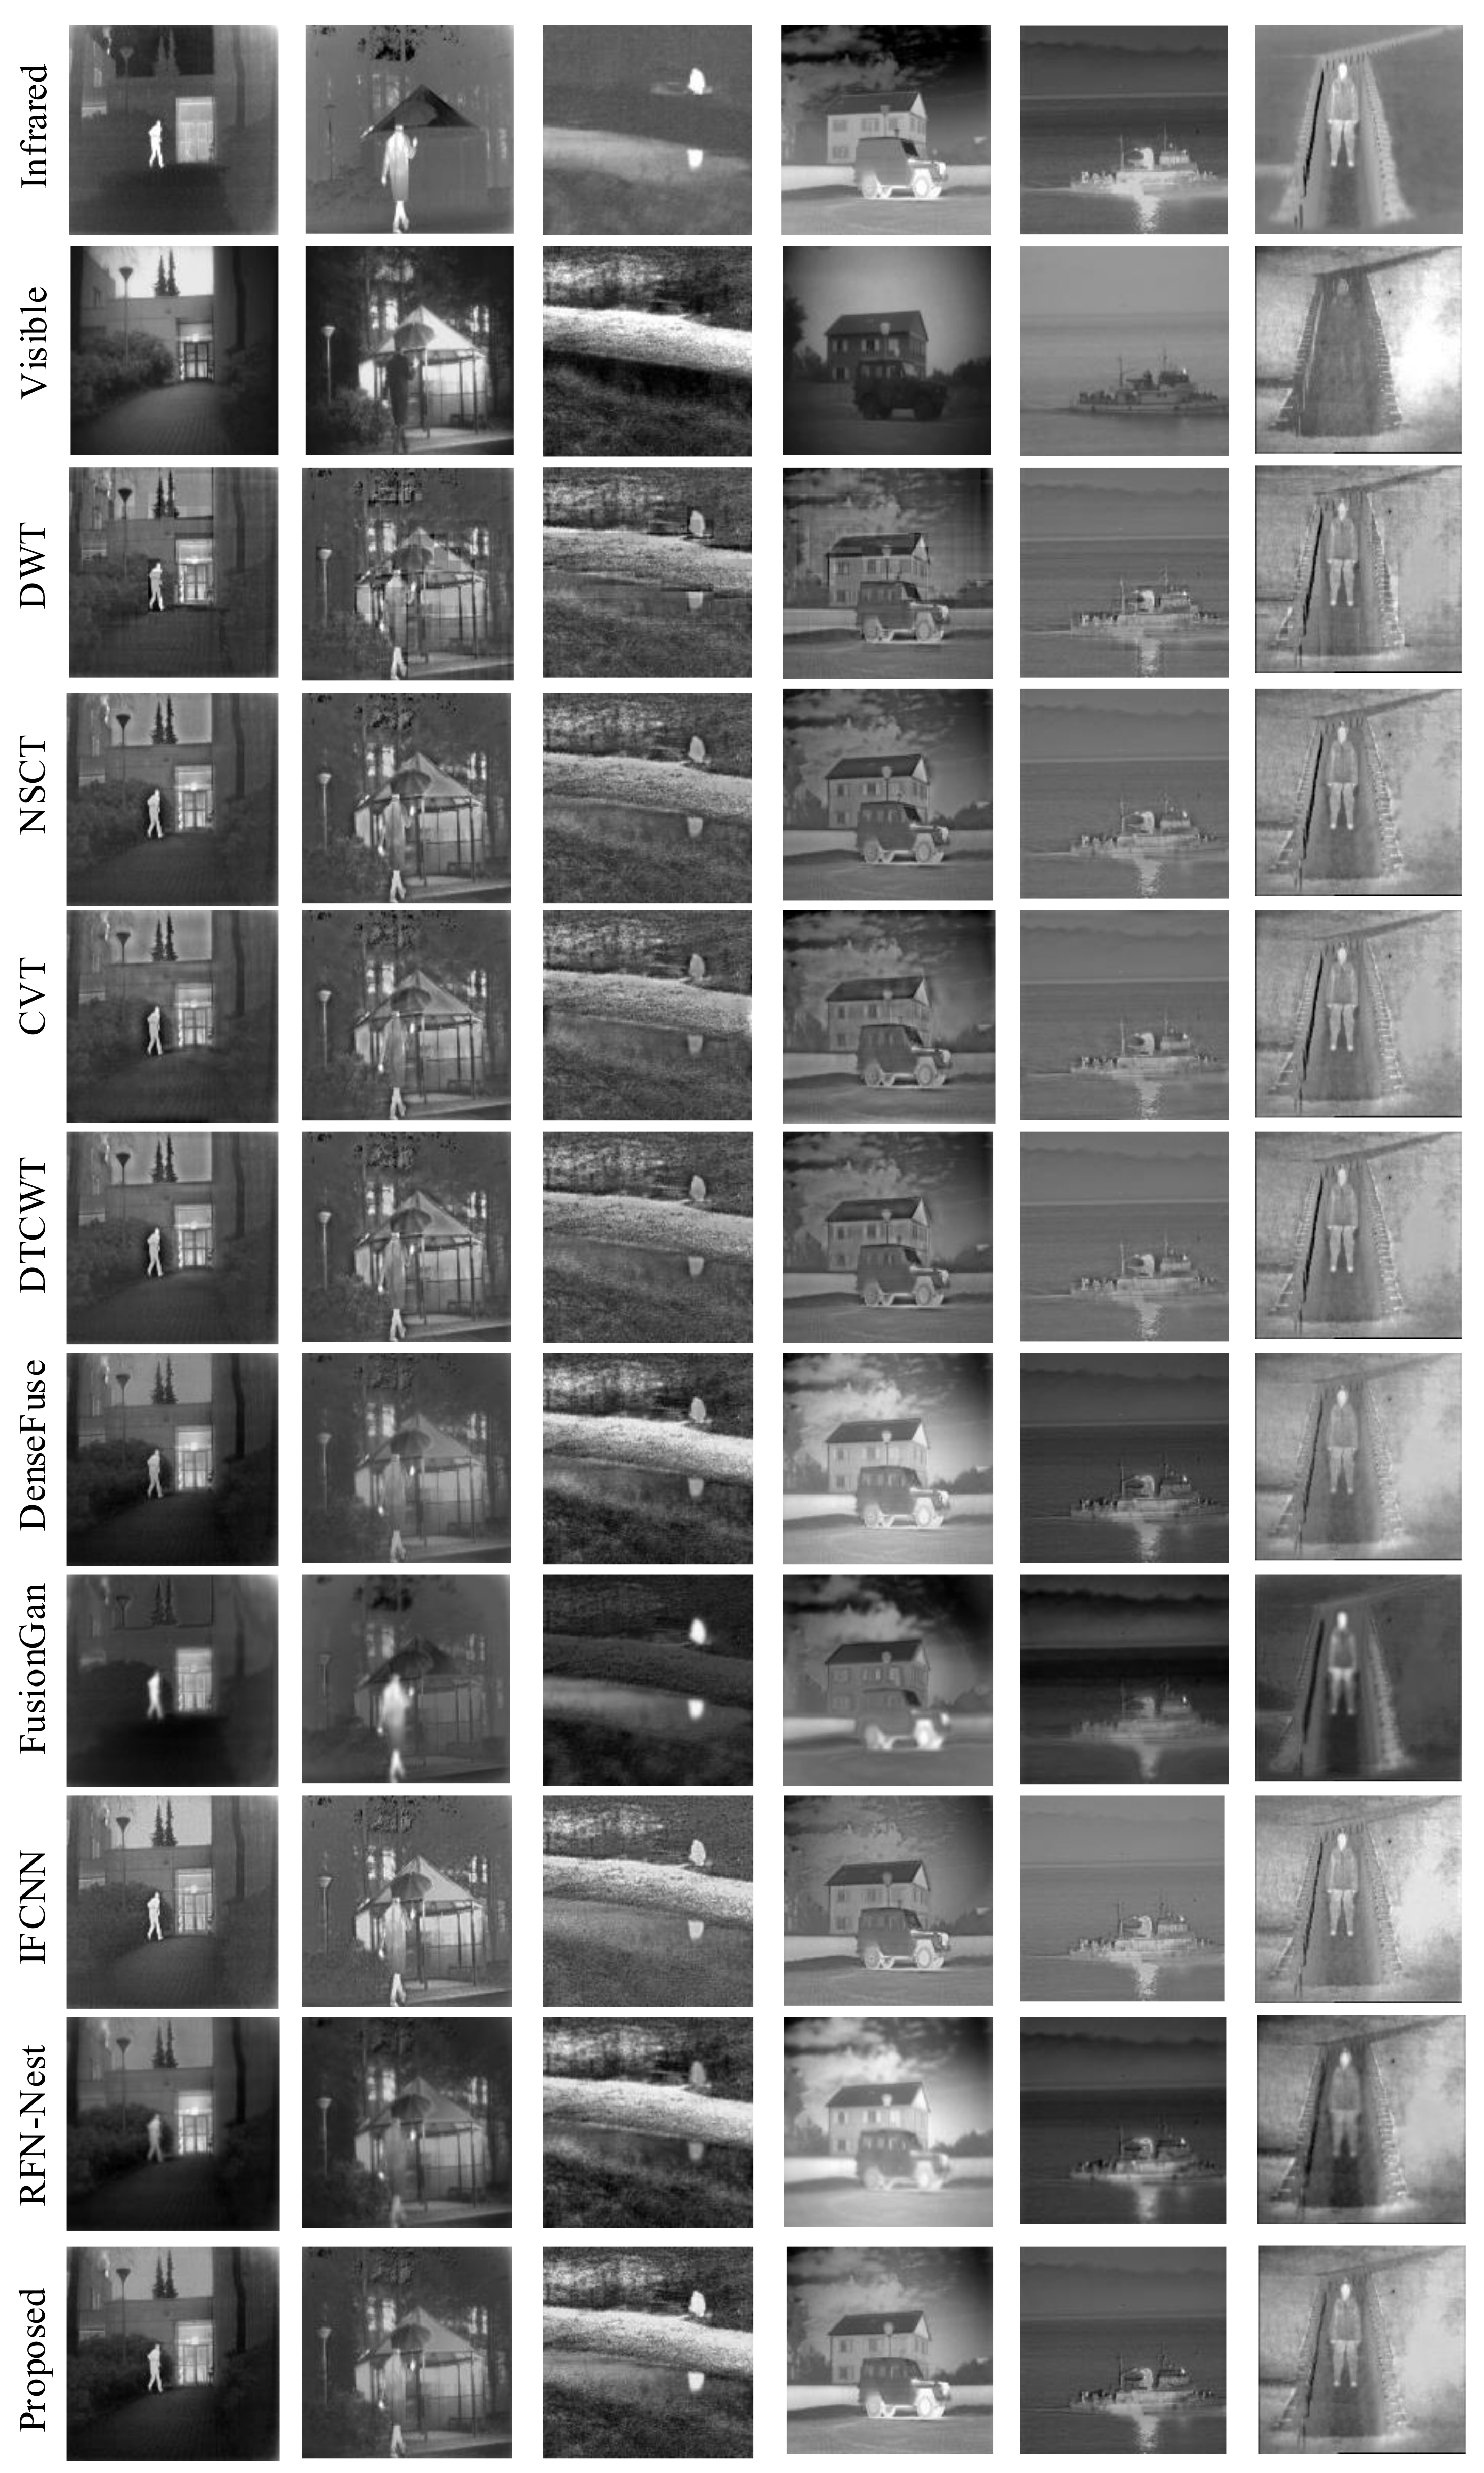
4.4.1. Fusion Results Analysis on TNO
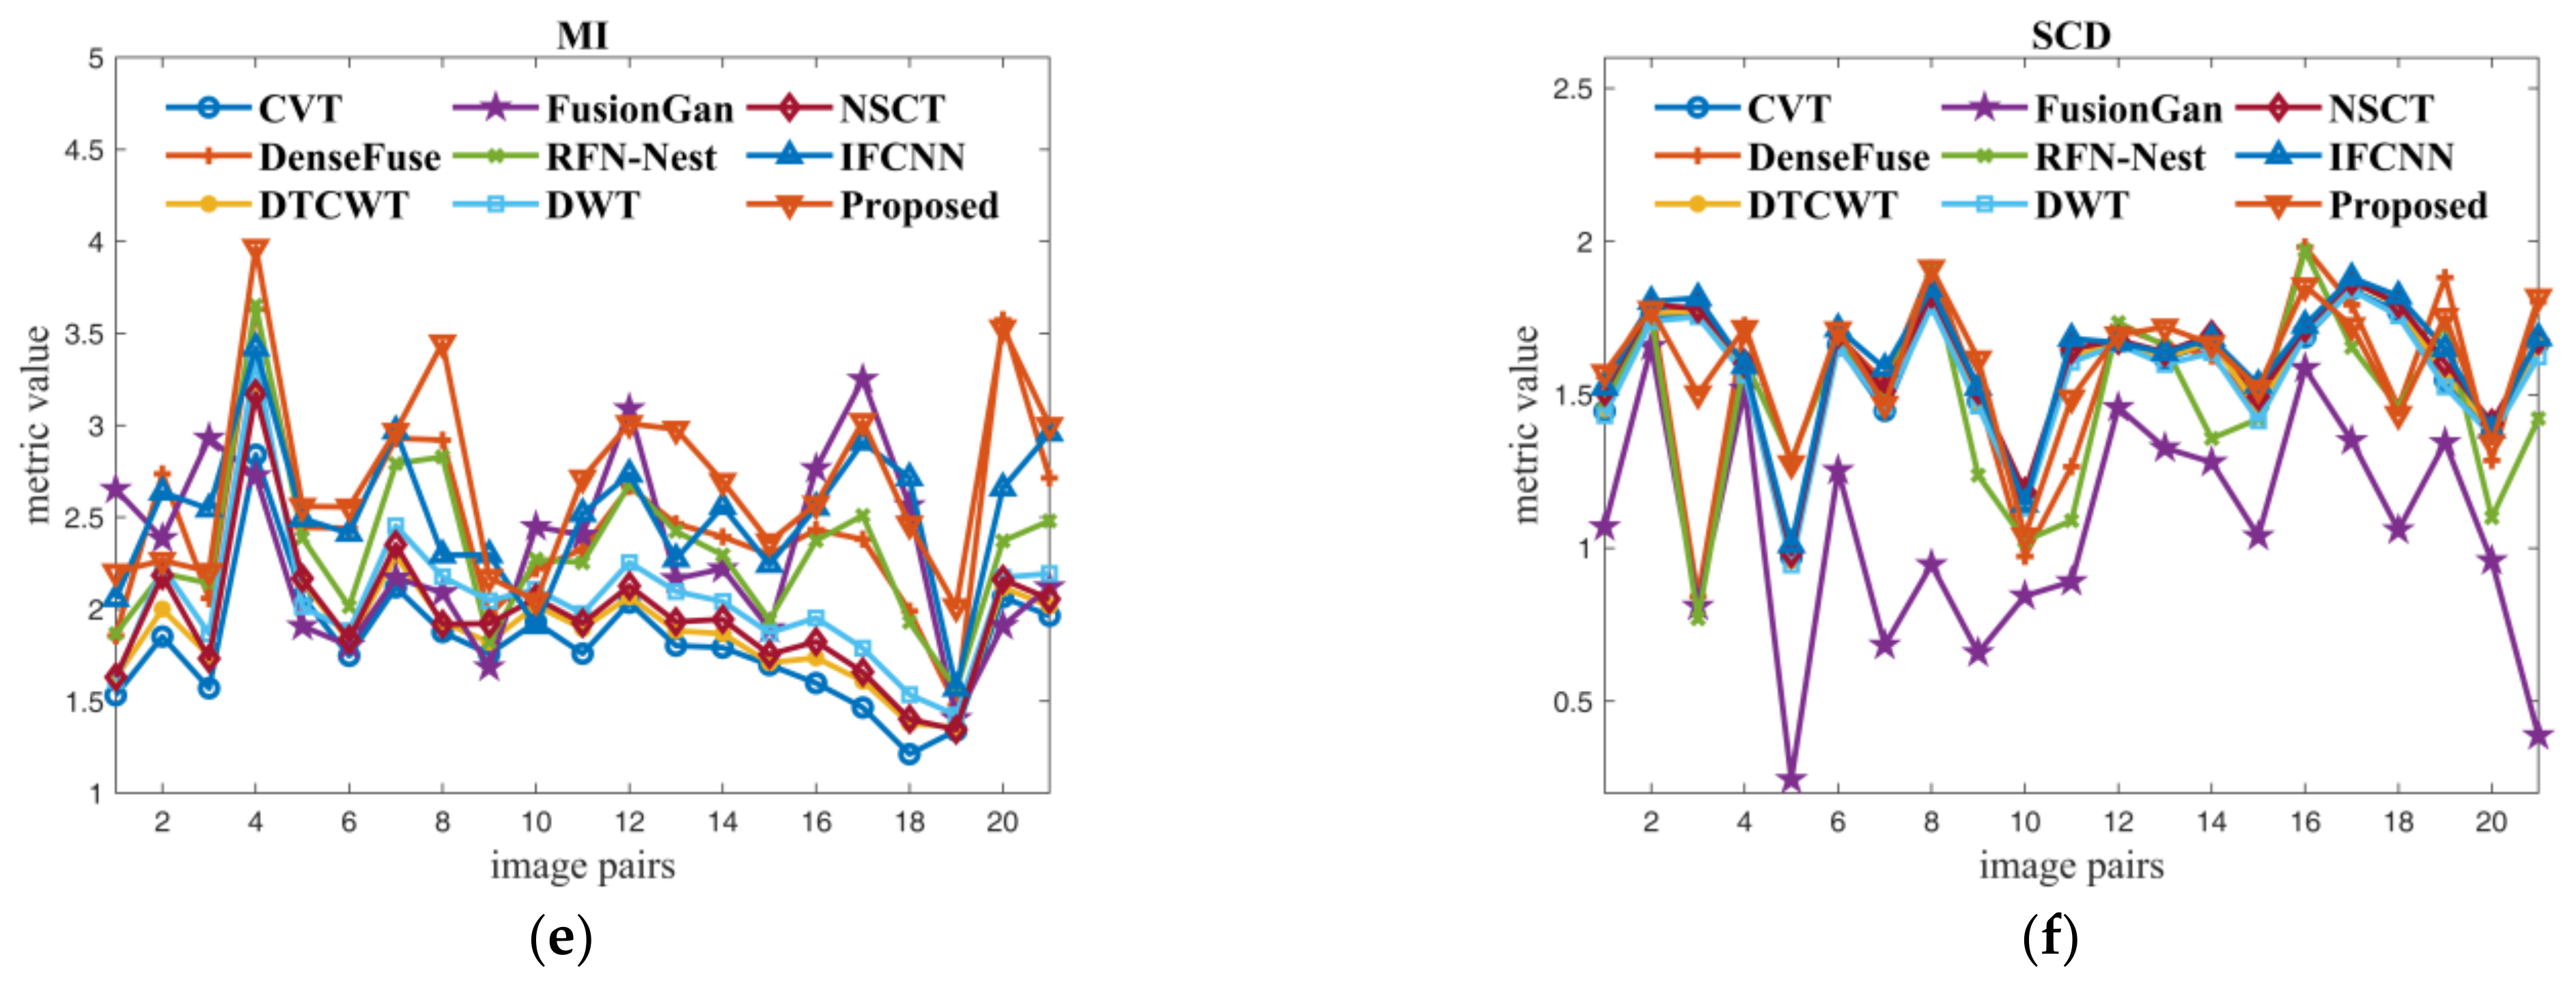
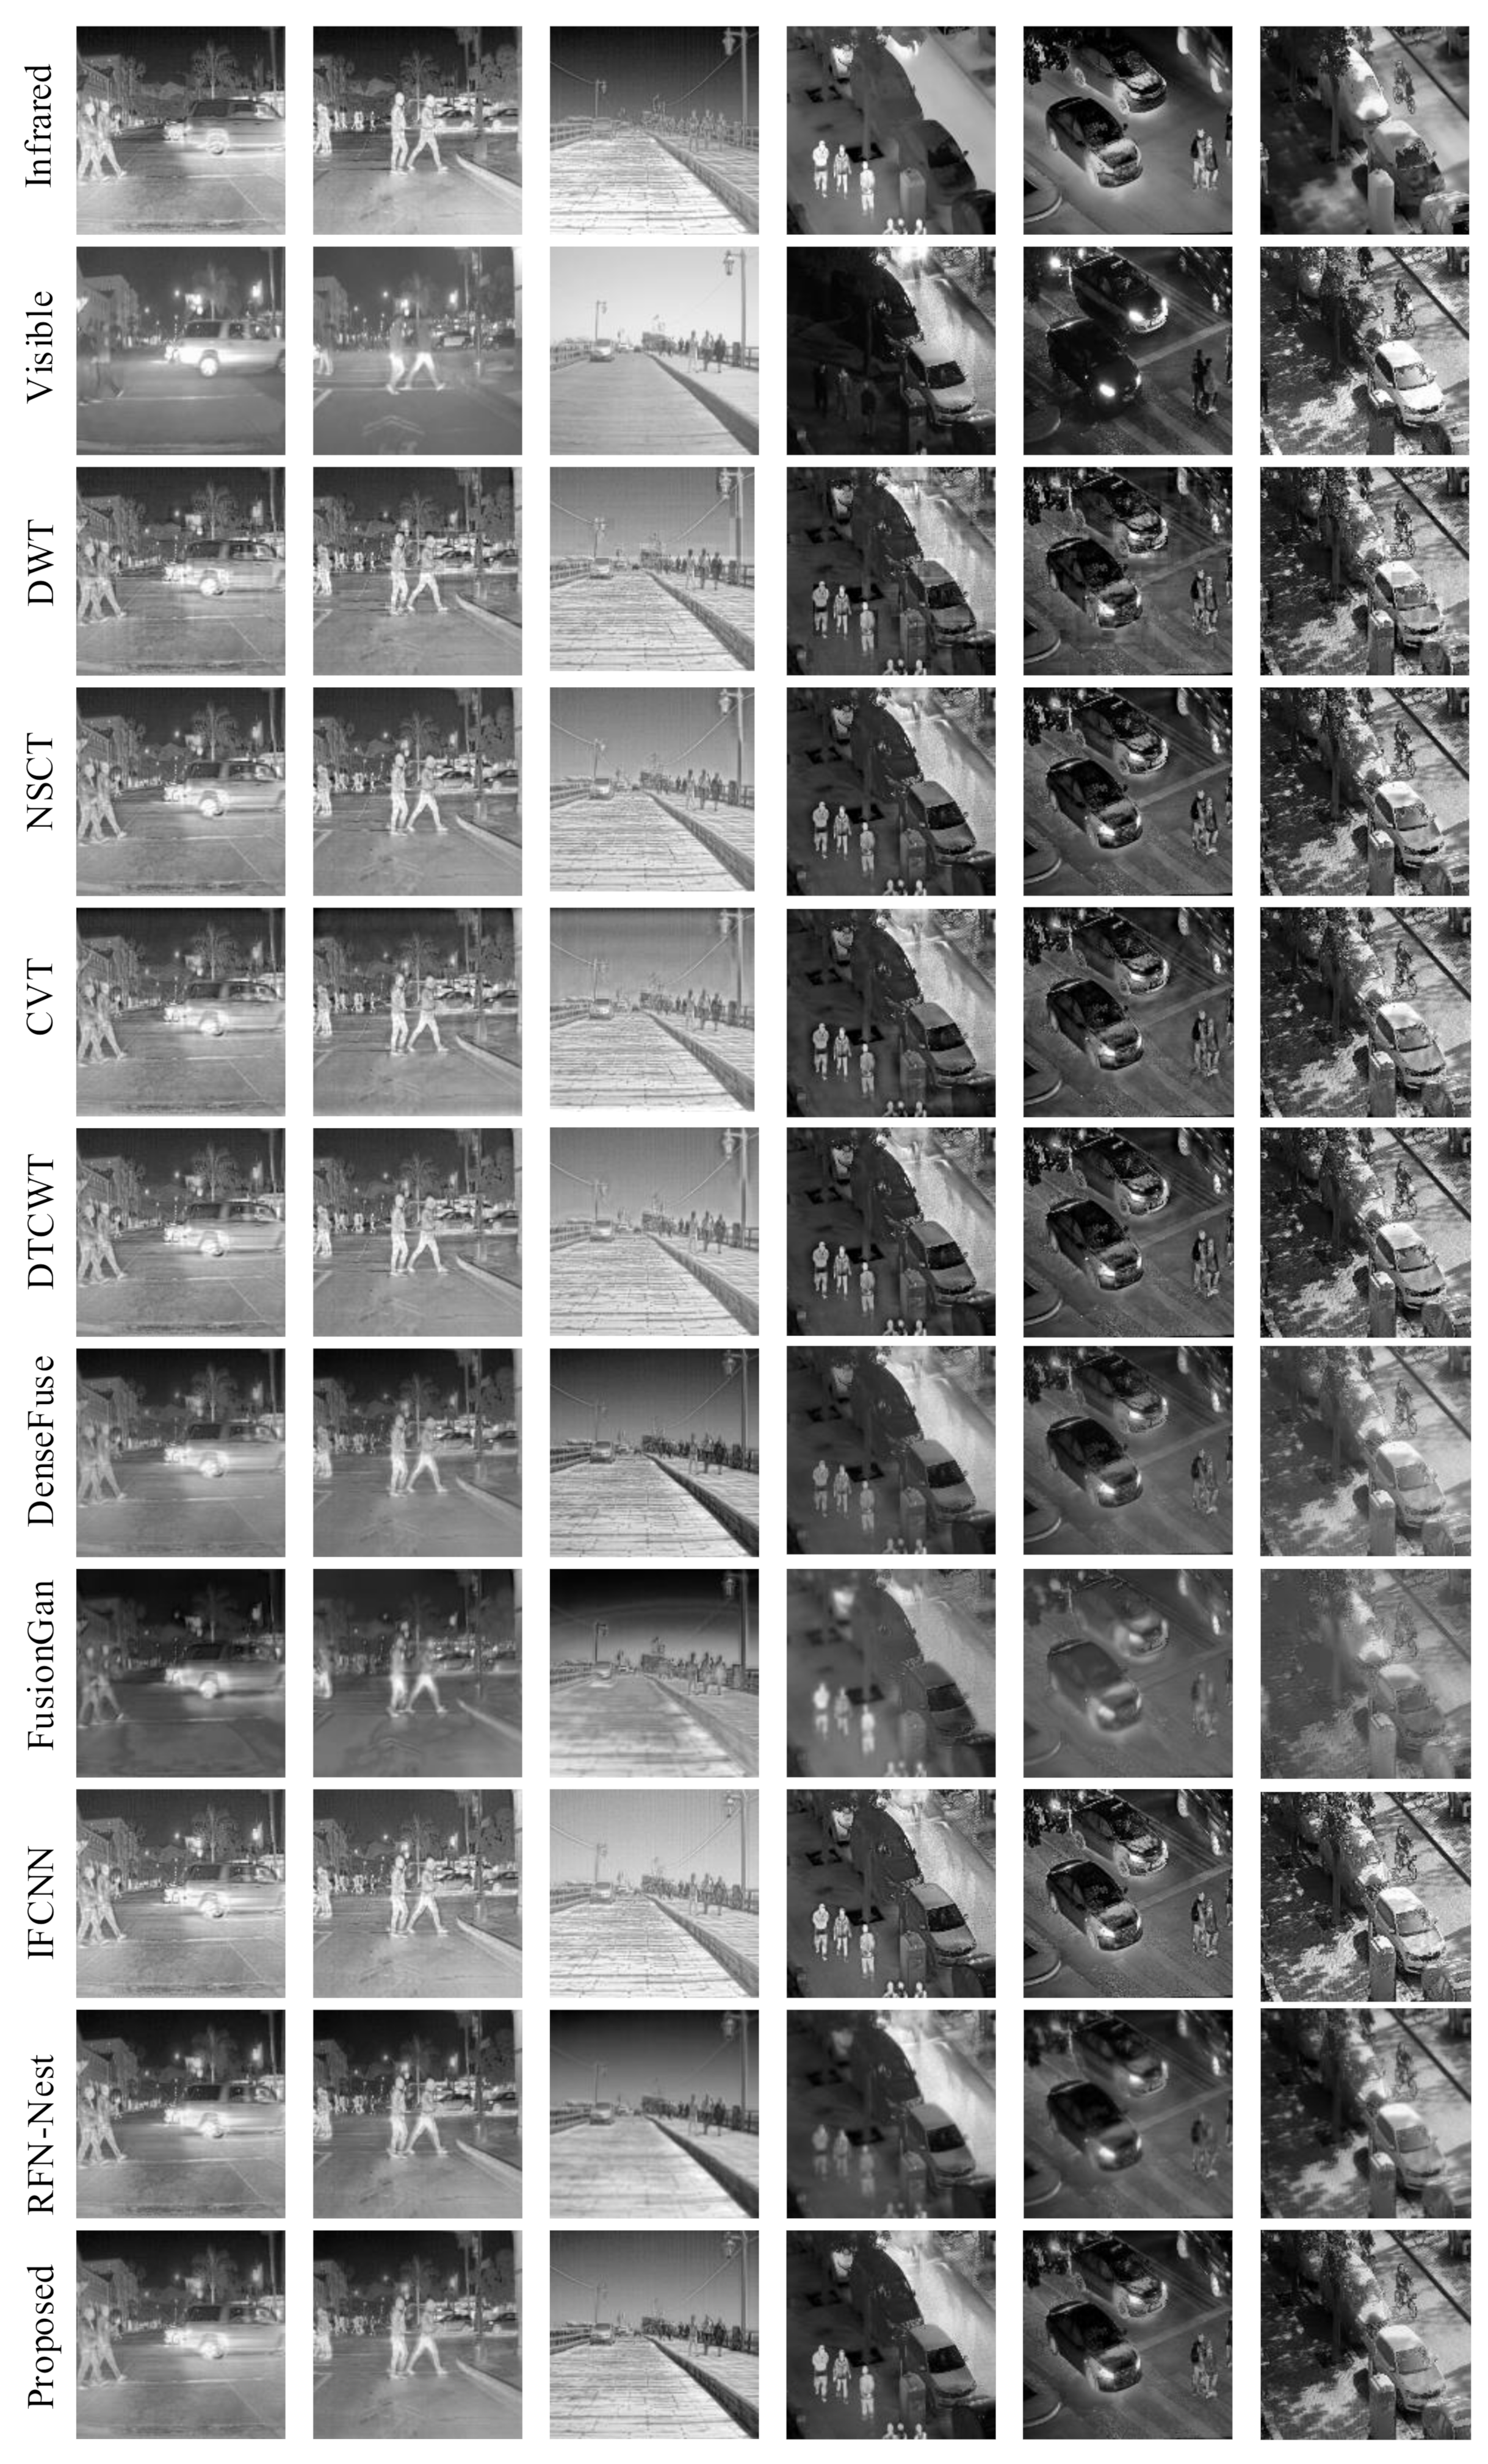
4.4.2. Fusion Results Analysis on FLIR and LLVIP
5. Conclusions
Author Contributions
Funding
Data Availability Statement
Acknowledgments
Conflicts of Interest
References
- Hu, H.M.; Wu, J.; Li, B.; Guo, Q.; Zheng, J. An Adaptive Fusion Algorithm for Visible and Infrared Videos Based on Entropy and the Cumulative Distribution of Gray Levels. IEEE Trans. Multimed. 2017, 19, 2706–2719. [Google Scholar] [CrossRef]
- Zhao, W.; Lu, H.; Wang, D. Multisensor Image Fusion and Enhancement in Spectral Total Variation Domain. IEEE Trans. Multimed. 2018, 20, 866–879. [Google Scholar] [CrossRef]
- Tian, Z.; Shen, C.; Chen, H.; He, T. FCOS: Fully Convolutional One-Stage Object Detection. In Proceedings of the IEEE/CVF International Conference on Computer Vision (ICCV), Montreal, QC, Canada, 11–17 October 2021; pp. 9627–9636. [Google Scholar]
- Kou, F.; Wei, Z.; Chen, W.; Wu, X.; Wen, C.; Li, Z. Intelligent Detail Enhancement for Exposure Fusion. IEEE Trans. Multimed. 2018, 20, 484–495. [Google Scholar] [CrossRef]
- Arroyo, S.; Bussi, U.; Safar, F.; Oliva, D. A Monocular Wide-Field Vision System for Geolocation with Uncertainties in Urban Scenes. Eng. Res. Express 2020, 2, 025041. [Google Scholar] [CrossRef]
- Rajah, P.; Odindi, J.; Mutanga, O. Feature Level Image Fusion of Optical Imagery and Synthetic Aperture Radar (SAR) for Invasive Alien Plant Species Detection and Mapping. Remote Sens. Appl. Soc. Environ. 2018, 10, 198–208. [Google Scholar] [CrossRef]
- Ma, J.; Yu, W.; Chen, C.; Liang, P.; Guo, X.; Jiang, J. Pan-GAN: An Unsupervised Pan-Sharpening Method for Remote Sensing Image Fusion. Inf. Fusion 2020, 62, 110–120. [Google Scholar] [CrossRef]
- Liu, W.; Yang, J.; Zhao, J.; Guo, F. A Dual-Domain Super-Resolution Image Fusion Method With SIRV and GALCA Model for PolSAR and Panchromatic Images. IEEE Trans. Geosci. Remote Sens. 2022, 60, 1–14. [Google Scholar] [CrossRef]
- Ying, J.; Shen, H.-L.; Cao, S.-Y. Unaligned Hyperspectral Image Fusion via Registration and Interpolation Modeling. IEEE Trans. Geosci. Remote Sens. 2022, 60, 1–14. [Google Scholar] [CrossRef]
- Zhu, Z.; Wei, H.; Hu, G.; Li, Y.; Qi, G.; Mazur, N. A Novel Fast Single Image Dehazing Algorithm Based on Artificial Multiexposure Image Fusion. IEEE Trans. Instrum. Meas. 2021, 70, 1–23. [Google Scholar] [CrossRef]
- Paramanandham, N.; Rajendiran, K. Infrared and Visible Image Fusion Using Discrete Cosine Transform and Swarm Intelligence for Surveillance Applications. Infrared Phys. Technol. 2018, 88, 13–22. [Google Scholar] [CrossRef]
- Wang, G.; Li, W.; Gao, X.; Xiao, B.; Du, J. Functional and Anatomical Image Fusion Based on Gradient Enhanced Decomposition Model. IEEE Trans. Instrum. Meas. 2022, 71, 1–14. [Google Scholar] [CrossRef]
- Li, G.; Lin, Y.; Qu, X. An Infrared and Visible Image Fusion Method Based on Multi-Scale Transformation and Norm Optimization. Inf. Fusion 2021, 71, 109–129. [Google Scholar] [CrossRef]
- Jian, L.; Yang, X.; Zhou, Z.; Zhou, K.; Liu, K. Multi-Scale Image Fusion through Rolling Guidance Filter. Future Gener. Comput. Syst. 2018, 83, 310–325. [Google Scholar] [CrossRef]
- Maqsood, S.; Javed, U. Multi-Modal Medical Image Fusion Based on Two-Scale Image Decomposition and Sparse Representation. Biomed. Signal Process. Control 2020, 57, 101810. [Google Scholar] [CrossRef]
- Zhang, Q.; Liu, Y.; Blum, R.S.; Han, J.; Tao, D. Sparse Representation Based Multi-Sensor Image Fusion for Multi-Focus and Multi-Modality Images: A Review. Inf. Fusion 2018, 40, 57–75. [Google Scholar] [CrossRef]
- Li, Q.; Han, G.; Liu, P.; Yang, H.; Wu, J.; Liu, D. An Infrared and Visible Image Fusion Method Guided by Saliency and Gradient Information. IEEE Access 2021, 9, 108942–108958. [Google Scholar] [CrossRef]
- Zhang, X.; Ma, Y.; Fan, F.; Zhang, Y.; Huang, J. Infrared and Visible Image Fusion via Saliency Analysis and Local Edge-Preserving Multi-Scale Decomposition. JOSA A 2017, 34, 1400–1410. [Google Scholar] [CrossRef]
- Li, H.; Wu, X.J. Infrared and Visible Image Fusion Using Latent Low-Rank Representation. arXiv 2022, arXiv:1804.08992v5. [Google Scholar]
- Gao, C.; Song, C.; Zhang, Y.; Qi, D.; Yu, Y. Improving the Performance of Infrared and Visible Image Fusion Based on Latent Low-Rank Representation Nested With Rolling Guided Image Filtering. IEEE Access 2021, 9, 91462–91475. [Google Scholar] [CrossRef]
- Vanmali, A.V.; Gadre, V.M. Visible and NIR Image Fusion Using Weight-Map-Guided Laplacian–Gaussian Pyramid for Improving Scene Visibility. Sādhanā 2017, 42, 1063–1082. [Google Scholar] [CrossRef] [Green Version]
- Yan, H.; Zhang, J.-X.; Zhang, X. Injected Infrared and Visible Image Fusion via 1 Decomposition Model and Guided Filtering. IEEE Trans. Comput. Imaging 2022, 8, 162–173. [Google Scholar] [CrossRef]
- Zhou, X.; Wang, W. Infrared and Visible Image Fusion Based on Tetrolet Transform. In Proceedings of the 2015 International Conference on Communications, Signal Processing, and Systems, Tianjin, China, 23–24 October 2015; pp. 701–708. [Google Scholar]
- Yang, B.; Yang, C.; Huang, G. Efficient Image Fusion with Approximate Sparse Representation. Int. J. Wavelets Multiresolution Inf. Process. 2016, 14, 1650024. [Google Scholar]
- Veshki, F.G.; Ouzir, N.; Vorobyov, S.A.; Ollila, E. Multimodal Image Fusion via Coupled Feature Learning. Signal Process. 2022, 200, 108637. [Google Scholar] [CrossRef]
- Ma, J.; Zhou, Z.; Wang, B.; Zong, H. Infrared and Visible Image Fusion Based on Visual Saliency Map and Weighted Least Square Optimization. Infrared Phys. Technol. 2017, 82, 8–17. [Google Scholar] [CrossRef]
- Liu, Y.; Dong, L.; Xu, W. Infrared and Visible Image Fusion via Salient Object Extraction and Low-Light Region Enhancement. Infrared Phys. Technol. 2022, 124, 104223. [Google Scholar] [CrossRef]
- Liu, Y.; Chen, X.; Peng, H.; Wang, Z. Multi-Focus Image Fusion with a Deep Convolutional Neural Network. Inf. Fusion 2017, 36, 191–207. [Google Scholar] [CrossRef]
- Liu, Y.; Chen, X.; Cheng, J.; Peng, H.; Wang, Z. Infrared and Visible Image Fusion with Convolutional Neural Networks. Int. J. Wavelets Multiresolution Inf. Process. 2017, 16, 1850018. [Google Scholar] [CrossRef]
- Jian, L.; Rayhana, R.; Ma, L.; Wu, S.; Liu, Z.; Jiang, H. Infrared and Visible Image Fusion Based on Deep Decomposition Network and Saliency Analysis. IEEE Trans. Multimed. 2021, 1. [Google Scholar] [CrossRef]
- Xu, H.; Ma, J.; Le, Z.; Jiang, J.; Guo, X. FusionDN: A Unified Densely Connected Network for Image Fusion. Proc. AAAI Conf. Artif. Intell. 2020, 34, 12484–12491. [Google Scholar] [CrossRef]
- Ma, J.; Xu, H.; Jiang, J.; Mei, X.; Zhang, X.-P. DDcGAN: A Dual-Discriminator Conditional Generative Adversarial Network for Multi-Resolution Image Fusion. IEEE Trans. Image Process. 2020, 29, 4980–4995. [Google Scholar] [CrossRef]
- Yang, Y.; Kong, X.; Huang, S.; Wan, W.; Liu, J.; Zhang, W. Infrared and Visible Image Fusion Based on Multiscale Network with Dual-Channel Information Cross Fusion Block. In Proceedings of the 2021 International Joint Conference on Neural Networks (IJCNN), Shenzhen, China, 18–22 July 2021; pp. 1–7. [Google Scholar]
- Tang, L.; Yuan, J.; Zhang, H.; Jiang, X.; Ma, J. PIAFusion: A Progressive Infrared and Visible Image Fusion Network Based on Illumination Aware. Inf. Fusion 2022, 83, 79–92. [Google Scholar] [CrossRef]
- Li, H.; Wu, X.J. DenseFuse: A Fusion Approach to Infrared and Visible Images. IEEE Trans. Image Process. 2019, 28, 2614–2623. [Google Scholar] [CrossRef] [PubMed] [Green Version]
- Li, H.; Wu, X.J.; Durrani, T. NestFuse: An Infrared and Visible Image Fusion Architecture Based on Nest Connection and Spatial/Channel Attention Models. IEEE Trans. Instrum. Meas. 2020, 69, 9645–9656. [Google Scholar] [CrossRef]
- Li, H.; Wu, X.J.; Kittler, J. RFN-Nest: An End-to-End Residual Fusion Network for Infrared and Visible Images. Inf. Fusion 2021, 73, 72–86. [Google Scholar] [CrossRef]
- Vaswani, A.; Shazeer, N.; Parmar, N.; Uszkoreit, J.; Jones, L.; Gomez, A.N.; Kaiser, L.; Polosukhin, I. Attention Is All You Need. In Proceedings of the Advances in Neural Information Processing Systems (NIPS 2017), Long Beach, CA, USA, 4–9 December 2017; pp. 5998–6008. [Google Scholar]
- Dosovitskiy, A.; Beyer, L.; Kolesnikov, A.; Weissenborn, D.; Zhai, X.; Unterthiner, T.; Dehghani, M.; Minderer, M.; Heigold, G.; Gelly, S.; et al. An Image Is Worth 16 × 16 Words: Transformers for Image Recognition at Scale. arXiv 2021, arXiv:2010.11929v2. [Google Scholar]
- Liu, N.; Zhang, N.; Wan, K.; Shao, L.; Han, J. Visual Saliency Transformer. In Proceedings of the IEEE/CVF International Conference on Computer Vision (ICCV), Montreal, QC, Canada, 11–17 October 2021; pp. 4722–4732. [Google Scholar]
- Liu, Z.; Lin, Y.; Cao, Y.; Hu, H.; Wei, Y.; Zhang, Z.; Lin, S.; Guo, B. Swin Transformer: Hierarchical Vision Transformer Using Shifted Windows. In Proceedings of the IEEE/CVF International Conference on Computer Vision (ICCV), Montreal, QC, Canada, 11–17 October 2021; pp. 10012–10022. [Google Scholar]
- Li, J.; Yan, Y.; Liao, S.; Yang, X.; Shao, L. Local-to-Global Self-Attention in Vision Transformers. arXiv 2021, arXiv:2107.04735v1. [Google Scholar]
- Yang, J.; Li, C.; Zhang, P.; Dai, X.; Xiao, B.; Yuan, L.; Gao, J. Focal Self-Attention for Local-Global Interactions in Vision Transformers. arXiv 2021, arXiv:2107.00641v1. [Google Scholar]
- Wang, Z.; Bovik, A.C.; Sheikh, H.R.; Simoncelli, E.P. Image Quality Assessment: From Error Visibility to Structural Similarity. IEEE Trans. Image Process. 2004, 13, 600–612. [Google Scholar] [CrossRef] [Green Version]
- Lin, T.Y.; Maire, M.; Belongie, S.; Hays, J.; Perona, P.; Ramanan, D.; Dollár, P.; Zitnick, C.L. Microsoft COCO: Common Objects in Context. In Proceedings of the Computer Vision (ECCV), Zurich, Switzerland, 6–12 September 2014; pp. 740–755. [Google Scholar]
- Toet, A. TNO Image Fusion Dataset. 2014. Available online: https://figshare.com/articles/dataset/TNO_Image_Fusion_Dataset/1008029 (accessed on 10 December 2021).
- Jia, X.; Zhu, C.; Li, M.; Tang, W.; Zhou, W. LLVIP: A Visible-Infrared Paired Dataset for Low-Light Vision. In Proceedings of the IEEE/CVF International Conference on Computer Vision (ICCV), Montreal, QC, Canada, 11–17 October 2021; pp. 3496–3504. [Google Scholar]
- Ma, J.; Ma, Y.; Li, C. Infrared and Visible Image Fusion Methods and Applications: A Survey. Inf. Fusion 2019, 45, 153–178. [Google Scholar] [CrossRef]
- Niu, Y.; Xu, S.; Wu, L.; Hu, W. Airborne Infrared and Visible Image Fusion for Target Perception Based on Target Region Segmentation and Discrete Wavelet Transform. Math. Probl. Eng. 2012, 2012, 275138. [Google Scholar] [CrossRef]
- Lewis, J.J.; O’Callaghan, R.J.; Nikolov, S.G.; Bull, D.R.; Canagarajah, N. Pixel- and Region-Based Image Fusion with Complex Wavelets. Inf. Fusion 2007, 8, 119–130. [Google Scholar] [CrossRef]
- Nencini, F.; Garzelli, A.; Baronti, S.; Alparone, L. Remote Sensing Image Fusion Using the Curvelet Transform. Inf. Fusion 2007, 8, 143–156. [Google Scholar] [CrossRef]
- Yin, S.; Cao, L.; Tan, Q.; Jin, G. Infrared and Visible Image Fusion Based on NSCT and Fuzzy Logic. In Proceedings of the 2010 IEEE International Conference on Mechatronics and Automation, Montreal, QC, Canada, 6–9 July 2010; pp. 671–675. [Google Scholar]
- Ma, J.; Yu, W.; Liang, P.; Li, C.; Jiang, J. FusionGAN: A Generative Adversarial Network for Infrared and Visible Image Fusion. Inf. Fusion 2019, 48, 11–26. [Google Scholar] [CrossRef]
- Zhang, Y.; Liu, Y.; Sun, P.; Yan, H.; Zhao, X.; Zhang, L. IFCNN: A General Image Fusion Framework Based on Convolutional Neural Network. Inf. Fusion 2020, 54, 99–118. [Google Scholar] [CrossRef]


| Layer | Input Channel | Output Channel | Size | Stride | Activation | |
|---|---|---|---|---|---|---|
| Encoder | EB1 | 1 | 64 | 3 | 1 | ReLU |
| EB2 | 64 | 112 | 3 | 1 | ReLU | |
| EB3 | 112 | 160 | 3 | 1 | ReLU | |
| EB4 | 160 | 208 | 3 | 1 | ReLU | |
| Decoder | DB11 | 176 | 64 | 3 | 1 | ReLU |
| DB12 | 240 | 64 | 3 | 1 | ReLU | |
| DB13 | 304 | 64 | 3 | 1 | ReLU | |
| DB21 | 272 | 112 | 3 | 1 | ReLU | |
| DB22 | 384 | 112 | 3 | 1 | ReLU | |
| DB33 | 368 | 160 | 3 | 1 | ReLU |
| Number of Layers | Channel | Window Partition Size | Focal Window Size | Focal Region Size | |
|---|---|---|---|---|---|
| TFB1 | 2 | 64 | 7 | 1, 7 | 13, 37 |
| TFB2 | 2 | 112 | 7 | 1, 7 | 13, 19 |
| TFB3 | 2 | 160 | 7 | 1, 7 | 13, 9 |
| TFB4 | 2 | 208 | 7 | 1, 7 | 13, 5 |
| Method | EN | SD | SCD | SSIM | MI | RMSE |
|---|---|---|---|---|---|---|
| OS, OF | 6.6784 | 35.7851 | 1.5017 | 0.7342 | 2.6247 | 10.2413 |
| WS, OF | 6.7561 | 38.1576 | 1.5578 | 0.7439 | 2.6782 | 10.1892 |
| OS, WF | 6.8242 | 39.0014 | 1.5876 | 0.7411 | 2.843 | 10.1678 |
| WS, WF | 6.9519 | 39.3726 | 1.6011 | 0.7466 | 2.7028 | 10.1066 |
| Method | EN | SD | SCD | SSIM | MI | RMSE |
|---|---|---|---|---|---|---|
| DWT | 6.5964 | 29.6984 | 1.5552 | 0.6745 | 2.051 | 10.2507 |
| NSCT | 6.5107 | 29.1414 | 1.6018 | 0.7318 | 1.9575 | 10.2494 |
| CVT | 6.5371 | 28.1056 | 1.5735 | 0.7149 | 1.8108 | 10.2445 |
| DTCWT | 6.4773 | 27.4436 | 1.5794 | 0.7237 | 1.9163 | 10.2514 |
| DenseFuse | 6.7378 | 34.7623 | 1.5599 | 0.7001 | 2.4726 | 10.2377 |
| FusionGan | 6.4919 | 27.9282 | 1.0647 | 0.514 | 2.3137 | 10.2673 |
| IFCNN | 6.6265 | 31.869 | 1.6153 | 0.7155 | 2.5111 | 9.939 |
| RFN-Nest | 6.9271 | 37.7383 | 1.4686 | 0.7151 | 2.3238 | 10.2609 |
| Proposed | 6.9519 | 39.3726 | 1.6011 | 0.7466 | 2.7028 | 10.1066 |
| Method | EN | SD | SCD | SSIM | MI | RMSE |
|---|---|---|---|---|---|---|
| DWT | 7.2733 | 43.5689 | 1.1043 | 0.5272 | 3.1864 | 10.1828 |
| NSCT | 7.2323 | 42.6921 | 1.1386 | 0.5722 | 3.1431 | 10.183 |
| CVT | 7.3018 | 43.8735 | 1.1106 | 0.5383 | 2.8208 | 10.1606 |
| DTCWT | 7.2096 | 41.9806 | 1.1051 | 0.5622 | 3.0607 | 10.1848 |
| DenseFuse | 7.4005 | 52.7755 | 1.2739 | 0.6014 | 3.7431 | 10.0585 |
| FusionGan | 7.3209 | 47.5473 | 0.5866 | 0.5947 | 3.3429 | 10.2062 |
| IFCNN | 7.185 | 40.4748 | 1.136 | 0.6112 | 3.3764 | 9.6982 |
| RFN-Nest | 7.5439 | 58.9438 | 1.3638 | 0.7006 | 3.5457 | 10.1004 |
| Proposed | 7.4811 | 52.4626 | 1.3064 | 0.6435 | 3.7815 | 10.103 |
| Method | EN | SD | SCD | SSIM | MI | RMSE |
| DenseFuse | 7.6602 | 56.5542 | 1.455 | 0.8319 | 4.2070 | 10.3664 |
| RFN-nest | 7.7641 | 60.1371 | 1.4058 | 0.5231 | 3.8915 | 10.2250 |
| Proposed | 7.5851 | 50.2960 | 1.4921 | 0.7507 | 3.4256 | 10.3871 |
| Method | EN | SD | SCD | SSIM | MI | RMSE |
|---|---|---|---|---|---|---|
| DWT | 7.1622 | 46.1461 | 1.3735 | 0.5756 | 2.834 | 10.0145 |
| NSCT | 7.1521 | 45.3417 | 1.4294 | 0.6318 | 2.7803 | 10.0127 |
| CVT | 7.1547 | 44.6028 | 1.3968 | 0.5984 | 2.5841 | 10.0227 |
| DTCWT | 7.1415 | 44.4009 | 1.3993 | 0.6177 | 2.701 | 10.0087 |
| DenseFuse | 7.1227 | 41.7651 | 1.4932 | 0.6027 | 3.2511 | 9.9555 |
| FusionGan | 6.7159 | 30.4424 | 0.7712 | 0.4887 | 2.7055 | 10.1182 |
| IFCNN | 7.3332 | 48.2112 | 1.4468 | 0.5971 | 3.1225 | 9.7326 |
| RFN-Nest | 7.2456 | 45.1502 | 1.5039 | 0.5533 | 2.8533 | 9.9285 |
| Proposed | 7.1779 | 46.9661 | 1.5255 | 0.6875 | 3.2941 | 9.9281 |
Publisher’s Note: MDPI stays neutral with regard to jurisdictional claims in published maps and institutional affiliations. |
© 2022 by the authors. Licensee MDPI, Basel, Switzerland. This article is an open access article distributed under the terms and conditions of the Creative Commons Attribution (CC BY) license (https://creativecommons.org/licenses/by/4.0/).
Share and Cite
Liu, X.; Gao, H.; Miao, Q.; Xi, Y.; Ai, Y.; Gao, D. MFST: Multi-Modal Feature Self-Adaptive Transformer for Infrared and Visible Image Fusion. Remote Sens. 2022, 14, 3233. https://doi.org/10.3390/rs14133233
Liu X, Gao H, Miao Q, Xi Y, Ai Y, Gao D. MFST: Multi-Modal Feature Self-Adaptive Transformer for Infrared and Visible Image Fusion. Remote Sensing. 2022; 14(13):3233. https://doi.org/10.3390/rs14133233
Chicago/Turabian StyleLiu, Xiangzeng, Haojie Gao, Qiguang Miao, Yue Xi, Yunfeng Ai, and Dingguo Gao. 2022. "MFST: Multi-Modal Feature Self-Adaptive Transformer for Infrared and Visible Image Fusion" Remote Sensing 14, no. 13: 3233. https://doi.org/10.3390/rs14133233